kinetics of starch and protein digestion in cereals and...
TRANSCRIPT

JING HOOI TAN s4198650
1
Kinetics of starch and protein
digestion in cereals and pulses with
special reference to field peas
Final Report
By
TAN JING HOOI1
Supervisor - DR PETER A SOPADE
1Centre for Nutrition and Food Sciences
Queensland Alliance for Agriculture and Food Innovation
The University of Queensland
St Lucia 4072

JING HOOI TAN s4198650
2
Declaration of Authorship
I, TAN JING HOOI confirm that the work presented in this research report has been
performed and interpreted solely by myself except where explicitly identified to the contrary.
I confirm that this work is submitted in partial fulfilment for the degree of BSc Hons in
Biomedical Science and has not been submitted elsewhere in any other form for the
fulfilment of any other degree or qualification.
Dated: 24 October 2012
Signature:
I, Dr Peter SOPADE, confirm that I have seen a copy of the work presented in this research
proposal/research report as the supervisor of Mr Jing Hooi Tan.
Date: 24 October 2012
Signature:

JING HOOI TAN s4198650
3
Table of Contents
Declaration of Authorship ....................................................................................................................... 2
List of abbreviations ................................................................................................................................ 5
Abstract ................................................................................................................................................... 6
Acknowledgements ................................................................................................................................. 7
CHAPTER 1 Introduction .................................................................................................................... 8
CHAPTER 2 Materials and methods ................................................................................................. 14
2.1 Cereals and pulses................................................................................................................. 14
2.2 Physical properties of grains ................................................................................................. 14
2.3 Particle size reduction ........................................................................................................... 15
2.4 Particle size analysis .............................................................................................................. 16
2.5 Moisture content .................................................................................................................. 16
2.6 Ash Content ........................................................................................................................... 16
2.7 Fat Content ........................................................................................................................... 17
2.8 Total starch analysis .............................................................................................................. 17
2.9 In-vitro starch digestion ........................................................................................................ 17
2.10 In-vitro protein digestion ...................................................................................................... 20
2.11 Statistical analysis ................................................................................................................. 21
CHAPTER 3 Results and Discussions................................................................................................. 22
3.1 Physical properties of wheat, barley, field peas and lupins ................................................. 22
3.2 Chemical properties of wheat, barley, lupins and field peas ................................................ 24
3.3 Particle size distribution ........................................................................................................ 25
3.4 Starch digestion kinetics ....................................................................................................... 28
3.5 Protein digestion kinetics ...................................................................................................... 41
CHAPTER 4 Conclusions ................................................................................................................... 57
CHAPTER 5 Further research needs and recommendations ........................................................... 58
References ............................................................................................................................................ 59
Appendices ............................................................................................................................................ 62
Appendix A: Cryo-milling condition and particle size distribution of the samples. .......................... 62
Appendix B: Hammer-milling condition and particle size distribution of the samples. .................... 64
Appendix C: Parameter of the first order kinetic model for starch digestion .................................. 66
Appendix D: Parameter of the first order kinetic model for starch digestion .................................. 67
Appendix E: The parameters of the modified first order kinetic model for protein digestion in cryo-
milled field peas ................................................................................................................................ 68

JING HOOI TAN s4198650
4
Appendix F: The parameters of the modified first order kinetic model for protein digestion in
hammer-milled field peas ................................................................................................................. 70

JING HOOI TAN s4198650
5
List of abbreviations
Do Digested starch at time t = 0 (g/100 g dry starch)
Dt Digested starch at time t (g/100 g dry starch)
D∞ Digested starch at infinite time (g/100 g dry starch)
IVPD In-vitro protein digestibility (g/100 g dry protein)
K Rate of constant (min-1
); subscript ST is for starch and PR is for protein
pHo pH of protein digesta at time t = 0
pHt pH of protein digesta at time t
pH∞ pH of protein digesta at infinite time
t Time (min.)
Af Accuracy factor
Diff Diffusion coefficient (cm2 s
-1)
r2 Coefficient of determination (r = correlation coefficient)
p Average particle size (cm)
SUMSQ Sum of squares of residuals
MRDM Mean relative deviation modulus

JING HOOI TAN s4198650
6
Abstract
Field peas (Pisum sativum), wheat (Triticum spp.), barley (Hordeum vulgare L.) and lupins
(Lupinus L.) were cryo- and hammer-milled at different mill settings, and the effects of
particle size (45 – 630 µm) on the kinetics of starch and protein digestion were investigated
by using in-vitro procedures. Starch digestion was studied using a glucometry method with
amylase enzymes, while protein digestion was studied using a modified pH drop
multienzyme (trypsin, chymotrypsin and protease) procedure. Irrespective of the particle size,
the grain samples exhibited essentially monophasic patterns for both starch and protein
digestion. A modified kinetic model suitably described the starch (r2 > 0.991; p < 0.001) and
protein (r2 > 0.991; p < 0.001) digestograms. Starch and protein digestion in milled grains
were found to be higher with hammer- than with cryo-milling. Presumably, the quench-
freezing effect in cryo-milling affected the starch and protein structures less than the
mechanical and frictional heat effects in hammer-milling. Also, the reciprocal of the rate of
starch and protein digestion of the cryo- and hammer-milled grains were related (p < 0.05)
related to the square of the particle size to suggest that starch and protein digestion in the
milled grains proceeded by diffusion, irrespective of the mills and their settings. Protein
digestion proceeded at a much faster (33 X) rate than starch digestion in the milled grains
with implications for nutrient asynchrony. Being the first study on the dependence of starch
and protein digestion on grain particle size in field peas, wheat, barley, and lupins, the study
concluded that particle size and type of mill affected starch and protein digestion. The results
have implications for feed processing, where field pea, wheat, barley, and lupins are notable
ingredients, and mills such as hammer, disc and roller mills are used.

JING HOOI TAN s4198650
7
Acknowledgements
First and foremost, I would like to thank Dr. Peter A Sopade from the School of Agriculture
and Food Sciences, and Centre for Nutrition and Food Sciences, the University of
Queensland, for his endless effort, time and dedication of supervising, and leading me to
accomplish this fine work. His patience, moral support, encouragement, advice and guidance
throughout this research project are much appreciated. He is always accessible and willing to
help me with my research. The weekly meetings and long discussions were crucial to keep
me on track and keep me motivated. I sincerely appreciate him for being such a wonderful
supervisor.
Many thanks to all members of CNAFS (Centre for Nutrition and Food Science) and all
graduate, postgraduate students and friends for sharing their knowledge and experience. It has
been such an unforgettable experience as we exchanged knowledge and ideas as well as
shared our cultural differences. Besides that, I would like to thank Dr. Lesleigh Force and
Dr Honest Madziva for the provision of laboratory inductions as well as all the available
instruments and chemicals, enabling all the experiments to be done in a timely manner.
Also, I would like to express my gratitude to the Pork CRC, represented by Dr. John Black
and Dr. Roger Campbell, for their generous financial and scientific support for this research
project. In addition, special thanks to QAAFI, represented by Professor Robert Henry for
the generous financial and scientific support for this research project.
Finally, my deepest gratitude goes to my family for their unflagging love and encouragement
throughout my life. This research is simply impossible without their constant support. I am
also thankful for all the caring friends who have helped and inspired me, besides supporting
me during the stressful moments in completing this research project.

JING HOOI TAN s4198650
8
CHAPTER 1 Introduction
“We are what we eat” is a common proverb used in the olden days. Food indeed
plays an essential role in determining our health, physical and mental faculties in our
everyday life (Mahasukhonthachat et al., 2010). There are various nutrient elements which
can be found in food, such as protein, carbohydrates, fats, minerals etc. In order to maximise
the utilization of nutrients in daily food consumption, these nutrients needed to be fully
absorbed and utilised by human or animal bodies through a system called, digestive system
(Byrd-Bredbenner et al., 2009). Food sources such as cereal grains and legumes or commonly
known as pulses are used as an important source of dietary carbohydrates and proteins
(Whitney and Rolfes, 2011). In Australia, cereal grains such as wheat (Triticum spp.) and
barley (Hordeum vulgane L.) are named among the “big three” cereal crops besides sorghum
(Duodu et al., 2003). On the other hand, there are six major pulse groups grown in Australia,
such as Faba bean (Vicia faba), Chickpea (Cicer arietinum), Lentil pea (Lens culinaris),
Lupins (Lupinus L.), Field pea (Pisum sativum) and Vetch (Vicia spp.) (Siddique and Sykes,
1997). Both cereals and pulses contribute to the main energy yielding components of food
and feed (Lawrance, 2007).
In the past, interests in starch and protein digestion within the gastrointestinal tract
have increased dramatically to include ways to increase the efficiency of starch and protein
utilisation (Gidley et al., 2010, Mahasukhonthachat et al., 2010). There are many possible
factors that are capable of resisting digestibility of starch and protein in the gastrointestinal
tract, such as particle size distribution, feed particle form, the presence of anti-nutritional
substances, heat treatments, and generally processing methods (Laurinen et al., 2000).
Amongst these factors, the effect of particle size distribution is the primary factor in affecting
the energy utilization properties. This can be explained that the rate of enzymatic digestion of

JING HOOI TAN s4198650
9
starch and protein in the small intestine will determine the availability of energy for growth
from the consumption of processed feeds or food (Weurding et al., 2001). The longer it takes,
the more are the non-digestible components that enter the large intestine, where bacterial
fermentation, rather than enzymatic digestion, predominates ileal digestibility is recognized
as a key marker of growth, while the succeeding large intestine bacterial fermentation
enhances gut health (Goñi et al., 1997, Mahasukhonthachat et al., 2010, Weurding et al.,
2001). Both are valuable for humans, while for animal, maximum energy delivery from feed
is largely determined by ileal digestion (Gidley et al., 2010). Therefore, understanding starch
and protein digestion will benefit from knowledge of the mechanisms of these digestion
processes, as influenced by unit operations and processes during food and feed manufacture.
Milling is a common unit operation, in which particle size is reduced by increasing
the surface area per unit volume (Amerah et al., 2007). Also, it is capable of disrupting
internal structures and molecular orderliness as well as material fracturability. Studies in the
past have revealed that the molecular orderliness in potato and maize starches were affected
by milling differently, which lead to an increase in damaged starch, decrease in starch
crystallinity and decrease in functional properties (Dhital et al., 2010, Huang et al., 2008).
The various types of mills in food and feed processing include hammer-, disc-, cryo-, ball-
and roller-mills, and these differ in the effective operating force and the extent of frictional
heat generation during the milling operation (Bond, 1963). Milling will cause the exposure of
the internal components of the materials and enhance the enzyme-substrate interactions,
which will affect the digestion of the components. In order to investigate the starch and
protein digestion in cereals and pulses, these grains are usually milled into different particle
sizes for analysing the dependence of the two digestion processes on particle size.
Starch and protein digestion, specifically can be studied using in-vitro and in-vivo
procedures, but the in-vivo procedures are less preferable because of time, cost and ethical

JING HOOI TAN s4198650
10
issues. Most studies have investigated starch and protein digestion based on single-point
measurement rather than time-course measurement. With single-point measurement, data on
digestion profile to understand kinetics of digestion are not available (Singh et al., 2010).
However, the data on digestion profile to understand the kinetics digestion of starch
dependence on processing factor such as particle size distribution can be accessible based on
time-course measurement. There are various in-vitro digestion procedures, and for starch
digestion, the rapid procedure of Sopade and Gidley (2009) that uses a glucometer to measure
glucose at set times has been shown to be versatile and applicable to all food and feed
materials. The starch digestograms obtained from this procedure have been modelled using a
modified first order kinetic model (Eqn. [1.1]). Sopade and co-workers have revealed that the
rate of starch digestion in sorghum, sweet potato, potato, and cowpea is inversely dependent
on the particle size. Furthermore, starch digestion has been revealed to proceed by diffusion
mechanism. There are many others materials (e.g. wheat and field peas) that are used in food
and feed, whose starch digestion behaviours have not been studied. Studying these and
understanding their digestion behaviours would advance knowledge on digestion of food and
feed materials to engineer appropriate diets for humans and animals.
Starch digestion:
Dt = D0 + D∞-0 (1 - exp (- KST t), (1.1)
D = D0 + D∞-0
where D0 = digested starch at time t = 0 (g/100g dry starch), Dt = digested starch at time t
(g/100g dry starch), D = digested starch at infinite time (g/100g dry starch), k = rate
constant (min-1
).

JING HOOI TAN s4198650
11
On the other hand, studies on the kinetics of in-vitro protein digestion are
comparatively limited as compared to studies on the kinetics of in-vitro starch digestion.
There are various in-vitro protein digestion procedures, which include single protease, such
as pepsin or trypsin, or based on multi-proteases, such as pepsin-trypsin, pepsin-pancreatin,
trypsin-chymotrypsin, trypsin-chymotrypsin-peptidase or trypsin-chymotrypsin-protease as
summarised in Table 1.1. These procedures either measure the digested protein or undigested
proteins if proteolysis using a batch or continuous approach, which based on procedures that
include amino acid analysis, chromatography and electrophoresis.
The pH drop three-enzyme method of Hsu. et al. (1977) is widely used in estimating apparent
in-vitro protein digestibility, where the drop in pH results from the release of amino acids,
protein building blocks, as protein is digested. The release of amino acids during proteolysis
is not expected to be linear or of a zero order. Hsu et al. (1977) have observed that power-law
model was the best to describe protein digestograms. However, these authors did not obtain
any significance correlation between parameters of the power-law model and in-vivo protein
digestion. Thus, Sopade and co-workers used a modified first order kinetic to investigate and
understands the kinetics of protein digestion. In terms of pH, a modified first order kinetic
model can be written as (Eqn. [1.2]):
pHt = pH0 + pH -0 (1-exp (-KPR t) (1.2)
pH = pH0 + pH -0
where pH0 = pH at time t = 0, pHt = pH at time t, pH = pH at infinite time, k = rate of
constant (min-1
).

JING HOOI TAN s4198650
12
Table 1.1 Different In-Vitro Protein Digestion Methods
Number Types of in-vitro protein
digestion
Enzyme/s used Sample/s used Analysis Method Reference
1 Single-protease Pepsin 200 mg grain
samples
Determine residual
nitrogen in a Technicon
analyser
Mertz et al. (1984)
Hamaker et al. (1987)
2 Single-protease Pepsin 500 mg dried
protein
Spinco model 120
amino acid
Akeson and Stahmann
(1964)
3 Single-protease Trypsin 40 ml protein
suspension
(2 mg N/ml)
pH drop against
incubation time
Maga et al. (1973)
4 Multi-protease Pepsin-pancreatin 100 mg protein Ion exchange method Akeson et al. 1964
5 Multi-protease Pepsin-pancreatin 250 mg samples Sodium dodecyl sulfate
polyacrylamide gel
electrophoresis (SDS-
PAGE)
Kim and Maga (1987)
6 Multi-protease Pepsin-trypsin 1% w/v legume
samples
High performance size
exclusion
chromatography with
multi-angle laser light
scattering (HPSEC-
MALLS)
Tang et al. (2009)
7 Multi-protease Trypsin-
chymotrypsin-
peptidase
50 ml 6.625 mg/ml
protein suspension
pH drop against
incubation time
Hsu et al. 1997
Zhang et al. (2010)

JING HOOI TAN s4198650
13
In the present study, the hypothesis tested was that starch and protein digestion in
milled cereal grains and pulses are dependent on particle size. Therefore, the objectives were,
to:
1) Investigate the effect of particle size distribution on starch and protein digestions of
cereals and pulses.
2) Examine the kinetics of protein and starch digestion of cereals and pulses.
3) Model protein and starch digestograms.
4) Obtain digestion parameters to examine the relative digestibility of starch and protein.
5) Study the relationship between digestion and particle size parameters.

JING HOOI TAN s4198650
14
CHAPTER 2 Materials and methods
2.1 Cereals and pulses
Wheat and barley, as well as pulses such field peas and lupins were obtained from the
project collaborators, local supplier and Cooperative Research Centre for High Integrity
Australian Pork (Pork CRC) in Australia. The grains were chosen because of their nutritional
importance in food and feed. These grains were cleaned and stored in a freezer for further
analysis.
2.2 Physical properties of grains
The physical properties, such as major diameter, minor diameter and thickness of all
cereals and pulses were measured using Vernier callipers and the 1000-grain weight of these
grains were determined as well. The analysis of the physical properties for all samples were
randomised and replicated. Grains are generally irregular in shapes, but certain regular bodies
can be used to approximate their appearances (Sopade and Okonmah, 1993). The regular
bodies that can be used to represent the grains (wheat, field peas, barley and lupins), and their
respective volumes are shown in Table 2.1.
Table 2.1 Approximate regular bodies for grains and the formulas for their volumes
Grain Assumed regular shape Volume formula
Field peas Spherical
Lupins Cuboid a b c
Barley Ellipsoidal
Wheat Ellipsoidal
*a = major radius, b= minor radius and c= half thickness

JING HOOI TAN s4198650
15
2.3 Particle size reduction
The grains were hammer-milled (MFC type DCFH48, John Morris Scientific Pty. Ltd.,
Eagle Farm QLD 4009, Australia) and cryo-milled (6850 SPEX Freezer/Mill, SPEX,
Metuchen, NJ 08840, USA) using 10 different settings of retention sieves and number of
passes in the hammer mill, and grinding times or cycles in the cryo-mill as shown in Figure
2.1. The cryo-mill was operated at fixed pre-cooling (5 min.) and resting times (2 min.) an
im actor stain ess stee iameter mm ength 70 mm) speed (10 s-1
). For retention sieves
of 1.0 and 0.5 mm in the hammer-mill, the samples were initially ground using 2-mm sieve.
The milling conditions (time, cycle and sieve) were varied to obtain different particle size
distributions and particle sizes. The grindings were randomised and replicated.
Figure 2.1. Preparation of samples grains
JING HOOI TAN s4198650
16
2.4 Particle size analysis
Particle size analysis was carried out using a Malvern Mastersizer Hydro 2000MU
(Malvern Instruments Ltd, Malvern WR14 1XZ, UK) as described by (Mahasukhonthachat et
al., 2010). The volume weighted mean (d[4,3]) was used as the average particle size.
2.5 Moisture content
his was etermine in an o en at or hr bo t g o the sam es were
weighe into reheate C) and cooled moisture dishes. The samples were thereafter
dried, and the change in weight was used to calculate the moisture content (MC) of the
samples (Eqn. [2.1]):
where wt = weight (g).
2.6 Ash Content
This was determine in an o en at or hr bo t g o the sam es were
weighe into reheate C) and cooled crucible dishes. The samples were thereafter dried,
and the change in weight was used to calculate the ash content (AC) of the samples (Eqn.
[2.2]):
where wt = weight (g).

JING HOOI TAN s4198650
17
2.7 Fat Content
The Soxhlet method was used with petroleum spirit as the solvent. Samples were
weighed into thimbles, covered with cotton wool and the fat was extracted in a Soxhlet
apparatus. Upon completion of extracted, the solvent was evaporated and the extracted fat
was weighed, and related to the weight of the sample. The fat content (FC) of the samples
was calculated using (Eqn. [2.3]):
where wt = weigh (g).
2.8 Total starch analysis
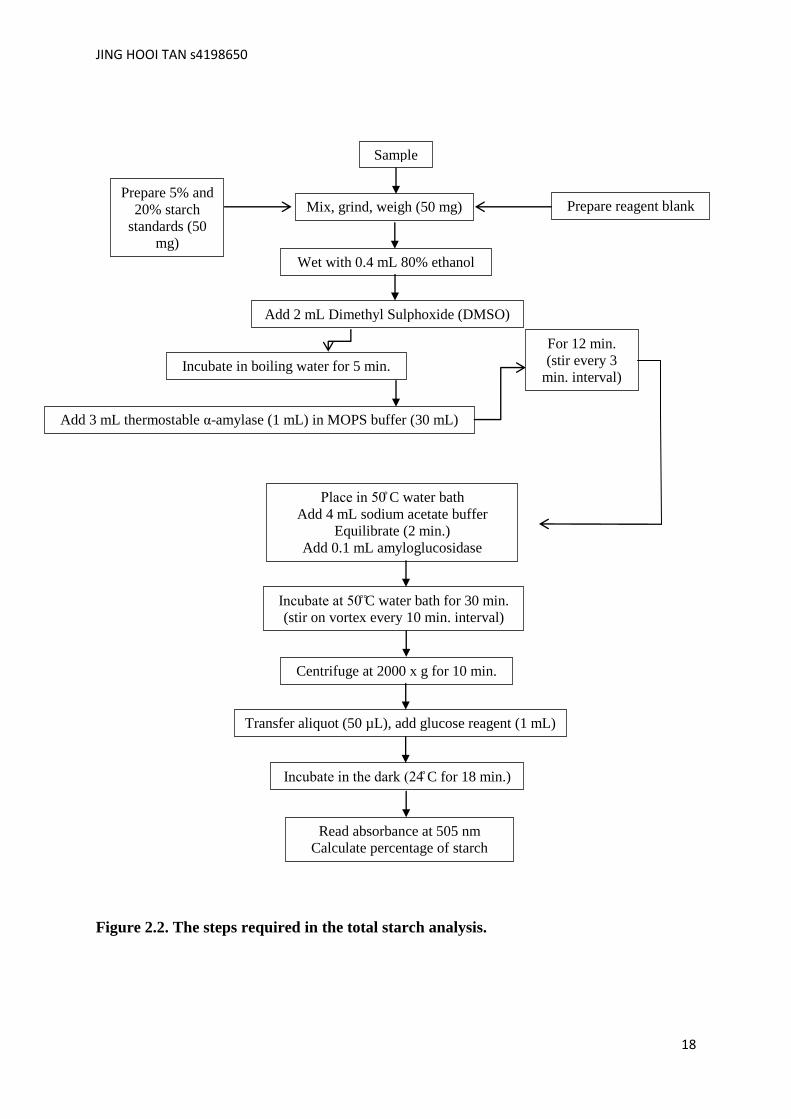
The total starch content of the samples was analysed by using a method derived from
Megazyme (Megazyme International Ireland Ltd, Wicklow, Ireland) based on dimethyl
s hoxi e DMSO) thermostab e α-amylase and amyloglucosidase (Fig. 2.2).
2.9 In-vitro starch digestion
In-vitro starch digestion was assayed using the procedure (Fig. 2.3) described by
Sopade and Gidley (2009), whereby known weight of samples was treated with artificial
saliva containing porcine α-am ase Sigma - ) an e sin Sigma - ) at ow
inc bate at C for 30 min (salivary-gastric digestion) before neutralisation with sodium
hydroxide. A sodium acetate buffer was added to the digesta, which was then treated with
pancreatin Sigma ) an am og cosi ase Sigma - ) an inc bate at C for
240 min. (pancreatin digestion). Accu-Check ® Performa ® glucometer (Roche Diagnostics
Aust. Pty. Ltd., Caste Hill NSW 2154, Australia) was used to measure the glucose
concentration and converted to digested starch.
JING HOOI TAN s4198650
18
Figure 2.2. The steps required in the total starch analysis.
Sample
Mix, grind, weigh (50 mg)
Wet with 0.4 mL 80% ethanol
Prepare 5% and
20% starch
standards (50
mg)
Prepare reagent blank
Add 2 mL Dimethyl Sulphoxide (DMSO)
Incubate in boiling water for 5 min.
Add 3 mL thermostable α-amylase (1 mL) in MOPS buffer (30 mL)
For 12 min.
(stir every 3
min. interval)
ace in C water bath Add 4 mL sodium acetate buffer
Equilibrate (2 min.) Add 0.1 mL amyloglucosidase
nc bate at C water bath for 30 min. (stir on vortex every 10 min. interval)
Centrifuge at 2000 x g for 10 min.
Transfer aliquot (50 µL), add glucose reagent (1 mL)
nc bate in the ar C for 18 min.)
Read absorbance at 505 nm Calculate percentage of starch

JING HOOI TAN s4198650
19
Figure 2.3. The steps in the in-vitro starch digestion procedure
Mix, grind, weight (500 mg)
Add 1mL artificial saliva (α-amylase)
Add 5mL pepsin in 0.02M HCI within 15-20 sec after saliva
Incubate at 37°C in a reciprocating water bath for 30 min.
Neutralize with 5mL of 0.02M NaOH
Add 25mL acetate buffer, and 5mL pancreatin/amyloglucosidase in acetate buffer
Incubate at 37°C in a reciprocating water bath
Record glucose concentration with Glucometer at (min.)
0 10 20 30 45 65 90 120 150 180 210 240
Sample
JING HOOI TAN s4198650
20
2.10 In-vitro protein digestion
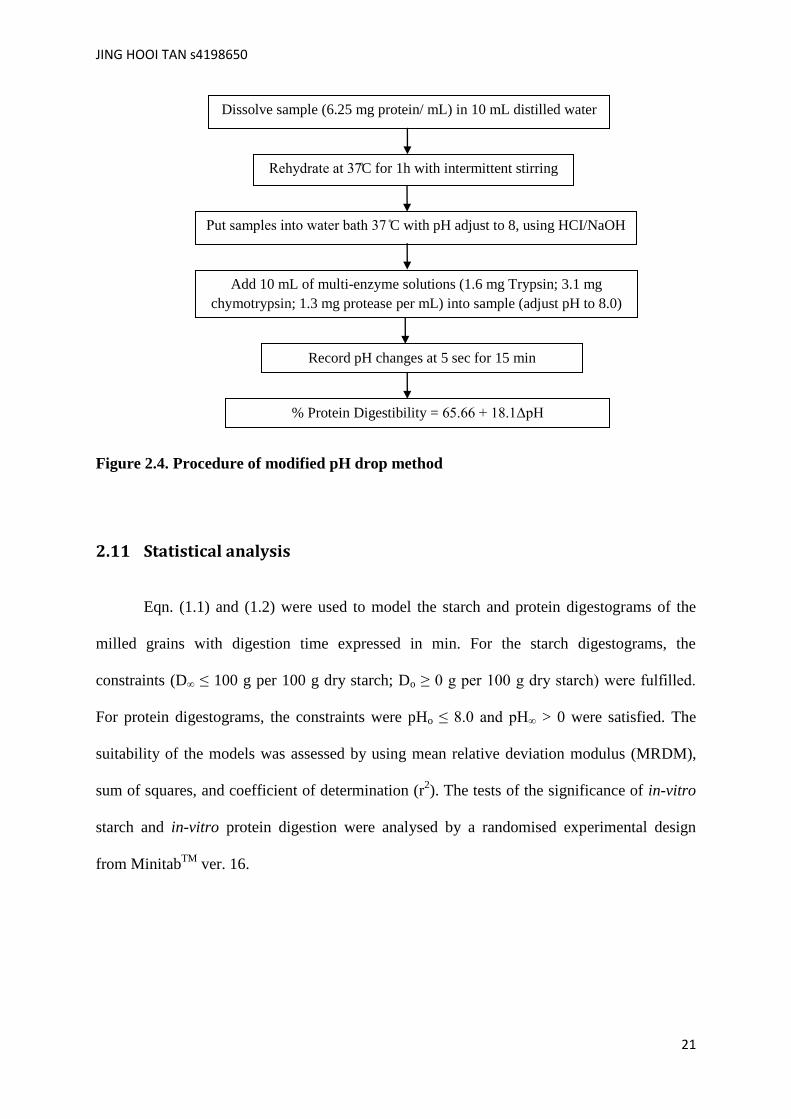
In-vitro protein digestion was assayed using the modified pH-drop procedure as
summarized in Fig. 2.4. Milled sample was weighed by using the formulae, (W= (62.5/p) ×
100 mg, p the percentage of proteins) and rehydrated in 10 mL of milli-Q water at C for 1
hr, after which the pH was adjusted to about 8.0 with 0.1M NaOH and/or HCl. 10 mL of a
multi-enzyme solution consisting of (T0303 Trypsin from porcine pancreas Type IX-S,
lyophilized powder, 13,000-20,000 BAEE units/mg protein), 31 mg of chymotrypsin (C4129
α-Chymotrypsin from bovine pancreas C4129 type II, lypholized powder, 40 units/mg
protein) and 13 mg protease (P5147) Protease from Streptomyces griseus Type XIV,
units/mg solids). Protease was used to replace the discontinued peptidase (Sigma P7500
Peptidase from porcine intestinal mucosal, 50-100 units/g solids). The multi-enzyme solution
was resh re are on the a o ana sis an e t at C, where the pH was adjusted to
about 8.0 prior to being added to the rehydrated sample dispersion. The pH of the digesta was
recorded every 5 sec. for 15 min. exactly using a programmable pH meter. The change in pH
at min o igestion Δ 10 min.) was used to calculate (Eqn. [2.4]):
V D = + Δ 10 min (2.4)
JING HOOI TAN s4198650
21
Figure 2.4. Procedure of modified pH drop method
2.11 Statistical analysis
Eqn. (1.1) and (1.2) were used to model the starch and protein digestograms of the
milled grains with digestion time expressed in min. For the starch digestograms, the
constraints (D∞ ≤ 100 g per 100 g dry starch; Do ≥ g er g r starch) were i e
For protein digestograms, the constraints were pHo ≤ an ∞ > 0 were satisfied. The
suitability of the models was assessed by using mean relative deviation modulus (MRDM),
sum of squares, and coefficient of determination (r2). The tests of the significance of in-vitro
starch and in-vitro protein digestion were analysed by a randomised experimental design
from MinitabTM
ver. 16.
Dissolve sample (6.25 mg protein/ mL) in 10 mL distilled water
eh rate at C for 1h with intermittent stirring
t sam es into water bath C with pH adjust to 8, using HCI/NaOH
Add 10 mL of multi-enzyme solutions (1.6 mg Trypsin; 3.1 mg
chymotrypsin; 1.3 mg protease per mL) into sample (adjust pH to 8.0)
Record pH changes at 5 sec for 15 min
% Protein Digestibility = + Δ

JING HOOI TAN s4198650
22
CHAPTER 3 Results and Discussions
3.1 Physical properties of wheat, barley, field peas and lupins
Different types of wheat, barley, pea and lupin grains were studied, and examining
their physical characteristics would enable differences in their dimensions to be compared.
Within a grain type, field peas in this context, there are differences in terms of major, minor
diameters, thickness (mm) and 1000-grain weight (g) as shown in Table 3.1. For example,
MAKI AGT Increase (field peas 1), its major and minor diameter, and thickness were
respectively 6.7, 6.3 and 6.0 (mm), while its 1000-grain weight was 187.2 g. On the other
hand, CRC Walana AGT Increase (field peas 2), its major and minor diameter, and thickness
were respectively 7.4, 6.7, 6.5, while its 1000-grain weight was 242.5 g.
The regular bodies that can be used to represent the grains (wheat, pea, barley and
lupin), and their respective volumes are shown in Table 2.1. With the given mass, g (1000-
grain weight) in Table 3.1, and volume formula in Table 2.1, density, p of the grains can be
calculated (Eqn. [3.1]):
p (kg/m3) = mass (kg) / volume (m
3) (3.1)
The density of all the grains was tabulated in Table 3.1 and shown in Figure 3.1. The density
of all the grains can be compared within the grain types and among the grain types. Among
the grain types, Gunyidi lupins (12.4 kg/m3) are shown to be denser as compared to pea 1 (3.5
kg/m3). Within the grain types, field peas 4 (4.6 kg/m
3) is shown to be denser as compared to
field peas 1 (3.5 kg/m3).

JING HOOI TAN s4198650
23
Table 3.1. Selected physical characteristics of whole grains
*Values with the same letters are non-significant (p > 0.05)
Sample
Sample
code
Major diameter
(mm)
Minor diameter
(mm)
Thickness
(mm)
1000-grain weight
(g)
Density
(kg/m3)
Gunyidi Lupins GL 7.4d 6.1cde 5.1d 141.6f 664.6a
Coromup Lupins CL 8.3bc 6.6ab 5.5c 192.4c 636.2a
Mandelup Lupins ML 7.9cd 6.4abc 5.4cd 168.9de 623.3a
Hard Wheat 1895 HW 2.8g 2.6h 2.5h 34.6h 446.1b
Soft Wheat 1894 SW 3.6f 3.1g 2.9fg 48.6g 360.1b
Sprouted Wheat 1896 SPW 3.2fg 2.9gh 2.6gh 36.4h 405.7b
MAKI AGT Increase (Field peas 1) FP 1 6.7e 6.3bcd 6.0b 187.2c 14.2c
CRC Walana AGT Increase (Field peas 2) FP 2 7.4d 6.7a 6.5a 242.5a 13.7c
Parafield P3WNA09 (Field peas 4) FP 4 6.5e 5.8e 5.5c 203.5b 18.0c
MAKI S409 Phenology (Field peas 7) FP 7 6.6e 6.2bcde 6.0b 174.1d 13.8c
Parafield S409T1 PBIN (Field peas 12) FP 12 6.6e 5.9e 5.5c 159.4e 12.8c
Kaspa S410 PBIN T2 (Field peas 17) FP 17 6.6e 5.9de 5.5c 149.0f 11.6c
Barley 3764 B 37 9.0a 4.0f 3.9e 51.5g 90.1c
Barley 3933 B 39 8.5b 3.7f 3.3f 37.7h 93.9c
Barley 3873 B 38 8.6ab 3.2g 2.1i 31.3h 109.2c

JING HOOI TAN s4198650
24
Figure 3.1. Grains are varied in terms of density
3.2 Chemical properties of wheat, barley, lupins and field peas
Besides investigating the physical characteristics of wheat, barley, lupins and field
peas, their chemical properties, such as moisture, fat, ash, starch and protein contents are
equally important to be investigated. Table 3.2 shows that different types of grains have
different chemical properties. It is important to note that any of the lupin species has virtually
no starch (Nalle et al., 2011). This is in marked contrast to grains such as field peas, barley
and wheat. Lupin species are relatively rich in proteins as opposed to the three other grain
species, which are rich in starch (Nalle et al., 2011).
Types of grains
Den
sity
, p
(kg/m
3)
560
580
600
620
640
660
680
700
Gunyidi Lupins Coromup Lupins Mandelup Lupins
0
50
100
150
200
250
300
350
400
450
500
Hard Wheat Soft Wheat Sprouted Wheat
0
2
4
6
8
10
12
14
16
18
20
Fieldpeas 1 Fieldpeas 2 Fieldpeas 4 Fieldpeas 7 Fieldpeas12
Fieldpeas17
0
20
40
60
80
100
120
140
Barley 3764 Barley 3933 Barley 3873

JING HOOI TAN s4198650
25
Table 3.2. Selected chemical properties of grains (%)
Sample
Moisture
content
Crude Fat
content Ash
Starch
content
Protein
content
Hard Wheat 11.73cde 2.47c 1.55g 52.79c 18.92f
Soft Wheat 11.04efg 2.75c 1.37gh 62.50a 11.28gh
Sprouted Wheat 12.35bcd 1.75ef 1.30h 57.47b 11.94gh
Gunyidi Lupins 11.41def 5.55b 2.47cd - 32.18a
Mandelup Lupins 9.95gh 5.47b 2.92a - 31.75a
Coromup Lupins 9.20h 6.14a 2.63bc - 31.94a
MAKI AGT Increase 12.57bcd 1.57efg 2.20ef 48.17d 19.94ef
CRC Walana AGT Increase 12.02cde 1.27fg 2.58bcd 43.26e 22.96d
Parafield P3WNA09 13.89a 1.27fg 2.60bcd 41.27e 24.94cd
MAKI S409 Phenology 12.38bcd 1.47efg 2.64bc 42.11e 22.35de
Parafield S409T1 PBIN 13.44ab 1.22g 2.79ab 37.96f 28.73b
Kaspa S410 PBIN T2 12.77abc 1.63efg 2.92a 36.72f 26.01bc
Barley 3764 10.99efg 2.35cd 2.38de 53.56c 12.20g
Barley 3873 10.23fgh 2.67c 2.02f 46.76d 18.77f
Barley 3933 11.73cde 1.95de 2.45cd 54.00c 8.97h
*Values with the same letters are non-significant (p > 0.05)
3.3 Particle size distribution
Figure 3.2 shows the typical particle size distributions of barley, field pea, soft wheat
and lupin grains. Irrespective of the milling technique and condition, all the grains exhibited
bimodal distribution with the fine modal class being less than or equal to about 100 µm,
while the coarse class is greater than 100 µm. Previous studies reported that cereals, legumes
and sweetpotato have bimodal particle size distributions (Becker et al., 2001, Kerr et al.,
2000). As expected, the milling techniques and conditions significantly (p < 0.05) affected
the particle size distribution of the grains with particle size generally increasing with
decreases in the cryo-mill cycle and the number of grinds or reduction in the size of the
retention sieve in hammer-mill.

JING HOOI TAN s4198650
26
Figure 3.2. Particle size distribution of different grains.
Differences in term of types of milling and extent of milling are expected to cause
high degree of damaged starch. Becker et al. (2001) have revealed differences in the protein
contents of fine and coarse fractions. In Figure 3.2, the fine samples had particle less than 100
µm. This suggests that the finer samples might contain mechanically separated starch
granules and protein bodies. With coarse sample showing more distribution between 100 µm
and 1000 µm, these would include multicellular structures containing cells with complete
encapsulating cell walls, with implications for their functional properties (Kerr et al., 2000,
Mahasukhonthachat et al., 2010). However, relatively more studies have been conducted on
the effects of milling on starch than on protein, even though starch and protein are associated.
Hence, it is expected that milling is capable of affecting protein, but the differences in
structure, chemistry and/or molecular architecture are expected to define how these
macromolecules affected, and subsequently, their various properties, including digestion
0
1
2
3
4
5
6
1 10 100 1000 10000
Barley 3764 CG 1
0
1
2
3
4
5
6
1 10 100 1000 10000
Maki AGT Increase HM 5
Sample code
0
1
2
3
4
5
6
1 10 100 1000 10000
Mandelup Lupin HM 4
Sample code
0
1
2
3
4
5
6
1 10 100 1000 10000
Soft Wheat CG 2
Sample code
Sample code
Particle size (µm)
Vo
lum
e (
%)

JING HOOI TAN s4198650
27
(Huang et al., 2008). In the present study, further analysis and discussion will be concentrated
on the volume weighted mean (d[4,3]), as a measure of the average particle size parameter to
be used in investigating the digestion properties of the samples. The particle size parameters
of all the field peas are tabulated in Tables 3.3 and 3.4. The particle size parameters for the
other grains (barley, wheat and lupin) are summarised in Appendices A and B.
Table 3.3. Cryo-milling condition and particle size distribution of the field peas.
Sample Sample Cryo-milling a
Particle size parameter (v/v, µm)
code Cycle [min.] d(v, 0.1)b
d(v, 0.5)b
d(v, 0.9)b
d (4, 3)b
Field peas 1 FP1CG3 1 8 63 785 263
Field peas 1 FP1CG2 2 7 31 309 101
Field peas 1 FP1CG4 3 5 25 227 73
Field peas 1 FP1CG5 4 6 25 200 65
Field peas 1 FP1CG1 6 5 23 146 51
Field peas 12 FP12CG3 1 10 60 589 204
Field peas 12 FP12CG2 2 6 33 314 104
Field peas 12 FP12CG4 3 5 28 258 85
Field peas 12 FP12CG5 4 6 28 201 70
Field peas 12 FP12CG1 6 4 24 183 61
Field peas 17 FP17CG3 1 12 146 796 293
Field peas 17 FP17CG2 2 8 43 415 144
Field peas 17 FP17CG4 3 5 26 230 79
Field peas 17 FP17CG5 4 6 28 236 76
Field peas 17 FP17CG1 6 5 26 201 68
Field peas 2 FP2CG3 1 12 102 895 279
Field peas 2 FP2CG2 2 11 45 797 246
Field peas 2 FP2CG4 3 7 32 301 100
Field peas 2 FP2CG5 4 6 26 196 65
Field peas 2 FP2CG1 6 5 25 161 55
Field peas 4 FP4CG3 1 11 96 772 271
Field peas 4 FP4CG2 2 8 38 380 128
Field peas 4 FP4CG4 3 6 32 263 86
Field peas 4 FP4CG5 4 6 29 200 69
Field peas 4 FP4CG1 6 5 25 164 59
Field peas 7 FP7CG3 1 7 39 488 162
Field peas 7 FP7CG2 2 7 33 293 96
Field peas 7 FP7CG4 3 5 26 229 75
Field peas 7 FP7CG5 4 6 28 218 72
Field peas 7 FP7CG1 6 7 29 178 63
Standard error mean, SEM 0.1 2.6 10.1 7.7 a The number of cycles with 5 min. pre-cooling, 2 min. intermediate (in-between cycles) cooling and 10 s-1 impactor speed
b 10th (d(v, 0.1), 50th (d(v, 0.5), 90th percentiles (d(v, 0.9), and volume weighted mean (d(4, 3)).

JING HOOI TAN s4198650
28
Table 3.4. Hammer-milling condition and particle size distribution of field peas.
Sample Sample Hammer-
milling a
Particle size parameter (v/v, µm)
code Sieve-Passa
d(v, 0.1)b
d(v, 0.5)b
d(v, 0.9)b
d (4, 3)b
Field peas 1 FP1HM 5 0.5 -1 9 30 160 71
Field peas 1 FP1HM 4 1.0 -1 12 51 804 220
Field peas 1 FP1HM 1 2.0 -1 12 57 1136 344
Field peas 1 FP1HM 2 2.0 -3 10 37 1036 283
Field peas 1 FP1HM 3 2.0 -6 10 36 811 249
Field peas 12 FP12HM 5 0.5 -1 11 35 229 82
Field peas 12 FP12HM 4 1.0 -1 13 53 568 181
Field peas 12 FP12HM 1 2.0 -1 16 161 1230 434
Field peas 12 FP12HM 2 2.0 -3 12 41 898 235
Field peas 12 FP12HM 3 2.0 -6 9 35 326 126
Field peas 17 FP17HM 5 0.5 -1 9 30 199 72
Field peas 17 FP17HM 4 1.0 -1 13 67 910 286
Field peas 17 FP17HM 1 2.0 -1 13 97 1197 399
Field peas 17 FP17HM 2 2.0 -3 12 65 1207 386
Field peas 17 FP17HM 3 2.0 -6 10 37 1051 297
Field peas 2 FP2HM 5 0.5 -1 9 34 194 76
Field peas 2 FP2HM 4 1.0 -1 13 47 604 185
Field peas 2 FP2HM 1 2.0 -1 12 59 1052 323
Field peas 2 FP2HM 2 2.0 -3 11 45 895 246
Field peas 2 FP2HM 3 2.0 -6 8 34 752 193
Field peas 4 FP4HM 5 0.5 -1 11 34 163 69
Field peas 4 FP4HM 4 1.0 -1 11 40 861 228
Field peas 4 FP4HM 1 2.0 -1 14 99 1204 403
Field peas 4 FP4HM 2 2.0 -3 12 50 1103 334
Field peas 4 FP4HM 3 2.0 -6 14 74 920 304
Field peas 7 FP7HM5 1.0 -1 10 33 120 65
Field peas 7 FP7HM4 2.0 -1 13 47 598 181
Field peas 7 FP7HM1 2.0 -3 16 73 959 294
Field peas 7 FP7HM2 2.0 -6 14 58 913 250
Field peas 7 FP7HM3 1.0 -1 13 45 835 238
Standard error mean, SEM 0.4 8.4 21.2 7.9 a The retention sieve and number of passes.
b 10th (d(v, 0.1), 50th (d(v, 0.5), 90th percentiles (d(v, 0.9), and volume weighted mean (d(4, 3)).
3.4 Starch digestion kinetics
Irrespective of milling types (cryo- and hammer-milling) and particle sizes, all the
grains exhibited a monosphasic digestogram as shown in Figure 3.3. As expected, more
fractions of starch in hard wheat, field peas and barley were digested as the digestion time
increased, or particle size decreased. This is due to the increased interactions between

JING HOOI TAN s4198650
29
substrate and enzymes that result in increased digested starch (Mahasukhonthachat et al.,
2010, Sopade and Gidley, 2009).
Figure 3.3. Monophasic digestograms of A) Hard Wheat, B) Barley 3873, C) Field
peas 7 and D) Field peas 12
Enzymatic digestion of starch can be affected by many factors such as granule size,
non-starch components, crystalline pattern and amylose to amylopectin ratio, presence of
lipids, presence of minerals, presence of proteins, digestion conditions and milling conditions
(Benmoussa et al., 2006, Vieira and Sarmento, 2008). In this study, further discussion and
analysis will be concentrated on the effect of particle sizes generated by cryo- and hammer-
0
20
40
60
80
100
0 40 80 120 160 200 240
CG 1
Predicted
HM 5
Predicted
Sample Code
0
20
40
60
80
100
0 40 80 120 160 200 240
CG 1
Predicted
HM 5
Predicted
Sample Code
B
Barley 3873
0
20
40
60
80
100
0 40 80 120 160 200 240
CG 1
Predicted
HM 5
Predicted
Sample Code
C
MAKI S409 Phenology 0
20
40
60
80
100
0 40 80 120 160 200 240
CG 1
Predicted
HM 5
Predicted
Sample Code
D
Parafield S409T1 PBIN
Time (min.)
Dig
este
d s
tarc
h (
g/1
00
g d
ry s
tarc
h)
A
Hard Wheat

JING HOOI TAN s4198650
30
mills on the rate of starch digestion. Figure 3.4 showed that the amount of starch digested in
barley 3873 (B38), soft wheat (SW) and field peas 4 (P4) varied along with the particle sizes
and types of milling. As reported in previous studies, differences in the effective operating
force and the extent of frictional heat generation between cryo- and hammer-mills have
significant impact on the amount of starch digested on sorghum, sweetpotato and potato
(Chen et al., 2009, Mahasukhonthachat et al., 2010).
Figure 3.4. Starch digestograms of barley, wheat and field peas of different particle sizes
Dig
este
d s
tarc
h (
g/1
00
g d
ry s
tarc
h)
Time (min.)
0
20
40
60
80
100
0 40 80 120 160 200 240
HM 1 (627 µm)
HM 2 (508 µm)
HM 3 (416 µm)
HM 4 (286 µm)
HM 5 (113 µm)
Predicted
Sample code
0
20
40
60
80
100
0 40 80 120 160 200 240
CG 1 (71 µm)
CG 2 (133 µm)
CG 3 (381 µm)
CG 4 (118 µm)
CG 5 (83 µm)
Predicted
Sample code
Barley 3873
0
20
40
60
80
100
0 40 80 120 160 200 240
HM 1 (491 µm)
HM 2 (465 µm)
HM 3 (379 µm)
HM 4 (255 µm)
HM 5 (143 µm)
Predicted
Sample code
Soft Wheat
0
20
40
60
80
100
0 40 80 120 160 200 240
CG 1 (70 µm)
CG 2 (149 µm)
CG 3 (295 µm)
CG 4 (107 µm)
CG 5 (73 µm)
Predicted
Sample code
Soft Wheat
0
20
40
60
80
100
0 40 80 120 160 200 240
HM 1 (403 µm)
HM 2 (334 µm)
HM 3 (304 µm)
HM 4 (228 µm)
HM 5 (69 µm)
Predicted
Sample code
Parafield P3WNA09
0
20
40
60
80
100
0 40 80 120 160 200 240
CG 1 (59 µm)
CG 2 (128 µm)
CG 3 (271 µm)
CG 4 (86 µm)
CG 5 (69 µm)
Predicted
Sample code
Parafield P3WNA09
Barley 3873

JING HOOI TAN s4198650
31
It can be concluded from Figure 3.4 that increasing particle size of the samples decreased the
rate of starch digestion. This can be explained that finer samples have relative higher surface
area or the access b igesti e enz mes s ch as α-amylase, pepsin, pancreatin and
amyloglucosidase (Mahasukhonthachat et al., 2010, Sopade and Gidley, 2009). The order of
the rate of starch digestion for hammer and cryo-milling:
Barley 3873 (B38):
HM 1 (627 µm) < HM 2 (508 µm) < HM 3 (416 µm) < HM 4 (286 µm) < HM 5 (113 µm)
CG 3 (381 µm) < CG 2 (133 µm) < CG 4 (118 µm) < CG 5 (83 µm) < CG 1 (71 µm)
Soft Wheat (SW):
HM 1 (491 µm) < HM 2 (465 µm) < HM 3 (379 µm) < HM 4 (255 µm) < HM 5 (143 µm)
CG 3 (295 µm) < CG 2 (149 µm) < CG 4 (107 µm) < CG 5 (73 µm) < CG 1 (70 µm)
Parafield P3WNA09 (FP4):
HM 1 (403 µm) < HM 2 (334 µm) < HM 3 (304 µm) < HM 4 (228 µm) < HM 5 (69 µm)
CG 3 (271 µm) < CG 2(128 µm) < CG 4 (86 µm) < CG 5 (69 µm) < CG 1 (59 µm)
As discussed before, a modified first order kinetic model was used to model and
describe starch digestograms as shown in Figures 3.3 and 3.4. In these figures, it showed that
the pattern of the graph for experimental is well fitted into the predicted graphs. Thus, it can
be concluded that the model gave relatively accurate prediction of the digestograms. To
further examine the predictive ability of the model, sum of squares (SUMSQ), coefficient of
determination (r2), mean relative deviation modulus (MRDM) and accuracy factor (AF) were
obtained, and they ranged from 0.991 – 0.999, r2; 0.010 – 0.093, SUMSQ; 5.5 9.7, MDRM;
and 0.6 – 1.0, Af.

JING HOOI TAN s4198650
32
Furthermore, Tables 3.5a and 3.5b show the rate of starch digestion in the milled field
peas with the other digestion parameters from the modified first order kinetic model. The
salivary-gastric digested starch or very rapidly digested starch, Do showed differences within
and between the mills, and generally, the hammer-milled field peas had higher Do values than
the cryo-milled ones. This is due to mill differences with respect to the severity of frictional
heat, which from mill characteristics, would be more with the hammer-milling. In addition, it
is worth noting that starch in both the cryo- and hammer-milled field peas could not be
completely digested due to the presence of non-digestible starch components in the field peas.
The hammer-milled field peas, also exhibited a higher rate of starch digestion and a larger
area under the digestogram (not shown) than the cryo-milled field peas.
In order to establish the mechanisms of starch digestion, previous studies and others
investigated the dependence of the reciprocal of the rate of digestion on the square of the
average particles size (Dhital et al., 2010). The theory proposed that the rate of starch
digestion (1/KST) is inversely proportional to the square of the particle size (p2) is further re-
affirmed in this study (Dhital et al., 2010, Mahasukhonthachat et al., 2010). Figure 3.5
showed that an inverse relationship holds for the effects of particle size on the rate of starch
digestion of the milled grains, but there were mill differences. This agrees with previous
studies on sorghum, sweetpotato, potato and cowpea or blackeye beans (Chen et al., 2009,
Mahasukhonthachat et al., 2010, Tinus et al., 2012). The hammer-milled grains exhibited a
higher rate of starch digestion than the cryo-milled grains. Presumably, the likelihood of
more frictional heat and mechanical energy during hammer-milling caused more digested
starch as compared to the cryo-milled grains. This is because grains are quench-frozen in
liquid nitrogen to well below glass transition temperatures in cryo-milling with negligible
frictional heat as opposed to hammer-milling. Again, this finding further reinforced the
JING HOOI TAN s4198650
33
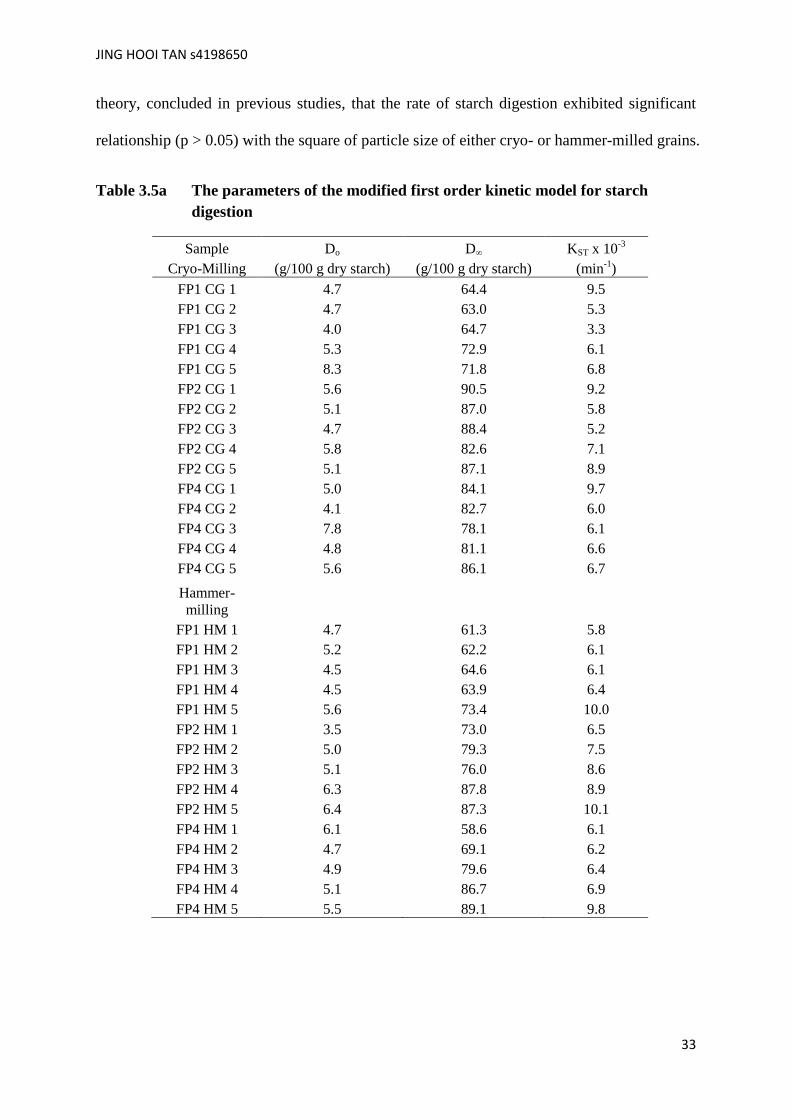
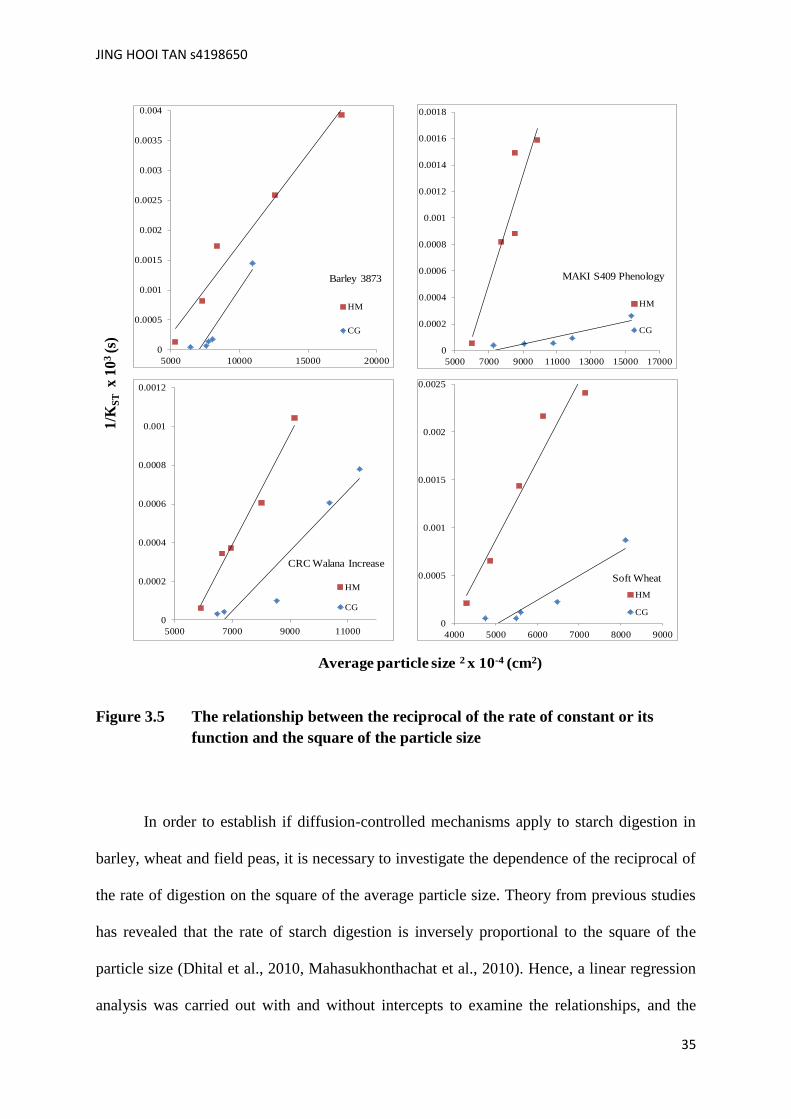
theory, concluded in previous studies, that the rate of starch digestion exhibited significant
relationship (p > 0.05) with the square of particle size of either cryo- or hammer-milled grains.
Table 3.5a The parameters of the modified first order kinetic model for starch
digestion
Sample Do D∞ KST x 10-3
Cryo-Milling (g/100 g dry starch) (g/100 g dry starch) (min-1
)
FP1 CG 1 4.7 64.4 9.5
FP1 CG 2 4.7 63.0 5.3
FP1 CG 3 4.0 64.7 3.3
FP1 CG 4 5.3 72.9 6.1
FP1 CG 5 8.3 71.8 6.8
FP2 CG 1 5.6 90.5 9.2
FP2 CG 2 5.1 87.0 5.8
FP2 CG 3 4.7 88.4 5.2
FP2 CG 4 5.8 82.6 7.1
FP2 CG 5 5.1 87.1 8.9
FP4 CG 1 5.0 84.1 9.7
FP4 CG 2 4.1 82.7 6.0
FP4 CG 3 7.8 78.1 6.1
FP4 CG 4 4.8 81.1 6.6
FP4 CG 5 5.6 86.1 6.7
Hammer-
milling
FP1 HM 1 4.7 61.3 5.8
FP1 HM 2 5.2 62.2 6.1
FP1 HM 3 4.5 64.6 6.1
FP1 HM 4 4.5 63.9 6.4
FP1 HM 5 5.6 73.4 10.0
FP2 HM 1 3.5 73.0 6.5
FP2 HM 2 5.0 79.3 7.5
FP2 HM 3 5.1 76.0 8.6
FP2 HM 4 6.3 87.8 8.9
FP2 HM 5 6.4 87.3 10.1
FP4 HM 1 6.1 58.6 6.1
FP4 HM 2 4.7 69.1 6.2
FP4 HM 3 4.9 79.6 6.4
FP4 HM 4 5.1 86.7 6.9
FP4 HM 5 5.5 89.1 9.8

JING HOOI TAN s4198650
34
Table 3.5b The parameters of the modified first order kinetic model for starch
digestion
Sample code Do D∞ KST x 10-3
Cryo-Milling (g/100 g dry starch) (g/100 g dry starch) (min-1
)
FP7 CG 1 5.6 96.0 8.1
FP7 CG 2 4.8 69.9 5.0
FP7 CG 3 4.5 84.5 4.2
FP7 CG 4 5.7 88.0 5.7
FP7 CG 5 6.3 80.8 6.7
FP12 CG 1 5.3 87.1 8.6
FP12 CG 2 6.3 94.4 5.0
FP12 CG 3 5.1 80.7 4.8
FP12 CG 4 5.9 94.0 5.1
FP12 CG 5 6.0 84.9 8.3
FP17 CG 1 6.6 82.5 8.8
FP17 CG 2 7.0 81.0 5.6
FP17 CG 3 5.8 73.6 5.0
FP17 CG 4 6.3 75.7 6.5
FP17 CG 5 6.1 97.2 8.7
Hammer-
milling
FP7 HM 1 4.5 56.9 4.7
FP7 HM 2 5.0 66.5 5.0
FP7 HM 3 5.6 88.8 6.1
FP7 HM 4 6.8 83.5 7.6
FP7 HM 5 6.0 91.8 11.6
FP12 HM 1 5.5 55.7 5.2
FP12 HM 2 5.7 72.1 5.8
FP12 HM 3 7.8 76.1 6.6
FP12 HM 4 5.9 80.3 6.9
FP12 HM 5 6.4 85.0 10.9
FP17 HM 1 7.5 58.0 6.2
FP17 HM 2 6.6 63.0 6.9
FP17 HM 3 6.5 83.2 7.0
FP17 HM 4 6.5 87.2 7.7
FP17 HM 5 6.5 88.9 10.0
JING HOOI TAN s4198650
35
Figure 3.5 The relationship between the reciprocal of the rate of constant or its
function and the square of the particle size
In order to establish if diffusion-controlled mechanisms apply to starch digestion in
barley, wheat and field peas, it is necessary to investigate the dependence of the reciprocal of
the rate of digestion on the square of the average particle size. Theory from previous studies
has revealed that the rate of starch digestion is inversely proportional to the square of the
particle size (Dhital et al., 2010, Mahasukhonthachat et al., 2010). Hence, a linear regression
analysis was carried out with and without intercepts to examine the relationships, and the
0
0.0005
0.001
0.0015
0.002
0.0025
0.003
0.0035
0.004
5000 10000 15000 20000
HM
CG
Barley 3873
0
0.0002
0.0004
0.0006
0.0008
0.001
0.0012
0.0014
0.0016
0.0018
5000 7000 9000 11000 13000 15000 17000
HM
CG
MAKI S409 Phenology
0
0.0002
0.0004
0.0006
0.0008
0.001
0.0012
5000 7000 9000 11000
HM
CG
CRC Walana Increase
0
0.0005
0.001
0.0015
0.002
0.0025
4000 5000 6000 7000 8000 9000
HM
CG
Soft Wheat
Average particle size 2 x 10⁻⁴ (cm2)
1/K
ST
x 1
03
(s)

JING HOOI TAN s4198650
36
reciprocal of the slope equates to the apparent diffusion coefficient, diffusion mechanisms
prevail if the apparent diffusion coefficient is of the order of 10-7
cm2 s
-1 (Tinus et al., 2012).
Tables 3.6a and 3.6b show the linear equations of the particle size-starch digestibility
obtained with and without the intercepts in both the cryo- or hammer-milled samples, and
indicate that starch digestion in both cryo- or hammer-milled samples proceeded by diffusion
mechanisms. Besides, the apparent diffusion coefficients obtained from Tables 3.6a and 3.6b
showed that different grains, such as barley, wheat and field peas have different diffusion
coefficients. The differences could be due to many factors including cell wall architecture,
the nature of protein matrices that surrounds starch granules and the presence of anti-
n tritiona actors s ch as tannin which can bin to the α-amylase enzyme and reduce its
accessibility through the grain fragments (Björck and Nyman, 1987; Hamaker et al., 1987).
Moreover, it is crucial to examine whether salivary digested starch or very rapidly
digested starch (Do) is only due to the fractions of the finest particles d (v,0.1) or 10th
percentiles. Previous studies have shown that starch granules and protein bodies are less than
150 µm in size. However, there was no evidence to prove that the physically-separated starch
granules and protein bodies are made up by the 10th
and 50th
percentiles (Becker et al., 2001,
Waramboi et al., 2012). The 10th
and 50th
percentiles were used to examine if they could be
used to explain the development of salivary digested starch, Do. In this study, regression
analysis revealed similar significant relationships between Do, and the 10th
, 50th
and 90th
percentiles (Figures 3.6a and 3.6b). Hence, it is plausible that salivary-gastric starch, Do, is
not determined by only 10th
percentile (fine materials), but determined by the whole materials
and their components.

JING HOOI TAN s4198650
37
Table 3.6a Linear equations between the square of the particle size and the
reciprocal of the rate of constant or its function in the cryo-milled samples
Sample 1/K against size2
Diffusion, Diff (x 10-7
cm2 s
-1)
(Cryo-
milling) With intercept Without intercept
With
intercept
Without
intercept
Barley
3764 1/K = 4.6 x 10
3 + 14.9 x 10
6 size
2 1/K = 4.7 x 10
6 size
2 0.67 0.21
r
2 = 0.36 * r
2 = 0.89 **
Barley
3873 1/K = 7.1 x 10
3 + 14.7 x 10
6 size
2 1/K = 2.6 x 10
6 size
2 0.68 0.38
r
2 = 0.91 * r
2 = 0.50 **
Barley
3933 1/K = 5.0 x 10
3 + 15.4 x 10
6 size
2 1/K = 2.1 x 10
6 size
2 0.65 0.47
r
2 = 0.81 * r2 = 0.56 *
Hard Wheat 1/K = 5.2 x 10³ + 10.6 x 10
6 size
2 1/K = 2.3 x 10
6 size
2 0.94 0.43
r
2 = 0.74 * r
2 = 0.43 *
Soft Wheat 1/K = 5.2 x 10³ + 12.8 x 10
6 size
2 1/K = 2.1 x 10
6 size
2 0.78 0.48
r
2 = 0.90 * r
2 = 0.60 *
Sprouted
Wheat 1/K = 6.2 x 10
3 + 13.7 x 10
6 size
2 1/K = 3.0 x 10
6 size
2 0.73 0.34
r
2 = 0.86 * r
2 = 0.63 **
FP 1 1/K = 8.1 x 10
3 + 13.0 x 10
6 size
2 1/K = 2.3 x 10
6 size
2 0.74 0.43
r
2 = 0.89 * r
2 = 0.66 *
FP 2 1/K = 6.9 x 10³ + 13.0 x 10
6 size
2 1/K = 2.2 x 10
6 size
2 0.76 0.46
r
2 = 0.91 * r
2 = 0.69 **
FP 4 1/K = 8.2 x 10
3 + 13.9 x 10
6 size
2 1/K = 2.8 x 10
6 size
2 0.72 0.36
r
2 = 0.81 ** r
2 = 0.79 *
FP 7 1/K = 7.9 x 10³ + 12.0 x 10
6 size
2 1/K = 2.4 x 10
6 size
2 0.83 0.41
r
2 = 0.83 * r
2 = 0.79 *
FP 12 1/K = 8.5 x 10³ + 12.8 x 10
6 size
2 1/K = 2.4 x 10
6 size
2 0.78 0.42
r
2 = 0.47 * r
2 = 0.63 *
FP 17 1/K = 7.7 x 10
3 + 12.8 x 10
6 size
2 1/K = 2.7 x 10
6 size
2 0.78 0.36
r2 = 0.69 * r
2 = 0.79*
aLevel of significance,
* ≤
** ≤
*** ≤ NS = non-significance (p > 0.05)

JING HOOI TAN s4198650
38
Table 3.6b Linear equations between the square of the particle size and the
reciprocal of the rate of constant or its function in the hammer-milled
samples
Sample 1/K against size2
Diffusion, Diff (x 10-7
cm2 s
-1)
(Hammer-
milling) With intercept Without intercept
With
intercept
Without
intercept
Barley 3764 1/K = 3.2 x 10³ + 14.7 x 10
6 size
2 1/K = 4.3 X 10
6 size
2 0.68 0.23
r
2 = 0.53 ** r
2 = 0.91 **
Barley 3873 1/K = 4.4 x 10
3 + 13.9 x 10
6 size
2 1/K = 4.7 X 10
6 size
2 0.72 0.21
r
2 = 0.97 ** r
2 = 0.94 **
Barley 3933 1/K = 4.2 x 10
3 + 13.2 x 10
6 size
2 1/K = 3.3 x 10
6 size
2 0.76 0.3
r
2 = 0.94 ** r
2 = 0.88 *
Hard Wheat 1/K = 4.2 x 10³ + 11.9 x 10
6 size
2 1/K = 2.4 x 10
6 size
2 0.84 0.41
r
2 = 0.90 * r
2 = 0.81*
Soft Wheat 1/K = 4.1 x 10³ + 11.4 x 10
6 size
2 1/K = 3.3 x 10
6 size
2 0.88 0.31
r
2 = 0.94 ** r
2 = 0.86 *
Sprouted
Wheat 1/K = 6.1 x 10
3 + 11.8 x 10
6 size
2 1/K = 3.2 x 10
6 size
2 0.84 0.31
r
2 = 0.96 ** r
2 = 0.85 *
FP 1 1/K = 6.6 x 10
3 + 11.4 x 10
6 size
2 1/K = 2.6 X 10
6 size
2 0.88 0.39
r
2 = 0.72 * r
2 = 0.85 *
FP 2 1/K = 5.7 x 10³ + 12.7 x 10
6 size
2 1/K = 2.0 X 10
6 size
2 0.79 0.49
r
2 = 0.98 ** r
2 = 0.81 *
FP 4 1/K = 6.7 x 10
3 + 13.7 x 10
6 size
2 1/K = 2.3 x 10
6 size
2 0.73 0.43
r
2 = 0.84 * r
2 = 0.83 *
FP 7 1/K = 4.6 x 10³ + 12.3 x 10
6 size
2 1/K = 2.7 x 10
6 size
2 0.81 0.36
r2 = 0.95** r
2= 0.94 **
FP 12 1/K = 7.6 x 10³ + 13.7 x 10
6 size
2 1/K = 3.1 x 10
6 size
2 0.73 0.32
r
2 = 0.58 * r
2 = 0.60 **
FP 17 1/K = 6.1 x 10
3 + 13.0 x 10
6 size
2 1/K = 2.9 x 10
6 size
2 0.77 0.35
r2 = 0.87 ** r
2 = 0.86 **
aLevel of significance,
* ≤
** ≤
*** ≤ NS = non-significance (p > 0.05)

JING HOOI TAN s4198650
39
Figure 3.6a. Particle size parameters against the salivary-gastric digested starch, Do in
cryo-milled grains.
0
5
10
15
20
25
0
200
400
600
800
1000
1200
1400
1600
2 2.5 3 3.5 4 4.5
d(0.
1),
d(0.
5)
d(0.
9),
d(4.
3)
d(0.5)
d(0.9)
d(4.3)
d(0.1)
Barley 3764
0
1
2
3
4
5
6
7
8
9
0
100
200
300
400
500
600
700
800
900
4 4.5 5 5.5 6 6.5 7 7.5 8 8.5 9
d(0.
1),
d(0.
5)
d(0.
9),
d(4.
3)
d(0.5)
d(0.9)
d(4.3)
d(0.1)
Field peas 1
0
1
2
3
4
5
6
7
8
0
100
200
300
400
500
600
4 4.5 5 5.5 6 6.5
d(0.
1),
d(0.
5)
d(0.
9),
d(4.
3)
d(0.5)
d(0.9)
d(4.3)
d(0.1)
Field peas 7
0
2
4
6
8
10
12
14
16
0
100
200
300
400
500
600
700
4 4.5 5 5.5
d(0.
1),
d(0.
5)
d(0.
9),
d(4.
3)
d(0.5)
d(0.9)
d(4.3)
d(0.1)
Sprouted Wheat
R² = 0.5737 0
2
4
6
8
10
12
14
16
18
20
0
100
200
300
400
500
600
700
800
900
4 4.5 5
d(0.
1),
d(0.
5)
d(0.
9),
d(4.
3)
d(0.5)
d(0.9)
d(4.3)
d(0.1)
Soft Wheat
0
2
4
6
8
10
12
0
50
100
150
200
250
300
350
400
450
500
1 2 3 4 5 6 7 8
d(0.
1),
d(0.
5)
d(0.
9),
d(4.
3)
d(0.5)
d(0.9)
d(4.3)
d(0.1)
Barley 3933
Salivary-gastric digested starch, Do (g/100 g dry starch)
Pa
rtic
le s
ize
pa
ram
eter
(µm
)

JING HOOI TAN s4198650
40
Figure 3.6b Particle size parameters against the salivary-gastric digested starch, Do in
hammer-milled grains.
0
5
10
15
20
25
0
200
400
600
800
1000
1200
1400
3 4 5
d(0
.1),
d(0
.5)
d(0
.9),
d(4
.3)
d(0.5)
d(0.9)
d(4.3)
d(0.1)
Barley 3764
0
2
4
6
8
10
12
14
16
18
0
200
400
600
800
1000
1200
4 5 6 7
d(0
.1),
d(0
.5)
d(0
.9),
d(4
.3)
d(0.5)
d(0.9)
d(4.3)
d(0.1)
Field peas 7
0
2
4
6
8
10
12
14
0
200
400
600
800
1000
1200
3 4 5 6 7
d(0
.1),
d(0
.5)
d(0
.9),
d(4
.3)
d(0.5)
d(0.9)
d(4.3)
d(0.1)
Field peas 2
0
5
10
15
20
25
0
200
400
600
800
1000
1200
3 4 5
d(0
.1),
d(0
.5)
d(0
.9),
d(4
.3)
d(0.5)
d(0.9)
d(4.3)
d(0.1)
Soft Wheat
0
5
10
15
20
25
0
200
400
600
800
1000
1200
4 5 6
d(0
.1),
d(0
.5)
d(0
.9),
d(4
.3)
d(0.5)
d(0.9)
d(4.3)
d(0.1)
Sprouted Wheat
0
5
10
15
20
25
30
35
40
45
50
0
200
400
600
800
1000
1200
1400
5 6 7
d(0
.1),
d(0
.5)
d(0
.9),
d(4
.3)
d(0.5)
d(0.9)
d(4.3)
d(0.1)
Hard Wheat
Salivary-gastric digested starch, Do (g/100 g dry starch)
Pa
rtic
le s
ize
pa
ram
eter
(µ
m)

JING HOOI TAN s4198650
41
3.5 Protein digestion kinetics
Irrespective of milling types and particle sizes, there is a reduction in the pH of the
protease-digested barley, wheat, field peas, lupins and casein (control) with the incubation
time. As expected, the speed of the pH-drop curve was different for casein and samples, such
as barley, wheat, field peas and lupin as shown in Figure 3.7. For example, the reduction in
the pH of casein was more than that of other samples. This can be explained that casein is
essentially protein, while there are non-protein (e.g. starch and cell wall) components in the
other samples that are capable of affecting protein digestion. Hence, it can be deduced that
casein is certainly digested more quickly than all other samples.
In this study, further discussion and analysis will be concentrated on the effect of
particle sizes generated by cryo- and hammer-mills on the rate of protein digestion. Figure
3.8 showed that the amount of protein digested in barley 3933 (B39), sprouted wheat (SPW),
coromup lupin (CL) and field peas 7 (FP7) varied along with the particle sizes and types of
milling. As discussed before, differences in the effective operating force and the extent of
frictional heat generation between cryo- and hammer-mills can have significant impact on the
amount of protein digested.
As shown in Figure 3.8, increasing particle size of the milled samples decreased the
rate of protein digestion. This can be explained that smaller samples have relative higher
surface area per unit volume for the access by digestive enzymes, such as trypsin,
chymotrypsin and protease. The order of the rate of protein digestion for hammer and cryo-
milling:

JING HOOI TAN s4198650
42
Figure 3.7 Monophasic digestograms of A) Barley 3873, B) Gunyidi Lupin, C)
Sprouted Wheat, D) Field peas 7, E) Field peas 1 and F) Casein
Time (min.)
pH
A
Casein
4
4.5
5
5.5
6
6.5
7
7.5
8
8.5
0 5 10 15
F
Casein
7
7.2
7.4
7.6
7.8
8
0.00 5.00 10.00 15.00
CG 1
HM 5
Predicted-CG
Predicted-HM
6.8
7
7.2
7.4
7.6
7.8
8
0.00 5.00 10.00 15.00
CG 1
HM 5
Predicted-CG
Predicted-HM
Gunyidi Lupins
6.8
7
7.2
7.4
7.6
7.8
8
0.00 5.00 10.00 15.00
CG 1
HM 5
Predicted-CG
Predicted-HM
Sprouted Wheat
7
7.2
7.4
7.6
7.8
8
0.00 5.00 10.00 15.00
CG 1
HM 5
Predicted-CG
Predicted-HM
MAKI S409 Phenology
6.8
7
7.2
7.4
7.6
7.8
8
0.00 5.00 10.00 15.00
CG1
HM5
Predicted-CG
Predicted-HM
MAKI AGT Increase
Barley 3873

JING HOOI TAN s4198650
43
Figure 3.8 Protein digestograms of barley 3933, sprouted wheat, coromup lupin and
field peas 7 of different particle sizes
7
7.1
7.2
7.3
7.4
7.5
7.6
7.7
7.8
7.9
8
0.00 2.00 4.00 6.00 8.00 10.00 12.00 14.00 16.00
HM 1
HM 2
HM 3
HM 4
HM 5
Predicted pH
MAKI S409 Phenology
6.8
7
7.2
7.4
7.6
7.8
8
0.00 2.00 4.00 6.00 8.00 10.00 12.00 14.00 16.00
HM 1
HM 2
HM 3
HM 4
HM 5
Predicted pH
Sprouted Wheat
6.8
7
7.2
7.4
7.6
7.8
8
0.00 2.00 4.00 6.00 8.00 10.00 12.00 14.00 16.00
CG 1
CG 2
CG 3
CG 4
CG 5
Predicted pH
Barley 3933
6.8
7
7.2
7.4
7.6
7.8
8
0.00 2.00 4.00 6.00 8.00 10.00 12.00 14.00 16.00
CG 1
CG 2
CG 3
CG 4
CG 5
Predicted pH
MAKI S409 Phenology
6.6
6.8
7
7.2
7.4
7.6
7.8
8
0.00 2.00 4.00 6.00 8.00 10.00 12.00 14.00 16.00
HM 1
HM 2
HM 3
HM 4
HM 5
Predicted pH
Coromup Lupins
6.6
6.8
7
7.2
7.4
7.6
7.8
8
0.00 2.00 4.00 6.00 8.00 10.00 12.00 14.00 16.00
B39HM 1
B39HM 2
B39HM 3
B39HM 4
B39HM 5
Predicted pH
Barley 3933
6.6
6.8
7
7.2
7.4
7.6
7.8
8
0.00 2.00 4.00 6.00 8.00 10.00 12.00 14.00 16.00
CG 1
CG 2
CG 3
CG 4
CG 5
Predicted pH
Sprouted Wheat
6.8
7
7.2
7.4
7.6
7.8
8
0.00 2.00 4.00 6.00 8.00 10.00 12.00 14.00 16.00
CG 1
CG 2
CG 3
CG 4
CG 5
Predicted pH
Coromup Lupins
Time (min.)
pH
JING HOOI TAN s4198650
44
Barley 3933 (B39):
HM 1 (526 µm) < HM 2 (426 µm) < HM 3 (366 µm) < HM 4 (352 µm) < HM 5 (144 µm)
CG 3 (167 µm) < CG 2 (94 µm) < CG 4 (76 µm) < CG 5 (60 µm) < CG 1 (44 µm)
Sprouted Wheat (SPW):
HM 1 (566 µm) < HM 2 (497 µm) < HM 3 (426 µm) < HM 4 (383 µm) < HM 5 (176 µm)
CG 3 (234 µm) < CG 2 (128 µm) < CG 4 (77 µm) < CG 5 (75 µm) < CG 1 (59 µm)
Coromup Lupins (CL):
HM 1 (411 µm) < HM 2 (374 µm) < HM 3 (356 µm) < HM 4 (319 µm) < HM 5 (115 µm)
CG 3 (357 µm) < CG 2 (152 µm) < CG 4 (128 µm) < CG 5 (108 µm) < CG 1 (98 µm)
MAKI S409 Phenology (FP 7):
HM 1 (294 µm) < HM 2 (250 µm) < HM 3 (238 µm) < HM 4 (181 µm) < HM 5 (65 µm)
CG 3 (162 µm) < CG 2 (96 µm) < CG 4 (75 µm) < CG 5 (72 µm) < CG 1 (63 µm)
As discussed in the kinetics of starch digestion, a modified first order kinetic model
was used to model and describe protein digestograms as shown in Figure 3.7. In Figure 3.7, it
showed that the pattern of the graph for experimental is well fitted into the predicted graphs.
Thus, it can be concluded that the model gave relatively accurate prediction of the
digestograms. To further examine the predictive ability of the model, sum of squares
(SUMSQ), coefficient of determination (r2), mean relative deviation modulus (MRDM) and
accuracy factor (AF) were obtained, and they ranged from 0.991 – 0.998, r2; 0.009 – 0.091,
SUMSQ; 0.1 – 0.4, MDRM; and 0.7 – 1.0, Af. The closer the SUMSQ and MDRM values to
0 and the closer the Af values to 1, which are considered an indicator of good predictability.

JING HOOI TAN s4198650
45
The protein digestograms of all the samples can be well described by modelling the
time course protein digestion of the samples with the modified first-order kinetic model in
(Eqn. [1.2]). Tables 3.7a and 3.7b summarize the parameters from the model and the apparent
in-vitro protein digestibility (IVPD) (Eqn. [3.1]):
V D = + Δ 10 min. (3.1)
where Δ 10 min. is the change in pH 10 in 10 min. from the initial pH of about 8.0.
Again, irrespective of the mills and milling condition, in-vitro protein digestion
(IVPD) of hammer-milled samples were digested more than 80%, exhibiting nominally
higher protein digestion than the cryo-milled samples as recorded in Tables 3.7a and 3.7b. It
can also be observed (Table 3.7a and 3.7b) that, the rate of protein digestion in the hammer-
milled samples was nominally higher than that of the cryo-milled samples. As discussed for
starch, the frictional heat and mechanical energy in the hammer mill are capable of disrupting
the structure and organisation of the sample protein to make them more susceptible to
digestion (Chen et al., 2009, Mahasukhonthachat et al., 2010).
Besides that, the theory proposed that the rate of protein digestion (1/KPR) is inversely
proportional to the square of the particle size (p2) can be further re-affirmed in this study.
Figure 3.9 showed that an inverse relationship holds for the effects of particle size on the rate
of protein digestion of the milled samples, but there were mill differences; a result that agreed
with the previous studies on the starch digestion of sorghum, sweetpotato and potato (Chen et
al., 2009, Mahasukhonthachat et al., 2010, Tinus et al., 2012). This further proven the results
obtained by calculating the IVPD in Tables 3.7a and 3.7b. Presumably, the likelihood of more
frictional heat and mechanical energy during hammer-milling caused more digested starch as
compared to the cryo-milled grains. This is because samples are quench-frozen in liquid

JING HOOI TAN s4198650
46
nitrogen to well below glass transition temperatures in cryo-milling with negligible frictional
heat as opposed to hammer-milling (Tinus et al., 2012).
Figure 3.9. The relationship between the reciprocal of the rate of constant or its
function and the square of the particle size
0
0.0002
0.0004
0.0006
0.0008
0.001
0.0012
0 100 200 300 400
CG
HM
CRC Walana Increase
0
0.0005
0.001
0.0015
0.002
0.0025
0.003
0 50 100 150 200 250 300
CG
HM
Soft Wheat
0
0.0005
0.001
0.0015
0.002
0.0025
0.003
0.0035
0.004
0 100 200 300 400 500
CG
HM
Gunyidi Lupins
0
0.0005
0.001
0.0015
0.002
0.0025
0.003
0.0035
0.004
0.0045
0 100 200 300 400
CG
HM
Barley 3873
Average particle size 2 x 10⁻⁴ (cm2)
1/K
PR
x 1
04
(s)

JING HOOI TAN s4198650
47
Table 3.7a. The parameters of the modified first order kinetic model for protein
digestion in cryo-milled field peas
Sample Sample code
Average particle
size
IVPD
(g/100 g dry protein) KPR x 10-3
(min-1
)
d [4,3], µm
Field peas 1 FP1CG 3 263.3 80.7 228.7
Field peas 1 FP1CG 2 101.0 82.2 290.3
Field peas 1 FP1CG 4 72.5 82.4 254.0
Field peas 1 FP1CG 5 65.3 84.3 295.0
Field peas 1 FP1CG 1 51.1 84.5 391.1
Field peas 12 FP12CG 3 204.4 78.6 176.5
Field peas 12 FP12CG 2 104.3 80.4 198.7
Field peas 12 FP12CG 4 84.7 80.7 199.8
Field peas 12 FP12CG 5 70.0 81.0 231.7
Field peas 12 FP17CG 1 61.5 83.5 243.6
Field peas 17 FP17CG 3 293.3 78.4 114.2
Field peas 17 FP17CG 2 143.8 79.0 172.2
Field peas 17 FP17CG 4 78.8 79.4 172.7
Field peas 17 FP17CG 5 75.9 79.7 253.9
Field peas 17 FP17CG 1 68.0 80.4 300.5
Field peas 2 FP2CG 3 279.1 80.2 186.1
Field peas 2 FP2CG 2 246.1 82.0 214.3
Field peas 2 FP2CG 4 99.6 82.3 232.4
Field peas 2 FP2CG 5 64.7 82.6 277.5
Field peas 2 FP2CG 1 55.4 82.8 307.6
Field peas 4 FP4CG 3 271.0 77.5 155.6
Field peas 4 FP4CG 2 128.2 77.9 179.1
Field peas 4 FP4CG 4 86.3 78.5 193.0
Field peas 4 FP4CG 5 69.1 78.9 196.4
Field peas 4 FP4CG 1 58.8 79.2 210.2
Field peas 7 FP7CG 3 161.9 76.2 273.4
Field peas 7 FP7CG 2 96.4 77.7 282.8
Field peas 7 FP7CG 4 74.7 79.9 302.1
Field peas 7 FP7CG 5 72.3 80.1 330.8
Field peas 7 FP7CG 1 63.5 80.3 348.1

JING HOOI TAN s4198650
48
Table 3.7b. The parameters of the modified first order kinetic model for protein
digestion in hammer-milled field peas
Sample Sample code
Average
particle size IVPD KPR x 10-
3 (min-1
)
d [4,3], µm (g/100 g dry protein)
Field peas 1 FP1HM 5 263.3 85.1 333.9
Field peas 1 FP1HM 4 101.0 84.8 327.7
Field peas 1 FP1HM 1 72.5 81.0 275.4
Field peas 1 FP1HM 2 65.3 82.9 279.0
Field peas 1 FP1HM 3 51.1 84.1 285.0
Field peas 12 FP12HM 5 204.4 84.2 233.4
Field peas 12 FP12HM 4 104.3 81.2 234.3
Field peas 12 FP12HM 1 84.7 79.5 185.1
Field peas 12 FP12HM 2 70.0 80.3 236.9
Field peas 12 FP12HM 3 61.5 80.3 189.5
Field peas 17 FP17HM 5 293.3 83.7 184.1
Field peas 17 FP17HM 4 143.8 83.2 183.9
Field peas 17 FP17HM 1 78.8 79.8 210.1
Field peas 17 FP17HM 2 75.9 80.5 230.6
Field peas 17 FP17HM 3 68.0 81.1 174.6
Field peas 2 FP2HM 5 279.1 86.1 516.0
Field peas 2 FP2HM 4 246.1 84.2 362.2
Field peas 2 FP2HM 1 99.6 79.4 297.9
Field peas 2 FP2HM 2 64.7 81.8 300.4
Field peas 2 FP2HM 3 55.4 83.7 339.4
Field peas 4 FP4HM 5 271.0 80.8 217.9
Field peas 4 FP4HM 4 128.2 80.7 415.2
Field peas 4 FP4HM 1 86.3 79.2 268.4
Field peas 4 FP4HM 2 69.1 79.4 228.7
Field peas 4 FP4HM 3 58.8 80.6 299.3
Field peas 7 FP7HM 5 161.9 81.5 260.8
Field peas 7 FP7HM 4 96.4 81.0 256.6
Field peas 7 FP7HM 1 74.7 79.3 164.7
Field peas 7 FP7HM 2 72.3 80.4 185.5
Field peas 7 FP7HM 3 63.5 80.5 282.9

JING HOOI TAN s4198650
49
As highlighted above, a review of the literature revealed most studies investigated
starch rather than protein digestion. Studies about rate of protein digestion dependence on
processing factors such as particle size are relatively limited. It appears the present study is
the first to examine the dependence of the kinetic of protein digestion of cereals and pulses on
particle size. As mentioned for starch digestion, there were significant linearly relationships
between the reciprocal of the rate of protein digestion and the square of the particle size as
shown in Tables 3.8a and 3.8b. If the reciprocal of the rate of protein digestion, which is the
apparent diffusion coefficient is of the order of 10-7
cm2 s
-1, it is plausible to suggest that the
digestion of protein in the samples also proceeded by diffusion mechanisms. The reciprocal
of the slope of the relationship was in the order of 10-7
cm2 s
-1, and as shown in starch
digestion kinetics, it suggests that the digestion of proteins in these milled samples also
proceeded by diffusion mechanisms.

JING HOOI TAN s4198650
50
Table 3.8a. Linear equations between the square of the particle size and the
reciprocal of the rate of constant or its function in hammer-milled grains.
Sample 1/K against size2 Diffusion, Diff (x 10
-7 cm
2 s
-1)
(Cryo-
Milling) With intercept Without intercept
With
intercept
Without
intercept
Barley
3764 1/K = 178.6 + 120.5 x 10
3 size
2 1/K = 434.8 x 10
3 size
2 83.0 23.0
r2 = 0.80 * r2 = 0.90 **
Barley
3873 1/K = 192.3 + 133.3 x 10
3 size
2 1/K = 188.7 x 10
3 size
2 75.1 53.0
r2 = 0.66 * r2 = 0.82 *
Barley
3933 1/K = 113.7 + 136.9 x 10
3 size
2 1/K = 208.3 x 10
3 size
2 73.0 48.0
r2 = 0.91 ** r2 = 0.87 *
Coromup
Lupins 1/K = 90.6 + 117.6 x10
3 size
2 1/K = 232.6 x 10
3 size
2 85.0 43.0
r2 = 0.77 * r2 = 0.94 **
Gunyidi
Lupins 1/K = 149.3 + 126.6 x 10
3 size
2 1/K = 208.3 x 10
3 size
2 79.0 48.0
r2 = 0.98 ** r2 = 0.93 **
Hard
Wheat 1/K = 160.3 + 122.0 x 10
3 size
2 1/K = 196.1 x 10
3 size
2 82.0 51.0
r2 = 0.92 ** r2 = 0.82 *
Mandelup
Lupins 1/K = 119.1 + 133.3 x 10
3 size
2 1/K = 243.9 x 10
6 size
2 75.0 41.0
r2 = 0.77 * r2 = 0.91 **
Soft
Wheat 1/K = 167.6
+ 122.0 x 10
3 size
2 1/K = 196.1 x 10
3 size
2 81.9 51.0
r2 = 0.90 * r2 = 0.84 *
Sprouted
Wheat 1/K = 144.7 + 129.9 x 10
3 size
2 1/K = 238.1 x 10
3 size
2 77.0 42.0
r2 = 0.79 * r2 = 0.93 **
FP 1 1/K = 177.1
+ 131.6 x 10
3 size
2 1/K = 244.0 x 10
3 size
2 76.0 41.0
r2 = 0.77 * r2 = 0.80 *
FP 2 1/K = 132.7 + 131.6 x 10
3 size
2 1/K = 212.8 x 10
3 size
2 76.0 47.0
r2 = 0.74 * r2 = 0.81 *
FP 4 1/K = 225.3
+ 123.5 x 10
3 size
2 1/K = 222.2 x 10
3 size
2 81.0 45.0
r2 = 0.90 * r2 = 0.67 *
FP 7 1/K = 195.8 + 122.0 x 10
3 size
2 1/K = 256.4 x 10
3 size
2 81.9 39.0
r2 = 0.84 * r2 = 0.86 *
FP 12 1/K = 264.9 + 133.3 x 10
3 size
2 1/K = 222.2 x10
3 size
2 75.0 45.0
r2 = 0.82 * r2 = 0.71 *
FP 17 1/K = 132.7 + 119.0 x 10
3 size
2 1/K = 227.3 x10
3 size
2 84.0 44.0
r2 = 0.74 * r2 = 0.81 *
aLevel of significance,
* ≤
** ≤
*** ≤ NS = non-significance (p > 0.05)

JING HOOI TAN s4198650
51
Table 3.8b. Linear equations between the square of the particle size and the
reciprocal of the rate of constant or its function in cryo-milled grains.
Sample 1/K against size2 Diffusion, Diff (x 10
-7 cm
2 s
-1)
(Hammer
-Milling) With intercept Without intercept
With
intercept
Without
intercept
Barley
3764 1/K = 177.3 + 128.8 x 10
3 size
2 1/K = 212.8 x 10
3 size
2 77.7 47.0
r2= 0.91 * r2 = 0.93 **
Barley
3873 1/K = 223.6 + 123.5 x 10
3 size
2 1/K = 263.4 x 10
3 size
2 80.9 38.0
r2 = 0.45 * r2 = 0.82 *
Barley
3933 1/K = 175.7 + 127.2 x 10
3 size
2 1/K = 212.8 x 10
3 size
2 78.6 47.0
r2 = 0.99 *** r2 = 0.72 *
Coromup
Lupins 1/K = 116.3 + 128.6 x 10
3 size
2 1/K = 217.2 x 10
3 size
2 77.7 46.0
r2 = 0.96 * r2 = 0.94 *
Gunyidi
Lupins 1/K = 236.6 + 115.0 x 10
3 size
2 1/K = 232.5 x 10
3 size
2 87.0 43.0
r2 = 0.74 ** r2 = 0.93 *
Hard
Wheat 1/K = 215.6 + 128.3 x 10
3 size
2 1/K = 208.1 x 10
3 size
2 77.9 48.0
r2 = 0.65 * r2 = 0.82 *
Mandelup
Lupins 1/K = 250.7 + 125.0 x 10
3 size
2 1/K = 222.3 x 10
3 size
2 80.0 45.0
r2 = 0.44 NS r2 = 0.91 *
Soft
Wheat 1/K = 172.4 + 128.4 x 10
3 size
2 1/K = 238.1 x 10
3 size
2 77.9 42.0
r2 = 0.82 * r2 = 0.72 *
Sprouted
Wheat 1/K = 205.3 + 117.3 x 10
3 size
2 1/K = 208.9 x 10
3 size
2 85.2 47.9
r2 = 0.70 * r2 = 0.78 *
FP 1 1/K = 197.8 + 121.6 x 10
3 size
2 1/K = 256.4 x 10
3 size
2 82.2 39.0
r2 = 0.76 * r2 = 0.75 *
FP 2 1/K = 213.7 + 127.5 x10
3 size
2 1/K = 243.9 x 10
3 size
2 78.4 41.0
r2 = 0.74 * r2 = 0.84 *
FP 4 1/K = 298.6 + 131.8 x 10
3 size
2 1/K = 212.6 x10
3 size
2 75.9 47.0
r2 = 0.90 * r2 = 0.68 *
FP 7 1/K = 180.1 + 128.3 x 10
3 size
2 1/K = 243.5 x 10
3 size
2 77.9 41.1
r2 = 0.59 * r2 = 0.66 *
FP 12 1/K = 262.4 + 123.7 x 10
3 size
2 1/K = 256.1 x 10
3 size
2 80.8 39.0
r2 = 0.71 * r2 = 0.57 *
FP 17 1/K = 250.7 + 124.7 x 10
3 size
2 1/K = 232.8 x 10
3 size
2 80.2 42.9
r2 = 0.81 * r2 = 0.86 **
aLevel of significance,
* ≤
** ≤
*** ≤ NS = non-significance (p > 0.05)

JING HOOI TAN s4198650
52
Furthermore, it is necessary to examine whether the rate of protein digestion (KPR) is
only due to the fractions of the finest particles d(v, 0.1) or 10th
percentiles. Previous studies
have shown that starch granules and protein bodies are less than 150 µm in size. However
there was no evidence to prove that the physically-separated starch granules and protein
bodies are made up by 10th
and 50th
percentiles. The 10th
and 50th
percentiles were used to
examine if they could be used to explain the development of the rate of protein digestion. In
this study, regression analysis revealed similar significant relationships between the rate of
protein digestion and the 10th
, 50th
and 90th
percentiles (Figures 3.10a and 3.10b). Thus, it is
plausible to conclude that the rate of protein digestion is not related to only 10th
percentile
(fine materials), but determined by the whole materials and their components.

JING HOOI TAN s4198650
53
Figure 3.10a. Particle size parameters against the rate of protein digestion, KPR in
cryo-milled grains
0
5
10
15
20
25
0
200
400
600
800
1000
1200
1400
100.0 150.0 200.0 250.0 300.0 350.0
d(0
.1),
d(0
.5)
d(0
.9),
d(4
.3)
d(0.5)
d(0.9)
d(4.3)
d(0.1)
Barley 3764
0
2
4
6
8
10
12
14
0
100
200
300
400
500
600
700
800
900
1000
350.0 400.0 450.0 500.0 550.0
d(0
.1),
d(0
.5)
d(0
.9),
d(4
.3)
d(0.5)
d(0.9)
d(4.3)
d(0.1)
Coromup Lupins
0
2
4
6
8
10
12
0
100
200
300
400
500
600
700
150.0 200.0 250.0
d(0
.1),
d(0
.5)
d(0
.9),
d(4
.3)
d(0.5)
d(0.9)
d(0.4)
d(0.1)
Field peas 12
0
2
4
6
8
10
12
14
0
100
200
300
400
500
600
700
800
900
1000
150.0 200.0 250.0 300.0 350.0
d(0
.1),
d(0
.5)
d(0
.9),
d(4
.3)
d(0.5)
d(0.9)
d(4.3)
d(0.1)
Field peas 2
0
2
4
6
8
10
12
0
100
200
300
400
500
600
700
800
900
140.0 180.0 220.0
d(0
.1),
d(0
.5)
d(0
.9),
d(4
.3)
d(0.5)
d(0.9)
d(4.3)
d(0.1)
Field peas 4
0
2
4
6
8
10
12
14
16
18
20
0
100
200
300
400
500
600
700
800
900
250.0 300.0 350.0 400.0
d(0
.1),
d(0
.5)
d(0
.9),
d(4
.3)
d(0.5)
d(0.9)
d(4.3)
d(0.1)
Soft Wheat
Rate of protein digestion, KPR x 10-3 (min-1)
Pa
rtic
le s
ize
pa
ram
eter
(µm
)

JING HOOI TAN s4198650
54
Figure 3.10b. Particle size parameters against the rate of protein digestion, KPR in
hammer-milled grains
0
5
10
15
20
25
0
200
400
600
800
1000
1200
1400
150 200 250 300 350
d(0
.1),
d(0
.5)
d(0
.9),
d(4
.3)
d(0.5)
d(0.9)
d(4.3)
d(0.1)
Barley 3764
0
10
20
30
40
50
60
0
200
400
600
800
1000
1200
1400
1600
150 200 250 300 350 400
d(0
.1),
d(0
.5)
d(0
.9),
d(4
.3)
d(0.5)
d(0.9)
d(4.3)
d(0.1)
Gunyidi Lupins
0
2
4
6
8
10
12
14
0
200
400
600
800
1000
1200
250 300 350
d(0
.1),
d(0
.5)
d(0
.9),
d(4
.3)
d(0.5)
d(0.9)
d(4.3)
d(0.1)
Field peas 1
0
2
4
6
8
10
12
14
0
200
400
600
800
1000
1200
250 300 350 400 450 500 550
d(0
.1),
d(0
.5)
d(0
.9),
d(4
.3)
d(0.5)
d(0.9)
d(4.3)
d(0.1)
Gunyidi Lupins
0
5
10
15
20
25
0
200
400
600
800
1000
1200
1400
200 250 300 350
d(0
.1),
d(0
.5)
d(0
.9),
d(4
.3)
d(0.5)
d(0.9)
d(4.3)
d(0.1)
Soft Wheat
0
5
10
15
20
25
0
200
400
600
800
1000
1200
1400
1600
200 240 280 320
d(0
.1),
d(0
.5)
d(0
.9),
d(4
.3)
d(0.5)
d(0.9)
d(4.3)
d(0.1)
Sprouted Wheat
Rate of protein digestion, KPR x 10-3 (min-1)
Pa
rtic
le s
ize
pa
ram
eter
(µm
)

JING HOOI TAN s4198650
55
Besides that, it is also important to note that the rate of protein digestion was about 33
(refer to Tables 3.5a and 3.5b for starch digestion and Tables 3.8a and 3.8b for protein
digestion) times higher than the rate of starch digestion in both cryo- and hammer-milled
samples. This can be explained that enzymatic activities of protein and starch digestion are
dependent on the concentration and specificity for the substrates. Unlike starch, the structure
and organisation of protein can exist in different forms with varied amino acids in food
systems. In previous studies, Vasconcelos et al. (2010) have obtained different form of
proteins in Brazilian cowpea, such as globulins, albumins, prolamins, glutelins and residuals.
These protein fractions were found to be different in terms of molecular weights and
susceptibility to proteolysis. In the study, results showed that the building blocks of protein,
amino acids were easier release from protein units, than the release of glucose from starch
molecules, thereby lowering the pH of the digesta (Waramboi et al., 2012). This can be
explained by the nature of the protein. Proteins, comprising of polymer chain of amino acids
bonded together by peptide bonds between carboxyl (COOH) and amino groups (NH2) will
start to break down in the stomach under acidic conditions. Eventually, more amino acids will
be produced leading to a pH reduction in the digestion samples (Dangin et al., 2001).
Figures 3.11 A and 3.11 B show the rate of protein digestion against the rate of starch
digestion in the milled samples. The rate of protein digestion was found to be proceeded at a
much faster (33 X) rate than starch digestion in the milled samples with implications for
nutrient asynchrony.

JING HOOI TAN s4198650
56
Figure 3.11. Rate of protein digestion against rate of starch digestion
0
50
100
150
200
250
300
350
400
450
0 2 4 6 8 10 12
Field peas 1Field peas 12Field peas 17Field peas 2Field peas 4Field peas 7
C
0
100
200
300
400
500
600
0 5 10 15
Field peas 1Field peas 12Field peas 17Field peas 2Field peas 4Chickpeas 7
D
Rate of starch digestion, KST x 10-3 (min-1)
Ra
te o
f p
ro
tein
dig
est
ion
, KP
R x
10
-3 (
min
-1)
KPR = 17.378 KST + 128 R² = 0.3059***
0
100
200
300
400
500
600
0 2 4 6 8 10 12 14 16
Hammer-milling(all samples)
A KPR = 13.485 KST + 142.31
R² = 0.278***
0
50
100
150
200
250
300
350
400
450
0 2 4 6 8 10 12 14
Cryo-milling(all samples)
B

JING HOOI TAN s4198650
57
CHAPTER 4 Conclusions
Particle size and type of mill affected starch and protein digestion in all milled grains.
Irrespective of the mill and for most or all the grain samples, starch and protein digestion can
be said to proceed by diffusion based on the inverse relationship between the rate of starch
and protein digestion (rate coefficient) and the square of the average particle size. However,
the hammer-milled grains were more digested with a higher diffusion coefficient, presumably
due to greater frictional heat and mechanical effects generated than during cryo-milling.
Frictional heat, consequently molecular transformations, would have been minimal or non-
existent during cryo-milling because this occurs in a glassy state.
The present study is the first on starch and protein digestion kinetics of a wide array
of cryo- and hammer-milled cereals and pulses. With differences in starch and protein
digestion, the presence of both nutrients will affect, as expected, overall energy availability
from food and feed. It is unknown if one is preferentially digested or the digestion of one is
rate-limited by the digestion of other. Hence, the significance of this study is having the
knowledge (a) relative digestibility of energy-yielding macromolecules in food and feed, (b)
nutrient asynchrony with the rate of protein digestion being much faster than that of starch
digestion in milled grains, (c) knowledge of how to maximise the end use of food and feed by
possibly targeting processing conditions that maximise the digestibility of the lower
digestible component for animal feeds, or conditions that minimize the digestibility of the
higher digestible component for human foods if that helps growth and gut health.

JING HOOI TAN s4198650
58
CHAPTER 5 Further research needs and recommendations
The following have been identified for future research needs:
a) Animal trials (feeding metabolism) to examine the concept of particle size
distributions.
b) Grain functional properties, such as pasting and gelatinisation combined with
digestion kinetics to select an appropriate particle size for desired application uses
of grains.
c) Identification of mill settings required to vary particle size distributions at fixed
average particle sizes.
d) Evaluation of particle size distribution at different settings in all commercial mills,
such as disc- and roller-mills.

JING HOOI TAN s4198650
59
References
AKESON, W. R. & STAHMANN, M. A. 1964. Pepsin pancreatin digest index of protein
quality evaluation. Journal of Nutrition, 83, 257-261.
AMERAH, A., RAVINDRAN, V., LENTLE, R. & THOMAS, D. 2007. Feed particle size:
Implications on the digestion and performance of poultry. World's Poultry Science
Journal, 63, 439-455.
BECKER, A., HILL, S. & MITCHELL, J. 2001. Milling-A further parameter affecting the
rapid visco analyser (RVA) profile. Cereal chemistry, 78, 166-172.
BENMOUSSA, M., SUHENDRA, B., ABOUBACAR, A. & HAMAKER, B. R. 2006.
Distinctive sorghum starch granule morphologies appear to improve raw starch
digestibility. Starch‐Stärke, 58, 92-99.
BJÖRCK, I. M. & NYMAN, M. E. 1987. In vitro effects of phytic acid and polyphenols on
starch digestion and fiber degradation. Journal of Food Science, 52, 1588-1594.
BLACK, J. L., HUGHES, R. J., NIELSEN, S. G., TREDREA, A. M., MACALPINE, R. &
BARNEVELD, R. J. 2005. The energy value of cereal grains, particularly wheat and
sorghum, for poultry. Proceedings of the Australian Poultry Science Symposium, 17,
21-29.
BOND, F. C. 1963. Some recent advances in grinding theory and practice. Brisitish
Chemistry Engineering 8, 631-634.
BYRD-BREDBENNER, C., MOE, G., BESHGETOOR, D. & BERNING, J. 2009.
Perspectives in nutrition London Mc Graw Hill Higher.
CHEN, G., KRAVCHUK, O. & SOPADE, P. Kinetics of starch digestion in Australian
sweetpotato as affected by particle size. 15th triennial symposium of the international
society for tropical root crops. International Potato Centre, Lima, Peru, 2009.
DANGIN, M., BOIRIE, Y., GARCIA-RODENAS, C., GACHON, P., FAUQUANT, J.,
CALLIER, P., BALLÈVRE, O. & BEAUFRÈRE, B. 2001. The digestion rate of
protein is an independent regulating factor of postprandial protein retention. American
Journal of Physiology-Endocrinology And Metabolism, 280, E340-E348.
DHITAL, S., SHRESTHA, A. K. & GIDLEY, M. J. 2010. Relationship between granule size
and in-vitro digestibility of maize and potato starches. Carbohydrate Polymers, 82,
480-488.
GIDLEY, M. J., SOPADE, P. A., RABADI, G. A., WILLIAMS, B. & BLACK, J. 2010.
Processing methods for improving the utilization of cereals grains by pigs. Australian
Government's Cooperative Research Centres 102, 1-34.
GOÑI, I., GARCIA-ALONSO, A. & SAURA-CALIXTO, F. 1997. A starch hydrolysis
procedure to estimate glycemic index. Nutrition Research, 17, 427-437.
HAMAKER, B., KIRLEIS, A., BUTLER, L., AXTELL, J. & MERTZ, E. 1987. Improving
the in vitro protein digestibility of sorghum with reducing agents. Proceedings of the
National Academy of Sciences, 84, 626.
HERRERA, S. R., GOMEZ, A. R., TORABI, M. & HUBER, J. T. 1990. Influence of
synchronizing proteina and starch degradation in the rumen on nutrient utilization and
microbial protein synthesis. Jounrnal of Dairy Science, 73, 142-149.
HSU., H. W., VAVAK., D. L., SATTERLEE., L. D. & MILLER, G. A. 1977. A
multienzyme technique for estimating protein digestibility. Journal of Food Science,
42, 1269-1273.
HUANG, Z. Q., XIE, X., CHEN, Y., LU, J. & TONG, Z. F. 2008. Ball-milling treatment
effect on physicochemical properties and features for cassava and maize starches.
Comptes Rendus Chimie, 11, 73-79.

JING HOOI TAN s4198650
60
KERR, W., WARD, C., MCWATTERS, K. & RESURRECCION, A. 2000. Effect of milling
and particle size on functionality and physicochemical properties of cowpea flour.
Cereal chemistry, 77, 213-219.
KIM, C. H. & MAGA, J. 1987. Properties of extruded whey protein concentrate and cereal
flour blends. Lebensmittel Wissenschaft Technologie, 20, 311-318.
LAURINEN, P., SILJANDER-RASI, H., KARHUNEN, J., ALAVIUHKOLA, T., NASI, M.
& TUPPI, K. 2000. Effects of different grinding methods and particle size of barley
and wheat on pig performance and digestibility. Animal Feed Science and Technology,
83, 1-16.
LAWRANCE, L. 2007. Lupins Australia's role in world markets. Australian Commodities,
14, 353-356.
MAGA, J. A., LORENZ, K. & ONAYEMI, O. 1973. Digestive acceptability of proteins as
measured by the initial rate of in vitro proteolysis. Journal of Food Science, 38, 173-
174.
MAHASUKHONTHACHAT, K., SOPADE, P. A. & GIDLEY, M. J. 2010. Kinetics of
starch digestion in sorghum as affected by particle size. Journal of Food Engineering,
96, 18-28.
MERTZ, E. T., HASSEN, M. M., CAIRNSWHITTERN, C., KIRLEIS, A. W., TU, L. &
AXTELL, J. D. 1984. Pepsin digestibility of proteins in sorghum and other major
cereals. Proceedings of the National Academy of Sciences of the United States of
America-Biological Sciences, 81, 1-2.
NALLE, C., RAVINDRAN, V. & RAVINDRAN, G. 2011. Nutritional value of white lupins
(Lupinus albus) for broilers: apparent metabolisable energy, apparent ileal amino acid
digestibility and production performance. Animal, 1, 1-7.
RICHARDSON, J. M., WILKINSON, R. G. & SINCLAIR, L. A. 2003. Synchrony of
nutrient supply to the ruman and dietary energy source and their effects on the growth
and metabolism of lambs. Journal of Animal Science, 81, 1332-1339.
SARIKAYA, E., HIGASA, T. & ADACHI, M. e Mikami, B.(2000). Comparison of
degradation abilities of a-and b-amylases on raw starch granules. Process
Biochemistry, 35, 711.
SIDDIQUE, K. H. M. & SYKES, J. 1997. Pulse production in Australia past, present and
future. Australian Journal of Experimental Agriculture, 37, 103-111.
SINGH, J., DARTOIS, A. & KAUR, L. 2010. Starch digestibility in food matrix: A review.
Trends in Food Science & Technology, 21, 168-180.
SOPADE, P. & OKONMAH, G. 1993. The influence of physicochemical properties of foods
on their water absorption behaviour: A quantitative approach. ASEAN Food Journal,
8, 32.
SOPADE, P. A. & GIDLEY, M. J. 2009. A Rapid In‐vitro Digestibility Assay Based on
Glucometry for Investigating Kinetics of Starch Digestion. Starch‐Stärke, 61, 245-255.
TANG, C. H., CHEN, L. & MA, C. Y. 2009. Thermal aggregation, amino acid composition
and in vitro digestibility of vicilin-rich protein isolates from three Phaseolus legumes:
A comparative study. Food chemistry, 113, 957-963.
TESTER, R. & MORRISON, W. 1994. Properties of damaged starch granules. V.
Composition and swelling of fractions of wheat starch in water at various
temperatures. Journal of Cereal Science, 20, 175-181.
TINUS, T., DAMOUR, M., VAN RIEL, V. & SOPADE, P. 2012. Particle size-starch-protein
digestibility relationships in cowpea (Vigna unguiculata). Journal of Food
Engineering, 113, 254-264.
VASCONCELOS, I. M., MAIA, F. M. M., FARIAS, D. F., CAMPELLO, C. C.,
CARVALHO, A. F. U., DE AZEVEDO MOREIRA, R. & DE OLIVEIRA, J. T. A.

JING HOOI TAN s4198650
61
2010. Protein fractions, amino acid composition and antinutritional constituents of
high-yielding cowpea cultivars. Journal of food composition and analysis, 23, 54-60.
VIEIRA, F. C. & SARMENTO, S. 2008. Heat‐Moisture Treatment and Enzymatic
Digestibility of Peruvian Carrot, Sweet Potato and Ginger Starches. Starch‐Stärke, 60,
223-232.
WARAMBOI, J. G., GIDLEY, M. J. & SOPADE, P. A. 2012. Kinetics of starch digestion in
sweetpotato flours from Papua New Guinean and Australian cultivars. Carbohydrate
Polymers, 87, 461-470.
WEURDING, R. E., VELDMAN, A., VEEN, W. A. G., VAN DER AAR, P. J. &
VERSTEGEN, M. W. A. 2001. In vitro starch digestion correlates well with rate and
extent of starch digestion in broiler chickens. The Journal of nutrition, 131, 2336-
2342.
WHITNEY, E. & ROLFES, S. R. 2011. Understanding Nutrition, United States, Wadsworth
Cengage Learning America.
ZHANG, Y., LI, Y., QIU, F. & QIU, Z. 2010. Comparative analysis of the human urinary
proteome by 1D SDS-PAGE and chip-HPLC-MS/MS identification of the AACT
putative urinary biomarker. Journal of Chromatography B, 878, 3395-3401.

JING HOOI TAN s4198650
62
Appendices
Appendix A: Cryo-milling condition and particle size distribution of the samples.
Sample Sample Cryo-milling a
Particle size parameter (v/v, µm)
code Cycle [min.] d(v, 0.1)b
d(v, 0.5)b
d(v, 0.9)b
d (4, 3)b
Barley 3763 B37CG3 1 19 340 1193 482
Barley 3763 B37CG2 2 17 264 1192 455
Barley 3763 B37CG4 3 15 229 1096 403
Barley 3763 B37CG5 4 15 194 1012 392
Barley 3763 B37CG1 6 7 40 319 108
Barley 3873 B38CG3 1 20 231 985 381
Barley 3873 B38CG2 2 10 54 374 133
Barley 3873 B38CG4 3 11 52 322 118
Barley 3873 B38CG5 4 8 38 227 83
Barley 3873 B38CG1 6 8 37 186 71
Barley 3933 B39CG3 1 10 69 471 167
Barley 3933 B39CG2 2 6 31 267 94
Barley 3933 B39CG4 3 5 27 218 76
Barley 3933 B39CG5 4 4 24 173 60
Barley 3933 B39CG1 6 3 19 128 44
Hard Wheat HWCG3 1 24 181 823 321
Hard Wheat HWCG2 2 13 68 289 119
Hard Wheat HWCG4 3 14 72 287 100
Hard Wheat HWCG5 4 11 60 215 94
Hard Wheat HWCG1 6 9 50 158 75
Soft Wheat SWCG3 1 18 140 814 295
Soft Wheat SWCG2 2 13 76 401 149
Soft Wheat SWCG4 3 10 55 285 107
Soft Wheat SWCG5 4 7 40 188 73
Soft Wheat SWCG1 6 7 38 175 70
Sprouted Wheat SPWCG3 1 14 115 622 234
Sprouted Wheat SPWCG2 2 9 58 354 128
Sprouted Wheat SPWCG4 3 6 37 206 77
Sprouted Wheat SPWCG5 4 7 39 197 75
Sprouted Wheat SPWCG1 6 5 31 154 59
Mandelup Lupins MLCG3 1 12 275 1092 422
Mandelup Lupins MLCG2 2 8 80 606 216
Mandelup Lupins MLCG4 3 7 42 303 106
Mandelup Lupins MLCG5 4 6 39 283 99
Mandelup Lupins MLCG1 6 6 31 200 70
Mandelup Lupins MLCG3 1 12 275 1092 422

JING HOOI TAN s4198650
63
Coromup Lupins CLCG3 1 12 223 924 357
Coromup Lupins CLCG2 2 8 64 514 182
Coromup Lupins CLCG4 3 7 49 368 128
Coromup Lupins CLCG5 4 7 43 307 108
Coromup Lupins CLCG1 6 6 33 207 98
Gunyidi Lupins GLCG3 1 19 254 1112 431
Gunyidi Lupins GLCG2 2 15 281 1014 397
Gunyidi Lupins GLCG4 3 9 59 398 144
Gunyidi Lupins GLCG5 4 7 41 276 104
Gunyidi Lupins GLCG1 6 8 56 269 98
Field peas 1 FP1CG3 1 8 63 785 263
Field peas 1 FP1CG2 2 7 31 309 101
Field peas 1 FP1CG4 3 5 25 227 73
Field peas 1 FP1CG5 4 6 25 200 65
Field peas 1 FP1CG1 6 5 23 146 51
Field peas 12 FP12CG3 1 10 60 589 204
Field peas 12 FP12CG2 2 6 33 314 104
Field peas 12 FP12CG4 3 5 28 258 85
Field peas 12 FP12CG5 4 6 28 201 70
Field peas 12 FP12CG1 6 4 24 183 61
Field peas 17 FP17CG3 1 12 146 796 293
Field peas 17 FP17CG2 2 8 43 415 144
Field peas 17 FP17CG4 3 5 26 230 79
Field peas 17 FP17CG5 4 6 28 236 76
Field peas 17 FP17CG1 6 5 26 201 68
Field peas 2 FP2CG3 1 12 102 895 279
Field peas 2 FP2CG2 2 11 45 797 246
Field peas 2 FP2CG4 3 7 32 301 100
Field peas 2 FP2CG5 4 6 26 196 65
Field peas 2 FP2CG1 6 5 25 161 55
Field peas 4 FP4CG3 1 11 96 772 271
Field peas 4 FP4CG2 2 8 38 380 128
Field peas 4 FP4CG4 3 6 32 263 86
Field peas 4 FP4CG5 4 6 29 200 69
Field peas 4 FP4CG1 6 5 25 164 59
Field peas 7 FP7CG3 1 7 39 488 162
Field peas 7 FP7CG2 2 7 33 293 96
Field peas 7 FP7CG4 3 5 26 229 75
Field peas 7 FP7CG5 4 6 28 218 72
Field peas 7 FP7CG1 6 7 29 178 63
Standard error mean, SEM 0.1 2.6 10.1 7.7 a The number of cycles with 5 min. pre-cooling, 2 min. intermediate (in-between cycles) cooling and 10 s-1 impactor speed
b 10th (d(v, 0.1), 50th (d(v, 0.5), 90th percentiles (d(v, 0.9), and volume weighted mean (d(4, 3)).

JING HOOI TAN s4198650
64
Appendix B: Hammer-milling condition and particle size distribution of the samples.
Sample Sample Hammer-
milling a
Particle size parameter (v/v, µm)
code Sieve-Pass d(v, 0.1)b
d(v, 0.5)b
d(v, 0.9)b
d (4, 3)b
Barley 3763 B37HM 5 0.5 -1 7 40 319 108
Barley 3763 B37HM 4 1.0 -1 17 229 1012 392
Barley 3763 B37HM 1 2.0 -1 19 340 1193 482
Barley 3763 B37HM 2 2.0 -3 15 264 1192 455
Barley 3763 B37HM 3 2.0 -6 15 194 1096 403
Barley 3873 B38HM 5 0.5 -1 10 48 323 113
Barley 3873 B38HM 4 1.0 -1 13 111 804 286
Barley 3873 B38HM 1 2.0 -1 22 575 1396 627
Barley 3873 B38HM 2 2.0 -3 22 385 1214 508
Barley 3873 B38HM 3 2.0 -6 15 184 1147 416
Barley 3933 B39HM 5 0.5 -1 10 52 409 144
Barley 3933 B39HM 4 1.0 -1 14 196 930 352
Barley 3933 B39HM 1 2.0 -1 18 405 1268 526
Barley 3933 B39HM 2 2.0 -3 14 268 1109 426
Barley 3933 B39HM 3 2.0 -6 13 189 995 366
Hard Wheat HWHM 5 0.5 -1 17 92 334 139
Hard Wheat HWHM 4 1.0 -1 22 143 800 289
Hard Wheat HWHM 1 2.0 -1 47 329 1190 495
Hard Wheat HWHM 2 2.0 -3 33 252 1095 435
Hard Wheat HWHM 3 2.0 -6 20 117 818 301
Soft Wheat SWHM 5 0.5 -1 11 63 407 143
Soft Wheat SWHM 4 1.0 -1 13 72 779 255
Soft Wheat SWHM 1 2.0 -1 22 335 1225 491
Soft Wheat SWHM 2 2.0 -3 20 311 1173 465
Soft Wheat SWHM 3 2.0 -6 17 131 1072 379
Sprouted Wheat SPWHM 5 0.5 -1 13 87 462 176
Sprouted Wheat SPWHM 4 1.0 -1 18 238 975 383
Sprouted Wheat SPWHM 1 2.0 -1 22 462 1261 566
Sprouted Wheat SPWHM 2 2.0 -3 20 367 1219 497
Sprouted Wheat SPWHM 3 2.0 -6 17 262 1100 426
Mandelup Lupins MLHM 5 0.5 -1 10 63 401 141 Mandelup Lupins MLHM 4 1.0 -1 35 319 1081 450 Mandelup Lupins MLHM 1 2.0 -1 47 548 1376 626
Mandelup Lupins MLHM 2 2.0 -3 33 574 1398 606
Mandelup Lupins MLHM 3 2.0 -6 13 191 1223 446
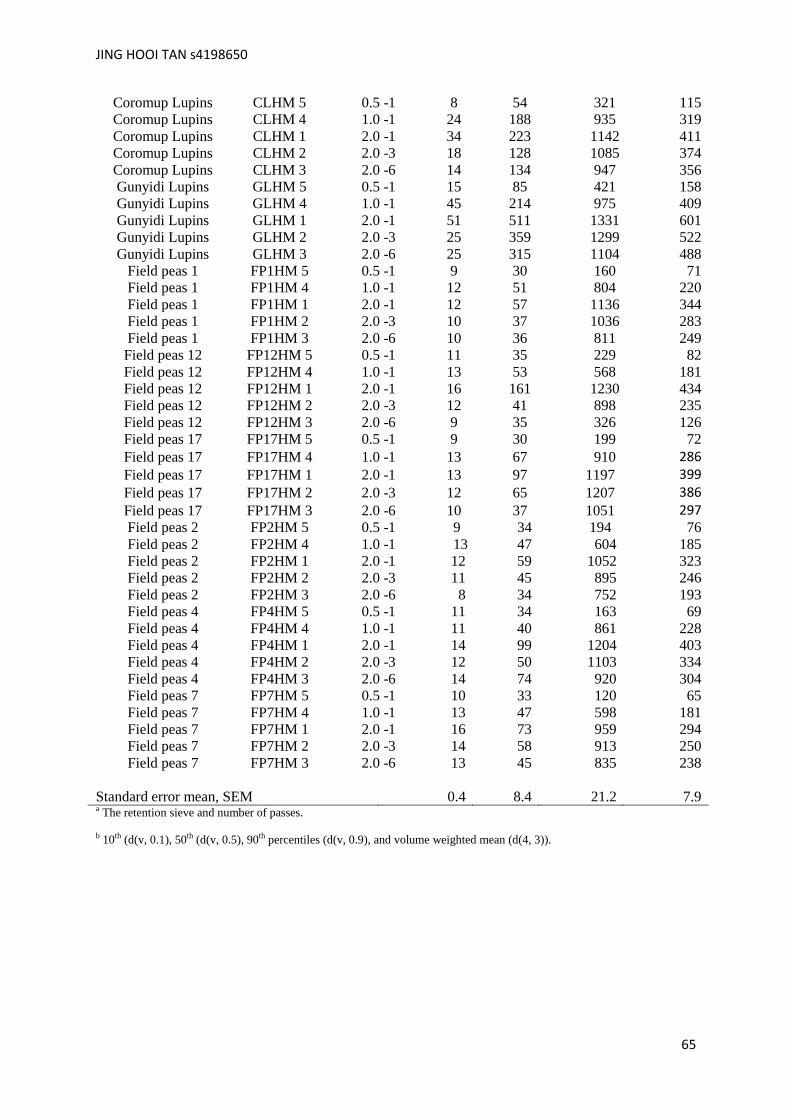
JING HOOI TAN s4198650
65
Coromup Lupins CLHM 5 0.5 -1 8 54 321 115
Coromup Lupins CLHM 4 1.0 -1 24 188 935 319
Coromup Lupins CLHM 1 2.0 -1 34 223 1142 411
Coromup Lupins CLHM 2 2.0 -3 18 128 1085 374
Coromup Lupins CLHM 3 2.0 -6 14 134 947 356
Gunyidi Lupins GLHM 5 0.5 -1 15 85 421 158
Gunyidi Lupins GLHM 4 1.0 -1 45 214 975 409
Gunyidi Lupins GLHM 1 2.0 -1 51 511 1331 601
Gunyidi Lupins GLHM 2 2.0 -3 25 359 1299 522
Gunyidi Lupins GLHM 3 2.0 -6 25 315 1104 488
Field peas 1 FP1HM 5 0.5 -1 9 30 160 71
Field peas 1 FP1HM 4 1.0 -1 12 51 804 220
Field peas 1 FP1HM 1 2.0 -1 12 57 1136 344
Field peas 1 FP1HM 2 2.0 -3 10 37 1036 283
Field peas 1 FP1HM 3 2.0 -6 10 36 811 249
Field peas 12 FP12HM 5 0.5 -1 11 35 229 82
Field peas 12 FP12HM 4 1.0 -1 13 53 568 181
Field peas 12 FP12HM 1 2.0 -1 16 161 1230 434
Field peas 12 FP12HM 2 2.0 -3 12 41 898 235
Field peas 12 FP12HM 3 2.0 -6 9 35 326 126
Field peas 17 FP17HM 5 0.5 -1 9 30 199 72
Field peas 17 FP17HM 4 1.0 -1 13 67 910 286 Field peas 17 FP17HM 1 2.0 -1 13 97 1197 399
Field peas 17 FP17HM 2 2.0 -3 12 65 1207 386
Field peas 17 FP17HM 3 2.0 -6 10 37 1051 297 Field peas 2 FP2HM 5 0.5 -1 9 34 194 76
Field peas 2 FP2HM 4 1.0 -1 13 47 604 185
Field peas 2 FP2HM 1 2.0 -1 12 59 1052 323
Field peas 2 FP2HM 2 2.0 -3 11 45 895 246
Field peas 2 FP2HM 3 2.0 -6 8 34 752 193
Field peas 4 FP4HM 5 0.5 -1 11 34 163 69
Field peas 4 FP4HM 4 1.0 -1 11 40 861 228
Field peas 4 FP4HM 1 2.0 -1 14 99 1204 403
Field peas 4 FP4HM 2 2.0 -3 12 50 1103 334
Field peas 4 FP4HM 3 2.0 -6 14 74 920 304
Field peas 7 FP7HM 5 0.5 -1 10 33 120 65
Field peas 7 FP7HM 4 1.0 -1 13 47 598 181
Field peas 7 FP7HM 1 2.0 -1 16 73 959 294
Field peas 7 FP7HM 2 2.0 -3 14 58 913 250
Field peas 7 FP7HM 3 2.0 -6 13 45 835 238
Standard error mean, SEM 0.4 8.4 21.2 7.9 a The retention sieve and number of passes.
b 10th (d(v, 0.1), 50th (d(v, 0.5), 90th percentiles (d(v, 0.9), and volume weighted mean (d(4, 3)).

JING HOOI TAN s4198650
66
Appendix C: Parameter of the first order kinetic model for starch digestion
Sample Do D∞ KST x 10-3
Cryo-Milling (g/100 g dry starch) (g/100 g dry starch) (min-1
)
Barley 3764 CG 1 4.091 100.00 0.01166
Barley 3764 CG 2 2.658 100.00 0.00770
Barley 3764 CG 3 3.459 100.00 0.00521
Barley 3764 CG 4 3.219 88.66 0.00933
Barley 3764 CG 5 4.096 94.94 0.01069
Barley 3873 CG 1 4.281 98.49 0.00934
Barley 3873 CG 2 4.271 100.00 0.00748
Barley 3873 CG 3 4.287 79.30 0.00542
Barley 3873 CG 4 4.171 99.85 0.00765
Barley 3873 CG 5 10.453 100.00 0.00786
Barley 3933 CG 1 7.356 100.00 0.01197
Barley 3933 CG 2 1.865 100.00 0.01099
Barley 3933 CG 3 2.668 100.00 0.01071
Barley 3933 CG 4 3.278 100.00 0.01167
Barley 3933 CG 5 4.546 100.00 0.01193
Hard Wheat CG 1 4.570 58.59 0.01219
Hard Wheat CG 2 4.945 45.31 0.01071
Hard Wheat CG 3 1.692 14.06 0.00957
Hard Wheat CG 4 5.596 49.22 0.01114
Hard Wheat CG 5 6.442 53.19 0.01121
Soft Wheat CG 1 3.904 61.33 0.01258
Soft Wheat CG 2 4.190 53.99 0.00919
Soft Wheat CG 3 3.480 45.87 0.00729
Soft Wheat CG 4 4.763 55.15 0.01061
Soft Wheat CG 5 4.589 55.64 0.01093
Sprouted Wheat CG 1 4.693 78.59 0.01105
Sprouted Wheat CG 2 4.783 74.80 0.00767
Sprouted Wheat CG 3 4.172 65.36 0.00600
Sprouted Wheat CG 4 4.736 80.76 0.00812
Sprouted Wheat CG 5 5.002 79.72 0.00919

JING HOOI TAN s4198650
67
Appendix D: Parameter of the first order kinetic model for starch digestion
Sample Do D∞ KST x 10-3
Hammer-Milling (g/100 g dry starch) (g/100 g dry starch) (min-1
)
Barley 3764 HM 1 5.094 76.49 0.00484
Barley 3764 HM 2 3.871 73.65 0.00866
Barley 3764 HM 3 5.297 94.94 0.00932
Barley 3764 HM 4 3.999 92.87 0.01100
Barley 3764 HM 5 4.377 96.60 0.01328
Barley 3873 HM 1 3.821 87.88 0.00335
Barley 3873 HM 2 5.923 91.45 0.00478
Barley 3873 HM 3 3.297 82.68 0.00735
Barley 3873 HM 4 6.081 96.77 0.00838
Barley 3873 HM 5 3.694 100.00 0.01118
Barley 3933 HM 1 2.813 100.00 0.00802
Barley 3933 HM 2 2.178 100.00 0.00886
Barley 3933 HM 3 1.917 100.00 0.01015
Barley 3933 HM 4 3.398 100.00 0.01075
Barley 3933 HM 5 3.337 100.00 0.01363
Hard Wheat HM 1 5.154 54.53 0.00969
Hard Wheat HM 2 5.237 39.77 0.01018
Hard Wheat HM 3 6.159 44.49 0.01113
Hard Wheat HM 4 5.984 44.92 0.01373
Hard Wheat HM 5 6.069 56.15 0.01445
Soft Wheat HM 1 3.165 40.09 0.00853
Soft Wheat HM 2 3.414 45.90 0.00977
Soft Wheat HM 3 4.080 48.18 0.01060
Soft Wheat HM 4 4.720 56.39 0.01225
Soft Wheat HM 5 4.236 66.70 0.01371
Sprouted Wheat HM 1 4.643 48.81 0.00717
Sprouted Wheat HM 2 4.140 65.24 0.00761
Sprouted Wheat HM 3 5.036 69.69 0.00796
Sprouted Wheat HM 4 5.071 74.80 0.00861
Sprouted Wheat HM 5 5.977 83.83 0.00932

JING HOOI TAN s4198650
68
Appendix E: The parameters of the modified first order kinetic model for
protein digestion in cryo-milled field peas
Sample Sample code
Average
particle size IVPD
(g/100 g dry protein)
KPR x 10-3
(min-1
)
d [4,3], µm
Barley 3763 B37CG 3 481.8 77.9 156.4
Barley 3763 B37CG 2 454.7 79.9 181.2
Barley 3763 B37CG 4 403.0 80.7 187.6
Barley 3763 B37CG 5 392.4 80.7 224.1
Barley 3763 B37CG 1 107.8 81.3 307.5
Barley 3873 B38CG 3 380.7 76.9 182.3
Barley 3873 B38CG 2 133.0 77.3 190.0
Barley 3873 B38CG 4 117.7 78.2 260.2
Barley 3873 B38CG 5 82.9 79.3 264.2
Barley 3873 B38CG 1 70.9 79.9 371.8
Barley 3933 B39CG 3 166.7 79.4 184.2
Barley 3933 B39CG 2 93.7 80.2 271.5
Barley 3933 B39CG 4 76.1 80.6 300.5
Barley 3933 B39CG 5 60.3 81.6 303.4
Barley 3933 B39CG 1 43.7 83.2 314.6
Coromup Lupins CLCG 3 356.6 84.7 351.7
Coromup Lupins CLCG 2 181.6 85.3 445.7
Coromup Lupins CLCG 4 128.4 85.4 465.3
Coromup Lupins CLCG 5 108.1 85.5 511.5
Coromup Lupins CLCG 1 98.1 85.7 517.0
Gunyidi Lupins GLCG 3 431.5 75.5 143.7
Gunyidi Lupins GLCG 2 396.9 75.9 190.6
Gunyidi Lupins GLCG 4 144.2 79.6 217.8
Gunyidi Lupins GLCG 5 103.7 80.0 218.4
Gunyidi Lupins GLCG 1 98.3 82.9 298.9
Hard Wheat HWCG 3 321.1 78.2 194.0
Hard Wheat HWCG 2 119.0 79.3 218.8
Hard Wheat HWCG 4 99.6 79.4 256.6
Hard Wheat HWCG 5 93.7 83.0 300.5
Hard Wheat HWCG 1 75.5 85.2 308.3
Mandelup Lupins MLCG 3 421.7 80.8 173.1
Mandelup Lupins MLCG 2 216.1 81.6 191.0
Mandelup Lupins MLCG 4 106.5 81.8 206.9
Mandelup Lupins MLCG 5 99.2 82.0 213.7
Mandelup Lupins MLCG 1 70.3 83.6 349.2
Field peas 1 CP1CG 3 263.3 80.7 228.7
Field peas 1 CP1CG 2 101.0 82.2 290.3
Field peas 1 CP1CG 4 72.5 82.4 254.0
Field peas 1 CP1CG 5 65.3 84.3 295.0
Field peas 1 CP1CG 1 51.1 84.5 391.1
Field peas 12 CP12CG 3 204.4 78.6 176.5

JING HOOI TAN s4198650
69
Field peas 12 CP12CG 2 104.3 80.4 198.7
Field peas 12 CP12CG 4 84.7 80.7 199.8
Field peas 12 CP12CG 5 70.0 81.0 231.7
Field peas 12 CP12CG 1 61.5 83.5 243.6
Field peas 17 CP17CG 3 293.3 78.4 114.2
Field peas 17 CP17CG 2 143.8 79.0 172.2
Field peas 17 CP17CG 4 78.8 79.4 172.7
Field peas 17 CP17CG 5 75.9 79.7 253.9
Field peas 17 CP17CG 1 68.0 80.4 300.5
Field peas 2 CP2CG 3 279.1 80.2 186.1
Field peas 2 CP2CG 2 246.1 82.0 214.3
Field peas 2 CP2CG 4 99.6 82.3 232.4
Field peas 2 CP2CG 5 64.7 82.6 277.5
Field peas 2 CP2CG 1 55.4 82.8 307.6
Field peas 4 CP4CG 3 271.0 77.5 155.6
Field peas 4 CP4CG 2 128.2 77.9 179.1
Field peas 4 CP4CG 4 86.3 78.5 193.0
Field peas 4 CP4CG 5 69.1 78.9 196.4
Field peas 4 CP4CG 1 58.8 79.2 210.2
Field peas 7 CP7CG 3 161.9 76.2 273.4
Field peas 7 CP7CG 2 96.4 77.7 282.8
Field peas 7 CP7CG 4 74.7 79.9 302.1
Field peas 7 CP7CG 5 72.3 80.1 330.8
Field peas 7 CP7CG 1 63.5 80.3 348.1
Soft Wheat SWCG 3 294.6 78.1 264.9
Soft Wheat SWCG 2 149.0 85.5 304.9
Soft Wheat SWCG 4 107.3 86.7 320.7
Soft Wheat SWCG 5 73.2 87.8 335.6
Soft Wheat SWCG 1 70.1 87.9 378.5
Sprouted Wheat SPWCG 3 233.9 77.9 205.4
Sprouted Wheat SPWCG 2 128.2 79.4 215.5
Sprouted Wheat SPWCG 4 76.7 83.6 287.8
Sprouted Wheat SPWCG 5 75.5 83.9 299.3
Sprouted Wheat SPWCG 1 59.0 85.2 300.5

JING HOOI TAN s4198650
70
Appendix F: The parameters of the modified first order kinetic model for
protein digestion in hammer-milled field peas
Sample Sample code
Average
particle size IVPD KPR x 10-3
(min-1
)
d [4,3], µm (g/100 g dry protein)
Barley 3763 B37HM 5 481.8 82.9 309.3
Barley 3763 B37HM 4 454.7 81.6 274.5
Barley 3763 B37HM 1 403.0 80.2 194.2
Barley 3763 B37HM 2 392.4 81.0 220.8
Barley 3763 B37HM 3 107.8 81.3 228.4
Barley 3873 B38HM 5 380.7 84.2 435.0
Barley 3873 B38HM 4 133.0 83.3 230.2
Barley 3873 B38HM 1 117.7 80.1 184.0
Barley 3873 B38HM 2 82.9 81.3 184.3
Barley 3873 B38HM 3 70.9 82.4 191.3
Barley 3933 B39HM 5 166.7 85.9 472.4
Barley 3933 B39HM 4 93.7 85.6 427.4
Barley 3933 B39HM 1 76.1 84.7 309.5
Barley 3933 B39HM 2 60.3 85.1 389.8
Barley 3933 B39HM 3 43.7 85.6 415.4
Coromup Lupins CLHM 5 356.6 87.7 523.5
Coromup Lupins CLHM 4 181.6 86.6 403.2
Coromup Lupins CLHM 1 128.4 83.2 250.3
Coromup Lupins CLHM 2 108.1 83.9 262.7
Coromup Lupins CLHM 3 98.1 86.5 375.8
Gunyidi Lupins GLHM 5 431.5 83.4 352.8
Gunyidi Lupins GLHM 4 396.9 82.6 279.4
Gunyidi Lupins GLHM 1 144.2 76.1 182.8
Gunyidi Lupins GLHM 2 103.7 81.4 210.7
Gunyidi Lupins GLHM 3 98.3 81.4 230.2
Hard Wheat HWHM 5 321.1 86.3 383.8
Hard Wheat HWHM 4 119.0 85.3 310.8
Hard Wheat HWHM 1 99.6 77.9 255.4
Hard Wheat HWHM 2 93.7 78.0 261.1
Hard Wheat HWHM 3 75.5 84.9 300.5
Mandelup Lupins MLHM 5 421.7 85.6 376.8
Mandelup Lupins MLHM 4 216.1 84.6 369.4
Mandelup Lupins MLHM 1 106.5 80.7 184.0
Mandelup Lupins MLHM 2 99.2 82.2 229.1
Mandelup Lupins MLHM 3 70.3 83.8 324.4
Field peas 1 CP1HM 5 263.3 85.1 333.9
Field peas 1 CP1HM 4 101.0 84.8 327.7
Field peas 1 CP1HM 1 72.5 81.0 275.4
Field peas 1 CP1HM 2 65.3 82.9 279.0
Field peas 1 CP1HM 3 51.1 84.1 285.0

JING HOOI TAN s4198650
71
Field peas 12 CP12HM 5 204.4 84.2 233.4
Field peas 12 CP12HM 4 104.3 81.2 234.3
Field peas 12 CP12HM 1 84.7 79.5 185.1
Field peas 12 CP12HM 2 70.0 80.3 236.9
Field peas 12 CP12HM 3 61.5 80.3 189.5
Field peas 17 CP17HM 5 293.3 83.7 184.1
Field peas 17 CP17HM 4 143.8 83.2 183.9
Field peas 17 CP17HM 1 78.8 79.8 210.1
Field peas 17 CP17HM 2 75.9 80.5 230.6
Field peas 17 CP17HM 3 68.0 81.1 174.6
Field peas 2 CP2HM 5 279.1 86.1 516.0
Field peas 2 CP2HM 4 246.1 84.2 362.2
Field peas 2 CP2HM 1 99.6 79.4 297.9
Field peas 2 CP2HM 2 64.7 81.8 300.4
Field peas 2 CP2HM 3 55.4 83.7 339.4
Field peas 4 CP4HM 5 271.0 80.8 217.9
Field peas 4 CP4HM 4 128.2 80.7 415.2
Field peas 4 CP4HM 1 86.3 79.2 268.4
Field peas 4 CP4HM 2 69.1 79.4 228.7
Field peas 4 CP4HM 3 58.8 80.6 299.3
Field peas 7 CP7HM 5 161.9 81.5 260.8
Field peas 7 CP7HM 4 96.4 81.0 256.6
Field peas 7 CP7HM 1 74.7 79.3 164.7
Field peas 7 CP7HM 2 72.3 80.4 185.5
Field peas 7 CP7HM 3 63.5 80.5 282.9
Soft Wheat SWHM 5 294.6 83.7 327.6
Soft Wheat SWHM 4 149.0 86.6 316.8
Soft Wheat SWHM 1 107.3 79.4 233.9
Soft Wheat SWHM 2 73.2 86.2 238.9
Soft Wheat SWHM 3 70.1 86.1 300.4
Sprouted Wheat SPWHM 5 233.9 85.4 300.0
Sprouted Wheat SPWHM 4 128.2 84.4 298.5
Sprouted Wheat SPWHM 1 76.7 77.7 147.5
Sprouted Wheat SPWHM 2 75.5 81.0 212.2
Sprouted Wheat SPWHM 3 59.0 82.8 220.3