king abdulaziz university faculty of science department of...
TRANSCRIPT

King Abdulaziz University
Faculty of Science
Department of Biochemistry
Girls Section
General Metabolism 1 Lab
BIOC 211

Table of Contents
Lab # Experiment name
1 Calorimetric Determination of Glucose by the
3,5-dinitrosallicylic acid Method
2 Assay of Glucose using the Nelson-Somogyi
Method I
3 Estimation of carbohydrate by Nelsons’s
Method II
4 Estimation of carbohydrate by Anthrone
Method.
5 Quantitative Estimation of Pentoses
6 The assay of tissue glycogen
7 Chromatographic Separation of sugars.
8 Estimation of total lipids by colorimetric
method
9 Determination of Iodine number.
10 Determination of Saponification Number
11 Estimation of Cholesterol Liberman – Burchard
Reaction

LAB EXPERIMENT 1___ _______
CCaalloorriimmeettrriicc DDeetteerrmmiinnaattiioonn ooff GGlluuccoossee bbyy tthhee
33,,55--ddiinniittrroossaalliiccyylliicc aacciidd MMeetthhoodd..
Principle:
Several reagents have been employed which assay sugars by using their
reducing properties. This method tests for the presence of free carbonyl
group (C=O), the so-called reducing sugars. This involves the oxidation
of the aldehyde functional group present in, for example, glucose and the
ketone functional group in fructose. Simultaneously, 3,5-dinitrosalicylic
acid (DNS) is reduced to 3-amino-5-nitrosalicylic acid under alkaline
conditions, as illustrated in the equation below:
The chemistry of the reaction is complicated since standard curves do not
always go through the origin and different sugars give different color
yields. The method is therefore not suitable for the determination of a
complex mixture of reducing sugar.
rriiaallss::MMaattee
1. Standard Glucose Solution:
0.1g anhydrous glucose is dissolved in distilled water and then raised the
volume to 100 ml with distilled water.

2. Dinitro salicylic acid reagent:
a. Solution "a" is prepared by dissolving 300g of sodium potassium
tartarate in about 500 ml distilled water.
b. Solution "b" is prepared by dissolving 10 g of 3,5-dinitrosalicylic acid
in 200 ml of 2N NaOH solution.
c. The dinitrosalycilate reagent is prepared by mixing solutions a & b and
raising the final volume to 1 litre with distilled water.
PPrroocceedduurree:: 1. Pipette in duplicate the following reagents into a series of dry-clean
and labelled test tubes and as indicated in the following table, take
Section A.
SECTION A SECTION B bbbbbB
BB
Tube No.
ml. Stand. Glucose.
ml. H2O
ml. Dinitrosalicylic
reagent
ml. H2O
1 0.0 1.0 2.0 7.0
2 0.2 0.8 2.0 7.0
3 0.4 0.6 2.0 7.0
4 0.6 0.4 2.0 7.0
5 0.8 0.2 2.0 7.0
6 1.0 0.0 2.0 7.0
2. After replacing the above mentioned solutions as in section A in the
labelled tubes, shake well and then place them in a boiling water bath for
5 minutes.
3. Cool the tubes thoroughly and then add 7.0 ml of distilled water to
each tube as indicated in section B of the previous table, Read the
extinction (Optical density) of the colored solutions at 540 nm using the
solution in tube 1 as a blank (control).
Note: All the tubes must be cooled to room temperature before reading
since the extinction is sensitive to temperature change.
4. Record the readings in section B, and plot the relationship between the
optical density and the concentration of glucose solution. See whether
there is a linear relationship between the concentrations of glucose
solutions and their corresponding optical densities.
5. Use the already prepared standard curve for the determination of the
unknown concentration of the glucose solution provided and tissue
extract form exp.6 or any other unknown reducing sugar sample.
Name: No.
Experiment 1:
Results Sheet
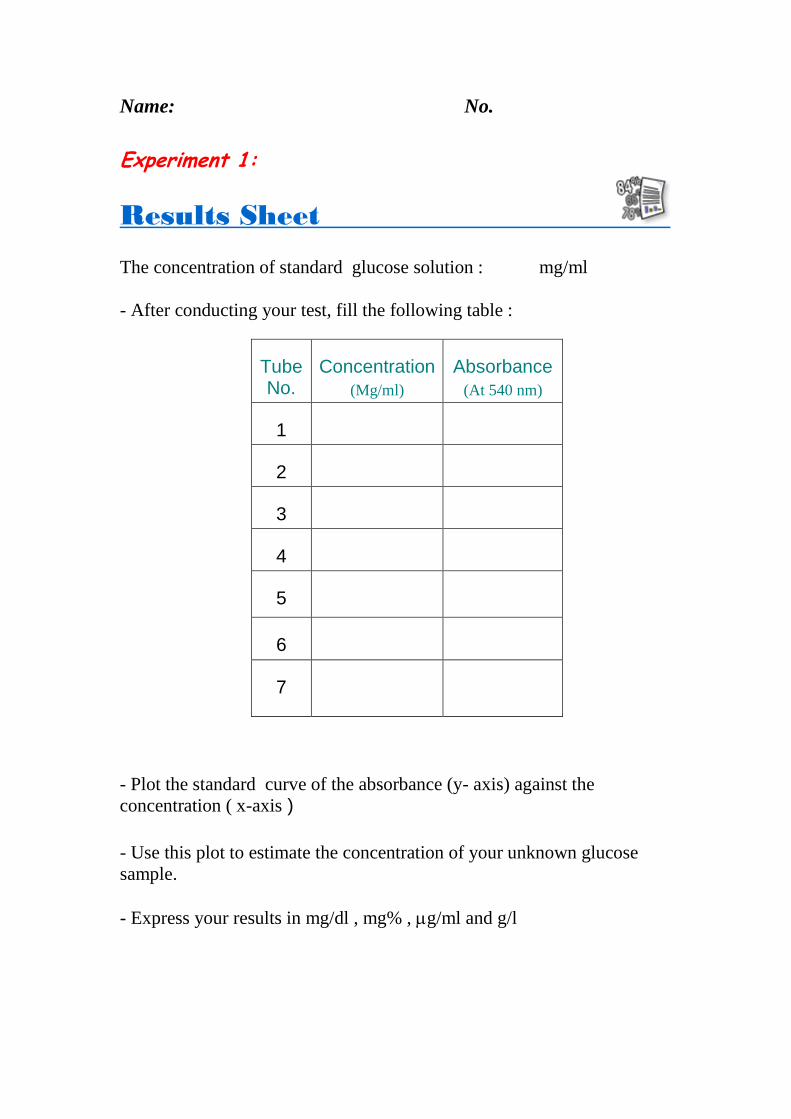
The concentration of standard glucose solution : mg/ml
- After conducting your test, fill the following table :
Tube No.
Concentration
(Mg/ml)
Absorbance
(At 540 nm)
1
2
3
4
5
6
7
- Plot the standard curve of the absorbance (y- axis) against the
concentration ( x-axis )
- Use this plot to estimate the concentration of your unknown glucose
sample.
- Express your results in mg/dl , mg% , g/ml and g/l

Name: No.
Experiment 1:
Results Sheet

LAB EXPERIMENT 2___ _______
SSoommooggyyii --AAssssaayy ooff GGlluuccoossee uussiinngg tthhee NNeellssoonn
method Imethod I
::PPrriinncciippllee
The sugar is heated with an alkaline solution of copper tartarate and cuprous oxide is produced, which reacts with arsenomolybdate to give molybdenum blue, the intense blue color is then measured in the colorimeter. Sodium sulphate is included in the reaction mixture to minimize the entry of atmospheric oxygen into the solution, which would cause reoxidation of cuprous oxide.
::MMaatteerriiaallss
1. Nelson’s A reagent: 12.5 g Na2CO3 (anhydrous), 12.5 g potassium-sodium tartarate, 10 g NaHCO3 and 100 g Na2CO3 (anhydrous) dissolved in 350 ml of H2O and diluted to 500 ml with distilled water. 2. Nelson’s B reagent: 7.5 g CuSO4. 5H2O dissolved in 50 ml of water and 1 drop of conc. H2SO4 is added. 3. Arsenomolebdate reagent: 25 g (NH4)6 MO7O24. 4H2O dissolved in 450 ml H2O. 21ml conc. H2SO4 and 3Na2HASO4.7H2O. dissolved in 25 ml H2O is added, then stored in brown bottle for 24 hours, at 37oC unstable in light and air. 4. Stock sugar standards (glucose, fructose, and maltose 2g/l solutions in saturated benzoic acid). 5. Some “unknown ” sugar solutions. 6. Boiling water bath.

::PPrroocceedduurree
1- Add 19 ml of distilled water to 1ml of standard Solution and mix well.
2- Prepare Nelson’s alkaline copper reagent by mixing 12.5 ml of
Nelson’s A reagent with 0.5 ml of Nelson’s B reagent.
3- Set up six test tubes as follows:
Tube No.
Dilute standard glucose (ml) .
Distilled H2O (ml)
1(blank) -- 1 2 0.2 0.8 3 0.5 0.5 4 0.8 0.2 5 1.0 --
3- Add 1 ml of Nelson’s reagent solution to each tube and shake well.
4- Place the tubes in a boiling water bath , and heat for 20 minutes.
Remove the tube and cool with cold water.
5- After cooling, add 1ml of arsenomolybdate reagent to each and shake occasionally over a five-minute period to dissolve the Cu2O and reduce the arsenomolybdate.
6- Add 7.0 ml of distilled water to each tube, and mix.
7- Read the absorbance of standard against the blank at 540 nm.
8- Plot the standard curve with the absorbance (Y axis) against
concentration (mg of glucose) (X axis). Draw the best straight line through the origin and points.
10- The concentration of unknown glucose solution can be determined from the curve.

Name: No. Experiment 2:
Results Sheet
The concentration of standard glucose solution : mg/ml
- After conducting your test, fill the following table :
Tube No.
Concentration(Mg/ml)
Absorbance(At 540 nm)
1
2
3
4
5
6
- Plot the standard curve of the absorbance (y- axis) against the concentration ( x-axis )
- Use this plot to estimate the concentration of your unknown glucose sample.
- Express your results in mg/dl , mg% , μg/ml and g/l.

Name: No. Experiment 2:
Results Sheet
LAB EXPERIMENT 3 ___ _______
EEssttiimmaattiioonn ooff ccaarrbboohhyyddrraattee bbyy NNeellssoonnss’’ss
Method IIMethod II
::PPrriinncciippllee Cupric ions are reduced by sugars to cuprous ions, which quantitatively reduce phosphomolybdic acid to a blue complex.
::MMaatteerriiaallss
1. Alkaline copper reagent. 2. Phosphomolybdic acid reagent. 3. Standard glucose solution containing 100μg/ml. 4. Glucose solution of unknown strength( 30-70 μg/ml). 5. Colorimeter or spectrophotometer.
::PPrroocceedduurree 1. Pipette in duplicate 0.25, 0.5, 0.75, 1.0, 1.5 and 2ml of standard glucose solution into a series of test tubes.
2. Make the volumes up to 2ml with water.also prepare a blank containing 2ml of water
3. Prepare two tubes containing 2ml of unknown glucose solution.
4. Add 2ml of alkaline copper reagent to each tube, mix and plug each tube with a small piece of cotton wool, this prevents reoxidation of Cu+ ions.
5. Heat the tubes in a boiling water bath for exactly 8 minutes.
6. allow the tubes to cool in cold water.

7. Add 2ml of phosphmolybdic reagent to each tube and shake well. 8. After about 2 min dilute each tube to 10ml with water.
9. Read absorbance against the reagent blank at 630nm .
10. Plot standard cure for glucose. read the concentration of the unknown from the standard curve.
Name: No. Experiment 3:
Results Sheet
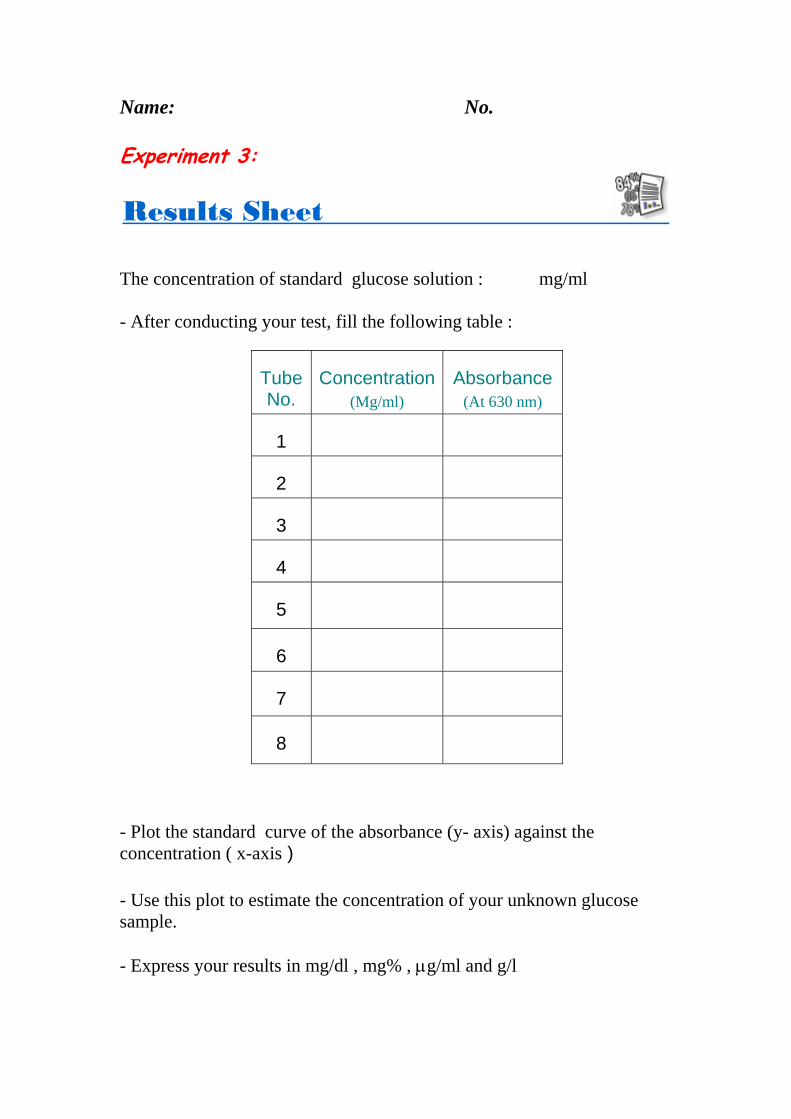
The concentration of standard glucose solution : mg/ml
- After conducting your test, fill the following table :
Tube No.
Concentration(Mg/ml)
Absorbance(At 630 nm)
1
2
3
4
5
6
7
8
- Plot the standard curve of the absorbance (y- axis) against the concentration ( x-axis )
- Use this plot to estimate the concentration of your unknown glucose sample.
- Express your results in mg/dl , mg% , μg/ml and g/l

Name: No. Experiment 3:
Results Sheet

LAB EXPERIMENT 4 ___ _______
EEssttiimmaattiioonn ooff ccaarrbboohhyyddrraattee bbyy AAnntthhrroonnee .MethodMetho .d
The anthrone reaction is the basis of a rapid and convenient method for the determination of carbohydrates, either free or present in polysaccharides.
::PPrriinncciippllee
Carbohydrates are dehydrated by concentrated H2SO4 to form furfural.Furfural condenses with anthrone to form a blue-green colored complex solution shows an absorption maximum at 620nm, which is measured colorimetrically. note that some carbohydrates may give other colors.
The extinction depends on the compound investigated, but is constant for a particular molecule.
::MMaatteerriiaallss
11.. Anthrone reagent (0.2% in conc. H2SO4). 2. Glucose (10mg/100ml).
::PPrroocceedduurree
1. Pipette out into a series of test tubes different volumes of glucose solution and make up the volume to 1ml with water. 2. Add 4ml of anthrone reagent to each tube. 3. mix well. 4. Cover the tubes with marbles on top to prevent loss of water by evaporation. 5. Keep the tubes in a boiling water bath for 10 minutes. 6. cool to room temperature. 7. Measure the optical density at 620 nm using a blank tube containing 1ml water and 4ml reagent. 8. Draw the standard cure and determine the concentration of unknown glucose solution

Name: No. Experiment 4:
Results Sheet

LAB EXPERIMENT 5__ _ _______
QQuuaannttiittaattiivvee EEssttiimmaattiioonn ooff PPeennttoosseess
:PPrriinncciippllee
When pentoses are heated with conc. HCl , furfural is formed which condenses with orcinol in the presence of ferric ions to give a blue-green color.
orcinol (3,5-dihidroxytoluene)
CH3
OHHO
::MMaatteerriiaallss 1- Orcinol reagent. (Dissolve 1.5 g of orcinol in 500 ml of conc. HCl and add 20 drops of a 100g/l solution of FeCl3.)
or 1.5 g Orcinol + (0.5 g FeCl3 + 500 ml conc. HCl)
:PPrroocceedduurree
Carry the experiment in two test tubes one for the standard and the other for the unknown.In each tube place the following: 1- 7.5 ml Orcinol reagent. 2- 2.5 ml sample. Shake well. 3- Heat for 25 minutes in a boiling water bath with a marple on top of
each tube (use a glass stopper). 4- Cool to room temperature in cold water. 5- Read at 665 nm.

::CCaallccuullaattiioonn
Standard : Ribose 2mg/ml (0.2%) in water.
Concentration of unknown = Absorbance of unk x Conc of std Absorbance of std
Name: No. Experiment 5:
Results Sheet
Concentration of standard pentose solution : mg/ml
CCaallccuullaattiioonnss::
AAsstt..== AAuunn..==

LAB EXPERIMENT 6___ _______
TThhee aassssaayy ooff ttiissssuuee ggllyyccooggeenn
Principle:Principle: Glycogen is released from the tissue by heating with strong alkali and precipitated on the addition of ethanol. Sodium sulphate is added as a co precipitant to give a quantitative yield of glycogen. The polysaccharide is then hydrolyzed in acid and the glucose released is estimated.
::MMaatteerriiaallss 1. Heart, liver, and muscle from a freshly killed rat. 2.potassium hydroxide (300 g/l) 3. Calibrated centrifuge tubes (10 ml). 30 4. Boiling water bath. 24 5. Saturated Na2 S04. 20 ml 6. Ethanol (95% v/v). 250 ml 7. Volumetric flasks (100 ml). 24 8. Test tubes calibrated at 10 ml. 100 ml 9. HCl (1.2 mol/l.). 100 ml 10. Marbles. 11. Phenol red indicator solution. 12 ml 12. NaOH (0.5 mol/l). 250 ml 13. Reagents for the estimation of glucose (Experiment 1).
Procedure:Procedure: Isolation of glycogen:- Accurately weigh the complete heart and muscle and about 1.5 g of liver. Place the tissues into a calibrated centrifuge tube containing 2 ml of KOH (300 g/l) and heat in a boiling water bath for 20 min with occasional shaking. Cool the tubes in ice, add 0.2 ml of saturated Na2 SO4, and mix thoroughly. Precipitate the glycogen by adding 5
ml of ethanol (95% v/v), stand on ice for 5 min, and remove the precipitate by centrifugation. Discard the supernatant and dissolve the precipitated glycogen in about 5 ml of water with gentle warming, then dilute with distilled water to the 10 ml calibration mark and mix thoroughly. In the case of the fed animals, transfer the liver sample quantitatively to a 100 ml volumetric flask and make up to the mark with water.
Hydrolysis and estimation of glycogen:- Pipette duplicate 1 ml samples of the glycogen solutions into test tubes calibrated at 10 ml, add 1 ml of HCl (1.2 mol/l), place a marble on top of each tube, and heat in a boiling water bath for 2 h. At the end of this period, add 1 drop of phenol red indicator and neutralize carefully with NaOH (0.5 mol/l) until the indicator changes from yellow through orange to a pink color. Dilute to 5 ml with distilled water and determine the glucose content by the 3.5 dinitrosalisylic acid method (Experiment 1 ).Then use the standard curve you obtained to estimate the concentration of glucose per100 g sample.

Name: No. Experiment 6:
Results Sheet
Calculate the amount of glycogen in the liver sample, using the standard curve you plotted in experiment 1.

LAB EXPERIMENT 7__ _ _______
.Chromatographic Separation of sugars
:Principle
The term chromatography comes from the earlier times when the technique was used for the separation of colored plants pigments. Chromatography is a technique for separation of closely related groups of compounds. The separation is brought about by differential migration along a porous medium and the migration is caused by the flow of solvent.
Within limits chromatography can be divided into two types : partition and adsorption chromatography .Paper chromatography is an example of liquid-liquid chromatography .
In this type of chromatography separation is due to differential partition of solutes between two liquid phases .One liquid phase is bound to the porous medium for example, the water bound in the cellulose paper, this phase is referred to as, the stationary phase. The other liquid phase, the mobile phase flows along the porous medium .As the mobile phase flows over the solute mixture, the individual solutes partition themselves between the aqueous stationary phase and the organic mobile phase relative to their solubilities in the two phases. The more soluble a solute

in the mobile phase, the faster it will travel along the paper, and conversely, the mobile phase must be a mixture in which the compounds to be separated are soluble or partially soluble .In paper chromatography solute or solute mixture is spotted in solution along a base line on a sheet of filter paper(whatman No. 1).The mobile phase(solvent) is allowed to flow over the spots either ascending the paper by capillary action or descending the paper by gravity.
The separation is measured in terms of a unit called Rf (relative rates of flow) with respect to the solvent front. The figure below explains how to calculate this value.
The Rf value of a compound in a particular solvent system is constant under identical conditions of the experiment, e.g. temperature, pH, etc.
Because most compound are colorless the spots are visualized after separation by specific reagent. The location reagent is applied by spraying the paper or rapidly dipping it in a solution of the reagent in a volatile solvent. Viewing under ultraviolet light is also useful since some compound which absorb it strongly show up as dark spots against the florescent background of the paper.

:Materials
filter paper is used because of its known 1. ally whatman No Usu:Paper
ammonia 1%+ saturated phenol -Water] a [:Solvents
[b] n-butanol-acetic acid-water (4:1:5 v/v) [c] isopropanol-pyridine-water-acetic acid (8:8:4:1 v/v)
:Spray reagent A. Ammoniacal silver nitrate:
add equal volumes of NH4OH to a saturated solution of AgNO3 and dilute the methanol to give a final concentration of 0.3M.After spraying the developed chromatograms,place them in an oven for 5-10 minutes, when the reducing sugars appear as brown spots.
B. Alkaline permanganate:
Prepare aqueous solution of KMNO4 (1%) containing 2 % NaCO3.After spraying with this mixture, the chromatograms are kept at 100C for a few minutes, when the sugar spots appear as yellow spots in purple background.
C. Aniline diphenylamine reagent:
Mix 5 volumes of 1% aniline and 5 volumes of 1% diphenylamine in acetone with 1 volume of 85% phosphoric acid .after spraying the dried chromatograms with this solution the spots are visualized by heating the paper at 100C for a few minutes.
D.Resorcinol reagent:
Mix 1% ethanolic solution of resorcinol and 0.2N HCl (1:1 v/v).Spray the dried chromatograms and visualize spots by heating at 90C.
Procedure:
1.Place sufficient solvent into the bottom of the tank. Cover the led and allow the tank to be saturated with the solvent.
2.Take a sheet of whattman 1 chromatography paper (about 9 x 10 cm) and place it on a piece of clean paper on a bench.
3. Draw a fine line with a pencil along the width of the paper and about 1.5cm from the lower edge.
4.Along this line place four equality spaced (about 2cm apart) small circles with a pencil.
5.Label the paper at the top with the name of each of the sugars and label the last unknown.
6.Use a fine capillary or tooth pick to place the drops of the solutions of the sugars, glucose, fructose, maltose, lactose and the mixture .
7.After spotting, dry the paper with hot air dryer for one minute, repeat this step again.
8.Place the spotted paper in the chromatographic tank and make the development by using the ascending technique.
9.Close the tank with lid, allow the solvent to flow for about 30-45 minutes.
10.Remove the paper and immediately mark the position of the solvent front with a pencil.
11. After the chromatogram has dried, spray the paper with the locating reagent.
12.you need to put the paper on the hot plate at low temperature or expose it to the hot air dryer, until the colored spots appear. the colors are stable for some weeks if kept in the dark and away from acid vapors.
13. Circle the position of each spot with pencil.

14. Calculate the Rf value for each spot and also for the spots the mixture contained.
- General summary of the behavior of the various sugars to these reagents are given below:
d c b a Sugars pink +++Aldohexoses red +++Ketohexoses
Blue,green+++Aldopentoses -+++Ketopentoses -++- Deoxy sugars ---+Glycosides -+++Amino sugars
- The table below Rf values of some sugars in the solvents previously mentioned. They are only for comparative purposes, since Rf Varies with physical parameters.
Solvent c Solvent b Solvent a Sugar 0.64 0.18 0.39 Glucose0.62 0.16 0.44 Galactose0.68 0.25 0.51 Fructose0.76 0.31 0.59 Ribose
- - 0.73 Deoxy ribose0.46 0.09 0.38 Lactose0.50 0.11 0.36 Maltose0.62 0.14 0.39 Sucrose

Name: No.
Experiment 7:
Results Sheet
1- Draw a sketch of your chromatogram. 2-Calculate Rf values for each spot of the mixture being separated. 3-By comparing the Rf values of the mixture along with those for the standards, state what sugars does this mixture contain?
LAB EXPERIMENT 8____ _______
Estimation of total lipids by colorimetric Estimation of total lipids by colorimetricmethod.method.
Principle:
Lipids react with sulfuric acid to form carbonium ions which subsequently react with the vanillin phosphate ester to yield a purple complex that is measured photometrically at 540 nm. The intensity of the colour is proportional to the Total lipids concentration.
::MMaatteerriiaallss
1. Vanillin reagent, 0.04M. Dissolve 6.1 g of vanillin in water and dilute to 1 liter. This solution is stable for about 2 months in a brown bottle at room temperature.
2. . Phosphovanillin reagent. Add 350 ml of the vanillin reagent and
50 ml of water to a flask. Add with constant stirring, 600 ml of concentrated (85%) phosphoric acid. This solution is also stable for about 2 months in a brown bottle at room temperature.
3. Sulfuric acid, concentrated, reagent grade.
4. Standard solution. A good U.S.P. grade of olive oil may be used
as a standard. In two tarred 100 ml volumetric flasks add approximately 0.5 and 1 ml of the olive oil and weigh again to obtain the exact weight of oil added. (It is time consuming to try to weigh out exactly 500 mg , or any other definite weight, of the oil; the approximate amounts are added. and the exact weight determined.) The above standards should be about 500 and 1,000 mg/dl. Dissolve the oil in absolute ethanol and dilute to the mark with the ethanol. This solution is stable for about month in the refrigerator.
5. Standard solution of cholesterol (1g/100 ml acetone)

:PPrroocceedduurree
In separate tubes add 20 μl of water (blank), 20 μl of samples, and 20 μl of standards. To each tube add 0.2 ml of concentrated sulfuric acid. Mix well, preferably on a vortex mixer. Place all tubes in boiling water bath for 10 min, remove, and cool in water to room temperature. To each tube add 10 ml of the phosphovanillin reagent and mix well. Incubate at 370C in a water bath for 15 min. Cool and read standards and samples against blank at 540 nm.
::CCaallccuullaattiioonnss
Concentration of unknown = Absorbance of unk x Conc of std Absorbance of std

Name: No. Experiment 8:
Results Sheet
Concentration of standard cholesterol solution : mg/ml
Concentration of standard olive oil solution : mg/ml
1) Ast. Cholesterol = Aun cholesterol =
2)
Ast. Olive Oil = Aun Olive Oil =
LAB EXPERIMENT 9____ _______
Determination of Iodine number.
::IInnttrroodduuccttiioonn
Current medical thinking suggests that a higher proportion of unsaturated fats in the diet are beneficial. Unsaturated fats tend to spoil (become rancid) more readily than saturated ones which presents a storage problem. The amount of unsaturation in fat samples is therefore often determined industrially and is termed the iodine number of the fat.
The iodine number is defined as the percentage of iodine absorbed by a fat or wax, or the number of grams of iodine absorbed per 100 g of fat or wax. It is a measure of the unsaturated bonds present in the fat under investigation, i.e.: a low iodine number indicates few unsaturated bonds.
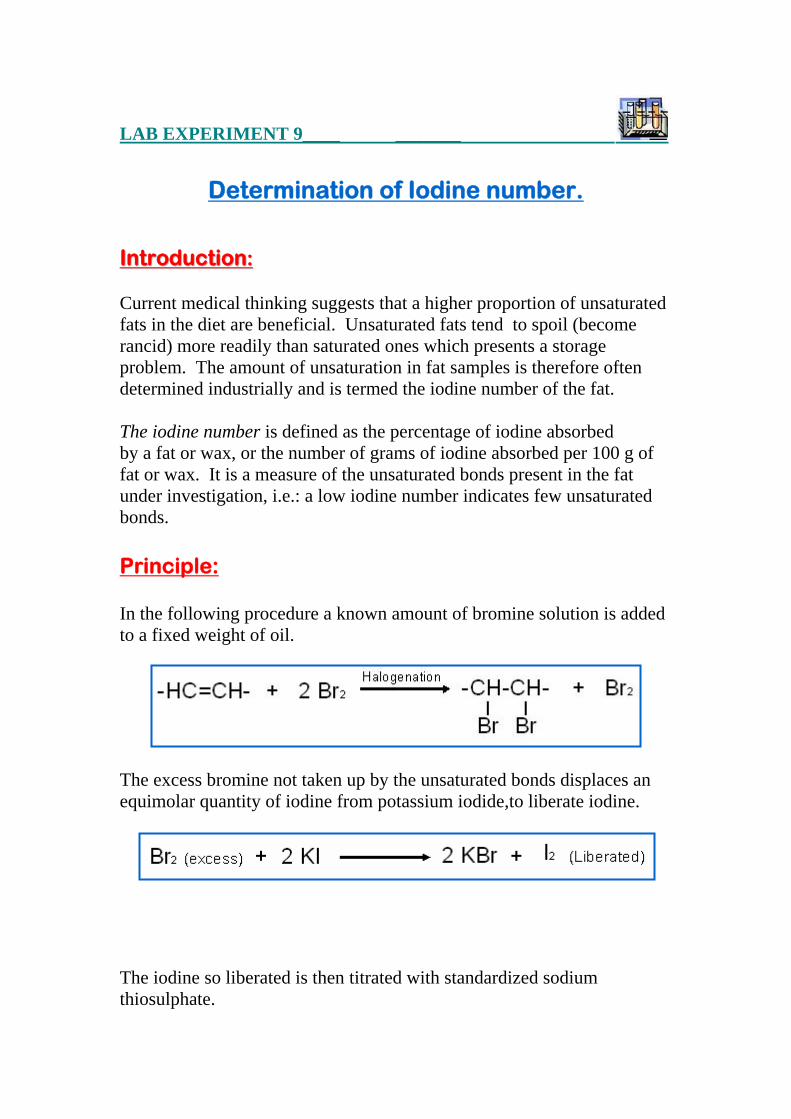
Principle: In the following procedure a known amount of bromine solution is added to a fixed weight of oil.
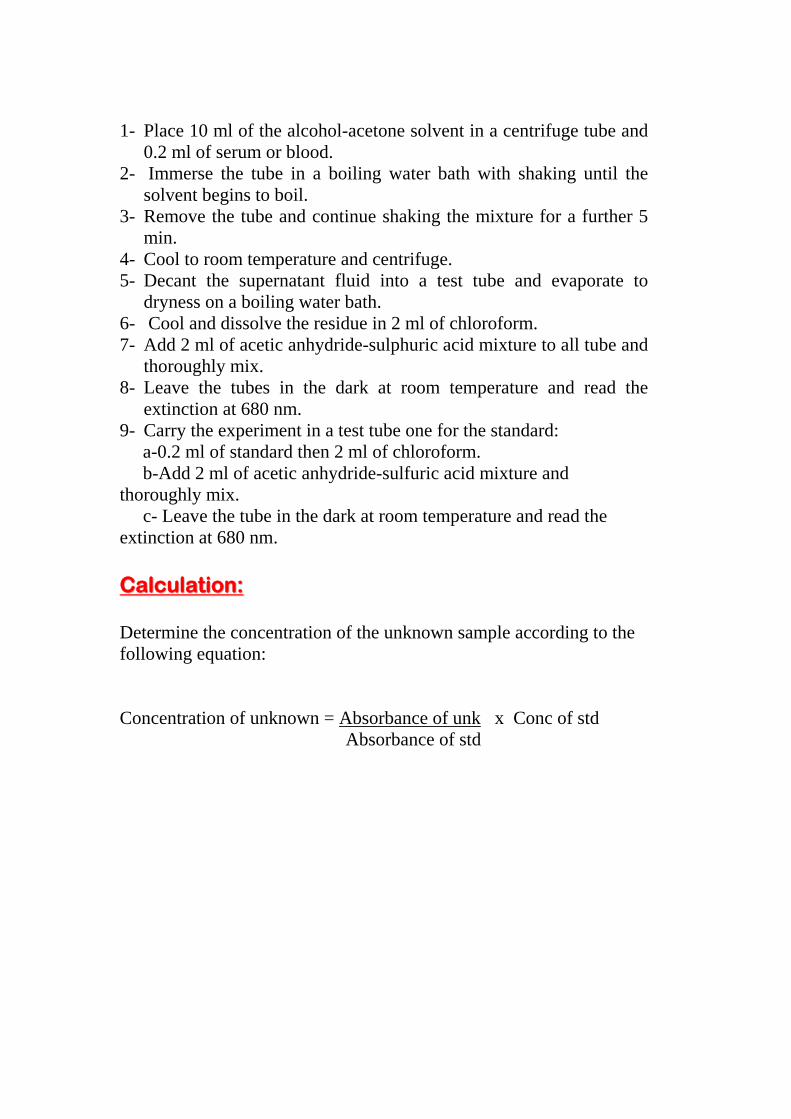
The excess bromine not taken up by the unsaturated bonds displaces an equimolar quantity of iodine from potassium iodide,to liberate iodine.
The iodine so liberated is then titrated with standardized sodium thiosulphate.

The reaction mixture is kept in the dark and the titration is carried out quickly as possible since halogens are oxidized in the light.
.B.N
- The sample titration (T) gives a measure of the amount of (iodine) remaining in solution after halogenation. - The titration of a blank (B) gives a measure of the total amount of halogenating reagent present initially. - A subtraction of the values (B) from (T) indicates the quantity of reagent utilized in the halogenation of a 5 ml sample of all from an original 27 ml volume.
::RReeaaggeennttss
1- The halogenation reagent:- Pyridine sulphate dibromide in glacial acetic acid is made as follows: 8 ml of pyridine and 5.5 ml concentrated sulphuric acid are separately added to 20 ml of glacial acetic acid. A 2.5 ml aliquot of bromine is then added to another 20 ml portion of the volume made up to 1 litre with glacial acetic acid giving an approximately 0.1 M solution of Bromine.
2- 10% aqueous solution of potassium iodide. 3- 1% aqueous solution of starch. 4- 0.1 mol/l standard thiosulphate solution. 6- various fats to be assigned.
::PPrroocceedduurree 1- To 2.0 ml of the fat, add 25 ml of chloroform to dissolve the material.
2- Pipette 5 ml sample of this solution into two separate Erlenmeyer flasks. To a third flask add 5 ml of chloroform to form a blank.

3- Add 10 ml of halogenation reagent to each flask.Cover the flasks with aluminum foil,shake and allow to stand for 15 minutes.
4- Add 7.5 ml of potassium iodide KI solution to each flask and titrate the liberated iodine using the thiosulphate solution.
5-Titrate the test solution until a light brown colour is obtained then add 5 drops of starch indicator solution immediately and titrate to a colourless end point.
7- Record the total volume of the thiosulphate required to reach the end point.
:Calculations
The difference C between the blank thiosulphate titer B and the sample titer T is the thiosulphate equivalent of iodine which combined with the fat. This titer volume is used in calculations.
)I(
1ml (0.1N) = 0.0127 g I2 C ml = Y g I2 reacted with the unsaturated bonds in the oil used
2g I = 0.0127C x = Y
1 )II(
27ml of oil solution contain = 2ml oil
5ml = X ml oil
ml27 ml oil in 0.37 = 2 x 5= X 27
Meaning that the 5ml of the test sample contain 0.37 ml oil. and to convert this amount from milliliters to grams this formula is used: W = V x d Where, W weight in gm V volume in milliliters D density of oil = 0.39 g/ml
By substitution, W = 0.3441 g oil

)III(
Since, 0.3441 g oil = Y g I2 100 g oil = Z
the iodine number = % Y x 100= Z
0.3441
:Typical iodine numbers for some fats and oils
Iodine No
Fat or Oil
8-10 Coconut oil 25-40 Butter 30-45 Beef tallow 37-54 Palm oil 45-70 Lard 75-95 Oliver oil
85-100 Peanut oil 100-117 Cottonseed oil 115-130 Corn oil 120-180 Fish oils 125-135 Canola oil 125-140 Soybean oil 130-140 Safflower oil 130-145 Sunflower oil

Name: No. Experiment 9:
Results Sheet 1-Calculate the iodine number of your oil sample. 2-Compare your results to those in the previous table.

LAB EXPERIMENT 10____ _______
Determination of Saponification Number. Principle: On refluxing with alkali, triacylglycerols (fatty acid esters) are hydrolyzed to give glycerol and potassium salts of fatty acids (soap).Such process is known as, Saponification . The saponification equation is shown below:
CH2 O
O
C R
CH O
O
C R
CH2 O
O
C R
CH2 OH
CH OH
CH2 OH+ 3 KOH
Saponification+ 3 RCOONa
Fat
Heat +Water Soap
The saponification value is the number of milligrams of KOH required to neutralize the fatty acids resulting from the complete hydrolysis of 1g of fat. The saponification value gives an indication of the nature of the fatty acids constituent of fat and thus, depends on the the average molecular weight of the fatty acids constituent of fat. The greater the molecular weight (the longer the carbon chain), the smaller the number of fatty acids is liberated per gram of fat hydrolyzed and therefore, the smaller the saponification number and vice versa. Materials: 1- Fats and oils (olive oil, coconut oil, sesame oil, and butter) 2- Fat solvent (equal volumes of 95% ethanol and ether) 3-Alcholic KOH (0.5 mol/liter)

4-Reflux condenser. 5-Boiling water bath. 6-Phenolphethalein. 7-Hydrochloric acid (0.5 mol/liter) 8-Burettes (10 ml and 25 ml) 9-Conical flasks (250ml) Procedure: 1- Accurately weight 1g of fat in a small beaker and dissolve it in about 3ml of the fat solvent. 2- Quantitatively transfer the contents of the beaker to a 250 ml conical flask by rinsing the beaker three times with a further milliliters of solvent. 3- add 25ml of alcoholic KOH and attach to a reflux condenser . 4- Set another reflux condenser as blank with everything present except the fat. 5- Heat both flasks on a boiling water bath for 30 min. 6- Leave to cool to room temperature and titrate with 0.5 mol/liter HCl and use phenolphthalein as indicator. Until the pink color disappears. 7- Record your readings as T ml for test and B ml for blank. Calculations: The difference between the blank and the test reading gives the number of milliliters of KOHrequired to saponify 1g fat. You can use this formula to calculate the saponification value: 1ml (0.5 N HCl ) = 28.05 mg KOH ( B-T ) = S saponification value (S) = ( B-T ) x 28.05 = mg KOH/1g Wt. of fat (1g

Name: No. Experiment 10:
Results Sheet
1- Calculate the Saponification value -for your test oil. 2- Record the results your friends have obtained for other oils. 1- your results:

LAB EXPERIMENT 11___ _______
BBuurrcchhaarrdd ––EEssttiimmaattiioonn ooff CChhoolleesstteerrooll LLiibbeerrmmaann ReactionReaction
::PPrriinncciippllee
Cholesterol is readily soluble in acetone, while most complex lipids are insoluble in this solvent. Blood or serum is extracted with an alcohol-acetone mixture which removes cholesterol and other lipids and precipitates protein. The organic solvent is removed by evapotation on a boiling water bath and dry residue dissolved in chloroform. The cholesteror is then determined colorimetrically using the Liebermann-Burchard reaction.
Acetic anhydride reacts with cholesterol in a chloroform solution to produce a characteristic blue-green color. The exact nature of the chromophore is not known but the reaction probably includes esterification of the hydroxyl group in the 3 position as well as other rearrangement in the molecule.The cholesterol is determined colorimetrically using the Libermann – Burchard reaction.
Materials Materials : 1. Serum or blood. 25 ml 2. Alcohol-acetone mixture (1:1). 21 3. Chloroform. 500 ml 4. Acetic anhydride-sulphuric acid mixture 930 ml (30:1 mix just before use, Care!). 5. Stock cholesterol solution (2 mg/ml in 250 ml chloroform). 6. Working cholesterol solution. (Dilute the 11 above solution one in five with chloroform to give a solution of 0.4 mg/ml.)
::PPrroocceedduurree
1- Place 10 ml of the alcohol-acetone solvent in a centrifuge tube and
0.2 ml of serum or blood. 2- Immerse the tube in a boiling water bath with shaking until the
solvent begins to boil. 3- Remove the tube and continue shaking the mixture for a further 5
min. 4- Cool to room temperature and centrifuge. 5- Decant the supernatant fluid into a test tube and evaporate to
dryness on a boiling water bath. 6- Cool and dissolve the residue in 2 ml of chloroform. 7- Add 2 ml of acetic anhydride-sulphuric acid mixture to all tube and
thoroughly mix. 8- Leave the tubes in the dark at room temperature and read the
extinction at 680 nm. 9- Carry the experiment in a test tube one for the standard: a-0.2 ml of standard then 2 ml of chloroform. b-Add 2 ml of acetic anhydride-sulfuric acid mixture and thoroughly mix. c- Leave the tube in the dark at room temperature and read the extinction at 680 nm.
::CCaallccuullaattiioonn
Determine the concentration of the unknown sample according to the following equation:
Concentration of unknown = Absorbance of unk x Conc of std Absorbance of std

Name: No. Experiment 11:
Results Sheet Calculate the concentration of cholesterol in your sample.