kingspan group plc design: annual report ... · annual report & financial statements 2016 ......
TRANSCRIPT
Kingspan Group plcAnnual Report & Financial Statements 2016
Kingspan Group plc Annual Report & Financial Statem
ents 2016
Des
ign:
ww
w.r
eddo
g.ie
Dublin RoadKingscourtCo CavanIrelandA82 XY31
Tel: +353 42 969 8000Fax: +353 42 966 7501Email: [email protected]
www.kingspan.com

Kingspan. The global leader in high performance insulation and building envelope solutions.
UKDelancey Street—Environmental: Thermomax Solar Thermal Tubes
Shaping the future built environment. Pioneering new technologies with energy conservation at their heart.
Germany Westhafen Tower—Light & Air: Natural ventilation system
SUMMARY FINANCIALS 2
GLOBAL REACH 8
COMPLETING THE ENVELOPE11
BUSINESS & STRATEGIC REPORT Chairman’s Statement 4Business Model & Strategy 8Chief Executive’s Review 16Financial Review 24Risk & Risk Management 30Corporate Social Responsibility 32
DIRECTORS' REPORT Chairman’s Introduction 42The Board 44Report of the Directors 46Corporate Governance Statement 54Report of the Remuneration Committee 61Report of the Audit Committee 72
FINANCIAL STATEMENTS Independent Auditor’s Report 80Financial Statements 83Notes to the Financial Statements 91
OTHER INFORMATION Alternative Performance Measures 128Shareholder Information 130Principal Subsidiary Undertakings 133Group Five Year Summary 136

2 3Kingspan Group plc Annual Report & Financial Statements 2016 Business & Strategic Report
SUMMARY FINANCIALS
1 Earnings before finance cost, income taxes, depreciation and intangible amortisation
2 Earnings before finance cost, income taxes and intangible amortisation
2 Revenue up
12%€3.1bn 2015 €2.8bn
2 EBITDA1 up
28%€404.1m
2015 €316.4m
2 Profit After Tax up
34%€255.5m
2015 €190.6m
2 EPS up
35%143.8 cent
2015 106.7 cent
2 Trading Profit2 up
33%€340.9m
2015 €255.9m
2 Trading Margin up
180bps11.0% 2015 9.2%
USAKennesaw State University—Insulation Boards: Greenguard XPS

54 Kingspan Group plc Annual Report & Financial Statements 2016 Business & Strategic Report Chairman's Statement
These have been bolstered by further acquisitions during 2016, including Essmann in Europe and Bristolite in North America which together with our existing daylighting business will combine to form a new Light & Air division offering a range of products that will “Complete the Envelope”. Other acquisitions during the year included Euro Clad and Eurobond,
the high-end architectural facades businesses in the UK, as well as Tankworks in Australia which gives our Environmental business its first platform in the Australasia region.
These acquisitions, as well as parallel organic investments in the Nordics, North America, Australasia and the Middle East, have been achieved
while growing the Company’s return on capital year-on-year, and maintaining a strong balance sheet. Notably, during the year the Company secured long-term strategic funding at very attractive interest rates, which will support the further development of the Group in the coming years.
These results reflect particularly strong contribution from organic growth and improved margins over the course of the year. In addition, the businesses acquired in 2015 are now fully integrated, and contributed well during the period.
BUSINESS & STRATEGIC REPORT
CHAIRMAN’S STATEMENTBuilding on the achievements of the previous year, 2016 was another record year for Kingspan. In a year that threw up many geopolitical surprises, Kingspan’s management remained focused on its business and strategy, delivering Revenues of €3.1bn, up 12%, and Trading Profit of €340.9m, up 33%.
AustraliaWAIS Sports Centre—Insulated Panels: Evolution and Trapezoidal

6 7Kingspan Group plc Annual Report & Financial Statements 2016 Business & Strategic Report Chairman's Statement
MANAGEMENT AND EMPLOYEESOn behalf of the Board, I want to thank the management team and more than 10,000 employees throughout Kingspan, for delivering these outstanding results. During the year the Board visited four of our manufacturing sites, in the US and in the Middle East, and had the opportunity to meet with the senior management in each location and see first-hand the energy and commitment of the local teams.
DIVIDEND The Board is recommending a final dividend of 23.5 cent per share, which if approved at the Annual General Meeting, will give a total dividend for the year of 33.5 cent, an increase of 34% on prior year. This will be the seventh consecutive year of growth in the shareholders’ dividend, in line with the Company’s continued progression.
If approved, the final dividend will be paid (subject to Irish withholding tax rules) on 5 May 2017 to shareholders on the register at close of business on 31 March 2017.
GOVERNANCEThe Board continues to manage and monitor governance and risk across the business throughout the year, details of which are set out in the Report of the Audit Committee and the Corporate Governance Statement in this annual report. We also maintained an open dialogue with our major shareholders on the Company’s governance as well as strategy and financial performance, as detailed in the Financial Review and the Report of the Remuneration Committee in this annual report. There were no appointments to or retirements from the Board during the year.
LOOKING AHEADAt the heart of Kingspan’s approach is the drive to help our customers achieve improved building performance and reduced running costs. I am confident that the business model of offering an increasing range of high performance insulation and low energy solutions which “Complete the Envelope”, which has contributed to our excellent performance in this past year, remains compelling. I am also confident that as we continue to expand this model across an ever growing geographic base we are well positioned to deliver increased shareholder value in 2017 and beyond.
Eugene Murtagh Chairman
17 February 2017
USANotre Dame University—Insulation Boards: Kooltherm K15 Rainscreen Board
FranceCenter Parc—Light & Air: Electric control panels for natural and smoke ventilation

Business & Strategic Report
2
21
104 4
32
2
3
24
3
3
3
16
11
36
48
3
2
2
2
2
8 Kingspan Group plc Annual Report & Financial Statements 2016 9Business & Strategic Report Business Model & Strategy
GLOBAL REACH
Kingspan Locations
AfricaEgyptMorocco South Africa
AsiaHong Kong IndiaIndonesiaMalaysia PakistanSingaporeThailandVietnam
AustralasiaAustraliaNew Zealand
EuropeAlbania AustriaAzerbaijan
BelgiumBosniaBulgariaCroatiaCzech RepublicDenmarkEstoniaFinlandFranceGermanyHungaryIreland ItalyKazakhstan LatviaLithuania MacedoniaMontenegroNetherlandsNorthern IrelandNorway Poland
RomaniaRussiaSerbiaSlovakiaSloveniaSpainSweden SwitzerlandUnited KingdomUkraine
Middle EastIranIraqSaudi ArabiaTurkeyUAEQatar
AmericasCanadaMexicoUSA
Who We Are
! Kingspan is the global leader in high performance insulation and building envelopes. Kingspan differentiates itself through its relentless development of innovative and patent-protected proprietary technology.
! Kingspan helps its customers to build in an energy efficient manner that both reduces running costs and also meets environmental regulations and greenhouse gas emissions targets. Improving building performance, construction methods and ultimately people’s lives, is what drives Kingspan forward around the world.
! Founded in Kingscourt, Co Cavan in Ireland in 1965, the Company has expanded into a global business operating in over 70 countries, employing more than 10,000 people.
9 1010
5Business Divisions
101ManufacturingFacilities
13Regional R&D Centres (Worldwide)
10,000+Employees Globally
1Global InnovationCentre (Ireland)
BUSINESS & STRATEGIC REPORT
BUSINESS MODEL & STRATEGY
Effective from January 2017
JordanQueen Alia International Airport—Insulated Panels: Kingzip
Manufacturing
Sales

4% Ireland
27% UK
41% Mainland Europe
20% Americas
8% Rest of World
The Company manages its business through 5 operating divisions:
› Insulated Panels› Insulation Boards› Access Floor Systems› Environmental› Light & Air*
Business & Strategic Report At A GlanceKingspan Group plc Annual Report & Financial Statements 2016
BUSINESS & STRATEGIC REPORT
AT A GLANCE
12 13
Products
65% Insulated Panels
22% Insulation Boards
6% Access Floors
5% Environmental
2% Light & Air
INSULATED PANELSA global leader in the design, development and manufacture of products and solutions for advanced building envelopes. Providing thermally efficient and airtight insulated panel building envelopes, integrated solar PV and smart lighting systems, and world-class customer and technical support in sustainable building design and realisation. All of our products and systems are backed by extensive testing and guarantees, and by 50 years of experience.
INSULATION BOARDSManufacturing insulation boards, pipe insulation and engineered
timber systems. A wide product range suitable for a variety of applications in the domestic, non-domestic, new-build and refurbishment sectors.
ACCESS FLOOR SYSTEMSThe world’s largest supplier of raised access flooring, providing the most cost effective way of creating flexible space and convenient distribution of building services in a range of high-end architectural finishes.
Our wide range of custom manufactured datacentre airflow systems, including structural ceilings, airflow panels and containment, work together to maximise datacentre performance.
ENVIRONMENTALProviding trusted market-leading solutions for rainwater harvesting and wastewater management, renewable energy technologies and hot water systems, environmental fuel storage and smart monitoring for all types of building projects.
LIGHT & AIR*Newly established in 2016, Kingspan Light & Air will provide daylighting solutions to complement Kingspan’s existing building envelope technologies.
Drivers Sector
85% Energy Efficiency & Conversion 15% Other
72% Commercial & Industrial 18% Residential 10% Office & Data
End Market Channel
30% Refurbishment70% New Build
75% Direct 25% Via Distribution
Geography
11
BUSINESS & STRATEGIC REPORT
BUSINESS MODEL & STRATEGY
Insulation boards
Insulatedpanels
Flatroof Membrane
Industrial insulation
Light and Air
Access floorsFacades
Completing the Envelope
Embryonic position presently Global Leadership
Kingspan manufactures a suite of complementary building envelope solutions for both the new build and refurbishment markets.
* Effective from January 2017

14 15Kingspan Group plc Annual Report & Financial Statements 2016 Business & Strategic Report Strategic Pillars
Sales by Geography 2006 Sales by Geography 2016
Extending to the wider environmental, social and governance ("ESG") strategies is core to Kingspan’s vision and development.
›› Kingspan is on track to meet its Net Zero Energy target by 2020 in an effort to reduce carbon emissions Kingspan’s renewable energy usage totalled 57% in 2016.
›› Kingspan was one of 193 leading, global companies on the 2016 'A List' in the CDP report.
›› Kingspan is demonstrating to customers the business case for investment in energy efficiency and renewable energy generation.
›› Kingspan is dedicated to providing holistic/ sustainable systems and solutions for the construction sector (and our own facilities).
BUSINESS & STRATEGIC REPORT
STRATEGIC PILLARS
NET ZERO ENERGY
Regulatory changes and environmental awareness underpinning increasing penetration of Kingspan’s product suite:
›› Continued progress on penetration gains in all major markets.
›› 12% market penetration threshold achieved in 2016 for insulated panels in the Americas, up from 5% market penetration on Kingspan first entering the market in 2006.
PENETRATION
Differentiation from competitors driven by superior innovation:
›› The launch of QuadCore™ in 2015 represented a game-changing step forward in the thermal and fire performance of insulated panels.
›› Dedicated research to achieve even higher levels of fabric thermal performance, without having to resort to greater thicknesses of insulation, culminated in the launch during 2016 of the next generation Kooltherm™ 100 range.
INNOVATION Kingspan continues to evolve into a truly global business:
›› Increasingly diversified geography base: UK and Ireland sales comprised 31% of Group sales during 2016 compared to 74% in 2006.
›› Sales in the Americas were 20% of Group sales during 2016, up from 5% in 2006, as a consequence of organic growth and the Group’s acquisition of Vicwest Building Products in 2015.
GLOBALISATION
18% Republic of Ireland 56% Great Britain & Northern Ireland 19% Mainland Europe 5% Americas 2% Other
4% Republic of Ireland 27% Great Britain & Northern Ireland 41% Mainland Europe 20% Americas 8% Other
Strategic Goals
! To lead the field in high performance insulation globally with proprietary and differentiating technologies.
! To become the world’s leading provider of low energy building solutions – Insulate & Generate.
! To achieve greater geographic balance, primarily focusing on the Americas, Europe and appropriate developing markets.

16 Kingspan Group plc Annual Report & Financial Statements 2016 17Business & Strategic Report Chief Executive's Review16 Kingspan Group plc Annual Report & Financial Statements 2016
BUSINESS & STRATEGIC REPORT
CHIEF EXECUTIVE'S REVIEW
Organic growth and margin expansion were key themes during the year, with progress particularly evident across the UK, Ireland, the Nordics and much of Western Europe. The leverage benefit from the revenue growth, coupled with a favourable raw material environment delivered a trading margin improvement from
9.2% in 2015 to 11.0% in 2016. As the year progressed, construction activity in Germany and parts of Eastern Europe weakened somewhat, in contrast to trends in the Netherlands and France which are now substantial sources of revenue for Kingspan. Our business in North America also tapered off marginally in the second
half, and order intake retreated somewhat which could impact first half sales revenue in 2017. The UK, notwithstanding the June 23rd referendum result, strengthened through the second half of 2016, and the order bank would point towards a positive start to the current year.
2016 was a very strong year for Kingspan, with record results and considerable progress on a range of strategic and innovation activities. Revenue grew by 12% to €3.1bn, resulting in EPS growth of 35% to 143.8 cent.
! Product Innovation and range expansion progressed across the Group, the most significant of which was the roll-out of QuadCore® across approximately one third of our Insulated Panel facilities worldwide, with a plan to cover the remainder over the coming two years. The next generation Kooltherm® 100 range was launched during the year and delivers another advance in the thermal performance of this product, cementing its position at the forefront of high performance insulation globally. Kingspan also took a quantum step forward in daylighting, with the establishment of our Light & Air division. This was achieved through two acquisitions, making us the first player to serve both the European and North American markets from local manufacturing bases.
! Globalisation of Kingspan remains central to our ongoing progress. During 2016, we further built our position in North America, established a manufacturing presence in Mexico, and commenced construction of new facilities in Australia, the UAE and Finland. Our trading presence in a number of these markets is still relatively embryonic and we see significant longer term upside for high performance insulation and building envelopes.
! Penetration growth and conversion from traditional insulation and building methods has been a core driver of our success to date.
As energy consumption, conservation, and its sources become increasingly centre-stage, so do the ‘enablers’. Buildings consume approximately 40% of energy globally, and building design is therefore undergoing a comparable evolution to that already underway in the automotive world. As this pattern and trend deepens, so will the penetration of materials that facilitate this evolution. Kingspan’s solutions are ideally positioned to play a key role in this dynamic.
! The pursuit of Net Zero Energy is at the heart of what we aim to achieve, both internally and externally. Our products and solutions greatly assist building designers, owners and occupiers to move in this direction and, within Kingspan itself, we are committed to achieving Net Zero Energy by 2020. Through saving, generating and procuring, we aim to use only renewable sources of power across the Group as a whole. This journey began in 2011 at 0% and in 2016 we achieved 57%, exceeding the 50% goal we had set for that period. We have several new initiatives either underway or being examined that will enable substantial advancements again in 2017 and beyond. We are a member of RE100, a group of international businesses committed to 100% renewable power, and we were selected as one of only 193 global companies on the Carbon Disclosure Project ‘A List’.
STRATEGYOur strategic agenda is focused on the four pillars of Innovation, Globalisation, Penetration and Net Zero Energy. 2016 once again delivered notable advancements in all four areas:
Financial Highlights:
! Revenue up 12% to €3.1bn, (pre-currency, up 16%).
! Trading profit up 33% to €340.9m, (pre-currency, up 41%).
! Acquisitions contributed 11% to sales growth and 7% to trading profit growth in the year.
! Group trading margin of 11%, an increase of 180bps.
! Basic EPS up 35% to 143.8 cent.
! Final dividend per share of 23.5 cent. Total dividend for the year up 34% to 33.5 cent.
! Year-end net debt of €427.9m (2015: €328.0m). Net debt to EBITDA of 1.06x (2015: 1.04x).
! Increase in ROCE by 210bps to 17.3% (2015:15.2%).
Operational Highlights:
! Strong performance in the UK, clear recovery evident in much of Western Europe with the US more subdued in the second half.
! Insulated Panels in the UK had a strong year and the North American market cooled off somewhat towards year end. European sales were strong in the Netherlands and France, whilst more flat in Germany.
! Insulation Boards had another strong year in the UK with the US and European businesses making good gains.
! Environmental continued its recovery and posted strong margin expansion year on year.
! Access Floors activity remains a challenge in North America. The UK was positive and is unlikely to dip until the second half of 2017. Datacentre solutions continue to progress.
! Total capital investment in the year was €364m, of which €113m was capex, plus an acquisition spend of €251m.
UK Friars Walk—Insulated Panels: Benchmark - Karrier
18 Kingspan Group plc Annual Report & Financial Statements 2016
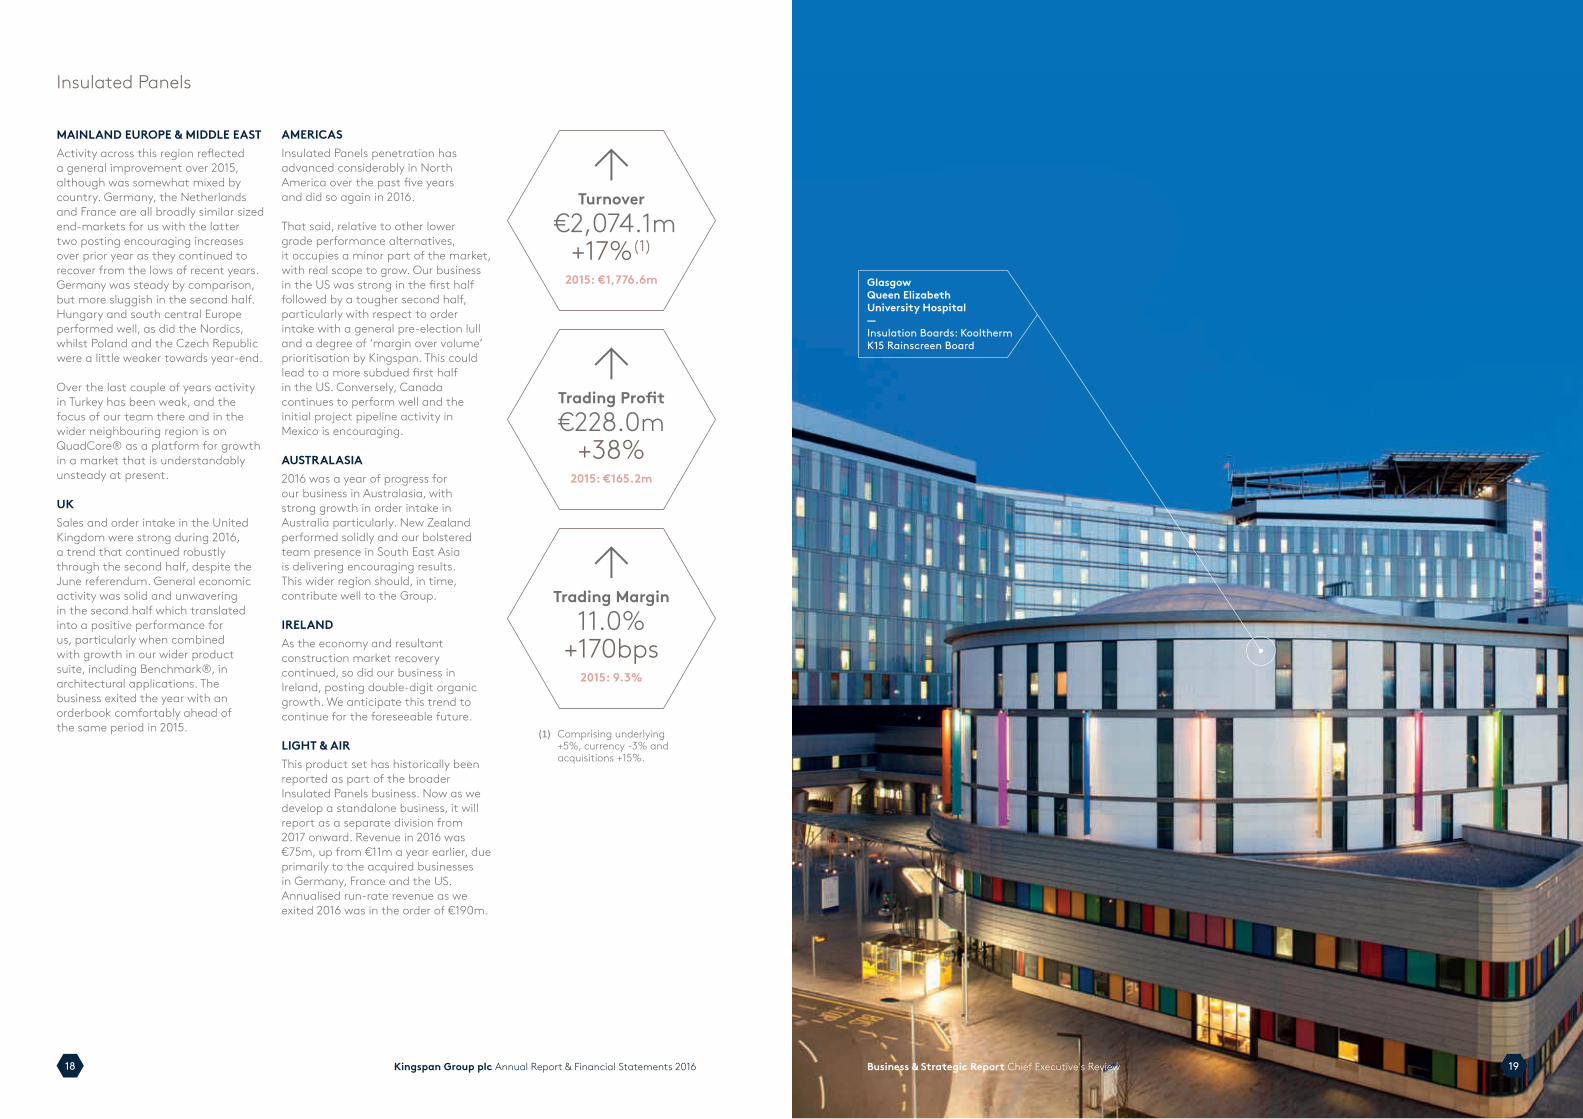
MAINLAND EUROPE & MIDDLE EASTActivity across this region reflected a general improvement over 2015, although was somewhat mixed by country. Germany, the Netherlands and France are all broadly similar sized end-markets for us with the latter two posting encouraging increases over prior year as they continued to recover from the lows of recent years. Germany was steady by comparison, but more sluggish in the second half. Hungary and south central Europe performed well, as did the Nordics, whilst Poland and the Czech Republic were a little weaker towards year-end.
Over the last couple of years activity in Turkey has been weak, and the focus of our team there and in the wider neighbouring region is on QuadCore® as a platform for growth in a market that is understandably unsteady at present.
UKSales and order intake in the United Kingdom were strong during 2016, a trend that continued robustly through the second half, despite the June referendum. General economic activity was solid and unwavering in the second half which translated into a positive performance for us, particularly when combined with growth in our wider product suite, including Benchmark®, in architectural applications. The business exited the year with an orderbook comfortably ahead of the same period in 2015.
AMERICASInsulated Panels penetration has advanced considerably in North America over the past five years and did so again in 2016.
That said, relative to other lower grade performance alternatives, it occupies a minor part of the market, with real scope to grow. Our business in the US was strong in the first half followed by a tougher second half, particularly with respect to order intake with a general pre-election lull and a degree of ‘margin over volume’ prioritisation by Kingspan. This could lead to a more subdued first half in the US. Conversely, Canada continues to perform well and the initial project pipeline activity in Mexico is encouraging.
AUSTRALASIA2016 was a year of progress for our business in Australasia, with strong growth in order intake in Australia particularly. New Zealand performed solidly and our bolstered team presence in South East Asia is delivering encouraging results. This wider region should, in time, contribute well to the Group.
IRELANDAs the economy and resultant construction market recovery continued, so did our business in Ireland, posting double-digit organic growth. We anticipate this trend to continue for the foreseeable future.
LIGHT & AIR This product set has historically been reported as part of the broader Insulated Panels business. Now as we develop a standalone business, it will report as a separate division from 2017 onward. Revenue in 2016 was €75m, up from €11m a year earlier, due primarily to the acquired businesses in Germany, France and the US. Annualised run-rate revenue as we exited 2016 was in the order of €190m.
GlasgowQueen Elizabeth University Hospital—Insulation Boards: Kooltherm K15 Rainscreen Board
19Business & Strategic Report Chief Executive's Review
Insulated Panels
2Turnover
€2,074.1m+17%(1)
2015: €1,776.6m
2Trading Profit€228.0m
+38% 2015: €165.2m
2Trading Margin
11.0%+170bps
2015: 9.3%
(1) Comprising underlying
+5%, currency -3% and acquisitions +15%.

21Business & Strategic Report Chief Executive's Review20 Kingspan Group plc Annual Report & Financial Statements 2016
Phot
ogra
ph: P
eter
Ben
nett Insulation Boards
2Turnover
€688.1m(1)
+4% 2015: €662.8m
2Trading Profit€78.5m+28%
2015: €61.3m
2Trading Margin
11.4%+220bps
2015: 9.2%
(1) Comprising underlying
+7%, currency -5% and acquisitions +2%.
UKInsulation Board and industrial insulation sales in the UK performed well during 2016. This was the result of targeted market share gains combined with robust growth in the penetration of Kooltherm®. The latter trend received a boost in the fourth quarter as we launched the next generation Kooltherm® 100 range. Additionally, as MDI supply was somewhat constrained in November, Kooltherm® became an upgrade substitute for many users. Overall, activity remained solid through year-end.
MAINLAND EUROPEThe performance of the business varied across the continent, but in general it was a positive year. The Netherlands, Germany and the Nordics performed particularly well, whilst Belgium and France were somewhat subdued. This was driven in the main by intensified competition from the relatively recently installed board capacity in that region.
AMERICASRevenue in North America was slightly ahead of prior year, although limited by current capacity constraints. An investment to double our XPS Insulation capacity in the North East US is underway and should begin supply around mid 2017. In addition to this, we are ramping up our sales team/front-end investment in generating Kooltherm® specification across the region. This strategy will be further complemented as we develop a PIR manufacturing presence, and a number of locations are currently under review for these greenfield projects. Ultimately, we aim to offer the most comprehensive range of high performance Insulation solutions for the Americas, which is currently dominated by mineral fibre.
AUSTRALASIA & MIDDLE EASTSales revenue grew marginally during 2016 in both regions. Australia is focused on growing Kooltherm® as the Melbourne plant start-up nears, a facility that will be the most advanced Insulation Board operation in Australasia. This will provide ample capacity for at least the next five years. In the Gulf region sales growth was less lively than a year earlier reflecting weaker activity in Saudi Arabia. With a view to the longer term, we are in the process of commencing a second ducting insulation line in Dubai which is currently being commissioned.
IRELANDActivity and revenue growth in Ireland has been notably strong and is likely to remain so for the foreseeable future.
AustraliaVictorian Comprehensive Cancer Centre—Insulation Boards: Kooltherm K10 FM Soffit Board
22 23Kingspan Group plc Annual Report & Financial Statements 2016 Business & Strategic Report Chief Executive's Review
Environmental Access Floors
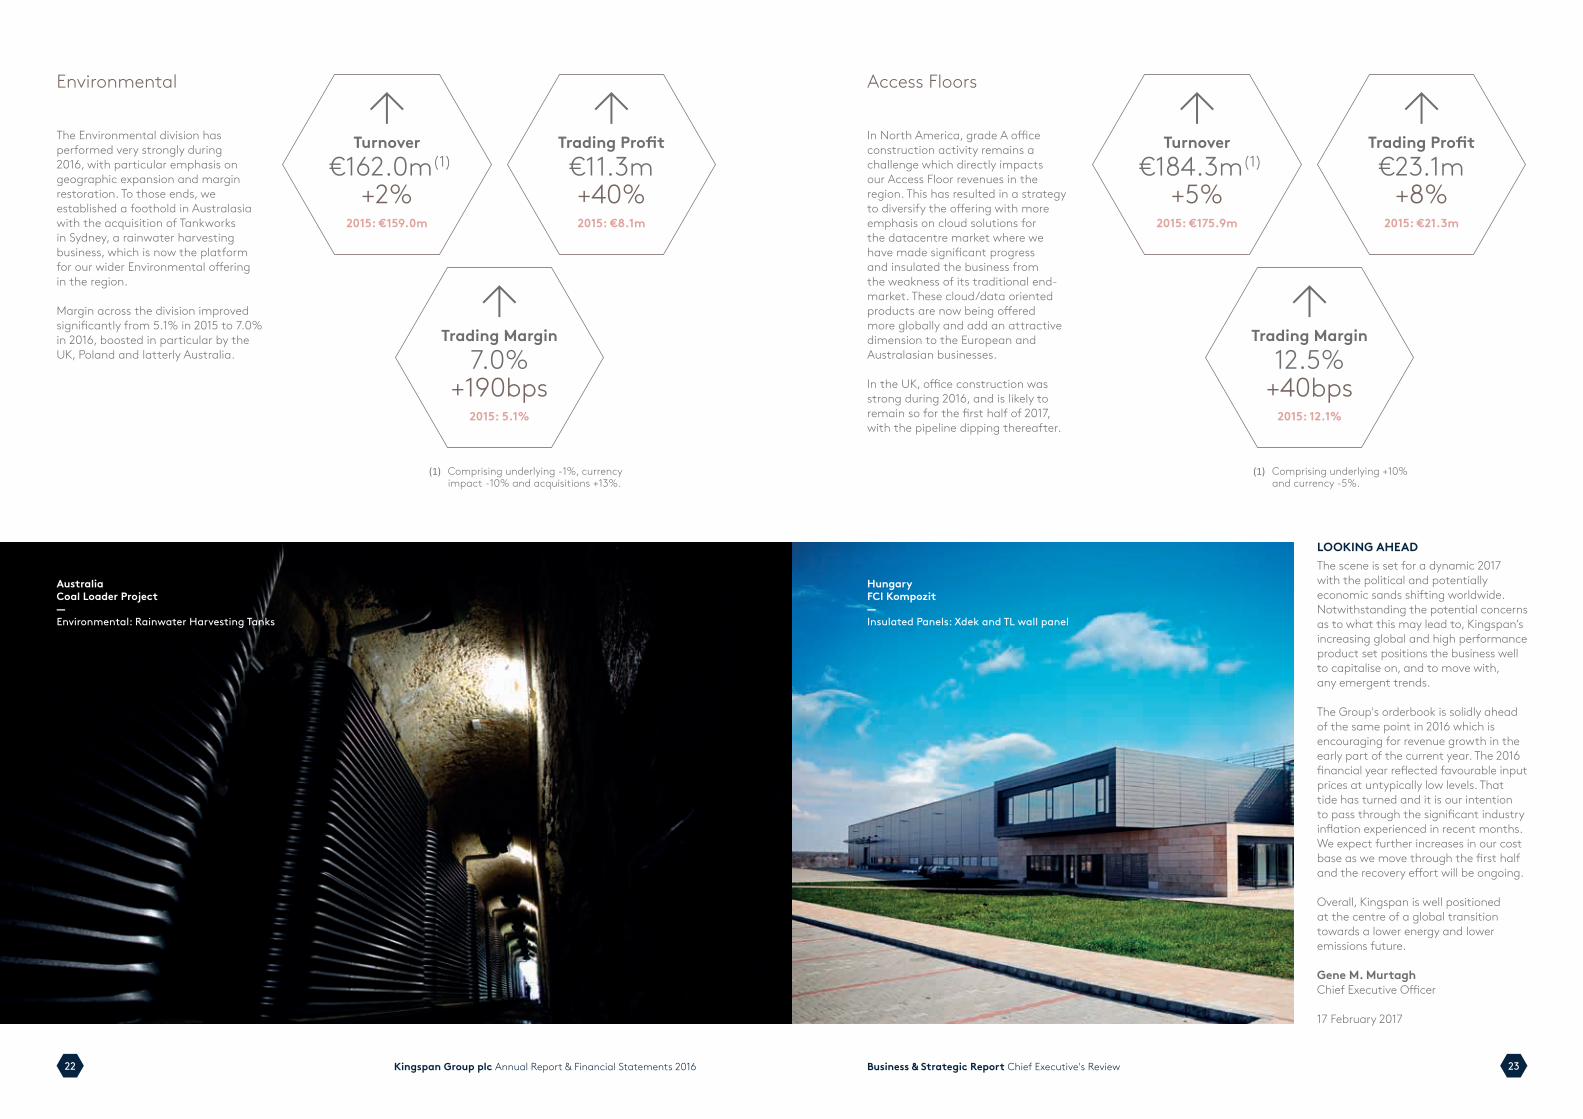
In North America, grade A office construction activity remains a challenge which directly impacts our Access Floor revenues in the region. This has resulted in a strategy to diversify the offering with more emphasis on cloud solutions for the datacentre market where we have made significant progress and insulated the business from the weakness of its traditional end-market. These cloud/data oriented products are now being offered more globally and add an attractive dimension to the European and Australasian businesses.
In the UK, office construction was strong during 2016, and is likely to remain so for the first half of 2017, with the pipeline dipping thereafter.
The Environmental division has performed very strongly during 2016, with particular emphasis on geographic expansion and margin restoration. To those ends, we established a foothold in Australasia with the acquisition of Tankworks in Sydney, a rainwater harvesting business, which is now the platform for our wider Environmental offering in the region.
Margin across the division improved significantly from 5.1% in 2015 to 7.0% in 2016, boosted in particular by the UK, Poland and latterly Australia.
2Turnover
€162.0m(1)
+2% 2015: €159.0m
2Trading Profit€11.3m+40% 2015: €8.1m
2Trading Margin
7.0%+190bps
2015: 5.1%
2Turnover
€184.3m(1)
+5% 2015: €175.9m
2Trading Profit€23.1m
+8% 2015: €21.3m
2Trading Margin
12.5%+40bps
2015: 12.1%
(1) Comprising underlying -1%, currency
impact -10% and acquisitions +13%.
(1) Comprising underlying +10%
and currency -5%.
AustraliaCoal Loader Project—Environmental: Rainwater Harvesting Tanks
HungaryFCI Kompozit—Insulated Panels: Xdek and TL wall panel
LOOKING AHEADThe scene is set for a dynamic 2017 with the political and potentially economic sands shifting worldwide. Notwithstanding the potential concerns as to what this may lead to, Kingspan’s increasing global and high performance product set positions the business well to capitalise on, and to move with, any emergent trends.
The Group's orderbook is solidly ahead of the same point in 2016 which is encouraging for revenue growth in the early part of the current year. The 2016 financial year reflected favourable input prices at untypically low levels. That tide has turned and it is our intention to pass through the significant industry inflation experienced in recent months. We expect further increases in our cost base as we move through the first half and the recovery effort will be ongoing.
Overall, Kingspan is well positioned at the centre of a global transition towards a lower energy and lower emissions future.
Gene M. MurtaghChief Executive Officer
17 February 2017
25Business & Strategic Report Financial Review24 Kingspan Group plc Annual Report & Financial Statements 2016
BUSINESS & STRATEGIC REPORT
FINANCIAL REVIEW
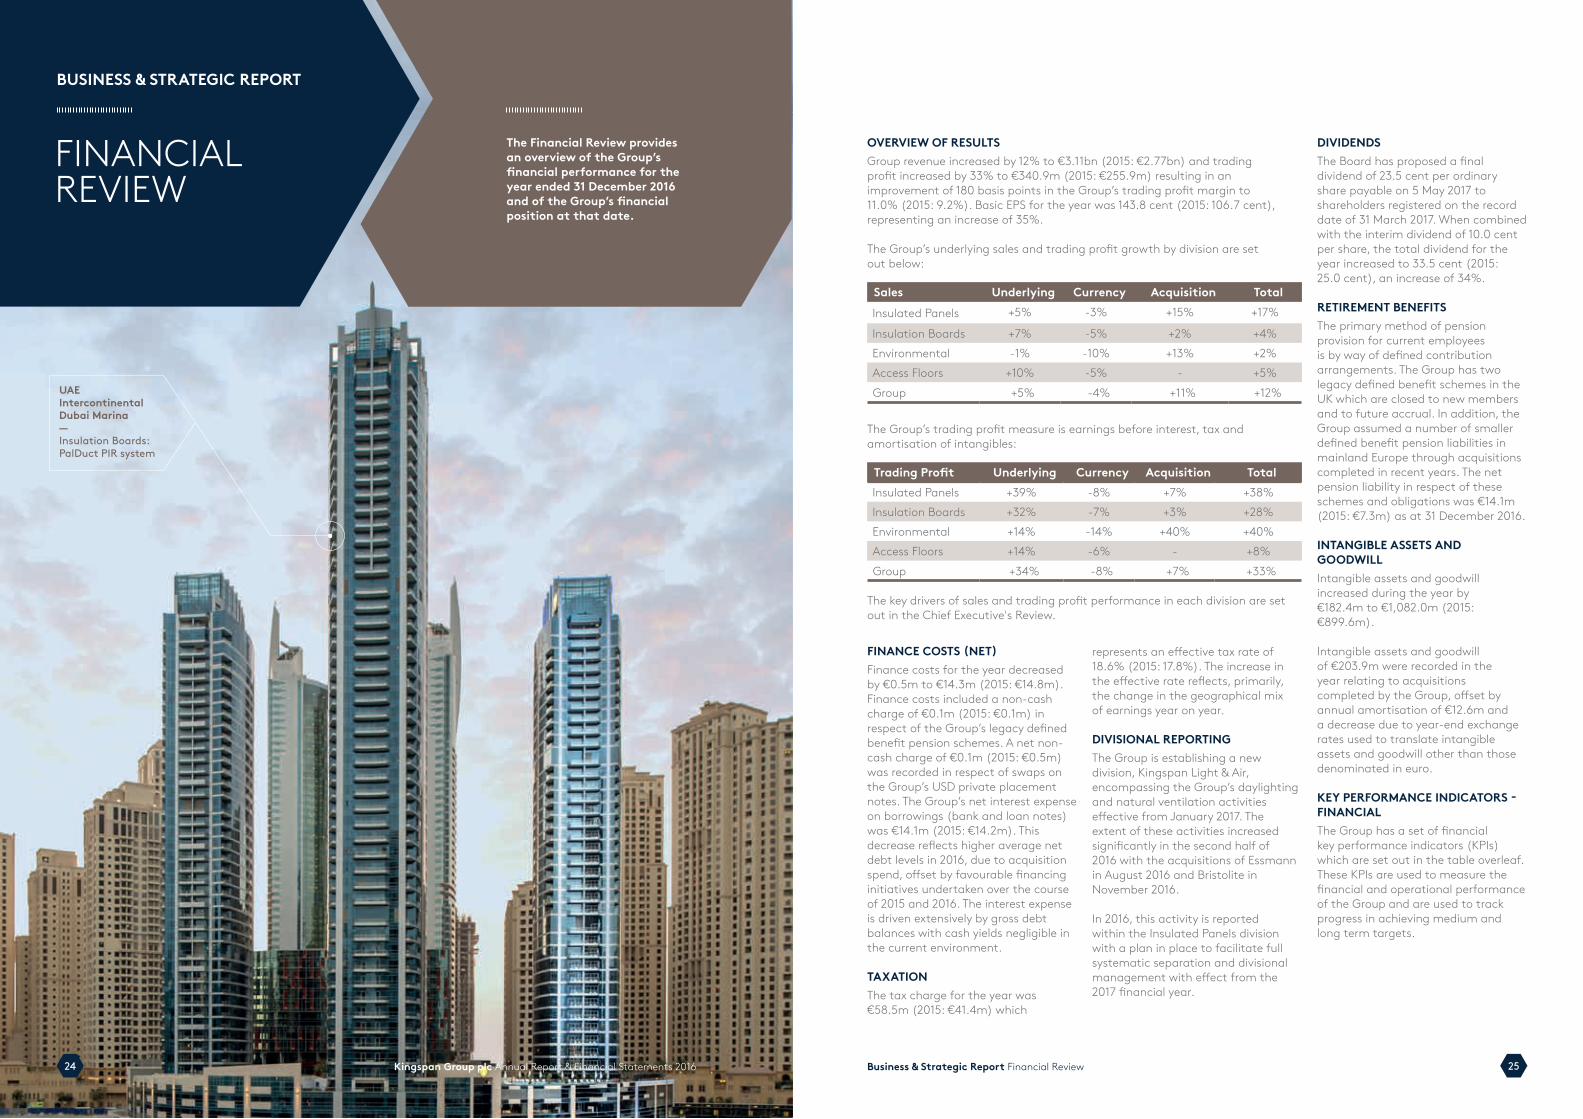
The Financial Review provides an overview of the Group’s financial performance for the year ended 31 December 2016 and of the Group’s financial position at that date.
OVERVIEW OF RESULTSGroup revenue increased by 12% to €3.11bn (2015: €2.77bn) and trading profit increased by 33% to €340.9m (2015: €255.9m) resulting in an improvement of 180 basis points in the Group’s trading profit margin to 11.0% (2015: 9.2%). Basic EPS for the year was 143.8 cent (2015: 106.7 cent), representing an increase of 35%.
The Group’s underlying sales and trading profit growth by division are set out below:
Sales Underlying Currency Acquisition TotalInsulated Panels +5% -3% +15% +17%
Insulation Boards +7% -5% +2% +4%Environmental -1% -10% +13% +2%Access Floors +10% -5% - +5%Group +5% -4% +11% +12%
The Group’s trading profit measure is earnings before interest, tax and amortisation of intangibles:
Trading Profit Underlying Currency Acquisition TotalInsulated Panels +39% -8% +7% +38%Insulation Boards +32% -7% +3% +28%Environmental +14% -14% +40% +40%Access Floors +14% -6% - +8%Group +34% -8% +7% +33%
The key drivers of sales and trading profit performance in each division are set out in the Chief Executive's Review.
DIVIDENDSThe Board has proposed a final dividend of 23.5 cent per ordinary share payable on 5 May 2017 to shareholders registered on the record date of 31 March 2017. When combined with the interim dividend of 10.0 cent per share, the total dividend for the year increased to 33.5 cent (2015: 25.0 cent), an increase of 34%.
RETIREMENT BENEFITS The primary method of pension provision for current employees is by way of defined contribution arrangements. The Group has two legacy defined benefit schemes in the UK which are closed to new members and to future accrual. In addition, the Group assumed a number of smaller defined benefit pension liabilities in mainland Europe through acquisitions completed in recent years. The net pension liability in respect of these schemes and obligations was €14.1m (2015: €7.3m) as at 31 December 2016.
INTANGIBLE ASSETS AND GOODWILLIntangible assets and goodwill increased during the year by €182.4m to €1,082.0m (2015: €899.6m).
Intangible assets and goodwill of €203.9m were recorded in the year relating to acquisitions completed by the Group, offset by annual amortisation of €12.6m and a decrease due to year-end exchange rates used to translate intangible assets and goodwill other than those denominated in euro.
KEY PERFORMANCE INDICATORS - FINANCIALThe Group has a set of financial key performance indicators (KPIs) which are set out in the table overleaf. These KPIs are used to measure the financial and operational performance of the Group and are used to track progress in achieving medium and long term targets.
FINANCE COSTS (NET) Finance costs for the year decreased by €0.5m to €14.3m (2015: €14.8m). Finance costs included a non-cash charge of €0.1m (2015: €0.1m) in respect of the Group’s legacy defined benefit pension schemes. A net non-cash charge of €0.1m (2015: €0.5m) was recorded in respect of swaps on the Group’s USD private placement notes. The Group’s net interest expense on borrowings (bank and loan notes) was €14.1m (2015: €14.2m). This decrease reflects higher average net debt levels in 2016, due to acquisition spend, offset by favourable financing initiatives undertaken over the course of 2015 and 2016. The interest expense is driven extensively by gross debt balances with cash yields negligible in the current environment.
TAXATIONThe tax charge for the year was €58.5m (2015: €41.4m) which
represents an effective tax rate of 18.6% (2015: 17.8%). The increase in the effective rate reflects, primarily, the change in the geographical mix of earnings year on year.
DIVISIONAL REPORTING The Group is establishing a new division, Kingspan Light & Air, encompassing the Group’s daylighting and natural ventilation activities effective from January 2017. The extent of these activities increased significantly in the second half of 2016 with the acquisitions of Essmann in August 2016 and Bristolite in November 2016.
In 2016, this activity is reported within the Insulated Panels division with a plan in place to facilitate full systematic separation and divisional management with effect from the 2017 financial year.
UAE Intercontinental Dubai Marina—Insulation Boards: PalDuct PIR system
26 27Kingspan Group plc Annual Report & Financial Statements 2016 Business & Strategic Report Financial Review
Key performance indicators 2016 2015Basic EPS growth 35% 70%Sales growth 12% 47%Trading margin 11.0% 9.2%Free cash flow (€m) 206.6 267.0Return on capital employed 17.3% 15.2%Net debt/EBITDA 1.06x 1.04x
(a) Basic EPS growth. The growth in EPS is accounted for by the 33% increase in trading profit, generating a 34% increase in profit after tax.
(b) Sales growth of 12% (2015: 47%) was driven by an 11% contribution from acquisitions, a 5% increase in underlying sales and a 4% decrease due to the effect of currency translation.
(c) Trading margin by division is set out below:
2016 2015Insulated Panels 11.0% 9.3%Insulation Boards 11.4% 9.2%Environmental 7.0% 5.1%Access Floors 12.5% 12.1%
Free cash flow 2016 2015€m €m
EBITDA* 404.1 316.4Non-cash items 12.4 21.1Movement in working capital (53.1) 37.9Pension contributions (2.9) (2.8)Movement in provisions 13.7 7.1Net capital expenditure (103.1) (69.5)Net interest paid (14.2) (14.5)Income taxes paid (50.3) (28.7)Free cashflow 206.6 267.0
* Earnings before finance costs, income taxes, depreciation and amortisation
Working capital at year-end was €382.7m (2015: €301.8m) and represents 12.3% (2015: 10.9%) of annual turnover. This metric is closely managed and monitored throughout the year and is subject to a certain amount of seasonal variability associated with trading patterns and the timing of significant purchases of steel and chemicals. The improvement reflects, primarily, untypically low inventory levels at the end of 2015 which have returned to more normal levels at the end of 2016.
(e) Return on capital employed, calculated as operating profit divided by total equity plus net debt, was 17.3% in 2016 (2015: 15.2%). The creation of shareholder value through the delivery of long term returns well in excess of the Group’s cost of capital is a core principle of Kingspan’s financial strategy. The increase in profitability and operating leverage has increased returns on capital during the year.
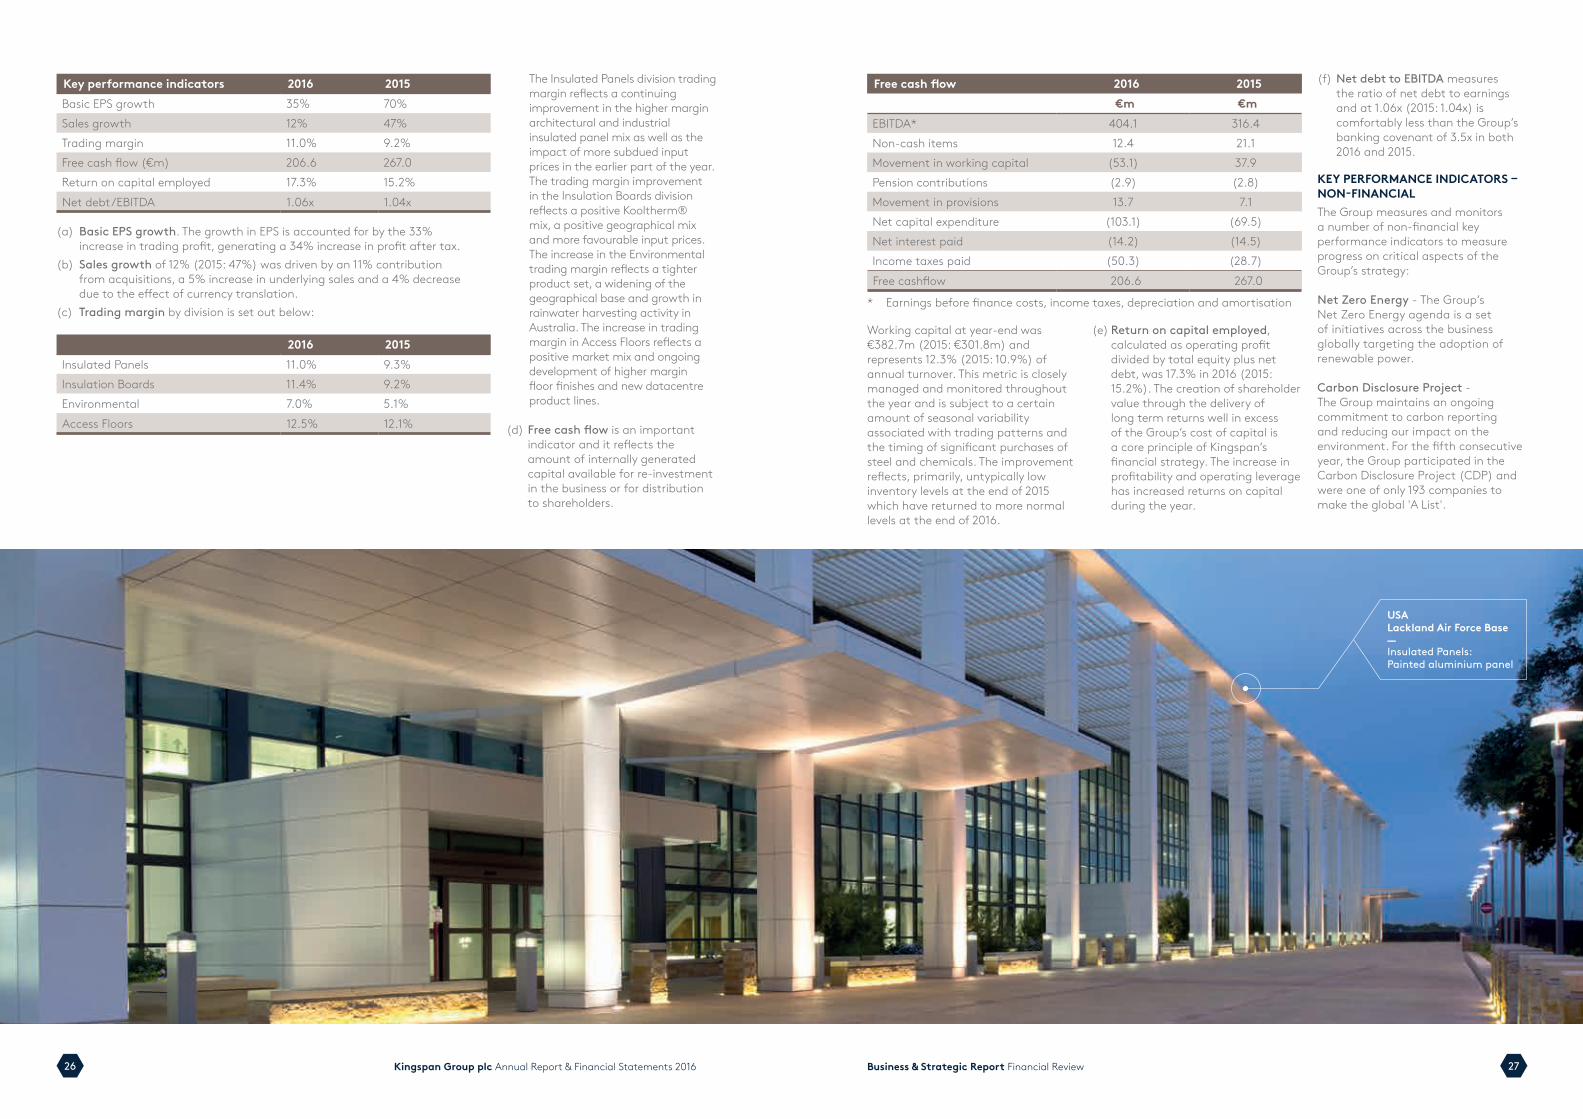
USALackland Air Force Base—Insulated Panels: Painted aluminium panel
The Insulated Panels division trading margin reflects a continuing improvement in the higher margin architectural and industrial insulated panel mix as well as the impact of more subdued input prices in the earlier part of the year. The trading margin improvement in the Insulation Boards division reflects a positive Kooltherm® mix, a positive geographical mix and more favourable input prices. The increase in the Environmental trading margin reflects a tighter product set, a widening of the geographical base and growth in rainwater harvesting activity in Australia. The increase in trading margin in Access Floors reflects a positive market mix and ongoing development of higher margin floor finishes and new datacentre product lines.
(d) Free cash flow is an important indicator and it reflects the amount of internally generated capital available for re-investment in the business or for distribution to shareholders.
(f) Net debt to EBITDA measures the ratio of net debt to earnings and at 1.06x (2015: 1.04x) is comfortably less than the Group’s banking covenant of 3.5x in both 2016 and 2015.
KEY PERFORMANCE INDICATORS – NON-FINANCIAL The Group measures and monitors a number of non-financial key performance indicators to measure progress on critical aspects of the Group’s strategy:
Net Zero Energy - The Group’s Net Zero Energy agenda is a set of initiatives across the business globally targeting the adoption of renewable power.
Carbon Disclosure Project - The Group maintains an ongoing commitment to carbon reporting and reducing our impact on the environment. For the fifth consecutive year, the Group participated in the Carbon Disclosure Project (CDP) and were one of only 193 companies to make the global 'A List'.
28 29Kingspan Group plc Annual Report & Financial Statements 2016 Business & Strategic Report Financial Review
In addition, the Group made four smaller acquisitions during the year for an aggregate cash consideration of €77m:
›› Tankworks: an Australian rainwater harvesting business was acquired on 29 April;
›› Bristolite: a US daylighting business was acquired on 2 November;
›› Paroc: a Finnish insulated panels business was acquired on 14 December; and
›› Isocab Isobar NV: a Belgian insulated panels business was acquired on 31 October.
CAPITAL STRUCTURE AND GROUP FINANCINGThe Group funds itself through a combination of equity and debt. Debt is funded through syndicated and bilateral bank facilities and private placement loan notes. The primary bank debt facility is a €300m revolving credit facility, which was undrawn
at year-end and which matures in March 2019. As at 31 December 2016, the Group’s committed bilateral bank facilities were €160m, none of which was drawn. Private placement loan note funding, net of related derivatives, totals €642.6m. The weighted average maturity of the notes is 6.5 years, including a new private placement of €250m completed on 16 November 2016. Of this, €220m was funded on completion with an additional €30m tranche drawdown taking place in March 2017.
The Group had significant available undrawn facilities and cash balances which, in aggregate, were €682m at 31 December 2016 and provide appropriate headroom for ongoing operational requirements and development funding.
NET DEBT Net debt increased by €99.9m during 2016 to €427.9m (2015: €328.0m). This is analysed in the table below:
KEY FINANCIAL COVENANTSThe majority of Group borrowings are subject to primary financial covenants calculated in accordance with lenders’ facility agreements:
›› A maximum net debt to EBITDA ratio of 3.5 times; and
›› A minimum EBITDA to net interest coverage of 4 times.
The performance against these covenants in the current and comparative year is set out below:
2016 2015Covenant Times Times
Net debt/EBITDA Maximum 3.5 1.06 1.04EBITDA/Net interest Minimum 4.0 28.3 21.4
INVESTOR RELATIONS Kingspan is committed to interacting with the international financial community to ensure a full understanding of the Group’s strategic plans and its performance against these plans. During the year, the executive management presented at 6 capital market conferences and conducted 401 institutional one-on-one and group meetings.
SHARE PRICE AND MARKET CAPITALISATION The Company’s shares traded in the range of €18.09 to €26.12 during the year. The share price at 31 December 2016 was €25.80 (31 December 2015: €24.31) giving a market capitalisation at that date of €4.6bn (2015: €4.3bn). Total shareholder return for 2016 was 7.4%.
FINANCIAL RISK MANAGEMENT The Group operates a centralised treasury function governed by a treasury policy approved by the Group Board. This policy primarily covers foreign exchange risk, credit risk, liquidity risk and interest rate risk. The principal objective of the policy is to minimise financial risk at reasonable cost. Adherence to the policy is monitored by the CFO and the Internal Audit function. The Group does not engage in speculative trading of derivatives or related financial instruments.
Geoff DohertyChief Financial Officer
17 February 2017
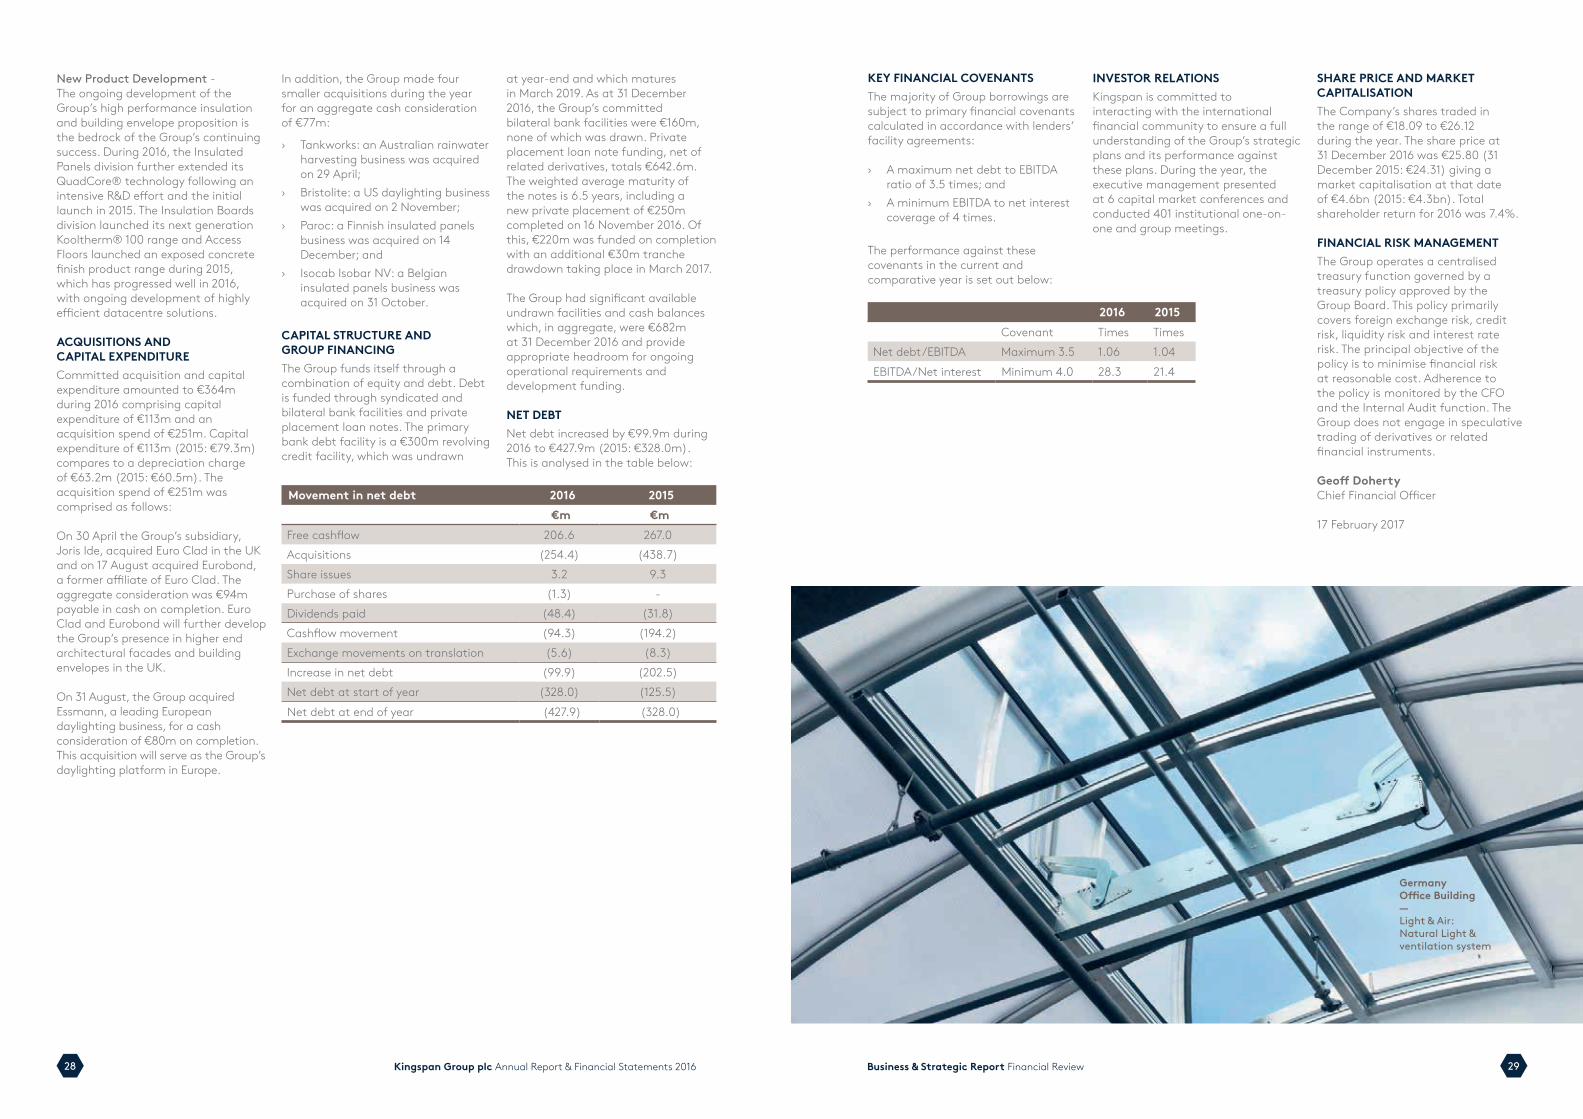
GermanyOffice Building—Light & Air: Natural Light & ventilation system
New Product Development - The ongoing development of the Group’s high performance insulation and building envelope proposition is the bedrock of the Group’s continuing success. During 2016, the Insulated Panels division further extended its QuadCore® technology following an intensive R&D effort and the initial launch in 2015. The Insulation Boards division launched its next generation Kooltherm® 100 range and Access Floors launched an exposed concrete finish product range during 2015, which has progressed well in 2016, with ongoing development of highly efficient datacentre solutions.
ACQUISITIONS AND CAPITAL EXPENDITURE Committed acquisition and capital expenditure amounted to €364m during 2016 comprising capital expenditure of €113m and an acquisition spend of €251m. Capital expenditure of €113m (2015: €79.3m) compares to a depreciation charge of €63.2m (2015: €60.5m). The acquisition spend of €251m was comprised as follows:
On 30 April the Group’s subsidiary, Joris Ide, acquired Euro Clad in the UK and on 17 August acquired Eurobond, a former affiliate of Euro Clad. The aggregate consideration was €94m payable in cash on completion. Euro Clad and Eurobond will further develop the Group’s presence in higher end architectural facades and building envelopes in the UK.
On 31 August, the Group acquired Essmann, a leading European daylighting business, for a cash consideration of €80m on completion. This acquisition will serve as the Group’s daylighting platform in Europe.
Movement in net debt 2016 2015€m €m
Free cashflow 206.6 267.0Acquisitions (254.4) (438.7)Share issues 3.2 9.3Purchase of shares (1.3) -Dividends paid (48.4) (31.8)Cashflow movement (94.3) (194.2)Exchange movements on translation (5.6) (8.3)Increase in net debt (99.9) (202.5)Net debt at start of year (328.0) (125.5)Net debt at end of year (427.9) (328.0)
30 31Kingspan Group plc Annual Report & Financial Statements 2016 Business & Strategic Report Risk & Risk Management
BUSINESS & STRATEGIC REPORT
RISK & RISK MANAGEMENT
As a leading building supplies manufacturer in a highly competitive international environment, Kingspan is exposed to a variety of risks and uncertainties which are monitored and controlled by the Group’s internal risk management framework.
Overall responsibility for risk management lies with the Board who ensures that risk awareness is set at an appropriate level. To ensure that risk awareness is set at an appropriate level, the Audit Committee assists the Board by taking delegated responsibility for the risk identification and assessment in addition to reviewing the Group’s risk management and internal control systems and making recommendations to the Board thereon.
The chairman of the Audit Committee reports to the Board at each Board meeting on its activities, both in regard to audit matters and risk management. The activities of the
Audit Committee are set out in detail in the Report of the Audit Committee on page 73.
The Board monitors the Group’s risk management systems through this consultation with the Audit Committee but also through the Group’s divisional monthly management meetings, where at least two executive directors are present. The risks and trends are the focus of each division’s monthly management meeting, where their performance is also assessed against budget, forecast and prior year. In addition, key performance indicators are used to benchmark operational performance for all manufacturing sites.
In addition to this ongoing assessment of risk within the divisions, the Audit Committee oversees an annual risk assessment for the Group whereby each divisional management team is formally asked to prepare a risk assessment for their businesses. This assessment involves evaluating group-wide risks, as put forward by the Board, and also presenting additional risks that are specific to their business.
While it is acknowledged that the Group faces a variety of risks, the Board, through the processes set out above, has identified the principal risks and uncertainties that could potentially impact upon the Group’s short to medium term strategic goals and these are as follows:
Risk and impact Actions to mitigateFailure to innovateFailing to successfully manage and compete with new product innovations, changing market trends and consumer tastes could have an adverse effect on Kingspan’s market share, the future growth of the business and the margins achieved on the existing product line.
Innovation is one of Kingspan’s four pillars to increasing shareholder value and therefore plays a key role within the Group.
There is a continual review of each division’s product portfolios at both the executive and local management level to ensure that they target current and future opportunities for profitable growth.
This risk is further mitigated by continuing innovation and compelling marketing programmes. Kingspan also has a deep understanding of changing consumer and industry dynamics in its key markets, enabling management to respond appropriately to issues which may impact business performance.
Product failureA key risk to Kingspan’s business is the potential for functional failure of our product which could lead to health, safety and security issues for both our people and our customers.
The Kingspan brand is well established and is a key element of the Group’s overall marketing and positioning strategy. In the event of a product failure, the Kingspan brand and/or reputation could be damaged and if so, this could lead to a loss of market share.
Dedicated structures and processes are in place to manage and monitor product quality controls throughout the business:›› The majority of new products go through a certification process which is undertaken by a recognised
and reputable authority (for example, in the UK it is the Building Research Establishment, BRE) before it is brought to market.›› Our businesses employ quality control specialists and operate strict policies to ensure consistently
high standards are maintained in relation to the sourcing and handling of raw materials.›› Quality audits are undertaken at our manufacturing sites.›› Documented and tested product recall procedures are embedded in all our businesses and
regularly reviewed.›› Effective training is delivered to our staff.›› We proactively monitor the regulatory and legislative environment.
Business interruption (including IT continuity)Kingspan’s performance is dependent on the availability and quality of its physical infrastructure, its raw material supply chain and its information technology. The safe and continued operation of such systems and infrastructure is threatened by natural and man-made perils and is affected by the level of investment available to improve them.
Any significant or prolonged restriction to its physical infrastructure, the necessary raw materials or its IT systems and infrastructure could have an adverse effect on Kingspan’s business performance.
Kingspan insists on industry leading operational processes and procedures to ensure effective management of each facility. The Group invests significantly in a rigorous programme of preventative maintenance on all key manufacturing lines to mitigate the risk of production line stoppages.
The impact of production line stoppages is also mitigated by having business continuity plans in place to allow for the transfer of significant volume from any one of our 58 plants in the Insulated Panels division or 19 plants in the Insulation Boards division to another in the event of a shutdown.
In addition and as part of our consequential loss insurance, Kingspan is subject to regular reviews of all manufacturing sites by external risk management experts, with these reviews being aimed at improving Kingspan’s risk profile.
In an effort to reduce Kingspan’s exposure to raw material supply chain issues, Kingspan builds strong relationships with a wide range of raw material suppliers to limit the reliance on any one supplier or even a small number of suppliers.
Kingspan’s IT infrastructure is constantly reviewed and updated to meet the needs of the Group. Procedures have been established for the protection of this infrastructure and all other IT related assets. These include the development of IT specific business continuity plans, IT disaster recovery plans and back-up delivery systems, to reduce business disruption in the event of a major technology failure.
Credit risks and credit controlAs part of the overall service package, Kingspan provides credit to customers and as a result there is an associated risk that the customer may not be able to pay outstanding balances.
At the year-end, the Group was carrying a receivables book of €546m expressed net of provision for default in payment. This represents a net risk of 18% of sales. Of these net receivables approximately 73% were covered by credit insurance or other forms of collateral such as letter of credit and bank guarantees.
Each business unit has established procedures and credit control functions around managing its receivables and takes action when necessary.
Trade receivables are primarily managed through strong credit control functions backed up by credit insurance to the extent that it is available. All major outstanding and overdue balances together with significant potential exposures are reviewed regularly and concerns are discussed at monthly meetings at which the Group’s executive directors are present.
Control systems are in place to ensure that credit authorisation requests are supported with appropriate and sufficient documentation and are approved at appropriate levels in the organisation.
Employee development & retention
The success of Kingspan is built upon effective management teams committed to achieving a superior performance in each division. Failure to attract, retain or develop these teams could have an impact on business performance.
Kingspan, and each of its divisions, is committed to ensuring that the necessary procedures are in place to attract, develop and retain the skill levels needed to achieve the Group’s strategic goals. These procedures include strong recruitment processes, succession planning, remuneration reviews, including both long and short term incentive plans, and career development plans.
Fraud and cybercrime
Kingspan is potentially exposed to fraudulent activity, with particular focus on the Group’s online banking systems, online payment procedures and unauthorised access to internal systems.
The security processes around the Group’s IT and banking systems are subject to review by divisional management and internal audit. These systems are continually reviewed with updates and improvements implemented as required. Relevant IT and security policy documents and related alerts are circulated by Group management to all divisions to ensure a consistent and effective approach is taken across the Group.
Acquisition and integration of new businesses
Acquisitive growth is an important element of Kingspan’s development strategy. A failure to execute and properly integrate significant acquisitions and capitalise on the potential synergies they bring may adversely affect the Group.
All potential acquisitions are rigorously assessed and evaluated, both internally and by external advisors, to ensure any potential acquisition meets Kingspan's strategic and financial criteria.
This process is underpinned by extensive integration procedures and the close monitoring of performance post acquisition by both divisional and Group management.
Kingspan also has a strong track record of successfully integrating acquisitions and therefore management have extensive knowledge in this area which it utilises for each acquisition.
Risk and impact Actions to mitigateVolatility in the macro environment
Kingspan products are targeted at both the residential and non-residential (including retail, commercial, public sector and high rise offices) construction sectors. As a result, demand is dependent on activity levels which may vary by geographic market and is subject to the usual drivers of construction activity (i.e. general economic conditions and volatility, events such as the UK’s EU Referendum, political uncertainty in some regions, interest rates, business / consumer confidence levels, unemployment and population growth).
While construction markets are inherently cyclical, changing building and environmental regulations continue to act as an underlying positive structural trend for demand for many of the Group’s products.
The exposure to the cyclicality of any one construction market is partially mitigated by the Group’s diversification, both geographically and by product.
As set out in the Business Model & Strategy, the Group has mitigated this risk through diversification as follows:
›› Sales outside of traditional markets, predominantly the UK and Ireland, have increased from 26% in 2006 to 69% in 2016;›› Launch of new products and continual improvements to existing product lines; and›› Acquisitions made during the year extend the geographic reach of the Group.
The full details of these diversifications are set out in the Business Model & Strategy on pages 8 to 15.

32 Kingspan Group plc Annual Report & Financial Statements 2016 33Business & Strategic Report Corporate Social Responsibility
BUSINESS & STRATEGIC REPORT
CORPORATE SOCIAL RESPONSIBILITY
Kingspan’s vision
To be a global leader in sustainable business and establish a leading position in providing ethical, renewable and affordable best practice solutions for the construction sector.
MARKETPLACE> Continue to produce best
in class products and building solutions.
> Ensure sustainability is considered in all aspects of our product’s lifecycle.
> Ensure supply chain accountability. WORKPLACE
> Safe and healthy workplace for all employees.
> Develop our employees in order to achieve their potential.
> Be an equal opportunity employer and respect the human rights of all employees.
ENVIRONMENT > Sustainability at the heart
of everything we do.> Net Zero Energy. > Mimimise waste,
harmful emmisions and water usage.
COMMUNITY> Actively engage with
and make positive contributions to the communities we belong to.
> Support a broad range of charitable causes.
> Comply with all local laws of the countries we operate in.
NET ZERO ENERGY
In 2011, Kingspan Group embarked on its own initiative, committing to ensure that all of its facilities, worldwide are Net Zero Energy on an aggregate basis by the year 2020. We have already exceeded our interim 50% target for 2016 by 7%.
CORPORATE SOCIAL RESPONSIBILITY
ENVIRONMENTWe help build a more sustainable future by delivering environmental, social and economic outcomes for our stakeholders, and by proactively leading the corporate response to climate change.
2 57%Interim Target of 50% exceeded on 12 October 2016
35Business & Strategic Report Corporate Social Responsibility34
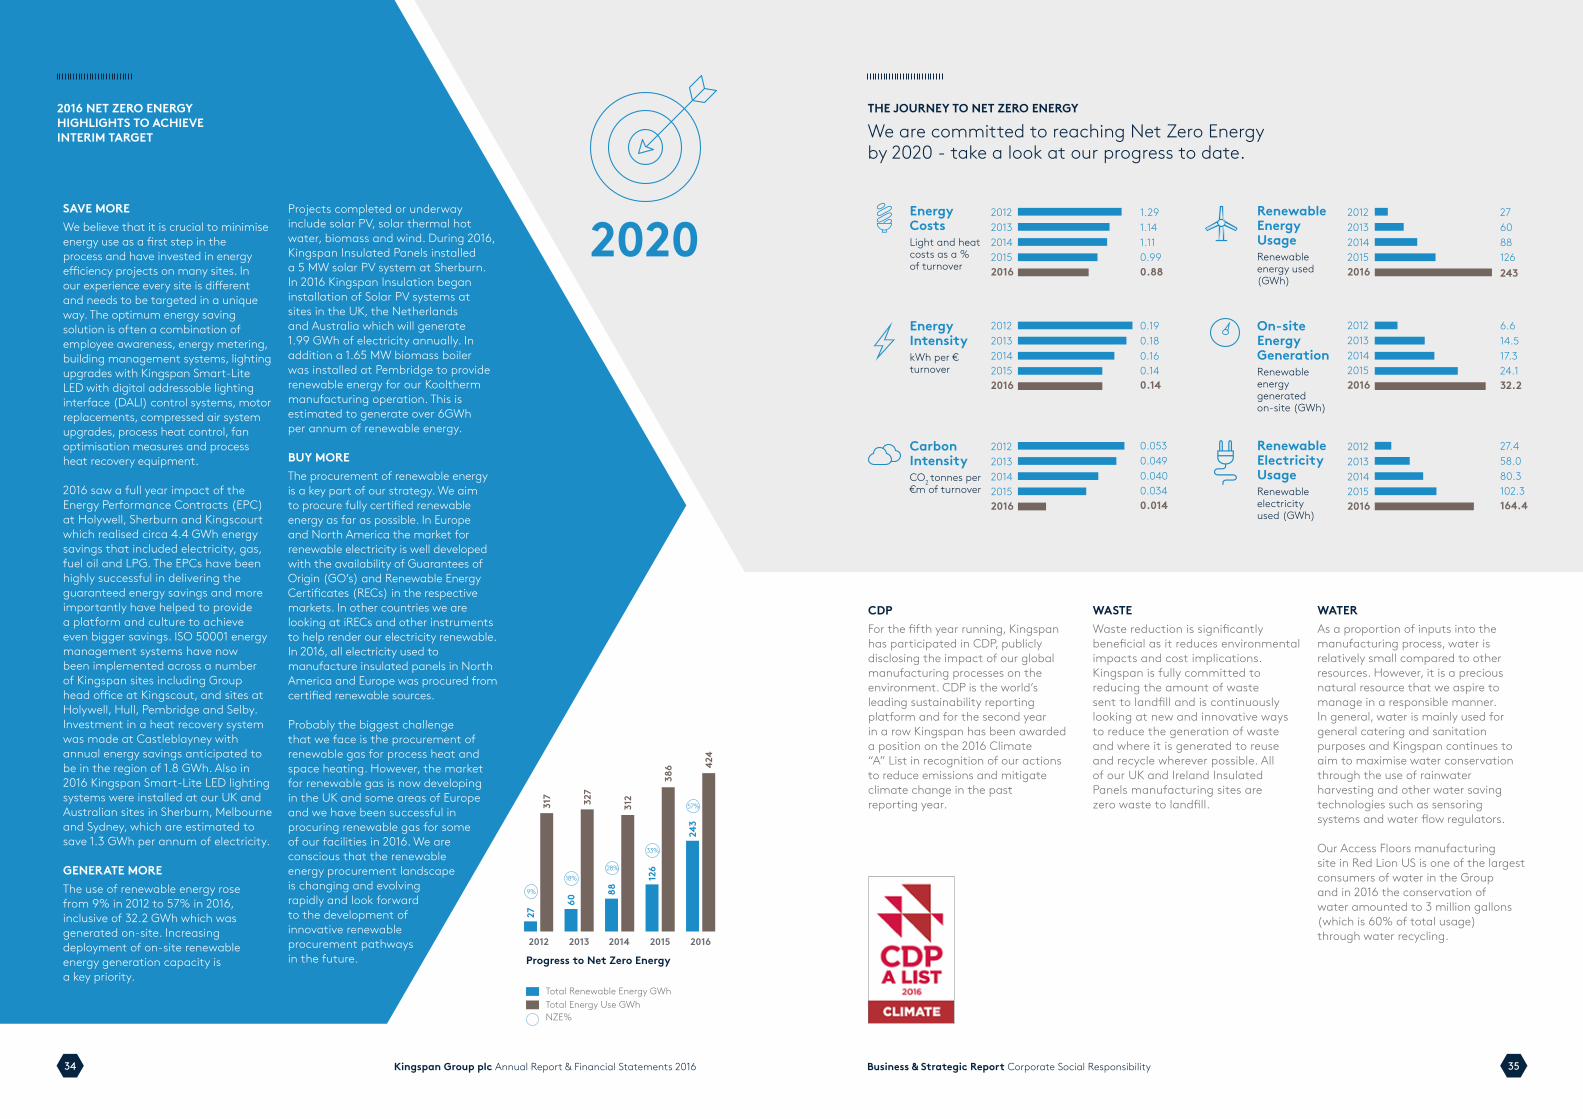
THE JOURNEY TO NET ZERO ENERGY
We are committed to reaching Net Zero Energy by 2020 - take a look at our progress to date.
2016 NET ZERO ENERGY HIGHLIGHTS TO ACHIEVE INTERIM TARGET
SAVE MOREWe believe that it is crucial to minimise energy use as a first step in the process and have invested in energy efficiency projects on many sites. In our experience every site is different and needs to be targeted in a unique way. The optimum energy saving solution is often a combination of employee awareness, energy metering, building management systems, lighting upgrades with Kingspan Smart-Lite LED with digital addressable lighting interface (DALI) control systems, motor replacements, compressed air system upgrades, process heat control, fan optimisation measures and process heat recovery equipment.
2016 saw a full year impact of the Energy Performance Contracts (EPC) at Holywell, Sherburn and Kingscourt which realised circa 4.4 GWh energy savings that included electricity, gas, fuel oil and LPG. The EPCs have been highly successful in delivering the guaranteed energy savings and more importantly have helped to provide a platform and culture to achieve even bigger savings. ISO 50001 energy management systems have now been implemented across a number of Kingspan sites including Group head office at Kingscout, and sites at Holywell, Hull, Pembridge and Selby. Investment in a heat recovery system was made at Castleblayney with annual energy savings anticipated to be in the region of 1.8 GWh. Also in 2016 Kingspan Smart-Lite LED lighting systems were installed at our UK and Australian sites in Sherburn, Melbourne and Sydney, which are estimated to save 1.3 GWh per annum of electricity.
GENERATE MOREThe use of renewable energy rose from 9% in 2012 to 57% in 2016, inclusive of 32.2 GWh which was generated on-site. Increasing deployment of on-site renewable energy generation capacity is a key priority.
Projects completed or underway include solar PV, solar thermal hot water, biomass and wind. During 2016, Kingspan Insulated Panels installed a 5 MW solar PV system at Sherburn. In 2016 Kingspan Insulation began installation of Solar PV systems at sites in the UK, the Netherlands and Australia which will generate 1.99 GWh of electricity annually. In addition a 1.65 MW biomass boiler was installed at Pembridge to provide renewable energy for our Kooltherm manufacturing operation. This is estimated to generate over 6GWh per annum of renewable energy.
BUY MOREThe procurement of renewable energy is a key part of our strategy. We aim to procure fully certified renewable energy as far as possible. In Europe and North America the market for renewable electricity is well developed with the availability of Guarantees of Origin (GO’s) and Renewable Energy Certificates (RECs) in the respective markets. In other countries we are looking at iRECs and other instruments to help render our electricity renewable. In 2016, all electricity used to manufacture insulated panels in North America and Europe was procured from certified renewable sources.
Probably the biggest challenge that we face is the procurement of renewable gas for process heat and space heating. However, the market for renewable gas is now developing in the UK and some areas of Europe and we have been successful in procuring renewable gas for some of our facilities in 2016. We are conscious that the renewable energy procurement landscape is changing and evolving rapidly and look forward to the development of innovative renewable procurement pathways in the future.
CDPFor the fifth year running, Kingspan has participated in CDP, publicly disclosing the impact of our global manufacturing processes on the environment. CDP is the world’s leading sustainability reporting platform and for the second year in a row Kingspan has been awarded a position on the 2016 Climate “A” List in recognition of our actions to reduce emissions and mitigate climate change in the past reporting year.
WASTE Waste reduction is significantly beneficial as it reduces environmental impacts and cost implications. Kingspan is fully committed to reducing the amount of waste sent to landfill and is continuously looking at new and innovative ways to reduce the generation of waste and where it is generated to reuse and recycle wherever possible. All of our UK and Ireland Insulated Panels manufacturing sites are zero waste to landfill.
WATERAs a proportion of inputs into the manufacturing process, water is relatively small compared to other resources. However, it is a precious natural resource that we aspire to manage in a responsible manner. In general, water is mainly used for general catering and sanitation purposes and Kingspan continues to aim to maximise water conservation through the use of rainwater harvesting and other water saving technologies such as sensoring systems and water flow regulators.
Our Access Floors manufacturing site in Red Lion US is one of the largest consumers of water in the Group and in 2016 the conservation of water amounted to 3 million gallons (which is 60% of total usage) through water recycling.
Energy CostsLight and heat costs as a % of turnover
Energy IntensitykWh per € turnover
Carbon IntensityCO2 tonnes per €m of turnover
Renewable Energy UsageRenewable energy used (GWh)
On-site Energy GenerationRenewable energy generated on-site (GWh)
Renewable Electricity UsageRenewable electricity used (GWh)
2012
2012
2012
2013
2013
2013
2014
2014
2014
2015
2015
2015
2016
2016
2016
1.29
0.19
0.053
1.14
0.18
0.049
1.11
0.16
0.040
0.99
0.14
0.034
0.88
0.14
0.014
2012
2012
2012
2013
2013
2013
2014
2014
2014
2015
2015
2015
2016
2016
2016
27
27.4
6.6
60
58.0
14.5
88
80.3
17.3
126
102.3
24.1
243
164.4
32.2
Kingspan Group plc Annual Report & Financial Statements 2016
386 42
4
2012
27
9%
18%28%
33%
57%317 327
312
60
88
243
126
2013 2014 2015 2016
Total Renewable Energy GWhTotal Energy Use GWhNZE%
Progress to Net Zero Energy
2020

36 37Kingspan Group plc Annual Report & Financial Statements 2016 Business & Strategic Report Corporate Social Responsibility
Problem solving for a better world is at the heart of our manufacturing and design process, with our Global Innovation centre based in Kingscourt, supported by 13 regional R&D centres worldwide. Pushing performance is something we thrive on, as is evidenced by our latest innovations: Kooltherm 100 and QuadCore.
KOOLTHERM 100 When you have a formula that works, that is tried and tested, it can be difficult to take a leap to the next level. This is the challenge our innovation labs not only accepted, but surpassed, creating a new benchmark for rigid insulation.
A constant problem facing the construction industry today is how to achieve very high levels of fabric thermal performance, without also having to resort to very great thicknesses of insulation. Our answer was the Kooltherm 100 range – ultra-low lambda products that support specifiers and contractors in making the most of the building space they have. Offering a thermal conductivity of just 0.018 W/mK, they provide a level of performance that is unrivalled in the world of rigid thermoset insulation materials.
QUADCORELaunched across Kingspan’s major markets, QuadCore technology is Kingspan’s next generation hybrid insulation core.
Within the world of Insulated Panels, this innovation with its distinctive grey microcells powers the industry’s highest combined performance:
Superior U-value performance with an unrivalled thermal conductivity of 0.018 W/mK. Better thermal efficiency in the building envelope reduces the load on heating and cooling, which unlocks significant additional energy savings.
Today’s buildings must be safe, efficient, reliable, practical and sustainable. In fact, we guarantee that whatever direction the building takes, the thermal and structural performance will last.
The only closed cell insulated panel material tested and approved by third party industry experts to FM 4882 for smoke sensitivity.
Higher environmental credentials leading to important green ratings for your building. All of which means QuadCore technology can make a significant and lasting difference to your environmental performance figures while enhancing the sustainability of your building.
Winner of Best Technology 2015 and 2016 RIAI architects choice awards.
CUSTOMER EXPERIENCE PROGRAMME Everything that our customers experience with Kingspan matters to us. Whether it’s the performance of our product solutions, the responsiveness of our service teams
or the efficiency of our deliveries, we strive to provide a positive experience to all our customers.
To help us achieve our strategic goal we have introduced four key commitment areas into our businesses on which we are focusing as part of our customer excellence programme:
›› Deliver a memorable customer experience.
›› Develop the employee experience, so our teams never want to work for anyone else.
›› Measure what our customers and employees actually experience.
›› Continue to innovate.
ENGAGING WITH SUPPLIERSThe environment Kingspan engages with its supply chain to minimise the environmental impact of its raw materials, using its purchasing power to bring about lasting and positive change. Kingspan have developed an ethical procurement strategy for procuring materials and services in a sustainable way, and we seek to build and
maintain long term relationships with key suppliers and contractors to ensure that they are aligned to the same standards. Many of our suppliers are accredited to ISO 9001, ISO 14001 and OHSAS 18001, which cover quality, environmental and health and safety management systems.
Modern Slavery Slavery and human trafficking are abhorrent crimes and we all have a responsibility to ensure that they do not continue. At Kingspan we pride ourselves on conducting our business ethically and responsibly. The Modern Slavery Act 2015 became UK legislation and required all large UK companies and businesses who supply goods or services in the UK to publish a slavery and human trafficking statement each financial year on their website.
Kingspan is fully committed to ensuring that modern slavery is not taking place in our business or any of our supply chains. We adopted and published our policy statement at the end of 2016 and in 2017 all our businesses will be contacting our suppliers to ensure compliance with the legislation.
CORPORATE SOCIAL RESPONSIBILITY
MARKETPLACEInnovating for a better world.
Kingspan started over 50 years ago with a simple mission to always work to make building better.

38 39Kingspan Group plc Annual Report & Financial Statements 2016
HEALTH AND SAFETY Kingspan has a strong reputation for health & safety in the workplace and takes seriously its responsibility for staff welfare. Every facility within the Group adopts a suite of good health & safety management systems designed to protect employees and visitors to its sites from injury and ill-health.
Last year Kingspan achieved OHSAS 18001 accreditation for more sites than ever before, including the ROSPA Gold Medal Award for having achieved nine consecutive gold awards at its largest Insulated Panels manufacturing facility in Holywell, North Wales.
TRAINING AND DEVELOPMENTImproving building performance, construction methods and ultimately people’s lives - that’s what drives our teams across the world. To achieve this Kingspan maintains the highest level of training and professional development. Each business unit takes responsibility for their own training and development programmes
based on individual and group needs. Kingspan provides opportunities to develop an international career by travelling and living abroad in its international business locations from graduates right through to senior management positions.
EQUAL OPPORTUNITIES, EMPLOYEE RIGHT AND DIVERSITYKingspan is committed to providing equal opportunities from recruitment and appointment, training and development to appraisal and promotion. Opportunities for a wide range of people free from discrimination or harassment, and in which all decisions will be based
Business & Strategic Report Corporate Social Responsibility
on work criteria and individual performance. We see diversity and inclusiveness as an essential part of our productivity, creativity and innovation.
KINGSPAN LEARNING AND INNOVATION CENTRE-KLICIn 2016 Kingspan Learning and Innovation Centre ("KLIC") was set up across the Insulated Panels division. Its purpose is to develop know-how that will result in improving functional performance, achieve excellence standards and therefore make it easier for our customers to do business with Kingspan. KLIC utilises all methods of modern communication like webinars and video.
GRADUATE PROGRAMMEIn 2016, Kingspan’s established graduate recruitment and development programme expanded internationally. A unique 12 month international training programme was rolled out where participants from across the global business work together to enhance learning and development.
This training and development programme is designed to assist each of the graduates in building self-awareness and understanding, developing skills essential for career success acquiring an understanding of some of the key functional activities in the Group and laying the foundation for the initial stages of an effective professional and personal network within the organisation. View graduate success stories at www.kingspan.com/graduates.
CORPORATE SOCIAL RESPONSIBILITY
WORKPLACE
Employee Numbers by Division Employee Numbers by Geography
55% Insulated Panels
21% Insulation Boards
10% Light & Air
10% Environmental
4% Access Floors
5% Republic of Ireland
27% UK
44% Mainland Europe
17% Americas
7% Rest of World
With over 10,000 employees worldwide Kingspan is committed to providing a safe, enterprising and exciting workplace to all employees.

40 41Kingspan Group plc Annual Report & Financial Statements 2016 Business & Strategic Report Corporate Social Responsibility
CORPORATE SOCIAL RESPONSIBILITY
COMMUNITY
HELPING EDUCATE IN CAMBODIA (1)“On behalf of the SALT School, RAW Impact would like to give a special thanks to Kingspan for your extremely generous donation of providing a high quality, insulated roof for the 200+ school kids on Gunty’s Island. For the first time, children in this village will be able to learn in a closed classroom environment, free from the elements and with a roof that will provide heat protection on hot days and deaden the sound of heavy rain in the wet season.
BUILDING ON HOPE FOR AT RISK YOUTH (2)"The Miracle on Beech Street," was the former St. Cecilia Hall - but is now home to the Officer Michael Briggs Community Center and the Manchester Police Athletic League that has served more than 8,000 at-risk youth through the years. Thanks to the generosity and dedication of one of Kingspan’s employee’s and with support from Morin, Building on Hope was able to transform this century-old structure.
HOW TO MANAGE WASTEFACTORY VISIT AND EDUCATION DAY ON WASTE CONTAINERS IN POLAND (3)School kids from Przystań Odkrywców enjoyed an educational day at Kingspan Environmental in Poland. During the visit children had the opportunity to see the manufacturing process and learn how the containers manufactured there contribute to the protection of the environment in everyday life.
M-PESA PRIMARY SCHOOL IN NAIROBI, KENYA (4)Kingspan supported the building of the M-Pesa primary school in Nairobi where children are provided with food, drinks and education. On a recent visit in 2016, Kingspan staff got to meet the children and follow their learning and development.
600K IN 5 DAYS CYCLE FOR IRISH HOSPICE FOUNDATION (5)Nine participants from Kingspan completed the 600km IHF Wild
Mediterranean Way Cycle Challenge from Perpignan to Barcelona raising over €100,000 for the Irish Hospice Foundation. This money makes a significant impact for the nurses for nightcare programme providing over 400 nights of free nursing care to affected families. Kingspan are delighted to be associated with the amazing work of the Irish Hospice Foundation and have been proud sponsors of this event for the past seven years.
GIVE & GAIN DAY (6)This annual nationwide event, organised through Business in the Community (BITC), sees a 40-strong Kingspan team joining forces with local primary schools to transform the spaces children play and learn in. In 2016 it was the turn of Cornist Park County Primary School in Flint. When the children returned after one weekend in June, they found a forest school, castle sandpit, bug hotel and outdoor classroom had been created just for them.
ENGAGING PUPILS IN CONSTRUCTION AS A CAREER (7)In Talacre in North Wales, we supported several local schools in visiting DangerPoint - an award winning interactive visitor centre offering young children the opportunity to learn about safety. Sponsoring the ‘building site scenario’ at the centre meant that we could engage pupils in the idea of construction as a career, as well as teaching them how to be safe.
KINGSPAN INSULATION COMMUNITY TRUST (8)In 2006, Kingspan Insulation set up a trust to fund local projects in the areas of biodiversity, ecology, road safety and healthy recreation for children. Over the years since the Trust was founded, we have been proud and delighted to support a huge range of local projects. From forest schools and wildlife ponds, to sports equipment and road safety gear. Even the creation of a village green conservation area.
HOMEAID ATLANTA (9)Kingspan Insulation North America and the Professional Women
in Building Council joined up with HomeAid Atlanta to make improvements at Forsyth County Family Haven, Inc. Volunteers worked diligently to prep and paint a large apartment. The space is used as transitional housing for a family working to rebuild their lives after escaping a domestic violence situation. HomeAid Atlanta firmly believes that homeless serving facilities should be welcoming, dignified environments that provide respite to families that had suffered through terrible experiences.
LAB IN A LORRY (10)Recently, Kingspan partnered up with the Institute of Physics to get a ‘lab-in-a-lorry’ to visit local secondary schools in Herefordshire. With three distinct lab areas in the lorry, groups of up to six young people at a time took part in experiments delivered by volunteers. There were no right or wrong answers, and the sessions were not simply about teaching physics. They were designed to connect the children with the subject, and to encourage their curiosity and questions.
Constructive, collaborative and caring. We recognise our role in ensuring our companies are rooted in the communities in which we operate. We do this in a number of ways - through community funding, through community volunteering and through partnerships with schools and colleges.
1 2
3
4
5
87
10
6
9
Kingspan Group plc Annual Report & Financial Statements 2016 4342 Directors' Report Chairman's Introduction42
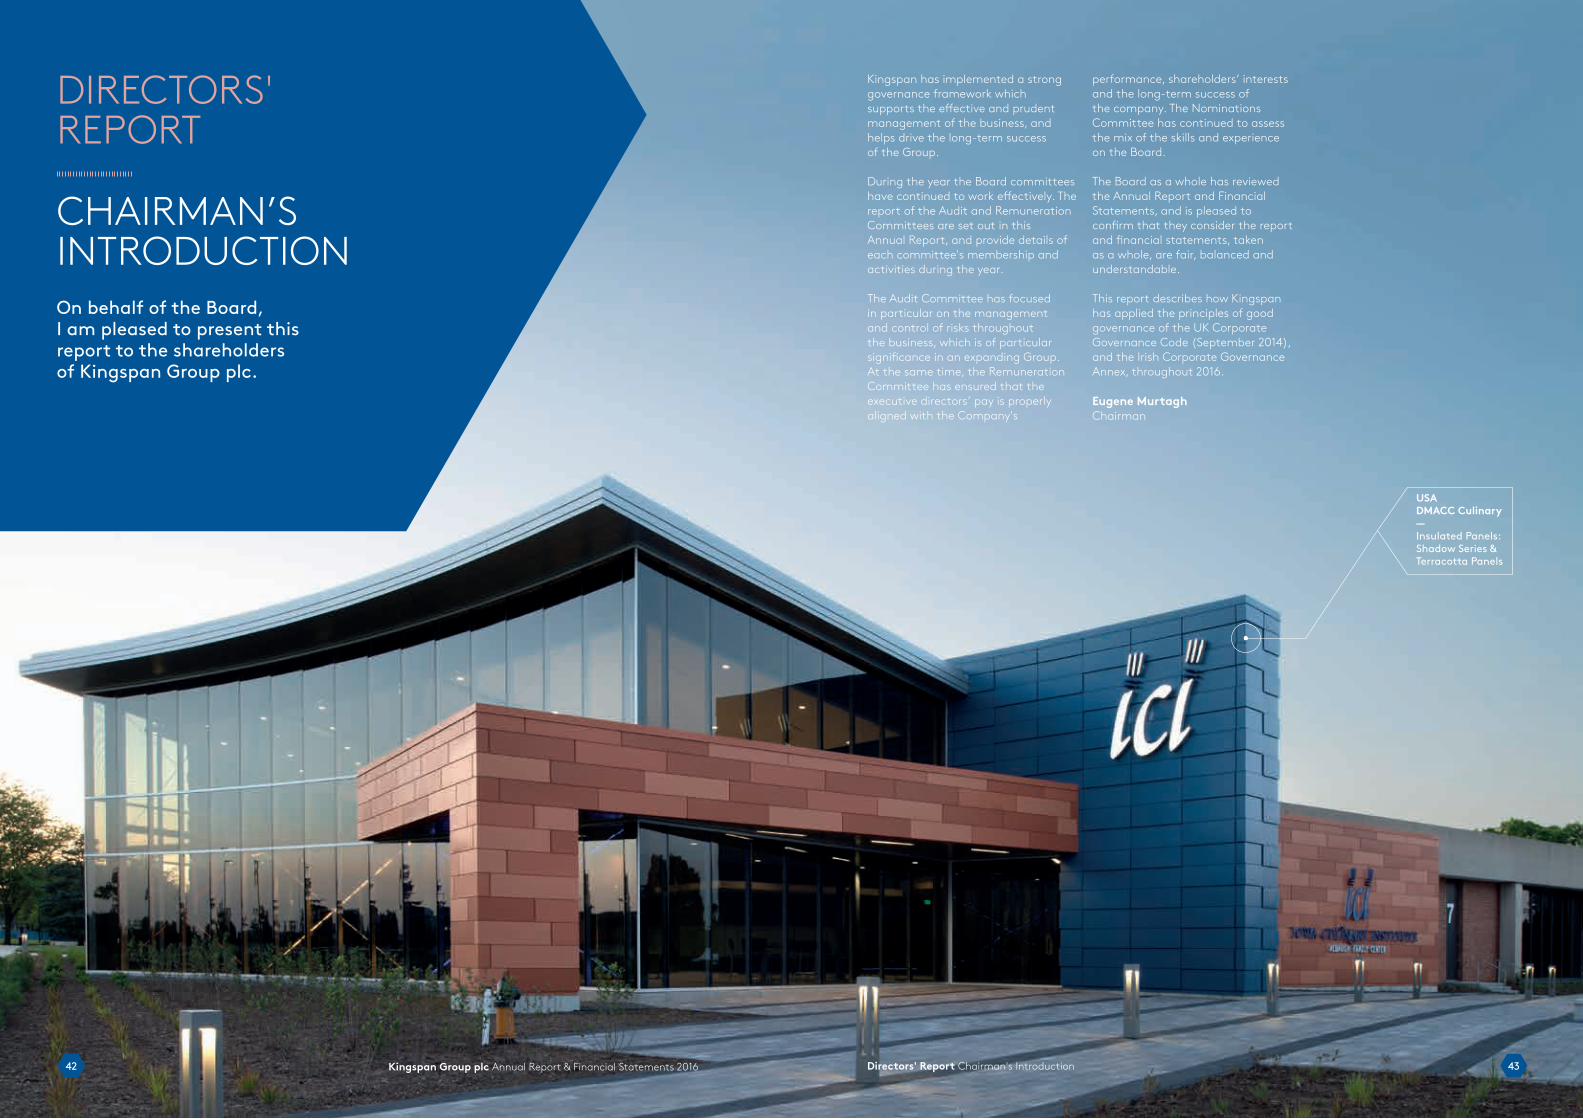
Kingspan has implemented a strong governance framework which supports the effective and prudent management of the business, and helps drive the long-term success of the Group.
During the year the Board committees have continued to work effectively. The report of the Audit and Remuneration Committees are set out in this Annual Report, and provide details of each committee's membership and activities during the year.
The Audit Committee has focused in particular on the management and control of risks throughout the business, which is of particular significance in an expanding Group. At the same time, the Remuneration Committee has ensured that the executive directors’ pay is properly aligned with the Company's
performance, shareholders’ interests and the long-term success of the company. The Nominations Committee has continued to assess the mix of the skills and experience on the Board.
The Board as a whole has reviewed the Annual Report and Financial Statements, and is pleased to confirm that they consider the report and financial statements, taken as a whole, are fair, balanced and understandable.
This report describes how Kingspan has applied the principles of good governance of the UK Corporate Governance Code (September 2014), and the Irish Corporate Governance Annex, throughout 2016.
Eugene MurtaghChairman
DIRECTORS' REPORT
CHAIRMAN’S INTRODUCTIONOn behalf of the Board, I am pleased to present this report to the shareholders of Kingspan Group plc.
USADMACC Culinary—Insulated Panels: Shadow Series & Terracotta Panels

4544 Kingspan Group plc Annual Report & Financial Statements 2016 Directors' Report The Board
Chairman
Eugene Murtagh(Age 74)
Ireland
Eugene Murtagh is the non-executive Chairman of the Group.
Key skills & experience: He founded the Kingspan business in 1965 and, as CEO until 2005, he led its growth and development to become an international market leader. He has an unrivalled understanding of the Group, its business and ethos, and brings to the Board his leadership and governance skills.
Committees: Nominations (19 years, chair).
Chief Executive Officer
Gene M. Murtagh(Age 45)
Ireland
Gene Murtagh is the Group Chief Executive Officer. He was appointed to the Board in November 1999.
Key skills & experience: He was previously the Chief Operating Officer from 2003 to 2005. Prior to that he was Managing Director of the Group’s Insulated Panel business and of the Environmental business. He joined the Group in 1993, and has a deep knowledge of all of the Group’s businesses and the wider construction materials industry.
Committees: Nominations (9½ years).
Executives
Geoff Doherty(Age 45)
Ireland
Geoff Doherty is the Group Chief Financial Officer. He joined the Group, and was appointed to the Board, in January 2011.
Key skills & experience: Prior to joining Kingspan he was the Chief Financial Officer of Greencore Group plc and Chief Executive of its property and agribusiness activities. He is a qualified chartered accountant, with extensive experience of capital markets and financial management in an international manufacturing environment.
Russell Shiels(Age 55)
United States of America
Russell Shiels is President of the Group’s Insulated Panels business in the Americas and the Group's global Access Floors business. He joined the Board in December 1996.
Key skills & experience: He has experience in many of the Group’s key businesses, and was previously Managing Director of the Group’s Building Components and Raised Access Floors businesses in the UK. He brings to the Board his particular knowledge of the North American building envelope market, as well as his understanding of the office and datacentre market globally.
Peter Wilson(Age 60)
United Kingdom
Peter Wilson is Managing Director of the Group’s Insulation Boards business. He was appointed to the Board in February 2003.
Key skills & experience: He has been with the Group since 1981, and has led the Insulation Boards division since 2001. He brings to the Board over 30 years’ knowledge and experience of the global insulation industry.
Gilbert McCarthy(Age 45)Ireland
Gilbert McCarthy is Managing Director of the Group’s Insulated Panels businesses in the UK, Ireland, Western Europe, Middle East and Australasia. He was appointed to the Board in September 2011.
Key skills & experience: He joined the Group in 1998, and has held a number of senior management positions including managing director of the Off-site division and general manager of the Insulation Boards business. He brings to the Board his extensive knowledge of the building envelope industry, in particular in Western Europe and Australasia.
Non-Executives
Helen Kirkpatrick M.B.E.
(Age 58)
United Kingdom
Independent
Helen Kirkpatrick joined the Board in June 2007.
Key skills & experience: Helen is a Fellow of the Institute of Chartered Accountants in Ireland and a member of the Chartered Institute of Marketing. She was formerly a non-executive director of the International Fund for Ireland, Enterprise Equity Venture Capital Group, Crumlin Together Ltd, NI-CO Ltd and Wireless Group plc. She brings her considerable financial and business acumen to the Board and its Committees.
Committees: Remuneration (8 years, chair), Nominations (8 years), Senior Independent Director.
External appointments: Non-executive director of Dale Farm Co-operative Limited, and a member of the Audit Committee of Queen’s University Belfast.
Qualifications: B.A., F.C.A.
Linda Hickey(Age 55)
Ireland
Independent
Linda Hickey was appointed to the Board in June 2013.
Key skills & experience: She is a registered stockbroker and the Head of Corporate Broking at Goodbody Capital Markets, where she has worked since 2004. Previously she worked at NCB Stockbrokers and Merrill Lynch. She brings to the Board her considerable knowledge and experience in capital markets and corporate governance.
Committees: Audit (3½ years), Nominations (2½ years), Remuneration (1½ year).
External appointments: Member of the board of the Irish Blood Transfusion Service.
Qualifications: B.B.S.
Michael Cawley(Age 62)IrelandIndependent
Michael Cawley was appointed to the Board in May 2014.
Key skills & experience: He is a chartered accountant, and was formerly Chief Operating Officer & Deputy Chief Executive of Ryanair. Prior to joining Ryanair he had experience in a number of different distribution and manufacturing industries, including as Finance Director of the Gowan Group, one of Ireland’s largest private companies. He brings his extensive international financial and business experience to the Board and to the Audit Committee.
Committees: Audit (2½ years, chair), Remuneration (2½ years).
External appointments: Chairman of Fáilte Ireland, and Non-executive director of Paddy Power Betfair plc, Ryanair Holdings plc, Hostelworld Group plc and Gowan Group Ltd.
Qualifications: B. Comm., F.C.A.
John Cronin(Age 57)IrelandIndependent
John Cronin was appointed to the Board in May 2014.
Key skills & experience: He is a qualified solicitor, and a partner and former chairman of McCann FitzGerald. He has more than 25 years’ experience in banking, structured finance and capital markets matters, and is a member of the International Bar Association. Since 2015 he is a council member of the British Irish Chamber of Commerce. He brings valuable legal, corporate governance and capital markets experience to the Board.
Committees: Nominations (2½ years), Audit (1½ year).
External appointments: None.
Qualifications: B.A. (Mod) Legal Science, Solicitor in Ireland and England & Wales.
Bruce McLennan(Age 52)AustraliaIndependent
Bruce McLennan was appointed to the Board in June 2015.
Key skills & experience: He is Managing Director and Co-Head of Advisory at Gresham Advisory Partners Limited. He is also a Member of the Australian Institute of Company Directors, Australian Society of Certified Practising Accountants, and a Fellow of the Securities Institute of Australia. He brings to the Board over 30 years’ experience in investment banking, and a broad knowledge of international capital markets and strategic and corporate planning.
Committees: None.
External appointments: Member of the Australian Takeovers Panel.
Qualifications: B.Bus, M. Comm.
Company Secretary
Lorcan Dowd(Age 48)Ireland
Lorcan Dowd was appointed Group Company Secretary in July 2005.
Key skills & experience He qualified as a solicitor in 1992. Before joining Kingspan he was Director of Corporate Legal Services in PwC in Belfast, having previously worked as a solicitor in private practice.
DIRECTORS' REPORT
THE BOARD
The Board provides entrepreneurial leadership and sets the governance framework for the Group.
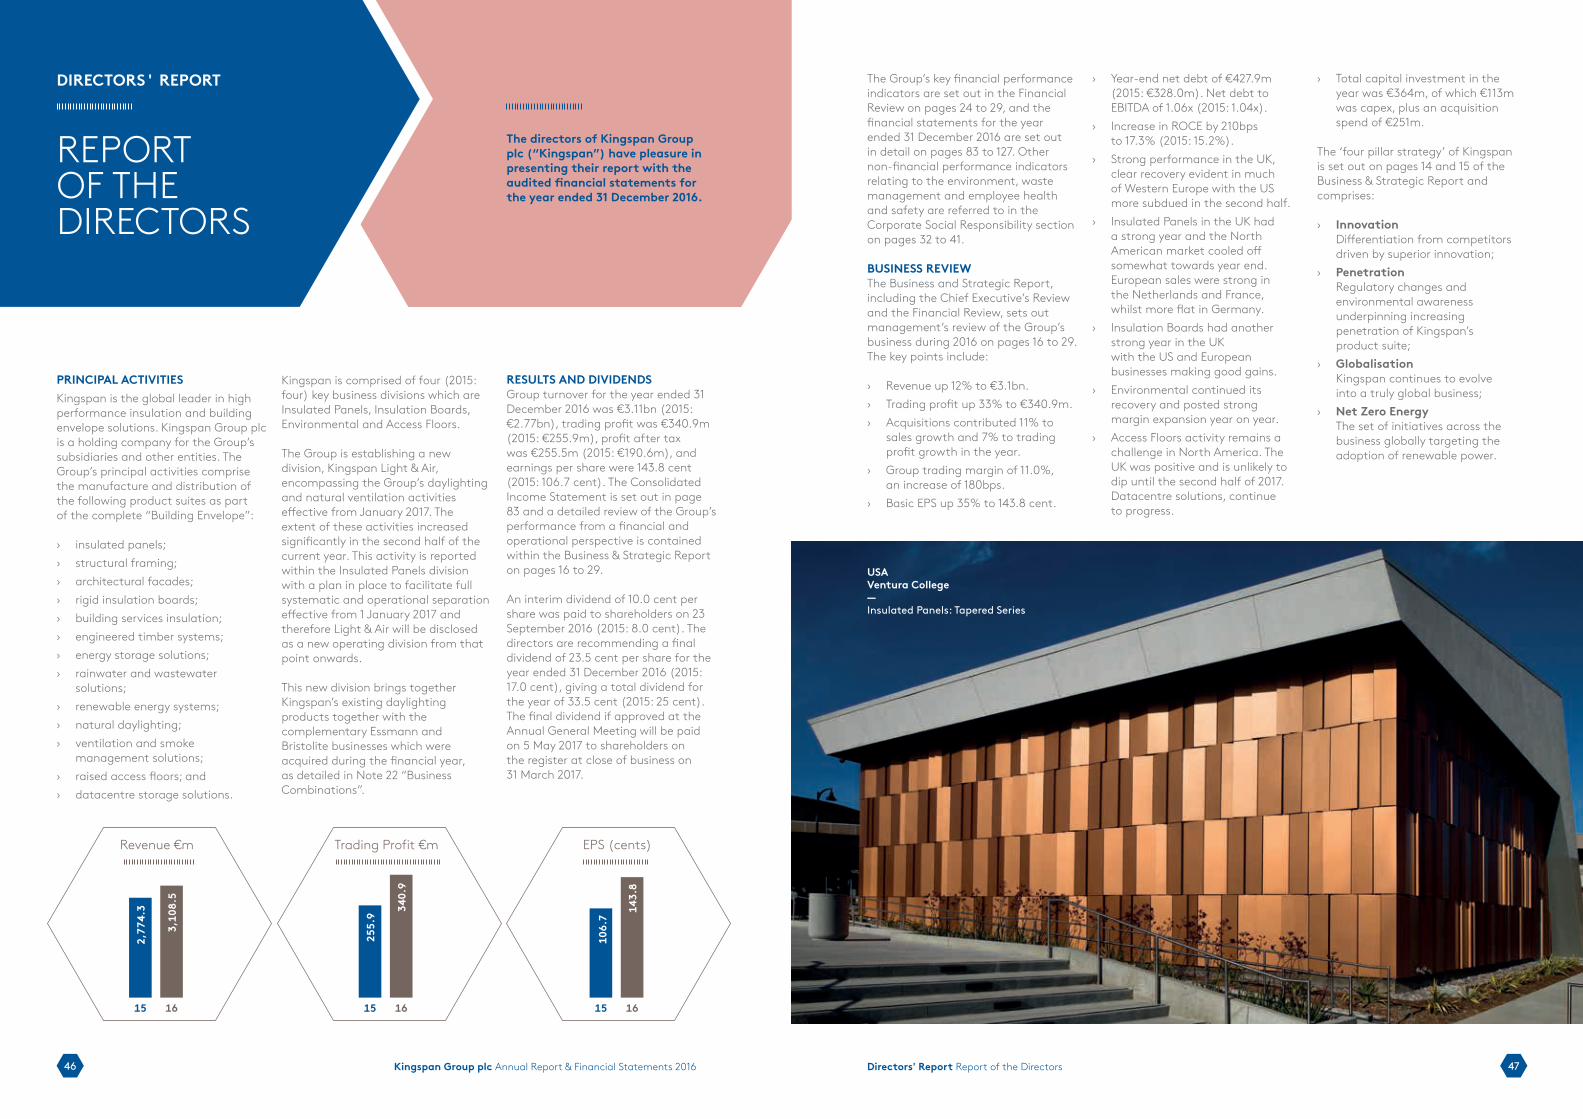
4746 Kingspan Group plc Annual Report & Financial Statements 2016 Directors' Report Report of the Directors
PRINCIPAL ACTIVITIESKingspan is the global leader in high performance insulation and building envelope solutions. Kingspan Group plc is a holding company for the Group’s subsidiaries and other entities. The Group’s principal activities comprise the manufacture and distribution of the following product suites as part of the complete “Building Envelope”:
›› insulated panels;›› structural framing;›› architectural facades;›› rigid insulation boards;›› building services insulation;›› engineered timber systems;›› energy storage solutions;›› rainwater and wastewater
solutions;›› renewable energy systems;›› natural daylighting;›› ventilation and smoke
management solutions;›› raised access floors; and›› datacentre storage solutions.
Kingspan is comprised of four (2015: four) key business divisions which are Insulated Panels, Insulation Boards, Environmental and Access Floors.
The Group is establishing a new division, Kingspan Light & Air, encompassing the Group’s daylighting and natural ventilation activities effective from January 2017. The extent of these activities increased significantly in the second half of the current year. This activity is reported within the Insulated Panels division with a plan in place to facilitate full systematic and operational separation effective from 1 January 2017 and therefore Light & Air will be disclosed as a new operating division from that point onwards.
This new division brings together Kingspan’s existing daylighting products together with the complementary Essmann and Bristolite businesses which were acquired during the financial year, as detailed in Note 22 “Business Combinations”.
RESULTS AND DIVIDENDSGroup turnover for the year ended 31 December 2016 was €3.11bn (2015: €2.77bn), trading profit was €340.9m (2015: €255.9m), profit after tax was €255.5m (2015: €190.6m), and earnings per share were 143.8 cent (2015: 106.7 cent). The Consolidated Income Statement is set out in page 83 and a detailed review of the Group’s performance from a financial and operational perspective is contained within the Business & Strategic Report on pages 16 to 29.
An interim dividend of 10.0 cent per share was paid to shareholders on 23 September 2016 (2015: 8.0 cent). The directors are recommending a final dividend of 23.5 cent per share for the year ended 31 December 2016 (2015: 17.0 cent), giving a total dividend for the year of 33.5 cent (2015: 25 cent). The final dividend if approved at the Annual General Meeting will be paid on 5 May 2017 to shareholders on the register at close of business on 31 March 2017.
The Group’s key financial performance indicators are set out in the Financial Review on pages 24 to 29, and the financial statements for the year ended 31 December 2016 are set out in detail on pages 83 to 127. Other non-financial performance indicators relating to the environment, waste management and employee health and safety are referred to in the Corporate Social Responsibility section on pages 32 to 41.
BUSINESS REVIEWThe Business and Strategic Report, including the Chief Executive’s Review and the Financial Review, sets out management’s review of the Group’s business during 2016 on pages 16 to 29. The key points include:
›› Revenue up 12% to €3.1bn. ›› Trading profit up 33% to €340.9m.›› Acquisitions contributed 11% to
sales growth and 7% to trading profit growth in the year.
›› Group trading margin of 11.0%, an increase of 180bps.
›› Basic EPS up 35% to 143.8 cent.
›› Year-end net debt of €427.9m (2015: €328.0m). Net debt to EBITDA of 1.06x (2015: 1.04x).
›› Increase in ROCE by 210bps to 17.3% (2015: 15.2%).
›› Strong performance in the UK, clear recovery evident in much of Western Europe with the US more subdued in the second half.
›› Insulated Panels in the UK had a strong year and the North American market cooled off somewhat towards year end. European sales were strong in the Netherlands and France, whilst more flat in Germany.
›› Insulation Boards had another strong year in the UK with the US and European businesses making good gains.
›› Environmental continued its recovery and posted strong margin expansion year on year.
›› Access Floors activity remains a challenge in North America. The UK was positive and is unlikely to dip until the second half of 2017. Datacentre solutions, continue to progress.
›› Total capital investment in the year was €364m, of which €113m was capex, plus an acquisition spend of €251m.
The ‘four pillar strategy’ of Kingspan is set out on pages 14 and 15 of the Business & Strategic Report and comprises:
›› Innovation Differentiation from competitors driven by superior innovation;
›› Penetration Regulatory changes and environmental awareness underpinning increasing penetration of Kingspan’s product suite;
›› Globalisation Kingspan continues to evolve into a truly global business;
›› Net Zero Energy The set of initiatives across the business globally targeting the adoption of renewable power.
DIRECTORS' REPORT
REPORT OF THE DIRECTORS
The directors of Kingspan Group plc (“Kingspan”) have pleasure in presenting their report with the audited financial statements for the year ended 31 December 2016.
USAVentura College—Insulated Panels: Tapered Series
2,77
4.3
3,10
8.5
15 16
255.
9
106.
7
340.
9
143.
8
15 1516 16
Revenue €m Trading Profit €m EPS (cents)

49Directors' Report Report of the Directors48 Kingspan Group plc Annual Report & Financial Statements 2016
During 2016, Kingspan made significant progress in pursuit of this strategy with Kingspan continuing to deliver growth year on year. This strategy will remain the focus of the execution of Kingspan's strategic plan for the foreseeable future.
PRINCIPAL RISKS AND UNCERTAINTIESKingspan is required under Section 327(1)(b) of the Companies Act 2014 and Regulation 5(4)(c)(ii) of the Transparency Directive (2004/109/EC) Regulations 2007 to give a description of the principal risks and uncertainties facing the Group. These risks and the actions taken by Kingspan to mitigate them are detailed on pages 30 and 31 of the Risk & Risk Management Report. The principal risks are:
›› Volatility in the macro environment;
›› Failure to innovate;›› Product failure;›› Business interruption
(including IT continuity);›› Credit risk and credit control;›› Employee development & retention;›› Fraud & cybercrime; and›› Acquisition and integration
of new businesses.
KEY PERFORMANCE INDICATORSThe directors are pleased to report on the very positive performance during 2016 against all of its key performance indicators. A detailed commentary incorporating key performance indicators is contained within the Financial Review on pages 24 to 29. A number of the key performance indicators have been included in more detail on page 128 "Alternative Performance Measures". The key performance indicators for Kingspan upon which particular emphasis is placed upon are:
Financial›› Basic EPS growth;›› Sales growth;›› Trading margin;›› Free cash flow;›› Return on capital employed;›› Net debt/EBITDA.
Non-financial›› Net Zero Energy;›› Carbon Disclosure Project;›› New Product Development.
INNOVATIONKingspan places considerable emphasis on innovation and development of existing and new products and on the improvement of the production process, focused primarily on differentiation and extending competitive advantage. In the year ended 31 December 2016, the Group’s research and development expenditure amounted to €24.2m (2015: €20.2m). Research and development expenditure is generally written off in the year in which it is incurred. During 2016 Kingspan’s continuing investment in research and development involved over 40 key projects. These key projects included:
›› QuadCore; ›› Optim-R E;›› Next generation Kooltherm®
100 range; ›› Prismatic daylighting development;›› Cleanroom systems product
development;›› Integrated solar PowerPanel; and›› New Access Floors
datacentre products.
CORPORATE GOVERNANCEThe directors are committed to achieving the highest standards of corporate governance. A statement describing how Kingspan has applied the principles of good governance set out in the UK Corporate Governance Code (September 2014) and the Irish Corporate Governance Annex is included in the Governance section of this Annual Report on pages 54 to 60. The Corporate Governance Statement is treated as forming part of this Report.
CODE OF CONDUCTKingspan is committed to acting responsibly in its business and maintaining high standards of ethics and integrity in all of its dealings with it stakeholders, be they investors, customers, suppliers, its people or the community it operates in. Kingspan
has a Code of Conduct which sets the standard by which all employees across the Group are expected to conduct themselves. The Code sets out the fundamental principles which all directors, officers and employees of Kingspan are required to adhere to in meeting those standards.
CORPORATE SOCIAL RESPONSIBILITY Kingspan recognises the importance of conducting its business in a socially responsible manner. The Corporate Social Responsibility section in this Annual Report on pages 32 to 41 gives details of some of the projects that are on-going across the Group, with further details available on the Group’s website (www.kingspan.com).
SUSTAINABILITYOur sustainability vision is to be a global leader in sustainable business and establish a leading position in providing ethical, renewable and affordable best practice solutions for the construction sector. We know that the built economy has an important part to play in combatting climate change, and we pledge to take the lead. Our commitment to sustainability is instilled at every level of the company and at every step in the manufacturing process. Our goal is that by 2020 all of Kingspan’s energy needs will be met by renewable energy.
ACCOUNTING RECORDSThe directors are responsible for ensuring that accounting records, as outlined in Sections 281 to 285 of the Companies Act 2014, are kept by the Group. The directors have provided appropriate systems and resources, including the appointment of suitably qualified accounting personnel, to maintain adequate accounting records throughout the Group, in order to ensure that the requirements of Sections 281 to 285 are complied with. The accounting records of the Company are maintained at the principal executive offices located at Dublin Road, Kingscourt, Co. Cavan, A82 XY31, Ireland.
AustraliaLoreto College—Insulation Boards: Kooltherm K5 External Wall Board, Kooltherm K12 Framing Board
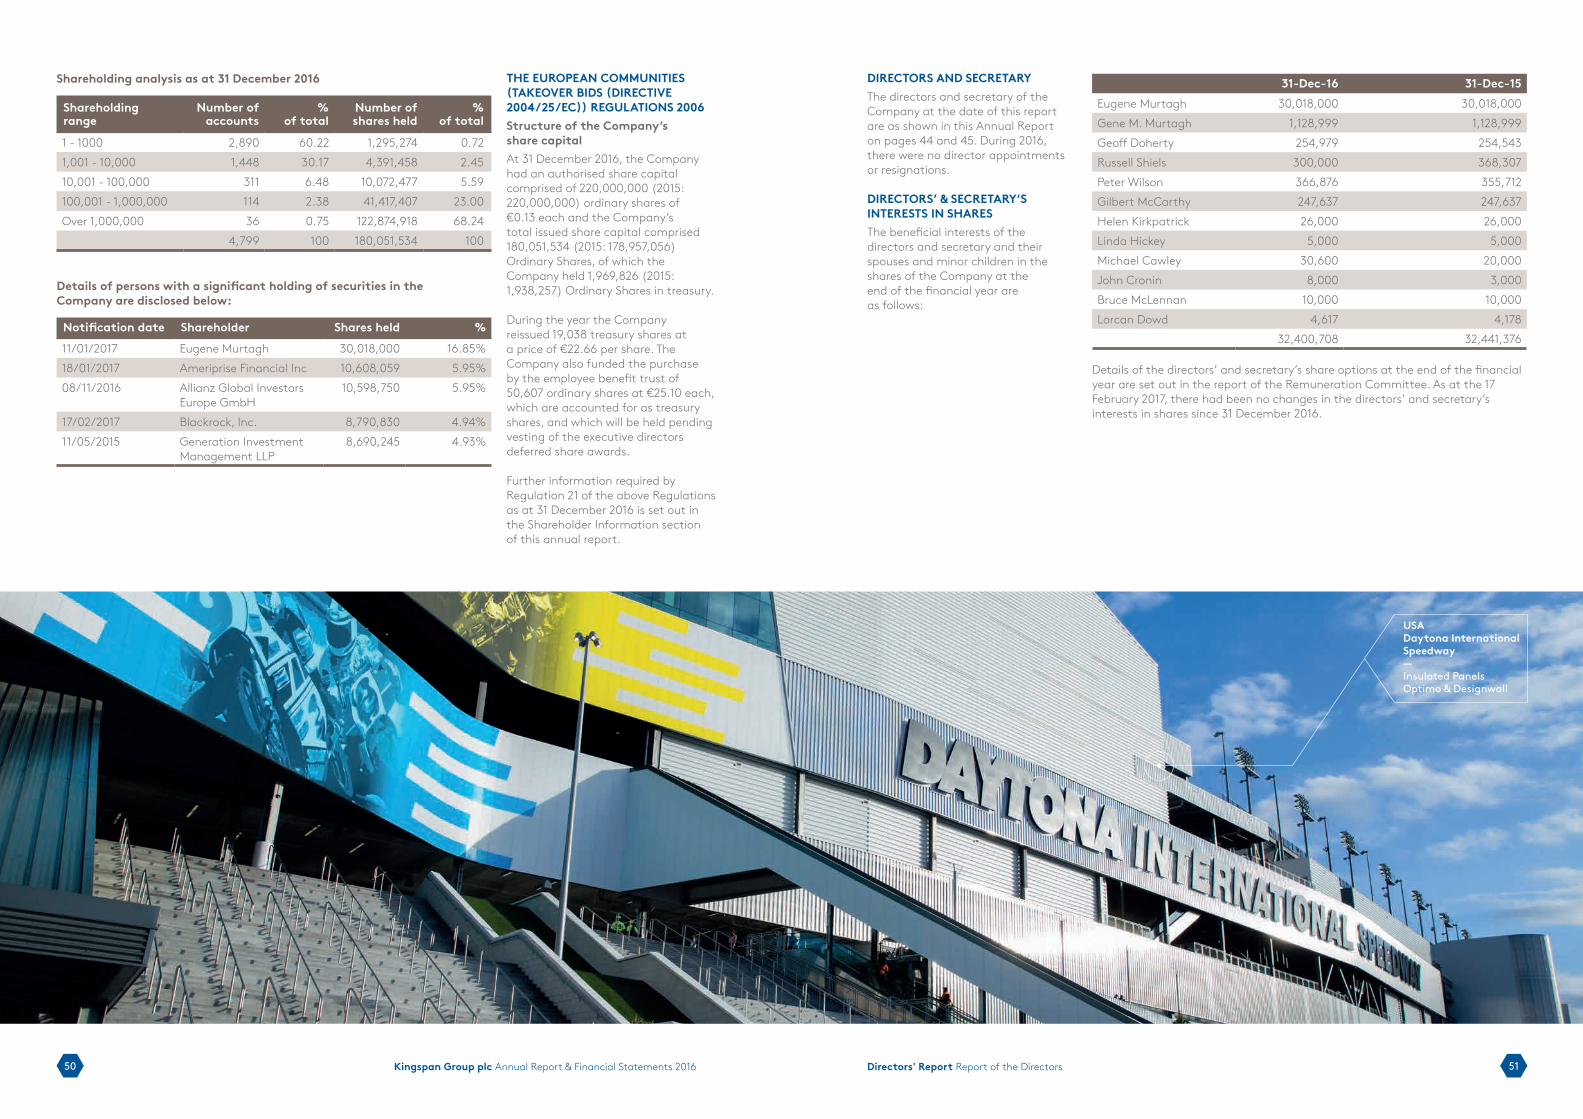
5150 Kingspan Group plc Annual Report & Financial Statements 2016 Directors' Report Report of the Directors
Shareholding analysis as at 31 December 2016
Shareholding range
Number of accounts
% of total
Number of shares held
% of total
1 - 1000 2,890 60.22 1,295,274 0.721,001 - 10,000 1,448 30.17 4,391,458 2.4510,001 - 100,000 311 6.48 10,072,477 5.59100,001 - 1,000,000 114 2.38 41,417,407 23.00Over 1,000,000 36 0.75 122,874,918 68.24
4,799 100 180,051,534 100
Details of persons with a significant holding of securities in the Company are disclosed below:
Notification date Shareholder Shares held %
11/01/2017 Eugene Murtagh 30,018,000 16.85%18/01/2017 Ameriprise Financial Inc 10,608,059 5.95%08/11/2016 Allianz Global Investors
Europe GmbH10,598,750 5.95%
17/02/2017 Blackrock, Inc. 8,790,830 4.94%11/05/2015 Generation Investment
Management LLP8,690,245 4.93%
DIRECTORS AND SECRETARYThe directors and secretary of the Company at the date of this report are as shown in this Annual Report on pages 44 and 45. During 2016, there were no director appointments or resignations.
DIRECTORS’ & SECRETARY’S INTERESTS IN SHARESThe beneficial interests of the directors and secretary and their spouses and minor children in the shares of the Company at the end of the financial year are as follows:
THE EUROPEAN COMMUNITIES (TAKEOVER BIDS (DIRECTIVE 2004/25/EC)) REGULATIONS 2006Structure of the Company’s share capital At 31 December 2016, the Company had an authorised share capital comprised of 220,000,000 (2015: 220,000,000) ordinary shares of €0.13 each and the Company’s total issued share capital comprised 180,051,534 (2015: 178,957,056) Ordinary Shares, of which the Company held 1,969,826 (2015: 1,938,257) Ordinary Shares in treasury.
During the year the Company reissued 19,038 treasury shares at a price of €22.66 per share. The Company also funded the purchase by the employee benefit trust of 50,607 ordinary shares at €25.10 each, which are accounted for as treasury shares, and which will be held pending vesting of the executive directors deferred share awards.
Further information required by Regulation 21 of the above Regulations as at 31 December 2016 is set out in the Shareholder Information section of this annual report.
31-Dec-16 31-Dec-15Eugene Murtagh 30,018,000 30,018,000Gene M. Murtagh 1,128,999 1,128,999Geoff Doherty 254,979 254,543Russell Shiels 300,000 368,307Peter Wilson 366,876 355,712Gilbert McCarthy 247,637 247,637Helen Kirkpatrick 26,000 26,000Linda Hickey 5,000 5,000Michael Cawley 30,600 20,000John Cronin 8,000 3,000Bruce McLennan 10,000 10,000Lorcan Dowd 4,617 4,178
32,400,708 32,441,376
Details of the directors’ and secretary’s share options at the end of the financial year are set out in the report of the Remuneration Committee. As at the 17 February 2017, there had been no changes in the directors’ and secretary’s interests in shares since 31 December 2016.
USADaytona International Speedway—Insulated Panels Optimo & Designwall

5352 Kingspan Group plc Annual Report & Financial Statements 2016 Directors' Report Report of the Directors
CONFLICTS OF INTERESTNone of the directors have any direct or indirect interest in any contract or arrangement subsisting at the date hereof which is significant in relation to the business of the Company or any of its subsidiaries nor in the share capital of the Company or any of its subsidiaries.
FINANCIAL INSTRUMENTSIn the normal course of business, the Group has exposure to a variety of financial risks, including foreign currency risk, interest rate risk, liquidity risk, and credit risk. The Company’s financial risk objectives and policies are set out in Note 19 of the financial statements.
POLITICAL DONATIONSNeither the Company nor any of its subsidiaries have made any political donations in the year which would be required to be disclosed under the Electoral Act 1997.
SUBSIDIARY COMPANIESThe Group operates from 101 manufacturing sites, and has operations in over 70 countries worldwide.
The Company’s principal subsidiary undertakings at 31 December 2016, country of incorporation and nature of business are listed on pages 133 to 137 of this annual report.
The Company does not have any branches outside of Ireland.
OUTLOOKThe Board fully endorses the outlook (“Looking Ahead”) expressed in the Chief Executive’s Review on page 23.
SIGNIFICANT EVENTS SINCE YEAR ENDThere have been no significant events since the year end.
GOING CONCERNThe directors have reviewed budgets and projected cash flows for a period of not less than 12 months from the date of this Annual Report, and considered its net debt position, available committed banking facilities and other relevant information including the economic conditions currently affecting the building environment generally and the Group’s strategic plan. On the basis of this review the directors
have concluded that there are no material uncertainties that would cast significant doubt over the Company’s and the Group’s ability to continue as a going concern. For this reason, the directors consider it appropriate to adopt the going concern basis in preparing the financial statements.
VIABILITY STATEMENTIn accordance with provision C.2.2 of the 2014 UK Corporate Governance Code, the directors are required to assess the prospects of the Company, explain the period over which we have done so and state whether we have a reasonable expectation that the Company will be able to continue in operation and meet liabilities as they fall due over this period of assessment.
The directors have assessed the prospects of the Group over the three-year period to February 2020.
The directors concluded that three years was an appropriate period for the assessment, having had regard to:
›› the Group’s rolling strategic plan which extends to 2020;
›› the Group’s long-term funding commitments some of which fall to be repaid during the period;
›› the inherent short-cycle nature of the construction market including the Group’s order bank and project pipeline; and
›› the potential impact of macro-economic events such as the EU Referendum in the UK and political uncertainty in some regions.
It is recognised that such future assessments are subject to a level of uncertainty that increases with time, and therefore future outcomes cannot be guaranteed or predicted with certainty.
The Group strategic plan is approved by the Board, building upon the several divisional management plans as well as the Group’s strategic goals. It is based on a number of cautious assumptions concerning macro growth and stability in our key markets, and continued access to capital to support the Group’s ongoing investments. The strategic plan is subject to stress testing which involves flexing a number of the main assumptions underlying the forecast in severe but reasonable scenarios. Such
assumptions are rigorously tested by management and the directors. It is reviewed and updated annually and was considered and approved by the Board at its meeting in October 2016.
In making this assessment, the directors have considered the resilience of the Group, taking account of its current position and the principal risks facing the business as outlined in the Risk & Risk Management Report on pages 30 and 31, and the Group’s ability to manage those risks. The risks have been identified using a top-down and bottom-up approach, and their potential impact was assessed having regard to the effectiveness of controls in place to manage each risk. In assessing the prospects of the Group such potential impacts have been considered as having the mitigating factors in place.
Based on this assessment the directors have a reasonable expectation that the Group will be able to continue in operation and meet its liabilities as they fall due over the three-year period of their assessment.
DIRECTORS’ RESPONSIBILITY STATEMENTEach of the directors whose names and functions are set out in the Board section of this Annual Report confirm their responsibility for preparing the Annual Report and the consolidated and company financial statements in accordance with applicable Irish law and regulations.
Company law in Ireland requires the directors to prepare financial statements for each financial year. Under that law the directors have to prepare the consolidated financial statements in accordance with International Financial Reporting Standards (IFRSs) as adopted by the European Union (EU). The directors have elected to prepare the company financial statements in accordance with IFRSs as adopted by the EU and as applied by the Companies Act 2014. The financial statements are required by law to give a true and fair view of the assets, liabilities and financial position of the Group and company and of the profit or loss of the Group for that period.
In preparing those financial statements, the directors are required to:
›› select suitable accounting policies and then apply them consistently;
›› make judgements and estimates that are reasonable and prudent;
›› state whether applicable IFRSs have been followed, subject to any material departures disclosed and explained in the financial statements; and
›› prepare the financial statements on the going concern basis unless it is inappropriate to presume that the Company, and the Group as a whole, will continue in business.
The directors are responsible for keeping accounting records which disclose with reasonable accuracy at any time the financial position of the Group and the Company and which enable them to ensure that the financial statements comply with the Companies Act 2014 and Article 4 of the IAS Regulation.
They are responsible for safeguarding the assets of the Group and the Company and hence for taking reasonable steps for the prevention and detection of fraud and other irregularities.
The directors are responsible for the maintenance and integrity of the corporate and financial information on the Company’s website. Legislation in the Republic of Ireland governing the preparation and dissemination of financial statements may differ from legislation in other jurisdictions.
In accordance with Transparency (Directive 2004/109/EC) Regulations 2007 and the Transparency Rules of the Financial Regulator, the directors confirm that to the best of their knowledge: ›› the Group financial statements
and the Company financial statements, prepared in accordance with the applicable set of accounting standards, give a true and fair view of the assets, liabilities, financial position and profit or loss of the Group and Company; and
›› the Report of the Directors includes a fair review of the development and performance of the business and the position of the Group and Company, together with a description of the principal risks and uncertainties that they face.
They are also satisfied in compliance with provision C.1.1 of the UK Corporate Governance Code (September 2014): ›› that the Annual Report and
financial statements, taken as a whole, is fair, balanced and understandable and provides the information necessary for shareholders to assess the Group’s position, business model and strategy.
DIRECTORS’ COMPLIANCE STATEMENTThe directors acknowledge that they are responsible for securing the Company’s compliance with its relevant obligations in accordance with Section 225(2)(a) of the Companies Act 2014 (the “Act”) (described below as the “Relevant Obligations”).
In accordance with Section 225 (2)(b) of the Act, the directors confirm that they have:
i. drawn up a Compliance Policy Statement setting out the Company’s policies (that are, in the opinion of the directors, appropriate to the Company) in respect of the compliance by the Company with its Relevant Obligations;
ii. put in place appropriate arrangements or structures that, in the opinion of the directors, provide a reasonable assurance of compliance in all material respects with the Company’s Relevant Obligations; and
iii. during the financial year to which this report relates, conducted a review of the arrangements or structures that the directors have put in place to ensure material compliance with the Company’s Relevant Obligations.
AUDIT INFORMATIONEach of the directors has taken all the steps that they should or ought to have taken as a director in order to make himself or herself aware of any relevant audit information and to establish that the Group’s statutory auditors are aware of that information. So far as the directors are aware, there is no relevant information of which the Group’s statutory auditors are unaware.
AUDITORIn accordance with Section 383(2) of the Companies Act 2014 the Company’s auditors, KPMG, Chartered Accountants, will continue in office. A resolution authorising the directors to determine their remuneration will be proposed at the Annual General Meeting.
On Behalf Of The Board
Gene M. Murtagh, Chief Executive Officer
Geoff Doherty, Chief Financial Officer
17 February 2017
UKNext Doncaster Distribution Centre—Insulated Panels: Rooftop Solar PV
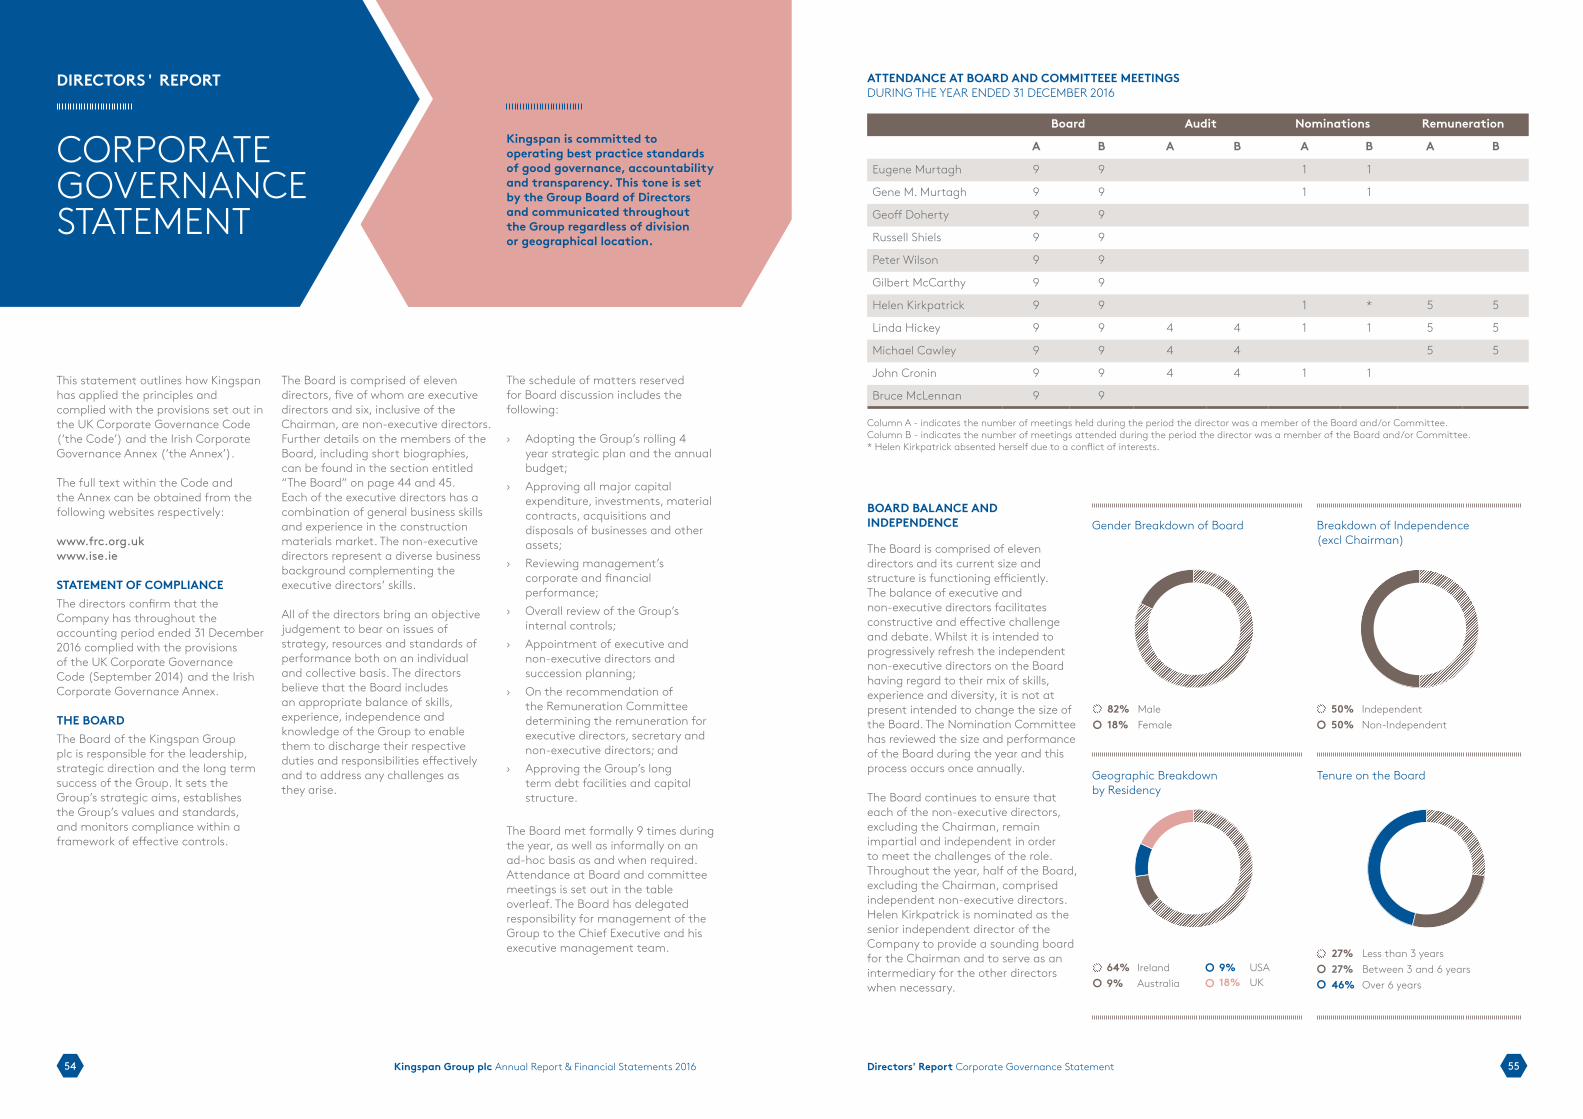
5554 Kingspan Group plc Annual Report & Financial Statements 2016 Directors' Report Corporate Governance Statement
ATTENDANCE AT BOARD AND COMMITTEEE MEETINGS DURING THE YEAR ENDED 31 DECEMBER 2016
Board Audit Nominations Remuneration
A B A B A B A B
Eugene Murtagh 9 9 1 1
Gene M. Murtagh 9 9 1 1
Geoff Doherty 9 9
Russell Shiels 9 9
Peter Wilson 9 9
Gilbert McCarthy 9 9
Helen Kirkpatrick 9 9 1 * 5 5
Linda Hickey 9 9 4 4 1 1 5 5
Michael Cawley 9 9 4 4 5 5
John Cronin 9 9 4 4 1 1
Bruce McLennan 9 9
Column A - indicates the number of meetings held during the period the director was a member of the Board and/or Committee.Column B - indicates the number of meetings attended during the period the director was a member of the Board and/or Committee. * Helen Kirkpatrick absented herself due to a conflict of interests.
This statement outlines how Kingspan has applied the principles and complied with the provisions set out in the UK Corporate Governance Code (‘the Code’) and the Irish Corporate Governance Annex (‘the Annex’).
The full text within the Code and the Annex can be obtained from the following websites respectively:
www.frc.org.ukwww.ise.ie
STATEMENT OF COMPLIANCEThe directors confirm that the Company has throughout the accounting period ended 31 December 2016 complied with the provisions of the UK Corporate Governance Code (September 2014) and the Irish Corporate Governance Annex.
THE BOARD The Board of the Kingspan Group plc is responsible for the leadership, strategic direction and the long term success of the Group. It sets the Group’s strategic aims, establishes the Group’s values and standards, and monitors compliance within a framework of effective controls.
The Board is comprised of eleven directors, five of whom are executive directors and six, inclusive of the Chairman, are non-executive directors. Further details on the members of the Board, including short biographies, can be found in the section entitled “The Board” on page 44 and 45. Each of the executive directors has a combination of general business skills and experience in the construction materials market. The non-executive directors represent a diverse business background complementing the executive directors’ skills.
All of the directors bring an objective judgement to bear on issues of strategy, resources and standards of performance both on an individual and collective basis. The directors believe that the Board includes an appropriate balance of skills, experience, independence and knowledge of the Group to enable them to discharge their respective duties and responsibilities effectively and to address any challenges as they arise.
The schedule of matters reserved for Board discussion includes the following:
›› Adopting the Group’s rolling 4 year strategic plan and the annual budget;
›› Approving all major capital expenditure, investments, material contracts, acquisitions and disposals of businesses and other assets;
›› Reviewing management’s corporate and financial performance;
›› Overall review of the Group’s internal controls;
›› Appointment of executive and non-executive directors and succession planning;
›› On the recommendation of the Remuneration Committee determining the remuneration for executive directors, secretary and non-executive directors; and
›› Approving the Group’s long term debt facilities and capital structure.
The Board met formally 9 times during the year, as well as informally on an ad-hoc basis as and when required. Attendance at Board and committee meetings is set out in the table overleaf. The Board has delegated responsibility for management of the Group to the Chief Executive and his executive management team.
DIRECTORS' REPORT
CORPORATE GOVERNANCE STATEMENT
Kingspan is committed to operating best practice standards of good governance, accountability and transparency. This tone is set by the Group Board of Directors and communicated throughout the Group regardless of division or geographical location.
Gender Breakdown of Board
Geographic Breakdown by Residency
Breakdown of Independence (excl Chairman)
Tenure on the Board
27% Less than 3 years27% Between 3 and 6 years46% Over 6 years
82% Male18% Female
9% USA18% UK
64% Ireland9% Australia
50% Independent50% Non-Independent
BOARD BALANCE AND INDEPENDENCE
The Board is comprised of eleven directors and its current size and structure is functioning efficiently. The balance of executive and non-executive directors facilitates constructive and effective challenge and debate. Whilst it is intended to progressively refresh the independent non-executive directors on the Board having regard to their mix of skills, experience and diversity, it is not at present intended to change the size of the Board. The Nomination Committee has reviewed the size and performance of the Board during the year and this process occurs once annually.
The Board continues to ensure that each of the non-executive directors, excluding the Chairman, remain impartial and independent in order to meet the challenges of the role. Throughout the year, half of the Board, excluding the Chairman, comprised independent non-executive directors. Helen Kirkpatrick is nominated as the senior independent director of the Company to provide a sounding board for the Chairman and to serve as an intermediary for the other directors when necessary.

5756 Kingspan Group plc Annual Report & Financial Statements 2016 Directors' Report Corporate Governance Statement
In accordance with the Code, the following matters were considered in determining the independence of the Board:
›› have they been an employee of the Group within the last five years;
›› have they within the last three years, had a material business relationship with the Group;
›› have they received additional remuneration apart from a Director’s fee;
›› have they close ties with any of the company’s advisers, directors or senior employees;
›› do they represent a significant shareholder or have significant links with other directors through their involvement in other companies or bodies; or
›› have they served on the Board for more than nine years from the date of their first election.
The directors consider that there is a strong independent representation on the Board. The Board considers that Helen Kirkpatrick, Linda Hickey, Michael Cawley, John Cronin and Bruce McLennan are independent, having regard to the criteria above.
In determining the independence of Helen Kirkpatrick, the Board had due regard to her length of service as a non-executive director on the Board. However, having considered the circumstances, the Board formed the view that she has always expressed a strongly independent voice at the Board and its Committee meetings, including the Remuneration Committee of which she is chairman, and that she has always exercised her judgement as a non-executive director and as the Senior Independent Director independent of any other relationships within the Board. Her independence and her sound judgement have also been recognised in her other external appointments.
In determining the independence of Linda Hickey, the Board had due regard to her position as a senior executive at Goodbody stockbrokers, one of the Company’s corporate brokers. Having regard to the fact that the level of fees and expenses paid to Goodbody stockbrokers in respect of their role as the Company’s corporate brokers is less than €50,000 per annum, the committee concluded that there was no material relationship, financial or otherwise,
which might either directly or indirectly influence her judgement.
When considering John Cronin’s independence, the Board had due regard to his position as a partner at McCann FitzGerald, one of the Company’s legal advisers. Mr Cronin is not engaged directly in the provision of legal advice to the Company and appropriate arrangements have been put in place within McCann FitzGerald to ensure that no conflict of interest could arise in the future. The total fees paid to McCann FitzGerald during the year (details of which are set out in Note 33) account for less than 1% of McCann’s FitzGerald’s annual revenues. In these circumstances the Board concluded that there was no material relationship, financial or otherwise, which might either directly or indirectly influence his judgement.
The Board therefore concluded that neither Ms Kirkpatrick’s, Ms Hickey’s nor Mr Cronin’s independence was affected and considers that between them they bring valuable financial, capital markets, governance and legal risk experience to the Board.
APPOINTMENTS TO THE BOARDAll appointments to the Board are made on the recommendation of the Nominations Committee. In addition, the Nominations Committee reviews the various committees and makes recommendations to the Board on the appointment of the chairman and the membership of each. This is a formal, rigorous and transparent procedure. The standard terms of appointment of non-executive directors are available, on request, from the Company Secretary. Further details of the activities of the Nominations Committee during the year are set out elsewhere in this section.
INFORMATION AND PROFESSIONAL DEVELOPMENT The Group Chairman is responsible for ensuring that all directors are supplied with appropriate and timely information for Board and committee meetings. Such information is always provided to the Board in a timely manner which gives the directors the opportunity to probe and question the executives when deemed relevant. Kingspan ensures that the directors obtain all professional advice required
in order to further their duties as a director either through the directors seeking professional advice at the expense of the Company or through independent professional advisors being available for consultation with the Board and attending Board and Committee meetings where required. All directors have access to the advice and services of the Company Secretary. The Group has arranged appropriate insurance cover in respect of legal action against its directors.
The Company has procedures whereby directors (including non-executive directors) receive formal induction and familiarisation with Kingspan’s business operations and systems on appointment. They are brought to the businesses manufacturing sites as part of the induction procedure with in-depth explanations of the processes involved at the site. All directors receive continuing training relating to the discharge of their duties as directors, including legislative changes and developments in accounting, governance and other standards as appropriate. The Board also meets with key executives within the Group during the year, and visits to the
Group’s manufacturing facilities are arranged twice annually.
PERFORMANCE EVALUATIONKingspan has in place formal procedures for the evaluation of its Board, Committees and individual directors. The purpose of this formal evaluation is to ensure that the Board of Directors (on a collective and individual basis) is performing effectively and to ensure stakeholder confidence in the Board.
The Chairman reviews annually the performance of the Board of Directors, the conduct of Board meetings and committee meetings, and the general corporate governance of the Group. An externally facilitated review of the Board’s performance was carried out in 2014, and progress against its agreed action points was monitored during the 2016 review.
In addition the non-executive directors, led by the senior independent Director, meet annually without the Chairman present to conduct a review of the Board and appraise the Chairman’s performance.
THE CHAIRMAN AND CHIEF EXECUTIVEThere is a clear division of responsibility set out in writing between the non-executive Chairman and the Chief Executive. Further information on the roles and responsibilities of the Board can be found in the graph below.
The Board has delegated executive responsibility for running the Group to the Chief Executive and the executive management team. The Chief Executive is responsible for the strategic direction and the overall performance of the Group, and is accountable to the Board for all authority so delegated.
All directors have access to the advice and services of the Company Secretary who is responsible for ensuring that Board procedures are followed. He is also responsible for advising the Board, through the Chairman, on all governance matters.
The Senior Independent Director of the Company is available to shareholders who have concerns that cannot be addressed through the Chairman, Chief Executive or Chief Financial Officer. She also leads an annual meeting with the non-executive directors to appraise the workings of the Board.
The Chairman’s primary responsibility is to lead the Board. He is responsible for setting the Board’s agenda and for the efficient and effective working of the Board. He ensures that all members of the Board, including in particular the non-executive directors, have an opportunity to contribute effectively and openly. He is also responsible for ensuring that there is appropriate and timely communication with shareholders.
USAMalone Hall, Johns Hopkins University—Access Floors: Ivory Black Terrazzo tile
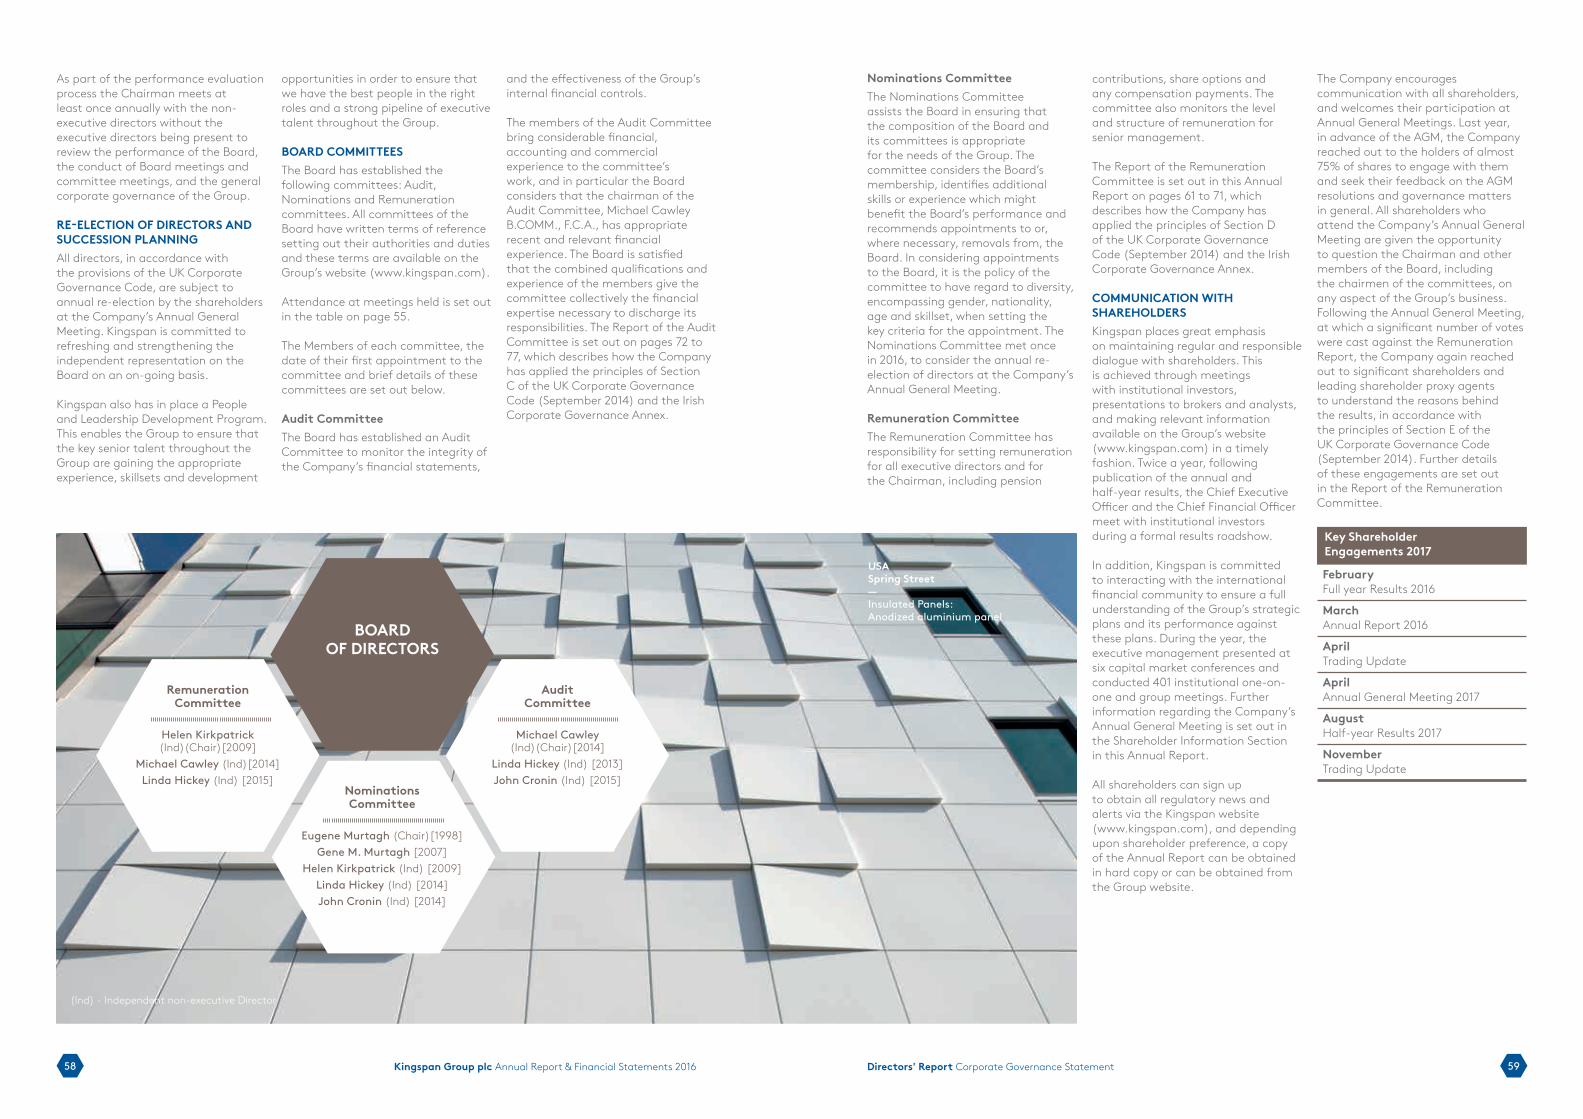
5958 Kingspan Group plc Annual Report & Financial Statements 2016 Directors' Report Corporate Governance Statement
As part of the performance evaluation process the Chairman meets at least once annually with the non-executive directors without the executive directors being present to review the performance of the Board, the conduct of Board meetings and committee meetings, and the general corporate governance of the Group.
RE-ELECTION OF DIRECTORS AND SUCCESSION PLANNINGAll directors, in accordance with the provisions of the UK Corporate Governance Code, are subject to annual re-election by the shareholders at the Company’s Annual General Meeting. Kingspan is committed to refreshing and strengthening the independent representation on the Board on an on-going basis.
Kingspan also has in place a People and Leadership Development Program. This enables the Group to ensure that the key senior talent throughout the Group are gaining the appropriate experience, skillsets and development
opportunities in order to ensure that we have the best people in the right roles and a strong pipeline of executive talent throughout the Group.
BOARD COMMITTEESThe Board has established the following committees: Audit, Nominations and Remuneration committees. All committees of the Board have written terms of reference setting out their authorities and duties and these terms are available on the Group’s website (www.kingspan.com).
Attendance at meetings held is set out in the table on page 55.
The Members of each committee, the date of their first appointment to the committee and brief details of these committees are set out below.
Audit CommitteeThe Board has established an Audit Committee to monitor the integrity of the Company’s financial statements,
and the effectiveness of the Group’s internal financial controls.
The members of the Audit Committee bring considerable financial, accounting and commercial experience to the committee’s work, and in particular the Board considers that the chairman of the Audit Committee, Michael Cawley B.COMM., F.C.A., has appropriate recent and relevant financial experience. The Board is satisfied that the combined qualifications and experience of the members give the committee collectively the financial expertise necessary to discharge its responsibilities. The Report of the Audit Committee is set out on pages 72 to 77, which describes how the Company has applied the principles of Section C of the UK Corporate Governance Code (September 2014) and the Irish Corporate Governance Annex.
(Ind) - Independent non-executive Director
Board of Directors
Nominations CommitteeThe Nominations Committee assists the Board in ensuring that the composition of the Board and its committees is appropriate for the needs of the Group. The committee considers the Board’s membership, identifies additional skills or experience which might benefit the Board’s performance and recommends appointments to or, where necessary, removals from, the Board. In considering appointments to the Board, it is the policy of the committee to have regard to diversity, encompassing gender, nationality, age and skillset, when setting the key criteria for the appointment. The Nominations Committee met once in 2016, to consider the annual re-election of directors at the Company’s Annual General Meeting.
Remuneration CommitteeThe Remuneration Committee has responsibility for setting remuneration for all executive directors and for the Chairman, including pension
BOARD OF DIRECTORS
Audit Committee
Michael Cawley (Ind)(Chair)[2014]
Linda Hickey (Ind) [2013]John Cronin (Ind) [2015]
Remuneration Committee
Helen Kirkpatrick (Ind)(Chair)[2009]
Michael Cawley (Ind)[2014]Linda Hickey (Ind) [2015]
Nominations Committee
Eugene Murtagh (Chair)[1998]Gene M. Murtagh [2007]
Helen Kirkpatrick (Ind) [2009]Linda Hickey (Ind) [2014]John Cronin (Ind) [2014]
(Ind) - Independent non-executive Director
contributions, share options and any compensation payments. The committee also monitors the level and structure of remuneration for senior management.
The Report of the Remuneration Committee is set out in this Annual Report on pages 61 to 71, which describes how the Company has applied the principles of Section D of the UK Corporate Governance Code (September 2014) and the Irish Corporate Governance Annex.
COMMUNICATION WITH SHAREHOLDERSKingspan places great emphasis on maintaining regular and responsible dialogue with shareholders. This is achieved through meetings with institutional investors, presentations to brokers and analysts, and making relevant information available on the Group’s website (www.kingspan.com) in a timely fashion. Twice a year, following publication of the annual and half-year results, the Chief Executive Officer and the Chief Financial Officer meet with institutional investors during a formal results roadshow.
In addition, Kingspan is committed to interacting with the international financial community to ensure a full understanding of the Group’s strategic plans and its performance against these plans. During the year, the executive management presented at six capital market conferences and conducted 401 institutional one-on-one and group meetings. Further information regarding the Company’s Annual General Meeting is set out in the Shareholder Information Section in this Annual Report.
All shareholders can sign up to obtain all regulatory news and alerts via the Kingspan website (www.kingspan.com), and depending upon shareholder preference, a copy of the Annual Report can be obtained in hard copy or can be obtained from the Group website.
The Company encourages communication with all shareholders, and welcomes their participation at Annual General Meetings. Last year, in advance of the AGM, the Company reached out to the holders of almost 75% of shares to engage with them and seek their feedback on the AGM resolutions and governance matters in general. All shareholders who attend the Company’s Annual General Meeting are given the opportunity to question the Chairman and other members of the Board, including the chairmen of the committees, on any aspect of the Group’s business. Following the Annual General Meeting, at which a significant number of votes were cast against the Remuneration Report, the Company again reached out to significant shareholders and leading shareholder proxy agents to understand the reasons behind the results, in accordance with the principles of Section E of the UK Corporate Governance Code (September 2014). Further details of these engagements are set out in the Report of the Remuneration Committee.
Key Shareholder Engagements 2017
February Full year Results 2016
March Annual Report 2016
April Trading Update
April Annual General Meeting 2017
August Half-year Results 2017
November Trading Update
USASpring Street—Insulated Panels: Anodized aluminium panel
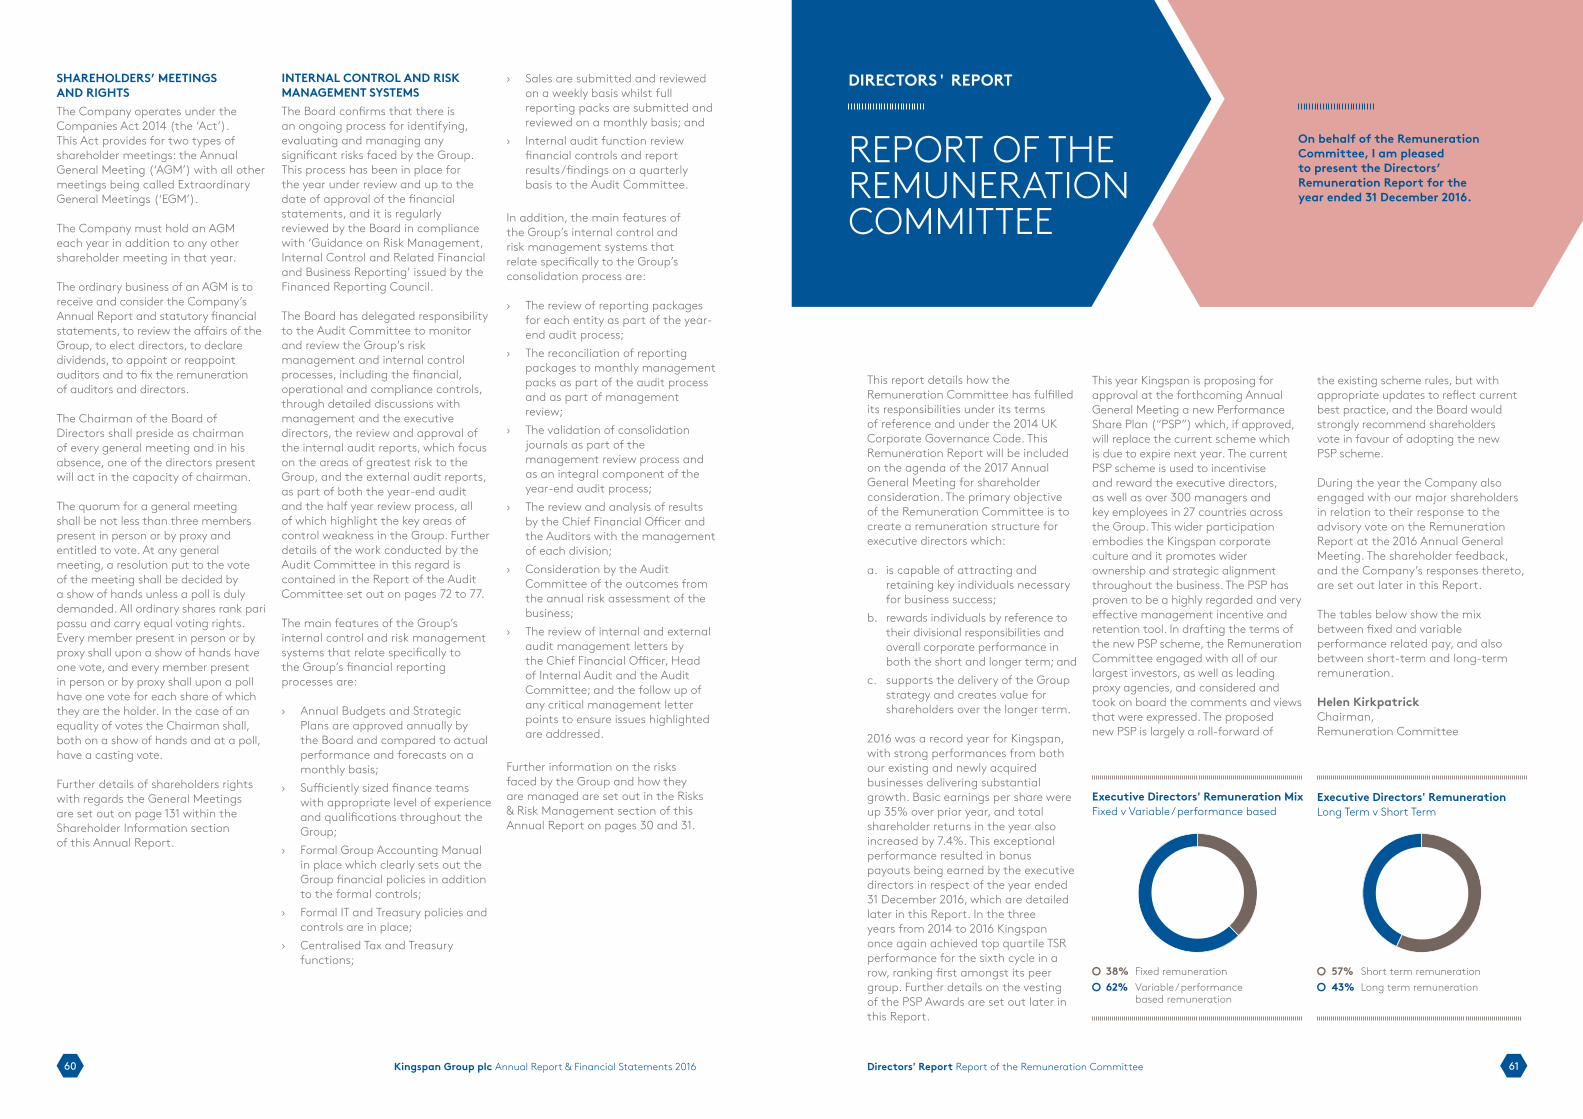
6160 Kingspan Group plc Annual Report & Financial Statements 2016 Directors' Report Report of the Remuneration Committee
SHAREHOLDERS’ MEETINGS AND RIGHTSThe Company operates under the Companies Act 2014 (the ‘Act’). This Act provides for two types of shareholder meetings: the Annual General Meeting (‘AGM’) with all other meetings being called Extraordinary General Meetings (‘EGM’).
The Company must hold an AGM each year in addition to any other shareholder meeting in that year.
The ordinary business of an AGM is to receive and consider the Company’s Annual Report and statutory financial statements, to review the affairs of the Group, to elect directors, to declare dividends, to appoint or reappoint auditors and to fix the remuneration of auditors and directors.
The Chairman of the Board of Directors shall preside as chairman of every general meeting and in his absence, one of the directors present will act in the capacity of chairman.
The quorum for a general meeting shall be not less than three members present in person or by proxy and entitled to vote. At any general meeting, a resolution put to the vote of the meeting shall be decided by a show of hands unless a poll is duly demanded. All ordinary shares rank pari passu and carry equal voting rights. Every member present in person or by proxy shall upon a show of hands have one vote, and every member present in person or by proxy shall upon a poll have one vote for each share of which they are the holder. In the case of an equality of votes the Chairman shall, both on a show of hands and at a poll, have a casting vote.
Further details of shareholders rights with regards the General Meetings are set out on page 131 within the Shareholder Information section of this Annual Report.
INTERNAL CONTROL AND RISK MANAGEMENT SYSTEMSThe Board confirms that there is an ongoing process for identifying, evaluating and managing any significant risks faced by the Group. This process has been in place for the year under review and up to the date of approval of the financial statements, and it is regularly reviewed by the Board in compliance with ‘Guidance on Risk Management, Internal Control and Related Financial and Business Reporting’ issued by the Financed Reporting Council.
The Board has delegated responsibility to the Audit Committee to monitor and review the Group’s risk management and internal control processes, including the financial, operational and compliance controls, through detailed discussions with management and the executive directors, the review and approval of the internal audit reports, which focus on the areas of greatest risk to the Group, and the external audit reports, as part of both the year-end audit and the half year review process, all of which highlight the key areas of control weakness in the Group. Further details of the work conducted by the Audit Committee in this regard is contained in the Report of the Audit Committee set out on pages 72 to 77.
The main features of the Group’s internal control and risk management systems that relate specifically to the Group’s financial reporting processes are:
›› Annual Budgets and Strategic Plans are approved annually by the Board and compared to actual performance and forecasts on a monthly basis;
›› Sufficiently sized finance teams with appropriate level of experience and qualifications throughout the Group;
›› Formal Group Accounting Manual in place which clearly sets out the Group financial policies in addition to the formal controls;
›› Formal IT and Treasury policies and controls are in place;
›› Centralised Tax and Treasury functions;
›› Sales are submitted and reviewed on a weekly basis whilst full reporting packs are submitted and reviewed on a monthly basis; and
›› Internal audit function review financial controls and report results/findings on a quarterly basis to the Audit Committee.
In addition, the main features of the Group’s internal control and risk management systems that relate specifically to the Group’s consolidation process are:
›› The review of reporting packages for each entity as part of the year-end audit process;
›› The reconciliation of reporting packages to monthly management packs as part of the audit process and as part of management review;
›› The validation of consolidation journals as part of the management review process and as an integral component of the year-end audit process;
›› The review and analysis of results by the Chief Financial Officer and the Auditors with the management of each division;
›› Consideration by the Audit Committee of the outcomes from the annual risk assessment of the business;
›› The review of internal and external audit management letters by the Chief Financial Officer, Head of Internal Audit and the Audit Committee; and the follow up of any critical management letter points to ensure issues highlighted are addressed.
Further information on the risks faced by the Group and how they are managed are set out in the Risks & Risk Management section of this Annual Report on pages 30 and 31.
This report details how the Remuneration Committee has fulfilled its responsibilities under its terms of reference and under the 2014 UK Corporate Governance Code. This Remuneration Report will be included on the agenda of the 2017 Annual General Meeting for shareholder consideration. The primary objective of the Remuneration Committee is to create a remuneration structure for executive directors which:
a. is capable of attracting and retaining key individuals necessary for business success;
b. rewards individuals by reference to their divisional responsibilities and overall corporate performance in both the short and longer term; and
c. supports the delivery of the Group strategy and creates value for shareholders over the longer term.
2016 was a record year for Kingspan, with strong performances from both our existing and newly acquired businesses delivering substantial growth. Basic earnings per share were up 35% over prior year, and total shareholder returns in the year also increased by 7.4%. This exceptional performance resulted in bonus payouts being earned by the executive directors in respect of the year ended 31 December 2016, which are detailed later in this Report. In the three years from 2014 to 2016 Kingspan once again achieved top quartile TSR performance for the sixth cycle in a row, ranking first amongst its peer group. Further details on the vesting of the PSP Awards are set out later in this Report.
DIRECTORS' REPORT
REPORT OF THE REMUNERATION COMMITTEE
On behalf of the Remuneration Committee, I am pleased to present the Directors’ Remuneration Report for the year ended 31 December 2016.
Executive Directors' Remuneration MixFixed v Variable / performance based
Executive Directors' RemunerationLong Term v Short Term
38% Fixed remuneration62% Variable / performance based remuneration
57% Short term remuneration43% Long term remuneration
This year Kingspan is proposing for approval at the forthcoming Annual General Meeting a new Performance Share Plan (“PSP”) which, if approved, will replace the current scheme which is due to expire next year. The current PSP scheme is used to incentivise and reward the executive directors, as well as over 300 managers and key employees in 27 countries across the Group. This wider participation embodies the Kingspan corporate culture and it promotes wider ownership and strategic alignment throughout the business. The PSP has proven to be a highly regarded and very effective management incentive and retention tool. In drafting the terms of the new PSP scheme, the Remuneration Committee engaged with all of our largest investors, as well as leading proxy agencies, and considered and took on board the comments and views that were expressed. The proposed new PSP is largely a roll-forward of
the existing scheme rules, but with appropriate updates to reflect current best practice, and the Board would strongly recommend shareholders vote in favour of adopting the new PSP scheme.
During the year the Company also engaged with our major shareholders in relation to their response to the advisory vote on the Remuneration Report at the 2016 Annual General Meeting. The shareholder feedback, and the Company’s responses thereto, are set out later in this Report.
The tables below show the mix between fixed and variable performance related pay, and also between short-term and long-term remuneration.
Helen KirkpatrickChairman, Remuneration Committee
6362 Kingspan Group plc Annual Report & Financial Statements 2016 Directors' Report Report of the Remuneration Committee
This report of the Remuneration Committee sets out Kingspan’s remuneration policy, gives details of the remuneration outcomes for 2016, and describes the workings of the Remuneration Committee during the year.
EXECUTIVE DIRECTORS’ REMUNERATION POLICY In setting the executive directors’ remuneration package the Remuneration Committee seeks to ensure that:›› the Group will attract, motivate
and retain individuals of the highest calibre;
›› executives are rewarded in a fair and balanced way for their contribution to the Group’s performance;
›› executives receive a level of remuneration that is appropriate to their scale of responsibility and individual performance;
›› the overall approach to remuneration has regard to the sectors and geographies in which we operate; and
›› risk is properly considered in setting remuneration policy and determining remuneration packages.
The Remuneration Committee seeks to align the interests of executive directors with those of shareholders through a mix of short and long term performance based incentives and by encouraging share ownership, whilst taking into consideration the market rates and practices of other quoted Irish and international industry peer companies of similar size and scope in setting the base and fixed elements of the package.
The key elements of the 2017 remuneration package for each of the executive directors are set out below:
Deferred bonus plan - rewards achievement of incremental performance targets with share based awards deferred for two yearsHow it operates Maximum opportunity
The Company’s deferred bonus plan rewards incremental growth over and above the growth targeted by the annual performance related cash bonus. Ambitious EPS growth targets are set by the Remuneration Committee, and any incremental performance bonus earned will be satisfied by the issue of share awards, which are deferred for two years.
The maximum deferred performance bonus is up to 50% of base salary.
Performance share plan - aligns the interests of executive directors and senior managers with those of the Group’s shareholders and provides long term performance based incentivesHow it operates Maximum opportunity
Executive directors are entitled to participate in the Group’s Performance Share Plan (PSP). Under the terms of the PSP, performance shares are awarded to the executive directors and the senior management team. The performance shares will vest after three years only if the Company’s underlying performance has improved during the vesting period, and if certain performance criteria are achieved over the vesting period.
The 2008 PSP scheme was approved by shareholders in May 2008 and is due to expire in 2018. Over the life of the 2008 PSP scheme to date, the total number of awards granted, net of awards lapsed, amounted to 4.9% of the issued share capital of the Company.
The Remuneration Committee is proposing for approval at the forthcoming AGM a new Performance Share Plan which, if approved, will replace the current 2008 PSP scheme.
Subject to shareholder approval of the new Performance Share Plan, the committee has selected the following performance measures for 2017:
›› Up to 50% of the award will vest (on a sliding scale) based on the achievement of Group EPS growth targets.
›› Up to 50% of the award will vest (on a sliding scale) based on the achievement of total shareholder return (TSR) compared to a selected peer group.
Subject to shareholder approval of the proposed new PSP scheme, for 2017 the committee has set the maximum value of PSP Awards that may be granted as follows:
in the case of the CEO: 175% of base salary, and
in the case of other executive directors: 150% of base salary.
Pension scheme and other allowances - attracts and retains skilled and experienced individuals
How it operates Maximum opportunity
The Group operates a defined contribution pension scheme for executive directors. Pension contributions are calculated on base salary only. Contributions are determined on an individual basis and take into account a number of factors including age, length of service, and number of years to retirement.
Where local legislation imposes a cap on pension contributions, the Company may agree to make a non-pensionable annual payment to the executive, subject to all applicable employee and employer payroll taxes.
No prescribed maximum pension contribution/annual payment.
Contributions will depend on individual circumstances.
Base salary - attracts and retains skilled and experienced individuals
How it operates Maximum opportunity
Base salaries are reviewed by the Remuneration Committee in the last quarter of each year. The committee engages a leading firm of independent consultants to carry out a benchmark report of the executive directors’ basic and total remuneration packages.
Factors taken into account by the committee include the Group’s overall performance, the executive directors’ role and personal performance, movements in pay generally across the Group and competitive market practice. Where applicable, changes in salary are effective from 1 January.
No prescribed maximum base salary or maximum annual increase.
Increases will generally be in line with increases across the Group, but may be higher or lower in certain circumstances to reflect changes in remit, roles and responsibilities, or to allow newly appointed executives to move progressively towards market norms.
Benefits - provides market competitive benefits
How it operates Maximum opportunity
In addition to their base salaries, executive directors’ benefits include life and health insurance and the use by the executive directors of company cars (or a taxable car allowance) in line with typical market practice.
No prescribed maximum level, as benefits depend on individual director circumstances.
Performance related bonus - rewards achievement of annual performance targets
How it operates Maximum opportunity
Executive directors receive annual performance related bonus payments based on the attainment of stretching financial targets set prior to the start of each year by the Remuneration Committee. Bonuses are paid on a sliding scale if the targets are met. Any annual performance related bonus achieved will be satisfied by a cash payment.
For 2017, the committee has selected the following performance measures:
CEO & CFO: Group EPS growth targets over prior year.
Divisional MDs:
60% of their bonus opportunity is based on the achievement of divisional profit growth targets, and 40% of their bonus opportunity is based on the achievement of Group EPS growth targets over prior year.
The maximum annual performance related bonus is up to 100% of base salary.
REMUNERATION OUTCOMES FOR 2016Base salary: The salaries for 2016 for each of the executive directors were set by the Remuneration Committee towards the end of 2015.
The committee engaged independent consultants, Mercer, to carry out a benchmarking report on the executive directors’ salary levels and total remuneration packages. They selected similar sized companies from the international industry peer
group referenced in the Performance Share Plan, as well as other similar sized Irish plcs as the appropriate comparator group for Kingspan both sectorally and geographically. When determining the appropriate levels of remuneration for 2016, the committee also considered the changes in scope and responsibilities of certain executives following the completion of the major Joris Ide and Vicwest acquisitions during 2015, and having regard to other developments within the Group, which continued to transform the depth and
breadth of the Group’s business. The committee agreed to increase the base salaries of the Chief Executive and the Chief Financial Officer which had remained frozen at 2008 and 2011 levels respectively, and also approved an increase in base salary for Gilbert McCarthy to reflect the growth in scale and profitability of his Insulated Panel division and the significant increase in his remit and responsibilities. Increases for the other Divisional MDs are generally in line with increases in the business.
6564 Kingspan Group plc Annual Report & Financial Statements 2016 Directors' Report Report of the Remuneration Committee
Overall, total salaries for the executive directors increased by 5.8% in 2016. Full details of the executive directors’ salaries in 2016 are set out in the table below.
Performance related bonus: The Remuneration Committee seeks to ensure that overall remuneration reflects Group performance and individual contribution. Accordingly, the committee seeks to align an appropriate portion of the executive directors’ remuneration with the achievement of annual performance targets. The targets for 2016 were set prior to the start of the year, and comprise a combination of Group EPS targets and divisional profit growth targets.
The Chief Executive’s and the Chief Financial Officer’s annual performance related bonuses were based on Group
EPS growth targets over prior year, with the maximum annual performance related bonus being payable on the achievement of 15% Group EPS growth over prior year. For each of the Divisional MDs, up to 60% of their annual performance related bonus opportunity was based on achieving stretching divisional profit targets, and a further 40% of the Divisional MDs annual performance related bonus opportunity was payable on the achievement of Group EPS growth over prior year, with maximum annual performance related bonus being payable on the achievement of 115% of their divisional profit target in each case, and 15% Group EPS growth over prior year.
The Remuneration Committee reviewed the Group EPS growth and divisional performance during the year, and considered the extent to which the 2016 annual performance bonus targets had been achieved by each of the executive directors. The table below sets out the performance against targets for each of the executive directors in 2016. The Board believes that disclosure of the Divisional MD’s specific bonus targets would be inappropriate as the targets are commercially sensitive business information not otherwise available to competitors.
Performance targets
Annual performance related bonus Maximum Performance Threshold Maximum Performance Bonus opportunity measure target target achieved outcome
Chief Executive 100% EPS 101.4 cent 122.7 cent 143.8 cent 100%Chief Financial Officer 100% EPS 101.4 cent 122.7 cent 143.8 cent 100%Russell Shiels 60% Divisional profit 115% 111% 49% 40% EPS 101.4 cent 122.7 cent 143.8 cent 40%Peter Wilson 60% Divisional profit 115% 127% 60% 40% EPS 101.4 cent 122.7 cent 143.8 cent 40%Gilbert McCarthy 60% Divisional profit 115% 135% 60% 40% EPS 101.4 cent 122.7 cent 143.8 cent 40%
Performance targets
Deferred bonus plan Maximum Performance Threshold Maximum Performance DBPOpportunity measure target target achieved outcome 50% EPS 122.7 cent 138.7 cent 143.8 cent 50%
Deferred bonus plan: The deferred bonus plan (DBP) is intended to reward incremental performance over and above the growth targeted by the annual performance related bonus. Any DBP bonus earned for such incremental performance is satisfied by the payment of deferred share awards, which are designed to align the DBP with longer-term shareholder interests. The holding period is two years.
In 2016 all executive directors were eligible for a maximum DBP bonus opportunity of up to 50% of base salary. The incremental performance
target for all of the executive directors was based on the achievement of Group EPS growth target in excess of the stretching targets set for the annual performance bonus, with the maximum DBP bonus being earned on the achievement of 30% Group EPS growth over prior year.
The table below sets out the performance against target for 2016. Having achieved 34.8% growth in basic EPS, the Remuneration Committee determined that the maximum DBP bonus has been earned by each of the executive directors.
Directors’ Remuneration for year ended 31 December 2016 (Remuneration is reported in the currency received by the individual)
Executive Gene Geoff Russell Peter Gilbert Total(1)
directors Murtagh Doherty Shiels Wilson McCarthy €000 €000 US$000 £000 €000 €000 2016 2015 2016 2015 2016 2015 2016 2015 2016 2015 2016 2015 Salary and Fees 698 635 514 490 525 510 341 325 466 395 2,568 2,427
Performance Pay (2) - Cash element 698 635 514 490 467 510 341 325 466 395 2,516 2,427 - Deferred shares 349 318 257 245 263 255 171 163 233 197 1,284 1,213
Benefits (3) 30 30 31 30 74 69 12 12 30 25 172 164
Pension Contributions (4) 140 127 129 123 186 184 147 143 93 79 708 691
Total executive pay 1,915 1,745 1,445 1,378 1,515 1,528 1,012 968 1,288 1,091 7,248 6,922 Charge to Consolidated Income Statement for share options and awards(5) 1,915 1,783 Non-executive directors (6) Eugene Murtagh 191 191Helen Kirkpatrick 85 85Linda Hickey 75 75Michael Cawley 85 81John Cronin 75 75Bruce McLennan (7) 70 36Kieran Murphy (8) 0 29
Total non-executive pay 581 572
Total directors’ remuneration 9,744 9,277 (1) Russell Shiels’ remuneration has been converted to Euro at the following average rate USD: 1.1104 (2015: 1.1102). (1) Peter Wilson’s remuneration has been converted to Euro at the following average rate GBP: 0.81929 (2015: 0.72644).(2) Performance pay is earned for meeting clearly defined EPS growth and divisional profit targets. Details of the bonus plan and targets are set out on
page 65 of the Remuneration Report. (3) Benefits principally relate to health insurance premiums and company cars/car allowances. In the case of Russell Shiels the cost of life insurance and
permanent health benefits is also included. (4) The Group operates a defined contribution pension scheme for executive directors. Certain executives have elected to receive part of their prospective
pension entitlement as a non-pensionable cash allowance in lieu of the pension benefit foregone, subject to all applicable employee and employer payroll taxes.
(5) The charge to the Consolidated Income Statement represents the current year cost of the unvested PSP Awards granted to the executive directors. Details of the valuation methodology are set out in Note 3 to the Financial Statements.
(6) Non-executive directors received a base fee of €70,000 per annum, plus an additional fee of between €5,000 and €15,000 for membership and/or chairmanship of Board committees. They do not receive any pension benefit, or any performance or share based remuneration.
(7) Bruce McLennan was appointed as a non-executive director on 26 June 2015.(8) Kieran Murphy retired as a non-executive director on 7 May 2015.

66 Kingspan Group plc Annual Report & Financial Statements 2016 67Directors' Report Report of the Remuneration Committee
Performance Share Plan: The Group’s Performance Share Plan (PSP) provides long term performance based incentives, thus aligning the interests of the executive directors with those of the Group’s shareholders.
The TSR peer group for all PSP Awards granted after 1 January 2014 comprised the following companies:
Armstrong World Industries Inc
Boral Ltd
Compagnie de Saint Gobain
CRH Plc
Geberit AG Grafton Group Plc
NCI Building Systems Inc
Owens Corning
Rockwool Intl. A/S SIG Plc
Travis Perkins Plc Uponor Corp
Uralita SA USG Corporation
Wienerberger AG
The Remuneration Committee reviewed the extent to which the vesting targets in respect of the PSP Awards granted in 2014 had been met by reference to EPS and TSR targets over the three year period to 31 December 2016. The committee determined that total EPS growth during the period was 278%, which significantly exceeded the annual target of CPI plus 7%. The committee also noted that Kingspan had achieved top quartile TSR performance in its peer group for the sixth cycle in a row, ranking first amongst its peers in respect of the performance period. The committee therefore concluded that the PSP vesting conditions in respect
of the 2014 PSP Awards had been satisfied in full, and that the additional 25% Exceptional TSR Awards that had been granted to the Chief Executive were also fully vested.
The table below sets out the targets set at the time of the granting of the 2014 PSP Awards, and the performance achieved in respect thereof.
In February 2016 the Remuneration Committee granted PSP Awards to the executive directors with a three year performance period from 2016 to 2018. The EPS condition for the 2016 PSP Awards as determined by the committee, is the achievement of annual EPS growth of between CPI plus 5% and CPI plus 10%. The TSR conditions remain as above.
Details of share options granted to the directors and secretary under the Performance Share Plan and the legacy Standard Share Option Scheme are set out in the table opposite.
Standard Share Option Scheme: Since May 2008, no more options can be awarded under the Standard Share Option Scheme, but options awarded before that date which have vested can be exercised up to ten years after the date of grant. Grants of options under the Standard Share Option Scheme were awarded at the market price of the Company’s shares at the time of the grant.
Such options vested only when earnings per share growth in the three year period commencing with the
accounting period in which the options were granted (or any subsequent period), exceeded CPI by at least 2% per annum compound. Over the life of the Standard Share Option Scheme the total number of options granted, net of options lapsed, amounted to 3.6% of the issued share capital of the Company. This scheme is now closed.
Other: During the year the Company reissued 11,164 and 7,874 treasury shares to Peter Wilson and Russell Shiels respectively, in satisfaction of a legacy contractual entitlement. These obligations are now extinguished, and there are no similar obligations due to any other party.
Non-executive directors: The non-executive directors each receive a fee which is set by the Remuneration Committee and approved by the Board on advice from the independent professional advisors. The basic non-executive director fee is €70,000, and an additional fee of between €5,000 and €15,000 is paid for membership and/or chairmanship of Board committees, to reflect the additional role and responsibilities. Non-executive director fee levels are reviewed annually, and there was no change to the rate of fees paid to the non-executive directors in 2016. The non-executive directors do not have service contracts and do not participate in any bonus or share option schemes. The non-executive directors do not receive any pension or other benefits. There is no provision for compensation for loss of office.
2014 - 2016 PSP Awards
Percentage of award
Performance measure
Threshold target
Maximum target
Performance achieved
PSP vesting
50% EPS 57.3 cent 63.3 cent 143.8 cent 50%50% TSR 50th percentile 75th percentile 100th percentile 50%25% Exceptional TSR 76th percentile 100th percentile 100th percentile 25%
Performance targets
USA Skyway Library— Insulated Panels:Painted aluminium panels
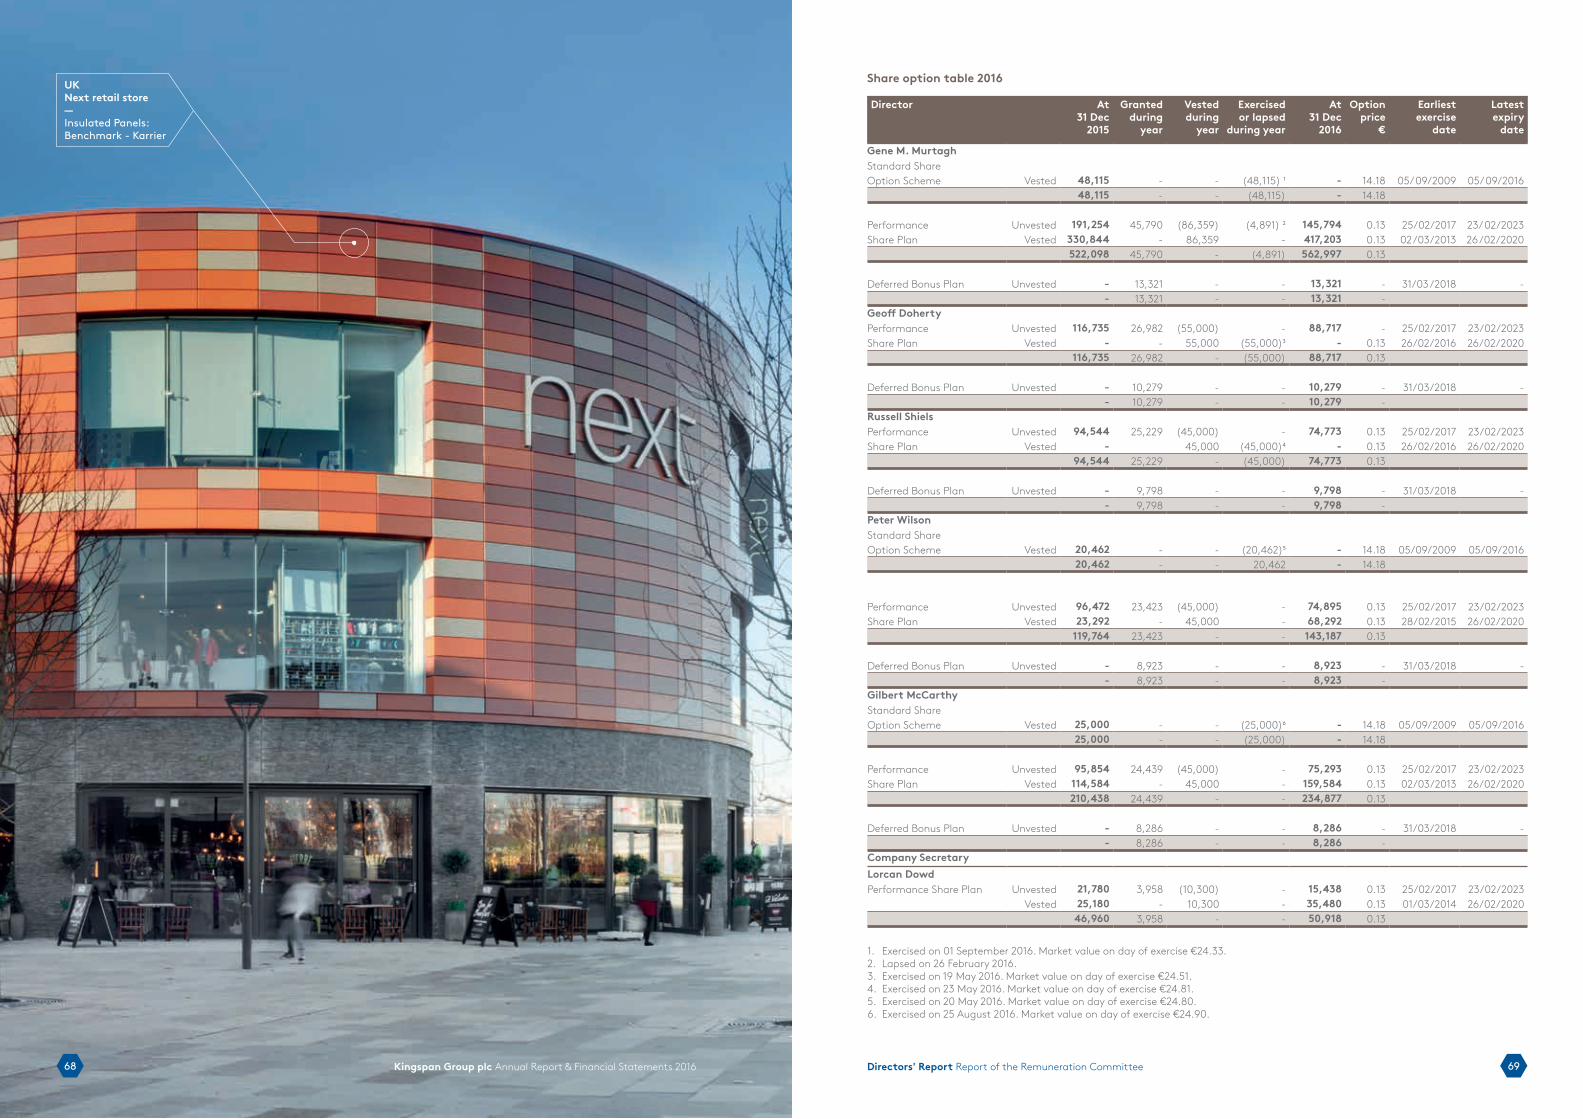
6968 Kingspan Group plc Annual Report & Financial Statements 2016 Directors' Report Report of the Remuneration Committee
Share option table 2016
Director At 31 Dec
2015
Granted during
year
Vested during
year
Exercised or lapsed
during year
At 31 Dec
2016
Option price
€
Earliest exercise
date
Latest expiry
date
Gene M. MurtaghStandard ShareOption Scheme Vested 48,115 - - (48,115) ¹ - 14.18 05/ 09/2009 05/ 09/2016
48,115 - - (48,115) - 14.18 Performance Unvested 191,254 45,790 (86,359) (4,891) ² 145,794 0.13 25/02/2017 23/ 02/2023Share Plan Vested 330,844 - 86,359 - 417,203 0.13 02 /03/2013 26 /02/2020
522,098 45,790 - (4,891) 562,997 0.13
Deferred Bonus Plan Unvested - 13,321 - - 13,321 - 31/03 /2018 - - 13,321 - - 13,321 -
Geoff DohertyPerformance Unvested 116,735 26,982 (55,000) - 88,717 - 25/02/2017 23/02/2023Share Plan Vested - - 55,000 (55,000)³ - 0.13 26/02/2016 26/02/2020
116,735 26,982 - (55,000) 88,717 0.13
Deferred Bonus Plan Unvested - 10,279 - - 10,279 - 31/03/2018 - - 10,279 - - 10,279 -
Russell ShielsPerformance Unvested 94,544 25,229 (45,000) - 74,773 0.13 25/02/2017 23/02/2023Share Plan Vested - 45,000 (45,000)⁴ - 0.13 26/02/2016 26/02/2020
94,544 25,229 - (45,000) 74,773 0.13
Deferred Bonus Plan Unvested - 9,798 - - 9,798 - 31/03/2018 - - 9,798 - - 9,798 -
Peter WilsonStandard ShareOption Scheme Vested 20,462 - - (20,462)⁵ - 14.18 05/09/2009 05/09/2016
20,462 - - 20,462 - 14.18 Performance Unvested 96,472 23,423 (45,000) - 74,895 0.13 25/02/2017 23/02/2023Share Plan Vested 23,292 - 45,000 - 68,292 0.13 28/02/2015 26/02/2020
119,764 23,423 - - 143,187 0.13
Deferred Bonus Plan Unvested - 8,923 - - 8,923 - 31/03/2018 - - 8,923 - - 8,923 -
Gilbert McCarthyStandard ShareOption Scheme Vested 25,000 - - (25,000)⁶ - 14.18 05/09/2009 05/09/2016
25,000 - - (25,000) - 14.18 Performance Unvested 95,854 24,439 (45,000) - 75,293 0.13 25/02/2017 23/02/2023Share Plan Vested 114,584 - 45,000 - 159,584 0.13 02/03/2013 26/02/2020
210,438 24,439 - - 234,877 0.13
Deferred Bonus Plan Unvested - 8,286 - - 8,286 - 31/03/2018 - - 8,286 - - 8,286 -
Company SecretaryLorcan DowdPerformance Share Plan Unvested 21,780 3,958 (10,300) - 15,438 0.13 25/02/2017 23/02/2023
Vested 25,180 - 10,300 - 35,480 0.13 01/03/2014 26/02/2020 46,960 3,958 - - 50,918 0.13
1. Exercised on 01 September 2016. Market value on day of exercise €24.33.2. Lapsed on 26 February 2016.3. Exercised on 19 May 2016. Market value on day of exercise €24.51.4. Exercised on 23 May 2016. Market value on day of exercise €24.81.5. Exercised on 20 May 2016. Market value on day of exercise €24.80.6. Exercised on 25 August 2016. Market value on day of exercise €24.90.
UKNext retail store—Insulated Panels: Benchmark - Karrier

7170 Kingspan Group plc Annual Report & Financial Statements 2016 Directors' Report Report of the Remuneration Committee
GOVERNANCE
Composition: The Remuneration Committee comprises three independent non-executive directors, Helen Kirkpatrick (chairman), Michael Cawley and Linda Hickey.
Responsibilities: The responsibilities of the Remuneration Committee are summarised in the Corporate Governance Report, and its terms of reference are available on the Group’s website: (www.kingspan.com).
Meetings: The Remuneration Committee met 5 times during the year. Each meeting was fully attended by all members of the committee, and an overview of the workings of the committee is set out below.
Service contracts: No director has a service contract or notice period in excess of one year.
Former directors: There were no pension payments, payments for loss of office or other remuneration paid to any former directors during the relevant financial year, other than as set out in the table above.
Clawback & malus policy: The Remuneration Committee recognises
that there could potentially be circumstances in which performance related pay (either annual performance related bonuses, deferred bonus plan awards and/or PSP Awards) is paid out based on misstated results or inappropriate conduct resulting in material damage to the Company. Whilst the Company has robust management and financial controls in place to minimise any such risk, the committee has put in place formal clawback & malus arrangements for the protection of the Company and its investors. The clawback of performance related pay (comprising the annual performance related bonus, the deferred bonus plan awards and the PSP Awards) would apply in certain circumstances including:
›› a material misstatement of the Company’s financial results;
›› a material breach of an executive’s contract of employment; and
›› any wilful misconduct, recklessness, and/or fraud resulting in serious injury to the financial condition or business reputation of the Company.
Payment of the annual performance related bonus is deferred until March of the following year after the audited financial statements have been
approved. The deferred bonus plan awards are deferred for a period of two years. The committee considers such periods are appropriate deferral periods in a manufacturing environment.
Minimum shareholding requirements: The Remuneration Committee recognises that share ownership is important in aligning the interests of management with those of shareholders. The committee has adopted a policy whereby executive directors are required to build up and retain, within five years of appointment, a minimum holding in Kingspan shares (or fully vested share options) with equivalent market value of 100% base salary.
The current shareholdings of the executive directors as a multiple of 2016 salary (as at 31 December 2016) are shown in the table below.
No. shares held
Multiple of salary
Gene M. Murtagh 1,128,999 41.7 x times
Geoff Doherty 254,979 12.8 x times
Russell Shiels 300,000 16.4 x times
Peter Wilson 366,876 22.7 x times
Gilbert McCarthy 247,637 13.7 x times
External advisors: During the year the Remuneration Committee obtained independent advice from external remuneration consultants, Mercer, in relation to market trends, comparator benchmarking, developments in remuneration policies and practice and governance best practice. Mercer also advised the committee on the drafting of the proposed new PSP scheme, and the selection of an appropriate comparator peer group in relation thereto. Mercer are members of the Remuneration Consultants Group and signatories to its Code of Conduct, and all advice is provided in accordance with this code. Mercer also provide administration services to Kingspan’s all employee Approved Profit Sharing Scheme, but had no other connection with the Group during the year. In light of this the committee is satisfied that the advice obtained is objective and independent.
Say on pay: Kingspan, as an Irish incorporated company, is not subject to the UK disclosure requirements of the Large and Medium-sized Companies and Groups (Accounts and Reports) (Amendment) Regulations 2013. However, in accordance with Kingspan’s commitment to best corporate governance practices and shareholder engagement, the Remuneration Committee have incorporated a number of the disclosure requirements in this report, and the Board, on the recommendation of the Remuneration Committee, will put this Report of the Remuneration Committee to an advisory vote at the forthcoming Annual General Meeting of the Company.
At Kingspan’s 2016 AGM, the result of the advisory vote in relation to the 2015 Directors’ Remuneration Report was 87,183,817 votes (68.23%) for, and 40,588,236 votes (31.77%) against.
The Company engaged widely with our major shareholders in relation to their response to the advisory vote on the Remuneration Report at the 2016 Annual General Meeting. This included meeting with some of our largest shareholders and engaging with the proxy agents that represent them. Whilst the Company was pleased that the Remuneration Report was approved by over two thirds majority of the votes
Remuneration Committee Activities Feb June Sept Oct NovSalary and feesEngage independent consultants • •Review Executives’ salary, role and responsibilities for 2017 •Review non-executives’ fees for 2017 •Performance payAssess Group and individual performance against targets for 2015 •Confirm percentage of performance bonus achieved for 2015 •Agree Group and individual performance targets for 2017 •Agree incremental performance targets for deferred bonus plan for 2017 •Confirm legacy entitlement to issue of treasury shares •PSP AwardsAssess performance of 2013/2015 PSP Awards against targets •Determine percentage of 2013/2015 PSP Awards which vest •Agree targets and level for grants of PSPs Awards for 2016 •Prepare draft terms of new 2017 PSP scheme and review peer group • • • •GovernanceReview and approve Remuneration Report for Annual Report 2015 •Consider shareholder votes and feedback from AGM 2016 • •Engage with shareholders on AGM feedback and proposed new PSP scheme • •Update on remuneration trends generally • • •Review of overall remuneration policy •Review of consultants’ performance and independence •
cast, it was clear from our engagement with shareholders that a number of common themes were expressed:
Overall remuneration levels: In general, shareholders opined that the executive directors’ remuneration levels were reasonable, and reflected the Company’s performance during the year.
Disclosure of bonus targets: A number of investors called for better disclosure of performance targets, and having noted this feedback, the Company will now provide full retrospective disclosure of annual performance bonus targets for the CEO and CFO, in the manner detailed earlier in this report.
Deferred Bonus Plan: It was noted from shareholder feedback that the timing of the introduction of the DBP was a matter of concern for some investors, albeit there was no issue with either the overall quantum of the award, or the structure of the DBP. The Remuneration Committee recognised that the introduction of the DBP part way through the year was highly unusual, however the committee had weighed this up against the exceptional circumstances prevailing at the time in light of the two largest acquisitions that the Group had ever
made, and believed that the DBP was an appropriate means to incentivise management to ensure the successful integration and implementation of synergies from these two strategically important acquisitions. The Committee is of the view that the DBP is an effective tool to reward extraordinary incremental performance aligned with long-term value creation in the business. The DBP is as part of its overall remuneration policy.
Short term and long term performance measures: During the Company’s engagement with shareholders a broad range of views were expressed on the pros and cons of differing performance measures. The Committee gave consideration to the views expressed and, where possible, reflected them in determining policy and better reporting. The Remuneration Committee does keep both the long-term and the short-term performance measures under constant review, in considering what metrics are best aligned with the Company’s strategy. At present, the Remuneration Committee believes that the key determinant of management performance is EPS growth, which is based on unadjusted audited figures to provide absolute clarity and transparency.
2009 2010 2011 2012 2013 2014 2015 2016
PERFORMANCE GRAPHThis graph shows the Company’s TSR performance against the performance of the ISEQ and the FTSE 250 Indices over the eight-year period to 31 December 2016.
Total Shareholder Returns
900
800
700
600
500
400
300
200
100
0
Kingspan ISEQ FTSE 250

7372 Kingspan Group plc Annual Report & Financial Statements 2016 Directors' Report Report of the Audit Committee
DIRECTORS' REPORT
REPORT OF THE AUDIT COMMITTEE
As Chairman of the Audit Committee, I am pleased to present the report of the committee for the year ended 31 December 2016.
This report details how the Audit Committee has met its responsibilities under its Terms of Reference and under the 2014 UK Corporate Governance Code in the last twelve months. The Audit Committee focused particularly on the appropriateness of the Group’s financial statements. The committee has satisfied itself, and has advised the Board accordingly, that the 2016 Annual Report and financial statements are fair, balanced and understandable, and provide the information necessary for shareholders to assess the Company’s performance, business model and strategy. The significant issues that the committee
considered in relation to the financial statements and how these issues were addressed are set out in this Report.
The Audit Committee notes the new requirements under section 225 of the Companies Act 2014 and has ensured that the Directors are aware of their responsibilities and fully comply with this provision.
One of the Audit Committee’s key responsibilities is to review the Group’s risk management and internal controls systems, including in particular internal financial controls. During the year, the committee carried out a robust assessment of the principal
risks facing the company and monitored the risk management and internal control system on an on-going basis. Further details in regard to these matters are also set out in this Report on page 77.
The committee also reviewed the effectiveness of both the external audit process and the internal audit function as part of the continuous improvement of financial reporting and risk management across the Group.
Michael CawleyChairman, Audit Committee
ROLE AND RESPONSIBILITIES The Board has established an Audit Committee to monitor the integrity of the Company’s financial statements and the effectiveness of the Group’s internal financial controls. The committee’s role and responsibilities are set out in the committee’s terms of reference which are available from the Company and are displayed on the Group’s website (www.kingspan.com). The Terms of Reference are reviewed annually and amended where appropriate. During the year the committee worked with management, the external auditors, internal audit, and other members of the senior management team in fulfilling these responsibilities.
The Audit Committee report deals with the key areas in which the Audit Committee plays an active role and has responsibility. These areas are as follows:
i. Financial Reporting and related primary areas of judgement;
ii. The External Audit process; iii. The Group’s Internal Audit function iv. Risk Management and Internal
controls; andv. Whistleblowing procedures.
COMMITTEE MEMBERSHIPAs at 31 December 2016, the Audit Committee comprised of three independent non-executive Directors who are Michael Cawley (Chairman), Linda Hickey and John Cronin.
The biographies of each can be found on pages 44 and 45.
The Board considers that the committee as a whole has an appropriate and experienced blend of commercial, financial and industry expertise to enable it to fulfil its duties, and that the committee chairman, Michael Cawley B.COMM., F.C.A., has appropriate recent and relevant financial experience.
MEETINGSThe committee met four times during the year ended 31 December 2016 and attendance at the meetings is noted below. The activities of the Audit Committee in each meeting are noted on the page below.
Committee Member Attended Eligible Joined CommitteeMichael Cawley (Chairman) 4 4 2014Linda Hickey 4 4 2013John Cronin 4 4 2015
Netherlands Dokvast manufacturing facility —Insulated Panels: Daylight and micro rib
Audit Committee activities Feb June Aug DecFinancial reportingReview and approve preliminary & interim results • •Consider key audit and accounting issues and judgements • •Consider accounting policies and the impact of new accounting standards • •Review any related party matters and intended disclosures • Review management letter from auditors •Approve going concern and viability statements •Review Annual Report, and confirm if fair balanced and understandable •
External auditorsPlan for year-endaudit & half year review • •Confirm auditor independence, materiality of fees, and non-audit services • •Approval of audit engagement letter and audit fees •
Internal audit and risk management controlsApprove internal audit plan and resources • • • •Review of internal audit reports and monitor progress on open actions • • • •Review of financial, IT and general controls • • • •Monitor Group whistleblowing procedures • • • •Assessment of the principal risks and effectiveness of internal control systems •
GovernanceAssurances as to corporate governance and Corporate Governance Code compliance •Accounting standards update • •Corporate governance update • •Evaluation of external and internal audit function •Directors' Compliance Statement policy and procedures •Policy on the engagement of external auditors •
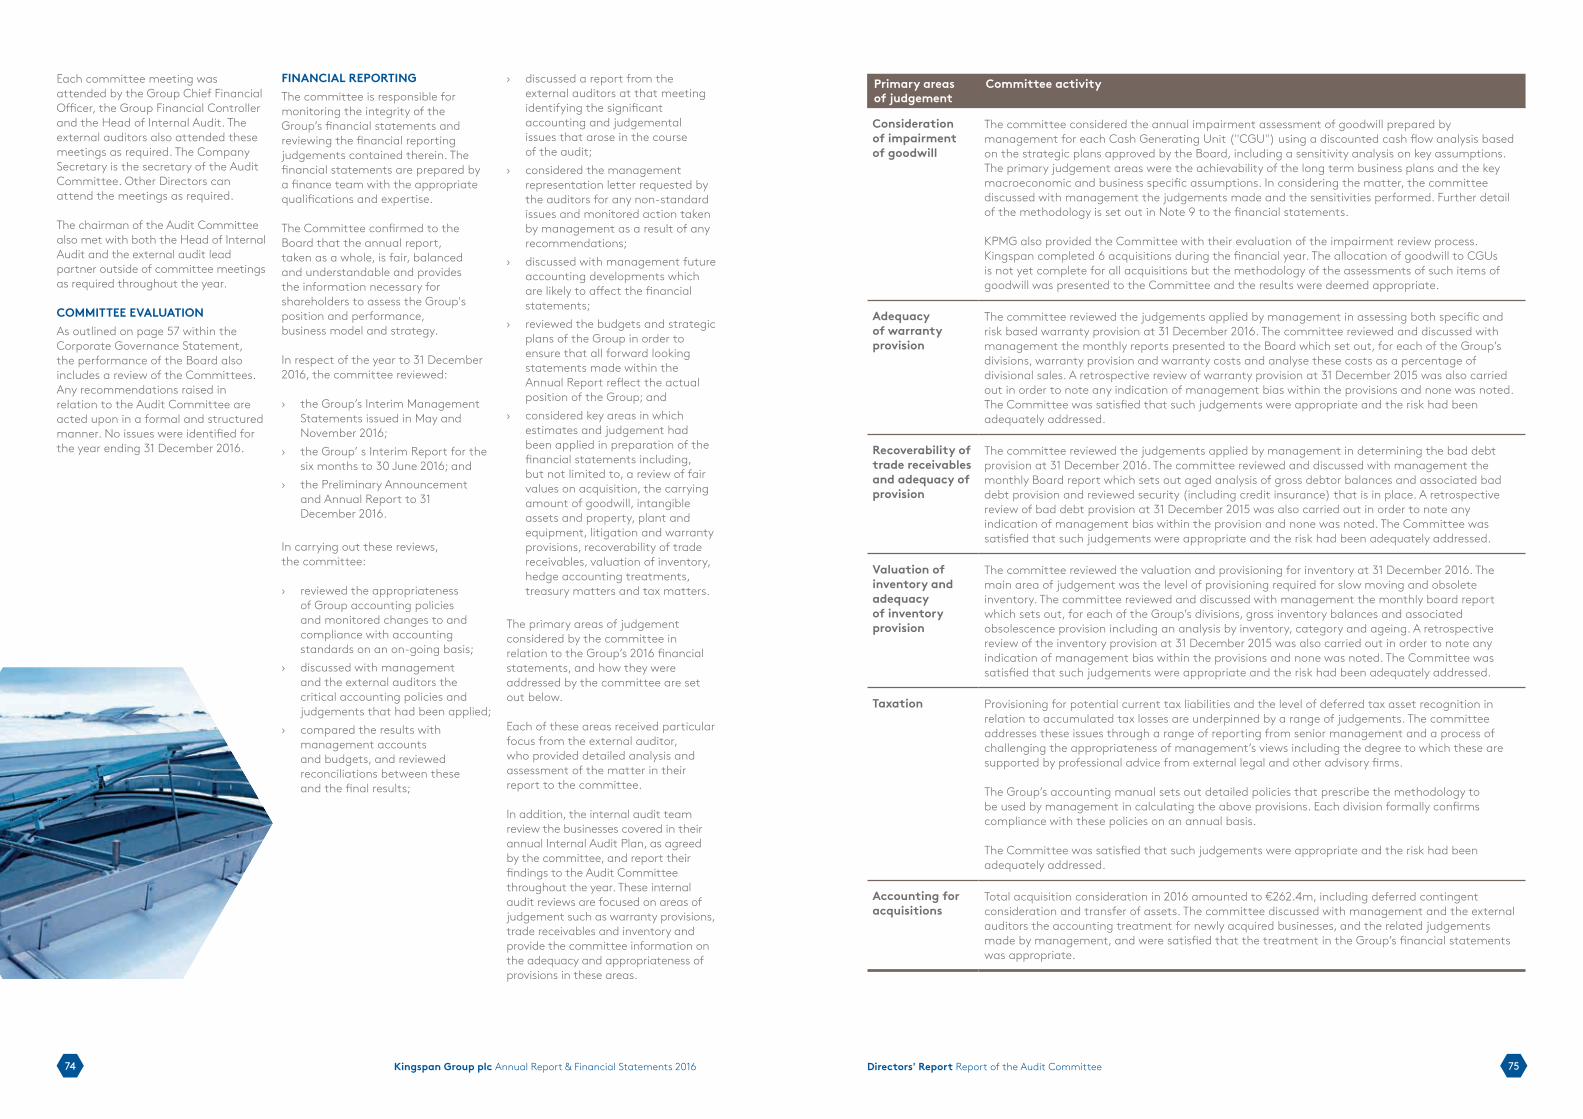
7574 Kingspan Group plc Annual Report & Financial Statements 2016 Directors' Report Report of the Audit Committee
Each committee meeting was attended by the Group Chief Financial Officer, the Group Financial Controller and the Head of Internal Audit. The external auditors also attended these meetings as required. The Company Secretary is the secretary of the Audit Committee. Other Directors can attend the meetings as required.
The chairman of the Audit Committee also met with both the Head of Internal Audit and the external audit lead partner outside of committee meetings as required throughout the year.
COMMITTEE EVALUATIONAs outlined on page 57 within the Corporate Governance Statement, the performance of the Board also includes a review of the Committees. Any recommendations raised in relation to the Audit Committee are acted upon in a formal and structured manner. No issues were identified for the year ending 31 December 2016.
FINANCIAL REPORTINGThe committee is responsible for monitoring the integrity of the Group’s financial statements and reviewing the financial reporting judgements contained therein. The financial statements are prepared by a finance team with the appropriate qualifications and expertise.
The Committee confirmed to the Board that the annual report, taken as a whole, is fair, balanced and understandable and provides the information necessary for shareholders to assess the Group's position and performance, business model and strategy.
In respect of the year to 31 December 2016, the committee reviewed:
›› the Group’s Interim Management Statements issued in May and November 2016;
›› the Group’ s Interim Report for the six months to 30 June 2016; and
›› the Preliminary Announcement and Annual Report to 31 December 2016.
In carrying out these reviews, the committee: ›› reviewed the appropriateness
of Group accounting policies and monitored changes to and compliance with accounting standards on an on-going basis;
›› discussed with management and the external auditors the critical accounting policies and judgements that had been applied;
›› compared the results with management accounts and budgets, and reviewed reconciliations between these and the final results;
›› discussed a report from the external auditors at that meeting identifying the significant accounting and judgemental issues that arose in the course of the audit;
›› considered the management representation letter requested by the auditors for any non-standard issues and monitored action taken by management as a result of any recommendations;
›› discussed with management future accounting developments which are likely to affect the financial statements;
›› reviewed the budgets and strategic plans of the Group in order to ensure that all forward looking statements made within the Annual Report reflect the actual position of the Group; and
›› considered key areas in which estimates and judgement had been applied in preparation of the financial statements including, but not limited to, a review of fair values on acquisition, the carrying amount of goodwill, intangible assets and property, plant and equipment, litigation and warranty provisions, recoverability of trade receivables, valuation of inventory, hedge accounting treatments, treasury matters and tax matters.
The primary areas of judgement considered by the committee in relation to the Group’s 2016 financial statements, and how they were addressed by the committee are set out below.
Each of these areas received particular focus from the external auditor, who provided detailed analysis and assessment of the matter in their report to the committee.
In addition, the internal audit team review the businesses covered in their annual Internal Audit Plan, as agreed by the committee, and report their findings to the Audit Committee throughout the year. These internal audit reviews are focused on areas of judgement such as warranty provisions, trade receivables and inventory and provide the committee information on the adequacy and appropriateness of provisions in these areas.
Primary areas of judgement
Committee activity
Consideration of impairment of goodwill
The committee considered the annual impairment assessment of goodwill prepared by management for each Cash Generating Unit ("CGU") using a discounted cash flow analysis based on the strategic plans approved by the Board, including a sensitivity analysis on key assumptions. The primary judgement areas were the achievability of the long term business plans and the key macroeconomic and business specific assumptions. In considering the matter, the committee discussed with management the judgements made and the sensitivities performed. Further detail of the methodology is set out in Note 9 to the financial statements.
KPMG also provided the Committee with their evaluation of the impairment review process.Kingspan completed 6 acquisitions during the financial year. The allocation of goodwill to CGUs is not yet complete for all acquisitions but the methodology of the assessments of such items of goodwill was presented to the Committee and the results were deemed appropriate.
Adequacy of warranty provision
The committee reviewed the judgements applied by management in assessing both specific and risk based warranty provision at 31 December 2016. The committee reviewed and discussed with management the monthly reports presented to the Board which set out, for each of the Group’s divisions, warranty provision and warranty costs and analyse these costs as a percentage of divisional sales. A retrospective review of warranty provision at 31 December 2015 was also carried out in order to note any indication of management bias within the provisions and none was noted. The Committee was satisfied that such judgements were appropriate and the risk had been adequately addressed.
Recoverability of trade receivables and adequacy of provision
The committee reviewed the judgements applied by management in determining the bad debt provision at 31 December 2016. The committee reviewed and discussed with management the monthly Board report which sets out aged analysis of gross debtor balances and associated bad debt provision and reviewed security (including credit insurance) that is in place. A retrospective review of bad debt provision at 31 December 2015 was also carried out in order to note any indication of management bias within the provision and none was noted. The Committee was satisfied that such judgements were appropriate and the risk had been adequately addressed.
Valuation of inventory and adequacy of inventory provision
The committee reviewed the valuation and provisioning for inventory at 31 December 2016. The main area of judgement was the level of provisioning required for slow moving and obsolete inventory. The committee reviewed and discussed with management the monthly board report which sets out, for each of the Group’s divisions, gross inventory balances and associated obsolescence provision including an analysis by inventory, category and ageing. A retrospective review of the inventory provision at 31 December 2015 was also carried out in order to note any indication of management bias within the provisions and none was noted. The Committee was satisfied that such judgements were appropriate and the risk had been adequately addressed.
Taxation Provisioning for potential current tax liabilities and the level of deferred tax asset recognition in relation to accumulated tax losses are underpinned by a range of judgements. The committee addresses these issues through a range of reporting from senior management and a process of challenging the appropriateness of management’s views including the degree to which these are supported by professional advice from external legal and other advisory firms.
The Group’s accounting manual sets out detailed policies that prescribe the methodology to be used by management in calculating the above provisions. Each division formally confirms compliance with these policies on an annual basis.
The Committee was satisfied that such judgements were appropriate and the risk had been adequately addressed.
Accounting for acquisitions
Total acquisition consideration in 2016 amounted to €262.4m, including deferred contingent consideration and transfer of assets. The committee discussed with management and the external auditors the accounting treatment for newly acquired businesses, and the related judgements made by management, and were satisfied that the treatment in the Group’s financial statements was appropriate.
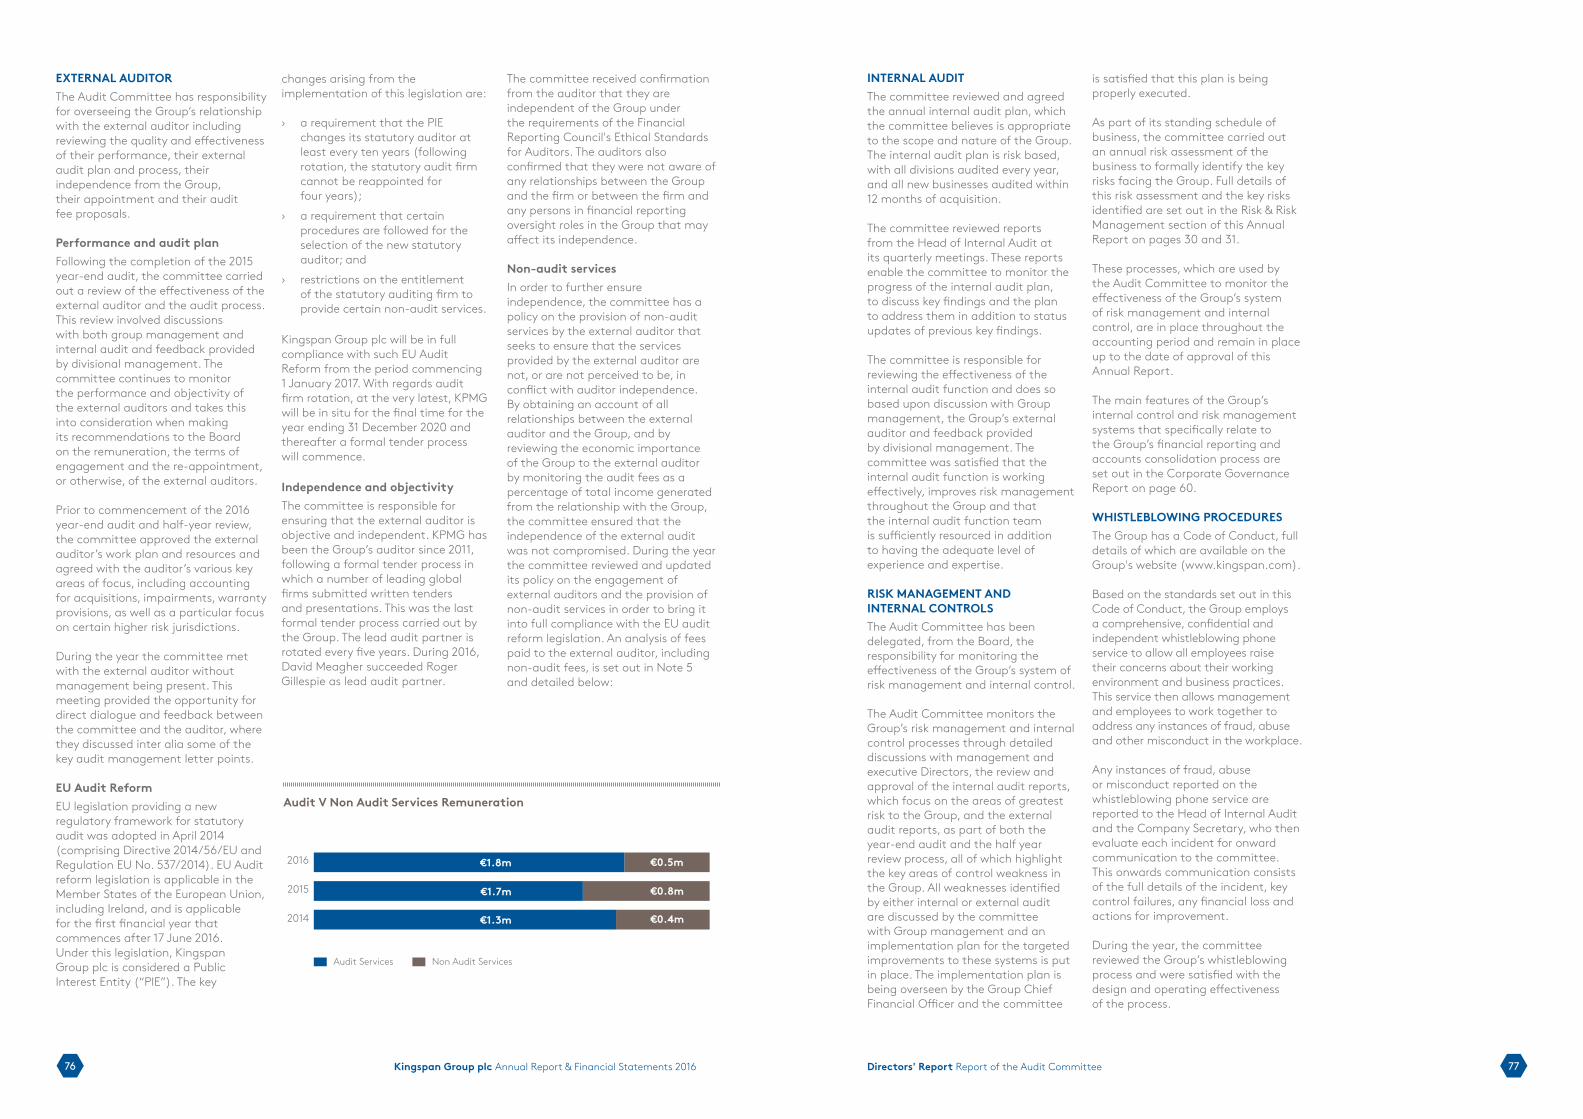
7776 Kingspan Group plc Annual Report & Financial Statements 2016 Directors' Report Report of the Audit Committee
EXTERNAL AUDITORThe Audit Committee has responsibility for overseeing the Group’s relationship with the external auditor including reviewing the quality and effectiveness of their performance, their external audit plan and process, their independence from the Group, their appointment and their audit fee proposals.
Performance and audit planFollowing the completion of the 2015 year-end audit, the committee carried out a review of the effectiveness of the external auditor and the audit process. This review involved discussions with both group management and internal audit and feedback provided by divisional management. The committee continues to monitor the performance and objectivity of the external auditors and takes this into consideration when making its recommendations to the Board on the remuneration, the terms of engagement and the re-appointment, or otherwise, of the external auditors.
Prior to commencement of the 2016 year-end audit and half-year review, the committee approved the external auditor’s work plan and resources and agreed with the auditor’s various key areas of focus, including accounting for acquisitions, impairments, warranty provisions, as well as a particular focus on certain higher risk jurisdictions.
During the year the committee met with the external auditor without management being present. This meeting provided the opportunity for direct dialogue and feedback between the committee and the auditor, where they discussed inter alia some of the key audit management letter points.
EU Audit ReformEU legislation providing a new regulatory framework for statutory audit was adopted in April 2014 (comprising Directive 2014/56/EU and Regulation EU No. 537/2014). EU Audit reform legislation is applicable in the Member States of the European Union, including Ireland, and is applicable for the first financial year that commences after 17 June 2016. Under this legislation, Kingspan Group plc is considered a Public Interest Entity (“PIE”). The key
INTERNAL AUDITThe committee reviewed and agreed the annual internal audit plan, which the committee believes is appropriate to the scope and nature of the Group. The internal audit plan is risk based, with all divisions audited every year, and all new businesses audited within 12 months of acquisition.
The committee reviewed reports from the Head of Internal Audit at its quarterly meetings. These reports enable the committee to monitor the progress of the internal audit plan, to discuss key findings and the plan to address them in addition to status updates of previous key findings.
The committee is responsible for reviewing the effectiveness of the internal audit function and does so based upon discussion with Group management, the Group’s external auditor and feedback provided by divisional management. The committee was satisfied that the internal audit function is working effectively, improves risk management throughout the Group and that the internal audit function team is sufficiently resourced in addition to having the adequate level of experience and expertise.
RISK MANAGEMENT AND INTERNAL CONTROLSThe Audit Committee has been delegated, from the Board, the responsibility for monitoring the effectiveness of the Group’s system of risk management and internal control.
The Audit Committee monitors the Group’s risk management and internal control processes through detailed discussions with management and executive Directors, the review and approval of the internal audit reports, which focus on the areas of greatest risk to the Group, and the external audit reports, as part of both the year-end audit and the half year review process, all of which highlight the key areas of control weakness in the Group. All weaknesses identified by either internal or external audit are discussed by the committee with Group management and an implementation plan for the targeted improvements to these systems is put in place. The implementation plan is being overseen by the Group Chief Financial Officer and the committee
is satisfied that this plan is being properly executed.
As part of its standing schedule of business, the committee carried out an annual risk assessment of the business to formally identify the key risks facing the Group. Full details of this risk assessment and the key risks identified are set out in the Risk & Risk Management section of this Annual Report on pages 30 and 31.
These processes, which are used by the Audit Committee to monitor the effectiveness of the Group’s system of risk management and internal control, are in place throughout the accounting period and remain in place up to the date of approval of this Annual Report.
The main features of the Group’s internal control and risk management systems that specifically relate to the Group’s financial reporting and accounts consolidation process are set out in the Corporate Governance Report on page 60.
WHISTLEBLOWING PROCEDURESThe Group has a Code of Conduct, full details of which are available on the Group's website (www.kingspan.com).
Based on the standards set out in this Code of Conduct, the Group employs a comprehensive, confidential and independent whistleblowing phone service to allow all employees raise their concerns about their working environment and business practices. This service then allows management and employees to work together to address any instances of fraud, abuse and other misconduct in the workplace.
Any instances of fraud, abuse or misconduct reported on the whistleblowing phone service are reported to the Head of Internal Audit and the Company Secretary, who then evaluate each incident for onward communication to the committee. This onwards communication consists of the full details of the incident, key control failures, any financial loss and actions for improvement.
During the year, the committee reviewed the Group’s whistleblowing process and were satisfied with the design and operating effectiveness of the process.
changes arising from the implementation of this legislation are:
›› a requirement that the PIE changes its statutory auditor at least every ten years (following rotation, the statutory audit firm cannot be reappointed for four years);
›› a requirement that certain procedures are followed for the selection of the new statutory auditor; and
›› restrictions on the entitlement of the statutory auditing firm to provide certain non-audit services.
Kingspan Group plc will be in full compliance with such EU Audit Reform from the period commencing 1 January 2017. With regards audit firm rotation, at the very latest, KPMG will be in situ for the final time for the year ending 31 December 2020 and thereafter a formal tender process will commence.
Independence and objectivityThe committee is responsible for ensuring that the external auditor is objective and independent. KPMG has been the Group’s auditor since 2011, following a formal tender process in which a number of leading global firms submitted written tenders and presentations. This was the last formal tender process carried out by the Group. The lead audit partner is rotated every five years. During 2016, David Meagher succeeded Roger Gillespie as lead audit partner.
The committee received confirmation from the auditor that they are independent of the Group under the requirements of the Financial Reporting Council's Ethical Standards for Auditors. The auditors also confirmed that they were not aware of any relationships between the Group and the firm or between the firm and any persons in financial reporting oversight roles in the Group that may affect its independence.
Non-audit servicesIn order to further ensure independence, the committee has a policy on the provision of non-audit services by the external auditor that seeks to ensure that the services provided by the external auditor are not, or are not perceived to be, in conflict with auditor independence. By obtaining an account of all relationships between the external auditor and the Group, and by reviewing the economic importance of the Group to the external auditor by monitoring the audit fees as a percentage of total income generated from the relationship with the Group, the committee ensured that the independence of the external audit was not compromised. During the year the committee reviewed and updated its policy on the engagement of external auditors and the provision of non-audit services in order to bring it into full compliance with the EU audit reform legislation. An analysis of fees paid to the external auditor, including non-audit fees, is set out in Note 5 and detailed below:
2016
2015
2014
€0.5m
€0.8m
€0.4m
Audit V Non Audit Services Remuneration
Audit Services Non Audit Services
€1.8m
€1.7m
€1.3m

78 Kingspan Group plc Annual Report & Financial Statements 2016
Isle of WightFairways—Insulation Boards: Kooltherm Cavity Board & Kooltherm Pitched Roof Board

79Financial Statements
FINANCIAL STATEMENTS
2016
Independent Auditor’s Report 80
Consolidated Income Statement 83
Consolidated Statement of Comprehensive Income 83
Consolidated Statement of Financial Position 84
Consolidated Statement of Changes in Equity 85
Consolidated Statement of Cash Flows 87
Company Statement of Financial Position 88
Company Statement of Changes in Equity 89
Company Statement of Cash Flows 90
Notes to the Financial Statements
1 Statement of Accounting Policies 912 Segment Reporting 993 Employees 1014 Finance Expense and Finance Income 1035 Profit for the Year Before Tax 1036 Directors’ Remuneration 1047 Income Tax Expense 1048 Earnings Per Share 1059 Goodwill 10510 Other Intangible Assets 10711 Joint Ventures 10712 Property, Plant and Equipment 10813 Investments in Subsidiaries 10914 Inventories 10915 Trade and Other Receivables 10916 Trade and Other Payables 11017 Interest Bearing Loans and Borrowings 11018 Deferred Contingent Consideration 11119 Financial Risk Management and Financial Instruments 11220 Provisions for Liabilities 11821 Deferred Tax Assets and Liabilities 11822 Business Combinations 11923 Share Capital 12124 Share Premium 12225 Treasury Shares 12226 Retained Earnings 12227 Dividends 12228 Non-Controlling Interest 12329 Reconciliation of Net Cash Flow
to Movement in Net Debt 12330 Cash Generated from Operations 12331 Guarantees and Other Financial Commitments 12432 Pension Obligations 12433 Related Party Transactions 12734 Post Balance Sheet Events 12735 Approval of Financial Statements 127
Other Information
Alternative Performance Measures 128 Shareholder information 130Principal Subsidiary Undertakings 133Group Five year summary 138
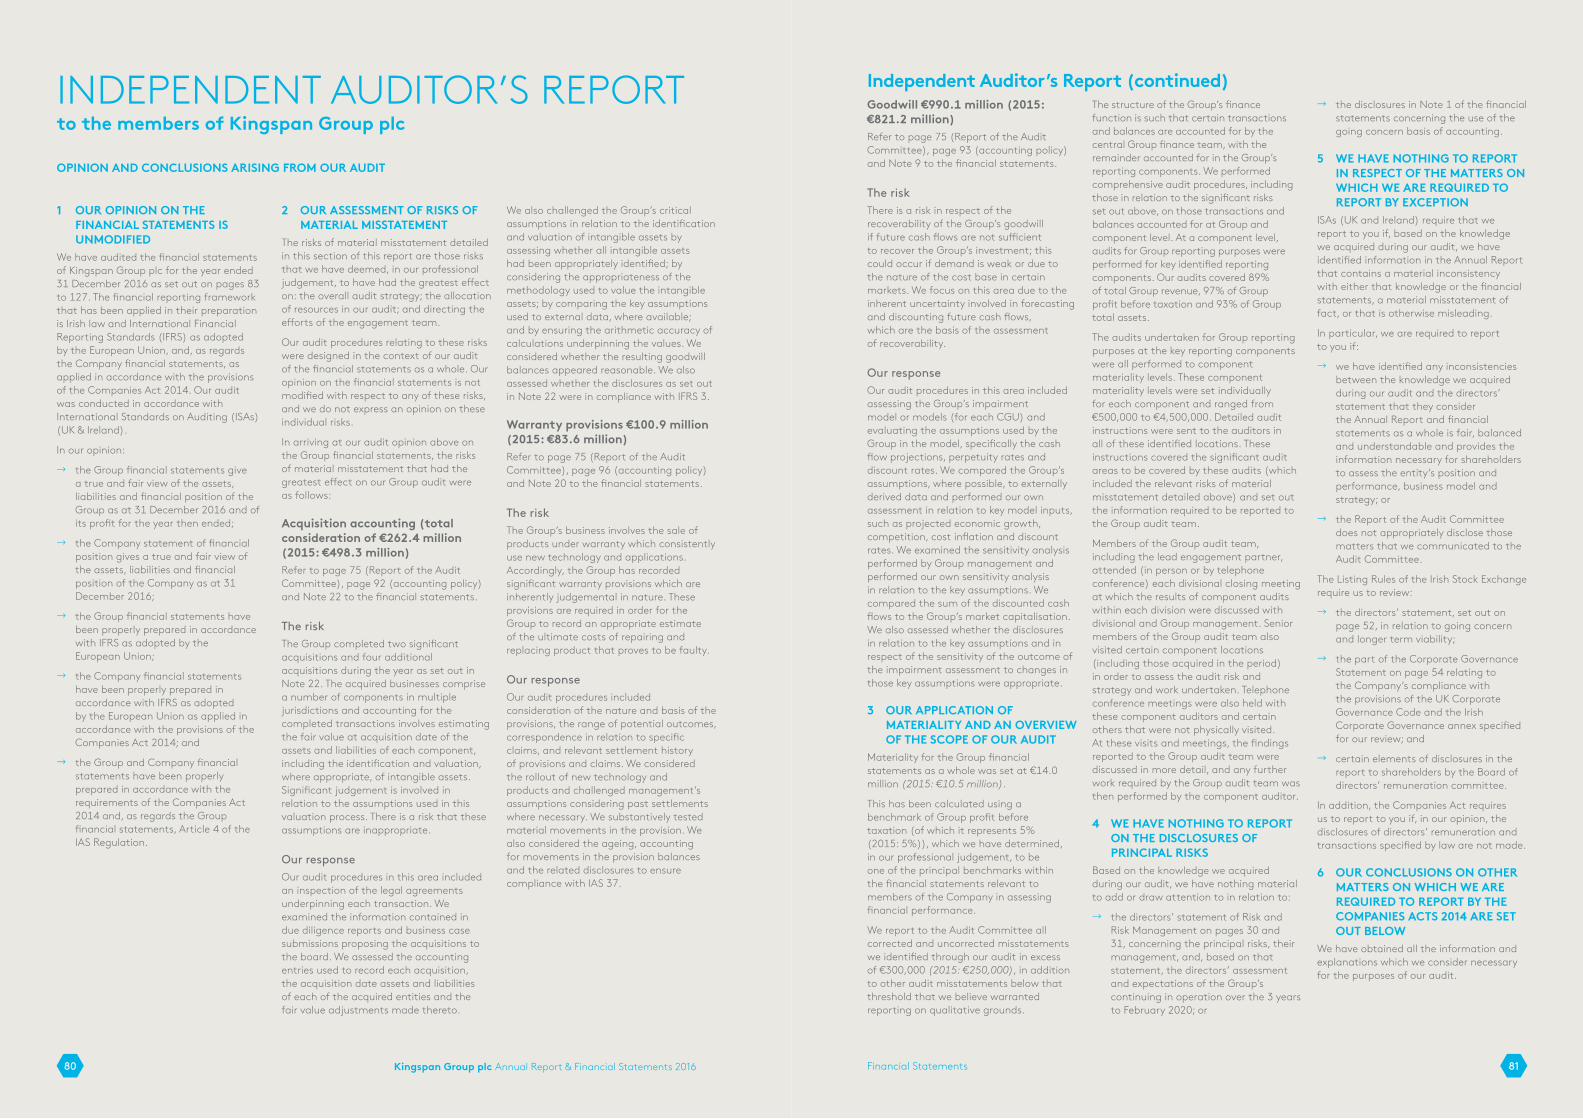
Kingspan Group plc Annual Report & Financial Statements 2016 81Financial Statements80
Goodwill €990.1 million (2015: €821.2 million)Refer to page 75 (Report of the Audit Committee), page 93 (accounting policy) and Note 9 to the financial statements.
The riskThere is a risk in respect of the recoverability of the Group’s goodwill if future cash flows are not sufficient to recover the Group’s investment; this could occur if demand is weak or due to the nature of the cost base in certain markets. We focus on this area due to the inherent uncertainty involved in forecasting and discounting future cash flows, which are the basis of the assessment of recoverability.
Our responseOur audit procedures in this area included assessing the Group’s impairment model or models (for each CGU) and evaluating the assumptions used by the Group in the model, specifically the cash flow projections, perpetuity rates and discount rates. We compared the Group’s assumptions, where possible, to externally derived data and performed our own assessment in relation to key model inputs, such as projected economic growth, competition, cost inflation and discount rates. We examined the sensitivity analysis performed by Group management and performed our own sensitivity analysis in relation to the key assumptions. We compared the sum of the discounted cash flows to the Group’s market capitalisation. We also assessed whether the disclosures in relation to the key assumptions and in respect of the sensitivity of the outcome of the impairment assessment to changes in those key assumptions were appropriate.
3 OUR APPLICATION OF MATERIALITY AND AN OVERVIEW OF THE SCOPE OF OUR AUDIT
Materiality for the Group financial statements as a whole was set at €14.0 million (2015: €10.5 million).
This has been calculated using a benchmark of Group profit before taxation (of which it represents 5% (2015: 5%)), which we have determined, in our professional judgement, to be one of the principal benchmarks within the financial statements relevant to members of the Company in assessing financial performance.
We report to the Audit Committee all corrected and uncorrected misstatements we identified through our audit in excess of €300,000 (2015: €250,000), in addition to other audit misstatements below that threshold that we believe warranted reporting on qualitative grounds.
The structure of the Group’s finance function is such that certain transactions and balances are accounted for by the central Group finance team, with the remainder accounted for in the Group’s reporting components. We performed comprehensive audit procedures, including those in relation to the significant risks set out above, on those transactions and balances accounted for at Group and component level. At a component level, audits for Group reporting purposes were performed for key identified reporting components. Our audits covered 89% of total Group revenue, 97% of Group profit before taxation and 93% of Group total assets.
The audits undertaken for Group reporting purposes at the key reporting components were all performed to component materiality levels. These component materiality levels were set individually for each component and ranged from €500,000 to €4,500,000. Detailed audit instructions were sent to the auditors in all of these identified locations. These instructions covered the significant audit areas to be covered by these audits (which included the relevant risks of material misstatement detailed above) and set out the information required to be reported to the Group audit team.
Members of the Group audit team, including the lead engagement partner, attended (in person or by telephone conference) each divisional closing meeting at which the results of component audits within each division were discussed with divisional and Group management. Senior members of the Group audit team also visited certain component locations (including those acquired in the period) in order to assess the audit risk and strategy and work undertaken. Telephone conference meetings were also held with these component auditors and certain others that were not physically visited. At these visits and meetings, the findings reported to the Group audit team were discussed in more detail, and any further work required by the Group audit team was then performed by the component auditor.
4 WE HAVE NOTHING TO REPORT ON THE DISCLOSURES OF PRINCIPAL RISKS
Based on the knowledge we acquired during our audit, we have nothing material to add or draw attention to in relation to:
! the directors’ statement of Risk and Risk Management on pages 30 and 31, concerning the principal risks, their management, and, based on that statement, the directors’ assessment and expectations of the Group’s continuing in operation over the 3 years to February 2020; or
! the disclosures in Note 1 of the financial statements concerning the use of the going concern basis of accounting.
5 WE HAVE NOTHING TO REPORT IN RESPECT OF THE MATTERS ON WHICH WE ARE REQUIRED TO REPORT BY EXCEPTION
ISAs (UK and Ireland) require that we report to you if, based on the knowledge we acquired during our audit, we have identified information in the Annual Report that contains a material inconsistency with either that knowledge or the financial statements, a material misstatement of fact, or that is otherwise misleading.
In particular, we are required to report to you if:
! we have identified any inconsistencies between the knowledge we acquired during our audit and the directors’ statement that they consider the Annual Report and financial statements as a whole is fair, balanced and understandable and provides the information necessary for shareholders to assess the entity’s position and performance, business model and strategy; or
! the Report of the Audit Committee does not appropriately disclose those matters that we communicated to the Audit Committee.
The Listing Rules of the Irish Stock Exchange require us to review:
! the directors’ statement, set out on page 52, in relation to going concern and longer term viability;
! the part of the Corporate Governance Statement on page 54 relating to the Company’s compliance with the provisions of the UK Corporate Governance Code and the Irish Corporate Governance annex specified for our review; and
! certain elements of disclosures in the report to shareholders by the Board of directors’ remuneration committee.
In addition, the Companies Act requires us to report to you if, in our opinion, the disclosures of directors’ remuneration and transactions specified by law are not made.
6 OUR CONCLUSIONS ON OTHER MATTERS ON WHICH WE ARE REQUIRED TO REPORT BY THE COMPANIES ACTS 2014 ARE SET OUT BELOW
We have obtained all the information and explanations which we consider necessary for the purposes of our audit.
1 OUR OPINION ON THE FINANCIAL STATEMENTS IS UNMODIFIED
We have audited the financial statements of Kingspan Group plc for the year ended 31 December 2016 as set out on pages 83 to 127. The financial reporting framework that has been applied in their preparation is Irish law and International Financial Reporting Standards (IFRS) as adopted by the European Union, and, as regards the Company financial statements, as applied in accordance with the provisions of the Companies Act 2014. Our audit was conducted in accordance with International Standards on Auditing (ISAs) (UK & Ireland).
In our opinion:
! the Group financial statements give a true and fair view of the assets, liabilities and financial position of the Group as at 31 December 2016 and of its profit for the year then ended;
! the Company statement of financial position gives a true and fair view of the assets, liabilities and financial position of the Company as at 31 December 2016;
! the Group financial statements have been properly prepared in accordance with IFRS as adopted by the European Union;
! the Company financial statements have been properly prepared in accordance with IFRS as adopted by the European Union as applied in accordance with the provisions of the Companies Act 2014; and
! the Group and Company financial statements have been properly prepared in accordance with the requirements of the Companies Act 2014 and, as regards the Group financial statements, Article 4 of the IAS Regulation.
2 OUR ASSESSMENT OF RISKS OF MATERIAL MISSTATEMENT
The risks of material misstatement detailed in this section of this report are those risks that we have deemed, in our professional judgement, to have had the greatest effect on: the overall audit strategy; the allocation of resources in our audit; and directing the efforts of the engagement team.
Our audit procedures relating to these risks were designed in the context of our audit of the financial statements as a whole. Our opinion on the financial statements is not modified with respect to any of these risks, and we do not express an opinion on these individual risks.
In arriving at our audit opinion above on the Group financial statements, the risks of material misstatement that had the greatest effect on our Group audit were as follows:
Acquisition accounting (total consideration of €262.4 million (2015: €498.3 million)Refer to page 75 (Report of the Audit Committee), page 92 (accounting policy) and Note 22 to the financial statements.
The riskThe Group completed two significant acquisitions and four additional acquisitions during the year as set out in Note 22. The acquired businesses comprise a number of components in multiple jurisdictions and accounting for the completed transactions involves estimating the fair value at acquisition date of the assets and liabilities of each component, including the identification and valuation, where appropriate, of intangible assets. Significant judgement is involved in relation to the assumptions used in this valuation process. There is a risk that these assumptions are inappropriate.
Our responseOur audit procedures in this area included an inspection of the legal agreements underpinning each transaction. We examined the information contained in due diligence reports and business case submissions proposing the acquisitions to the board. We assessed the accounting entries used to record each acquisition, the acquisition date assets and liabilities of each of the acquired entities and the fair value adjustments made thereto.
We also challenged the Group’s critical assumptions in relation to the identification and valuation of intangible assets by assessing whether all intangible assets had been appropriately identified; by considering the appropriateness of the methodology used to value the intangible assets; by comparing the key assumptions used to external data, where available; and by ensuring the arithmetic accuracy of calculations underpinning the values. We considered whether the resulting goodwill balances appeared reasonable. We also assessed whether the disclosures as set out in Note 22 were in compliance with IFRS 3.
Warranty provisions €100.9 million (2015: €83.6 million)Refer to page 75 (Report of the Audit Committee), page 96 (accounting policy) and Note 20 to the financial statements.
The riskThe Group’s business involves the sale of products under warranty which consistently use new technology and applications. Accordingly, the Group has recorded significant warranty provisions which are inherently judgemental in nature. These provisions are required in order for the Group to record an appropriate estimate of the ultimate costs of repairing and replacing product that proves to be faulty.
Our responseOur audit procedures included consideration of the nature and basis of the provisions, the range of potential outcomes, correspondence in relation to specific claims, and relevant settlement history of provisions and claims. We considered the rollout of new technology and products and challenged management’s assumptions considering past settlements where necessary. We substantively tested material movements in the provision. We also considered the ageing, accounting for movements in the provision balances and the related disclosures to ensure compliance with IAS 37.
INDEPENDENT AUDITOR’S REPORTto the members of Kingspan Group plc
OPINION AND CONCLUSIONS ARISING FROM OUR AUDIT
Independent Auditor’s Report (continued)

Kingspan Group plc Annual Report & Financial Statements 2016 83Financial Statements82
Consolidated Income Statement For the year ended 31 December 2016
Note 2016€m
2015€m
REVENUE 2 3,108.5 2,774.3Cost of sales (2,168.3) (1,966.9)
GROSS PROFIT 940.2 807.4Operating costs, excluding intangible amortisation (599.3) (551.5)
TRADING PROFIT 2 340.9 255.9Intangible amortisation 2 (12.6) (9.1)
OPERATING PROFIT 328.3 246.8Finance expense 4 (14.4) (15.1)Finance income 4 0.1 0.3
PROFIT FOR THE YEAR BEFORE INCOME TAX 5 314.0 232.0Income tax expense 7 (58.5) (41.4)
NET PROFIT FOR THE YEAR FROM CONTINUING OPERATIONS 255.5 190.6
Attributable to owners of Kingspan Group plc 255.4 188.1Attributable to non-controlling interests 28 0.1 2.5
255.5 190.6
EARNINGS PER SHARE FOR THE YEARBasic 8 143.8c 106.7c
Diluted 8 141.6c 105.0c
Gene M. Murtagh Geoff Doherty 17 February 2017Chief Executive Officer Chief Financial Officer
Consolidated Statement of Comprehensive Income For the year ended 31 December 2016
Note 2016€m
2015€m
Profit for the year 255.5 190.6
Other comprehensive income:
Items that may be reclassified subsequently to profit or lossExchange differences on translating foreign operations (43.8) 40.6Effective portion of changes in fair value of cash flow hedges (0.7) 3.2Income taxes relating to changes in fair value of cash flow hedges 21 0.1 (0.1)
Items that will not be reclassified subsequently to profit or lossActuarial (losses)/gains on defined benefit pension schemes 32 (2.9) 1.8Income taxes relating to actuarial (losses)/gains on defined benefit pension schemes 21 0.6 (0.2)
Total other comprehensive income (46.7) 45.3
Total comprehensive income for the year 208.8 235.9
Attributable to owners of Kingspan Group plc 208.2 232.5Attributable to non-controlling interests 28 0.6 3.4
208.8 235.9
The Company Statement of Financial Position is in agreement with its accounting records and in our opinion adequate accounting records have been kept by the company.
In our opinion the information given in the Directors’ Report is consistent with the financial statements and the description in the Corporate Governance Statement of the main features of the internal control and risk management systems in relation to the process for preparing the Group financial statements is consistent with the Group financial statements.
In addition we report, in relation to information given in the Corporate Governance Statement on page 60, that:
! based on knowledge and understanding of the Group and its environment obtained in the course of our audit, no material misstatements in the information identified above have come to our attention;
! based on the work undertaken in the course of our audit, in our opinion
» the description of the main features of the internal control and risk management systems in relation to the process for preparing the Group financial statements, and information relating to voting rights and other matters required by the European Communities (Takeover Bids (Directive 2004/25/EC) Regulations 2006 and specified by the Companies Act 2014 for our consideration, are consistent with the financial statements and have been prepared in accordance with the Companies Act 2014, and
» the Corporate Governance Statement contains the information required by the Companies Act 2014.
Basis of our report, responsibilities and restrictions on useAs explained more fully in the Statement of Directors’ Responsibilities set out on page 52, the directors are responsible for the preparation of the financial statements and for being satisfied that they give a true and fair view. Our responsibility is to audit and express an opinion on the Group and Company financial statements in accordance with applicable law and International Standards on Auditing (ISAs) (UK and Ireland). Those standards require us to comply with the Financial Reporting Council’s Ethical Standards for Auditors.
An audit undertaken in accordance with ISAs (UK and Ireland) involves obtaining evidence about the amounts and disclosures in the financial statements sufficient to give reasonable assurance
that the financial statements are free from material misstatement, whether caused by fraud or error. This includes an assessment of: whether the accounting policies are appropriate to the Group’s and Company’s circumstances and have been consistently applied and adequately disclosed; the reasonableness of significant accounting estimates made by the directors; and the overall presentation of the financial statements.
In addition, we read all the financial and non-financial information in the Annual Report to identify material inconsistencies with the audited financial statements and to identify any information that is apparently materially incorrect based on, or materially inconsistent with, the knowledge acquired by us in the course of performing our audit. If we become aware of any apparent material misstatements or inconsistencies we consider the implications for our report.
Whilst an audit conducted in accordance with ISAs (UK and Ireland) is designed to provide reasonable assurance of identifying material misstatements or omissions it is not guaranteed to do so. Rather the auditor plans the audit to determine the extent of testing needed to reduce to an appropriately low level the probability that the aggregate of uncorrected and undetected misstatements does not exceed materiality for the financial statements as a whole. This testing requires us to conduct significant audit work on a broad range of assets, liabilities, income and expense as well as devoting significant time of the most experienced members of the audit team, in particular the engagement partner responsible for the audit, to subjective areas of accounting and reporting.
Our report is made solely to the Company’s members, as a body, in accordance with section 391 of the Companies Act 2014. Our audit work has been undertaken so that we might state to the company’s members those matters we are required to state to them in an auditor’s report and for no other purpose. To the fullest extent permitted by law, we do not accept or assume responsibility to anyone other than the Company and the Company’s members as a body, for our audit work, for this report, or for the opinions we have formed.
David Meagher for and on behalf ofKPMGChartered Accountants, Statutory Audit Firm1 Stokes PlaceSt. Stephen’s GreenDublin 2Ireland
17 February 2017
Independent Auditor’s Report (continued)

Kingspan Group plc Annual Report & Financial Statements 2016 85Financial Statements84
Con
solid
ated
Sta
tem
ent
of C
hang
es in
Equ
ity
For t
he y
ear e
nded
31
Dec
embe
r 201
6
Shar
e C
apit
alSh
are
Prem
ium
Cap
ital
Re
dem
ptio
n Re
serv
eTr
easu
ry
Shar
esTr
ansl
atio
n Re
serv
e
Cas
h Fl
ow
Hed
ging
Re
serv
e
Shar
e Ba
sed
Paym
ent
Rese
rve
Reva
luat
ion
Rese
rve
Reta
ined
Ea
rnin
gs
Tota
l At
trib
utab
le
to O
wne
rs o
f th
e Pa
rent
Non
- co
ntro
lling
In
tere
stTo
tal
Equi
ty
€m€m
€m€m
€m€m
€m€m
€m€m
€m€m
Bala
nce
at 1
Janu
ary
2016
23.3
92.5
0.7
(11.
3)(5
0.9)
2.9
29.6
0.7
1,19
4.9
1,28
2.4
11.4
1,29
3.8
Tran
sact
ions
wit
h ow
ners
reco
gnis
ed d
irect
ly
in e
quit
y
Empl
oyee
sha
re b
ased
com
pens
atio
n 0.
13.
1-
--
-10
.4-
-13
.6-
13.6
Tax
on e
mpl
oyee
sha
re b
ased
com
pens
atio
n-
--
--
-(0
.3)
-1.
71.
4-
1.4
Exer
cise
or l
apsin
g of
sha
re o
ptio
ns
--
--
--
(6.4
)-
6.4
--
-Re
purc
hase
of s
hare
s-
--
(1.3
)-
--
--
(1.3
)-
(1.3
)Tr
ansf
er o
f sha
res
--
-0.
1-
--
--
0.1
-0.
1D
ivid
ends
--
--
--
--
(48.
0)(4
8.0)
-(4
8.0)
Tran
sact
ions
with
non
-con
trol
ling
inte
rest
s:Ar
ising
on
acqu
isitio
n-
--
--
--
--
-3.
53.
5C
hang
e of
ow
ners
hip
inte
rest
--
--
--
--
(1.5
)(1
.5)
1.5
-D
ivid
ends
pai
d to
non
-con
trol
ling
inte
rest
--
--
--
--
--
(0.4
)(0
.4)
Tran
sact
ions
wit
h ow
ners
0.1
3.1
-(1
.2)
--
3.7
-(4
1.4)
(35.
7)4.
6(3
1.1)
Tota
l com
preh
ensi
ve in
com
e fo
r the
yea
r
Profi
t fo
r the
yea
r-
--
--
--
-25
5.4
255.
40.
125
5.5
Oth
er c
ompr
ehen
sive
inco
me:
Item
s th
at m
ay b
e re
clas
sifi
ed s
ubse
quen
tly
to
profi
t or
loss
Cas
h flo
w h
edgi
ng in
equ
ity-
curr
ent y
ear
--
--
-(0
.7)
--
-(0
.7)
-(0
.7)
- ta
x im
pact
--
--
-0.
1-
--
0.1
-0.
1Ex
chan
ge d
iffer
ence
s on
tra
nsla
ting
fore
ign
oper
atio
ns-
--
-(4
4.3)
--
--
(44.
3)0.
5(4
3.8)
Item
s th
at w
ill n
ot b
e re
clas
sifi
ed s
ubse
quen
tly
to p
rofi
t or
loss
Actu
aria
l los
ses
of d
efine
d be
nefit
pen
sion
sche
me
--
--
--
--
(2.9
)(2
.9)
-(2
.9)
Inco
me
taxe
s re
latin
g to
act
uaria
l los
ses
on
defin
ed b
enefi
t pe
nsio
n sc
hem
e-
--
--
--
-0.
60.
6-
0.6
Tota
l com
preh
ensi
ve in
com
e fo
r the
yea
r-
--
-(4
4.3)
(0.6
)-
-25
3.1
208.
20.
620
8.8
Bala
nce
at 3
1 D
ecem
ber 2
016
23.4
95.6
0.7
(12.
5)(9
5.2)
2.3
33.3
0.7
1,40
6.6
1,45
4.9
16.6
1,47
1.5Consolidated Statement of Financial Position
As at 31 December 2016Note 2016
€m2015
€m
ASSETSNON-CURRENT ASSETSGoodwill 9 990.1 821.2Other intangible assets 10 91.9 78.4Property, plant and equipment 12 665.5 619.1Derivative financial instruments 19 40.6 29.6Retirement benefit assets 32 6.7 7.8Deferred tax assets 21 12.0 10.9
1,806.8 1,567.0CURRENT ASSETSInventories 14 365.5 293.5Trade and other receivables 15 601.9 474.5Derivative financial instruments 19 8.4 2.1Cash and cash equivalents 222.0 212.0
1,197.8 982.1TOTAL ASSETS 3,004.6 2,549.1
LIABILITIESCURRENT LIABILITIESTrade and other payables 16 585.2 468.2Provisions for liabilities 20 55.5 47.2Derivative financial instruments 19 - 0.1Deferred contingent consideration 18 6.8 9.5Interest bearing loans and borrowings 17 41.1 98.7Current income tax liabilities 77.1 64.5
765.7 688.2NON-CURRENT LIABILITIESRetirement benefit obligations 32 20.8 15.1Provisions for liabilities 20 45.4 36.4Interest bearing loans and borrowings 17 657.3 470.9Deferred tax liabilities 21 37.8 44.1Deferred contingent consideration 18 6.1 0.6
767.4 567.1
TOTAL LIABILITIES 1,533.1 1,255.3NET ASSETS 1,471.5 1,293.8
EQUITYShare capital 23 23.4 23.3Share premium 24 95.6 92.5Capital redemption reserve 0.7 0.7Treasury shares 25 (12.5) (11.3)Other reserves (58.9) (17.7)Retained earnings 1,406.6 1,194.9EQUITY ATTRIBUTABLE TO OWNERS OF KINGSPAN GROUP PLC 1,454.9 1,282.4NON-CONTROLLING INTEREST 28 16.6 11.4
TOTAL EQUITY 1,471.5 1,293.8
Gene M. Murtagh Geoff Doherty 17 February 2017Chief Executive Officer Chief Financial Officer
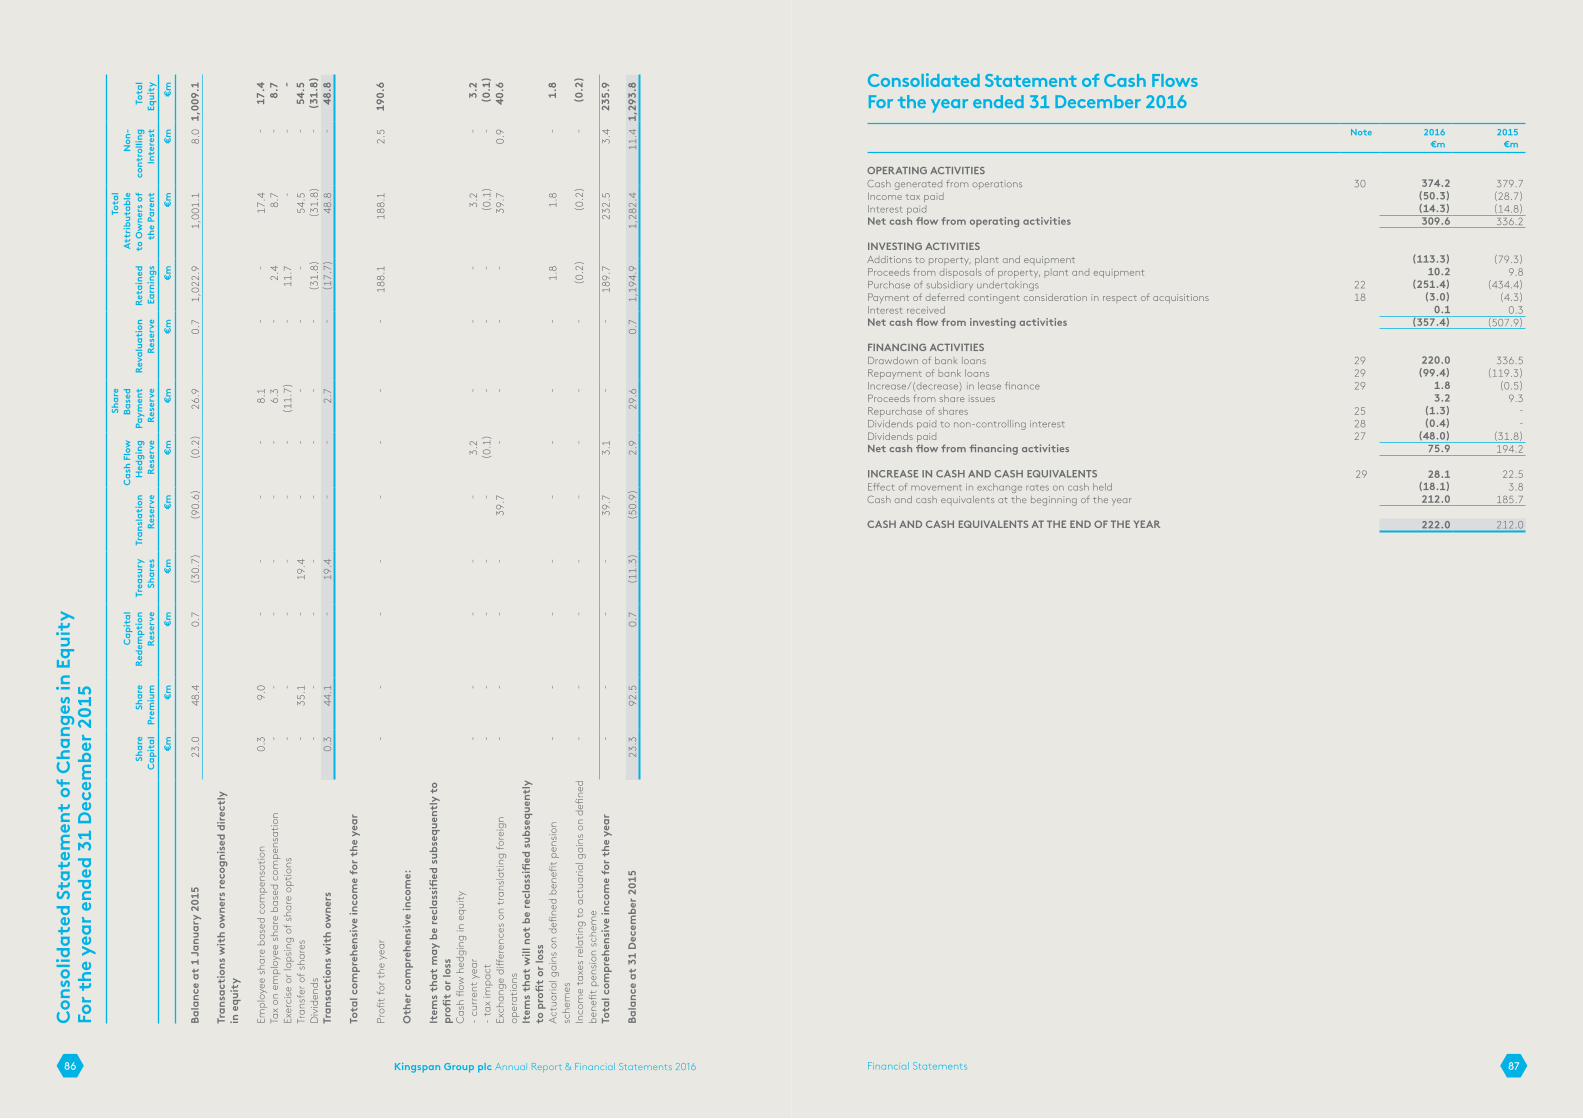
Kingspan Group plc Annual Report & Financial Statements 2016 87Financial Statements86
Consolidated Statement of Cash Flows For the year ended 31 December 2016
Note 2016€m
2015€m
OPERATING ACTIVITIESCash generated from operations 30 374.2 379.7Income tax paid (50.3) (28.7)Interest paid (14.3) (14.8)Net cash flow from operating activities 309.6 336.2
INVESTING ACTIVITIESAdditions to property, plant and equipment (113.3) (79.3)Proceeds from disposals of property, plant and equipment 10.2 9.8Purchase of subsidiary undertakings 22 (251.4) (434.4)Payment of deferred contingent consideration in respect of acquisitions 18 (3.0) (4.3)Interest received 0.1 0.3Net cash flow from investing activities (357.4) (507.9)
FINANCING ACTIVITIESDrawdown of bank loans 29 220.0 336.5Repayment of bank loans 29 (99.4) (119.3)Increase/(decrease) in lease finance 29 1.8 (0.5)Proceeds from share issues 3.2 9.3Repurchase of shares 25 (1.3) -Dividends paid to non-controlling interest 28 (0.4) -Dividends paid 27 (48.0) (31.8)Net cash flow from financing activities 75.9 194.2
INCREASE IN CASH AND CASH EQUIVALENTS 29 28.1 22.5Effect of movement in exchange rates on cash held (18.1) 3.8Cash and cash equivalents at the beginning of the year 212.0 185.7
CASH AND CASH EQUIVALENTS AT THE END OF THE YEAR 222.0 212.0
Con
solid
ated
Sta
tem
ent
of C
hang
es in
Equ
ity
For t
he y
ear e
nded
31
Dec
embe
r 201
5
Shar
e C
apit
alSh
are
Prem
ium
Cap
ital
Re
dem
ptio
n Re
serv
eTr
easu
ry
Shar
esTr
ansl
atio
n Re
serv
e
Cas
h Fl
ow
Hed
ging
Re
serv
e
Shar
e Ba
sed
Paym
ent
Rese
rve
Reva
luat
ion
Rese
rve
Reta
ined
Ea
rnin
gs
Tota
l At
trib
utab
le
to O
wne
rs o
f th
e Pa
rent
Non
- co
ntro
lling
In
tere
stTo
tal
Equi
ty
€m€m
€m€m
€m€m
€m€m
€m€m
€m€m
Bala
nce
at 1
Jan
uary
201
523
.048
.40.
7(3
0.7)
(90.
6)(0
.2)
26.9
0.7
1,02
2.9
1,00
1.1
8.0
1,00
9.1
Tran
sact
ions
wit
h ow
ners
reco
gnis
ed d
irect
ly
in e
quit
y
Empl
oyee
sha
re b
ased
com
pens
atio
n 0.
39.
0-
--
-8.
1-
-17
.4-
17.4
Tax
on e
mpl
oyee
sha
re b
ased
com
pens
atio
n-
--
--
-6.
3-
2.4
8.7
-8.
7Ex
erci
se o
r lap
sing
of s
hare
opt
ions
-
--
--
-(1
1.7)
-11
.7-
--
Tran
sfer
of s
hare
s-
35.1
-19
.4-
--
--
54.5
-54
.5D
ivid
ends
--
--
--
--
(31.
8)(3
1.8)
-(3
1.8)
Tran
sact
ions
wit
h ow
ners
0.3
44.1
-19
.4-
-2.
7-
(17.
7)48
.8-
48.8
Tota
l com
preh
ensi
ve in
com
e fo
r the
yea
r
Profi
t fo
r the
yea
r-
--
--
--
-18
8.1
188.
12.
519
0.6
Oth
er c
ompr
ehen
sive
inco
me:
Item
s th
at m
ay b
e re
clas
sifi
ed s
ubse
quen
tly
to
profi
t or
loss
Cas
h flo
w h
edgi
ng in
equ
ity-
curr
ent y
ear
--
--
-3.
2-
--
3.2
-3.
2-
tax
impa
ct-
--
--
(0.1
)-
--
(0.1
)-
(0.1
)Ex
chan
ge d
iffer
ence
s on
tra
nsla
ting
fore
ign
oper
atio
ns-
--
-39
.7-
--
-39
.70.
940
.6
Item
s th
at w
ill n
ot b
e re
clas
sifi
ed s
ubse
quen
tly
to p
rofi
t or
loss
Actu
aria
l gai
ns o
n de
fined
ben
efit
pens
ion
sche
mes
--
--
--
--
1.8
1.8
-1.
8
Inco
me
taxe
s re
latin
g to
act
uaria
l gai
ns o
n de
fined
be
nefit
pen
sion
sche
me
--
--
--
--
(0.2
)(0
.2)
-(0
.2)
Tota
l com
preh
ensi
ve in
com
e fo
r the
yea
r-
--
-39
.73.
1-
-18
9.7
232.
53.
423
5.9
Bala
nce
at 3
1 D
ecem
ber 2
015
23.3
92.5
0.7
(11.
3)(5
0.9)
2.9
29.6
0.7
1,19
4.9
1,28
2.4
11.4
1,29
3.8

Kingspan Group plc Annual Report & Financial Statements 2016 89Financial Statements88
Company Statement of Financial Position As at 31 December 2016
Note 2016€m
2015€m
ASSETS
NON-CURRENT ASSETSInvestments in subsidiaries 13 1,173.3 1,164.3
CURRENT ASSETSIntercompany receivables 144.6 184.3
TOTAL ASSETS 1,317.9 1,348.6
LIABILITIES
CURRENT LIABILITIESPayables (0.1) (0.1)
TOTAL LIABILITIES (0.1) (0.1)
NET ASSETS 1,317.8 1,348.5
EQUITY
Equity attributable to owners of Kingspan Group plcShare capital 23 23.4 23.3Share premium 24 95.6 92.5Capital redemption reserve 0.7 0.7Treasury shares 25 (12.5) (11.3)Retained earnings 26 1,210.6 1,243.3
TOTAL EQUITY 1,317.8 1,348.5
Gene M. Murtagh Geoff Doherty 17 February 2017Chief Executive Officer Chief Financial Officer
Company Statement of Changes in Equity For the year ended 31 December 2016
Share Capital
Share Premium
Capital Redemption
ReserveTreasury
SharesRetained Earnings
Shareholders’ Equity
€m €m €m €m €m €m
Balance at 1 January 2016 23.3 92.5 0.7 (11.3) 1,243.3 1,348.5
Shares issued 0.1 3.1 - - - 3.2Repurchase of shares - - - (1.3) - (1.3)Transfer of shares - - - 0.1 - 0.1Employee share based compensation - - - - 10.4 10.4Dividends - - - - (48.0) (48.0)
Transactions with owners 0.1 3.1 - (1.2) (37.6) (35.6)
Profit for the year - - - - 4.9 4.9
Balance at 31 December 2016 23.4 95.6 0.7 (12.5) 1,210.6 1,317.8
Share Capital
Share Premium
Capital Redemption
ReserveTreasury
SharesRetained Earnings
Shareholders’ Equity
€m €m €m €m €m €m
Balance at 1 January 2015 23.0 48.4 0.7 (30.7) 1,260.0 1,301.4
Shares issued 0.3 9.0 - - - 9.3Transfer of shares - 35.1 - 19.4 - 54.5Employee share based compensation - - - - 8.1 8.1Dividends - - - - (31.8) (31.8)
Transactions with owners 0.3 44.1 - 19.4 (23.7) 40.1
Profit for the year - - - - 7.0 7.0
Balance at 31 December 2015 23.3 92.5 0.7 (11.3) 1,243.3 1,348.5
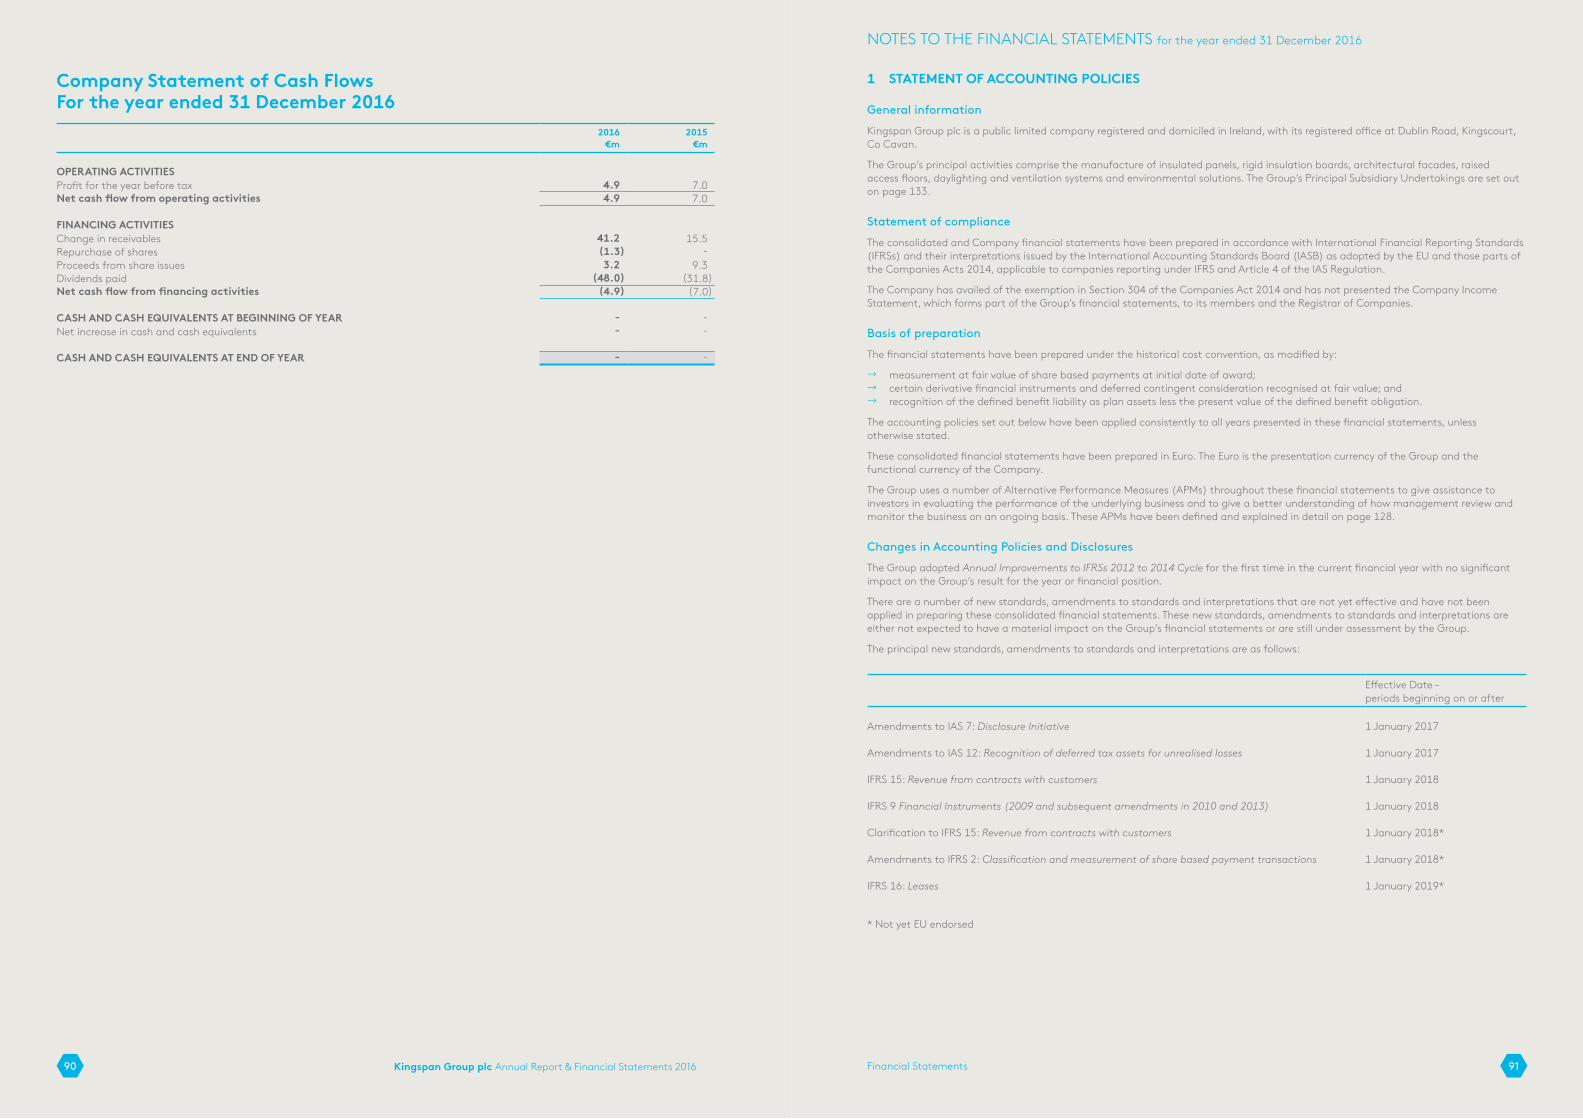
Kingspan Group plc Annual Report & Financial Statements 2016 91Financial Statements90
NOTES TO THE FINANCIAL STATEMENTS for the year ended 31 December 2016
Company Statement of Cash Flows For the year ended 31 December 2016
2016€m
2015€m
OPERATING ACTIVITIESProfit for the year before tax 4.9 7.0Net cash flow from operating activities 4.9 7.0
FINANCING ACTIVITIESChange in receivables 41.2 15.5Repurchase of shares (1.3) -Proceeds from share issues 3.2 9.3Dividends paid (48.0) (31.8)Net cash flow from financing activities (4.9) (7.0)
CASH AND CASH EQUIVALENTS AT BEGINNING OF YEAR - -Net increase in cash and cash equivalents - -
CASH AND CASH EQUIVALENTS AT END OF YEAR - -
1 STATEMENT OF ACCOUNTING POLICIES
General information
Kingspan Group plc is a public limited company registered and domiciled in Ireland, with its registered office at Dublin Road, Kingscourt, Co Cavan.
The Group’s principal activities comprise the manufacture of insulated panels, rigid insulation boards, architectural facades, raised access floors, daylighting and ventilation systems and environmental solutions. The Group’s Principal Subsidiary Undertakings are set out on page 133.
Statement of compliance
The consolidated and Company financial statements have been prepared in accordance with International Financial Reporting Standards (IFRSs) and their interpretations issued by the International Accounting Standards Board (IASB) as adopted by the EU and those parts of the Companies Acts 2014, applicable to companies reporting under IFRS and Article 4 of the IAS Regulation.
The Company has availed of the exemption in Section 304 of the Companies Act 2014 and has not presented the Company Income Statement, which forms part of the Group’s financial statements, to its members and the Registrar of Companies.
Basis of preparation
The financial statements have been prepared under the historical cost convention, as modified by:
! measurement at fair value of share based payments at initial date of award; ! certain derivative financial instruments and deferred contingent consideration recognised at fair value; and ! recognition of the defined benefit liability as plan assets less the present value of the defined benefit obligation.
The accounting policies set out below have been applied consistently to all years presented in these financial statements, unless otherwise stated.
These consolidated financial statements have been prepared in Euro. The Euro is the presentation currency of the Group and the functional currency of the Company.
The Group uses a number of Alternative Performance Measures (APMs) throughout these financial statements to give assistance to investors in evaluating the performance of the underlying business and to give a better understanding of how management review and monitor the business on an ongoing basis. These APMs have been defined and explained in detail on page 128.
Changes in Accounting Policies and Disclosures
The Group adopted Annual Improvements to IFRSs 2012 to 2014 Cycle for the first time in the current financial year with no significant impact on the Group’s result for the year or financial position.
There are a number of new standards, amendments to standards and interpretations that are not yet effective and have not been applied in preparing these consolidated financial statements. These new standards, amendments to standards and interpretations are either not expected to have a material impact on the Group’s financial statements or are still under assessment by the Group.
The principal new standards, amendments to standards and interpretations are as follows:
Effective Date – periods beginning on or after
Amendments to IAS 7: Disclosure Initiative 1 January 2017
Amendments to IAS 12: Recognition of deferred tax assets for unrealised losses 1 January 2017
IFRS 15: Revenue from contracts with customers 1 January 2018
IFRS 9 Financial Instruments (2009 and subsequent amendments in 2010 and 2013) 1 January 2018
Clarification to IFRS 15: Revenue from contracts with customers 1 January 2018*
Amendments to IFRS 2: Classification and measurement of share based payment transactions 1 January 2018*
IFRS 16: Leases 1 January 2019*
* Not yet EU endorsed
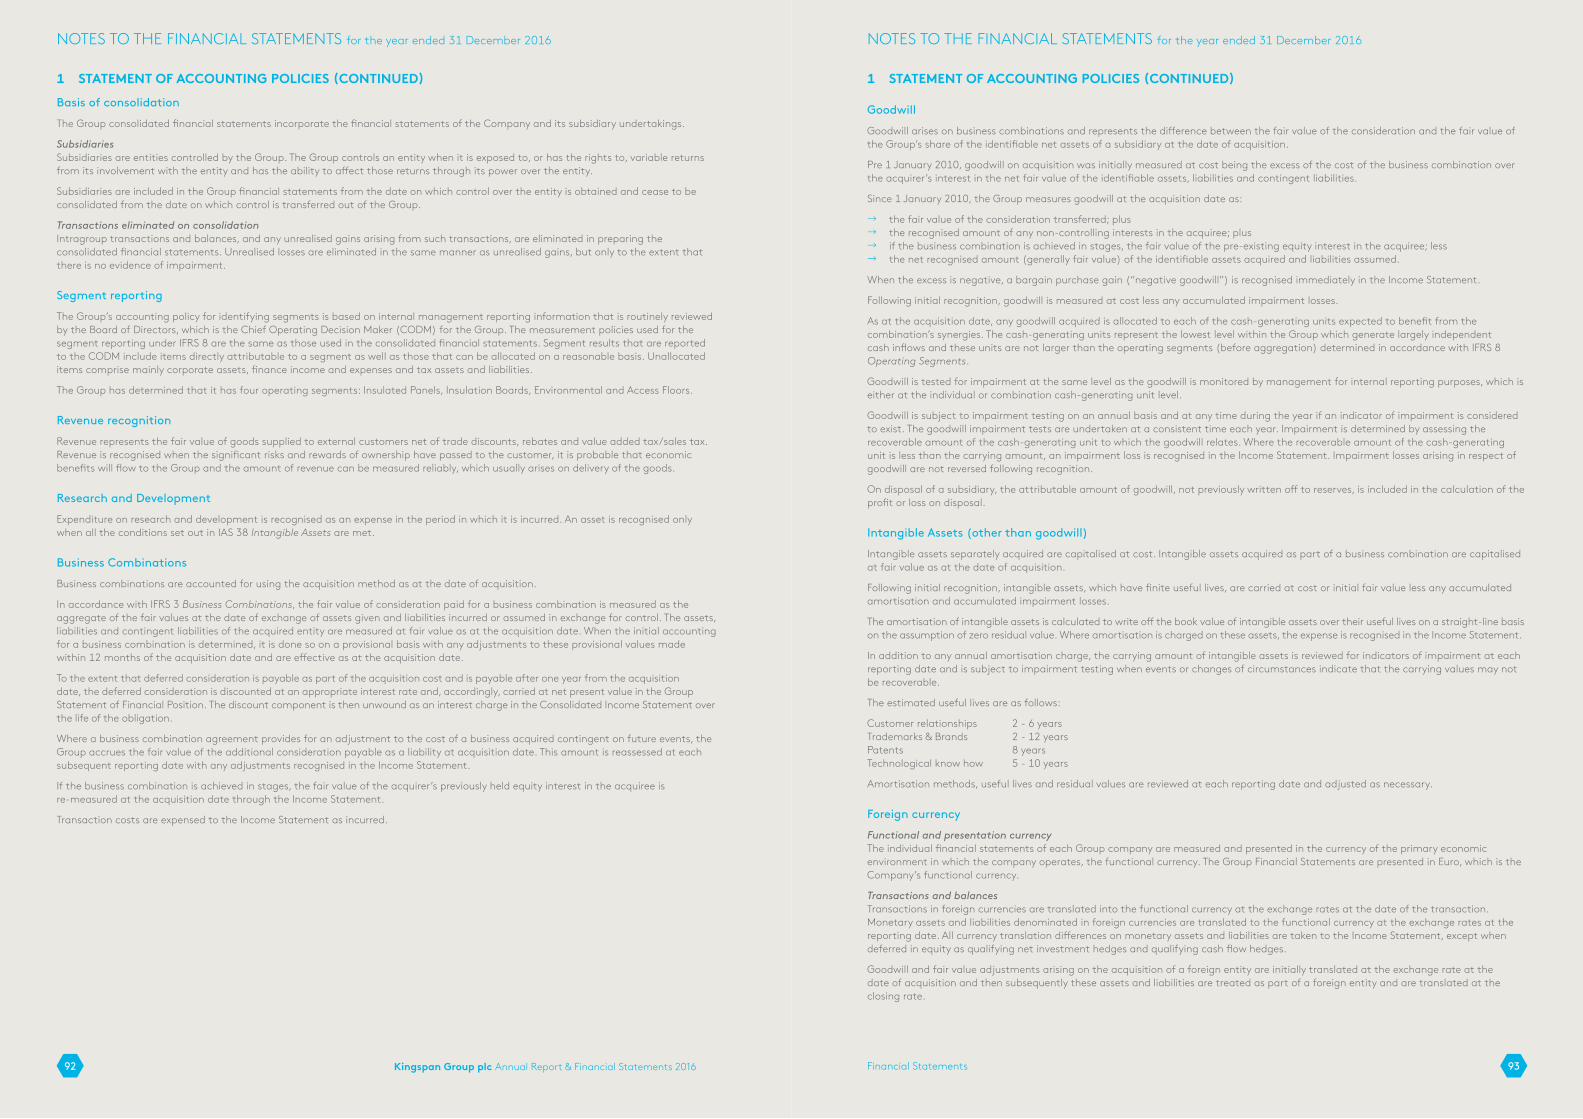
Kingspan Group plc Annual Report & Financial Statements 2016 93Financial Statements92
NOTES TO THE FINANCIAL STATEMENTS for the year ended 31 December 2016 NOTES TO THE FINANCIAL STATEMENTS for the year ended 31 December 2016
1 STATEMENT OF ACCOUNTING POLICIES (CONTINUED)Basis of consolidation
The Group consolidated financial statements incorporate the financial statements of the Company and its subsidiary undertakings.
Subsidiaries Subsidiaries are entities controlled by the Group. The Group controls an entity when it is exposed to, or has the rights to, variable returns from its involvement with the entity and has the ability to affect those returns through its power over the entity.
Subsidiaries are included in the Group financial statements from the date on which control over the entity is obtained and cease to be consolidated from the date on which control is transferred out of the Group.
Transactions eliminated on consolidationIntragroup transactions and balances, and any unrealised gains arising from such transactions, are eliminated in preparing the consolidated financial statements. Unrealised losses are eliminated in the same manner as unrealised gains, but only to the extent that there is no evidence of impairment.
Segment reporting
The Group’s accounting policy for identifying segments is based on internal management reporting information that is routinely reviewed by the Board of Directors, which is the Chief Operating Decision Maker (CODM) for the Group. The measurement policies used for the segment reporting under IFRS 8 are the same as those used in the consolidated financial statements. Segment results that are reported to the CODM include items directly attributable to a segment as well as those that can be allocated on a reasonable basis. Unallocated items comprise mainly corporate assets, finance income and expenses and tax assets and liabilities.
The Group has determined that it has four operating segments: Insulated Panels, Insulation Boards, Environmental and Access Floors.
Revenue recognition
Revenue represents the fair value of goods supplied to external customers net of trade discounts, rebates and value added tax/sales tax. Revenue is recognised when the significant risks and rewards of ownership have passed to the customer, it is probable that economic benefits will flow to the Group and the amount of revenue can be measured reliably, which usually arises on delivery of the goods.
Research and Development
Expenditure on research and development is recognised as an expense in the period in which it is incurred. An asset is recognised only when all the conditions set out in IAS 38 Intangible Assets are met.
Business Combinations
Business combinations are accounted for using the acquisition method as at the date of acquisition.
In accordance with IFRS 3 Business Combinations, the fair value of consideration paid for a business combination is measured as the aggregate of the fair values at the date of exchange of assets given and liabilities incurred or assumed in exchange for control. The assets, liabilities and contingent liabilities of the acquired entity are measured at fair value as at the acquisition date. When the initial accounting for a business combination is determined, it is done so on a provisional basis with any adjustments to these provisional values made within 12 months of the acquisition date and are effective as at the acquisition date.
To the extent that deferred consideration is payable as part of the acquisition cost and is payable after one year from the acquisition date, the deferred consideration is discounted at an appropriate interest rate and, accordingly, carried at net present value in the Group Statement of Financial Position. The discount component is then unwound as an interest charge in the Consolidated Income Statement over the life of the obligation.
Where a business combination agreement provides for an adjustment to the cost of a business acquired contingent on future events, the Group accrues the fair value of the additional consideration payable as a liability at acquisition date. This amount is reassessed at each subsequent reporting date with any adjustments recognised in the Income Statement.
If the business combination is achieved in stages, the fair value of the acquirer’s previously held equity interest in the acquiree is re-measured at the acquisition date through the Income Statement.
Transaction costs are expensed to the Income Statement as incurred.
1 STATEMENT OF ACCOUNTING POLICIES (CONTINUED)
Goodwill
Goodwill arises on business combinations and represents the difference between the fair value of the consideration and the fair value of the Group’s share of the identifiable net assets of a subsidiary at the date of acquisition.
Pre 1 January 2010, goodwill on acquisition was initially measured at cost being the excess of the cost of the business combination over the acquirer’s interest in the net fair value of the identifiable assets, liabilities and contingent liabilities.
Since 1 January 2010, the Group measures goodwill at the acquisition date as:
! the fair value of the consideration transferred; plus ! the recognised amount of any non-controlling interests in the acquiree; plus ! if the business combination is achieved in stages, the fair value of the pre-existing equity interest in the acquiree; less ! the net recognised amount (generally fair value) of the identifiable assets acquired and liabilities assumed.
When the excess is negative, a bargain purchase gain (“negative goodwill”) is recognised immediately in the Income Statement.
Following initial recognition, goodwill is measured at cost less any accumulated impairment losses.
As at the acquisition date, any goodwill acquired is allocated to each of the cash-generating units expected to benefit from the combination’s synergies. The cash-generating units represent the lowest level within the Group which generate largely independent cash inflows and these units are not larger than the operating segments (before aggregation) determined in accordance with IFRS 8 Operating Segments.
Goodwill is tested for impairment at the same level as the goodwill is monitored by management for internal reporting purposes, which is either at the individual or combination cash-generating unit level.
Goodwill is subject to impairment testing on an annual basis and at any time during the year if an indicator of impairment is considered to exist. The goodwill impairment tests are undertaken at a consistent time each year. Impairment is determined by assessing the recoverable amount of the cash-generating unit to which the goodwill relates. Where the recoverable amount of the cash-generating unit is less than the carrying amount, an impairment loss is recognised in the Income Statement. Impairment losses arising in respect of goodwill are not reversed following recognition.
On disposal of a subsidiary, the attributable amount of goodwill, not previously written off to reserves, is included in the calculation of the profit or loss on disposal.
Intangible Assets (other than goodwill)
Intangible assets separately acquired are capitalised at cost. Intangible assets acquired as part of a business combination are capitalised at fair value as at the date of acquisition.
Following initial recognition, intangible assets, which have finite useful lives, are carried at cost or initial fair value less any accumulated amortisation and accumulated impairment losses.
The amortisation of intangible assets is calculated to write off the book value of intangible assets over their useful lives on a straight-line basis on the assumption of zero residual value. Where amortisation is charged on these assets, the expense is recognised in the Income Statement.
In addition to any annual amortisation charge, the carrying amount of intangible assets is reviewed for indicators of impairment at each reporting date and is subject to impairment testing when events or changes of circumstances indicate that the carrying values may not be recoverable.
The estimated useful lives are as follows:
Customer relationships 2 - 6 yearsTrademarks & Brands 2 - 12 yearsPatents 8 yearsTechnological know how 5 - 10 years
Amortisation methods, useful lives and residual values are reviewed at each reporting date and adjusted as necessary.
Foreign currency
Functional and presentation currencyThe individual financial statements of each Group company are measured and presented in the currency of the primary economic environment in which the company operates, the functional currency. The Group Financial Statements are presented in Euro, which is the Company’s functional currency.
Transactions and balancesTransactions in foreign currencies are translated into the functional currency at the exchange rates at the date of the transaction. Monetary assets and liabilities denominated in foreign currencies are translated to the functional currency at the exchange rates at the reporting date. All currency translation differences on monetary assets and liabilities are taken to the Income Statement, except when deferred in equity as qualifying net investment hedges and qualifying cash flow hedges.
Goodwill and fair value adjustments arising on the acquisition of a foreign entity are initially translated at the exchange rate at the date of acquisition and then subsequently these assets and liabilities are treated as part of a foreign entity and are translated at the closing rate.
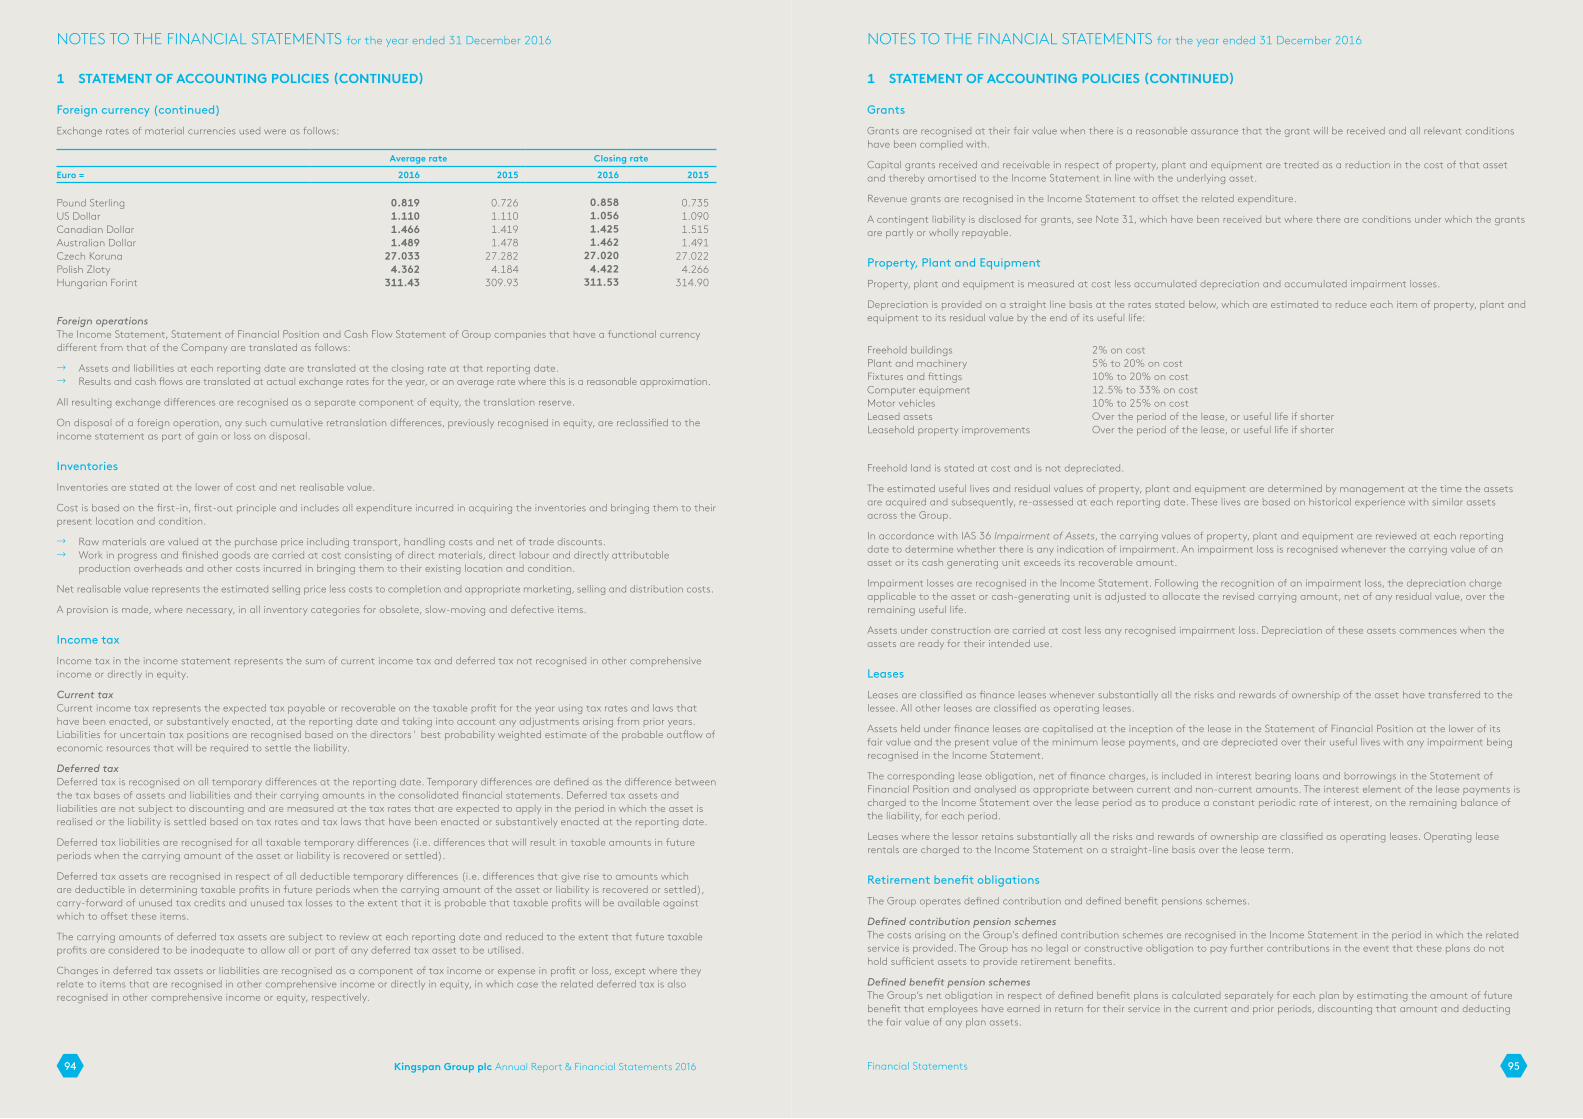
Kingspan Group plc Annual Report & Financial Statements 2016 95Financial Statements94
NOTES TO THE FINANCIAL STATEMENTS for the year ended 31 December 2016 NOTES TO THE FINANCIAL STATEMENTS for the year ended 31 December 2016
1 STATEMENT OF ACCOUNTING POLICIES (CONTINUED)
Foreign currency (continued)
Exchange rates of material currencies used were as follows:
Average rate Closing rate
Euro = 2016 2015 2016 2015
Pound Sterling 0.819 0.726 0.858 0.735US Dollar 1.110 1.110 1.056 1.090Canadian Dollar 1.466 1.419 1.425 1.515Australian Dollar 1.489 1.478 1.462 1.491Czech Koruna 27.033 27.282 27.020 27.022Polish Zloty 4.362 4.184 4.422 4.266Hungarian Forint 311.43 309.93 311.53 314.90
Foreign operationsThe Income Statement, Statement of Financial Position and Cash Flow Statement of Group companies that have a functional currency different from that of the Company are translated as follows:
! Assets and liabilities at each reporting date are translated at the closing rate at that reporting date. ! Results and cash flows are translated at actual exchange rates for the year, or an average rate where this is a reasonable approximation.
All resulting exchange differences are recognised as a separate component of equity, the translation reserve.
On disposal of a foreign operation, any such cumulative retranslation differences, previously recognised in equity, are reclassified to the income statement as part of gain or loss on disposal.
Inventories
Inventories are stated at the lower of cost and net realisable value.
Cost is based on the first-in, first-out principle and includes all expenditure incurred in acquiring the inventories and bringing them to their present location and condition.
! Raw materials are valued at the purchase price including transport, handling costs and net of trade discounts. ! Work in progress and finished goods are carried at cost consisting of direct materials, direct labour and directly attributable
production overheads and other costs incurred in bringing them to their existing location and condition.
Net realisable value represents the estimated selling price less costs to completion and appropriate marketing, selling and distribution costs.
A provision is made, where necessary, in all inventory categories for obsolete, slow-moving and defective items.
Income tax
Income tax in the income statement represents the sum of current income tax and deferred tax not recognised in other comprehensive income or directly in equity.
Current taxCurrent income tax represents the expected tax payable or recoverable on the taxable profit for the year using tax rates and laws that have been enacted, or substantively enacted, at the reporting date and taking into account any adjustments arising from prior years. Liabilities for uncertain tax positions are recognised based on the directors' best probability weighted estimate of the probable outflow of economic resources that will be required to settle the liability.
Deferred taxDeferred tax is recognised on all temporary differences at the reporting date. Temporary differences are defined as the difference between the tax bases of assets and liabilities and their carrying amounts in the consolidated financial statements. Deferred tax assets and liabilities are not subject to discounting and are measured at the tax rates that are expected to apply in the period in which the asset is realised or the liability is settled based on tax rates and tax laws that have been enacted or substantively enacted at the reporting date.
Deferred tax liabilities are recognised for all taxable temporary differences (i.e. differences that will result in taxable amounts in future periods when the carrying amount of the asset or liability is recovered or settled).
Deferred tax assets are recognised in respect of all deductible temporary differences (i.e. differences that give rise to amounts which are deductible in determining taxable profits in future periods when the carrying amount of the asset or liability is recovered or settled), carry-forward of unused tax credits and unused tax losses to the extent that it is probable that taxable profits will be available against which to offset these items.
The carrying amounts of deferred tax assets are subject to review at each reporting date and reduced to the extent that future taxable profits are considered to be inadequate to allow all or part of any deferred tax asset to be utilised.
Changes in deferred tax assets or liabilities are recognised as a component of tax income or expense in profit or loss, except where they relate to items that are recognised in other comprehensive income or directly in equity, in which case the related deferred tax is also recognised in other comprehensive income or equity, respectively.
1 STATEMENT OF ACCOUNTING POLICIES (CONTINUED)
Grants
Grants are recognised at their fair value when there is a reasonable assurance that the grant will be received and all relevant conditions have been complied with.
Capital grants received and receivable in respect of property, plant and equipment are treated as a reduction in the cost of that asset and thereby amortised to the Income Statement in line with the underlying asset.
Revenue grants are recognised in the Income Statement to offset the related expenditure.
A contingent liability is disclosed for grants, see Note 31, which have been received but where there are conditions under which the grants are partly or wholly repayable.
Property, Plant and Equipment
Property, plant and equipment is measured at cost less accumulated depreciation and accumulated impairment losses.
Depreciation is provided on a straight line basis at the rates stated below, which are estimated to reduce each item of property, plant and equipment to its residual value by the end of its useful life:
Freehold buildings 2% on costPlant and machinery 5% to 20% on costFixtures and fittings 10% to 20% on costComputer equipment 12.5% to 33% on costMotor vehicles 10% to 25% on costLeased assets Over the period of the lease, or useful life if shorterLeasehold property improvements Over the period of the lease, or useful life if shorter
Freehold land is stated at cost and is not depreciated.
The estimated useful lives and residual values of property, plant and equipment are determined by management at the time the assets are acquired and subsequently, re-assessed at each reporting date. These lives are based on historical experience with similar assets across the Group.
In accordance with IAS 36 Impairment of Assets, the carrying values of property, plant and equipment are reviewed at each reporting date to determine whether there is any indication of impairment. An impairment loss is recognised whenever the carrying value of an asset or its cash generating unit exceeds its recoverable amount.
Impairment losses are recognised in the Income Statement. Following the recognition of an impairment loss, the depreciation charge applicable to the asset or cash-generating unit is adjusted to allocate the revised carrying amount, net of any residual value, over the remaining useful life.
Assets under construction are carried at cost less any recognised impairment loss. Depreciation of these assets commences when the assets are ready for their intended use.
Leases
Leases are classified as finance leases whenever substantially all the risks and rewards of ownership of the asset have transferred to the lessee. All other leases are classified as operating leases.
Assets held under finance leases are capitalised at the inception of the lease in the Statement of Financial Position at the lower of its fair value and the present value of the minimum lease payments, and are depreciated over their useful lives with any impairment being recognised in the Income Statement.
The corresponding lease obligation, net of finance charges, is included in interest bearing loans and borrowings in the Statement of Financial Position and analysed as appropriate between current and non-current amounts. The interest element of the lease payments is charged to the Income Statement over the lease period as to produce a constant periodic rate of interest, on the remaining balance of the liability, for each period.
Leases where the lessor retains substantially all the risks and rewards of ownership are classified as operating leases. Operating lease rentals are charged to the Income Statement on a straight-line basis over the lease term.
Retirement benefit obligations
The Group operates defined contribution and defined benefit pensions schemes.
Defined contribution pension schemesThe costs arising on the Group’s defined contribution schemes are recognised in the Income Statement in the period in which the related service is provided. The Group has no legal or constructive obligation to pay further contributions in the event that these plans do not hold sufficient assets to provide retirement benefits.
Defined benefit pension schemesThe Group’s net obligation in respect of defined benefit plans is calculated separately for each plan by estimating the amount of future benefit that employees have earned in return for their service in the current and prior periods, discounting that amount and deducting the fair value of any plan assets.

Kingspan Group plc Annual Report & Financial Statements 2016 97Financial Statements96
NOTES TO THE FINANCIAL STATEMENTS for the year ended 31 December 2016 NOTES TO THE FINANCIAL STATEMENTS for the year ended 31 December 2016
1 STATEMENT OF ACCOUNTING POLICIES (CONTINUED)
Retirement benefit obligations (continued)
The calculation is performed annually by a qualified actuary using the projected unit credit method. When the calculation results in a benefit to the Group, the recognised asset is limited to the total of any unrecognised past service costs and the present value of economic benefits available in the form of any future refunds from the plan or reductions in future contributions to the plan.
Remeasurements of the net defined benefit liability or asset, which comprise actuarial gains and losses, the return on plan assets (excluding interest) and the effect of the asset ceiling, are recognised immediately in other comprehensive income.
The Group determines the net interest expense on the net defined benefit liability or asset by applying the discount rate used to measure the defined benefit obligation at the beginning of the annual period to the then net defined benefit liability or asset, taking into account any changes in the net defined benefit liability or asset during the period as a result of contributions and benefit payments. Net interest expense and other expenses related to defined benefit plans are recognised in profit or loss.
When the benefits of a plan are changed or when a plan is curtailed, the resulting change in benefit that relates to past service or the gain or loss on curtailment is recognised immediately in profit or loss. The Group recognises gains and losses on the settlement of a defined benefit plan when the settlement occurs.
Provisions
A provision is recognised in the Statement of Financial Position when the Group has a present constructive or legal obligation as a result of a past event and it is probable that an outflow of economic benefit will be required to settle the obligation and the amount of the obligation can be estimated reliably.
A specific provision is created when a claim has actually been made against the Group or where there is a known issue at a known customer’s site, both relating to a product or service supplied in the past. In addition, a risk-based provision is created where future claims are considered likely. The warranty provision is based on historical warranty data and a weighting of all possible outcomes against their associated probabilities.
Specific provisions will generally be aged as a current liability, reflecting the assessment that a current liability exists to replace or repair product sold on foot of an accepted valid warranty issue. Only where the liability is reasonably certain not to be settled within the next 12 months, will a specific provision be categorised as a long-term obligation. Risk-based provisions will generally be aged as a non-current liability, reflecting the fact that no warranty claim has yet been made by the customer.
Provisions which are not expected to give rise to a cash outflow within 12 months of the reporting date are, where material, determined by discounting the expected future cash flows. The unwinding of the discount is recognised as a finance cost.
Dividends
Final dividends on ordinary shares are recognised as a liability in the financial statements only after they have been approved at the Annual General Meeting of the Company. Interim dividends on ordinary shares are recognised when they are paid.
Cash and cash equivalents
Cash and cash equivalents principally comprise cash at bank and in hand and short term deposits with an original maturity of three months or less.
Derivative financial instruments
Derivative financial instruments, principally interest rate and currency swaps, are used to hedge the Group’s foreign exchange and interest rate risk exposures.
Derivative financial instruments are recognised initially at fair value and thereafter are subsequently remeasured at their fair value. Fair value is the amount for which an asset could be exchanged, or a liability settled, between knowledgeable willing parties in an arm’s length transaction. The fair value of these instruments is the estimated amount that the Group would receive or pay to terminate the swap at the reporting date, taking into account current interest and currency exchange rates and the current creditworthiness of the swap counterparties.
The Group designates all of its derivatives in one or more of the following types of relationships:
i. Fair value hedge: Hedges the exposure to movements in fair value of recognised assets or liabilities that are attributable to hedged risks.ii. Cash flow hedge: Hedges the Group’s exposures to fluctuations in future cash flow derived from a particular risk associated with
recognised assets or liabilities.iii. Net investment hedge: Hedges the exchange rate fluctuations of a net investment in a foreign operation.
At inception of the transaction, the Group documents the relationship between the hedging instruments and hedged items, including the risk management objectives and strategy in undertaking the hedge transactions. The Group also documents its assessment, both at inception and on an ongoing basis, as to whether the derivatives that are used in hedging transactions are highly effective in offsetting changes in fair values or cash flows of hedged items.
Fair value hedgeAny gain or loss resulting from the re-measurement of the hedging instrument to fair value is reported in the Income Statement, together with any changes in the fair value of the hedged asset or liability that are attributable to the hedged risk. The gains or losses of a hedging instrument that are in hedge relationships with borrowings are included within Finance Income or Finance Expense in the Income Statement. In the case of the related hedged borrowings, any gain or loss on the hedged item which is attributable to the hedged risk is adjusted against the carrying amount of the hedged item and is also included within Finance Income or Finance Expense in the Income Statement.
1 STATEMENT OF ACCOUNTING POLICIES (CONTINUED)
Derivative financial instruments (continued)
If the hedge no longer meets the criteria for hedge accounting, the adjustment to the carrying amount of the hedged item is amortised on an effective interest basis to the Income Statement with the objective of achieving full amortisation by maturity of the hedged item.
Cash flow hedgeThe effective part of any gain or loss on the derivative financial instrument is recognised in other comprehensive income and presented in the Cash Flow Hedge Reserve in equity with the ineffective portion being recognised within Finance Income or Finance Expense in the Income Statement. If a hedge of a forecasted transaction subsequently results in the recognition of a financial asset or a financial liability, the associated gains and losses that were recognised directly in other comprehensive income are reclassified into profit or loss in the same period or periods during which the asset acquired or liability assumed affects profit or loss. For cash flow hedges, other than those covered by the preceding statements, the associated cumulative gain or loss is removed from other comprehensive income and recognised in the Income Statement in the same period or periods during which the hedged forecast transaction affects profit or loss. The ineffective part of any gain or loss is recognised immediately in the Income Statement.
Hedge accounting is discontinued when a hedging instrument expires or is sold, terminated or exercised, or no longer qualifies for hedge accounting. The cumulative gain or loss at that point remains in other comprehensive income and is recognised when the transaction occurs. If a hedged transaction is no longer expected to occur, the net cumulative gain or loss recognised in other comprehensive income is transferred to the Income Statement in the period.
Net investment hedgeAny gain or loss on the hedging instrument relating to the effective portion of the hedge is recognised in other comprehensive income and presented in the translation reserve in equity. The gain or loss relating to the ineffective portion is recognised immediately in either Finance Income or Finance Expense in the Income Statement. Cumulative gains or losses remain in equity until disposal of the net investment in the foreign operation at which point the related differences are reclassified to the Income Statement as part of the overall gain or loss on sale.
Financial Assets
Financial assets other than derivatives are divided into the following categories:
! loans and receivables ! investments held at fair value through profit and loss
Trade and other receivables are initially recorded at fair value and, at subsequent reporting dates, at amortised cost. Generally, the Group recognises all financial assets using settlement day accounting. An assessment of whether a financial asset is impaired is made at least at each reporting date.
A provision for impairment of trade receivables is recognised when there is objective evidence that the Group will not be able to collect all amounts due according to the original terms of the receivable. The amount of the provision is the difference between the asset’s carrying amount and the present value of estimated future cash flows. Movements in provisions are recognised in the Income Statement. Bad debts are written off against the provision when no further prospect of collection exists.
Financial Liabilities
Financial liabilities are classified as either financial liabilities at fair value through profit or loss or other financial liabilities. Financial liabilities at fair value through profit or loss are initially measured at fair value and subsequently stated at fair value, with any resultant gain or loss recognised in profit or loss. The net gain or loss recognised in profit or loss incorporates any interest paid on the financial liability.
Other financial liabilities (including trade payables) are initially measured at fair value, net of transaction costs, and are subsequently measured at amortised cost using the effective interest method. When determining the fair value of financial liabilities, the expected future cash flows are discounted using an appropriate interest rate.
A financial liability is derecognised only when the obligation is extinguished, that is, when the obligation is discharged, cancelled or expired.
Finance Income
Finance Income comprises interest income on funds invested and any gains on hedging instruments that are recognised in the Income Statement. Interest income is recognised as it accrues using the effective interest rate method.
Finance Expense
Finance Expense comprises interest payable on borrowings calculated using the effective interest rate method, gains and losses on hedging instruments that are recognised in the Income Statement and the net finance cost of the Group’s defined benefit pension scheme.
Borrowing costs
Borrowing costs directly attributable to qualifying assets, as defined in IAS 23 Borrowing costs, are capitalised during the period of time that is necessary to complete and prepare the asset for its intended use. Other borrowing costs are expensed to the Income Statement in the period in which they are incurred.

Kingspan Group plc Annual Report & Financial Statements 2016 99Financial Statements98
NOTES TO THE FINANCIAL STATEMENTS for the year ended 31 December 2016 NOTES TO THE FINANCIAL STATEMENTS for the year ended 31 December 2016
1 STATEMENT OF ACCOUNTING POLICIES (CONTINUED)
Share-Based Payment Transactions
The Group grants equity settled share based payments to employees through the Performance Share Plan and the Deferred Bonus Plan.
The fair value of these equity settled transactions is determined at grant date and is recognised as an employee expense in the Income Statement, with the corresponding increase in equity, on a straight line basis over the vesting period. The fair value at the grant date is determined using a combination of the Monte Carlo simulation technique and a Black Scholes model, excluding the impact of any non-market conditions. Non-market vesting conditions are included in the assumptions about the number of options that are expected to vest. At each reporting date, the Group revises its estimates of the number of options that are likely to vest. Any adjustment from this revision is recognised in the Income Statement with a corresponding adjustment to equity.
Where the share based payments give rise to the issue of new share capital, the proceeds received by the Company are credited to share capital (nominal value) and share premium when the share entitlements are exercised. Where the share-based payments give rise to the re-issue of shares from treasury shares, the proceeds of issue are credited to share premium.
The Group does not operate any cash-settled share-based payment schemes or share-based payment transactions with cash alternatives as defined in IFRS 2.
Treasury shares
Where the Company purchases its own equity share capital, the consideration paid is deducted from total shareholders’ equity and classified as treasury shares until such shares are cancelled or reissued. Where such shares are subsequently sold or reissued, any consideration received is included in total shareholders’ equity. No gains or losses are recognised on the purchase, sale, cancellation or issue of treasury shares.
Non-controlling interest
Non-controlling interests represent the portion of the equity of a subsidiary not attributable either directly or indirectly to the parent company and are presented separately in the Income Statement and within equity in the Statement of Financial Position, distinguished from shareholders’ equity attributable to owner of the parent company.
Significant judgements and estimation uncertainty
In the process of applying the Group’s accounting policies, as set out on pages 91 to 99, management are required to make estimates, assumptions and judgements that could materially affect the Group’s reported results or net asset position.
The areas where key estimates, assumptions and judgements were made by management and are material to the Group’s reported results or net asset position, are as following:
Impairment (Note 9)
The Group is required to review assets for objective evidence of impairment.
It does this on the basis of a review of the budget and rolling 5 year forecasts (4 year strategic plan, as approved by the Board, plus year 5 forecasted by management), which by their nature are based on a series of assumptions and estimates.
The Group has performed impairment tests on those cash generating units which contain goodwill, and on any assets where there are indicators of impairment. The key assumptions associated with these reviews are detailed in Note 9.
Guarantees & warranties (Note 20)
Certain products carry formal guarantees of satisfactory functional and aesthetic performance of varying periods following their purchase. Local management evaluate the constructive or legal obligation arising from customer feedback and assess the requirement to provide for any probable outflow of economic benefit arising from a settlement.
Recoverability of trade receivables (Note 15)
The Group provides credit to customers and as a result there is an associated risk that the customer may not be able to pay outstanding balances. Trade receivables are considered for impairment on a case by case basis, when they are past due at the reporting date or when objective evidence is received that a specific counterparty may default.
Valuation of inventory (Note 14)
Inventories are measured at the lower of cost and net realisable value. The Group’s policy is to hold inventories at original cost and create an inventory provision where evidence exist that indicates net realisable value is below cost for a particular item of inventory. Damaged, slow-moving or obsolete inventory are typical examples of such evidence.
1 STATEMENT OF ACCOUNTING POLICIES (CONTINUED)
Business Combinations (Note 22)
Business combinations are accounted for using the acquisition method which requires that the assets and liabilities assumed are recorded at their respective fair values at the date of acquisition. The application of this method requires certain estimates and assumptions relating, in particular, to the determination of the fair values of the acquired assets and liabilities assumed at the date of acquisition.
For intangible assets acquired, the Group bases valuations on expected future cash flows. This method employs a discounted cash flow analysis using the present value of the estimated cash flows expected to be generated from these intangible assets using appropriate discount rates and revenue forecasts. The period of expected cash flows is based on the expected useful life of the intangible asset acquired.
Income taxes (Note 7)
The Group is subject to income tax in numerous jurisdictions. Significant judgement is required in determining the worldwide provision for income taxes. There are many transactions for which the ultimate tax determination is uncertain. The Group recognises liabilities based on estimates of whether additional taxes will be due. Once it has been concluded that a liability needs to be recognised, the liability is measured based on the tax laws that have been enacted or substantially enacted at the end of the reporting period. The amount shown for current taxation includes a liability for tax uncertainties and is based on the directors' best probability weighted estimate of the probable outflow of economic resources that will be required to settle the liability. Where the final tax outcome of these matters is different from the amounts that were initially estimated, such differences will impact the income tax and deferred tax provisions in the period in which such determination is made.
Deferred tax assets are recognised to the extent that it is probable that future taxable profit will be available against which the unused tax losses and unused tax credits can be utilised. The Group estimates the most probable amount of future taxable profits, using assumptions consistent with those employed in impairment calculations, and taking into consideration applicable tax legislation in the relevant jurisdiction. These calculations also require the use of estimates.
2 SEGMENT REPORTINGIn identifying the Group’s operating segments, management based its decision on the product supplied by each segment and the fact that each segment is managed and reported separately to the Chief Operating Decision Maker. These operating segments are monitored and strategic decisions are made on the basis of segment operating results.
The Group is establishing a new division, Kingspan Light & Air, encompassing the Group’s daylighting and natural ventilation activities effective from January 2017. The extent of these activities increased significantly in the second half of the current year. This activity is reported within the Insulated Panels segment with a plan in place to facilitate full systematic and operational separation effective from 1 January 2017 and therefore Light & Air will be disclosed as a new operating segment from that point onwards.
Operating segments
The Group has the following four operating segments:
Insulated Panels Manufacture of insulated panels, structural framing and metal facades.Insulation Boards Manufacture of rigid insulation boards, building services insulation and
engineered timber systems.Environmental Manufacture of energy storage solutions, water and microwind systems and all
related service activities.Access Floors Manufacture of raised access floors and datacentre storage solutions.
Analysis by class of business
Segment revenue Insulated Panels Insulation Boards Environmental Access Floors Total
€m €m €m €m €m
Total revenue – 2016 2,074.1 688.1 162.0 184.3 3,108.5Total revenue – 2015 1,776.6 662.8 159.0 175.9 2,774.3
Inter-segment transfers are carried out at arm’s length prices and using an appropriate transfer pricing methodology. As inter-segment revenue is not material, it is not subject to separate disclosure in the above analysis. For the purposes of the segmental analysis, corporate overheads have been allocated to each division based on their respective revenue for the year.
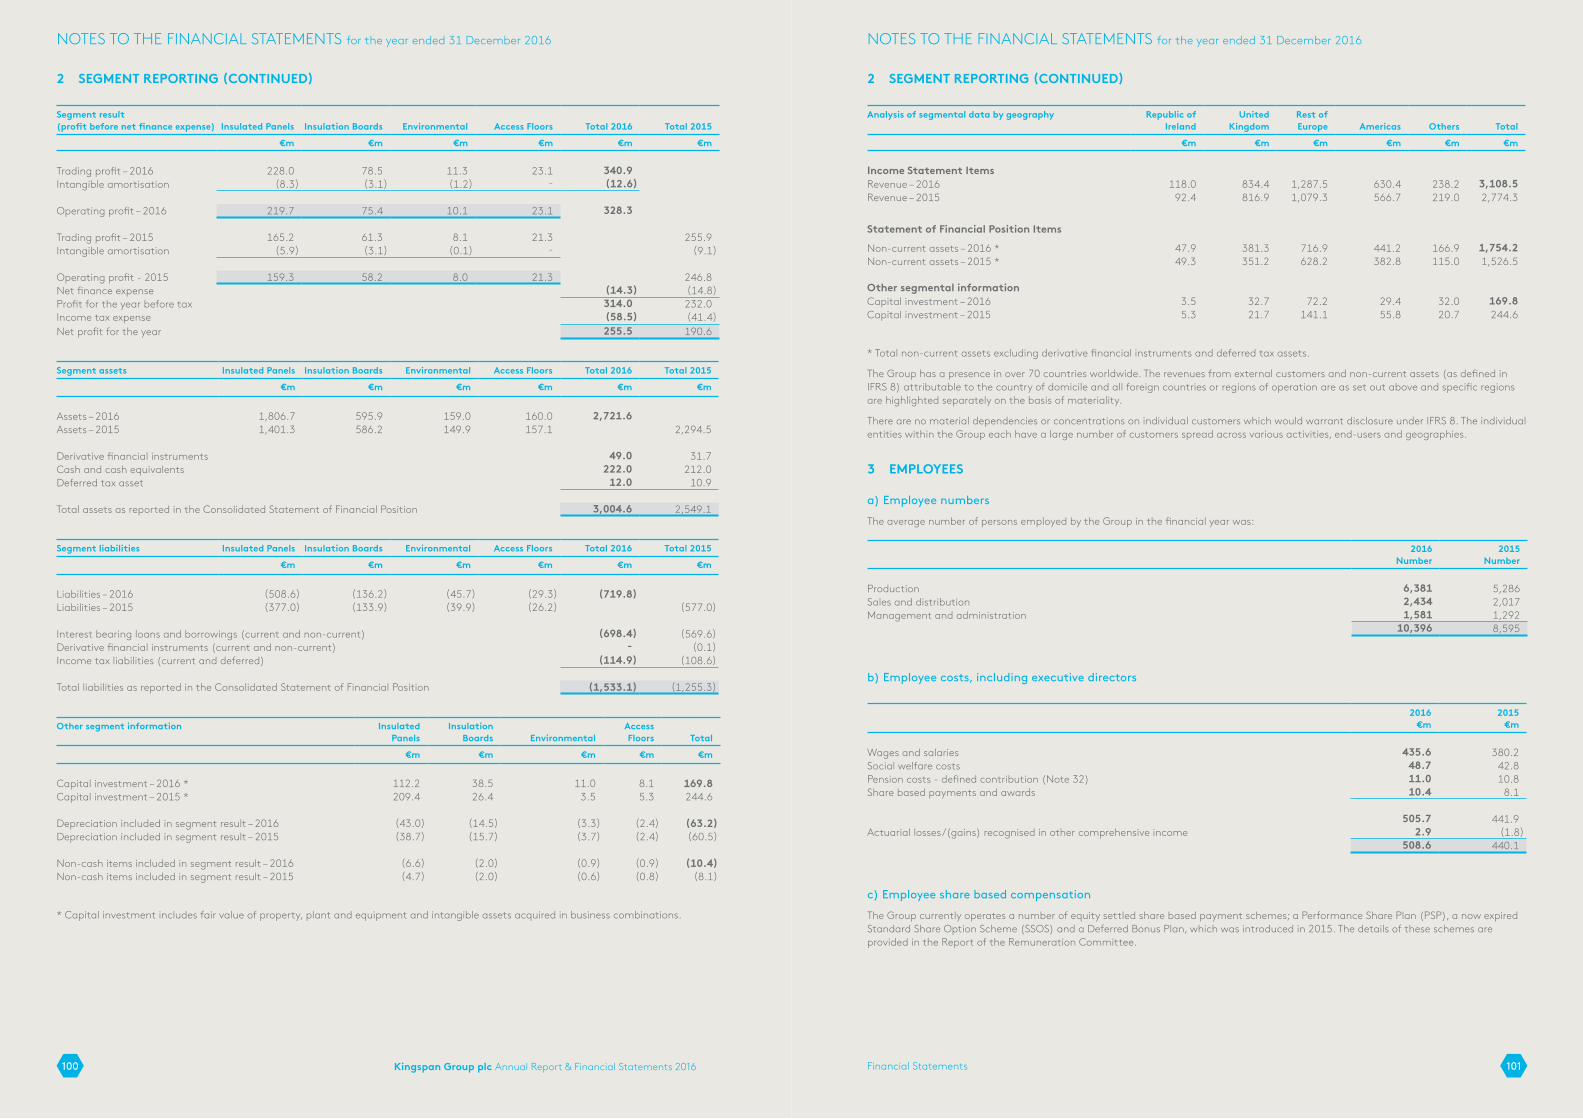
Kingspan Group plc Annual Report & Financial Statements 2016 101Financial Statements100
NOTES TO THE FINANCIAL STATEMENTS for the year ended 31 December 2016 NOTES TO THE FINANCIAL STATEMENTS for the year ended 31 December 2016
2 SEGMENT REPORTING (CONTINUED)
Segment result (profit before net finance expense) Insulated Panels Insulation Boards Environmental Access Floors Total 2016 Total 2015
€m €m €m €m €m €m
Trading profit – 2016 228.0 78.5 11.3 23.1 340.9Intangible amortisation (8.3) (3.1) (1.2) - (12.6)
Operating profit – 2016 219.7 75.4 10.1 23.1 328.3
Trading profit – 2015 165.2 61.3 8.1 21.3 255.9Intangible amortisation (5.9) (3.1) (0.1) - (9.1)
Operating profit - 2015 159.3 58.2 8.0 21.3 246.8Net finance expense (14.3) (14.8)Profit for the year before tax 314.0 232.0Income tax expense (58.5) (41.4)Net profit for the year 255.5 190.6
Segment assets Insulated Panels Insulation Boards Environmental Access Floors Total 2016 Total 2015
€m €m €m €m €m €m
Assets – 2016 1,806.7 595.9 159.0 160.0 2,721.6Assets – 2015 1,401.3 586.2 149.9 157.1 2,294.5
Derivative financial instruments 49.0 31.7Cash and cash equivalents 222.0 212.0Deferred tax asset 12.0 10.9
Total assets as reported in the Consolidated Statement of Financial Position 3,004.6 2,549.1
Segment liabilities Insulated Panels Insulation Boards Environmental Access Floors Total 2016 Total 2015
€m €m €m €m €m €m
Liabilities – 2016 (508.6) (136.2) (45.7) (29.3) (719.8)Liabilities – 2015 (377.0) (133.9) (39.9) (26.2) (577.0)
Interest bearing loans and borrowings (current and non-current) (698.4) (569.6)Derivative financial instruments (current and non-current) - (0.1)Income tax liabilities (current and deferred) (114.9) (108.6)
Total liabilities as reported in the Consolidated Statement of Financial Position (1,533.1) (1,255.3)
Other segment information Insulated Panels
Insulation Boards Environmental
Access Floors
Total
€m €m €m €m €m
Capital investment – 2016 * 112.2 38.5 11.0 8.1 169.8Capital investment – 2015 * 209.4 26.4 3.5 5.3 244.6
Depreciation included in segment result – 2016 (43.0) (14.5) (3.3) (2.4) (63.2)Depreciation included in segment result – 2015 (38.7) (15.7) (3.7) (2.4) (60.5)
Non-cash items included in segment result – 2016 (6.6) (2.0) (0.9) (0.9) (10.4)Non-cash items included in segment result – 2015 (4.7) (2.0) (0.6) (0.8) (8.1)
* Capital investment includes fair value of property, plant and equipment and intangible assets acquired in business combinations.
2 SEGMENT REPORTING (CONTINUED)
Analysis of segmental data by geography Republic of Ireland
United Kingdom
Rest of Europe Americas Others Total
€m €m €m €m €m €m
Income Statement ItemsRevenue – 2016 118.0 834.4 1,287.5 630.4 238.2 3,108.5Revenue – 2015 92.4 816.9 1,079.3 566.7 219.0 2,774.3
Statement of Financial Position Items
Non-current assets – 2016 * 47.9 381.3 716.9 441.2 166.9 1,754.2Non-current assets – 2015 * 49.3 351.2 628.2 382.8 115.0 1,526.5
Other segmental informationCapital investment – 2016 3.5 32.7 72.2 29.4 32.0 169.8Capital investment – 2015 5.3 21.7 141.1 55.8 20.7 244.6
* Total non-current assets excluding derivative financial instruments and deferred tax assets.
The Group has a presence in over 70 countries worldwide. The revenues from external customers and non-current assets (as defined in IFRS 8) attributable to the country of domicile and all foreign countries or regions of operation are as set out above and specific regions are highlighted separately on the basis of materiality.
There are no material dependencies or concentrations on individual customers which would warrant disclosure under IFRS 8. The individual entities within the Group each have a large number of customers spread across various activities, end-users and geographies.
3 EMPLOYEES
a) Employee numbers
The average number of persons employed by the Group in the financial year was:
2016Number
2015Number
Production 6,381 5,286Sales and distribution 2,434 2,017Management and administration 1,581 1,292
10,396 8,595
b) Employee costs, including executive directors
2016€m
2015€m
Wages and salaries 435.6 380.2Social welfare costs 48.7 42.8Pension costs - defined contribution (Note 32) 11.0 10.8Share based payments and awards 10.4 8.1
505.7 441.9Actuarial losses/(gains) recognised in other comprehensive income 2.9 (1.8)
508.6 440.1
c) Employee share based compensation
The Group currently operates a number of equity settled share based payment schemes; a Performance Share Plan (PSP), a now expired Standard Share Option Scheme (SSOS) and a Deferred Bonus Plan, which was introduced in 2015. The details of these schemes are provided in the Report of the Remuneration Committee.

Kingspan Group plc Annual Report & Financial Statements 2016 103Financial Statements102
NOTES TO THE FINANCIAL STATEMENTS for the year ended 31 December 2016 NOTES TO THE FINANCIAL STATEMENTS for the year ended 31 December 2016
3 EMPLOYEES (CONTINUED)
Performance Share Plan (PSP) Number of PSP Options
2016 2015
Outstanding at 1 January 3,582,587 4,526,786Granted 655,674 775,998Forfeited (60,341) (75,548)Lapsed (4,891) (15,776)Exercised (877,036) (1,628,873)Outstanding at 31 December 3,295,993 3,582,587
Of which, exercisable 1,211,254 968,680
The Group recognised a PSP expense of €9.1m (2015: €8.1m) in the Income Statement during the year. All PSP options are exercisable at €0.13 per share. For PSP options that were exercised during the year the average share price at the date of exercise was €23.70 (2015: €18.80). The weighted average contractual life of share options outstanding at 31 December 2016 is 4.0 years (2015: 4.3 years).
The fair values of options granted under the PSP scheme during the current and prior year were determined using the Black Scholes Model or the Monte Carlo Pricing Model as appropriate. The key assumptions used in the model were as follows:
2016 Awards 2015 Awards
Share price at grant date €23.40 €17.80Exercise price per share €0.13 €0.13Expected volatility 32% 26%Expected dividend yield 1.4% 1.3%Risk-free rate -0.133% 0.15%Expected life 3 years 3 years
The resulting weighted average fair value of options granted in the year was €17.36 (2015: €13.16).
As set out in the Report of the Remuneration Committee, the number of options that will ultimately vest is contingent on market conditions such as Total Shareholder Return and non market conditions such as the Earnings Per Share of the Group. Market conditions were taken into account in determining the above fair value, and non market conditions are considered when estimating the number of shares that will eventually vest. Expected volatility was determined by calculating the historical volatility of the Group and peer company share prices over the previous 3 years.
Standard Share Option Scheme (SSOS)In addition to the PSP scheme, there were also outstanding options granted under a legacy scheme, the Standard Share Option Scheme (SSOS), which has now expired. During the year, all remaining 217,442 options were exercised, at an average price of €24.54 and therefore at 31 December 2016 there are no options (2015: 217,442) outstanding under this scheme. In the prior year, the exercisable options had a weighted average price of €14.18. No options lapsed or were forfeited during the year and there was no income statement expense (2015: Nil) in relation to this scheme.
Deferred Bonus PlanAs set out in the Report of the Remuneration Committee, the Deferred Bonus Plan (DBP) is intended to reward incremental performance over and above the growth targeted by the annual performance related bonus. Any DBP bonus earned for such incremental performance is satisfied by the payment of deferred share awards. These shares are held for the benefit of the individual participants for two years without any additional performance conditions. These shares vest after two years but are forfeited if the participant leaves the Group within that period.
During the year, 50,607 awards were granted under the DBP and all 50,607 awards remain outstanding at 31 December 2016. The charge recognised in the Income Statement for 2016 was €1.3m.
4 FINANCE EXPENSE AND FINANCE INCOME
2016€m
2015€m
Finance expenseBank loans 2.1 3.9Private Placement loan notes 12.1 10.6Fair value movement on derivative financial instrument (20.4) (14.8)Fair value movement on private placement debt 20.5 15.3Net defined benefit pension scheme (Note 32) 0.1 0.1
14.4 15.1Finance incomeInterest earned (0.1) (0.3)
Net finance cost 14.3 14.8
No borrowing costs were capitalised during the year (2015: €nil).
No costs were reclassified from other comprehensive income to profit during the year (2015: €nil).
5 PROFIT FOR THE YEAR BEFORE TAX
2016€m
2015€m
The profit for the year is stated after charging / (crediting):Distribution expenses 152.4 138.5Operating lease payments 13.0 12.0Product development costs (total, including payroll) 24.2 18.5Depreciation 63.2 60.5Amortisation of intangible assets 12.6 9.1Foreign exchange (gain)/loss (5.8) 1.4Profit on sale of property, plant and equipment (1.4) (2.1)
Analysis of total auditor’s remuneration for audit services
2016€m
2015€m
Audit of Group (KPMG Ireland) 0.7 0.7Audit of other subsidiaries (other KPMG offices) 1.1 1.0
1.8 1.7
Analysis of amounts paid to the auditor in respect of non-audit services
2016€m
2015€m
Tax compliance and advisory services (KPMG Ireland) 0.1 0.2Tax compliance and advisory services (other KPMG offices) 0.4 0.6
0.5 0.8
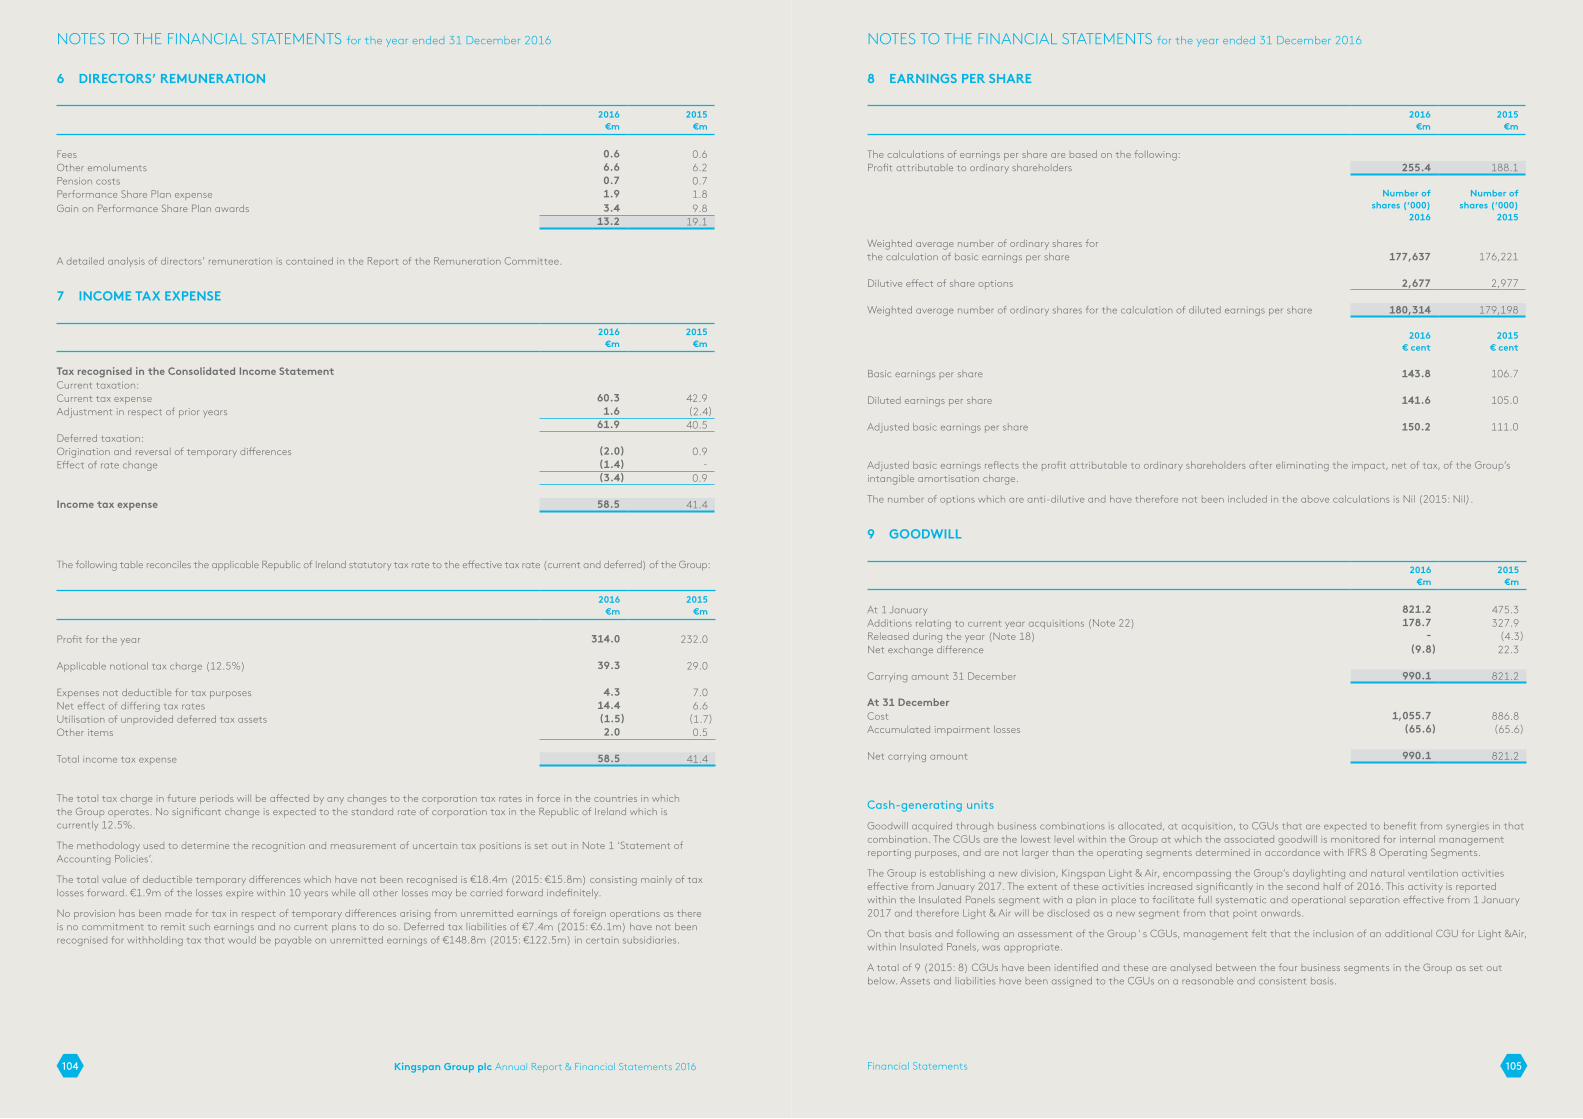
Kingspan Group plc Annual Report & Financial Statements 2016 105Financial Statements104
NOTES TO THE FINANCIAL STATEMENTS for the year ended 31 December 2016 NOTES TO THE FINANCIAL STATEMENTS for the year ended 31 December 2016
6 DIRECTORS’ REMUNERATION
2016€m
2015€m
Fees 0.6 0.6Other emoluments 6.6 6.2Pension costs 0.7 0.7Performance Share Plan expense 1.9 1.8Gain on Performance Share Plan awards 3.4 9.8
13.2 19.1
A detailed analysis of directors’ remuneration is contained in the Report of the Remuneration Committee.
7 INCOME TAX EXPENSE
2016€m
2015€m
Tax recognised in the Consolidated Income StatementCurrent taxation:Current tax expense 60.3 42.9Adjustment in respect of prior years 1.6 (2.4)
61.9 40.5Deferred taxation:Origination and reversal of temporary differences (2.0) 0.9Effect of rate change (1.4) -
(3.4) 0.9
Income tax expense 58.5 41.4
The following table reconciles the applicable Republic of Ireland statutory tax rate to the effective tax rate (current and deferred) of the Group:
2016€m
2015€m
Profit for the year 314.0 232.0
Applicable notional tax charge (12.5%) 39.3 29.0
Expenses not deductible for tax purposes 4.3 7.0Net effect of differing tax rates 14.4 6.6Utilisation of unprovided deferred tax assets (1.5) (1.7)Other items 2.0 0.5
Total income tax expense 58.5 41.4
The total tax charge in future periods will be affected by any changes to the corporation tax rates in force in the countries in which the Group operates. No significant change is expected to the standard rate of corporation tax in the Republic of Ireland which is currently 12.5%.
The methodology used to determine the recognition and measurement of uncertain tax positions is set out in Note 1 ‘Statement of Accounting Policies’.
The total value of deductible temporary differences which have not been recognised is €18.4m (2015: €15.8m) consisting mainly of tax losses forward. €1.9m of the losses expire within 10 years while all other losses may be carried forward indefinitely.
No provision has been made for tax in respect of temporary differences arising from unremitted earnings of foreign operations as there is no commitment to remit such earnings and no current plans to do so. Deferred tax liabilities of €7.4m (2015: €6.1m) have not been recognised for withholding tax that would be payable on unremitted earnings of €148.8m (2015: €122.5m) in certain subsidiaries.
8 EARNINGS PER SHARE
2016€m
2015€m
The calculations of earnings per share are based on the following:Profit attributable to ordinary shareholders 255.4 188.1
Number ofshares (‘000)
2016
Number ofshares (‘000)
2015
Weighted average number of ordinary shares forthe calculation of basic earnings per share 177,637 176,221
Dilutive effect of share options 2,677 2,977
Weighted average number of ordinary shares for the calculation of diluted earnings per share 180,314 179,198
2016€ cent
2015€ cent
Basic earnings per share 143.8 106.7
Diluted earnings per share 141.6 105.0
Adjusted basic earnings per share 150.2 111.0
Adjusted basic earnings reflects the profit attributable to ordinary shareholders after eliminating the impact, net of tax, of the Group’s intangible amortisation charge.
The number of options which are anti-dilutive and have therefore not been included in the above calculations is Nil (2015: Nil).
9 GOODWILL
2016€m
2015€m
At 1 January 821.2 475.3Additions relating to current year acquisitions (Note 22) 178.7 327.9Released during the year (Note 18) - (4.3)Net exchange difference (9.8) 22.3
Carrying amount 31 December 990.1 821.2
At 31 DecemberCost 1,055.7 886.8Accumulated impairment losses (65.6) (65.6)
Net carrying amount 990.1 821.2
Cash-generating units
Goodwill acquired through business combinations is allocated, at acquisition, to CGUs that are expected to benefit from synergies in that combination. The CGUs are the lowest level within the Group at which the associated goodwill is monitored for internal management reporting purposes, and are not larger than the operating segments determined in accordance with IFRS 8 Operating Segments.
The Group is establishing a new division, Kingspan Light & Air, encompassing the Group’s daylighting and natural ventilation activities effective from January 2017. The extent of these activities increased significantly in the second half of 2016. This activity is reported within the Insulated Panels segment with a plan in place to facilitate full systematic and operational separation effective from 1 January 2017 and therefore Light & Air will be disclosed as a new segment from that point onwards.
On that basis and following an assessment of the Group's CGUs, management felt that the inclusion of an additional CGU for Light &Air, within Insulated Panels, was appropriate.
A total of 9 (2015: 8) CGUs have been identified and these are analysed between the four business segments in the Group as set out below. Assets and liabilities have been assigned to the CGUs on a reasonable and consistent basis.
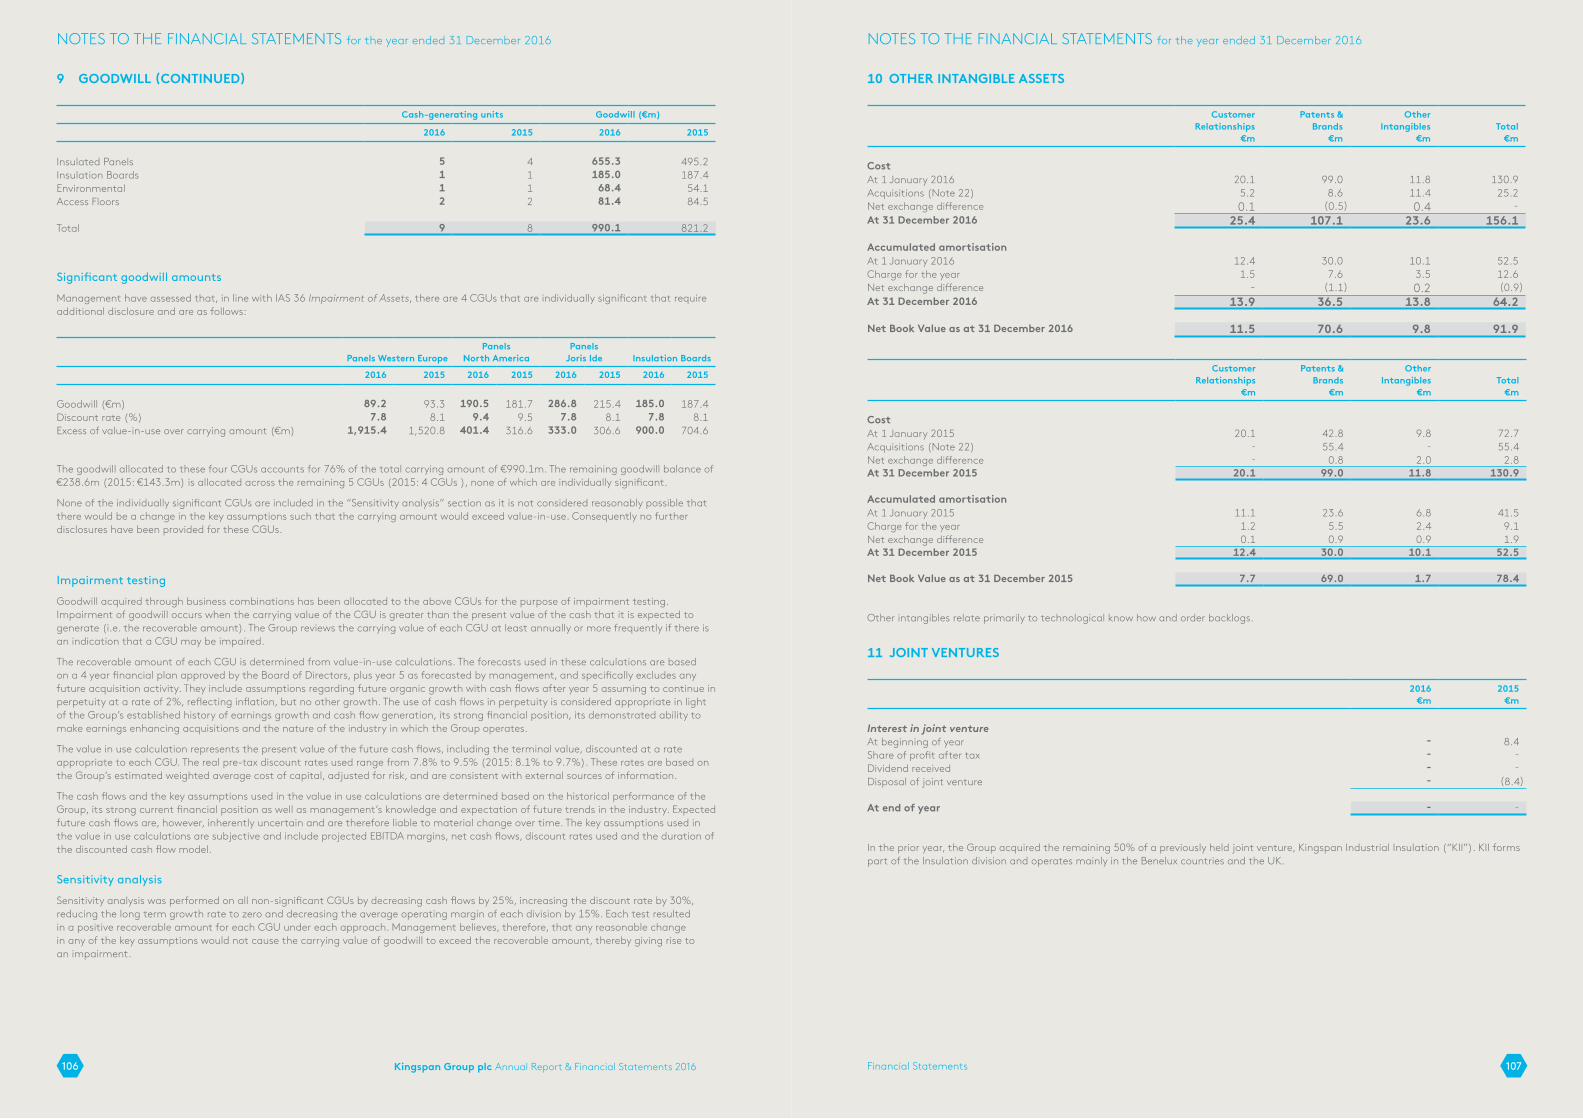
Kingspan Group plc Annual Report & Financial Statements 2016 107Financial Statements106
NOTES TO THE FINANCIAL STATEMENTS for the year ended 31 December 2016 NOTES TO THE FINANCIAL STATEMENTS for the year ended 31 December 2016
9 GOODWILL (CONTINUED)
Cash-generating units Goodwill (€m)
2016 2015 2016 2015
Insulated Panels 5 4 655.3 495.2Insulation Boards 1 1 185.0 187.4Environmental 1 1 68.4 54.1Access Floors 2 2 81.4 84.5
Total 9 8 990.1 821.2
Significant goodwill amounts
Management have assessed that, in line with IAS 36 Impairment of Assets, there are 4 CGUs that are individually significant that require additional disclosure and are as follows:
Panels Western EuropePanels
North AmericaPanels
Joris Ide Insulation Boards
2016 2015 2016 2015 2016 2015 2016 2015
Goodwill (€m) 89.2 93.3 190.5 181.7 286.8 215.4 185.0 187.4Discount rate (%) 7.8 8.1 9.4 9.5 7.8 8.1 7.8 8.1Excess of value-in-use over carrying amount (€m) 1,915.4 1,520.8 401.4 316.6 333.0 306.6 900.0 704.6
The goodwill allocated to these four CGUs accounts for 76% of the total carrying amount of €990.1m. The remaining goodwill balance of €238.6m (2015: €143.3m) is allocated across the remaining 5 CGUs (2015: 4 CGUs ), none of which are individually significant.
None of the individually significant CGUs are included in the “Sensitivity analysis” section as it is not considered reasonably possible that there would be a change in the key assumptions such that the carrying amount would exceed value-in-use. Consequently no further disclosures have been provided for these CGUs.
Impairment testing
Goodwill acquired through business combinations has been allocated to the above CGUs for the purpose of impairment testing. Impairment of goodwill occurs when the carrying value of the CGU is greater than the present value of the cash that it is expected to generate (i.e. the recoverable amount). The Group reviews the carrying value of each CGU at least annually or more frequently if there is an indication that a CGU may be impaired.
The recoverable amount of each CGU is determined from value-in-use calculations. The forecasts used in these calculations are based on a 4 year financial plan approved by the Board of Directors, plus year 5 as forecasted by management, and specifically excludes any future acquisition activity. They include assumptions regarding future organic growth with cash flows after year 5 assuming to continue in perpetuity at a rate of 2%, reflecting inflation, but no other growth. The use of cash flows in perpetuity is considered appropriate in light of the Group’s established history of earnings growth and cash flow generation, its strong financial position, its demonstrated ability to make earnings enhancing acquisitions and the nature of the industry in which the Group operates.
The value in use calculation represents the present value of the future cash flows, including the terminal value, discounted at a rate appropriate to each CGU. The real pre-tax discount rates used range from 7.8% to 9.5% (2015: 8.1% to 9.7%). These rates are based on the Group’s estimated weighted average cost of capital, adjusted for risk, and are consistent with external sources of information.
The cash flows and the key assumptions used in the value in use calculations are determined based on the historical performance of the Group, its strong current financial position as well as management’s knowledge and expectation of future trends in the industry. Expected future cash flows are, however, inherently uncertain and are therefore liable to material change over time. The key assumptions used in the value in use calculations are subjective and include projected EBITDA margins, net cash flows, discount rates used and the duration of the discounted cash flow model.
Sensitivity analysis
Sensitivity analysis was performed on all non-significant CGUs by decreasing cash flows by 25%, increasing the discount rate by 30%, reducing the long term growth rate to zero and decreasing the average operating margin of each division by 15%. Each test resulted in a positive recoverable amount for each CGU under each approach. Management believes, therefore, that any reasonable change in any of the key assumptions would not cause the carrying value of goodwill to exceed the recoverable amount, thereby giving rise to an impairment.
10 OTHER INTANGIBLE ASSETS
Customer Relationships
€m
Patents &Brands
€m
Other Intangibles
€mTotal
€m
CostAt 1 January 2016 20.1 99.0 11.8 130.9Acquisitions (Note 22) 5.2 8.6 11.4 25.2Net exchange difference 0.1 (0.5) 0.4 -At 31 December 2016 25.4 107.1 23.6 156.1
Accumulated amortisationAt 1 January 2016 12.4 30.0 10.1 52.5Charge for the year 1.5 7.6 3.5 12.6Net exchange difference - (1.1) 0.2 (0.9)At 31 December 2016 13.9 36.5 13.8 64.2
Net Book Value as at 31 December 2016 11.5 70.6 9.8 91.9
Customer Relationships
€m
Patents &Brands
€m
Other Intangibles
€mTotal
€m
CostAt 1 January 2015 20.1 42.8 9.8 72.7Acquisitions (Note 22) - 55.4 - 55.4Net exchange difference - 0.8 2.0 2.8At 31 December 2015 20.1 99.0 11.8 130.9
Accumulated amortisationAt 1 January 2015 11.1 23.6 6.8 41.5Charge for the year 1.2 5.5 2.4 9.1Net exchange difference 0.1 0.9 0.9 1.9At 31 December 2015 12.4 30.0 10.1 52.5
Net Book Value as at 31 December 2015 7.7 69.0 1.7 78.4
Other intangibles relate primarily to technological know how and order backlogs.
11 JOINT VENTURES
2016€m
2015€m
Interest in joint ventureAt beginning of year - 8.4Share of profit after tax - -Dividend received - -Disposal of joint venture - (8.4)
At end of year - -
In the prior year, the Group acquired the remaining 50% of a previously held joint venture, Kingspan Industrial Insulation (“KII”). KII forms part of the Insulation division and operates mainly in the Benelux countries and the UK.
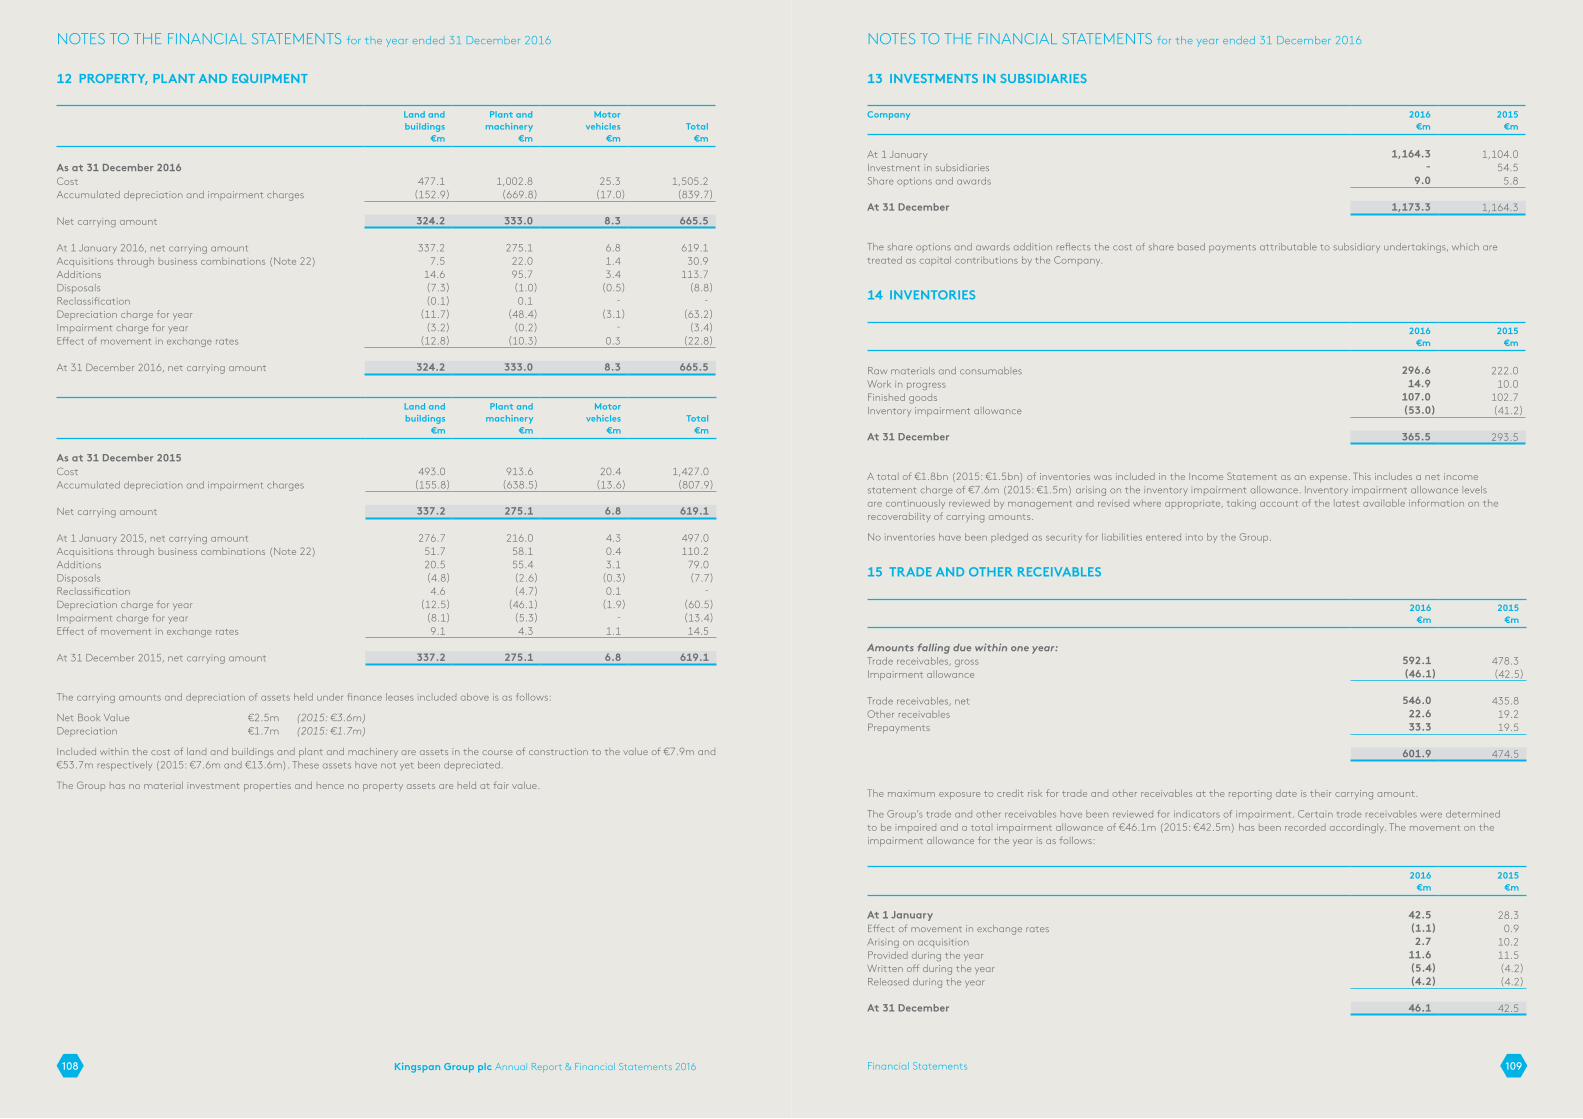
Kingspan Group plc Annual Report & Financial Statements 2016 109Financial Statements108
NOTES TO THE FINANCIAL STATEMENTS for the year ended 31 December 2016 NOTES TO THE FINANCIAL STATEMENTS for the year ended 31 December 2016
12 PROPERTY, PLANT AND EQUIPMENT
Land and buildings
€m
Plant and machinery
€m
Motor vehicles
€mTotal
€m
As at 31 December 2016Cost 477.1 1,002.8 25.3 1,505.2Accumulated depreciation and impairment charges (152.9) (669.8) (17.0) (839.7)
Net carrying amount 324.2 333.0 8.3 665.5
At 1 January 2016, net carrying amount 337.2 275.1 6.8 619.1Acquisitions through business combinations (Note 22) 7.5 22.0 1.4 30.9Additions 14.6 95.7 3.4 113.7Disposals (7.3) (1.0) (0.5) (8.8)Reclassification (0.1) 0.1 - -Depreciation charge for year (11.7) (48.4) (3.1) (63.2)Impairment charge for year (3.2) (0.2) - (3.4)Effect of movement in exchange rates (12.8) (10.3) 0.3 (22.8)
At 31 December 2016, net carrying amount 324.2 333.0 8.3 665.5
Land and buildings
€m
Plant and machinery
€m
Motor vehicles
€mTotal
€m
As at 31 December 2015Cost 493.0 913.6 20.4 1,427.0Accumulated depreciation and impairment charges (155.8) (638.5) (13.6) (807.9)
Net carrying amount 337.2 275.1 6.8 619.1
At 1 January 2015, net carrying amount 276.7 216.0 4.3 497.0Acquisitions through business combinations (Note 22) 51.7 58.1 0.4 110.2Additions 20.5 55.4 3.1 79.0Disposals (4.8) (2.6) (0.3) (7.7)Reclassification 4.6 (4.7) 0.1 -Depreciation charge for year (12.5) (46.1) (1.9) (60.5)Impairment charge for year (8.1) (5.3) - (13.4)Effect of movement in exchange rates 9.1 4.3 1.1 14.5
At 31 December 2015, net carrying amount 337.2 275.1 6.8 619.1
The carrying amounts and depreciation of assets held under finance leases included above is as follows:
Net Book Value €2.5m (2015: €3.6m) Depreciation €1.7m (2015: €1.7m)
Included within the cost of land and buildings and plant and machinery are assets in the course of construction to the value of €7.9m and €53.7m respectively (2015: €7.6m and €13.6m). These assets have not yet been depreciated.
The Group has no material investment properties and hence no property assets are held at fair value.
13 INVESTMENTS IN SUBSIDIARIES
Company 2016€m
2015€m
At 1 January 1,164.3 1,104.0Investment in subsidiaries - 54.5Share options and awards 9.0 5.8
At 31 December 1,173.3 1,164.3
The share options and awards addition reflects the cost of share based payments attributable to subsidiary undertakings, which are treated as capital contributions by the Company.
14 INVENTORIES
2016€m
2015€m
Raw materials and consumables 296.6 222.0Work in progress 14.9 10.0Finished goods 107.0 102.7Inventory impairment allowance (53.0) (41.2)
At 31 December 365.5 293.5
A total of €1.8bn (2015: €1.5bn) of inventories was included in the Income Statement as an expense. This includes a net income statement charge of €7.6m (2015: €1.5m) arising on the inventory impairment allowance. Inventory impairment allowance levels are continuously reviewed by management and revised where appropriate, taking account of the latest available information on the recoverability of carrying amounts.
No inventories have been pledged as security for liabilities entered into by the Group.
15 TRADE AND OTHER RECEIVABLES
2016€m
2015€m
Amounts falling due within one year:Trade receivables, gross 592.1 478.3Impairment allowance (46.1) (42.5)
Trade receivables, net 546.0 435.8 Other receivables 22.6 19.2Prepayments 33.3 19.5
601.9 474.5
The maximum exposure to credit risk for trade and other receivables at the reporting date is their carrying amount.
The Group’s trade and other receivables have been reviewed for indicators of impairment. Certain trade receivables were determined to be impaired and a total impairment allowance of €46.1m (2015: €42.5m) has been recorded accordingly. The movement on the impairment allowance for the year is as follows:
2016€m
2015€m
At 1 January 42.5 28.3Effect of movement in exchange rates (1.1) 0.9Arising on acquisition 2.7 10.2Provided during the year 11.6 11.5Written off during the year (5.4) (4.2)Released during the year (4.2) (4.2)
At 31 December 46.1 42.5
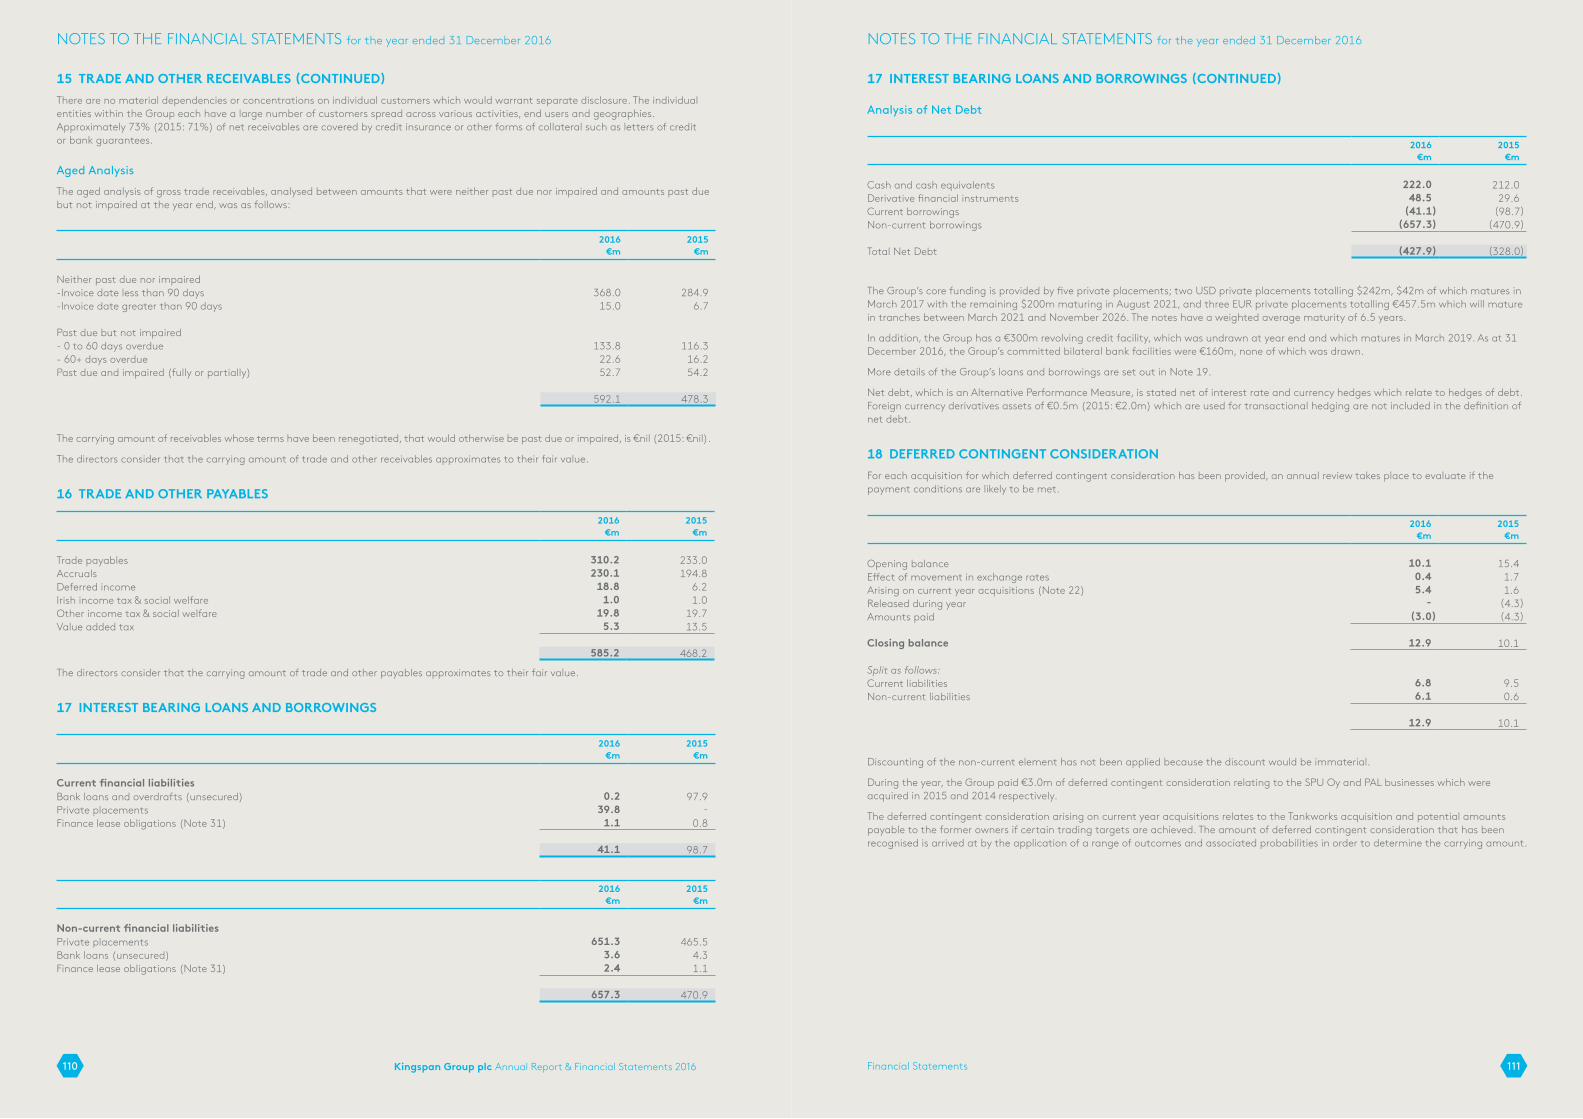
Kingspan Group plc Annual Report & Financial Statements 2016 111Financial Statements110
NOTES TO THE FINANCIAL STATEMENTS for the year ended 31 December 2016 NOTES TO THE FINANCIAL STATEMENTS for the year ended 31 December 2016
15 TRADE AND OTHER RECEIVABLES (CONTINUED)There are no material dependencies or concentrations on individual customers which would warrant separate disclosure. The individual entities within the Group each have a large number of customers spread across various activities, end users and geographies. Approximately 73% (2015: 71%) of net receivables are covered by credit insurance or other forms of collateral such as letters of credit or bank guarantees.
Aged Analysis
The aged analysis of gross trade receivables, analysed between amounts that were neither past due nor impaired and amounts past due but not impaired at the year end, was as follows:
2016€m
2015€m
Neither past due nor impaired-Invoice date less than 90 days 368.0 284.9-Invoice date greater than 90 days 15.0 6.7
Past due but not impaired- 0 to 60 days overdue 133.8 116.3- 60+ days overdue 22.6 16.2Past due and impaired (fully or partially) 52.7 54.2
592.1 478.3
The carrying amount of receivables whose terms have been renegotiated, that would otherwise be past due or impaired, is €nil (2015: €nil).
The directors consider that the carrying amount of trade and other receivables approximates to their fair value.
16 TRADE AND OTHER PAYABLES
2016€m
2015€m
Trade payables 310.2 233.0Accruals 230.1 194.8Deferred income 18.8 6.2Irish income tax & social welfare 1.0 1.0Other income tax & social welfare 19.8 19.7Value added tax 5.3 13.5
585.2 468.2
The directors consider that the carrying amount of trade and other payables approximates to their fair value.
17 INTEREST BEARING LOANS AND BORROWINGS
2016€m
2015€m
Current financial liabilitiesBank loans and overdrafts (unsecured) 0.2 97.9Private placements 39.8 -Finance lease obligations (Note 31) 1.1 0.8
41.1 98.7
2016€m
2015€m
Non-current financial liabilitiesPrivate placements 651.3 465.5Bank loans (unsecured) 3.6 4.3Finance lease obligations (Note 31) 2.4 1.1
657.3 470.9
17 INTEREST BEARING LOANS AND BORROWINGS (CONTINUED)
Analysis of Net Debt
2016€m
2015€m
Cash and cash equivalents 222.0 212.0Derivative financial instruments 48.5 29.6Current borrowings (41.1) (98.7)Non-current borrowings (657.3) (470.9)
Total Net Debt (427.9) (328.0)
The Group’s core funding is provided by five private placements; two USD private placements totalling $242m, $42m of which matures in March 2017 with the remaining $200m maturing in August 2021, and three EUR private placements totalling €457.5m which will mature in tranches between March 2021 and November 2026. The notes have a weighted average maturity of 6.5 years.
In addition, the Group has a €300m revolving credit facility, which was undrawn at year end and which matures in March 2019. As at 31 December 2016, the Group’s committed bilateral bank facilities were €160m, none of which was drawn.
More details of the Group’s loans and borrowings are set out in Note 19.
Net debt, which is an Alternative Performance Measure, is stated net of interest rate and currency hedges which relate to hedges of debt. Foreign currency derivatives assets of €0.5m (2015: €2.0m) which are used for transactional hedging are not included in the definition of net debt.
18 DEFERRED CONTINGENT CONSIDERATIONFor each acquisition for which deferred contingent consideration has been provided, an annual review takes place to evaluate if the payment conditions are likely to be met.
2016€m
2015€m
Opening balance 10.1 15.4Effect of movement in exchange rates 0.4 1.7Arising on current year acquisitions (Note 22) 5.4 1.6Released during year - (4.3)Amounts paid (3.0) (4.3)
Closing balance 12.9 10.1
Split as follows:Current liabilities 6.8 9.5Non-current liabilities 6.1 0.6
12.9 10.1
Discounting of the non-current element has not been applied because the discount would be immaterial.
During the year, the Group paid €3.0m of deferred contingent consideration relating to the SPU Oy and PAL businesses which were acquired in 2015 and 2014 respectively.
The deferred contingent consideration arising on current year acquisitions relates to the Tankworks acquisition and potential amounts payable to the former owners if certain trading targets are achieved. The amount of deferred contingent consideration that has been recognised is arrived at by the application of a range of outcomes and associated probabilities in order to determine the carrying amount.

Kingspan Group plc Annual Report & Financial Statements 2016 113Financial Statements112
NOTES TO THE FINANCIAL STATEMENTS for the year ended 31 December 2016 NOTES TO THE FINANCIAL STATEMENTS for the year ended 31 December 2016
19 FINANCIAL RISK MANAGEMENT AND FINANCIAL INSTRUMENTS
Financial Risk ManagementIn the normal course of business, the Group has exposure to a variety of financial risks, including foreign currency risk, interest rate risk, liquidity risk and credit risk. The Group’s focus is to understand these risks and to put in place policies that minimise the economic impact of an adverse event on the Group’s performance. Meetings are held on a regular basis to review the result of the risk assessment, approve recommended risk management strategies and monitor the effectiveness of such policies.
The Group’s risk management strategies include the usage of derivatives (other than for speculative transactions), principally forward exchange contracts, interest rate swaps, and cross currency interest rate swaps.
Liquidity riskIn addition to the high level of free cash flow, the Group operates a prudent approach to liquidity management using a mixture of long-term debt together with short-term debt, cash and cash equivalents, to enable it to meet its liabilities when due.
The Group’s core funding is provided by a number of private placement loan notes totalling €691.1m. The notes have a weighted average maturity of 6.5 years.
In addition, the Group has a €300m revolving credit facility, which was undrawn at year end and which matures in March 2019. As at 31 December 2016, the Group’s committed bilateral bank facilities were €160m, none of which was drawn.
Both the private placements and the revolving credit facility have an interest cover test (Net Interest: EBITDA must exceed 4 times) and a net debt test (Net Debt: EBITDA must be less than 3.5 times). In addition, the revolving credit facility has a requirement that the Group’s net assets must exceed €400m. These covenant tests have been met for the covenant test period to 31 December 2016.
The Group also has in place a number of uncommitted bilateral working capital facilities to serve its working capital requirements. These facilities total €44m (2015: €43m) and are generally supported by a Group guarantee.
The following are the carrying amounts and contractual maturities of financial liabilities (including estimated interest payments):
Carrying amount
2016
Contractual
cash flow
Within 1
year
Between 1 and 2
years
Between 2 and 5
years
Greater than 5
years
€m €m €m €m €m €m
Non derivative financial instrumentsBank loans 3.8 3.8 0.2 - - 3.6Private placement loan notes 691.1 799.4 58.7 17.9 285.2 437.6Finance lease liabilities 3.5 3.5 1.1 0.5 0.4 1.5Trade and other payables 585.2 585.2 585.2 - - -Deferred contingent consideration 12.9 12.9 6.8 6.1 - -
Derivative financial (assets) / liabilitiesInterest rate swaps used for hedging: Carrying value (1.7)Net inflows 2.0 0.7 0.5 0.8 -
Cross currency interest rate swaps used for hedging:Carrying value (46.8)- outflow 141.9 35.1 3.0 103.8 -- inflow 195.4 46.7 6.5 142.2 -
Foreign exchange forwards used for hedging:Carrying value assets (0.5)Carrying value liabilities -- outflow 37.5 37.5- inflow 37.7 37.7
19 FINANCIAL RISK MANAGEMENT AND FINANCIAL INSTRUMENTS (CONTINUED)
Carrying amount
2015
Contractual cash
flow
Within 1
year
Between 1 and 2
years
Between 2 and 5
years
Greater than 5
years
€m €m €m €m €m €m
Non derivative financial instrumentsBank loans 102.2 102.2 98.2 0.4 - 3.6Private placement loan notes 465.5 558.9 16.4 53.9 43.2 445.4Finance lease liabilities 1.9 1.9 0.8 1.1 - -Trade and other payables 468.2 468.2 468.2 - - -Deferred contingent consideration 10.1 10.1 9.5 0.6 - -
Derivative financial (assets) / liabilitiesInterest rate swaps used for hedging:Carrying value (2.3)Net inflows 2.7 0.8 0.6 1.0 0.3
Cross currency interest rate swaps used for hedging:Carrying value (27.3)- outflow 150.1 4.5 35.9 11.6 98.1- inflow 177.9 7.5 45.0 16.3 109.1
Foreign exchange forwards used for hedging:Carrying value assets (2.1)Carrying value liabilities 0.1- outflow 68.1 68.1- inflow 70.0 70.0
For provisions, the carrying amount represents the Group’s best estimate of the expected future outflows. As it does not represent a contractual liability at the year end, no amount has been included as a contractual cash flow.
The actual future cash flows could be different than predicted in the tables above, if the associated obligations were to become repayable on demand as a result of non-compliance with covenants or other contractual terms. No such non-compliance is envisaged.
Foreign exchange risks
There are two types of foreign currency risk to which the Group is exposed, namely transaction risk and translation risk. The objective of the Group’s foreign currency risk management strategy is to manage and control market risk exposures within acceptable parameters. As set out below the Group uses derivatives to manage foreign exchange risk. Transactions involving derivatives are carried out in accordance with the Treasury policy. The Group seeks to apply hedge accounting, where practicable, to manage volatility in profit or loss.
Transaction riskApart from transaction risk on debt, this arises where operating units have input costs or sales in currencies other than their functional currencies. These exposures are internally hedged as far as possible. Group policy is to hedge up to a maximum of 75% of a forecast exposure. Material exposures are hedged on a rolling 12 months basis. The Group’s principal exposure relates to GBP and USD, with less significant exposures to certain central European currencies.
In addition, where operating entities carry monetary assets and liabilities at year end denominated other than in their functional currency, their translation at the year-end rates of exchange into their functional currency will give rise to foreign currency gains and losses. The Group seeks to manage these gains and losses to net to nil.
Based on current cashflow projections for the businesses to 31 December 2017, it is estimated that the Group is long GBP£92m and short USD$28m. At 31 December 2016 hedges were in place covering 32% and 0% respectively of these exposures.
Translation risk This exists due to the fact that the Group has operations whose functional currency is not the Euro, the Group’s presentational currency. Changes in the exchange rate between the reporting currencies of these operations and the Euro, have an impact on the Group’s consolidated reported result. For 2016, the impact of changing currency rates versus Euro compared to the average 2015 rates was negative €43.8m (2015: positive €40.6m). In common with many other international groups, the Group does not currently seek to externally hedge its translation exposure.
Sensitivity analysis for primary currency riskA 10% volatility of the EUR against GBP and USD in respect of transaction risk in the reporting entities functional currency would impact reported after tax profit by €9.9m (2015: €6.6m) and equity by €3.5m (2015: €5.2m).

Kingspan Group plc Annual Report & Financial Statements 2016 115Financial Statements114
NOTES TO THE FINANCIAL STATEMENTS for the year ended 31 December 2016 NOTES TO THE FINANCIAL STATEMENTS for the year ended 31 December 2016
19 FINANCIAL RISK MANAGEMENT AND FINANCIAL INSTRUMENTS (CONTINUED)
US Dollar Loan Notes
2005 Private PlacementThe Group has a private placement of US$42m fixed interest 12-year bullet repayment loan notes maturing on 29 March 2017. The Group has entered into US dollar fixed/Euro fixed cross currency interest rate swaps for the full amount of the private placement with semi-annual interest payments with a weighted average interest rate of 4.35%. The maturity dates of these cross currency interest rate swaps is identical to the maturity dates of the private placement debt.
These cross currency interest rate swaps have been designated as cashflow hedges under the IAS 39 hedge accounting rules, thereby removing any significant volatility from reported earnings.
2011 Private PlacementIn 2011, the Group issued a second private placement of US$200m fixed interest 10 year bullet repayment loan notes maturing in August 2021. In order to align the Group’s debt profile with its risk management strategy, the Group entered into a number of hedging transactions in order to mitigate the associated foreign exchange and interest rate exposures. The Group entered into US dollar fixed / GBP floating cross currency interest rate swaps for US$118.6m of the private placement. The benchmark interest rate and credit spread have been separately identified and designated for hedge accounting purposes. The Group also entered into US dollar interest rate swaps for US$40m of the private placement. The fixed rate and maturity date on the swaps match the fixed rate on the private placement for all instruments. The instruments were designated as hedging instruments at inception and continued to qualify as effective hedges under IAS 39 at 31 December 2016.
Interest Rate Risk
The Group has an exposure to movements in interest rates on its debt portfolio, and on its cash and cash equivalent balances and derivatives. The Group policy is to ensure that at least 40% of its debt is fixed rate.
In respect of interest bearing loans and borrowings, the following table indicates the effective average interest rates at the year-end and the periods over which they mature. Interest on interest bearing loans and borrowings classified as floating rate is repriced at intervals of less than one year. The table further analyses interest bearing loans and borrowings by currency and fixed/floating mix and has been prepared both before and after the impact of derivatives.
Before the impact of hedging transactionsAs at 31 December 2016
Weighted average effective interest rate
Total€m
At fixed interest rate
€m
At floating interest rate
€m
Under 5 years
€m
Over 5 years
€m
Bank loans 2.91% 3.8 3.8 - 0.2 3.6Loan notes 2.91% 691.1 691.1 - 276.1 415.0
694.9 694.9 - 276.3 418.6
Total€m
At fixed interest rate
€m
At floating interest rate
€m
Euro 461.3 461.3 -USD 233.6 233.6 -
694.9 694.9 -
After the impact of hedging transactionsAs at 31 December 2016
Weighted average effective interest rate
Total€m
At fixed interest rate
€m
At floating interest rate
€m
Under 5 years
€m
Over 5 years
€m
Bank loans 2.91% 3.8 3.8 - 0.2 3.6Loan notes 2.24% 691.1 536.5 154.6 276.1 415.0
694.9 540.3 154.6 276.3 418.6
Total€m
At fixed interest rate
€m
At floating interest rate
€m
Euro 527.6 527.6 -GBP 115.1 - 115.1USD 52.2 12.7 39.5
694.9 540.3 154.6
The weighted average maturity of debt is 6.5 years (2015: 5.4 years) as at 31 December 2016.
19 FINANCIAL RISK MANAGEMENT AND FINANCIAL INSTRUMENTS (CONTINUED)
Before the impact of hedging transactionsAs at 31 December 2015 Weighted average effective
interest rate
TotalAt fixed
interest rateAt floating
interest rateUnder 5
yearsOver
5 years
€m €m €m €m €m
Bank loans 0.74% 102.2 26.0 76.2 98.4 3.8Loan notes 3.57% 465.5 465.5 - 38.5 427.0
567.7 491.5 76.2 136.9 430.8
Total
At fixed interest rate
At floating interest rate
€m €m €m
Euro 313.9 237.7 76.2USD 253.8 253.8 -
567.7 491.5 76.2
After the impact of hedging transactionsAs at 31 December 2015 Weighted average effective
interest rate
TotalAt fixed
interest rateAt floating
interest rateUnder 5
yearsOver
5 years
€m €m €m €m €m
Bank loans 0.74% 102.2 26.0 76.2 98.4 3.8Loan notes 2.71% 465.5 314.0 151.5 38.5 427.0
567.7 340.0 227.7 136.9 430.8
Total
At fixed interest rate
At floating interest rate
€m €m €m
Euro 378.1 301.9 76.2GBP 112.5 - 112.5USD 77.1 38.1 39.0
567.7 340.0 227.7
An increase or decrease of 100 basis points in each of the applicable rates and interest rate curves would impact reported after tax profit by €1.5m (2015: €2.3m) and equity by €1.5m (2015: €2.3m).
Credit risk
Credit risk encompasses the risk of financial loss to the Group of counterparty default in relation to any of its financial assets. The Group’s maximum exposure to credit risk is represented by the carrying value of each financial asset:
2016€m
2015€m
Cash & cash equivalents 222.0 212.0Trade receivables 546.0 435.8 Derivative financial assets 49.0 31.7
Trade receivables arise from a wide and varied customer base spread across various activities, end users and geographies, and as such there is no significant concentration of credit risk. The Group’s credit risk management policy in relation to trade receivables involves periodically assessing the financial reliability of customers, taking into account their financial position, past experience and other factors. The utilisation of credit limits is regularly monitored and a significant element of credit risk is covered by credit insurance or other forms of collateral such as letters of credit or bank guarantees.
Further details of trade receivables and associated impairment allowances, including detailed analysis of overdue debtors, is included in Note 15.

Kingspan Group plc Annual Report & Financial Statements 2016 117Financial Statements116
NOTES TO THE FINANCIAL STATEMENTS for the year ended 31 December 2016 NOTES TO THE FINANCIAL STATEMENTS for the year ended 31 December 2016
19 FINANCIAL RISK MANAGEMENT AND FINANCIAL INSTRUMENTS (CONTINUED)
Cash & cash equivalents
On the Group’s cash and cash equivalents and derivatives, counterparty risk is managed by dealing with banks that have a minimum credit rating and by spreading business across a portfolio of 8 relationship banks.
Financial instruments by category
The carrying amount of financial assets presented in the Statement of Financial Position relate to the following measurement categories as defined in IAS 39:
2016
Loans and receivables
Derivatives designated as hedging
instruments
Total
€m €m €m
Current:Trade receivables 546.0 - 546.0Other receivables 22.6 - 22.6Cash and cash equivalents 222.0 - 222.0Derivative financial instruments - 8.4 8.4
790.6 8.4 799.0
Non Current:Derivative financial instruments - 40.6 40.6
- 40.6 40.6
2015
Loans and receivables
Derivatives designated as hedging
instruments
Total
€m €m €m
Current:Trade receivables 435.8 - 435.8Other receivables 19.2 - 19.2Cash and cash equivalents 212.0 - 212.0Derivative financial instruments - 2.1 2.1
667.0 2.1 669.1
Non Current:Derivative financial instruments - 29.6 29.6
- 29.6 29.6
It is considered that the carrying amounts of the above financial assets approximate their fair values.
The carrying amounts of financial liabilities presented in the Statement of Financial Position relate to the following measurement categories as defined in IAS 39:
2016 Financial
liabilities in fair value
hedge
Financial liabilities
measured at fair value
Financial liabilities
measured at amortised
cost
Derivatives designated as hedging
instruments
Total
€m €m €m €m €m
Current:Borrowings - - 41.1 - 41.1Trade payables - - 310.2 - 310.2Accruals - - 230.1 - 230.1Deferred contingent consideration - 6.8 - - 6.8
- 6.8 581.4 - 588.2
Non current:Borrowings 154.6 - 502.7 - 657.3Deferred contingent consideration - 6.1 - - 6.1
154.6 6.1 502.7 - 663.4
19 FINANCIAL RISK MANAGEMENT AND FINANCIAL INSTRUMENTS (CONTINUED)
2015 Financial
liabilities in fair value
hedge
Financial liabilities
measured at fair value
Financial liabilities
measured at amortised
cost
Derivatives designated as hedging
instruments
Total
€m €m €m €m €m
Current:Borrowings - - 98.7 - 98.7Trade payables - - 233.0 - 233.0Accruals - - 194.8 - 194.8Derivative financial instruments - - - 0.1 0.1Deferred contingent consideration - 9.5 - - 9.5
- 9.5 526.5 0.1 536.1
Non current:Borrowings 151.5 - 319.4 - 470.9Deferred contingent consideration - 0.6 - - 0.6
151.5 0.6 319.4 - 471.5
Fair value hierarchy
Financial assets and liabilities recognised at fair value are analysed between those based on quoted prices in active markets for identical assets or liabilities (Level 1), those involving inputs other than quoted prices that are observable for the assets or liabilities, either directly or indirectly (Level 2); and those involving inputs for the assets or liabilities that are not based on observable market data (Level 3).
Normally, the derivatives entered into by the Group are not traded in active markets. The fair values of these contracts are estimated using a valuation technique that maximises the use of observable market inputs, e.g. market exchange and interest rates (Level 2). All derivatives entered into by the Group are included in Level 2 and consist of foreign currency forward contracts, interest rate swaps and cross currency interest rate swaps.
As at 31 December 2016 As at 31 December 2015
Level 1€m
Level 2€m
Level 3€m
Level 1€m
Level 2€m
Level 3€m
Financial AssetsInterest rate swaps - 48.5 - - 29.4 -Foreign exchange contracts for hedging - 0.5 - - 2.3 -
Financial LiabilitiesDeferred contingent consideration - - 12.9 - - 10.1
During the period ended 31 December 2016, there were no significant changes in the business or economic circumstances that affect the fair value of financial assets and liabilities, no reclassifications and no transfers between levels of the fair value hierarchy used in measuring the fair value of the financial instruments.
Except as detailed below, it is considered that the carrying amounts of financial assets and financial liabilities recognised at amortised cost approximate their fair values.
As at 31 December 2016 As at 31 December 2015
Carrying amount
€m
Fair Value
€m
Level
Carrying amount
€m
Fair Value
€m
Level
Private Placement Loan Notes 691.1 742.3 2 465.5 501.2 2Bank Loans 3.8 3.8 2 102.2 102.2 2

Kingspan Group plc Annual Report & Financial Statements 2016 119Financial Statements118
NOTES TO THE FINANCIAL STATEMENTS for the year ended 31 December 2016 NOTES TO THE FINANCIAL STATEMENTS for the year ended 31 December 2016
19 FINANCIAL RISK MANAGEMENT AND FINANCIAL INSTRUMENTS (CONTINUED)
Capital Management Policies and Procedures
The Group employs a combination of debt and equity to fund its operations. As at 31 December 2016 the total capital employed in the Group was as follows:
2016€m
2015€m
Net Debt 427.9 328.0Equity 1,471.5 1,293.8
Total Capital Employed 1,899.4 1,621.8
The Board’s objective when managing capital is to maintain a strong capital base so as to maintain the confidence of investors, creditors and the market. The Board monitors the return on capital (defined as total shareholders’ equity plus net debt), and targets a return of 15% together with a dividend level that is compatible with industry norms, but which also reflects any exceptional market conditions.
The Board seeks to maintain a balance between the higher returns that might be possible with higher levels of borrowings and the advantages and security afforded by a sound capital position. The Group actively manages foreign currency and interest rate exposure, as well as actively managing the net asset position, in order to create bottom line value. This necessitates the development of a methodology to optimise the allocation of financial resources on the one hand and the return on capital on the other.
The Board closely monitors externally imposed capital restrictions which are present due to covenants within the Group’s core banking facilities. These covenants include a requirement that the net assets of the Group be maintained at a minimum level of €400m.
There were no changes to the Group’s approach to capital management during the year.
20 PROVISIONS FOR LIABILITIES
Guarantees and warranties 2016€m
2015€m
At 1 January 83.6 55.8Arising on acquisitions (Note 22) 7.5 18.8Provided during year 41.4 43.7Claims paid (14.9) (24.8)Provisions released (12.8) (11.8)Effect of movement in exchange rates (3.9) 1.9
At 31 December 100.9 83.6
Current liability 55.5 47.2Non-current liability 45.4 36.4
100.9 83.6
The Group manufactures a wide range of insulation and related products for use primarily in the construction sector. Some products carry formal guarantees of satisfactory performance of varying periods following their purchase by customers and a provision is carried in respect of the expected costs of settling warranty and guarantee claims which arise. Both the number of claims and the cost of settling the claim are sensitive to change but not to such an extent as would cause a material change in the provision. Provisions are reviewed by management on a regular basis, and adjusted to reflect the current best estimate of the economic outflow. If it is no longer probable that an outflow of economic benefits will be required, the related provision is reversed.
For the non-current element of the provision, the Group anticipates that these will be utilised within three years of the reporting date. Discounting of the non-current element has not been applied because the discount would be immaterial.
The Group is not engaged in any material litigation.
21 DEFERRED TAX ASSETS AND LIABILITIESDeferred tax assets and liabilities arising from temporary differences and unused tax losses after offset are as follows:
2016€m
2015€m
Deferred tax assets 12.0 10.9Deferred tax liabilities (37.8) (44.1)
Net Position (25.8) (33.2)
21 DEFERRED TAX ASSETS AND LIABILITIES (CONTINUED)Deferred tax arises from differences in the carrying value of items such as property, plant and equipment, intangibles, pension obligations, and other temporary differences in the financial statements and the tax base established by the tax authorities.
The movement in the net deferred tax position for 2016 is as follows:
Balance 1 Jan 2016
Recognised in profit or
loss
Recognised
in equity
Recognised in other comprehensive
income
Translation adjustment
Arising on
acquisitions
Balance 31 Dec
2016
€m €m €m €m €m €m €m
Property, plant and equipment (49.2) 3.1 - - 1.1 (1.3) (46.3)Intangibles (20.6) 1.2 - - (1.0) (6.4) (26.8)Other temporary differences 34.6 (1.6) 1.4 0.1 0.5 4.2 39.2Pension obligations (1.5) 0.4 - 0.6 0.4 - (0.1)Unused tax losses 3.5 0.3 - - 0.4 4.0 8.2
(33.2) 3.4 1.4 0.7 1.4 0.5 (25.8)
The movement in the net deferred tax position for 2015 is as follows:
Balance1 Jan2015
Recognised in profit
or loss
Recognised
in equity
Recognised in other comprehensive
income
Translation adjustment
Arising on
acquisitions
Balance31 Dec
2015
€m €m €m €m €m €m €m
Property, plant and equipment (32.9) 1.1 - - (0.7) (16.7) (49.2)Intangibles (4.7) 1.3 - - - (17.2) (20.6)Other temporary differences 21.7 (2.2) 8.7 (0.1) 0.8 5.7 34.6Pension obligations (0.8) (0.4) - (0.2) (0.1) - (1.5)Unused tax losses 1.6 (0.7) - - 0.1 2.5 3.5
(15.1) (0.9) 8.7 (0.3) 0.1 (25.7) (33.2)
22 BUSINESS COMBINATIONSIn August 2016, the Group acquired 100% of the share capital of Essmann Gebaudetechnik GmbH, the holding company of the Essmann Group (“Essmann”). Essmann is a European provider of light, air and safety solutions for flat roofs and façades on non-residential buildings. The total consideration including debt and related costs amounted to €79.6m.
In April 2016 and August 2016, the Group acquired 100% of the share capital of Euro Clad (Holdings) Limited (“Euro Clad”) and of Eurobond Laminates Limited (“Eurobond”) respectively. The two companies are referred to as the ‘Euro Group’ as they previously had common ownership and were acquired together, with the Eurobond acquisition delayed due to UK competition clearance. Euro Clad is a British manufacturer of built up metal roof and wall systems and products whilst Eurobond is a British manufacturer of stone wool fibre panels. The total consideration including debt and related costs amounted to €94.2m.
The Group made four additional acquisitions during the year for a combined total consideration of €88.6m:
! the purchase of 100% of the share capital of Tankworks Australia Pty Limited in April 2016, a manufacturer and supplier of steel based rain water harvesting systems in Australia;
! the asset purchase of Bristol Fiberlite Industries Inc. ("Bristolite") in November 2016, a US manufacturer of energy efficient commercial unit skylights, smoke vents and accessories;
! the purchase of 100% of the share capital of the Paroc Group in December 2016, a Finnish insulated panels business; and ! the purchase of 62.5% of the share capital of Isocab Isobar NV in October 2016, a Belgian insulated panels business.

Kingspan Group plc Annual Report & Financial Statements 2016 121Financial Statements120
NOTES TO THE FINANCIAL STATEMENTS for the year ended 31 December 2016 NOTES TO THE FINANCIAL STATEMENTS for the year ended 31 December 2016
22 BUSINESS COMBINATIONS (CONTINUED)The provisional fair values of the acquired assets and liabilities at acquisition are set out below:
Essmann€m
Euro Group€m
Other€m
Total€m
Non-current assetsIntangible assets 8.7 10.3 6.2 25.2Property, plant and equipment 13.5 5.5 11.9 30.9Deferred tax asset 5.9 0.7 1.1 7.7
Current assetsInventories 15.3 7.7 15.4 38.4Trade and other receivables 29.4 22.1 22.3 73.8
Current liabilitiesTrade and other payables (23.5) (22.7) (23.3) (69.5)Provisions for liabilities (3.7) (2.1) (1.7) (7.5)
Non-current liabilitiesRetirement benefit obligation (4.6) - - (4.6)Deferred tax liabilities (2.8) (2.4) (2.0) (7.2)
Total identifiable assets 38.2 19.1 29.9 87.2
Non-controlling interest arising on acquisition (Note 28) - - (3.5) (3.5)Goodwill 41.4 75.1 62.2 178.7
Total consideration 79.6 94.2 88.6 262.4
Satisfied by:Cash (net of cash acquired) 79.6 94.2 77.6 251.4Deferred contingent consideration - - 5.4 5.4Transfer of assets - - 5.6 5.6
79.6 94.2 88.6 262.4
The acquired goodwill is attributable principally to the profit generating potential of the businesses, together with cross-selling opportunities and other synergies expected to be achieved from integrating the acquired businesses into the Group’s existing business.
In the post-acquisition period to 31 December 2016, the businesses acquired during the current year contributed revenue of €144.5m and a trading profit of €10.9m to the Group’s results.
The full year revenue and trading profit had the acquisitions taken place at the start of the year, would have been €3.3bn and €362m.
The gross contractual value of trade and other receivables as at the respective dates of acquisition amounted to €73.8m. The fair value of these receivables is €71.1m, all of which is recoverable, and is inclusive of an aggregate impairment provision of €2.7m.
Given the nature of the acquisitions made during the year, there is €26.2m goodwill (2015: €Nil) which is expected to be deductible for tax purposes.
The Group incurred acquisition related costs of €3.1m (2015: €3.8m) relating to external legal fees and due diligence costs. These costs have been included in operating costs in the Income Statement.
The deferred contingent consideration reflects the present value, which is based on a multiple of EBITDA, of a put and call option to acquire the non-controlling interest in Tankworks. As this option is expected to be exercised, the Group has consolidated Tankworks as a 100% subsidiary.
The transfer of assets resulted from the Isocab Isobar NV acquisition and reflects the assets contributed by the Group in exchange for 62.5% of the share capital. The non-controlling interest recognised on acquisition reflects the value of assets contributed by the other party in exchange for its 37.5% shareholding in the new company. The fair value of such assets are provisional as at the reporting date.
The initial assignment of fair values to identifiable net assets acquired has been performed on a provisional basis in respect of a number of the business combinations above given their proximity to year-end. Any amendments to these fair values within the twelve month timeframe from the date of acquisition will be disclosable in the 2017 Annual Report as stipulated by IFRS 3.
22 BUSINESS COMBINATIONS (CONTINUED)Prior year acquisitionsIn the prior year, the Group acquired 100% of the share capital of Steel Partners NV (the holding company of the Joris Ide Group), the Building Products division of Vicwest Inc., 100% of the share capital of American Solar Alternative Power LLC, 100% of the share capital of SPU Oy and the remaining 50% of the previously held joint venture Kingspan Industrial Insulation.
The provisional fair values of the acquired assets and liabilities at acquisition are set out below:
Joris Ide€m
Vicwest€m
Other€m
Total€m
Non-current assetsIntangible assets 34.5 20.9 - 55.4Property, plant and equipment 81.8 22.9 5.5 110.2Deferred tax asset - - 0.5 0.5
Current assetsInventories 79.0 24.3 5.1 108.4Trade and other receivables 38.1 28.4 10.3 76.8
Current liabilitiesTrade and other payables (93.4) (32.6) (9.9) (135.9)Provisions for liabilities (13.0) (3.5) (2.3) (18.8)
Non-current liabilitiesDeferred tax liabilities (22.0) (4.2) - (26.2)
Total identifiable assets 105.0 56.2 9.2 170.4
Goodwill 215.4 82.1 30.4 327.9
Total consideration 320.4 138.3 39.6 498.3
Satisfied by:Cash (net of cash acquired) 265.9 138.3 30.2 434.4Deferred contingent consideration - - 1.6 1.6Share capital issued 54.5 - - 54.5Value attributed to initial 50% of the business - - 7.8 7.8
320.4 138.3 39.6 498.3
In the post-acquisition period to 31 December 2015, the acquired businesses contributed revenue of €567m and a trading profit of €39m to the Group’s results.
The full year revenue and trading profit had the acquisitions taken place at the start of the year, would have been €2.9bn and €256m.
The Group incurred acquisition related costs of €3.8m (2014: €1.1m) relating to external legal fees and due diligence costs. These costs have been included in operating costs in the Income Statement.
23 SHARE CAPITAL
2016€m
2015€m
Authorised220,000,000 Ordinary shares of €0.13 each 28.6 28.6
Issued and fully paid Ordinary shares of €0.13 eachOpening balance – 178,957,056 (2015: 176,599,183) shares 23.3 23.0Share options exercised – 1,094,478 (2015: 2,357,873) shares 0.1 0.3
Closing balance – 180,051,534 (2015: 178,957,056) shares 23.4 23.3
Details of share options exercised are set out in Note 3 to the financial statements.

Kingspan Group plc Annual Report & Financial Statements 2016 123Financial Statements122
NOTES TO THE FINANCIAL STATEMENTS for the year ended 31 December 2016 NOTES TO THE FINANCIAL STATEMENTS for the year ended 31 December 2016
24 SHARE PREMIUM
2016€m
2015€m
At 1 January 92.5 48.4Premium on share options exercised under employee share based compensation schemes 3.1 9.0Premium on treasury shares issued - 35.1
At 31 December 95.6 92.5
25 TREASURY SHARES
Consideration paid 2016 2015No. of shares Consideration
per share€
Total€m
No. of shares Consideration per share
€
Total€m
At 1 January 1,938,257 5.83 11.3 4,938,257 6.22 30.7Repurchase of shares 50,607 25.10 1.3 - - -Shares issued (19,038) 6.21 (0.1) (3,000,000) 6.47 (19.4)
At 31 December 1,969,826 6.32 12.5 1,938,257 5.83 11.3
Nominal value 2016 2015No. of shares Nominal value
€Total
€No. of shares Nominal value
€Total
€At 1 January 1,938,257 0.13 251,973 4,938,257 0.13 641,973Repurchase of shares 50,607 0.13 6,579 - - -Shares issued (19,038) 0.13 (2,475) (3,000,000) 0.13 (390,000)
At 31 December 1,969,826 0.13 256,077 1,938,257 0.13 251,973
During the year, the company repurchased 50,607 of its own shares at a cost of €1.3m. The nominal value of these shares was €6,579 at the date of purchase. This was part of a Deferred Bonus Plan, as set out in the Report to the Remuneration Committee.
The Group also issued 19,038 ordinary shares to a number of executive directors, as also set out in the Report to the Remuneration Committee.
26 RETAINED EARNINGSIn accordance with Section 304 of the Companies Act 2014, the Company is availing of the exemption from presenting its individual Income Statement to the Annual General Meeting and from filing it with the Registrar of Companies. The Company’s profit for the financial year was €4.9m (2015: €7.0m).
27 DIVIDENDS
Equity dividends on ordinary shares: 2016€m
2015€m
2016 Interim dividend 10.0 cent (2015: 8.0 cent) per share 17.8 14.22015 Final dividend 17.0 cent (2014: 10.0 cent) per share 30.2 17.6
48.0 31.8Proposed for approval at AGMFinal dividend of 23.5 cent (2015: 17.0 cent) per share 42.3 30.4
This proposed dividend for 2016 is subject to approval by the shareholders at the Annual General Meeting and has not been included as a liability in the Statement of Financial Position of the Group as at 31 December 2016 in accordance with IAS 10 Events after the Reporting Period. The proposed final dividend for the year ended 31 December 2016 will be payable on 5 May 2017 to shareholders on the Register of Members at close of business on 31 March 2017.
28 NON-CONTROLLING INTEREST
2016€m
2015€m
At 1 January 11.4 8.0Profit for the year attributable to non-controlling interest 0.1 2.5Arising on acquisition (Note 22) 3.5 -Change of ownership interest transferred from retained earnings 1.5 -Dividends paid to minorities (0.4) -Share of foreign operations’ translation movement 0.5 0.9
At 31 December 16.6 11.4
During the year, the Group acquired 62.5% of the ordinary share capital of Isocab Isobar NV, a Belgian Insulated Panels business. As part of this acquisition, the Group has recognised the 37.5% non-controlling interest of €3.5m. Further details on this acquisition are provided in Note 22.
In addition, there was a change in the Group’s ownership interest in two of its subsidiaries which gave rise to an increase in non-controlling interest of €1.5m. The Group disposed of 15% of its interest in Kingspan Insulated Panels Manufacturing LLC and in exchange acquired an additional 34% interest in Kingspan Yapi Elemanlari A.S. Both of these businesses were accounted for as subsidiaries pre and post the transaction and are listed in Principal Subsidiary Undertakings on page 133.
29 RECONCILIATION OF NET CASH FLOW TO MOVEMENT IN NET DEBT
2016€m
2015€m
Increase in cash and cash equivalents 28.1 22.5Drawdown of bank loans (220.0) (336.5)Repayment of bank loans 99.4 119.3(Increase)/decrease in lease finance (1.8) 0.5Change in net debt resulting from cash flows (94.3) (194.2)
Translation movement - relating to US dollar loan (5.6) (24.0)Translation movement - other (19.0) 1.5Derivative financial instruments movement 19.0 14.2Net movement (99.9) (202.5)
Net debt at start of the year (328.0) (125.5)
Net debt at end of the year (427.9) (328.0)
30 CASH GENERATED FROM OPERATIONS
2016€m
2015€m
Profit for the year 255.5 190.6
Add back non-operating expenses:-Income tax expense 58.5 41.4-Depreciation of property, plant and equipment 63.2 60.5-Amortisation of intangible assets 12.6 9.1-Impairment of non-current assets 3.4 13.4-Employee equity-settled share options 10.4 8.1-Finance income (0.1) (0.3)-Finance expense 14.4 15.1-Non cash items - 1.7-Profit on sale of property, plant and equipment (1.4) (2.1)
Changes in working capital:-Inventories (39.9) 57.5-Trade and other receivables (75.7) (21.2)-Trade and other payables 62.5 1.6
Other: -Change in provisions 13.7 7.1-Pension contributions (2.9) (2.8)
Cash generated from operations 374.2 379.7
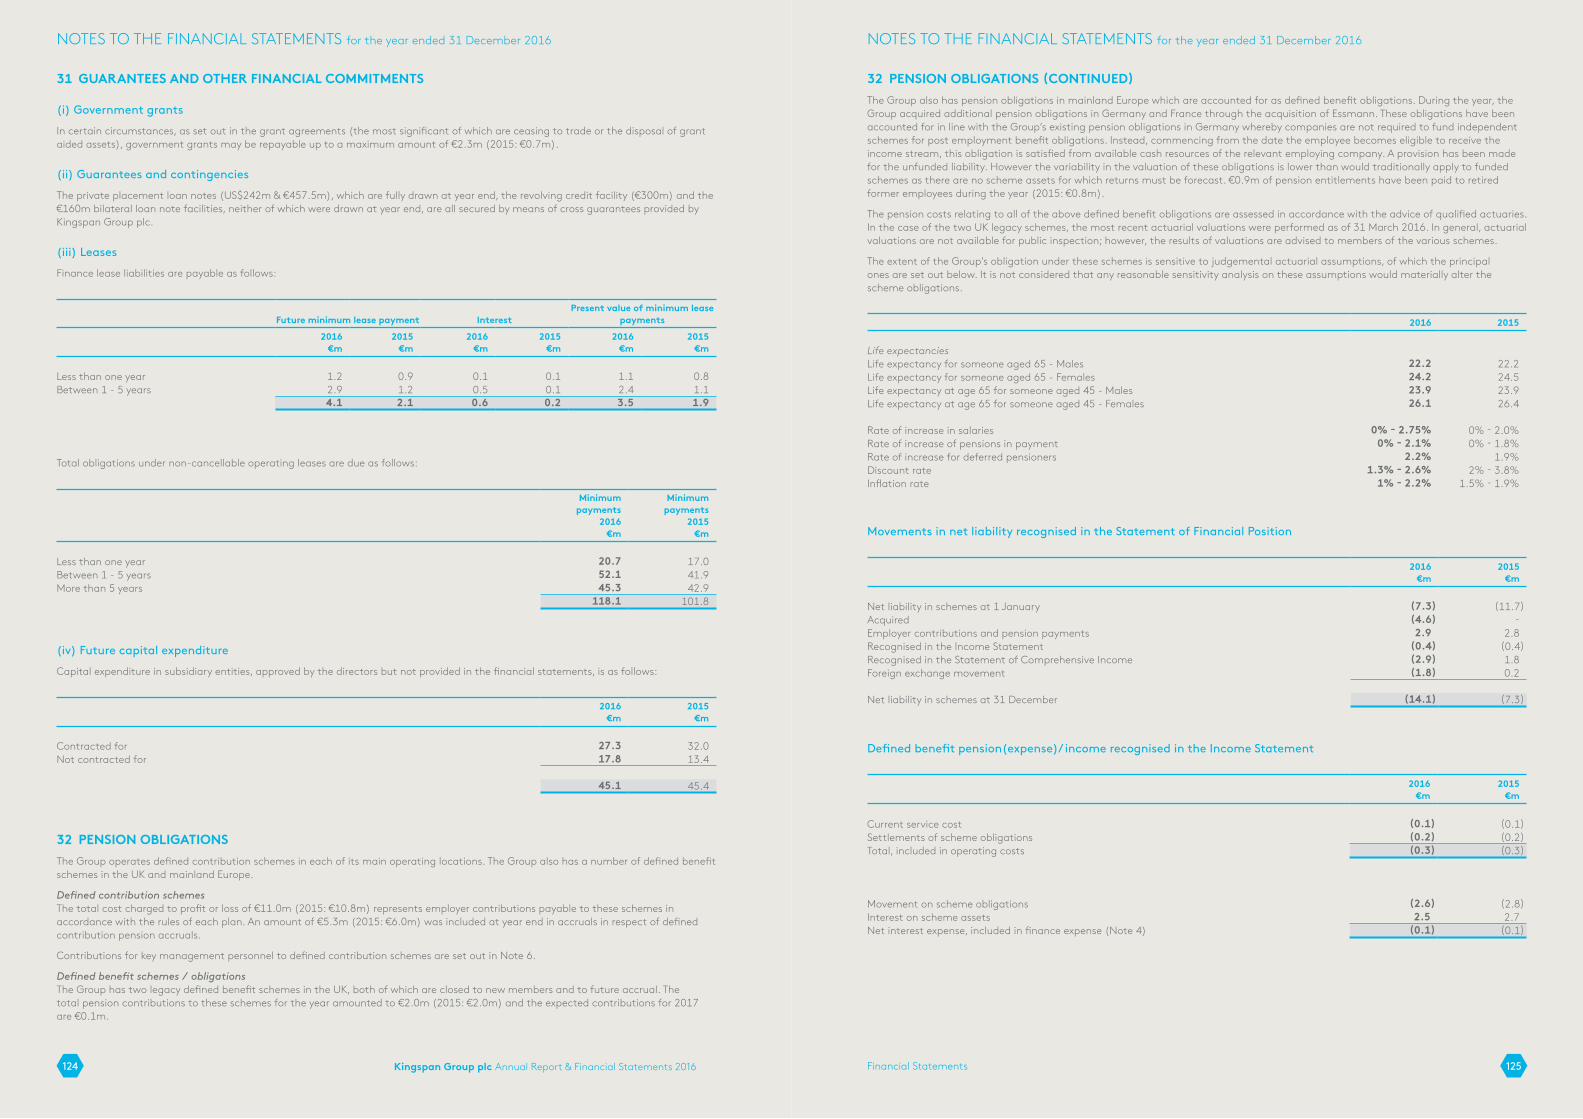
Kingspan Group plc Annual Report & Financial Statements 2016 125Financial Statements124
NOTES TO THE FINANCIAL STATEMENTS for the year ended 31 December 2016 NOTES TO THE FINANCIAL STATEMENTS for the year ended 31 December 2016
31 GUARANTEES AND OTHER FINANCIAL COMMITMENTS
(i) Government grants
In certain circumstances, as set out in the grant agreements (the most significant of which are ceasing to trade or the disposal of grant aided assets), government grants may be repayable up to a maximum amount of €2.3m (2015: €0.7m).
(ii) Guarantees and contingencies
The private placement loan notes (US$242m & €457.5m), which are fully drawn at year end, the revolving credit facility (€300m) and the €160m bilateral loan note facilities, neither of which were drawn at year end, are all secured by means of cross guarantees provided by Kingspan Group plc.
(iii) Leases
Finance lease liabilities are payable as follows:
Future minimum lease payment
Interest
Present value of minimum lease payments
2016€m
2015€m
2016€m
2015€m
2016€m
2015€m
Less than one year 1.2 0.9 0.1 0.1 1.1 0.8Between 1 - 5 years 2.9 1.2 0.5 0.1 2.4 1.1
4.1 2.1 0.6 0.2 3.5 1.9
Total obligations under non-cancellable operating leases are due as follows:
Minimumpayments
2016€m
Minimumpayments
2015€m
Less than one year 20.7 17.0Between 1 - 5 years 52.1 41.9More than 5 years 45.3 42.9
118.1 101.8
(iv) Future capital expenditure
Capital expenditure in subsidiary entities, approved by the directors but not provided in the financial statements, is as follows:
2016€m
2015€m
Contracted for 27.3 32.0Not contracted for 17.8 13.4
45.1 45.4
32 PENSION OBLIGATIONSThe Group operates defined contribution schemes in each of its main operating locations. The Group also has a number of defined benefit schemes in the UK and mainland Europe.
Defined contribution schemesThe total cost charged to profit or loss of €11.0m (2015: €10.8m) represents employer contributions payable to these schemes in accordance with the rules of each plan. An amount of €5.3m (2015: €6.0m) was included at year end in accruals in respect of defined contribution pension accruals.
Contributions for key management personnel to defined contribution schemes are set out in Note 6.
Defined benefit schemes / obligationsThe Group has two legacy defined benefit schemes in the UK, both of which are closed to new members and to future accrual. The total pension contributions to these schemes for the year amounted to €2.0m (2015: €2.0m) and the expected contributions for 2017 are €0.1m.
32 PENSION OBLIGATIONS (CONTINUED)The Group also has pension obligations in mainland Europe which are accounted for as defined benefit obligations. During the year, the Group acquired additional pension obligations in Germany and France through the acquisition of Essmann. These obligations have been accounted for in line with the Group’s existing pension obligations in Germany whereby companies are not required to fund independent schemes for post employment benefit obligations. Instead, commencing from the date the employee becomes eligible to receive the income stream, this obligation is satisfied from available cash resources of the relevant employing company. A provision has been made for the unfunded liability. However the variability in the valuation of these obligations is lower than would traditionally apply to funded schemes as there are no scheme assets for which returns must be forecast. €0.9m of pension entitlements have been paid to retired former employees during the year (2015: €0.8m).
The pension costs relating to all of the above defined benefit obligations are assessed in accordance with the advice of qualified actuaries. In the case of the two UK legacy schemes, the most recent actuarial valuations were performed as of 31 March 2016. In general, actuarial valuations are not available for public inspection; however, the results of valuations are advised to members of the various schemes.
The extent of the Group’s obligation under these schemes is sensitive to judgemental actuarial assumptions, of which the principal ones are set out below. It is not considered that any reasonable sensitivity analysis on these assumptions would materially alter the scheme obligations.
2016 2015
Life expectanciesLife expectancy for someone aged 65 - Males 22.2 22.2Life expectancy for someone aged 65 - Females 24.2 24.5Life expectancy at age 65 for someone aged 45 - Males 23.9 23.9Life expectancy at age 65 for someone aged 45 - Females 26.1 26.4
Rate of increase in salaries 0% - 2.75% 0% - 2.0%Rate of increase of pensions in payment 0% - 2.1% 0% - 1.8%Rate of increase for deferred pensioners 2.2% 1.9%Discount rate 1.3% - 2.6% 2% - 3.8%Inflation rate 1% - 2.2% 1.5% - 1.9%
Movements in net liability recognised in the Statement of Financial Position
2016€m
2015€m
Net liability in schemes at 1 January (7.3) (11.7)Acquired (4.6) -Employer contributions and pension payments 2.9 2.8Recognised in the Income Statement (0.4) (0.4)Recognised in the Statement of Comprehensive Income (2.9) 1.8Foreign exchange movement (1.8) 0.2
Net liability in schemes at 31 December (14.1) (7.3)
Defined benefit pension(expense)/ income recognised in the Income Statement
2016€m
2015€m
Current service cost (0.1) (0.1)Settlements of scheme obligations (0.2) (0.2)Total, included in operating costs (0.3) (0.3)
Movement on scheme obligations (2.6) (2.8)Interest on scheme assets 2.5 2.7Net interest expense, included in finance expense (Note 4) (0.1) (0.1)

Kingspan Group plc Annual Report & Financial Statements 2016 127Financial Statements126
NOTES TO THE FINANCIAL STATEMENTS for the year ended 31 December 2016 NOTES TO THE FINANCIAL STATEMENTS for the year ended 31 December 2016
32 PENSION OBLIGATIONS (CONTINUED)
Analysis of amount included in other comprehensive income
2016€m
2015€m
Actual return less interest on scheme assets 11.8 (2.3)Experience gain arising on scheme liabilities 1.6 -Actuarial gain arising from changes in demographic assumptions 0.6 0.2Actuarial (loss)/gain arising from changes in financial assumptions (16.9) 3.9(Loss)/gain recognised in other comprehensive income (2.9) 1.8
The cumulative actuarial loss recognised in other comprehensive income to date is €20.2m (2015: €17.3m).
In 2016, the actual return on plan assets was €14.3m (2015: €0.4m).
Asset Classes and Expected Rate of Return
The assets in the scheme at each year end were as follows:
2016 2015
Asset Classes as % of Total Scheme AssetsEquities 67% 63%Bonds (Corporates) 0% 0%Cash 0% 0%Liability Driven Investment (LDI) 33% 37%
100% 100%
The net pension liability is analysed as follows:
2016€m
2015€m
Equities 51.2 47.2Bonds (Corporates) 0.3 0.3Cash 0.1 0.4Liability Driven Investment (LDI) 25.5 27.5Fair market value of plan assets 77.1 75.4Present value of obligation (91.2) (82.7)Deficit (14.1) (7.3)
Analysed between:Funded schemes’ surplus 6.7 7.8Unfunded obligations (20.8) (15.1)
(14.1) (7.3)
Related deferred tax liability 0.1 1.5
Changes in present value of defined benefit obligations 2016€m
2015€m
At 1 January 82.7 83.7Acquired through business combination 4.6 -Current service cost 0.2 0.2Interest cost 2.6 2.8Benefits paid (4.1) (3.9)Settlement (0.1) (0.1)Actuarial losses/(gains) 14.7 (4.1)Effect of movement in exchange rates (9.4) 4.1
At 31 December 91.2 82.7
32 PENSION OBLIGATIONS (CONTINUED)
Changes in present value of scheme assets during year 2016€m
2015€m
At 1 January 75.4 72.0Interest on scheme assets 2.5 2.7Employer contributions 2.0 2.0Benefits paid (3.2) (3.1)Settlement (0.3) (0.3)Actual return less interest 11.8 (2.3)Effect of movement in exchange rates (11.1) 4.4
At 31 December 77.1 75.4
History of Assets, Liabilities, Experience Gains and Losses 2016€m
2015€m
2014€m
2013€m
2012€m
Fair value of plan assets 77.1 75.4 72.0 61.2 58.7Present value of defined benefit obligation (91.2) (82.7) (83.7) (68.9) (71.0)Deficit (14.1) (7.3) (11.7) (7.7) (12.3)
Experience gains/(losses) arising on scheme liabilities (present value)
1.6 - - (0.6) 0.1
% of defined benefit obligation 2% 0% 0.0% 0.9% 0.2%
Assumptions (loss)/gain (14.7) 4.1 (10.6) 0.1 (0.2)% of defined benefit obligation 16% 5% 12.7% 0.1% 0.3%
Actual return less interest on scheme assets 11.8 (2.3) 3.9 0.7 0.9% of scheme assets 15% (3%) 5.4% 1.1% 1.6%
33 RELATED PARTY TRANSACTIONSThe principal related party relationships requiring disclosure under IAS 24 Related Party Disclosures relate to (i) transactions between group companies, (ii) compensation of key management personnel and (iii) goods and services purchased from directors.
(i) Transactions between subsidiaries are carried out on an arm’s length basis. The Company received dividends from subsidiaries of €Nil, and there was a net decrease in the intercompany balance of €39.7m
(2015: €13.1m). Transactions with the Group’s non-wholly owned subsidiaries primarily comprise trading sales and capital funding, carried out on an
arm’s length basis. These transactions are not considered to be material.
(ii) For the purposes of the disclosure requirements of IAS 24 Related Party Disclosures, the term “key management personnel” (i.e. those persons having the authority and responsibility for planning, directing and controlling the activities of the Company), comprise the board of directors who manage the business and affairs of the Company. As identified in the Report of the Remuneration Committee, the directors, other than the non-executive directors, serve as executive officers of the Group.
Key management personnel compensation is set out in Note 6. Mr Eugene Murtagh received dividends of €8.1m during the year from the Company (2015: €5.4m). Dividends of €0.65m were paid
to other key management personnel (2015: €0.43m).
(iv) The Group purchased legal services in the sum of €108,104 (2015: €158,336) from McCann FitzGerald Solicitors, a firm in which Mr John Cronin is a partner.
34 POST BALANCE SHEET EVENTSThere have been no material events subsequent to 31 December 2016 which would require adjustment to or disclosure in this report.
35 APPROVAL OF FINANCIAL STATEMENTSThe financial statements were approved by the directors on 17 February 2017.
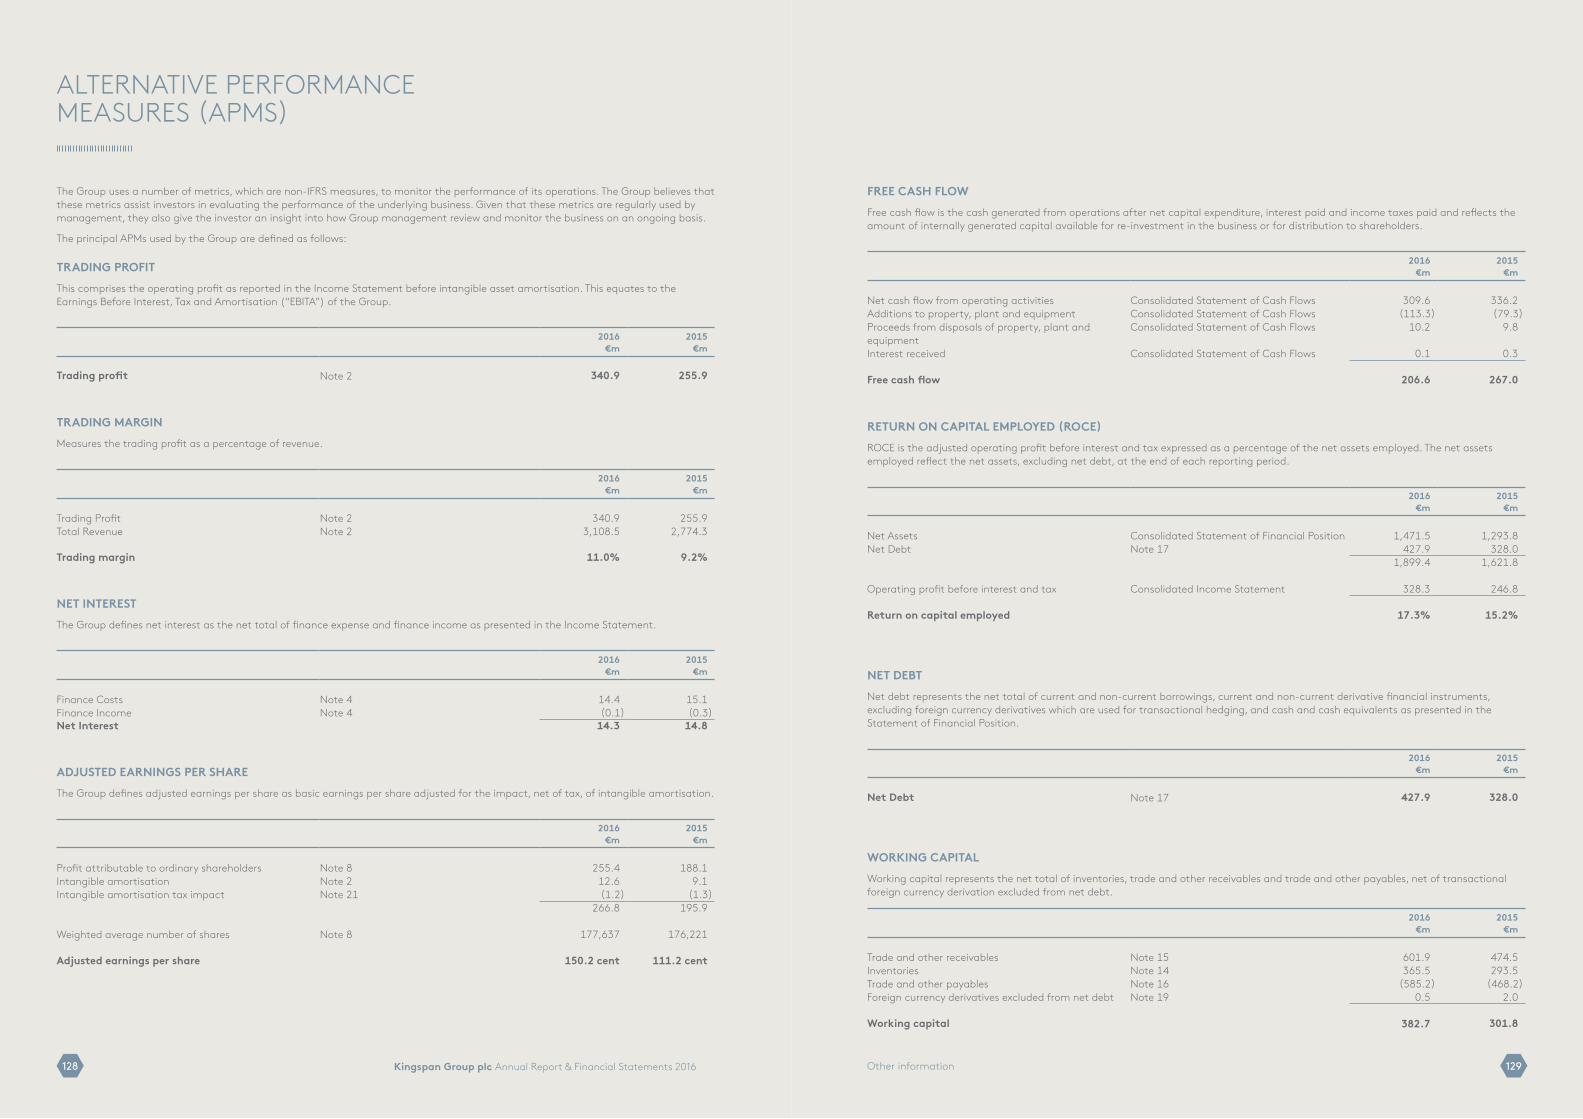
Kingspan Group plc Annual Report & Financial Statements 2016 129128 Other information
ALTERNATIVE PERFORMANCE MEASURES (APMS)
The Group uses a number of metrics, which are non-IFRS measures, to monitor the performance of its operations. The Group believes that these metrics assist investors in evaluating the performance of the underlying business. Given that these metrics are regularly used by management, they also give the investor an insight into how Group management review and monitor the business on an ongoing basis.
The principal APMs used by the Group are defined as follows:
TRADING PROFITThis comprises the operating profit as reported in the Income Statement before intangible asset amortisation. This equates to the Earnings Before Interest, Tax and Amortisation (“EBITA”) of the Group.
2016€m
2015€m
Trading profit Note 2 340.9 255.9
TRADING MARGINMeasures the trading profit as a percentage of revenue.
2016€m
2015€m
Trading Profit Note 2 340.9 255.9Total Revenue Note 2 3,108.5 2,774.3
Trading margin 11.0% 9.2%
NET INTERESTThe Group defines net interest as the net total of finance expense and finance income as presented in the Income Statement.
2016€m
2015€m
Finance Costs Note 4 14.4 15.1Finance Income Note 4 (0.1) (0.3)Net Interest 14.3 14.8
ADJUSTED EARNINGS PER SHAREThe Group defines adjusted earnings per share as basic earnings per share adjusted for the impact, net of tax, of intangible amortisation.
2016€m
2015€m
Profit attributable to ordinary shareholders Note 8 255.4 188.1Intangible amortisation Note 2 12.6 9.1Intangible amortisation tax impact Note 21 (1.2) (1.3)
266.8 195.9
Weighted average number of shares Note 8 177,637 176,221
Adjusted earnings per share 150.2 cent 111.2 cent
FREE CASH FLOWFree cash flow is the cash generated from operations after net capital expenditure, interest paid and income taxes paid and reflects the amount of internally generated capital available for re-investment in the business or for distribution to shareholders.
2016€m
2015€m
Net cash flow from operating activities Consolidated Statement of Cash Flows 309.6 336.2 Additions to property, plant and equipment Consolidated Statement of Cash Flows (113.3) (79.3)Proceeds from disposals of property, plant and equipment
Consolidated Statement of Cash Flows 10.2 9.8
Interest received Consolidated Statement of Cash Flows 0.1 0.3
Free cash flow 206.6 267.0
RETURN ON CAPITAL EMPLOYED (ROCE)ROCE is the adjusted operating profit before interest and tax expressed as a percentage of the net assets employed. The net assets employed reflect the net assets, excluding net debt, at the end of each reporting period.
2016€m
2015€m
Net Assets Consolidated Statement of Financial Position 1,471.5 1,293.8 Net Debt Note 17 427.9 328.0
1,899.4 1,621.8
Operating profit before interest and tax Consolidated Income Statement 328.3 246.8
Return on capital employed 17.3% 15.2%
NET DEBTNet debt represents the net total of current and non-current borrowings, current and non-current derivative financial instruments, excluding foreign currency derivatives which are used for transactional hedging, and cash and cash equivalents as presented in the Statement of Financial Position.
2016€m
2015€m
Net Debt Note 17 427.9 328.0
WORKING CAPITALWorking capital represents the net total of inventories, trade and other receivables and trade and other payables, net of transactional foreign currency derivation excluded from net debt.
2016€m
2015€m
Trade and other receivables Note 15 601.9 474.5Inventories Note 14 365.5 293.5Trade and other payables Note 16 (585.2) (468.2)Foreign currency derivatives excluded from net debt Note 19 0.5 2.0
Working capital 382.7 301.8

Kingspan Group plc Annual Report & Financial Statements 2016 131130 Other information
SHAREHOLDER INFORMATION
THE ANNUAL GENERAL MEETINGThe Annual General Meeting of the Company will be held at The Herbert Park Hotel, Ballsbridge, Dublin 4 on Thursday 27 April 2017 at 10.00 a.m.
Notice of the 2017 AGM will be made available to view online at www.kingspan.com/agm2017
You may submit your votes electronically by accessing Computershare’s website:http://www.eproxyappointment.com/
You will be asked for your Shareholder Reference Number (SRN), Control Number, and PIN, all of which will have been sent to shareholders in advance of the meeting. To be valid, your proxy vote must be received by Computershare no later than 10.00 am on Tuesday 25 April 2017 (48 hours before the meeting).
AMALGAMATION OF SHAREHOLDING ACCOUNTSShareholders who receive duplicate sets of Company mailings due to multiple accounts in their name should write to the Company’s Registrar to have their accounts amalgamated.
WARNING TO SHAREHOLDERSMany companies have become aware that their shareholders have received unsolicited phone calls or correspondence concerning investment matters. These are typically from overseas based “brokers” who target shareholders offering to sell them what often turn out to be worthless or high-risk shares in US or UK investments. They can be very persistent and extremely persuasive. Shareholders are therefore advised to be very wary of any unsolicited advice, offers to buy shares at a discount or offers of free company reports.
Please note that it is very unlikely that either the Company or the Company’s Registrar, Computershare, would make unsolicited telephone calls to shareholders and that any such calls would relate only to official documentation already circulated to shareholders and never in respect of investment “advice”.
If you are in any doubt about the veracity of an unsolicited phone call, please call either the Company Secretary or the Registrar.
COMPANY INFORMATIONKingspan Group plc was incorporated on 14 August 1979. It is an Irish domiciled company and the registered office is Kingspan Group plc, Dublin Road, Kingscourt, Co. Cavan, A82 XY31, Ireland. The registered company number of Kingspan Group plc is 70576.
SHARE REGISTRARAdministrative enquiries about the holding of Kingspan Group plc shares should be directed to:
The Company Registrar:Computershare Investor Services (Ireland) Limited,Heron House,Corrig Road,Sandyford Industrial Estate,Dublin 18.
FINANCIAL CALENDAR
Preliminary results announced: 17 February 2017
Annual General Meeting: 27 April 2017
Payment date for 2016 final dividend: 5 May 2017
Ex dividend date: 30 March 2017
Record date: 31 March 2017
Half-yearly financial report: 21 August 2017
Trading update: 13 November 2017
BANKERS
KBC Bank NV Ulster Bank Ireland Limited
HSBC Bank plc Bank of Ireland
Danske Bank AS Commerzbank
Bank of America ING Bank NV
SOLICITORS
McCann FitzGerald,Riverside One,Sir John Rogerson’s Quay,Dublin 2,Ireland.
Macfarlanes,20 Cursitor Street,London,EC4A 1LT,England.
STOCKBROKERS
Goodbody,Ballsbridge Park,Ballsbridge,Dublin 4Ireland.
UBS Limited, 1 Finsbury Avenue,London,EC2M 2PP,England.
AUDITOR
KPMG,Chartered Accountants & Statutory Auditor,1 Stokes Place,St Stephen’s Green,Dublin 2,Ireland.
INFORMATION REQUIRED BY THE EUROPEAN COMMUNITIES (TAKEOVER BIDS (DIRECTIVE 2004/25/EC)) REGULATIONS 2006The information required by Regulation 21 of the above Regulations as at 31 December 2016 is set out below.
Rights and obligations attaching to the Ordinary Shares
The Company has no securities in issue conferring special rights with regards control of the Company.
All Ordinary Shares rank pari passu, and the rights attaching to the Ordinary Shares (including as to voting and transfer) are as set out in the Company’s Articles of Association (“Articles”). The Articles of Association also contain the rules relating to the appointment and removal of directors, rules relating to the amending of the Articles of Association, the powers of the Company’s directors and in relation to issuing or buying back by the Company of its shares. A copy of the Articles may be found on www.kingspan.com or may be obtained on request to the Company Secretary.
Holders of Ordinary Shares are entitled to receive duly declared dividends in cash or, when offered, additional Ordinary Shares. In the event of any surplus arising on the occasion of the liquidation of the Company, shareholders would be entitled to a share in that surplus pro rata to their holdings of Ordinary Shares.
Holders of Ordinary Shares are entitled to receive notice of and to attend, speak and vote in person or by proxy, at general meetings having, on a show of hands, one vote, and, on a poll, one vote for each Ordinary Share held. Procedures and deadlines for entitlement to exercise, and exercise of, voting rights are specified in the notice convening the general meeting in question. There are no restrictions on voting rights except in the circumstances where a “Specified Event” (as defined in the Articles) shall have occurred and the directors have served a Restriction Notice on the shareholder. Upon the service of such Restriction Notice, no holder of the shares specified in the notice shall, for so long as such notice shall remain in force, be entitled to attend or vote at any general meeting, either personally or by proxy.
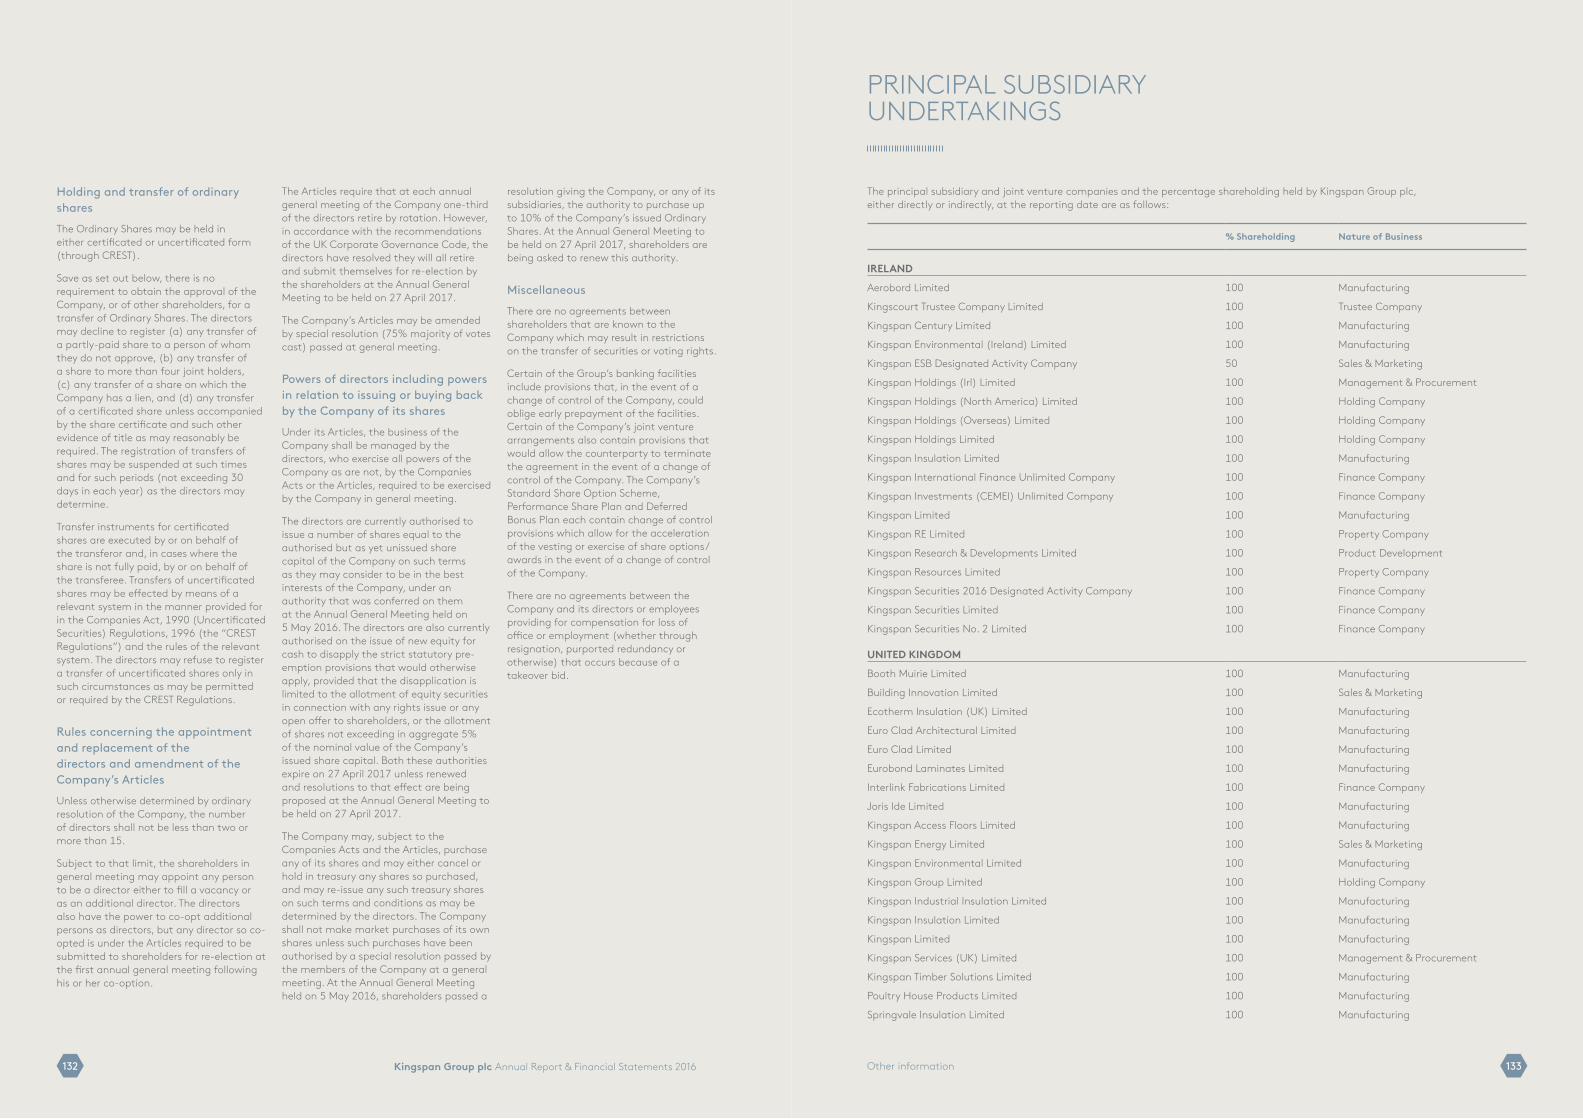
Kingspan Group plc Annual Report & Financial Statements 2016 133132 Other information
Holding and transfer of ordinary shares
The Ordinary Shares may be held in either certificated or uncertificated form (through CREST).
Save as set out below, there is no requirement to obtain the approval of the Company, or of other shareholders, for a transfer of Ordinary Shares. The directors may decline to register (a) any transfer of a partly-paid share to a person of whom they do not approve, (b) any transfer of a share to more than four joint holders, (c) any transfer of a share on which the Company has a lien, and (d) any transfer of a certificated share unless accompanied by the share certificate and such other evidence of title as may reasonably be required. The registration of transfers of shares may be suspended at such times and for such periods (not exceeding 30 days in each year) as the directors may determine.
Transfer instruments for certificated shares are executed by or on behalf of the transferor and, in cases where the share is not fully paid, by or on behalf of the transferee. Transfers of uncertificated shares may be effected by means of a relevant system in the manner provided for in the Companies Act, 1990 (Uncertificated Securities) Regulations, 1996 (the “CREST Regulations”) and the rules of the relevant system. The directors may refuse to register a transfer of uncertificated shares only in such circumstances as may be permitted or required by the CREST Regulations.
Rules concerning the appointment and replacement of the directors and amendment of the Company’s Articles
Unless otherwise determined by ordinary resolution of the Company, the number of directors shall not be less than two or more than 15.
Subject to that limit, the shareholders in general meeting may appoint any person to be a director either to fill a vacancy or as an additional director. The directors also have the power to co-opt additional persons as directors, but any director so co-opted is under the Articles required to be submitted to shareholders for re-election at the first annual general meeting following his or her co-option.
The Articles require that at each annual general meeting of the Company one-third of the directors retire by rotation. However, in accordance with the recommendations of the UK Corporate Governance Code, the directors have resolved they will all retire and submit themselves for re-election by the shareholders at the Annual General Meeting to be held on 27 April 2017.
The Company’s Articles may be amended by special resolution (75% majority of votes cast) passed at general meeting.
Powers of directors including powers in relation to issuing or buying back by the Company of its shares
Under its Articles, the business of the Company shall be managed by the directors, who exercise all powers of the Company as are not, by the Companies Acts or the Articles, required to be exercised by the Company in general meeting.
The directors are currently authorised to issue a number of shares equal to the authorised but as yet unissued share capital of the Company on such terms as they may consider to be in the best interests of the Company, under an authority that was conferred on them at the Annual General Meeting held on 5 May 2016. The directors are also currently authorised on the issue of new equity for cash to disapply the strict statutory pre-emption provisions that would otherwise apply, provided that the disapplication is limited to the allotment of equity securities in connection with any rights issue or any open offer to shareholders, or the allotment of shares not exceeding in aggregate 5% of the nominal value of the Company’s issued share capital. Both these authorities expire on 27 April 2017 unless renewed and resolutions to that effect are being proposed at the Annual General Meeting to be held on 27 April 2017.
The Company may, subject to the Companies Acts and the Articles, purchase any of its shares and may either cancel or hold in treasury any shares so purchased, and may re-issue any such treasury shares on such terms and conditions as may be determined by the directors. The Company shall not make market purchases of its own shares unless such purchases have been authorised by a special resolution passed by the members of the Company at a general meeting. At the Annual General Meeting held on 5 May 2016, shareholders passed a
resolution giving the Company, or any of its subsidiaries, the authority to purchase up to 10% of the Company’s issued Ordinary Shares. At the Annual General Meeting to be held on 27 April 2017, shareholders are being asked to renew this authority.
Miscellaneous
There are no agreements between shareholders that are known to the Company which may result in restrictions on the transfer of securities or voting rights.
Certain of the Group’s banking facilities include provisions that, in the event of a change of control of the Company, could oblige early prepayment of the facilities. Certain of the Company’s joint venture arrangements also contain provisions that would allow the counterparty to terminate the agreement in the event of a change of control of the Company. The Company’s Standard Share Option Scheme, Performance Share Plan and Deferred Bonus Plan each contain change of control provisions which allow for the acceleration of the vesting or exercise of share options/awards in the event of a change of control of the Company.
There are no agreements between the Company and its directors or employees providing for compensation for loss of office or employment (whether through resignation, purported redundancy or otherwise) that occurs because of a takeover bid.
% Shareholding Nature of Business
IRELAND
Aerobord Limited 100 Manufacturing
Kingscourt Trustee Company Limited 100 Trustee Company
Kingspan Century Limited 100 Manufacturing
Kingspan Environmental (Ireland) Limited 100 Manufacturing
Kingspan ESB Designated Activity Company 50 Sales & Marketing
Kingspan Holdings (Irl) Limited 100 Management & Procurement
Kingspan Holdings (North America) Limited 100 Holding Company
Kingspan Holdings (Overseas) Limited 100 Holding Company
Kingspan Holdings Limited 100 Holding Company
Kingspan Insulation Limited 100 Manufacturing
Kingspan International Finance Unlimited Company 100 Finance Company
Kingspan Investments (CEMEI) Unlimited Company 100 Finance Company
Kingspan Limited 100 Manufacturing
Kingspan RE Limited 100 Property Company
Kingspan Research & Developments Limited 100 Product Development
Kingspan Resources Limited 100 Property Company
Kingspan Securities 2016 Designated Activity Company 100 Finance Company
Kingspan Securities Limited 100 Finance Company
Kingspan Securities No. 2 Limited 100 Finance Company
UNITED KINGDOM
Booth Muirie Limited 100 Manufacturing
Building Innovation Limited 100 Sales & Marketing
Ecotherm Insulation (UK) Limited 100 Manufacturing
Euro Clad Architectural Limited 100 Manufacturing
Euro Clad Limited 100 Manufacturing
Eurobond Laminates Limited 100 Manufacturing
Interlink Fabrications Limited 100 Finance Company
Joris Ide Limited 100 Manufacturing
Kingspan Access Floors Limited 100 Manufacturing
Kingspan Energy Limited 100 Sales & Marketing
Kingspan Environmental Limited 100 Manufacturing
Kingspan Group Limited 100 Holding Company
Kingspan Industrial Insulation Limited 100 Manufacturing
Kingspan Insulation Limited 100 Manufacturing
Kingspan Limited 100 Manufacturing
Kingspan Services (UK) Limited 100 Management & Procurement
Kingspan Timber Solutions Limited 100 Manufacturing
Poultry House Products Limited 100 Manufacturing
Springvale Insulation Limited 100 Manufacturing
PRINCIPAL SUBSIDIARY UNDERTAKINGS
The principal subsidiary and joint venture companies and the percentage shareholding held by Kingspan Group plc, either directly or indirectly, at the reporting date are as follows:
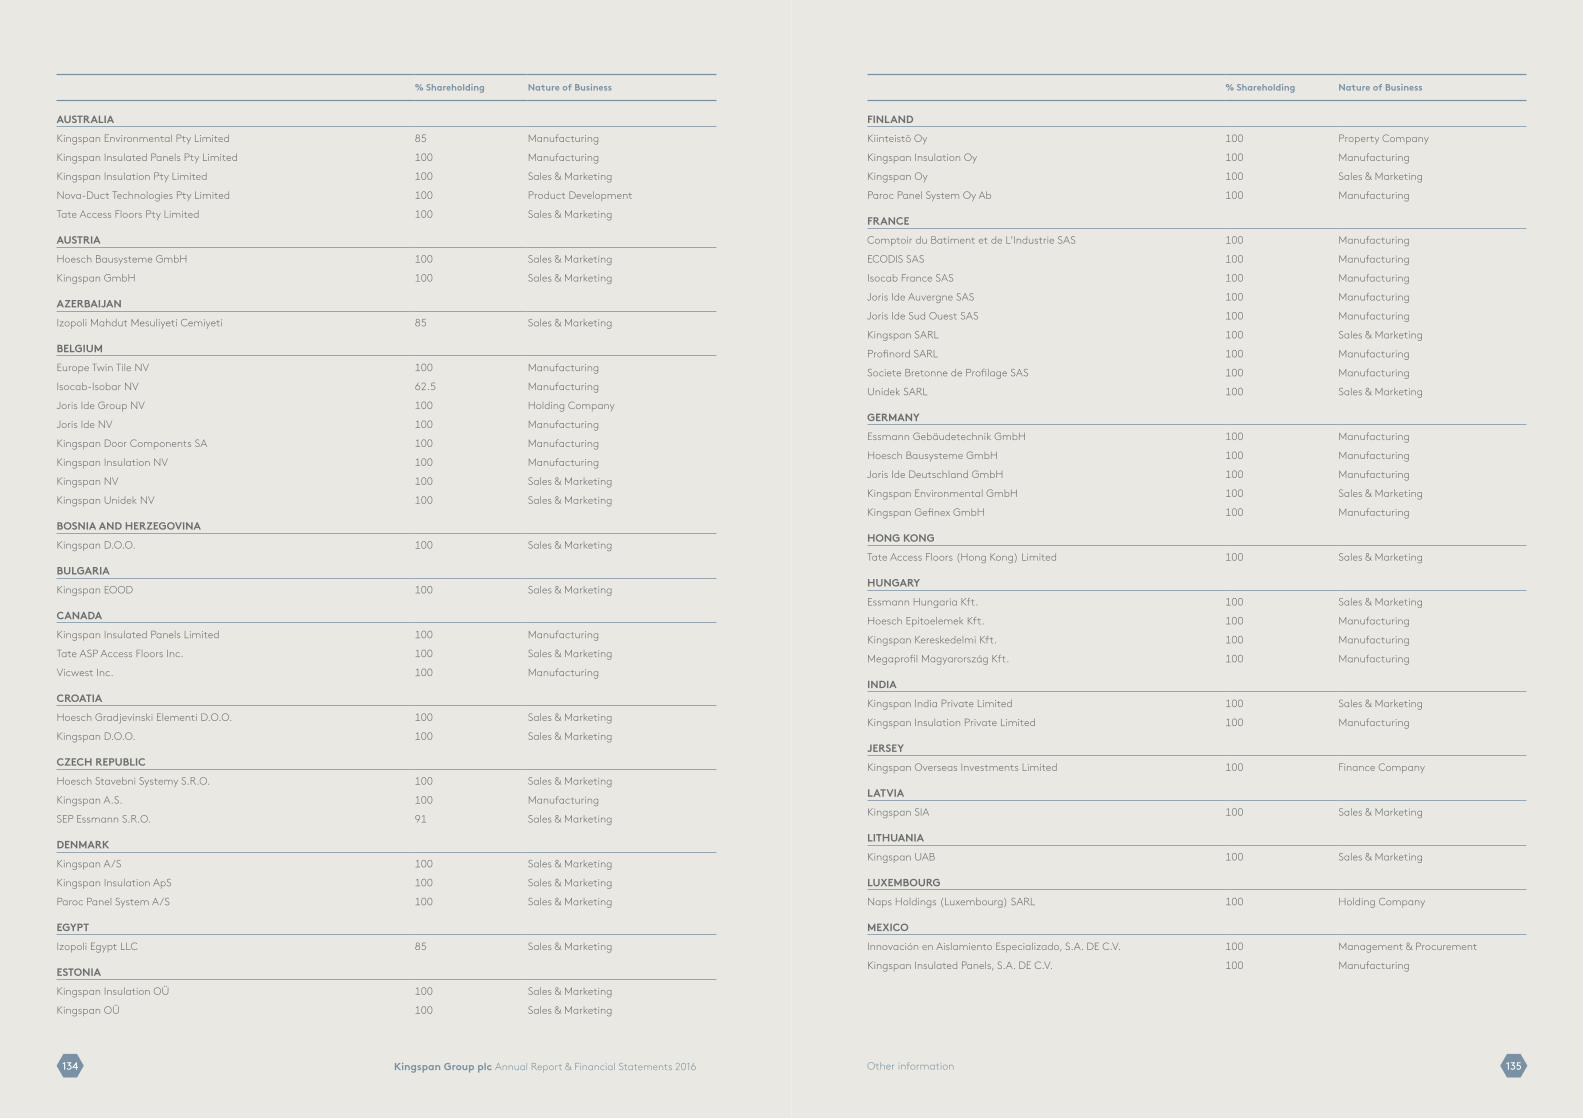
Kingspan Group plc Annual Report & Financial Statements 2016 135134 Other information
% Shareholding Nature of Business
AUSTRALIA
Kingspan Environmental Pty Limited 85 Manufacturing
Kingspan Insulated Panels Pty Limited 100 Manufacturing
Kingspan Insulation Pty Limited 100 Sales & Marketing
Nova-Duct Technologies Pty Limited 100 Product Development
Tate Access Floors Pty Limited 100 Sales & Marketing
AUSTRIA
Hoesch Bausysteme GmbH 100 Sales & Marketing
Kingspan GmbH 100 Sales & Marketing
AZERBAIJAN
Izopoli Mahdut Mesuliyeti Cemiyeti 85 Sales & Marketing
BELGIUM
Europe Twin Tile NV 100 Manufacturing
Isocab-Isobar NV 62.5 Manufacturing
Joris Ide Group NV 100 Holding Company
Joris Ide NV 100 Manufacturing
Kingspan Door Components SA 100 Manufacturing
Kingspan Insulation NV 100 Manufacturing
Kingspan NV 100 Sales & Marketing
Kingspan Unidek NV 100 Sales & Marketing
BOSNIA AND HERZEGOVINA
Kingspan D.O.O. 100 Sales & Marketing
BULGARIA
Kingspan EOOD 100 Sales & Marketing
CANADA
Kingspan Insulated Panels Limited 100 Manufacturing
Tate ASP Access Floors Inc. 100 Sales & Marketing
Vicwest Inc. 100 Manufacturing
CROATIA
Hoesch Gradjevinski Elementi D.O.O. 100 Sales & Marketing
Kingspan D.O.O. 100 Sales & Marketing
CZECH REPUBLIC
Hoesch Stavebni Systemy S.R.O. 100 Sales & Marketing
Kingspan A.S. 100 Manufacturing
SEP Essmann S.R.O. 91 Sales & Marketing
DENMARK
Kingspan A/S 100 Sales & Marketing
Kingspan Insulation ApS 100 Sales & Marketing
Paroc Panel System A/S 100 Sales & Marketing
EGYPT
Izopoli Egypt LLC 85 Sales & Marketing
ESTONIA
Kingspan Insulation OÜ 100 Sales & Marketing
Kingspan OÜ 100 Sales & Marketing
% Shareholding Nature of Business
FINLAND
Kiinteistö Oy 100 Property Company
Kingspan Insulation Oy 100 Manufacturing
Kingspan Oy 100 Sales & Marketing
Paroc Panel System Oy Ab 100 Manufacturing
FRANCE
Comptoir du Batiment et de L’Industrie SAS 100 Manufacturing
ECODIS SAS 100 Manufacturing
Isocab France SAS 100 Manufacturing
Joris Ide Auvergne SAS 100 Manufacturing
Joris Ide Sud Ouest SAS 100 Manufacturing
Kingspan SARL 100 Sales & Marketing
Profinord SARL 100 Manufacturing
Societe Bretonne de Profilage SAS 100 Manufacturing
Unidek SARL 100 Sales & Marketing
GERMANY
Essmann Gebäudetechnik GmbH 100 Manufacturing
Hoesch Bausysteme GmbH 100 Manufacturing
Joris Ide Deutschland GmbH 100 Manufacturing
Kingspan Environmental GmbH 100 Sales & Marketing
Kingspan Gefinex GmbH 100 Manufacturing
HONG KONG
Tate Access Floors (Hong Kong) Limited 100 Sales & Marketing
HUNGARY
Essmann Hungaria Kft. 100 Sales & Marketing
Hoesch Epitoelemek Kft. 100 Manufacturing
Kingspan Kereskedelmi Kft. 100 Manufacturing
Megaprofil Magyarország Kft. 100 Manufacturing
INDIA
Kingspan India Private Limited 100 Sales & Marketing
Kingspan Insulation Private Limited 100 Manufacturing
JERSEY
Kingspan Overseas Investments Limited 100 Finance Company
LATVIA
Kingspan SIA 100 Sales & Marketing
LITHUANIA
Kingspan UAB 100 Sales & Marketing
LUXEMBOURG
Naps Holdings (Luxembourg) SARL 100 Holding Company
MEXICO
Innovación en Aislamiento Especializado, S.A. DE C.V. 100 Management & Procurement
Kingspan Insulated Panels, S.A. DE C.V. 100 Manufacturing
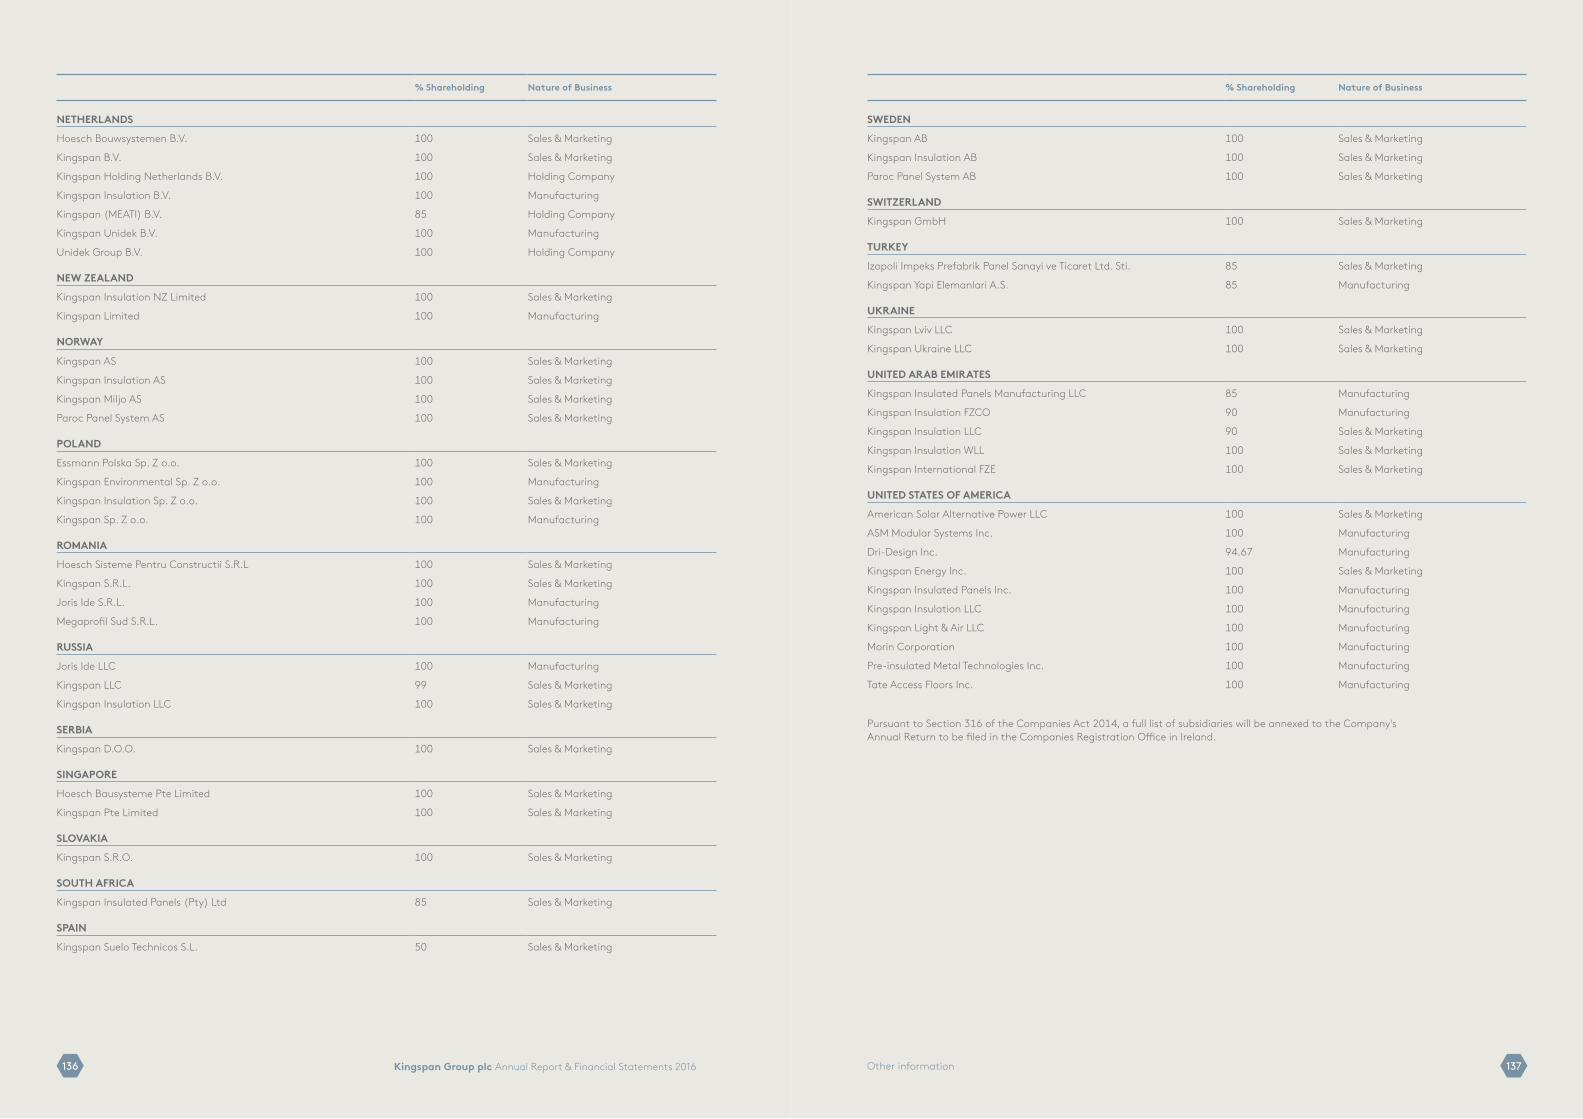
Kingspan Group plc Annual Report & Financial Statements 2016 137136 Other information
% Shareholding Nature of Business
NETHERLANDS
Hoesch Bouwsystemen B.V. 100 Sales & Marketing
Kingspan B.V. 100 Sales & Marketing
Kingspan Holding Netherlands B.V. 100 Holding Company
Kingspan Insulation B.V. 100 Manufacturing
Kingspan (MEATI) B.V. 85 Holding Company
Kingspan Unidek B.V. 100 Manufacturing
Unidek Group B.V. 100 Holding Company
NEW ZEALAND
Kingspan Insulation NZ Limited 100 Sales & Marketing
Kingspan Limited 100 Manufacturing
NORWAY
Kingspan AS 100 Sales & Marketing
Kingspan Insulation AS 100 Sales & Marketing
Kingspan Miljo AS 100 Sales & Marketing
Paroc Panel System AS 100 Sales & Marketing
POLAND
Essmann Polska Sp. Z o.o. 100 Sales & Marketing
Kingspan Environmental Sp. Z o.o. 100 Manufacturing
Kingspan Insulation Sp. Z o.o. 100 Sales & Marketing
Kingspan Sp. Z o.o. 100 Manufacturing
ROMANIA
Hoesch Sisteme Pentru Constructii S.R.L 100 Sales & Marketing
Kingspan S.R.L. 100 Sales & Marketing
Joris Ide S.R.L. 100 Manufacturing
Megaprofil Sud S.R.L. 100 Manufacturing
RUSSIA
Joris Ide LLC 100 Manufacturing
Kingspan LLC 99 Sales & Marketing
Kingspan Insulation LLC 100 Sales & Marketing
SERBIA
Kingspan D.O.O. 100 Sales & Marketing
SINGAPORE
Hoesch Bausysteme Pte Limited 100 Sales & Marketing
Kingspan Pte Limited 100 Sales & Marketing
SLOVAKIA
Kingspan S.R.O. 100 Sales & Marketing
SOUTH AFRICA
Kingspan Insulated Panels (Pty) Ltd 85 Sales & Marketing
SPAIN
Kingspan Suelo Technicos S.L. 50 Sales & Marketing
% Shareholding Nature of Business
SWEDEN
Kingspan AB 100 Sales & Marketing
Kingspan Insulation AB 100 Sales & Marketing
Paroc Panel System AB 100 Sales & Marketing
SWITZERLAND
Kingspan GmbH 100 Sales & Marketing
TURKEY
Izopoli Impeks Prefabrik Panel Sanayi ve Ticaret Ltd. Sti. 85 Sales & Marketing
Kingspan Yapi Elemanlari A.S. 85 Manufacturing
UKRAINE
Kingspan Lviv LLC 100 Sales & Marketing
Kingspan Ukraine LLC 100 Sales & Marketing
UNITED ARAB EMIRATES
Kingspan Insulated Panels Manufacturing LLC 85 Manufacturing
Kingspan Insulation FZCO 90 Manufacturing
Kingspan Insulation LLC 90 Sales & Marketing
Kingspan Insulation WLL 100 Sales & Marketing
Kingspan International FZE 100 Sales & Marketing
UNITED STATES OF AMERICA
American Solar Alternative Power LLC 100 Sales & Marketing
ASM Modular Systems Inc. 100 Manufacturing
Dri-Design Inc. 94.67 Manufacturing
Kingspan Energy Inc. 100 Sales & Marketing
Kingspan Insulated Panels Inc. 100 Manufacturing
Kingspan Insulation LLC 100 Manufacturing
Kingspan Light & Air LLC 100 Manufacturing
Morin Corporation 100 Manufacturing
Pre-insulated Metal Technologies Inc. 100 Manufacturing
Tate Access Floors Inc. 100 Manufacturing
Pursuant to Section 316 of the Companies Act 2014, a full list of subsidiaries will be annexed to the Company's Annual Return to be filed in the Companies Registration Office in Ireland.
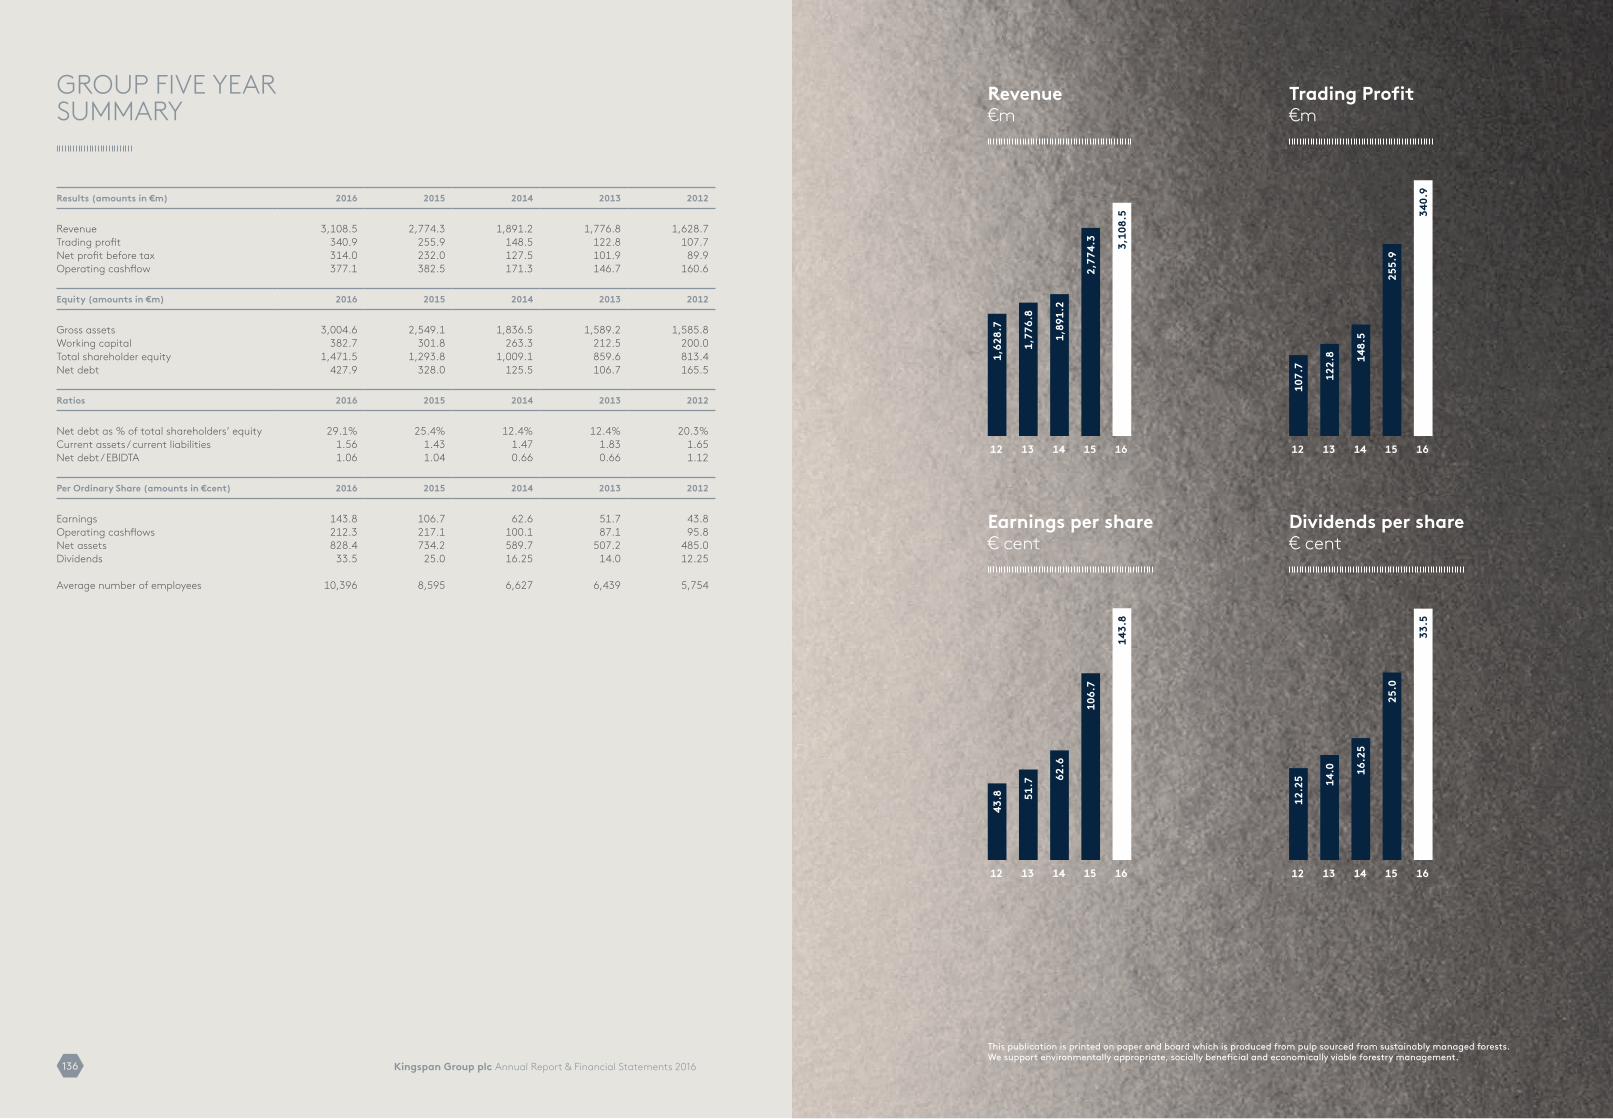
Revenue €m
Trading Profit €m
Kingspan Group plc Annual Report & Financial Statements 2016136
group fIve yeAr summAry
results (amounts in €m) 2016 2015 2014 2013 2012
Revenue 3,108.5 2,774.3 1,891.2 1,776.8 1,628.7Trading profit 340.9 255.9 148.5 122.8 107.7Net profit before tax 314.0 232.0 127.5 101.9 89.9Operating cashflow 377.1 382.5 171.3 146.7 160.6
equity (amounts in €m) 2016 2015 2014 2013 2012
Gross assets 3,004.6 2,549.1 1,836.5 1,589.2 1,585.8Working capital 382.7 301.8 263.3 212.5 200.0Total shareholder equity 1,471.5 1,293.8 1,009.1 859.6 813.4Net debt 427.9 328.0 125.5 106.7 165.5
ratios 2016 2015 2014 2013 2012
Net debt as % of total shareholders’ equity 29.1% 25.4% 12.4% 12.4% 20.3%Current assets / current liabilities 1.56 1.43 1.47 1.83 1.65Net debt / EBIDTA 1.06 1.04 0.66 0.66 1.12
per Ordinary share (amounts in €cent) 2016 2015 2014 2013 2012
Earnings 143.8 106.7 62.6 51.7 43.8Operating cashflows 212.3 217.1 100.1 87.1 95.8Net assets 828.4 734.2 589.7 507.2 485.0Dividends 33.5 25.0 16.25 14.0 12.25
Average number of employees 10,396 8,595 6,627 6,439 5,754
12
1,62
8.7
1,77
6.8
1,89
1.2
2,77
4.3
3,10
8.5
1213 1314 1415 1516 16
107.
7
122.
8 148.
5
255.
9
340.
9
12 1213 1314 1415 1516 16
Earnings per share € cent
Dividends per share € cent
43.8 51
.7 62.6
106.
7
143.
8
12.2
5 14.0 16
.25
25.0
33.5
This publication is printed on paper and board which is produced from pulp sourced from sustainably managed forests.We support environmentally appropriate, socially beneficial and economically viable forestry management.

Kingspan Group plcAnnual Report & Financial Statements 2016
Kingspan Group plc Annual Report & Financial Statem
ents 2016
Des
ign:
ww
w.r
eddo
g.ie
Dublin RoadKingscourtCo CavanIrelandA82 XY31
Tel: +353 42 969 8000Fax: +353 42 966 7501Email: [email protected]
www.kingspan.com