kirklees air quality annual status report 2016
TRANSCRIPT

2016
LAQM Annual Status Report 2016
2016 Air Quality Annual Status Report (ASR) In fulfilment of Part IV of the Environment Act 1995 Local Air Quality Management Date: June 2016

2016
LAQM Annual Status Report 2016
Local Authority Officer
Andrew Jameson
Department Investment & Regeneration
Address
Environmental Health Flint Street Depot Flint Street Fartown Huddersfield HD1 6LG
Telephone 01484 221000
E-mail [email protected]
Report Reference number
Kirklees_2016_ASR
Date Sept 2016

2016
LAQM Annual Status Report 2016 i
Executive Summary: Air Quality in Our Area
Kirklees is the third largest Metropolitan District in area - it covers 157 square miles
or 40,860 hectares and a population of ~404,000. Measured in population terms
Kirklees is one of the larger local authorities in England and Wales ranking 11th out
of 348 districts. Over one tenth of the district is in the Peak District National Park. The
extremes of altitude in Kirklees range from 33m (108 ft) at Thornhill Lees to 582m
(1903 ft) at Black Hill.
Manufacturing industry, textiles and engineering still form a proportion of the local
economy, the majority of it situated in the Huddersfield and Dewsbury areas and
northwards to the M62. The urban areas comprise nine towns including the two larger
towns of Huddersfield and Dewsbury.
Air Quality in Kirklees
Air pollution is associated with a number of adverse health impacts. It is recognised
as a contributing factor in the onset of heart disease and cancer. Additionally, air
pollution particularly affects the most vulnerable in society: children and older people,
and those with heart and lung conditions. There is also often a strong correlation with
equalities issues, because areas with poor air quality are also often the less affluent
areas1,2.
The annual health cost to society of the impacts of particulate matter alone in the UK
is estimated to be around £16 billion3.
The air quality issues within Kirklees are focussed around the road network connecting
the towns, and traffic which passes between the West Yorkshire conurbation along the
M62 and Greater Manchester.
Kirklees Council have conducted monitoring across the district where these primary
roads are in close proximity to relevant human activity. To date Kirklees has identified
2 primary pollutants of concern. They are Nitrogen Dioxide and Particulate Matter.
1 Environmental equity, air quality, socioeconomic status and respiratory health, 2010
2 Air quality and social deprivation in the UK: an environmental inequalities analysis, 2006
3 Defra. Abatement cost guidance for valuing changes in air quality, May 2013

2016
LAQM Annual Status Report 2016 ii
Current trends indicate that the levels of these pollutants have fallen over the last 5
years, but health related objectives are still exceeded within the district.
Actions to Improve Air Quality
Kirklees Council has taken forward a number of measures during the current
reporting year of 2016 in pursuit of improving local air quality.
Key completed measures are:
West Yorkshire Low Emission Strategy
Deep Clean of Scout Hill
ECO Stars Freight Recognition Scheme
Local Plan Air Quality Officer input and associated study
The Deep Clean of Scouthill was an AQMA focused project conducted in 2014 and
2015 in an attempt to reduce the PM10 exceedances. The project targets the issue of
re-suspension of particulates. Prior to conducting the cleaning PM10 levels exceeded
the daily objective, which resulted in a declaration in 2007. Following the
improvement actions, Kirklees Council have observed an 83% fall in number of daily
exceedances by conducting deep cleans in the area. The lower levels have been
observed in both 2014 and 2015. It is for that reason that Kirklees Council are
proposing to revoke AQMA 2.
The majority of the other aforementioned improvement actions are districtwide and
policy based action, of which the improvements are difficult to measure.
Local Priorities and Challenges
During the 2016/17 reporting year Kirklees Council priorities for air quality are listed
below;
Declare 7 AQMAs
Construct new action plan for the district and AQMAs
Integrate the West Yorkshire Low Emission Strategy into Council Policy
Undertake impact assessment of the local plan

2016
LAQM Annual Status Report 2016 iii
Explore a regional EV charging network
How to Get Involved
If you wish to get information for air quality, please use the following websites:
http://www.kirklees.gov.uk/community/noisePollution/pollution.aspx
http://www.kirklees.gov.uk/involve/entry.aspx?id=821
https://uk-air.defra.gov.uk/
2016
LAQM Annual Status Report 2016 iv
Table of Contents
Executive Summary: Air Quality in Our Area .......................................................... i
Air Quality in Kirklees .......................................................................................................... i
Actions to Improve Air Quality ............................................................................................ ii
Local Priorities and Challenges .......................................................................................... ii
How to Get Involved.......................................................................................................... iii
1 Local Air Quality Management ........................................................................ 1
2 Actions to Improve Air Quality ........................................................................ 2
2.1 Air Quality Management Areas .............................................................................. 2
2.2 Progress and Impact of Measures to address Air Quality in Kirklees Council ........ 3
2.3 PM2.5 – Local Authority Approach to Reducing Emissions and or
Concentrations.................................................................................................................25
3 Air Quality Monitoring Data and Comparison with Air Quality
Objectives and National Compliance .................................................................... 26
3.1 Summary of Monitoring Undertaken .....................................................................26
3.1.1 Automatic Monitoring Sites .......................................................................................... 26
3.1.2 Non-Automatic Monitoring Sites................................................................................... 27
3.2 Individual Pollutants .............................................................................................27
3.2.1 Nitrogen Dioxide (NO2)................................................................................................. 27
3.2.2 Particulate Matter (PM10) .............................................................................................. 30
3.2.3 Sulphur Dioxide (SO2) .................................................................................................. 32
Appendix A: Monitoring Results ........................................................................... 33
Appendix B: Full Monthly Diffusion Tube Results for 2016 ................................ 46
Appendix C: Supporting Technical Information / Air Quality Monitoring
Data QA/QC ............................................................................................................. 52
C.1.1 Factor from Local Co-location Studies .............................................................................. 52
C.1.2 Diffusion Tube Bias Adjustment Factors ........................................................................... 52
C.1.3 Discussion of Choice of Factor to Use .............................................................................. 52
C.2 PM Monitoring Adjustment ................................................................................................... 53
C.3 QA/QC of Automatic Monitoring ........................................................................................... 53
C.4 QA/QC of Diffusion Tube Monitoring .................................................................................... 55
Appendix D: Map(s) of Monitoring Locations ...................................................... 56
D.1 Continuous Monitor Sites ..................................................................................................... 56
D.2 Passive Monitor Sites ........................................................................................................... 60
Appendix E: Summary of Air Quality Objectives in England .............................. 65
Appendix F: Air Quality Management Areas 2016 ............................................... 66
2016
LAQM Annual Status Report 2016 v
F1.1 Ainley Top AQMA Assessment ....................................................................................... 66
F1.2 Birkenshaw AQMA Assessment ..................................................................................... 66
F1.3 Eastborough AQMA Assessment ................................................................................... 66
F1.4 Edgerton AQMA Assessment ......................................................................................... 66
F1.5 Heckmondwike AQMA Assessment ............................................................................... 66
F1.6 Huddersfield Town Centre AQMA Assessment .............................................................. 66
F1.7 Outlane AQMA Assessment ........................................................................................... 66
F.1 Ainley Top Detailed Assessment .......................................................................................... 67
F.2 Birkenshaw Detailed Assessment ......................................................................................... 70
F.3 Eastborough Detailed Assessment ....................................................................................... 73
F.4 Edgerton Detailed Assessment ............................................................................................. 76
F.5 Heckmondwike Detailed Assessment ................................................................................... 79
F.6 Huddersfield Town Centre Detailed Assessment ................................................................. 82
F.7 Outlane Detailed Assessment ............................................................................................... 85
F.8 Outlane Detailed Assessment ............................................................................................... 88
Glossary of Terms .................................................................................................. 92
References .............................................................................................................. 93
2016
LAQM Annual Status Report 2016 vi
List of Tables
Table 0.1 – Declared Air Quality Management Areas
Table 0.2 – Progress on Measures to Improve Air Quality
Table A.1 – Details of Automatic Monitoring Sites
Table A.2 – Details of Non-Automatic Monitoring Sites
Table A.3 – Annual Mean NO2 Monitoring Results
Table A.4 – 1-Hour Mean NO2 Monitoring Results
Table A.5 – Annual Mean PM10 Monitoring Results
Table A.6 – 24-Hour Mean PM10 Monitoring Results
Table A.7 – SO2 Monitoring Results
Table B.1 – NO2 Monthly Diffusion Tube Results – 2016
Table B.2 – Façade Corrected NO2 Annual Diffusion Tube Results – 2016
Table E.1 – Air Quality Objectives in England
Table F.1.1 - Results of Run at diffusion tube sites and statistical analysis of model
Table F.1.2 - Statistical analysis of the corrected data
Table F.2.1 - Results of Run at diffusion tube sites and statistical analysis of model
Table F.2.2 - Statistical analysis of the corrected data
Table F.3.1 - Results of Run at diffusion tube sites and statistical analysis of model
Table F.3.2 - Statistical analysis of the corrected data
Table F.4.1 - Results of Run at diffusion tube sites and statistical analysis of model
Table F.4.2 - Statistical analysis of the corrected data
Table F.5.1 - Results of Run at diffusion tube sites and statistical analysis of model
Table F.5.2 - Statistical analysis of the corrected data
Table F.6.1 - Results of Run at diffusion tube sites and statistical analysis of model
Table F.6.2 - Statistical analysis of the corrected data
Table F.7.1 - Results of Run at diffusion tube sites and statistical analysis of model
Table F.7.2 - Statistical analysis of the corrected data
Table F.8.1 - Results of Run at diffusion tube sites and statistical analysis of model
Table F.8.2 - Statistical analysis of the corrected data

2016
LAQM Annual Status Report 2016 vii
List of Figures
Figure 3.1 Automatic monitoring - Annual NO2 concentration trends
Figure 3.2 Diffusion tube monitoring - Annual NO2 concentration trends
Figure 3.3 Automatic monitoring - Annual PM10 concentration trends
Figure 3.4 Automatic monitoring - Daily PM10 exceedance trends
Map 1.1 Automatic Monitoring Sites across district
Map 1.2 Automatic Monitoring Site Trailer 2 Back Ravens Avenue & Roadside 1 Huddersfield Road
Map 1.3 Automatic Monitoring Site Roadside 2
Map 1.4 Automatic Monitoring Site New Roadside 3
Map 1.5 Automatic Monitoring Site Roadside 4
Map 1.6 Automatic Monitoring Site Roadside 5
Map 1.7 Automatic Monitoring Site Roadside 6
Map 2.1 Non-Automatic Monitoring Sites across district
Map 2.2 AQMA 1 Bradley diffusion tubes
Map 2.3 Huddersfield town centre diffusion tubes
Map 2.4 Dewsbury town centre & Eastborough diffusion tubes
Map 2.5 Batley diffusion tubes
Map 2.6 Birkenshaw diffusion tubes
Map 2.7 Heckmondwike and Liversedge diffusion tubes
Map 2.8 Edgerton diffusion tubes
Map 2.9 Thornton Lodge diffusion tubes
Figure F.1.1 NO2 Monitored / Modelled scatter graph
Map 3.1 Ainley Top AQMA
Figure F.2.1 NO2 Monitored / Modelled scatter graph
Map 3.2 Birkenshaw AQMA
Figure F.3.1 NO2 Monitored / Modelled scatter graph
Map 3.3 Eastborough AQMA
Figure F4.1 NO2 Monitored / Modelled scatter graph
Map 3.4 Edgerton AQMA
Figure F5.1 NO2 Monitored / Modelled scatter graph
Map 3.5 Heckmondwike AQMA
Figure F.6.1 NO2 Monitored / Modelled scatter graph
Map 3.6 Huddersfield Town Centre AQMA
Figure F.7.1 NO2 Monitored / Modelled scatter graph
Map 3.7 Outlane AQMA
Figure F.8.1 NO2 Monitored / Modelled scatter graph
Map 3.7 AQMA 1 Review

2016
LAQM Annual Status Report 2016 1
1 Local Air Quality Management
This report provides an overview of air quality in Kirklees Council during 2016. It
fulfils the requirements of Local Air Quality Management (LAQM) as set out in Part IV
of the Environment Act (1995) and the relevant Policy and Technical Guidance
documents.
The LAQM process places an obligation on all local authorities to regularly review
and assess air quality in their areas, and to determine whether or not the air quality
objectives are likely to be achieved. Where an exceedance is considered likely the
local authority must declare an Air Quality Management Area (AQMA) and prepare
an Air Quality Action Plan (AQAP) setting out the measures it intends to put in place
in pursuit of the objectives. This Annual Status Report (ASR) is an annual
requirement showing the strategies employed by Kirklees Council to improve air
quality and any progress that has been made.
The statutory air quality objectives applicable to LAQM in England can be found in
Table E.2 in Appendix E.

2016
LAQM Annual Status Report 2016 2
2 Actions to Improve Air Quality
2.1 Air Quality Management Areas
Air Quality Management Areas (AQMAs) are declared when there is an exceedance
or likely exceedance of an air quality objective. After declaration, the authority must
prepare an Air Quality Action Plan (AQAP) within 12-18 months setting out measures
it intends to put in place in pursuit of the objectives.
A summary of AQMAs declared by Kirklees Council can be found in Table 2.1.
Further information related to declared or revoked AQMAs, including maps of AQMA
boundaries are available online at https://uk-air.defra.gov.uk/aqma/local-
authorities?la_id=140 and
http://www.kirklees.gov.uk/community/noisePollution/pollution.aspx
We propose to declare new AQMAs in 7 areas (Appendix F – Air Quality
Management areas). The new AQMAs are as a result of exceedance of annual NO2
objectives and the boundaries have been defined through the use of monitoring
coupled with air quality modelling. These areas are a follows;
Birchencliffe
Birkenshaw
Eastborough
Edgerton
Heckmondwike
Huddersfield Town Centre
Outlane
The AQMA 1 at Bradley continues to exceed the annual NO2 objectives. Therefore,
Kirklees Council has no intention to revoke or amend the boundaries
2016
LAQM Annual Status Report 2016 3
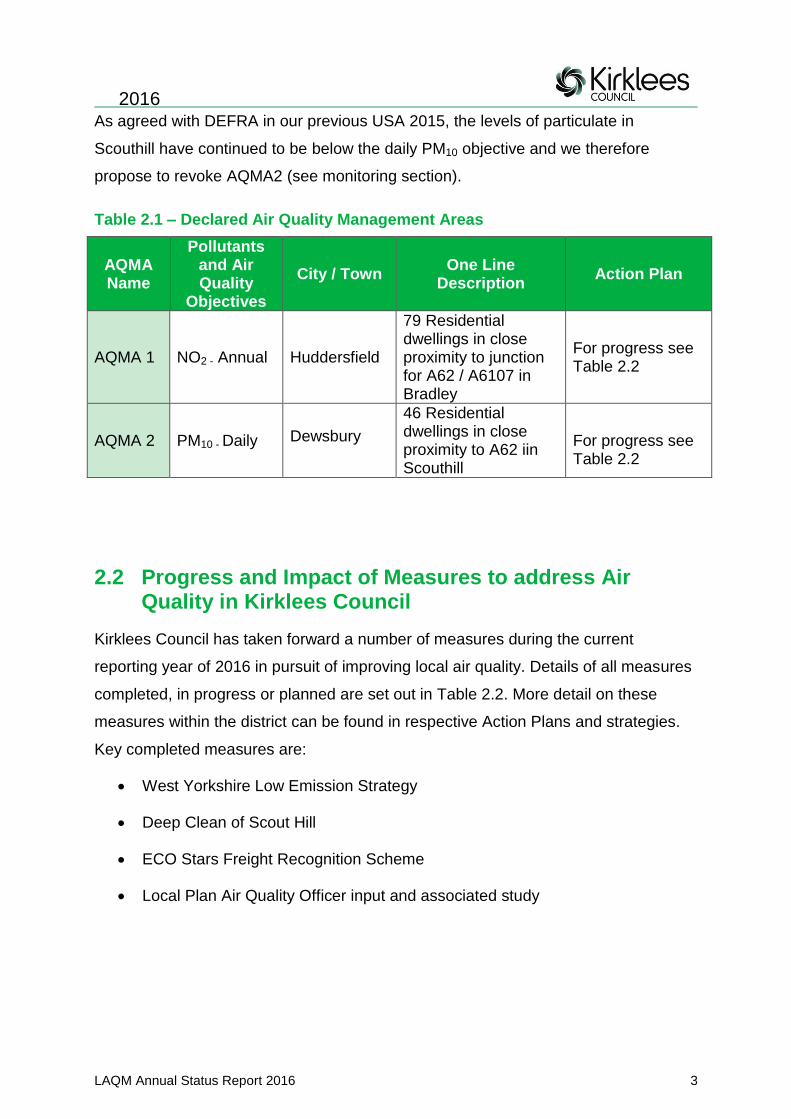
As agreed with DEFRA in our previous USA 2015, the levels of particulate in
Scouthill have continued to be below the daily PM10 objective and we therefore
propose to revoke AQMA2 (see monitoring section).
Table 2.1 – Declared Air Quality Management Areas
AQMA Name
Pollutants and Air Quality
Objectives
City / Town One Line
Description Action Plan
AQMA 1 NO2 - Annual Huddersfield
79 Residential dwellings in close proximity to junction for A62 / A6107 in Bradley
For progress see Table 2.2
AQMA 2 PM10 - Daily Dewsbury
46 Residential dwellings in close proximity to A62 iin Scouthill
For progress see Table 2.2
2.2 Progress and Impact of Measures to address Air Quality in Kirklees Council
Kirklees Council has taken forward a number of measures during the current
reporting year of 2016 in pursuit of improving local air quality. Details of all measures
completed, in progress or planned are set out in Table 2.2. More detail on these
measures within the district can be found in respective Action Plans and strategies.
Key completed measures are:
West Yorkshire Low Emission Strategy
Deep Clean of Scout Hill
ECO Stars Freight Recognition Scheme
Local Plan Air Quality Officer input and associated study
2016
LAQM Annual Status Report 2016 4
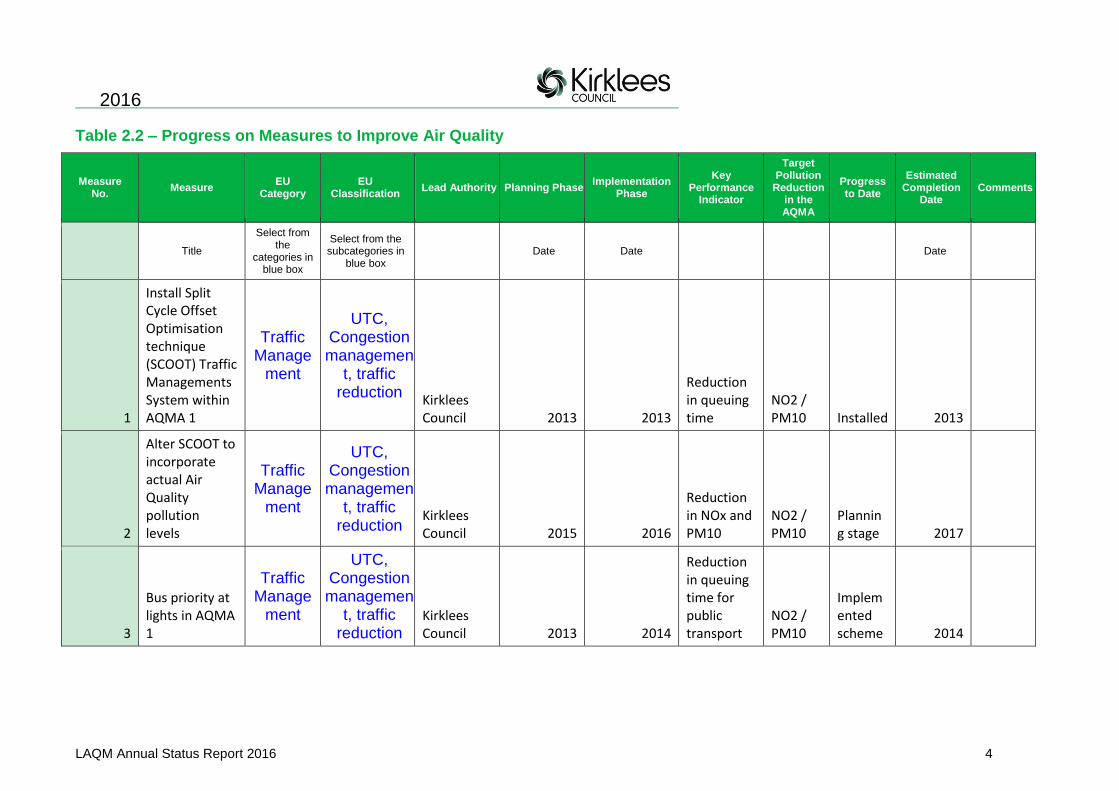
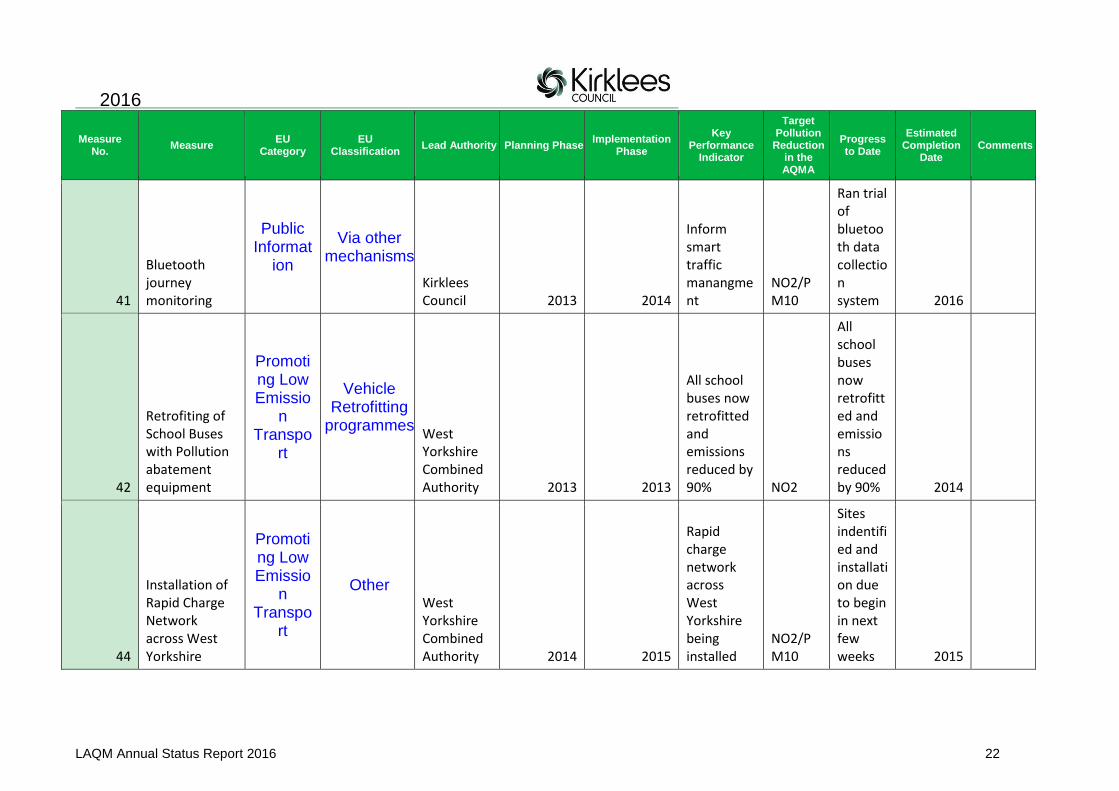
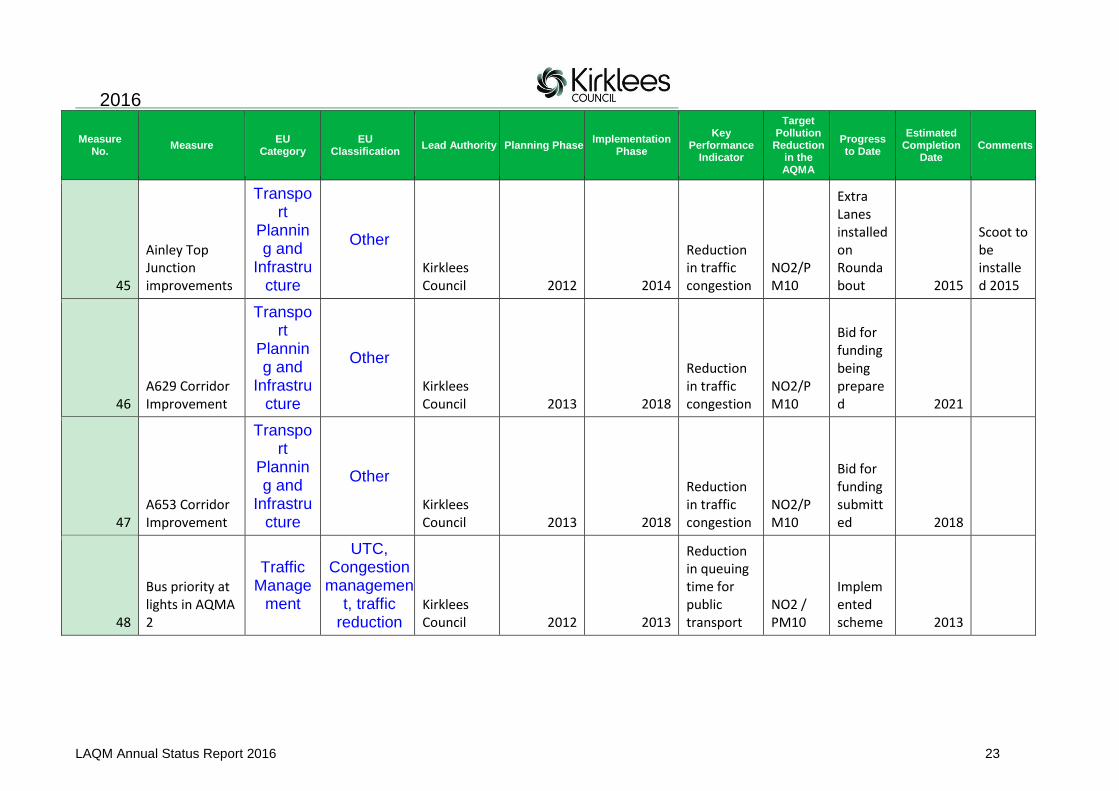
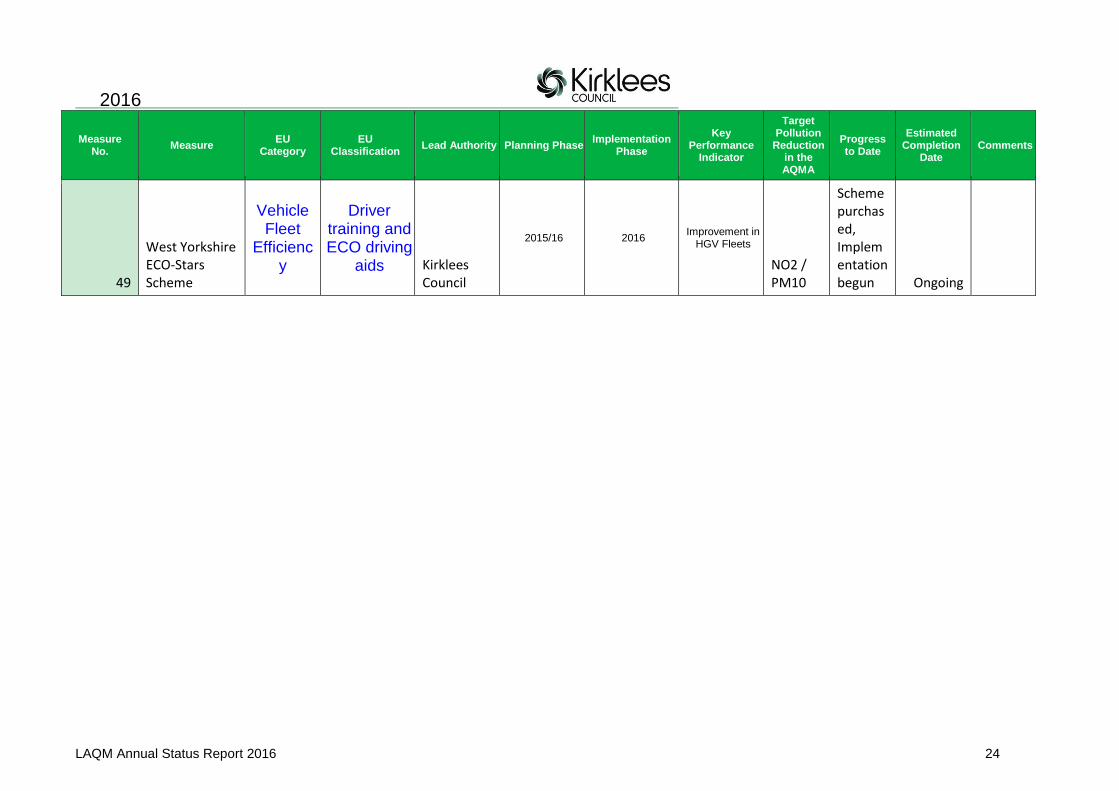
Table 2.2 – Progress on Measures to Improve Air Quality
Measure No.
Measure EU
Category EU
Classification Lead Authority Planning Phase
Implementation Phase
Key Performance
Indicator
Target Pollution
Reduction in the AQMA
Progress to Date
Estimated Completion
Date Comments
Title
Select from the
categories in blue box
Select from the subcategories in
blue box Date Date Date
1
Install Split Cycle Offset Optimisation technique (SCOOT) Traffic Managements System within AQMA 1
Traffic Manage
ment
UTC, Congestion managemen
t, traffic reduction Kirklees
Council 2013 2013
Reduction in queuing time
NO2 / PM10 Installed 2013
2
Alter SCOOT to incorporate actual Air Quality pollution levels
Traffic Manage
ment
UTC, Congestion managemen
t, traffic reduction
Kirklees Council 2015 2016
Reduction in NOx and PM10
NO2 / PM10
Planning stage 2017
3
Bus priority at lights in AQMA 1
Traffic Manage
ment
UTC, Congestion managemen
t, traffic reduction
Kirklees Council 2013 2014
Reduction in queuing time for public transport
NO2 / PM10
Implemented scheme 2014

2016
LAQM Annual Status Report 2016 5
Measure No.
Measure EU
Category EU
Classification Lead Authority Planning Phase
Implementation Phase
Key Performance
Indicator
Target Pollution
Reduction in the AQMA
Progress to Date
Estimated Completion
Date Comments
4
Bradley Junction. Re-model one of the busiest Road Junction in Kirklees in AQMA 1
Transport
Planning and
Infrastructure
Strategic highway
improvements, Re-
prioritising road space away from
cars, including Access
management, Selective
vehicle priority, bus priority, high
vehicle occupancy
lane
Kirklees Council 2014 2019
Reduce congestion levels at AM/PM peaks
NO2 / PM10
Pre-design stage 2021

2016
LAQM Annual Status Report 2016 6
Measure No.
Measure EU
Category EU
Classification Lead Authority Planning Phase
Implementation Phase
Key Performance
Indicator
Target Pollution
Reduction in the AQMA
Progress to Date
Estimated Completion
Date Comments
5
Ravensthorpe Bypass. Complete by pass of AQMA 2.
Transport
Planning and
Infrastructure
Strategic highway
improvements, Re-
prioritising road space away from
cars, including Access
management, Selective
vehicle priority, bus priority, high
vehicle occupancy
lane
Kirklees Council 2012 2021
Divert traffic away from AQMA 2
NO2 / PM10
Feesibility Study carried out 2026

2016
LAQM Annual Status Report 2016 7
Measure No.
Measure EU
Category EU
Classification Lead Authority Planning Phase
Implementation Phase
Key Performance
Indicator
Target Pollution
Reduction in the AQMA
Progress to Date
Estimated Completion
Date Comments
6
Cooper Bridge Gyratory proposed in AQMA 1
Transport
Planning and
Infrastructure
Strategic highway
improvements, Re-
prioritising road space away from
cars, including Access
management, Selective
vehicle priority, bus priority, high
vehicle occupancy
lane
Kirklees Council 2014 2019
Reduction in queuing time
NO2 / PM10
Juction designed. Funding sought 2021
2016
LAQM Annual Status Report 2016 8
Measure No.
Measure EU
Category EU
Classification Lead Authority Planning Phase
Implementation Phase
Key Performance
Indicator
Target Pollution
Reduction in the AQMA
Progress to Date
Estimated Completion
Date Comments
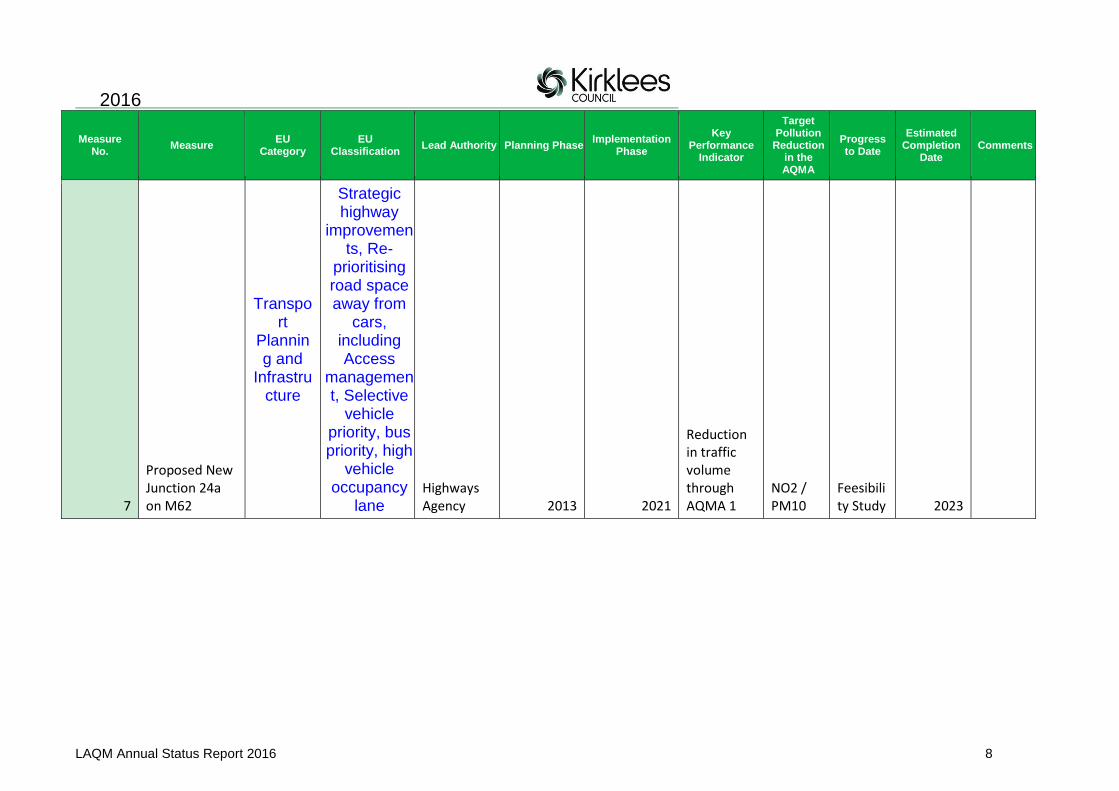
7
Proposed New Junction 24a on M62
Transport
Planning and
Infrastructure
Strategic highway
improvements, Re-
prioritising road space away from
cars, including Access
management, Selective
vehicle priority, bus priority, high
vehicle occupancy
lane
Highways Agency 2013 2021
Reduction in traffic volume through AQMA 1
NO2 / PM10
Feesibility Study 2023

2016
LAQM Annual Status Report 2016 9
Measure No.
Measure EU
Category EU
Classification Lead Authority Planning Phase
Implementation Phase
Key Performance
Indicator
Target Pollution
Reduction in the AQMA
Progress to Date
Estimated Completion
Date Comments
8
Bus Lanes approaching AQMA 1
Traffic Manage
ment
Strategic highway
improvements, Re-
prioritising road space away from
cars, including Access
management, Selective
vehicle priority, bus priority, high
vehicle occupancy
lane
Kirklees Council 2010 2011
Reduction in delays to buses
NO2 / PM10
Bus lane installed
9
Resource Smart Resource Corridor
Policy Guidance and Development Control
Air Quality Planning and Policy Guidance
Kirklees Council
Reduction of NO2 in AQMA
NO2 / PM10
2016
LAQM Annual Status Report 2016 10
Measure No.
Measure EU
Category EU
Classification Lead Authority Planning Phase
Implementation Phase
Key Performance
Indicator
Target Pollution
Reduction in the AQMA
Progress to Date
Estimated Completion
Date Comments
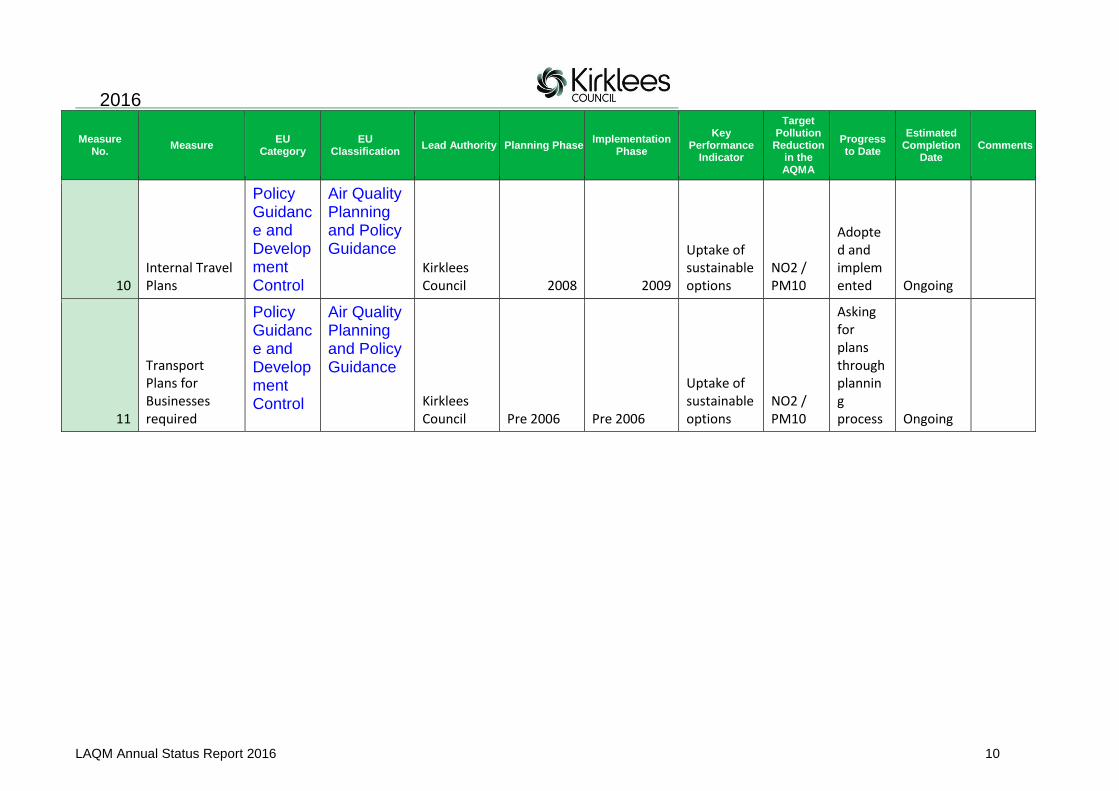
10 Internal Travel Plans
Policy Guidance and Development Control
Air Quality Planning and Policy Guidance
Kirklees Council 2008 2009
Uptake of sustainable options
NO2 / PM10
Adopted and implemented Ongoing
11
Transport Plans for Businesses required
Policy Guidance and Development Control
Air Quality Planning and Policy Guidance
Kirklees Council Pre 2006 Pre 2006
Uptake of sustainable options
NO2 / PM10
Asking for plans through planning process Ongoing

2016
LAQM Annual Status Report 2016 11
Measure No.
Measure EU
Category EU
Classification Lead Authority Planning Phase
Implementation Phase
Key Performance
Indicator
Target Pollution
Reduction in the AQMA
Progress to Date
Estimated Completion
Date Comments
12
School Travel Plan Framework
Policy Guidance and Development Control
Air Quality Planning and Policy Guidance
Kirklees Council 2005 2006
Uptake of sustainable options
NO2 / PM10
Schools were encouraged to produce travel plans and funding sought to fund infrastructure requirements Ongoing
13
Bikeability in schools. Council staff visited schools giving cycling safety training.
Public Informat
ion
Via other mechanisms
Kirklees Council 2009 2010
Increase in cycling
NO2 / PM10
Promoted cycling in schools via eductaion plrogrammes on road safety 2014
2016
LAQM Annual Status Report 2016 12
Measure No.
Measure EU
Category EU
Classification Lead Authority Planning Phase
Implementation Phase
Key Performance
Indicator
Target Pollution
Reduction in the AQMA
Progress to Date
Estimated Completion
Date Comments
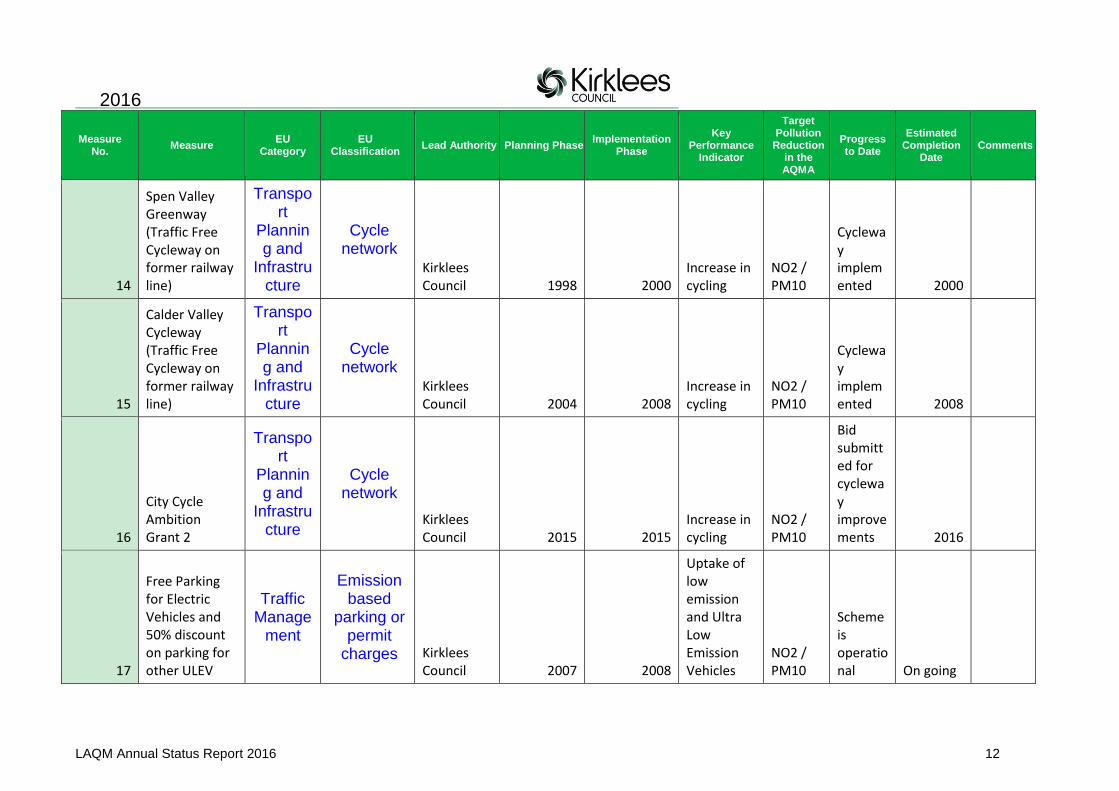
14
Spen Valley Greenway (Traffic Free Cycleway on former railway line)
Transport
Planning and
Infrastructure
Cycle network
Kirklees Council 1998 2000
Increase in cycling
NO2 / PM10
Cycleway implemented 2000
15
Calder Valley Cycleway (Traffic Free Cycleway on former railway line)
Transport
Planning and
Infrastructure
Cycle network
Kirklees Council 2004 2008
Increase in cycling
NO2 / PM10
Cycleway implemented 2008
16
City Cycle Ambition Grant 2
Transport
Planning and
Infrastructure
Cycle network
Kirklees Council 2015 2015
Increase in cycling
NO2 / PM10
Bid submitted for cycleway improvements 2016
17
Free Parking for Electric Vehicles and 50% discount on parking for other ULEV
Traffic Manage
ment
Emission based
parking or permit
charges Kirklees Council 2007 2008
Uptake of low emission and Ultra Low Emission Vehicles
NO2 / PM10
Scheme is operational On going

2016
LAQM Annual Status Report 2016 13
Measure No.
Measure EU
Category EU
Classification Lead Authority Planning Phase
Implementation Phase
Key Performance
Indicator
Target Pollution
Reduction in the AQMA
Progress to Date
Estimated Completion
Date Comments
18 City Car Club
Alternatives to private vehicle
use
Car Clubs
Kirklees Council 2008 2009
Use of club cars
NO2 / PM10
Introduced car club to Kirklees District Ongoing
19 Car Sharing Scheme
Alternatives to private vehicle
use
Car & lift sharing
schemes
Kirklees Council 2006 2007
Use of website
NO2 / PM10
Contribute to license fee for car sharing website and private subsite for council staff Ongoing
20
Local Free Bus around Huddersfield Town Centre and Dewsbury Town Centre
Alternatives to private vehicle
use
Other
Kirklees Council 2005 2006
Bus Patronage
NO2 / PM10
Bus runs in both Huddersfield and Dewsbury Ongoing
2016
LAQM Annual Status Report 2016 14
Measure No.
Measure EU
Category EU
Classification Lead Authority Planning Phase
Implementation Phase
Key Performance
Indicator
Target Pollution
Reduction in the AQMA
Progress to Date
Estimated Completion
Date Comments
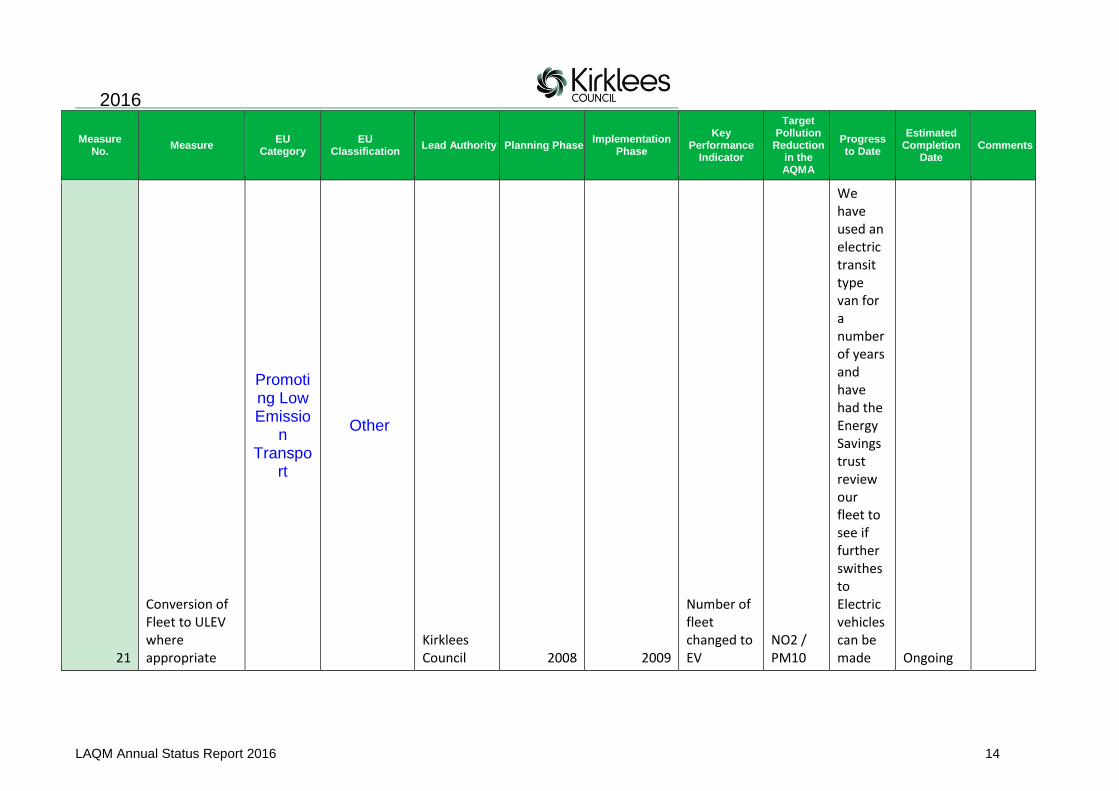
21
Conversion of Fleet to ULEV where appropriate
Promoting Low Emissio
n Transpo
rt
Other
Kirklees Council 2008 2009
Number of fleet changed to EV
NO2 / PM10
We have used an electric transit type van for a number of years and have had the Energy Savings trust review our fleet to see if further swithes to Electric vehicles can be made Ongoing

2016
LAQM Annual Status Report 2016 15
Measure No.
Measure EU
Category EU
Classification Lead Authority Planning Phase
Implementation Phase
Key Performance
Indicator
Target Pollution
Reduction in the AQMA
Progress to Date
Estimated Completion
Date Comments
22
Air Quality report to Newspaper
Public Informat
ion
Via other mechanisms
Kirklees Council Pre 2006 Pre 2006
Awareness of Air Quality amongst the public
NO2 / PM10
Daily Reports sent to newspaper Ongoing
23
Bike to work scheme within Council, discount cycle purchase scheme
Alternatives to private vehicle
use
Other
Kirklees Council 2008 2009
Uptake of bikes
NO2 / PM10
Implemented scheme and promoted to workforce Ongoing
24
Local sustainable transport fund project to promote modal shift in schools. Dedicated officer visiting schools promoting model shift
Public Informat
ion
Via other mechanisms
Kirklees Council 2011 2012
Monitor transport options at local schools
NO2 / PM10
Funded officer to go into schools and promote modal shift Ongoing
2016
LAQM Annual Status Report 2016 16
Measure No.
Measure EU
Category EU
Classification Lead Authority Planning Phase
Implementation Phase
Key Performance
Indicator
Target Pollution
Reduction in the AQMA
Progress to Date
Estimated Completion
Date Comments
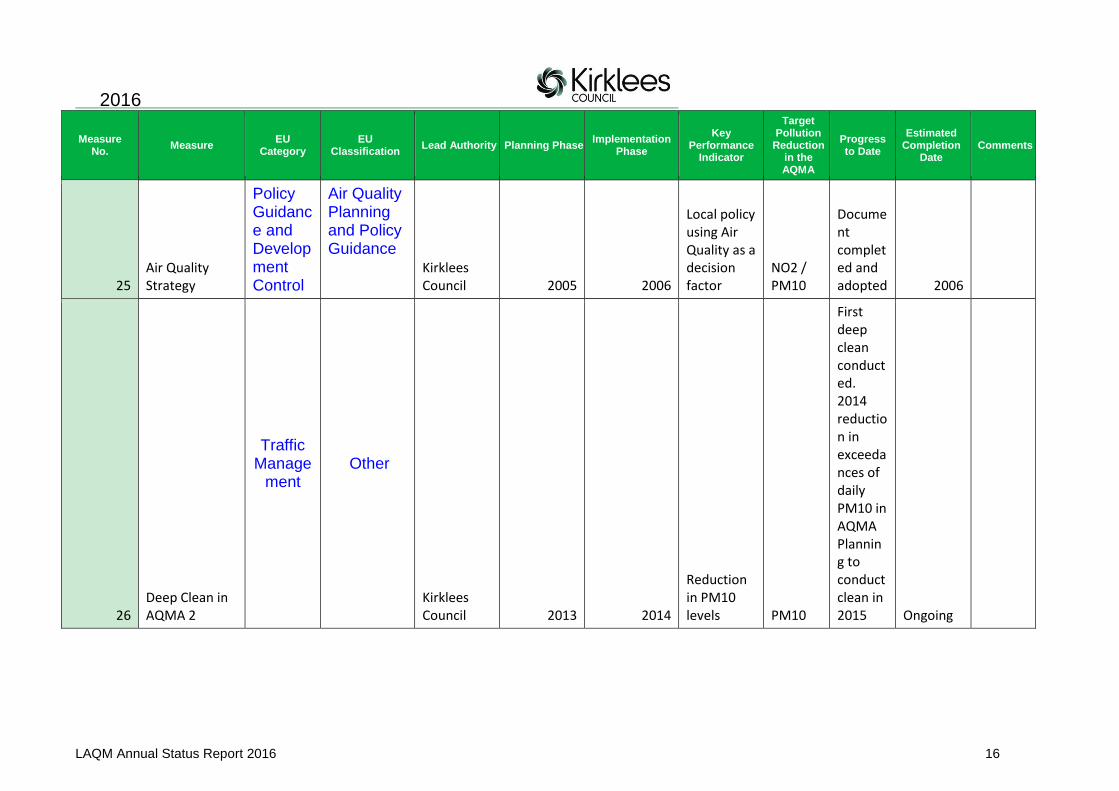
25 Air Quality Strategy
Policy Guidance and Development Control
Air Quality Planning and Policy Guidance
Kirklees Council 2005 2006
Local policy using Air Quality as a decision factor
NO2 / PM10
Document completed and adopted 2006
26 Deep Clean in AQMA 2
Traffic Manage
ment Other
Kirklees Council 2013 2014
Reduction in PM10 levels PM10
First deep clean conducted. 2014 reduction in exceedances of daily PM10 in AQMA Planning to conduct clean in 2015 Ongoing

2016
LAQM Annual Status Report 2016 17
Measure No.
Measure EU
Category EU
Classification Lead Authority Planning Phase
Implementation Phase
Key Performance
Indicator
Target Pollution
Reduction in the AQMA
Progress to Date
Estimated Completion
Date Comments
27
Mote sensing real-time emissions
Public Informat
ion
Via other mechanisms
Kirklees Council 2010 2012
Results from research
NO2 / PM10
Analysed emissions of local traffic
28
Electric Vehicle Charge point Installed in Council Depot
Promoting Low Emissio
n Transpo
rt
Other
Kirklees Council 2013 2014
Number of fleet changed to EV
NO2 / PM10
Charge point installed in council depot 2014
29
Trial of EV vehicles as pool car
Promoting Low Emissio
n Transpo
rt
Other
Kirklees Council 2014 2014
Uptake of LEVs
NO2 / PM10
Car was used by various staff to conduct daily works 2014

2016
LAQM Annual Status Report 2016 18
Measure No.
Measure EU
Category EU
Classification Lead Authority Planning Phase
Implementation Phase
Key Performance
Indicator
Target Pollution
Reduction in the AQMA
Progress to Date
Estimated Completion
Date Comments
30 Smokey Vehicle hotline
Public Informat
ion
Via other mechanisms
Kirklees Council Pre 2000 Pre 2000
Number of calls received
NO2 / PM10
Customers can call and report vehicles with smokey exhausts Ongoing
31
Planning conditions on all applications for sustainable transport
Policy Guidance and Development Control
Air Quality Planning and Policy Guidance
Kirklees Council 2014 2014
Number of conditions on approval
NO2 / PM10
Currently request EV charge points on all new developments Ongoing
32
Green Procurement Toolkit
Policy Guidanc
e and Develop
ment Control
Sustainable Procurement Guidance
Kirklees Council 2005 2006
use of toolkit in procurment
NO2 / PM10
Green procurement toolkit created for Low carbon 2015
2016
LAQM Annual Status Report 2016 19
Measure No.
Measure EU
Category EU
Classification Lead Authority Planning Phase
Implementation Phase
Key Performance
Indicator
Target Pollution
Reduction in the AQMA
Progress to Date
Estimated Completion
Date Comments
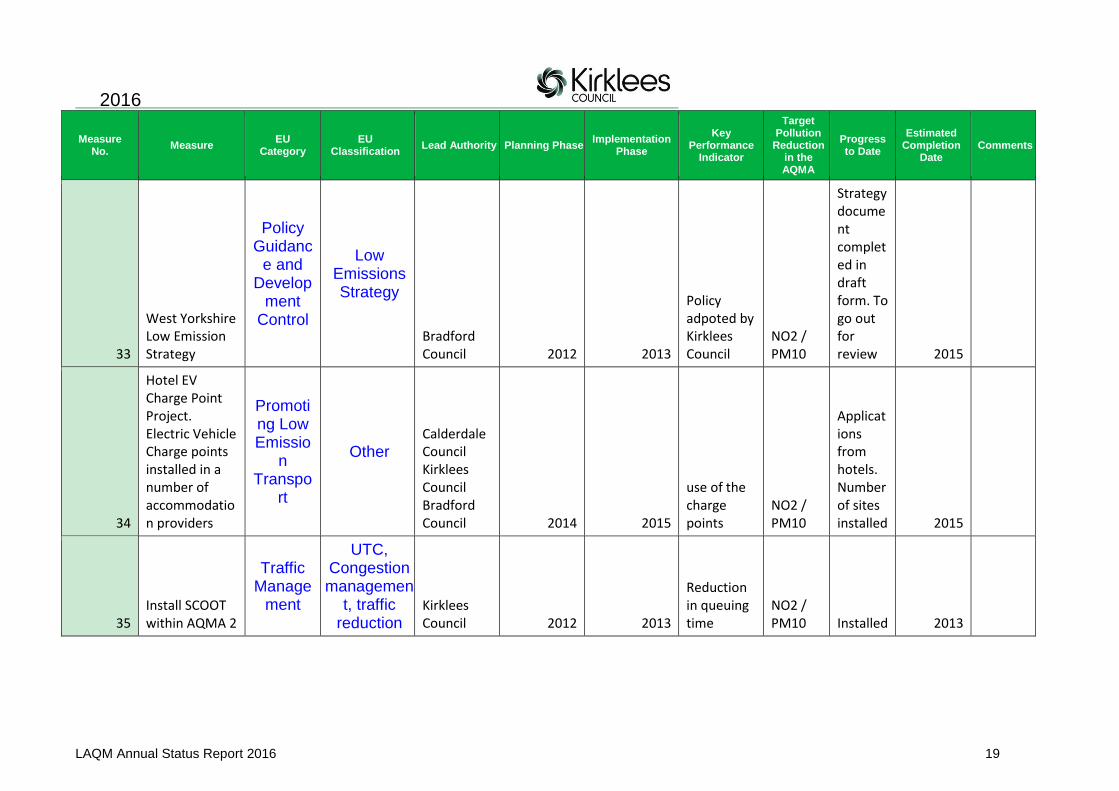
33
West Yorkshire Low Emission Strategy
Policy Guidanc
e and Develop
ment Control
Low Emissions Strategy
Bradford Council 2012 2013
Policy adpoted by Kirklees Council
NO2 / PM10
Strategy document completed in draft form. To go out for review 2015
34
Hotel EV Charge Point Project. Electric Vehicle Charge points installed in a number of accommodation providers
Promoting Low Emissio
n Transpo
rt
Other
Calderdale Council Kirklees Council Bradford Council 2014 2015
use of the charge points
NO2 / PM10
Applications from hotels. Number of sites installed 2015
35 Install SCOOT within AQMA 2
Traffic Manage
ment
UTC, Congestion managemen
t, traffic reduction
Kirklees Council 2012 2013
Reduction in queuing time
NO2 / PM10 Installed 2013

2016
LAQM Annual Status Report 2016 20
Measure No.
Measure EU
Category EU
Classification Lead Authority Planning Phase
Implementation Phase
Key Performance
Indicator
Target Pollution
Reduction in the AQMA
Progress to Date
Estimated Completion
Date Comments
36
New links to Greenway (Cycle Path) added through planning
Transport
Planning and
Infrastructure
Cycle network
Kirklees Council 2000 2000
Increase cycle routes
NO2/PM10
Recommended conditions to planning Ongoing
36
Subsidised Metro Cards for Staff
Promoting
Travel Alternati
ves
Other
Kirklees Council Pre 2006 Pre 2006
Promote use of public transport
NO2/PM10
Scheme is operational Ongoing
37
Metro Cards Introduced for work journeys
Promoting
Travel Alternati
ves
Other
Kirklees Council 2008 2009
Reduce use of cars for shorter jouneys
NO2/PM10
Metro Cards in use for public transport for council staff to undertake their daily work Ongoing
2016
LAQM Annual Status Report 2016 21
Measure No.
Measure EU
Category EU
Classification Lead Authority Planning Phase
Implementation Phase
Key Performance
Indicator
Target Pollution
Reduction in the AQMA
Progress to Date
Estimated Completion
Date Comments
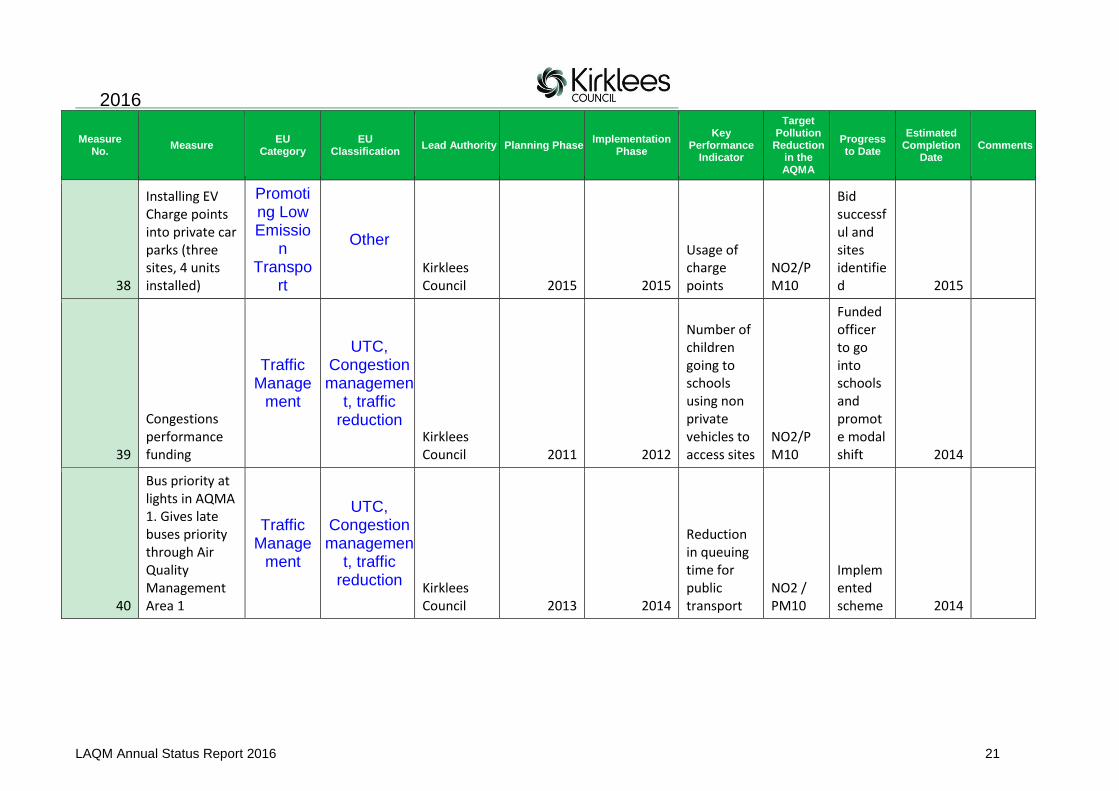
38
Installing EV Charge points into private car parks (three sites, 4 units installed)
Promoting Low Emissio
n Transpo
rt
Other
Kirklees Council 2015 2015
Usage of charge points
NO2/PM10
Bid successful and sites identified 2015
39
Congestions performance funding
Traffic Manage
ment
UTC, Congestion managemen
t, traffic reduction
Kirklees Council 2011 2012
Number of children going to schools using non private vehicles to access sites
NO2/PM10
Funded officer to go into schools and promote modal shift 2014
40
Bus priority at lights in AQMA 1. Gives late buses priority through Air Quality Management Area 1
Traffic Manage
ment
UTC, Congestion managemen
t, traffic reduction Kirklees
Council 2013 2014
Reduction in queuing time for public transport
NO2 / PM10
Implemented scheme 2014
2016
LAQM Annual Status Report 2016 22
Measure No.
Measure EU
Category EU
Classification Lead Authority Planning Phase
Implementation Phase
Key Performance
Indicator
Target Pollution
Reduction in the AQMA
Progress to Date
Estimated Completion
Date Comments
41
Bluetooth journey monitoring
Public Informat
ion
Via other mechanisms
Kirklees Council 2013 2014
Inform smart traffic manangment
NO2/PM10
Ran trial of bluetooth data collection system 2016
42
Retrofiting of School Buses with Pollution abatement equipment
Promoting Low Emissio
n Transpo
rt
Vehicle Retrofitting
programmes West Yorkshire Combined Authority 2013 2013
All school buses now retrofitted and emissions reduced by 90% NO2
All school buses now retrofitted and emissions reduced by 90% 2014
44
Installation of Rapid Charge Network across West Yorkshire
Promoting Low Emissio
n Transpo
rt
Other
West Yorkshire Combined Authority 2014 2015
Rapid charge network across West Yorkshire being installed
NO2/PM10
Sites indentified and installation due to begin in next few weeks 2015
2016
LAQM Annual Status Report 2016 23
Measure No.
Measure EU
Category EU
Classification Lead Authority Planning Phase
Implementation Phase
Key Performance
Indicator
Target Pollution
Reduction in the AQMA
Progress to Date
Estimated Completion
Date Comments
45
Ainley Top Junction improvements
Transport
Planning and
Infrastructure
Other
Kirklees Council 2012 2014
Reduction in traffic congestion
NO2/PM10
Extra Lanes installed on Roundabout 2015
Scoot to be installed 2015
46 A629 Corridor Improvement
Transport
Planning and
Infrastructure
Other
Kirklees Council 2013 2018
Reduction in traffic congestion
NO2/PM10
Bid for funding being prepared 2021
47 A653 Corridor Improvement
Transport
Planning and
Infrastructure
Other
Kirklees Council 2013 2018
Reduction in traffic congestion
NO2/PM10
Bid for funding submitted 2018
48
Bus priority at lights in AQMA 2
Traffic Manage
ment
UTC, Congestion managemen
t, traffic reduction
Kirklees Council 2012 2013
Reduction in queuing time for public transport
NO2 / PM10
Implemented scheme 2013
2016
LAQM Annual Status Report 2016 24
Measure No.
Measure EU
Category EU
Classification Lead Authority Planning Phase
Implementation Phase
Key Performance
Indicator
Target Pollution
Reduction in the AQMA
Progress to Date
Estimated Completion
Date Comments
49
West Yorkshire ECO-Stars Scheme
Vehicle Fleet
Efficiency
Driver training and ECO driving
aids Kirklees Council
2015/16 2016 Improvement in
HGV Fleets
NO2 / PM10
Scheme purchased, Implementation begun Ongoing
2016
LAQM Annual Status Report 2016 25
2.3 PM2.5 – Local Authority Approach to Reducing Emissions and or Concentrations
As detailed in Policy Guidance LAQM.PG16 (Chapter 7), local authorities are
expected to work towards reducing emissions and/or concentrations of PM2.5
(particulate matter with an aerodynamic diameter of 2.5µm or less). There is clear
evidence that PM2.5 has a significant impact on human health, including premature
mortality, allergic reactions, and cardiovascular diseases.
Kirklees Council is taking the following measures to address PM2.5:
Collaborative working between Public Health, Environmental Health, Planning
and Highways to conduct a 2015 baseline Air Quality Model for the whole
Kirklees District for PM2.5 as part of local plan works.
Installation of PM2.5 monitors at 2 location within the district
Analyse pre-existing PM10 data and DEFRA PM2.5 maps to inform Kirklees
Council of potential issues within the district
2016
LAQM Annual Status Report 2016 26
3 Air Quality Monitoring Data and Comparison with Air Quality Objectives and National Compliance
3.1 Summary of Monitoring Undertaken
3.1.1 Automatic Monitoring Sites
This section sets out what monitoring has taken place and how it compares with
objectives.
Kirklees Council undertook automatic (continuous) monitoring at 7 sites during 2016.
Table A.7 in Appendix A shows the details of the sites.
Maps showing the location of the monitoring sites are provided in Appendix D.
Further details on how the monitors are calibrated and how the data has been
adjusted are included in Appendix C.
In 2016 Kirklees Council have taken opportunity to review their automatic monitoring
network. At the beginning of 2015 NO2 & PM10 was monitored by a network of 7
continuous automatic. Kirklees Council also monitored O3 and SO2 at 1 location. NO2
& PM10 monitors are based at 6 roadside and 1 urban background locations, while
the O3 & SO2 are only at the Urban Background location.
In 2014 and 2015 only 2 automatic monitoring locations were found to exceed at the
façade of properties for NO2. Our PM10 AQMA has not exceeded since 2013 and
particulate is not an issue at other locations. O3 and SO2 is not an issue within
Kirklees. Kirklees Council has a limited monitoring budget, which means that we
need to rationalise our monitoring network in order to ensure relevant cost affective
data collection. With this in mind we have reviewed the automatic network and
propose to remove 5 monitoring locations where AQO’s are compliant.
Kirklees Council will also be adding 2 PM2.5 monitors to the network at our 2
remaining roadside locations and will install diffusion tubes at locations where
automatic monitors have been removed in order to ensure levels remain below the
objective in these areas.

2016
LAQM Annual Status Report 2016 27
3.1.2 Non-Automatic Monitoring Sites
Kirklees Council undertook non- automatic (passive) monitoring of NO2 at 55 sites
during 2016.
Table A.8 in Appendix A shows the details of the sites.
Maps showing the location of the monitoring sites are provided in Appendix D.
Further details on Quality Assurance/Quality Control (QA/QC) and bias adjustment
for the diffusion tubes are included in Appendix C.
Kirklees Council currently have a diffusion tube monitoring network of 55 diffusion
tubes across the whole district, which will be increased by 5 tubes when the
automatic stations are decommissioned. These are constructed and analysed in the
Kirklees Council laboratory, being of the composition 50%TEA solution to 50%
Acetone.
Majority of diffusion tubes across the district are attached to street furniture such as
lamp posts and sited at either in a kerbside or roadside location.
3.2 Individual Pollutants
The air quality monitoring results presented in this section are, where relevant,
adjusted for “annualisation” and bias. Further details on adjustments are provided in
Appendix C.
3.2.1 Nitrogen Dioxide (NO2)
Table A.9 in Appendix A compares the ratified and adjusted monitored NO2 annual
mean concentrations for the past 5 years with the air quality objective of 40µg/m3.
For diffusion tubes, the full 2016 dataset of monthly mean values and façade
calculations are provided in Appendix B.
Table A.10 in Appendix A compares the ratified continuous monitored NO2 hourly
mean concentrations for the past 5 years with the air quality objective of 200µg/m3,
not to be exceeded more than 18 times per year.

2016
LAQM Annual Status Report 2016 28
In 2016 no Kirklees Council automatic monitoring sites have reported levels
exceeding the NO2 hourly objective more than 18 times and only 1 diffusion in
Eastborough exceeds 60µg/m3 indicator.
In 2016 2 Kirklees Council automatic monitoring sites exceeded the annual AQO for
NO2 at Birchencliffe and Birkenshaw. Within the same period 7 diffusion tube
locations exceeded the annual AQO for NO2 at the façades of properties within the
localities of Eastborough, Edgerton, Heckmondwike, Huddersfield Town Centre,
Outlane and Thornton Lodge
Figure 3.1 Automatic monitoring - Annual NO2 concentration trends

2016
LAQM Annual Status Report 2016 29
Figure 3.2 Diffusion tube monitoring - Annual NO2 concentration trends
Figures 3.1 and 3.2 shows that trends for Annual NO2 levels within the district have
continued to show falls year on year since 2010 for average diffusion tube levels,
average automatic monitor locations outside AQMAs and the urban background
location.
Levels within the AQMA have conflicting trends between automatic and diffusion tube
monitoring. Trends from the diffusion tube data mirrors that of other monitors within
the district, that of a continous fall since 2010. The automatic monitor level has
always been lower than that observed using diffusion tubes. Over the last 2 years the
levels have crept up. In 2015 the levels are closer to that of the diffusion tubes, but
still not above the AQO. Variabilty between the levels could be accounted for due to
the affect of street canyoning and gaps within the canyon. Therefore, because levels
continue to fall and the automatic monitoring being below objectives, we have
decided to carry out modelling to redefine the boundaries of the AQMA.

2016
LAQM Annual Status Report 2016 30
Kirklees Council have conducted detailed assessments at 7 of the 8 locations and
have run models to determine the extent of the exceedance. These areas are;
Birchencliffe
Birkenshaw
Eastborough
Edgerton
Heckmondwike
Huddersfield Town Centre
Outlane
Details regarding the models and output maps are included in Appendix F.
In order to determine the issues within Thornton Lodge, Kirklees council proposes to
install further passive monitoring sites to determine the full extent of the exceedance,
3.2.2 Particulate Matter (PM10)
Kirklees Council have 3 types of monitoring equipment installed in our monitoring
station Trailer 2 monitors using a tapered element oscillating microbalance (TEOM)
and data collected at this station has been corrected using the Volatile Correction
Model (VCM).
Discussion regarding PM10 correction factors can be found in Appendix C
Table A.11 in Appendix A compares the ratified and adjusted monitored PM10 annual
mean concentrations for the past 5 years with the air quality objective of 40µg/m3.
Table A.12 in Appendix A compares the ratified continuous monitored PM10 daily
mean concentrations for the past 5 years with the air quality objective of 50µg/m3, not
to be exceeded more than 35 times per year.
In 2016 no Kirklees Council automatic monitoring sites have reported levels
exceeding the Annual or Daily PM10 objective more than 35 times.

2016
LAQM Annual Status Report 2016 31
Figure 3.3 Automatic monitoring - Annual PM10 concentration trends
Figure 3.4 Automatic monitoring - Daily PM10 exceedance trends
Figures 3.3 and 3.4 shows that trends for Annual PM10 levels within the district have
continued to show falls year on year outside and within the AQMA since 2011 for
both annual and daily levels.

2016
LAQM Annual Status Report 2016 32
3.2.3 Sulphur Dioxide (SO2)
Table A. in Appendix A compares the ratified continuous monitored SO2
concentrations for year 2015 with the air quality objectives for SO2.
The SO2 monitor is at a background location within the district. Kirklees Council has
previously monitored at industrial locations, but have not recoded an exceedance
during any monitoring period. Kirklees Council has therefore decided to remove SO2
monitoring from our network.

2016
LAQM Annual Status Report 2016 33
Appendix A: Monitoring Results
Table A.7 – Details of Automatic Monitoring Sites
Site Name
Site Type X OS Grid Ref
Y OS Grid Ref
Pollutants Monitored
In AQMA?
Monitoring Technique
Distance to Relevant Exposure
(m) (1)
Distance to kerb of nearest road (m)
(2)
Inlet Height
(m)
Trailer 2 Industrial 423185 420612 NO2, O3,
PM10, SO2 Adjacent
Chemiluminescence method.
Ultraviolet Absorptiometry.
TEOM. Ultraviolet
luminescence
N (42m) 6m 3.0
Roadside
1 Roadside 423247 420761 NO2, PM10, Y
Chemiluminescence method.
FH 62 I-R Y (3m) 3m 1.5
Roadside 2 Roadside 418240 426553 NO2, PM10, N Chemiluminescence
method. FH 62 I-R
Y (50m) 2m 1.5
Roadside 3 Roadside 417255 420358 NO2, PM10, Y
Chemiluminescence method.
FH 62 I-R Y (3m) 3m 1.5
Roadside 4 Roadside 420441 427353 NO2, PM10, N Chemiluminescence
method. FH 62 I-R
N (29m) 3m 1.5
Roadside 5 Roadside 422430 420399 NO2, PM10, N
Chemiluminescence method.
FH 62 I-R Y (3m) 3m 1.5
2016
LAQM Annual Status Report 2016 34
Site Name
Site Type X OS Grid Ref
Y OS Grid Ref
Pollutants Monitored
In AQMA?
Monitoring Technique
Distance to Relevant Exposure
(m) (1)
Distance to kerb of nearest road (m)
(2)
Inlet Height
(m)
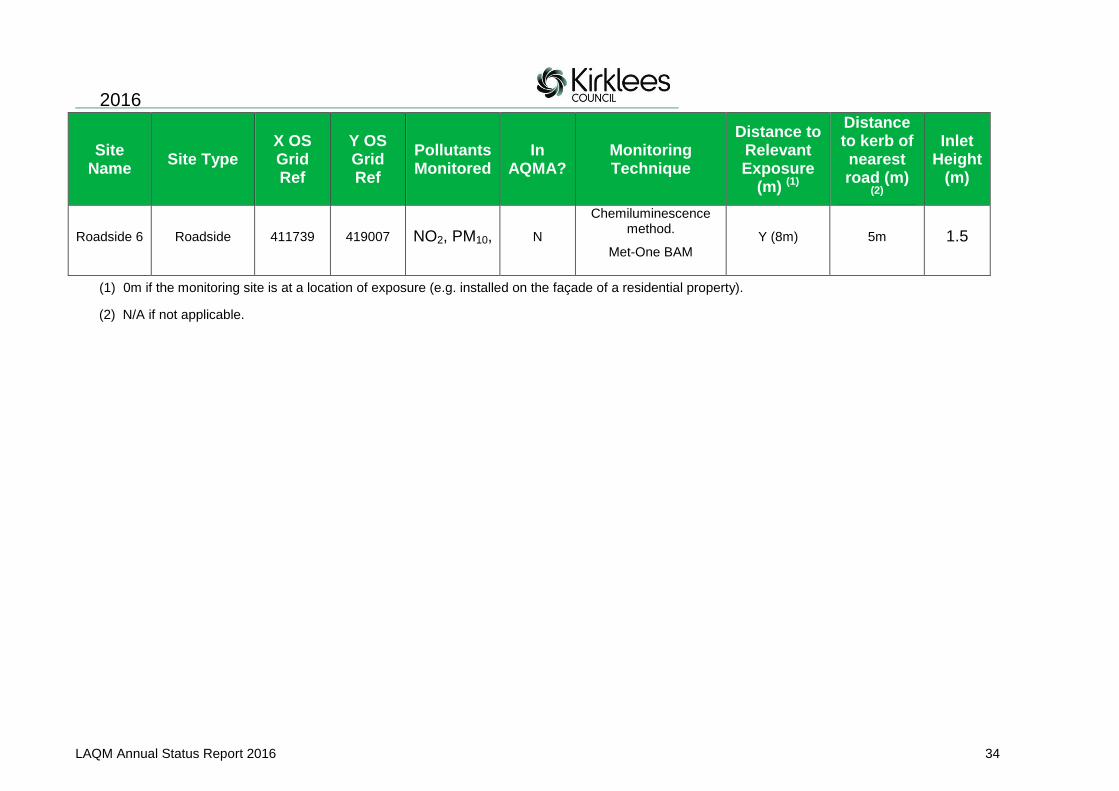
Roadside 6 Roadside 411739 419007 NO2, PM10, N
Chemiluminescence method.
Met-One BAM Y (8m) 5m 1.5
(1) 0m if the monitoring site is at a location of exposure (e.g. installed on the façade of a residential property).
(2) N/A if not applicable.

2016
LAQM Annual Status Report 2016 35
Table A.8 – Details of Non-Automatic Monitoring Sites
Site Name
Site Type X OS Grid Ref
Y OS Grid Ref
Pollutants Monitored
In AQMA
?
Distance to Relevant Exposure
(m) (1)
Distance to kerb of nearest
road (m) (2)
Tube collocated
with a Continuous Analyser?
Height (m)
1
Other 424506 421535 NO2 N N 0.8 N 2.0
2 Other 414214 416504 NO2 N N 4.1 N 2.0
3 Roadside 413504 417439 NO2 N Y (2.0) 2.4 N 2.0
4 Roadside 424464 424395 NO2 N Y (4.3) 1.8 N 2.0
5 Roadside
422443 420380 NO2 N Y (1.6) 1.9 N 2.0
6 Roadside 417872 421050 NO2 Y Y (5.2) 6.0 N 2.0
7
Urban Centre
414434 416744 NO2 N Y (0.5) 0.5 N 2.0
8 Roadside 414496 417795 NO2 N Y (2.5) 2.5 N 2.0
9 Kerbside 417280 420482 NO2 Y Y (13.4) 0.7 N 2.0
10 Roadside 417227 420337 NO2 Y Y (3.2) 2.0 N 2.0
2016
LAQM Annual Status Report 2016 36
Site Name
Site Type X OS Grid Ref
Y OS Grid Ref
Pollutants Monitored
In AQMA
?
Distance to Relevant Exposure
(m) (1)
Distance to kerb of nearest
road (m) (2)
Tube collocated
with a Continuous Analyser?
Height (m)
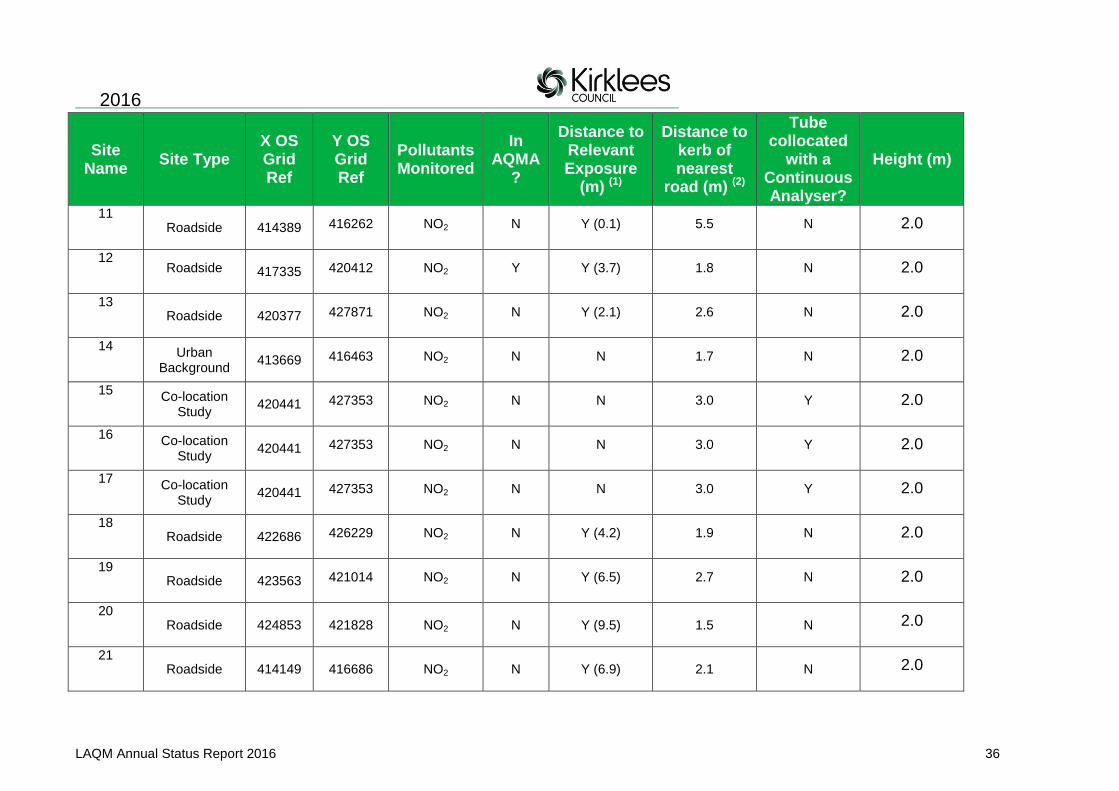
11 Roadside 414389 416262 NO2 N Y (0.1) 5.5 N 2.0
12 Roadside 417335 420412 NO2 Y Y (3.7) 1.8 N 2.0
13 Roadside 420377 427871 NO2 N Y (2.1) 2.6 N 2.0
14 Urban
Background 413669 416463 NO2 N N 1.7 N 2.0
15 Co-location
Study 420441 427353 NO2 N N 3.0 Y 2.0
16 Co-location
Study 420441 427353 NO2 N N 3.0 Y 2.0
17 Co-location
Study 420441 427353 NO2 N N 3.0 Y 2.0
18 Roadside 422686 426229 NO2 N Y (4.2) 1.9 N 2.0
19 Roadside 423563 421014 NO2 N Y (6.5) 2.7 N 2.0
20 Roadside 424853 421828 NO2 N Y (9.5) 1.5 N 2.0
21 Roadside 414149 416686 NO2 N Y (6.9) 2.1 N 2.0
2016
LAQM Annual Status Report 2016 37
Site Name
Site Type X OS Grid Ref
Y OS Grid Ref
Pollutants Monitored
In AQMA
?
Distance to Relevant Exposure
(m) (1)
Distance to kerb of nearest
road (m) (2)
Tube collocated
with a Continuous Analyser?
Height (m)
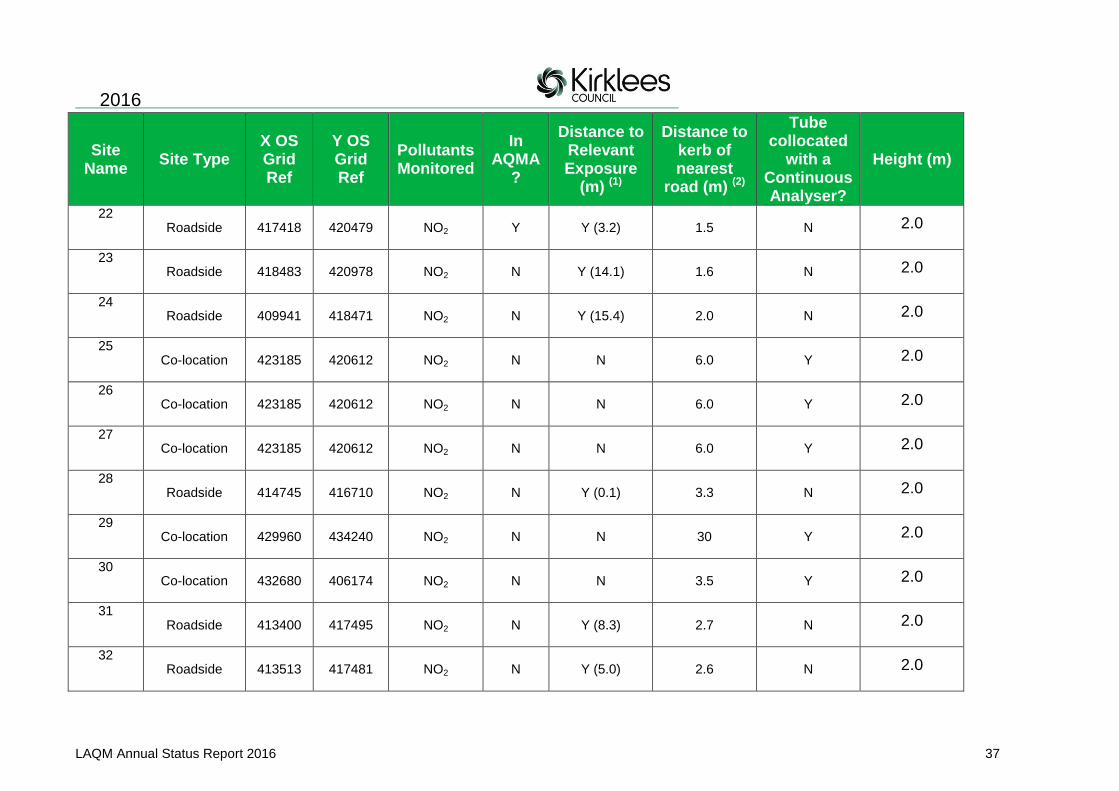
22 Roadside 417418 420479 NO2 Y Y (3.2) 1.5 N 2.0
23 Roadside 418483 420978 NO2 N Y (14.1) 1.6 N 2.0
24 Roadside 409941 418471 NO2 N Y (15.4) 2.0 N 2.0
25 Co-location 423185 420612 NO2 N N 6.0 Y 2.0
26 Co-location 423185 420612 NO2 N N 6.0 Y 2.0
27 Co-location 423185 420612 NO2 N N 6.0 Y 2.0
28 Roadside 414745 416710 NO2 N Y (0.1) 3.3 N 2.0
29 Co-location 429960 434240 NO2 N N 30 Y 2.0
30 Co-location 432680 406174 NO2 N N 3.5 Y 2.0
31 Roadside 413400 417495 NO2 N Y (8.3) 2.7 N 2.0
32 Roadside 413513 417481 NO2 N Y (5.0) 2.6 N 2.0

2016
LAQM Annual Status Report 2016 38
Site Name
Site Type X OS Grid Ref
Y OS Grid Ref
Pollutants Monitored
In AQMA
?
Distance to Relevant Exposure
(m) (1)
Distance to kerb of nearest
road (m) (2)
Tube collocated
with a Continuous Analyser?
Height (m)
33 Roadside 420727 423668 NO2 N Y (4.3) 2.4 N 2.0
34 Roadside 420845 423770 NO2 N Y (0.3) 1.9 N 2.0
35 Roadside 420853 423866 NO2 N Y (9.4) 1.9 N 2.0
36 Kerbside 420304 419766 NO2 N Y (2.9) 0.9 N 2.0
37 Roadside 420356 427810 NO2 N Y (2.5) 2.2 N 2.0
38 Roadside 420222 427764 NO2 N Y (18.3) 1.0 N 2.0
39 Roadside 424526 424326 NO2 N Y (1.7) 2.1 N 2.0
40 Roadside 424871 421921 NO2 N Y (1.2) 1.6 N 2.0
41 Roadside 418285 426630 NO2 N Y (12.5) 3.4 N 2.0
42 Roadside 424969 422002 NO2 N Y (5.6) 1.9 N 2.0
43 Roadside 425083 422022 NO2 N Y (6.0) 1.9 N 2.0

2016
LAQM Annual Status Report 2016 39
Site Name
Site Type X OS Grid Ref
Y OS Grid Ref
Pollutants Monitored
In AQMA
?
Distance to Relevant Exposure
(m) (1)
Distance to kerb of nearest
road (m) (2)
Tube collocated
with a Continuous Analyser?
Height (m)
44 Roadside 425179 422114 NO2 N Y (-7.2) 1.7 N 2.0
45 Roadside 414480 417720 NO2 N Y (0.5) 7.2 N 2.0
46 Roadside 414546 417759 NO2 N Y (0) 2.2 N 2.0
47 Other 407942 417261 NO2 N Y (0) 14.4 N 2.0
48 Roadside 421039 423673 NO2 N Y (0) 2.6 N 2.0
49 Roadside 413659 416182 NO2 N Y (3.5) 3.7 N 2.0
50 Roadside 413414 415981 NO2 N Y (1.6) 2.5 N 2.0
51 Roadside 421904 423580 NO2 N Y (4.9) 1.0 N 2.0
52 Roadside 417627 416472 NO2 N Y (7.8) 2.4 N 2.0
53 Roadside 411564 415902 NO2 N Y ( 1.6) 1.7 N 2.0
54 Roadside 425196 421566 NO2 N Y (2.7) 3.2 N 2.0
2016
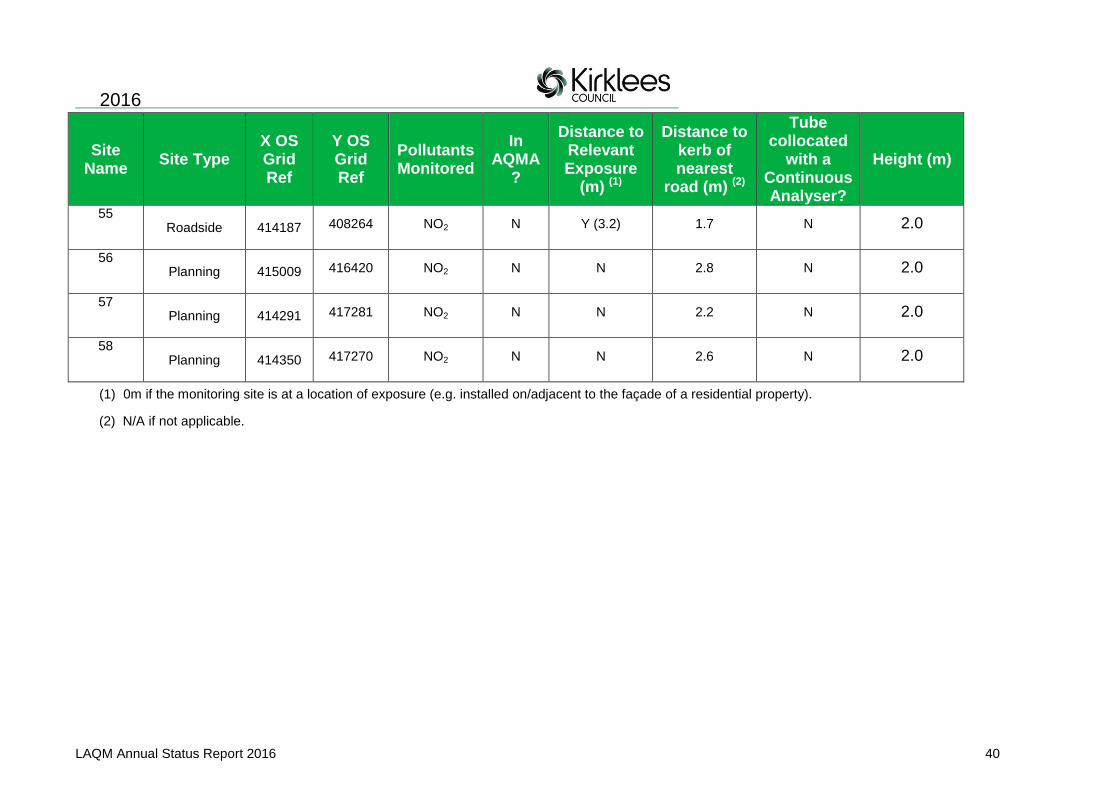
LAQM Annual Status Report 2016 40
Site Name
Site Type X OS Grid Ref
Y OS Grid Ref
Pollutants Monitored
In AQMA
?
Distance to Relevant Exposure
(m) (1)
Distance to kerb of nearest
road (m) (2)
Tube collocated
with a Continuous Analyser?
Height (m)
55 Roadside 414187 408264 NO2 N Y (3.2) 1.7 N 2.0
56 Planning 415009 416420 NO2 N N 2.8 N 2.0
57 Planning 414291 417281 NO2 N N 2.2 N 2.0
58 Planning 414350 417270 NO2 N N 2.6 N 2.0
(1) 0m if the monitoring site is at a location of exposure (e.g. installed on/adjacent to the façade of a residential property).
(2) N/A if not applicable.

2016
LAQM Annual Status Report 2016 41
Table A.9 – Annual Mean NO2 Monitoring Results
Site ID Site Type Monitoring Type
Valid Data Capture for Monitoring
Period (%) (1)
Valid Data Capture 2015
(%) (2)
NO2 Annual Mean Concentration (µg/m3) (3)
2011 2012 2013 2014 2015
Trailer 2 Urban
Background Continuous 77 77 24.0 24.6 23.9
22.0 21.0
Roadside 1 Roadside Continuous 83 83 39.5 41.0 35.9 37.2 32.0
Roadside 2 Roadside Continuous 75 75 37.7 37.4 32.4 33.1 35.7
Roadside 3 Roadside Continuous 75 75 34.5 35.0 33.2 36.0 39.8
Roadside 4 Roadside Continuous 74 74 46.3 42.9 36.9 43.6 44.6
Roadside 5 Roadside Continuous 77 77 33.9 33.1 32.8 32.7 29.7
Roadside 6 Roadside Continuous 91 91 N/A N/A 42.3 41.7 44.4
Notes: Exceedances of the NO2 annual mean objective of 40µg/m3 are shown in bold.
NO2 annual means exceeding 60µg/m3, indicating a potential exceedance of the NO2 1-hour mean objective are shown in bold and underlined.
(1) data capture for the monitoring period, in cases where monitoring was only carried out for part of the year.
(2) data capture for the full calendar year (e.g. if monitoring was carried out for 6 months, the maximum data capture for the full calendar year is 50%).
(3) Means for diffusion tubes have been corrected for bias. All means have been “annualised” as per Technical Guidance LAQM.TG16 if valid data capture for the full calendar year is less than 75%. See Appendix C for details.

2016
LAQM Annual Status Report 2016 42
Table A.10 – 1-Hour Mean NO2 Monitoring Results
Site ID Site Type Monitoring
Type
Valid Data Capture for
Monitoring Period (%) (1)
Valid Data Capture 2015
(%) (2)
NO2 1-Hour Means > 200µg/m3 (3)
2011 2012 2013 2014 2015
Trailer 2 Urban
Background Continuous 77 77 0 0 0 (64.23) 0 (79.85) 0 (71.17)
Roadside 1 Roadside Continuous 83 83 0 5 1 0 (126.15) 0 (107.03)
Roadside 2 Roadside Continuous 75 75 0 0 0(88.91) 0 (135.03) 0 (121.47)
Roadside 3 Roadside Continuous 75 75 0 0 0 2 (139.91) 7 (171.37)
Roadside 4 Roadside Continuous 74 74 7 5 0 (96.68) 1 (136.96) 0 (131.91)
Roadside 5 Roadside Continuous 77 77 0 0 0 0 (98.96) 0 (89.28)
Roadside 6 Roadside Continuous 91 91 N/A N/A 0 (102.04) 0 (128.0) 0
Notes: Exceedances of the NO2 1-hour mean objective (200µg/m3 not to be exceeded more than 18 times/year) are shown in bold.
(1) data capture for the monitoring period, in cases where monitoring was only carried out for part of the year.
(2) data capture for the full calendar year (e.g. if monitoring was carried out for 6 months, the maximum data capture for the full calendar year is 50%).
(3) If the period of valid data is less than 90%, the 99.8th percentile of 1-hour means is provided in brackets.

2016
LAQM Annual Status Report 2016 43
Table A.11 – Annual Mean PM10 Monitoring Results
Site ID Site Type Valid Data Capture
for Monitoring Period (%) (1)
Valid Data Capture 2015
(%) (2)
PM10 Annual Mean Concentration (µg/m3) (3)
2011 2012 2013 2014 2015
Trailer 2 Urban Background Continuous 77 22.81 22.46 21.54 17.22 18.52
Roadside 1 Roadside Continuous 64 32.47 29.21 30.34 16.78 19.28
Roadside 2 Roadside Continuous 0 18.61 19.13 19.11 15.92 N/A
Roadside 3 Roadside Continuous 67 23.30c 19.21 22.08 20.12 18.72
Roadside 4 Roadside Continuous 70 23.29 19.87 22.29 20.84 19.14
Roadside 5 Roadside Continuous 66 29.29 22.79 25.48 22.41 15.58
Roadside 6 Roadside Continuous 45 N/A N/A N/A 17.13 25.95
Notes: Exceedances of the PM10 annual mean objective of 40µg/m3 are shown in bold.
(1) data capture for the monitoring period, in cases where monitoring was only carried out for part of the year.
(2) data capture for the full calendar year (e.g. if monitoring was carried out for 6 months, the maximum data capture for the full calendar year is 50%).
(3) All means have been “annualised” as per Technical Guidance LAQM.TG16, valid data capture for the full calendar year is less than 75%. See Appendix C for details.

2016
LAQM Annual Status Report 2016 44
Table A.12 – 24-Hour Mean PM10 Monitoring Results
Site ID Site Type Valid Data Capture for Monitoring Period (%)
(1)
Valid Data Capture 2015 (%)
(2)
PM10 24-Hour Means > 50µg/m3 (3)
2011 2012 2013 2014 2015
Trailer 2 Urban
Background 77 77 19 28 5 (33.31)c
2 (29.44) 4 (30.05)
Roadside 1 Roadside 64 64 57 39 36 (50.32)c 6 (28.02) 9 (42.40)
Roadside 2 Roadside 0 0 4 9 4 (35.69)c 0 (24.81) N/A
Roadside 3 Roadside 67 67 7
(29.68)c 12 13
8 (32.36) 3 (32.48)
Roadside 4 Roadside 70 70 22 13 13 (40.57)c 8 (33.77) 3 (25.38)
Roadside 5 Roadside 66 66 44 17 15 6 (35.96) 0 (20.26)
Roadside 6 Roadside 45 45 N/A N/A N/A 0 (24.79) 10 (40.11)
Notes: Exceedances of the PM10 24-hour mean objective (50µg/m3 not to be exceeded more than 35 times/year) are shown in bold.
(1) data capture for the monitoring period, in cases where monitoring was only carried out for part of the year.
(2) data capture for the full calendar year (e.g. if monitoring was carried out for 6 months, the maximum data capture for the full calendar year is 50%).
(3) If the period of valid data is less than 90%, the 90.4th percentile of 24-hour means is provided in brackets.

2016
LAQM Annual Status Report 2016 45
Table A.7 – SO2 Monitoring Results
Site ID Site Type
Valid Data Capture for monitoring
Period (%) (1)
Valid Data Capture
2015 (%) (2)
Number of Exceedances (percentile in bracket) (3)
15-minute Objective (266 µg/m3)
1-hour Objective (350 µg/m3)
24-hour Objective (125 µg/m3)
Trailer 2 Urban
Background 59 59 0 (7.81) 0 (7.72) 0 (7.48)
Notes: Exceedances of the SO2 objectives are shown in bold (15-min mean = 35 allowed a year, 1-hour mean = 24 allowed a year, 24-hour mean = 3 allowed a year)
(1) Data capture for the monitoring period, in cases where monitoring was only carried out for part of the year.
(2) Data capture for the full calendar year (e.g. if monitoring was carried out for 6 months, the maximum data capture for the full calendar year is 50%)
(3) If the period of valid data is less than 90%, the relevant percentiles are provided in brackets.

2016
LAQM Annual Status Report 2016 46
Appendix B: Full Monthly Diffusion Tube Results for 2015
Table B.2 – NO2 Monthly Diffusion Tube Results - 2015
Site ID
NO2 Mean Concentrations (µg/m3)
Jan Feb Mar Apr May Jun Jul Aug Sep Oct Nov Dec
Annual Mean
Raw Data
(2)
Bias Adjusted
(1)(2) 1 64.22 66.49 57.28 48.12 50.10 53.32 62.23 65.98 52.55 67.54 75.78 61.79 60.45 45.34
2 74.40 73.32 69.93 58.99 59.92 47.08 43.79 57.60 55.13 77.10 76.31 54.19 62.31 46.74
3 73.17 79.30 65.92 66.01 61.95 64.45 68.23 75.67 73.95 79.17 80.55 70.86 71.60 53.70
4 53.23 39.42 53.02 55.42 51.60 41.34 33.46 40.72 54.64 - 55.99 36.91 46.89 35.16
5 63.84 48.77 65.33 49.50 56.29 48.17 46.14 49.57 56.42 56.84 69.64 53.43 55.33 41.50
6 - 84.03 48.93 43.35 39.94 43.54 38.85 46.72 50.17 70.63 55.06 49.84 51.92 38.94
7 64.33 63.11 49.96 54.99 57.97 55.59 44.08 63.34 69.01 82.81 63.29 48.53 59.75 44.81
8 64.07 - 53.74 41.75 33.08 48.45 37.49 49.25 50.99 69.03 66.45 47.42 51.06 38.30
9 - 61.58 51.68 37.63 40.00 45.37 36.17 45.13 53.91 63.29 75.02 65.30 52.28 39.21
10 - 62.72 48.00 43.36 44.92 54.28 45.88 53.05 61.82 76.19 73.57 53.84 56.15 42.11
11 62.16 66.47 59.01 46.03 50.81 48.07 38.98 - 52.67 70.75 73.19 53.72 56.53 42.40
12 - 64.05 - 46.29 49.20 51.52 - 55.78 57.02 61.23 66.10 59.61 56.76 42.57
13 51.72 78.13 48.66 52.34 45.06 49.51 40.92 46.82 54.57 56.48 67.24 54.58 53.83 40.38
14 28.91 26.05 24.02 20.26 14.06 12.88 13.52 15.39 23.09 33.05 24.54 25.73 21.79 16.34
15 59.92 64.21 51.69 42.61 42.93 56.74 45.91 48.23 42.07 45.80 56.69 58.75 51.29 38.47
16 58.49 65.16 55.27 47.84 50.35 55.61 48.11 45.52 48.08 50.38 61.22 55.47 53.46 40.09
17 54.10 56.89 48.22 49.92 52.28 55.22 44.82 46.61 49.42 53.40 55.67 49.70 51.35 38.51
18 60.61 64.75 69.43 60.48 59.80 56.37 44.96 59.36 61.35 62.62 68.42 58.23 60.53 45.40
19 52.26 48.65 65.71 55.13 42.00 50.77 48.68 57.80 56.37 64.82 - 42.09 53.12 39.84
20 59.28 68.44 - - 51.66 49.07 44.40 49.15 57.82 43.10 62.37 57.09 54.24 40.68
21 57.48 - 64.97 57.06 54.43 49.31 43.43 - 55.16 87.00 68.17 61.93 59.89 44.92

2016
LAQM Annual Status Report 2016 47
Site ID
NO2 Mean Concentrations (µg/m3)
Jan Feb Mar Apr May Jun Jul Aug Sep Oct Nov Dec
Annual Mean
Raw Data
(2)
Bias Adjusted
(1)(2) 22 65.19 - 57.02 62.72 56.18 - - - - 74.13 52.48 67.40 57.81 43.36
23 53.32 51.65 60.28 55.59 46.14 48.75 56.80 56.79 56.37 71.59 70.21 54.65 56.84 42.63
24 82.03 90.01 61.25 67.89 59.04 55.97 55.96 46.20 70.58 90.54 74.94 53.33 67.31 50.48
25 29.26 28.47 34.49 21.69 18.54 21.34 22.15 25.80 28.81 35.04 32.25 28.31 27.18 20.39
26 36.26 24.28 36.90 23.68 18.66 24.89 21.13 24.85 31.67 29.18 29.43 28.86 27.48 20.61
27 34.06 27.22 32.05 20.87 17.33 21.88 22.34 26.00 30.74 25.00 33.28 28.76 26.63 19.97
28 72.79 87.47 72.93 68.97 67.17 62.33 51.11 73.69 64.77 88.60 84.41 80.60 72.90 54.68
29 49.97 56.55 39.38 42.04 38.36 30.47 32.58 36.39 38.33 57.21 55.84 50.42 43.96 32.97
30 55.38 63.11 49.98 45.97 37.98 39.08 39.54 43.11 59.83 60.40 59.98 56.71 50.92 38.19
31 47.34 49.48 44.73 48.79 42.54 36.35 38.75 45.08 51.51 55.53 49.90 49.31 46.61 34.96
32 73.16 64.46 63.09 54.66 54.84 53.40 55.94 57.51 65.34 76.74 71.13 68.39 63.22 47.42
33 48.44 44.10 42.77 44.84 37.33 31.46 39.81 44.18 54.58 53.54 54.30 44.64 45.00 33.75
34 42.31 45.66 47.61 48.19 42.21 - - 33.65 42.71 52.98 43.01 44.47 44.28 33.21
35 56.23 52.82 53.02 55.76 36.35 30.94 57.94 55.30 51.27 59.08 52.32 60.75 51.82 38.86
36 58.25 - - 53.58 49.28 51.78 54.33 63.59 57.21 63.19 62.30 53.03 56.65 42.49
37 46.22 55.06 48.87 51.29 42.71 47.34 38.38 45.00 55.66 51.10 58.64 41.43 48.48 36.36
38 47.80 57.59 51.47 54.32 43.28 55.56 42.20 51.00 48.03 54.20 62.65 50.41 51.54 38.66
39 58.36 56.77 63.45 68.27 51.03 50.55 38.74 51.15 50.73 59.37 58.88 39.03 53.86 40.40
40 55.34 61.70 82.48 55.15 60.09 92.33 72.44 107.78 110.87 77.44 99.93 90.62 80.51 60.39
41 60.83 - 53.83 66.37 51.82 59.98 55.39 57.00 62.44 61.70 80.44 53.78 60.33 45.25
42 61.07 59.58 52.92 51.28 50.34 - 35.92 49.87 72.32 53.30 70.26 73.63 57.32 42.99
43 58.96 57.10 61.22 49.45 41.84 51.86 45.24 62.99 74.66 57.48 73.16 69.55 58.63 43.97
44 50.97 52.05 53.72 41.79 41.97 45.03 39.93 47.91 55.84 42.22 60.61 54.88 48.91 36.68
45 53.75 53.30 51.29 44.73 39.11 43.28 36.55 49.98 52.65 67.90 54.28 52.35 49.93 37.45
46 48.18 46.64 48.00 50.33 40.13 46.78 35.80 - 51.05 69.90 64.86 53.83 50.50 37.87

2016
LAQM Annual Status Report 2016 48
Site ID
NO2 Mean Concentrations (µg/m3)
Jan Feb Mar Apr May Jun Jul Aug Sep Oct Nov Dec
Annual Mean
Raw Data
(2)
Bias Adjusted
(1)(2) 47 87.68 87.85 67.46 66.45 65.45 58.78 69.10 64.10 72.45 72.84 86.87 67.52 72.21 54.16
48 60.97 52.68 54.35 53.47 56.56 56.47 45.83 65.66 61.99 63.59 73.71 55.78 58.42 43.82
49 59.76 - 42.54 66.05 40.27 - 45.92 51.56 54.12 81.38 64.23 63.59 56.94 42.71
50 63.62 - 51.83 71.35 52.12 49.70 53.06 60.64 63.58 76.25 47.87 77.11 60.65 45.49
51 52.82 62.84 - 58.18 50.74 47.73 41.36 46.96 58.23 71.10 62.59 34.75 53.39 40.04
52 52.50 45.29 51.05 48.42 42.61 47.60 35.84 48.03 47.06 63.95 51.14 46.26 48.31 36.23
53 45.87 49.88 48.43 48.87 37.97 34.67 35.85 41.60 46.68 57.16 72.95 41.16 46.76 35.07
54 56.29 49.69 46.75 60.99 44.87 53.61 44.49 50.29 50.91 66.78 56.38 52.51 52.80 39.60
55 68.50 69.63 48.42 45.47 - - 30.44 - 47.03 66.55 47.16 45.39 52.06 39.05
56 35.12 35.51 57.66 50.88 - - - 36.18 56.75 85.84 65.76 55.51 53.25 39.93
57 78.59 - 33.88 59.93 56.87 16.73 49.21 61.83 56.94 76.60 76.42 42.50 55.41 41.56
58 85.58 52.24 35.62 34.82 22.79 - 36.75 - 41.20 41.30 36.66 44.41 43.14 32.35
(1) See Appendix C for details on bias adjustment
(2) In accordance with paragraph 7.177 of TG(16) sites with less than 75% data capture have been annualised in using the procedure set out in box 7.9 of
TG(16)

2016
LAQM Annual Status Report 2016 49
Table B.2 – Façade Corrected NO2 Annual Diffusion Tube Results - 2015
Site ID
Site Name Site Type
Bias Adjusted Annual
Concentration (µg/m3)
Distance to Relevant Exposure
(m) (1)
Distance to kerb of nearest
road (m) (2)
Background NO2 (µg/m3)
NO2 at Façade of nearest receptor
(µg/m3)
1
Dewsbury Bus Station (Dewsbury)
Other 45.34
N 0.8 30.62
N/A
2 Huddersfield Bus Station (Huddersfield Town Centre)
Other 46.74
N 4.1 25.29
N/A
3 Edgerton Rd / Blacker Rd, Lamp post No 26 (Edgerton)
Roadside 53.70
Y (2.0) 2.4 18.35
48.5
5 Queens St (Ravensthorpe) Roadside 41.50 Y (1.6) 1.9 19.98 38.5 7
Byram Arcade, Westgate (Huddersfield Town Centre)
Urban Centre 44.81
Y (0.5) 0.5 25.29
N/A
10
Leeds Rd (Bradley) Roadside
42.11 Y (3.2) 2.0
19.98
37.2
11 Chapel Hill (Huddersfield Ring Road)
Roadside 42.40
Y (0.1) 5.5 25.29
42.3
12
Leeds Rd (Bradley) Roadside
42.57 Y (3.7) 1.8
19.98
36.8
13
Whitehall Rd (Birkenshaw) Roadside
40.38 Y (2.1) 2.6
26.69
38.4
16
Roadside 4 (co location) Co-location
Study 40.09 N 3.0
26.69
N/A

2016
LAQM Annual Status Report 2016 50
Site ID
Site Name Site Type
Bias Adjusted Annual
Concentration (µg/m3)
Distance to Relevant Exposure
(m) (1)
Distance to kerb of nearest
road (m) (2)
Background NO2 (µg/m3)
NO2 at Façade of nearest receptor
(µg/m3)
18
Huddersfield Rd (Birstall) Roadside
45.40 Y (4.2) 1.9
20.68
38.7
20 Leeds Rd (Eastborough) Roadside 40.68 Y (9.5) 1.5 30.62 36.3 21 Castlegate Appartments
(Huddersfield Ring Road) Roadside
44.92 Y (6.9) 2.1
25.29
38.2 22 Colne Bridge Rd / Leeds Rd /
Bradley Rd (Bradley) Roadside
43.36 Y (3.2) 1.5
19.98
37.5 23 Huddersfield Rd (Mirfield) Roadside 42.63 Y (14.1) 1.6 16.94 29.6 24 Lindley Moor Rd (Lindley) Roadside 50.48 Y (15.4) 2.0 19.54 34.8 28 Southgate (Huddersfield Ring
Road) Roadside
54.68 Y (0.1) 3.3
25.29
54.4
32 Blacker Rd (Edgerton) Roadside 47.42 Y (5.0) 2.6 18.34 39.6 36 Huddersfield Rd (Mirfield) Kerbside 42.49 Y (2.9) 0.9 16.94 35.2 39 Bradford Rd (Batley) Roadside 40.40 Y (1.7) 2.1 21.66 37.8 40 Leeds Rd (Eastborough) Roadside 60.39 Y (1.2) 1.6 30.62 56.7
41 Chain Bar Roundabout Roadside 45.25 Y (12.5) 3.4 26.44 37.5 42
Leeds Rd (Eastborough) Roadside
42.99 Y (5.6) 1.9
22.01
36.3
43 Leeds Rd / John St (Eastborough)
Roadside 43.97
Y (6.0) 1.9 22.01
36.7
47
Round Ings Road (Outlane) Other
54.16 Y (0) 14.4
15.53
54.2
48
Flush (Heckmondwike) Roadside
43.82 Y (0) 2.6
21.78
43.8

2016
LAQM Annual Status Report 2016 51
Site ID
Site Name Site Type
Bias Adjusted Annual
Concentration (µg/m3)
Distance to Relevant Exposure
(m) (1)
Distance to kerb of nearest
road (m) (2)
Background NO2 (µg/m3)
NO2 at Façade of nearest receptor
(µg/m3)
49 Manchester Rd (Thornton Lodge)
Roadside 42.71
Y (3.5) 3.7 19.51
38.5
50 Manchester Rd (Thornton Lodge)
Roadside 45.49
Y (1.6) 2.5 19.88
42.4
51
High St (Heckmondwike) Roadside
40.04 Y (4.9) 1.0
21.78
33.5
57 Cambridge Rd (Huddersfield Town Centre)
Planning 41.56
N 2.2 24.95
N/A

2016
LAQM Annual Status Report 2016 52
Appendix C: Supporting Technical Information / Air Quality Monitoring Data QA/QC
Kirklees operates its own laboratory for the analysis of Palmes NO2 diffusion tubes. The laboratory operates following the protocols set out in the AEAT document “Diffusion Tubes for Ambient NO2 Monitoring: Practical Guidance”. The tubes are prepared using 50% tea: 50% acetone mix.
C.1.1 Factor from Local Co-location Studies
Kirklees Council currently conduct 2 co-location studies with neighbouring authorities and participates in the Intercomparison scheme locating tubes at Marylebone Road The bias adjustment factor derived from Kirklees participation in the Intercomparison scheme for 2015 is 0.75, with the precision being rated as good
C.1.2 Diffusion Tube Bias Adjustment Factors
In addition to the Intercomparison scheme 3 Co-location studies are conducted at
Kirklees Monitoring stations and with neighbouring authorities, but due to station
failures, Roadside 4 did not have a data capture >75% and not valid.
Trailer 2 Co –location study generated a bias adjustment figure of 0.79 with a good
precision between the 3 tubes.
Barnsley Council Co-location study generated a bias adjustment figure of 0.75, but
does not have a precision because the study is carried out with a singular tube.
Bias adjustment data is fed into the national bias adjustment spreadsheet and
available below;
http://laqm.defra.gov.uk/documents/Database_Diffusion_Tube_Bias_Factors_v06_16
-Final.xls
C.1.3 Discussion of Choice of Factor to Use
Of the 3 Co-location studies are conducted by Kirklees Council, 2 have generated the
same value and the other is close to that. Therefore, Kirklees Council have used the
Barnsley Council and Intercomparison scheme derived correction factor of 0.75
2016
LAQM Annual Status Report 2016 53
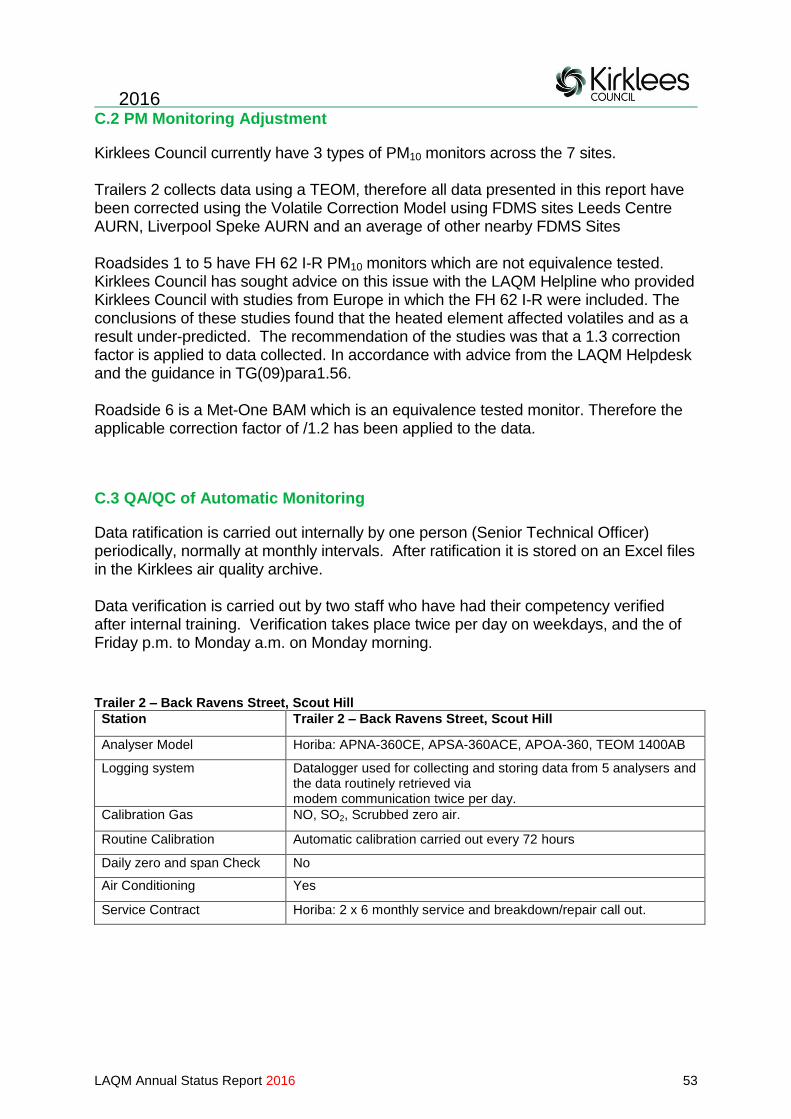
C.2 PM Monitoring Adjustment
Kirklees Council currently have 3 types of PM10 monitors across the 7 sites. Trailers 2 collects data using a TEOM, therefore all data presented in this report have been corrected using the Volatile Correction Model using FDMS sites Leeds Centre AURN, Liverpool Speke AURN and an average of other nearby FDMS Sites Roadsides 1 to 5 have FH 62 I-R PM10 monitors which are not equivalence tested. Kirklees Council has sought advice on this issue with the LAQM Helpline who provided Kirklees Council with studies from Europe in which the FH 62 I-R were included. The conclusions of these studies found that the heated element affected volatiles and as a result under-predicted. The recommendation of the studies was that a 1.3 correction factor is applied to data collected. In accordance with advice from the LAQM Helpdesk and the guidance in TG(09)para1.56. Roadside 6 is a Met-One BAM which is an equivalence tested monitor. Therefore the applicable correction factor of /1.2 has been applied to the data.
C.3 QA/QC of Automatic Monitoring
Data ratification is carried out internally by one person (Senior Technical Officer) periodically, normally at monthly intervals. After ratification it is stored on an Excel files in the Kirklees air quality archive. Data verification is carried out by two staff who have had their competency verified after internal training. Verification takes place twice per day on weekdays, and the of Friday p.m. to Monday a.m. on Monday morning.
Trailer 2 – Back Ravens Street, Scout Hill
Station Trailer 2 – Back Ravens Street, Scout Hill
Analyser Model Horiba: APNA-360CE, APSA-360ACE, APOA-360, TEOM 1400AB
Logging system Datalogger used for collecting and storing data from 5 analysers and the data routinely retrieved via modem communication twice per day.
Calibration Gas NO, SO2, Scrubbed zero air.
Routine Calibration Automatic calibration carried out every 72 hours
Daily zero and span Check No
Air Conditioning Yes
Service Contract Horiba: 2 x 6 monthly service and breakdown/repair call out.

2016
LAQM Annual Status Report 2016 54
Roadside 1 – Dewsbury
Station Roadside 1 – Dewsbury
Analyser Model Horiba: APNA-360CE, FH 62 I-R
Logging system Each analyser has a data distribution board and communicates directly via modem for data download twice per day
Calibration Gas NO, zero air.
Routine Calibration Automatic calibration carried out every 72 hours
Daily zero and span Check No
Air Conditioning Yes
Service Contract Horiba: 2 x 6 monthly service and breakdown/repair call out.
Roadside 2 – Bradford Rd/Chain Bar
Station Roadside 2 – Bradford Rd/Chain Bar
Analyser Model Horiba: APNA-360CE, FH 62 I-R
Logging system Each analyser has a data distribution board and communicates directly via modem for data download twice per day.
Calibration Gas NO, zero air.
Routine Calibration Automatic calibration carried out every 72 hours
Daily zero and span Check No
Air Conditioning Yes
Service Contract Horiba: 2 x 6 monthly service and breakdown/repair call out.
Roadside 3 – Hunsworth Lane
Station Roadside 3 – Hunsworth Lane
Analyser Model Horiba: APNA-360CE, FH 62 I-R
Logging system Each analyser has a data distribution board and communicates directly via modem for data download twice per day
Calibration Gas NO, zero air.
Routine Calibration Automatic calibration carried out every 72 hours
Daily zero and span Check No
Air Conditioning Yes
Service Contract Horiba: 2 x 6 monthly service and breakdown/repair call out.
Roadside 4 – M62 road bridge, Birkenshaw
Station Roadside 4 – M62 road bridge, Birkenshaw
Analyser Model Horiba: APNA-360CE, FH 62 I-R
Logging system Each analyser has a data distribution board and communicates directly via modem for data download twice per day.
Calibration Gas NO, zero air.
Routine Calibration Automatic calibration carried out every 72 hours
Daily zero and span Check No
Air Conditioning Yes
Service Contract Horiba: 2 x 6 monthly service and breakdown/repair call out.
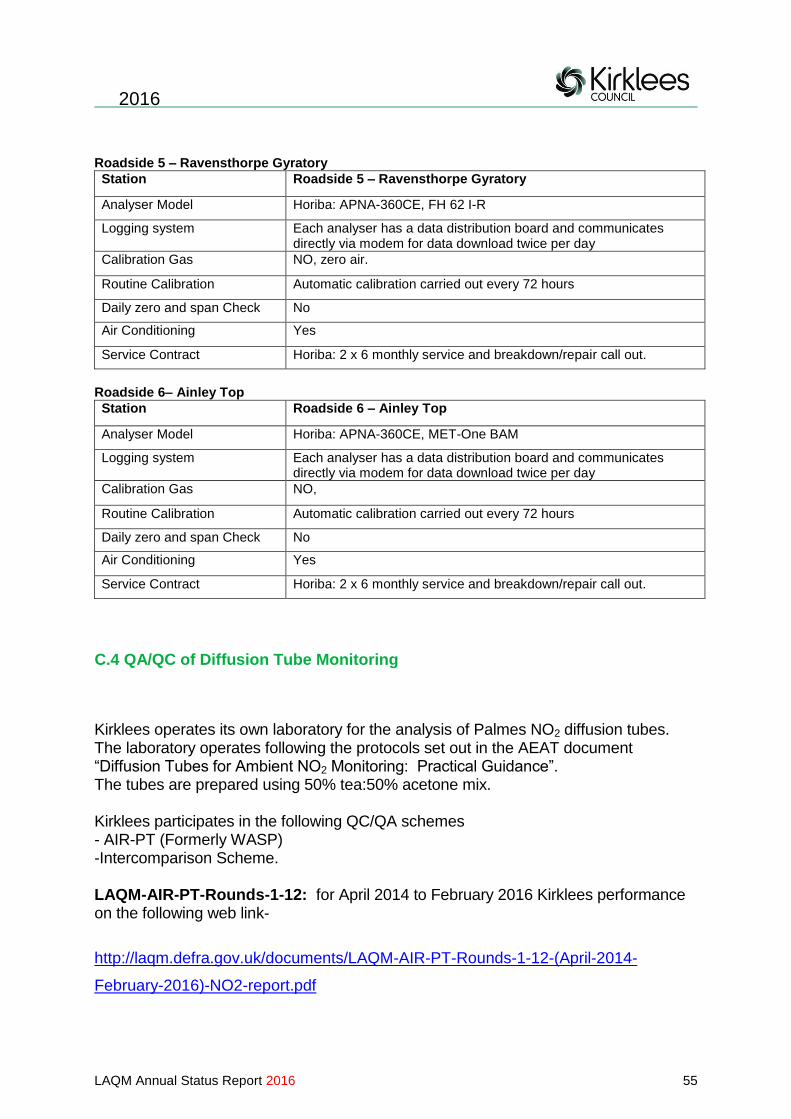
2016
LAQM Annual Status Report 2016 55
Roadside 5 – Ravensthorpe Gyratory
Station Roadside 5 – Ravensthorpe Gyratory
Analyser Model Horiba: APNA-360CE, FH 62 I-R
Logging system Each analyser has a data distribution board and communicates directly via modem for data download twice per day
Calibration Gas NO, zero air.
Routine Calibration Automatic calibration carried out every 72 hours
Daily zero and span Check No
Air Conditioning Yes
Service Contract Horiba: 2 x 6 monthly service and breakdown/repair call out.
Roadside 6– Ainley Top
Station Roadside 6 – Ainley Top
Analyser Model Horiba: APNA-360CE, MET-One BAM
Logging system Each analyser has a data distribution board and communicates directly via modem for data download twice per day
Calibration Gas NO,
Routine Calibration Automatic calibration carried out every 72 hours
Daily zero and span Check No
Air Conditioning Yes
Service Contract Horiba: 2 x 6 monthly service and breakdown/repair call out.
C.4 QA/QC of Diffusion Tube Monitoring
Kirklees operates its own laboratory for the analysis of Palmes NO2 diffusion tubes. The laboratory operates following the protocols set out in the AEAT document “Diffusion Tubes for Ambient NO2 Monitoring: Practical Guidance”. The tubes are prepared using 50% tea:50% acetone mix. Kirklees participates in the following QC/QA schemes - AIR-PT (Formerly WASP) -Intercomparison Scheme. LAQM-AIR-PT-Rounds-1-12: for April 2014 to February 2016 Kirklees performance on the following web link-
http://laqm.defra.gov.uk/documents/LAQM-AIR-PT-Rounds-1-12-(April-2014-
February-2016)-NO2-report.pdf
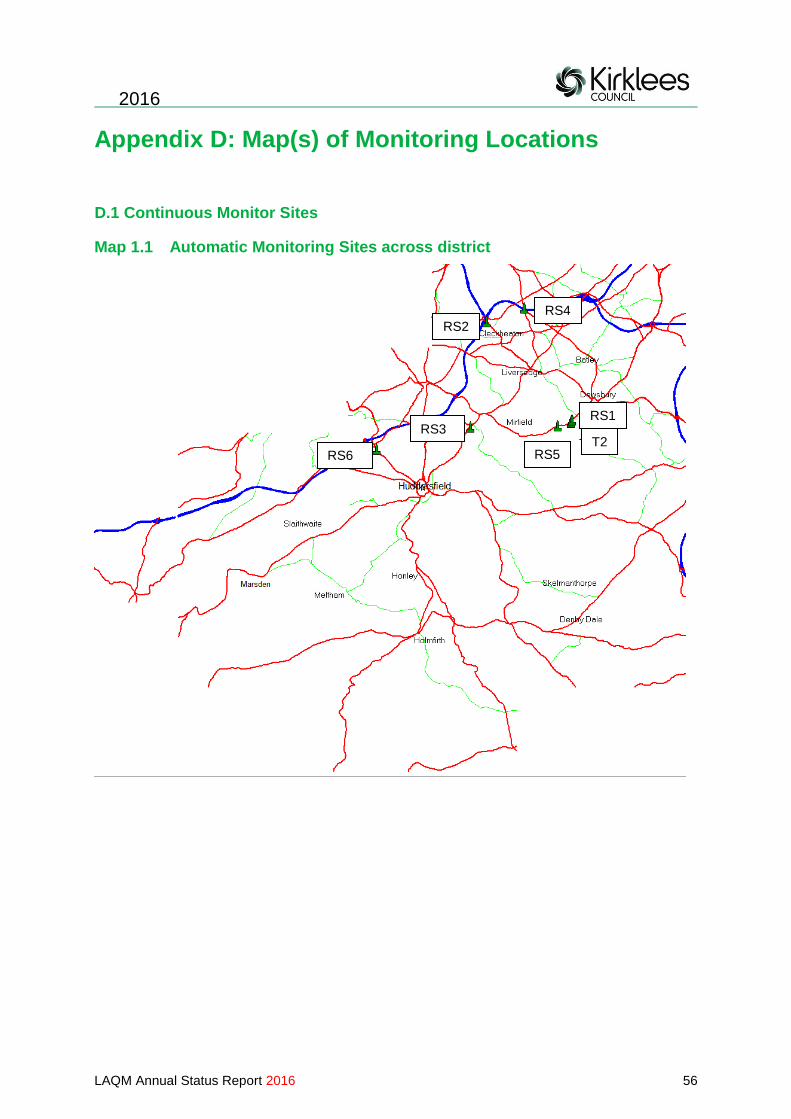
2016
LAQM Annual Status Report 2016 56
Appendix D: Map(s) of Monitoring Locations
D.1 Continuous Monitor Sites
Map 1.1 Automatic Monitoring Sites across district
RS1
T2 RS5
RS2
RS4
RS3
RS6
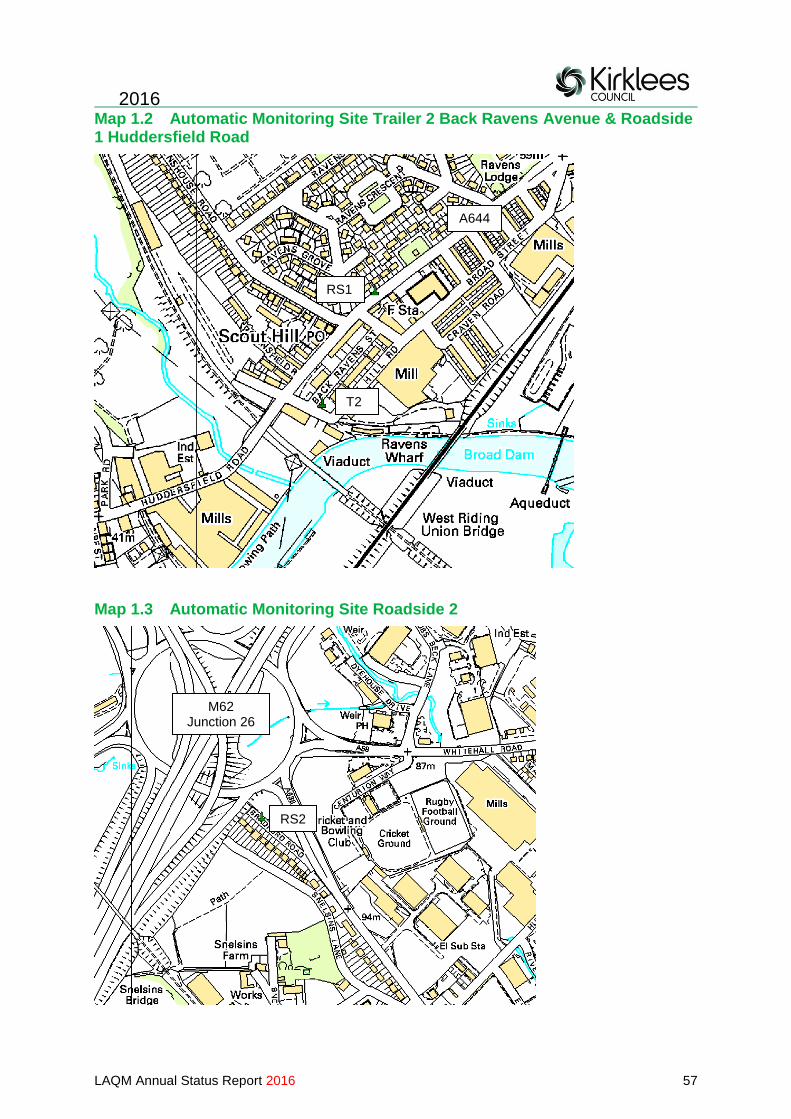
2016
LAQM Annual Status Report 2016 57
Map 1.2 Automatic Monitoring Site Trailer 2 Back Ravens Avenue & Roadside 1 Huddersfield Road
Map 1.3 Automatic Monitoring Site Roadside 2
T2
RS1
A644
RS2
M62 Junction 26

2016
LAQM Annual Status Report 2016 58
Map 1.4 Automatic Monitoring Site New Roadside 3
Map 1.5 Automatic Monitoring Site Roadside 4
RS3
A62
A62
A6107
RS4
M62
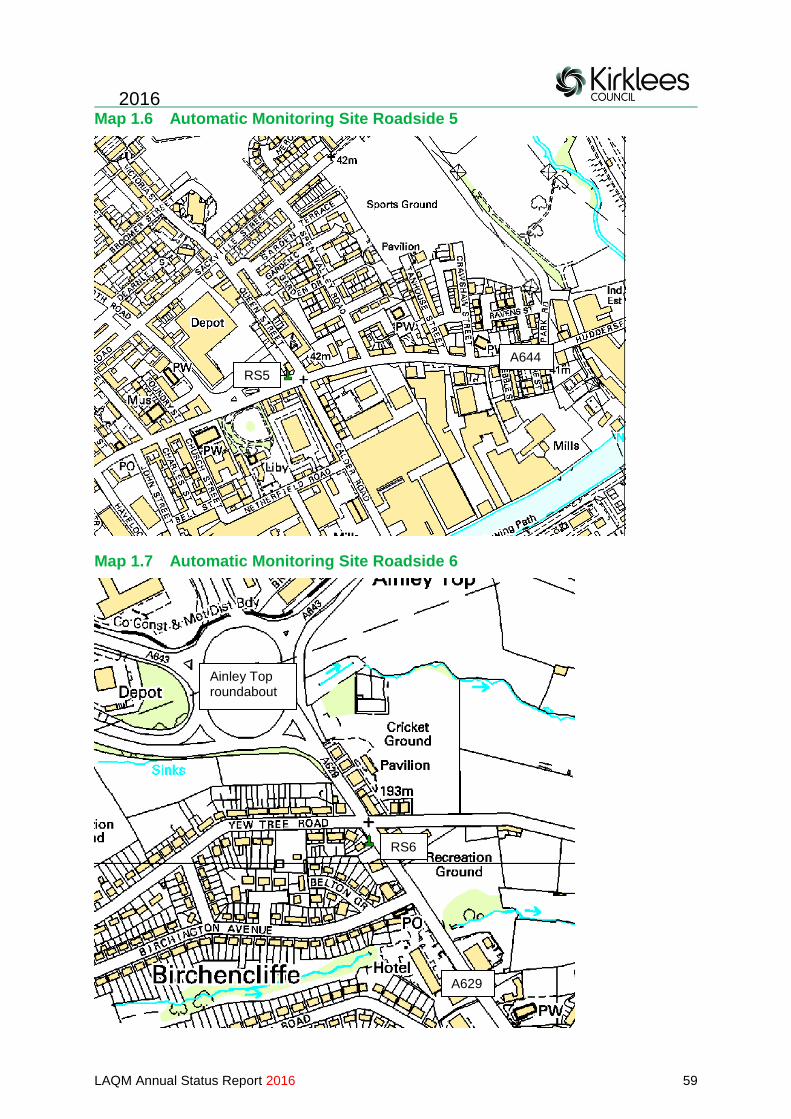
2016
LAQM Annual Status Report 2016 59
Map 1.6 Automatic Monitoring Site Roadside 5
Map 1.7 Automatic Monitoring Site Roadside 6
RS5
A644
RS6
Ainley Top roundabout
A629

2016
LAQM Annual Status Report 2016 60
D.2 Passive Monitor Sites
Map 2.1 Non-Automatic Monitoring Sites across district

2016
LAQM Annual Status Report 2016 61
Map 2.2 AQMA 1 Bradley diffusion tubes
Map 2.3 Huddersfield town centre diffusion tubes
Tube 6
Tube 22
Tube 9
Tube 10
Tube 12
Tube 23
Tube 7
Tube 21
Tube 2
Tube 11
Tube 28
Planning Tube 1
Planning Tube 2 Planning Tube 3
Tube 14
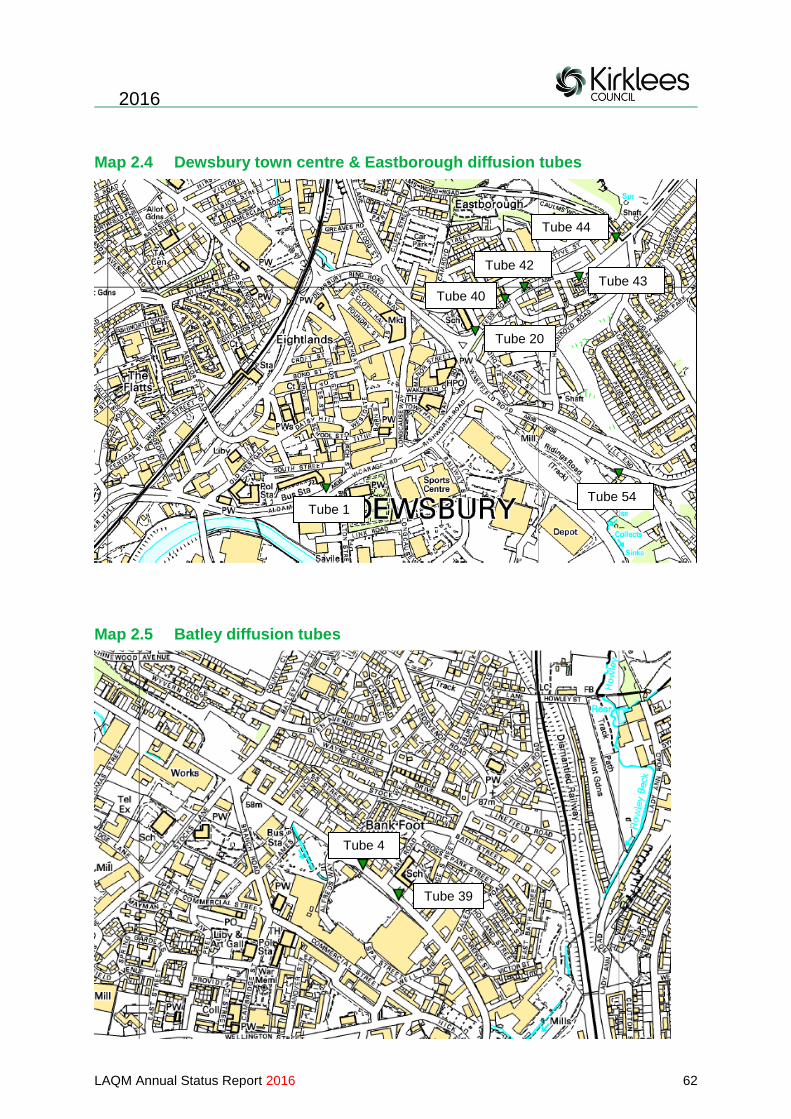
2016
LAQM Annual Status Report 2016 62
Map 2.4 Dewsbury town centre & Eastborough diffusion tubes
Map 2.5 Batley diffusion tubes
Tube 1
Tube 20
Tube 40
Tube 42
Tube 43
Tube 44
Tube 54
Tube 39
Tube 4

2016
LAQM Annual Status Report 2016 63
Map 2.6 Birkenshaw diffusion tubes
Map 2.7 Heckmondwike and Liversedge diffusion tubes
Tube 13
Tube 37
Tube 38
Tube 49
Tube 34
Tube 35
Tube 51 Tube 33
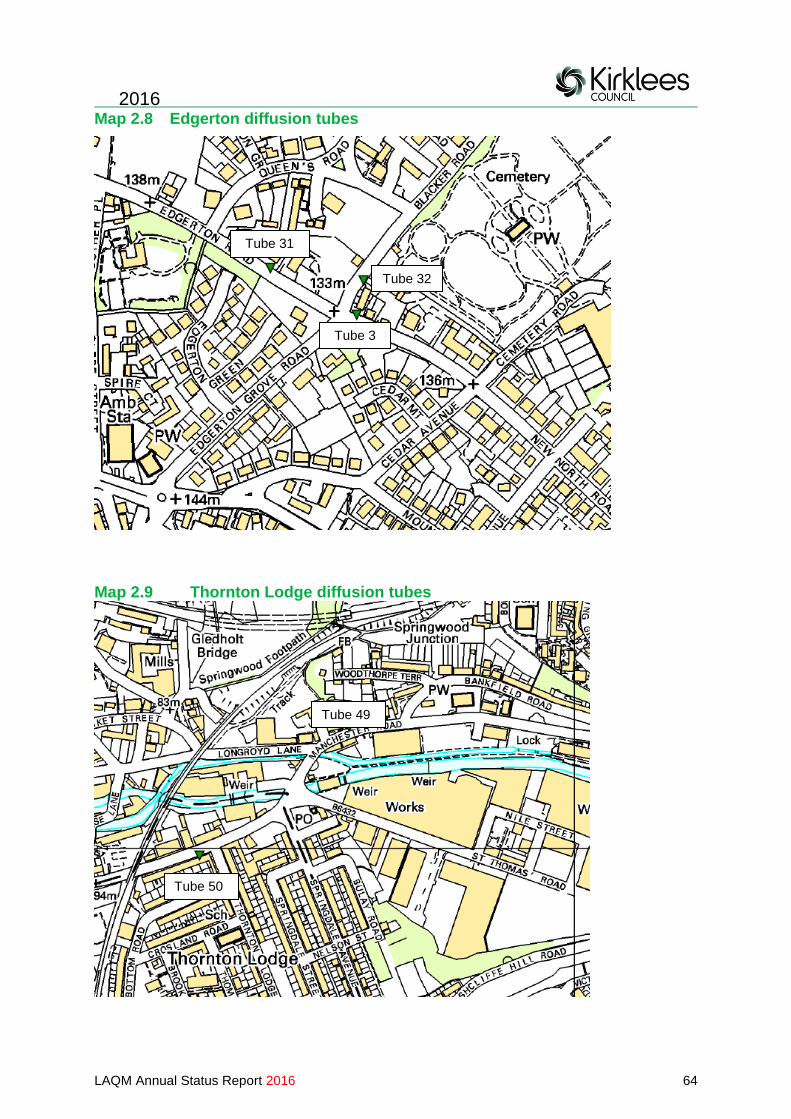
2016
LAQM Annual Status Report 2016 64
Map 2.8 Edgerton diffusion tubes
Map 2.9 Thornton Lodge diffusion tubes
Tube 3
Tube 32
Tube 31
Tube 49
Tube 50
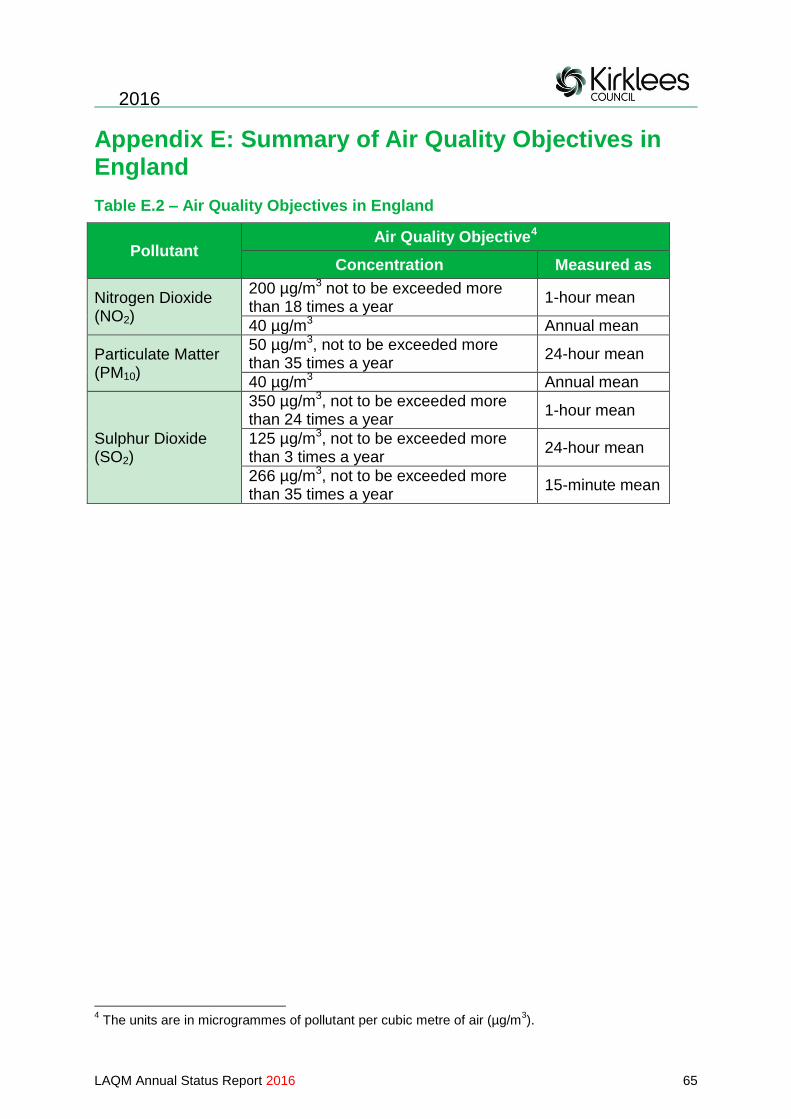
2016
LAQM Annual Status Report 2016 65
Appendix E: Summary of Air Quality Objectives in England
Table E.2 – Air Quality Objectives in England
Pollutant Air Quality Objective4
Concentration Measured as
Nitrogen Dioxide (NO2)
200 µg/m3 not to be exceeded more than 18 times a year
1-hour mean
40 µg/m3 Annual mean
Particulate Matter (PM10)
50 µg/m3, not to be exceeded more than 35 times a year
24-hour mean
40 µg/m3 Annual mean
Sulphur Dioxide (SO2)
350 µg/m3, not to be exceeded more than 24 times a year
1-hour mean
125 µg/m3, not to be exceeded more than 3 times a year
24-hour mean
266 µg/m3, not to be exceeded more than 35 times a year
15-minute mean
4 The units are in microgrammes of pollutant per cubic metre of air (µg/m
3).

2016
LAQM Annual Status Report 2016 66
Appendix F: Air Quality Management Areas 2016
F1.1 Ainley Top AQMA Assessment
F1.2 Birkenshaw AQMA Assessment
F1.3 Eastborough AQMA Assessment
F1.4 Edgerton AQMA Assessment
F1.5 Heckmondwike AQMA Assessment
F1.6 Huddersfield Town Centre AQMA Assessment
F1.7 Outlane AQMA Assessment
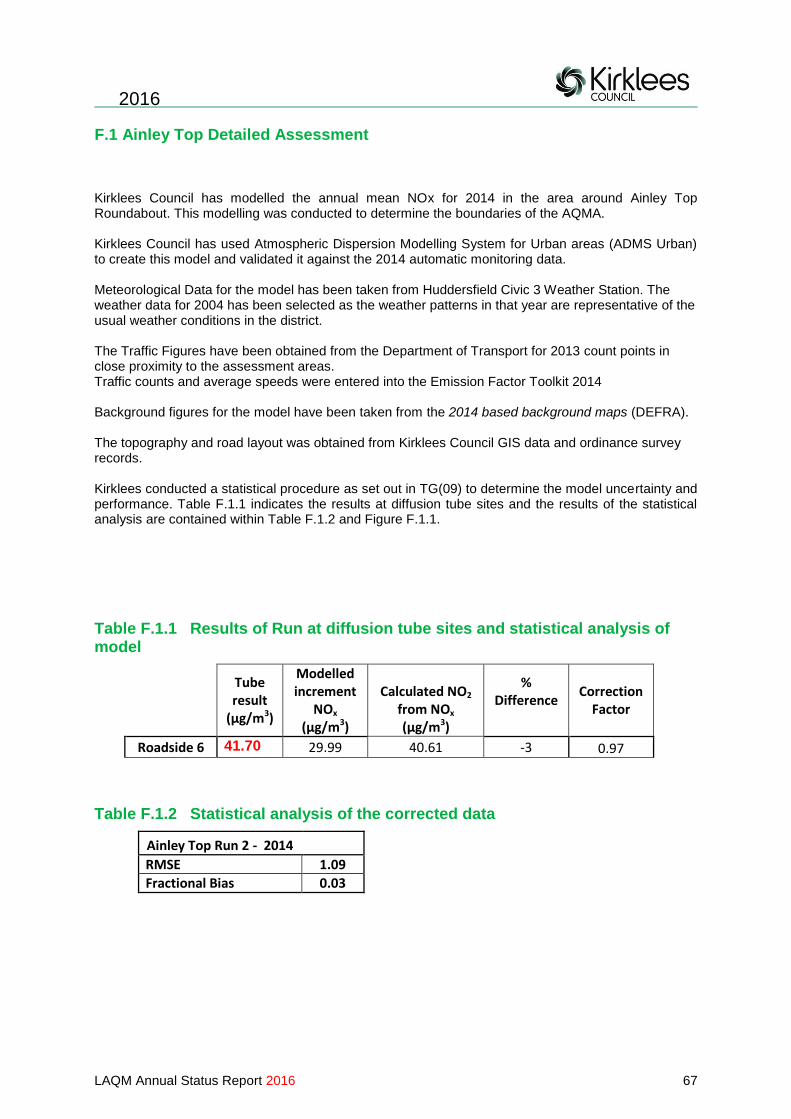
2016
LAQM Annual Status Report 2016 67
F.1 Ainley Top Detailed Assessment
Kirklees Council has modelled the annual mean NOx for 2014 in the area around Ainley Top Roundabout. This modelling was conducted to determine the boundaries of the AQMA.
Kirklees Council has used Atmospheric Dispersion Modelling System for Urban areas (ADMS Urban) to create this model and validated it against the 2014 automatic monitoring data. Meteorological Data for the model has been taken from Huddersfield Civic 3 Weather Station. The weather data for 2004 has been selected as the weather patterns in that year are representative of the usual weather conditions in the district. The Traffic Figures have been obtained from the Department of Transport for 2013 count points in close proximity to the assessment areas. Traffic counts and average speeds were entered into the Emission Factor Toolkit 2014 Background figures for the model have been taken from the 2014 based background maps (DEFRA). The topography and road layout was obtained from Kirklees Council GIS data and ordinance survey records.
Kirklees conducted a statistical procedure as set out in TG(09) to determine the model uncertainty and performance. Table F.1.1 indicates the results at diffusion tube sites and the results of the statistical analysis are contained within Table F.1.2 and Figure F.1.1.
Table F.1.1 Results of Run at diffusion tube sites and statistical analysis of model
Tube result
(µg/m3)
Modelled increment
NOx
(µg/m3)
Calculated NO2
from NOx
(µg/m3)
% Difference
Correction Factor
Roadside 6 41.70 29.99 40.61 -3 0.97
Table F.1.2 Statistical analysis of the corrected data
Ainley Top Run 2 - 2014 RMSE 1.09
Fractional Bias 0.03
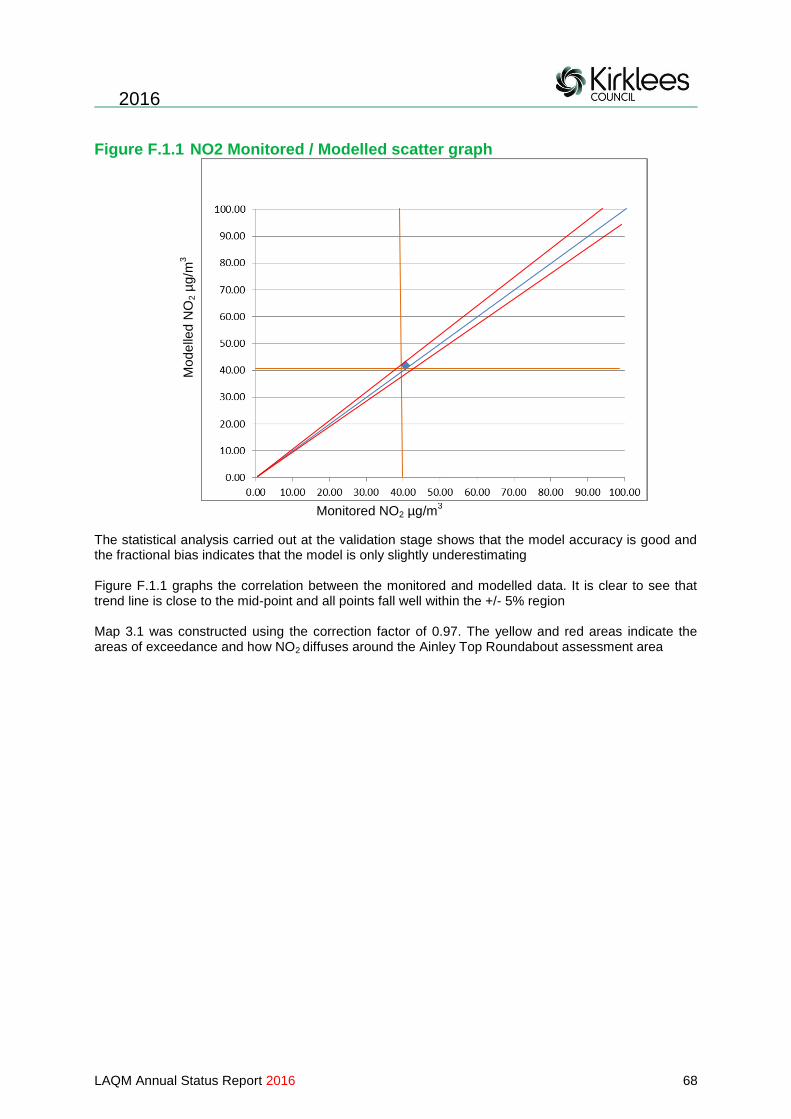
2016
LAQM Annual Status Report 2016 68
Figure F.1.1 NO2 Monitored / Modelled scatter graph
The statistical analysis carried out at the validation stage shows that the model accuracy is good and the fractional bias indicates that the model is only slightly underestimating Figure F.1.1 graphs the correlation between the monitored and modelled data. It is clear to see that trend line is close to the mid-point and all points fall well within the +/- 5% region Map 3.1 was constructed using the correction factor of 0.97. The yellow and red areas indicate the areas of exceedance and how NO2 diffuses around the Ainley Top Roundabout assessment area
Mode
lled N
O2 µ
g/m
3
Monitored NO2 µg/m3

2016
LAQM Annual Status Report 2016 69
Map 3.1 Ainley Top AQMA
Key
Residential Property AQMA Council Boundary NO2 Levels:
Calderdale
Kirklees
>60µg/m3
50 - 60µg/m
3
45 - 50µg/m3
40 - 45µg/m
3

2016
LAQM Annual Status Report 2016 70
F.2 Birkenshaw Detailed Assessment
Kirklees Council has modelled the annual mean NOx for 2015 in the area of Birkenshaw. This modelling was conducted to determine the boundaries of the AQMA.
Kirklees Council has used Atmospheric Dispersion Modelling System for Urban areas (ADMS Urban) to create this model and validated it against the 2015 automatic monitoring data. Meteorological Data for the model has been taken from Huddersfield Civic 3 Weather Station. The weather data for 2004 has been selected as the weather patterns in that year are representative of the usual weather conditions in the district. The Traffic Figures have been obtained from the Department of Transport for 2015 count points in close proximity to the assessment areas. Traffic counts and average speeds were entered into the Emission Factor Toolkit 2014 Background figures for the model have been taken from the 2015 based background maps (DEFRA). The topography and road layout was obtained from Kirklees Council GIS data and ordinance survey records.
Kirklees conducted a statistical procedure as set out in TG(09) to determine the model uncertainty and performance. Table F.2.1 indicates the results at diffusion tube sites and the results of the statistical analysis are contained within Table F.2.2 and Figure F.2.1.
Table F.2.1 Results of Run at diffusion tube sites and statistical analysis of model
Tube result
(µg/m3)
Modelled increment
NOx
(µg/m3)
Calculated NO2
from NOx
(µg/m3)
% Difference
Correction Factor
RS4 44.60 70.09 50.71 14 0.88
Tube 13 40.38 77.69 53.22 32 0.76
Tube 37 36.36 56.64 46.04 27 0.79
Tube 38 38.66 56.17 45.87 19 0.84
Table F.2.2 Statistical analysis of the corrected data
Birkenshaw Run - 2015 RMSE 7.05
Fractional Bias -0.20

2016
LAQM Annual Status Report 2016 71
Figure F.2.1 NO2 Monitored / Modelled scatter graph
The statistical analysis carried out at the validation stage shows that the model accuracy is average and the fractional bias indicates that the model is over estimating
Figure F.2.1 graphs the correlation between the monitored and modelled data. It is clear to see that trend line falls within the +/- 20% region Map 3.1 was constructed using the correction factor of 0.88. The yellow and red areas indicate the areas of exceedance and how NO2 diffuses around the Ainley Top Roundabout assessment area
Mode
lled N
O2 µ
g/m
3
Monitored NO2 µg/m3
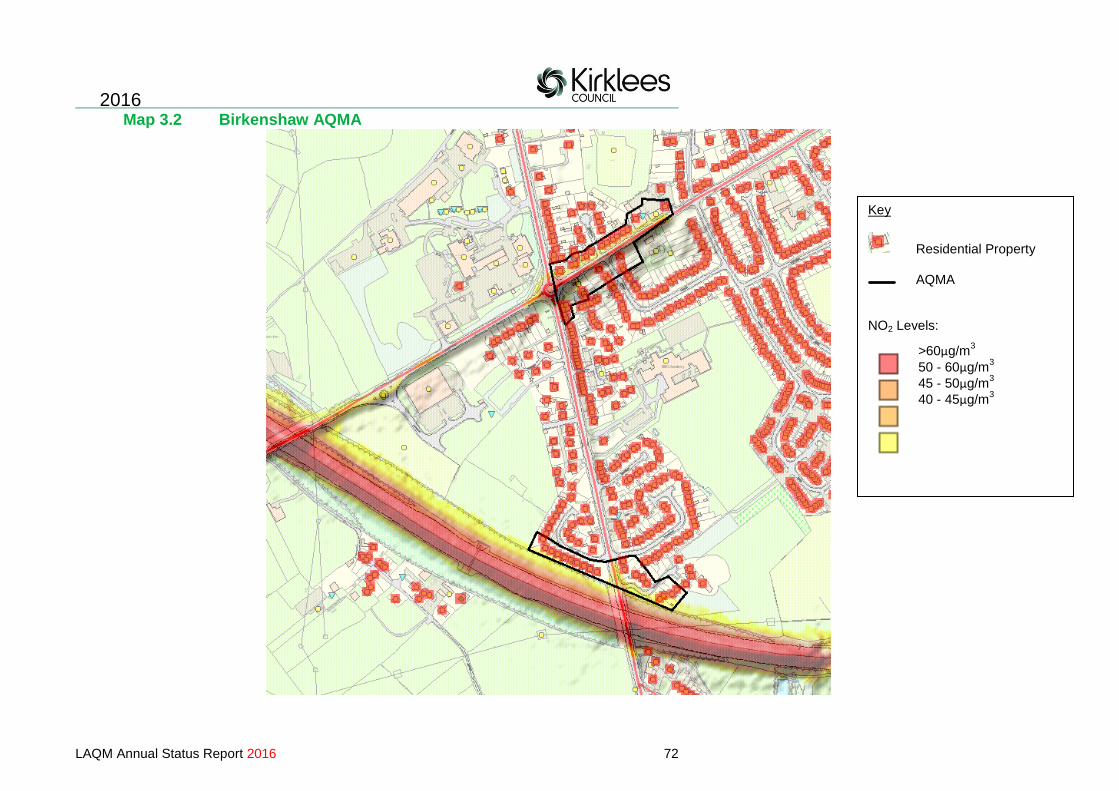
2016
LAQM Annual Status Report 2016 72
Map 3.2 Birkenshaw AQMA
Key
Residential Property
AQMA
NO2 Levels:
>60µg/m3
50 - 60µg/m3
45 - 50µg/m3
40 - 45µg/m3

2016
LAQM Annual Status Report 2016 73
F.3 Eastborough Detailed Assessment
Kirklees Council has modelled the annual mean NOx for 2015 in the area of Eastborough. This modelling was conducted to determine the boundaries of the AQMA.
Kirklees Council has used Atmospheric Dispersion Modelling System for Urban areas (ADMS Urban) to create this model and validated it against the 2015 automatic monitoring data. Meteorological Data for the model has been taken from Huddersfield Civic 3 Weather Station. The weather data for 2004 has been selected as the weather patterns in that year are representative of the usual weather conditions in the district. The Traffic Figures have been obtained from the Department of Transport for 2015 count points in close proximity to the assessment areas. Traffic counts and average speeds were entered into the Emission Factor Toolkit 2014 Background figures for the model have been taken from the 2015 based background maps (DEFRA). The topography and road layout was obtained from Kirklees Council GIS data and ordinance survey records.
Kirklees conducted a statistical procedure as set out in TG(09) to determine the model uncertainty and performance. Table F.3.1 indicates the results at diffusion tube sites and the results of the statistical analysis are contained within Table F.3.2 and Figure F.3.1.
Table F.3.1 Results of Run at diffusion tube sites and statistical analysis of model
Tube result
(µg/m3)
Modelled increment
NOx
(µg/m3)
Calculated NO2
from NOx
(µg/m3)
% Difference
Correction Factor
Tube 20 40.68 100.15 46.39 14 0.88
Tube 40 60.39 86.89 41.48 -31 1.46
Tube 42 42.99 74.35 36.48 -15 1.18
Tube 43 43.97 68.74 34.12 -22 1.29
Tube 44 36.68 61.83 31.11 -15 1.18
Table F.3.2 Statistical analysis of the corrected data
Eastborough Run - 2015 RMSE 8.95
Fractional Bias 0.17
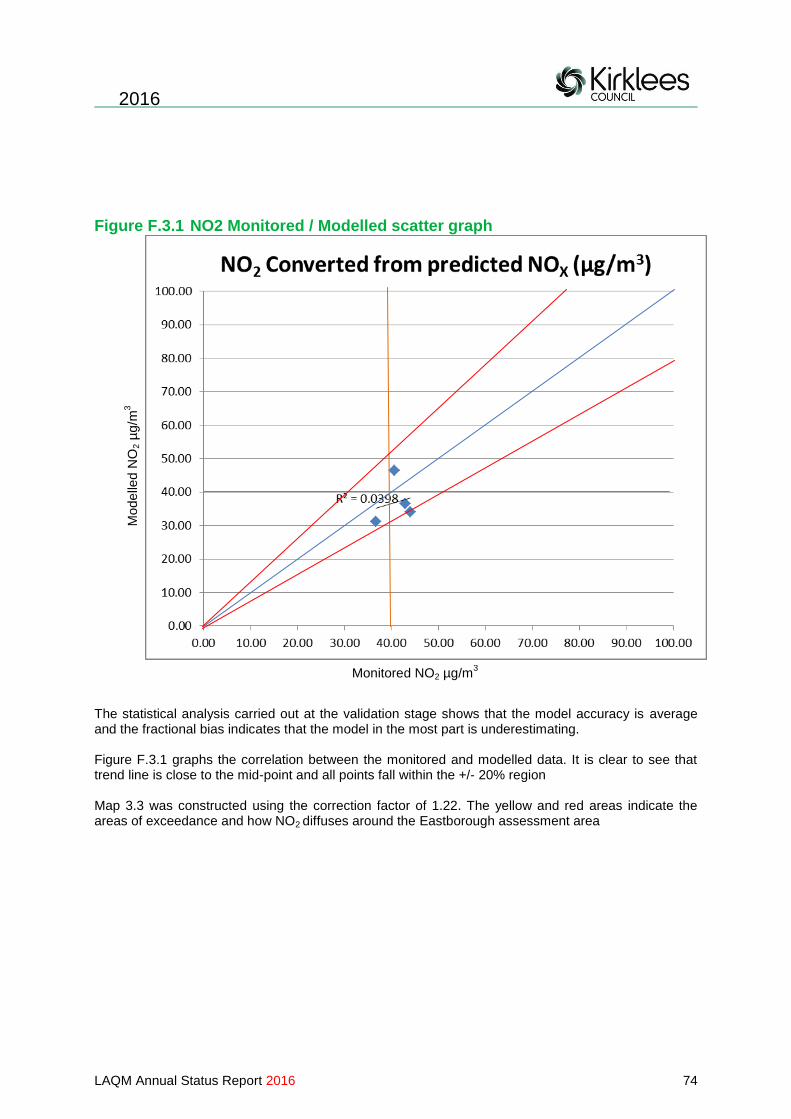
2016
LAQM Annual Status Report 2016 74
Figure F.3.1 NO2 Monitored / Modelled scatter graph
The statistical analysis carried out at the validation stage shows that the model accuracy is average and the fractional bias indicates that the model in the most part is underestimating.
Figure F.3.1 graphs the correlation between the monitored and modelled data. It is clear to see that trend line is close to the mid-point and all points fall within the +/- 20% region Map 3.3 was constructed using the correction factor of 1.22. The yellow and red areas indicate the areas of exceedance and how NO2 diffuses around the Eastborough assessment area
Mode
lled N
O2 µ
g/m
3
Monitored NO2 µg/m3

2016
LAQM Annual Status Report 2016 75
Map 3.3 Eastborough AQMA
Key
Residential Property
AQMA
NO2 Levels:
>60µg/m3
50 - 60µg/m3
45 - 50µg/m3
40 - 45µg/m3

2016
LAQM Annual Status Report 2016 76
F.4 Edgerton Detailed Assessment
Kirklees Council has modelled the annual mean NOx for 2015 in the area of Edgerton. This modelling was conducted to determine the boundaries of the AQMA.
Kirklees Council has used Atmospheric Dispersion Modelling System for Urban areas (ADMS Urban) to create this model and validated it against the 2015 automatic monitoring data. Meteorological Data for the model has been taken from Huddersfield Civic 3 Weather Station. The weather data for 2004 has been selected as the weather patterns in that year are representative of the usual weather conditions in the district. The Traffic Figures have been obtained from the Department of Transport for 2015 count points in close proximity to the assessment areas. Traffic counts and average speeds were entered into the Emission Factor Toolkit 2014 Background figures for the model have been taken from the 2015 based background maps (DEFRA). The topography and road layout was obtained from Kirklees Council GIS data and ordinance survey records.
Kirklees conducted a statistical procedure as set out in TG(09) to determine the model uncertainty and performance. Table F.4.1 indicates the results at diffusion tube sites and the results of the statistical analysis are contained within Table F.4.2 and Figure F4.1.
Table F.4.1 Results of Run at diffusion tube sites and statistical analysis of model
Tube result
(µg/m3)
Modelled increment
NOx
(µg/m3)
Calculated NO2
from NOx
(µg/m3)
% Difference
Correction Factor
Tube 3 53.70 73.10 51.72 -4 1.04
Tube 31 34.96 69.30 50.45 44 0.69
Tube 32 47.42 28.39 35.04 -26 1.35
Table F.4.2 Statistical analysis of the corrected data
Edgerton Run - 2015 RMSE 8.14
Fractional Bias -0.01
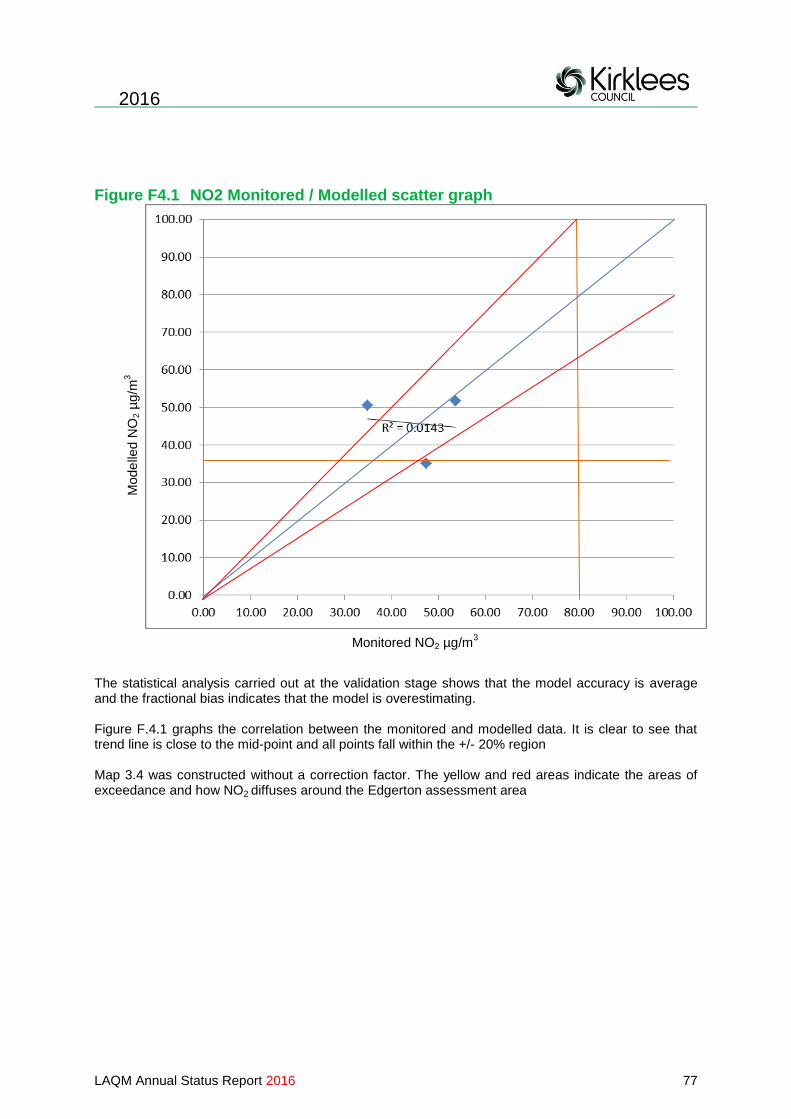
2016
LAQM Annual Status Report 2016 77
Figure F4.1 NO2 Monitored / Modelled scatter graph
The statistical analysis carried out at the validation stage shows that the model accuracy is average and the fractional bias indicates that the model is overestimating.
Figure F.4.1 graphs the correlation between the monitored and modelled data. It is clear to see that trend line is close to the mid-point and all points fall within the +/- 20% region Map 3.4 was constructed without a correction factor. The yellow and red areas indicate the areas of exceedance and how NO2 diffuses around the Edgerton assessment area
Mode
lled N
O2 µ
g/m
3
Monitored NO2 µg/m3

2016
LAQM Annual Status Report 2016 78
Map 3.4 Edgerton AQMA
Key
Residential Property
AQMA
NO2 Levels:
>60µg/m3
50 - 60µg/m3
45 - 50µg/m3
40 - 45µg/m3

2016
LAQM Annual Status Report 2016 79
F.5 Heckmondwike Detailed Assessment
Kirklees Council has modelled the annual mean NOx for 2015 in the area of Heckmondwike. This modelling was conducted to determine the boundaries of the AQMA.
Kirklees Council has used Atmospheric Dispersion Modelling System for Urban areas (ADMS Urban) to create this model and validated it against the 2015 automatic monitoring data. Meteorological Data for the model has been taken from Huddersfield Civic 3 Weather Station. The weather data for 2004 has been selected as the weather patterns in that year are representative of the usual weather conditions in the district. The Traffic Figures have been obtained from the Department of Transport for 2015 count points in close proximity to the assessment areas. Traffic counts and average speeds were entered into the Emission Factor Toolkit 2014 Background figures for the model have been taken from the 2015 based background maps (DEFRA). The topography and road layout was obtained from Kirklees Council GIS data and ordinance survey records.
Kirklees conducted a statistical procedure as set out in TG(09) to determine the model uncertainty and performance. Table F.5.1 indicates the results at diffusion tube sites and the results of the statistical analysis are contained within Table F.5.2 and Figure F5.1.
Table F.5.1 Results of Run at diffusion tube sites and statistical analysis of model
Tube result
(µg/m3)
Modelled increment
NOx
(µg/m3)
Calculated NO2
from NOx
(µg/m3)
% Difference
Correction Factor
Tube 33 33.75 44.12 41.38 23 0.82
Tube 34 33.21 44.64 41.58 25 0.80
Tube 35 38.86 37.67 38.85 0 1.00
Tube 48 43.82 25.33 33.74 -23 1.30
Table F.5.2 Statistical analysis of the corrected data
Heckomndwike Run - 2015 RMSE 5.73
Fractional Bias -0.04
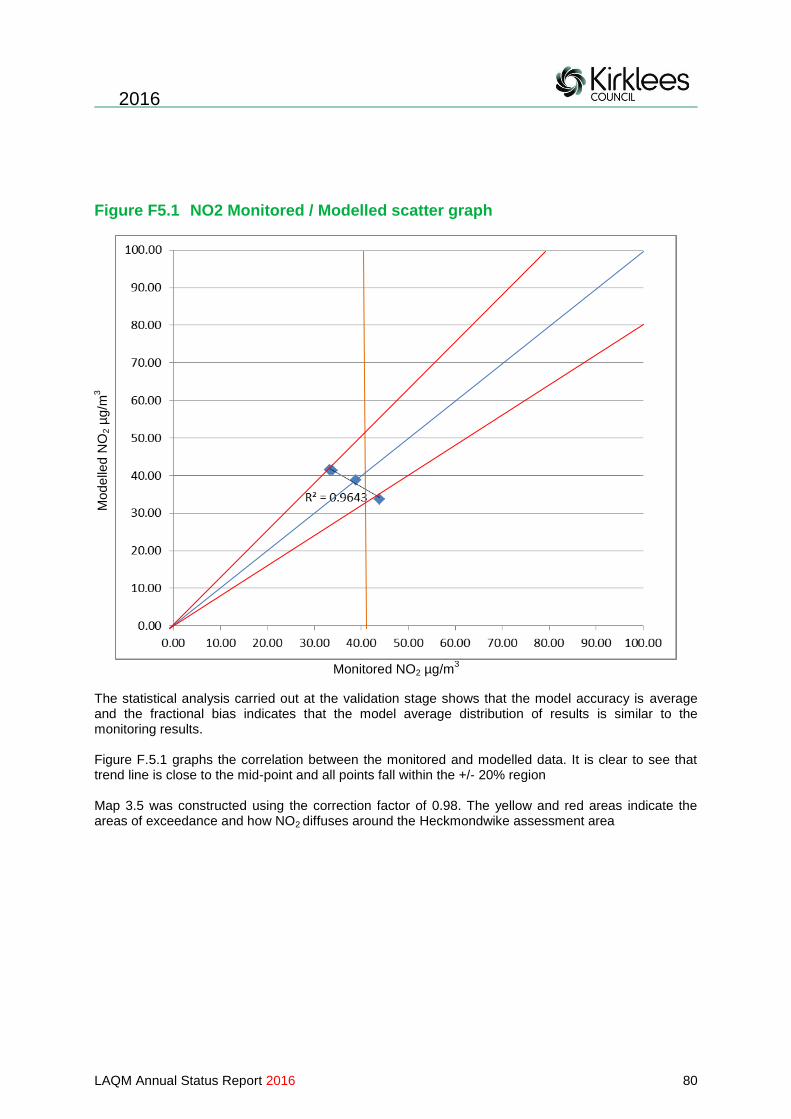
2016
LAQM Annual Status Report 2016 80
Figure F5.1 NO2 Monitored / Modelled scatter graph
The statistical analysis carried out at the validation stage shows that the model accuracy is average and the fractional bias indicates that the model average distribution of results is similar to the monitoring results.
Figure F.5.1 graphs the correlation between the monitored and modelled data. It is clear to see that trend line is close to the mid-point and all points fall within the +/- 20% region Map 3.5 was constructed using the correction factor of 0.98. The yellow and red areas indicate the areas of exceedance and how NO2 diffuses around the Heckmondwike assessment area
Mode
lled N
O2 µ
g/m
3
Monitored NO2 µg/m3

2016
LAQM Annual Status Report 2016 81
Map 3.5 Heckmondwike AQMA
Key
Residential Property
AQMA
NO2 Levels:
>60µg/m3
50 - 60µg/m3
45 - 50µg/m3
40 - 45µg/m3
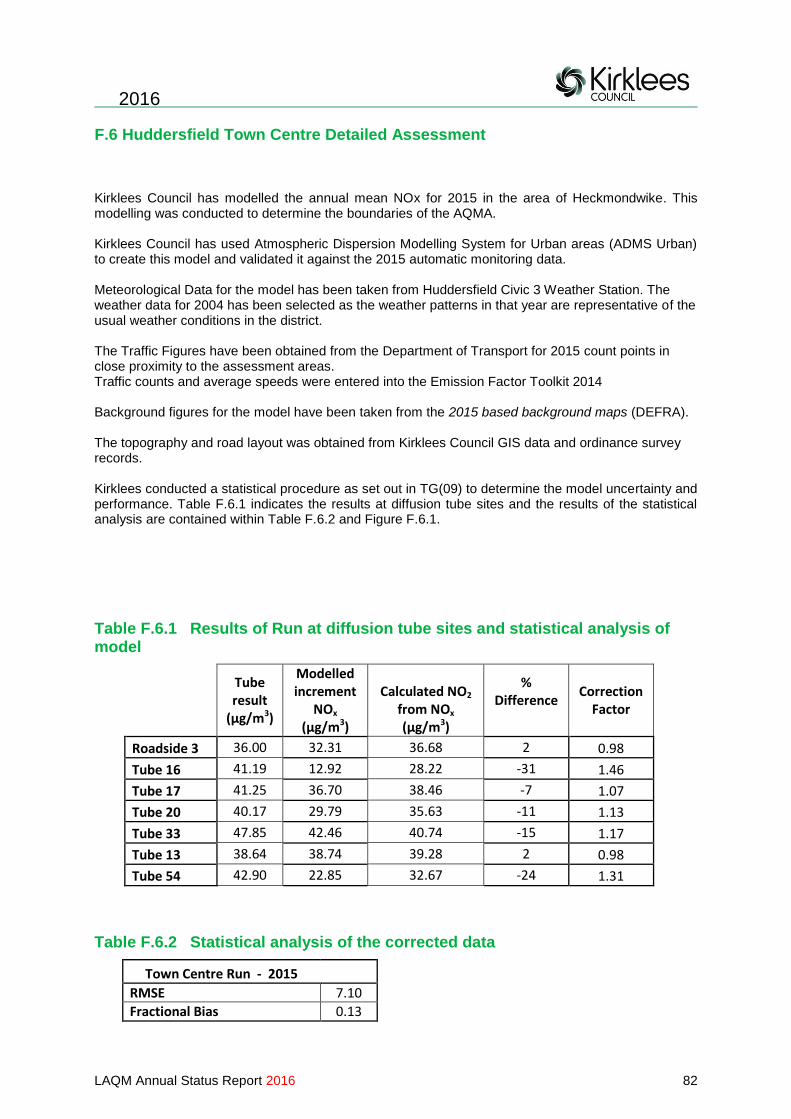
2016
LAQM Annual Status Report 2016 82
F.6 Huddersfield Town Centre Detailed Assessment
Kirklees Council has modelled the annual mean NOx for 2015 in the area of Heckmondwike. This modelling was conducted to determine the boundaries of the AQMA.
Kirklees Council has used Atmospheric Dispersion Modelling System for Urban areas (ADMS Urban) to create this model and validated it against the 2015 automatic monitoring data. Meteorological Data for the model has been taken from Huddersfield Civic 3 Weather Station. The weather data for 2004 has been selected as the weather patterns in that year are representative of the usual weather conditions in the district. The Traffic Figures have been obtained from the Department of Transport for 2015 count points in close proximity to the assessment areas. Traffic counts and average speeds were entered into the Emission Factor Toolkit 2014 Background figures for the model have been taken from the 2015 based background maps (DEFRA). The topography and road layout was obtained from Kirklees Council GIS data and ordinance survey records.
Kirklees conducted a statistical procedure as set out in TG(09) to determine the model uncertainty and performance. Table F.6.1 indicates the results at diffusion tube sites and the results of the statistical analysis are contained within Table F.6.2 and Figure F.6.1.
Table F.6.1 Results of Run at diffusion tube sites and statistical analysis of model
Tube result
(µg/m3)
Modelled increment
NOx
(µg/m3)
Calculated NO2
from NOx
(µg/m3)
% Difference
Correction Factor
Roadside 3 36.00 32.31 36.68 2 0.98
Tube 16 41.19 12.92 28.22 -31 1.46
Tube 17 41.25 36.70 38.46 -7 1.07
Tube 20 40.17 29.79 35.63 -11 1.13
Tube 33 47.85 42.46 40.74 -15 1.17
Tube 13 38.64 38.74 39.28 2 0.98
Tube 54 42.90 22.85 32.67 -24 1.31
Table F.6.2 Statistical analysis of the corrected data
Town Centre Run - 2015 RMSE 7.10
Fractional Bias 0.13

2016
LAQM Annual Status Report 2016 83
Figure F.6.1 NO2 Monitored / Modelled scatter graph
The statistical analysis carried out at the validation stage shows that the model accuracy is average and the fractional bias indicates that the model average distribution of results is similar to the monitoring results.
Figure F.6.1 graphs the correlation between the monitored and modelled data. It is clear to see that trend line is close to the mid-point and all points fall within the +/- 20% region Map 3.6 was constructed using the correction factor of 0.95. The yellow and red areas indicate the areas of exceedance and how NO2 diffuses around the Huddersfield Town Centre assessment area
Mode
lled N
O2 µ
g/m
3
Monitored NO2 µg/m3
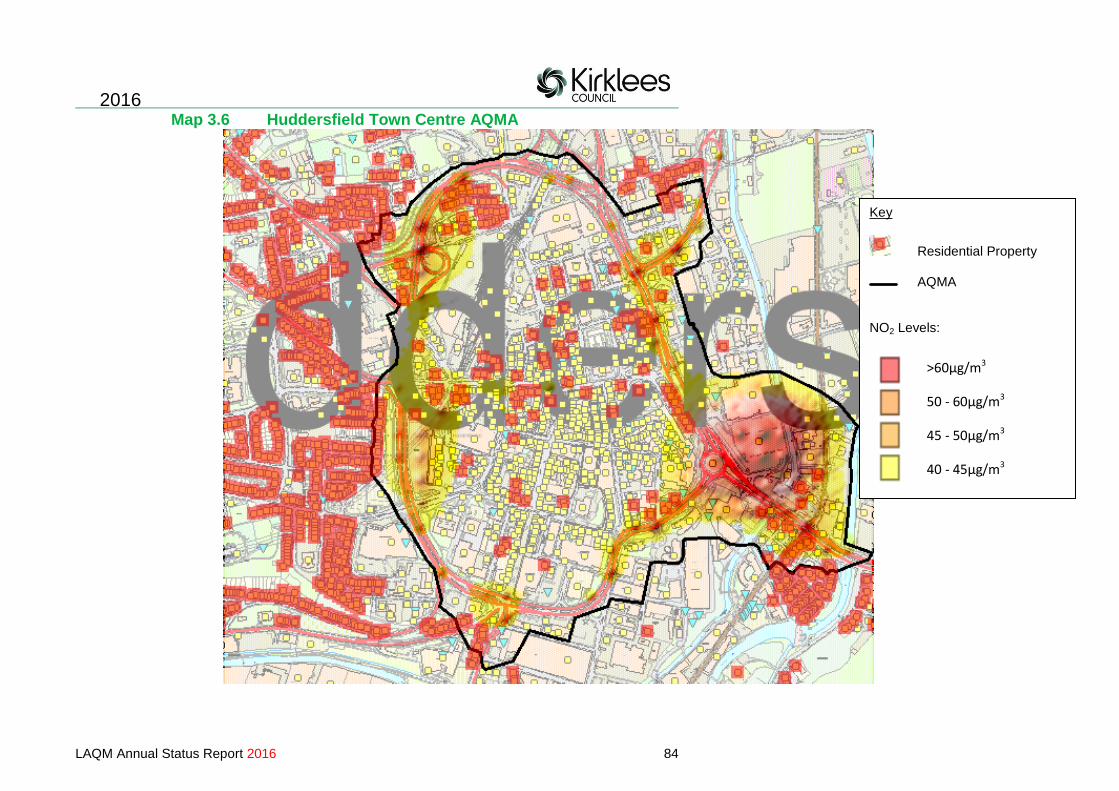
2016
LAQM Annual Status Report 2016 84
Map 3.6 Huddersfield Town Centre AQMA
Key
Residential Property
AQMA
NO2 Levels:
>60µg/m3
50 - 60µg/m3
45 - 50µg/m3
40 - 45µg/m3

2016
LAQM Annual Status Report 2016 85
F.7 Outlane Detailed Assessment
Kirklees Council has modelled the annual mean NOx for 2015 in the area of Outlane. This modelling was conducted to determine the boundaries of the AQMA.
Kirklees Council has used Atmospheric Dispersion Modelling System for Urban areas (ADMS Urban) to create this model and validated it against the 2015 automatic monitoring data. Meteorological Data for the model has been taken from Huddersfield Civic 3 Weather Station. The weather data for 2004 has been selected as the weather patterns in that year are representative of the usual weather conditions in the district. The Traffic Figures have been obtained from the Department of Transport for 2015 count points in close proximity to the assessment areas. Traffic counts and average speeds were entered into the Emission Factor Toolkit 2014 Background figures for the model have been taken from the 2015 based background maps (DEFRA). The topography and road layout was obtained from Kirklees Council GIS data and ordinance survey records.
Kirklees conducted a statistical procedure as set out in TG(09) to determine the model uncertainty and performance. Table F.7.1 indicates the results at diffusion tube sites and the results of the statistical analysis are contained within Table F.7.2 and Figure F.7.1.
Table F.7.1 Results of Run at diffusion tube sites and statistical analysis of model
Tube result
(µg/m3)
Modelled increment
NOx
(µg/m3)
Calculated NO2
from NOx
(µg/m3)
% Difference
Correction Factor
Tube 47 54.16 226.83 87.75 62 0.62
Table F.7.2 Statistical analysis of the corrected data
Outlane Run - 2015 RMSE 16.80
Fractional Bias -0.47
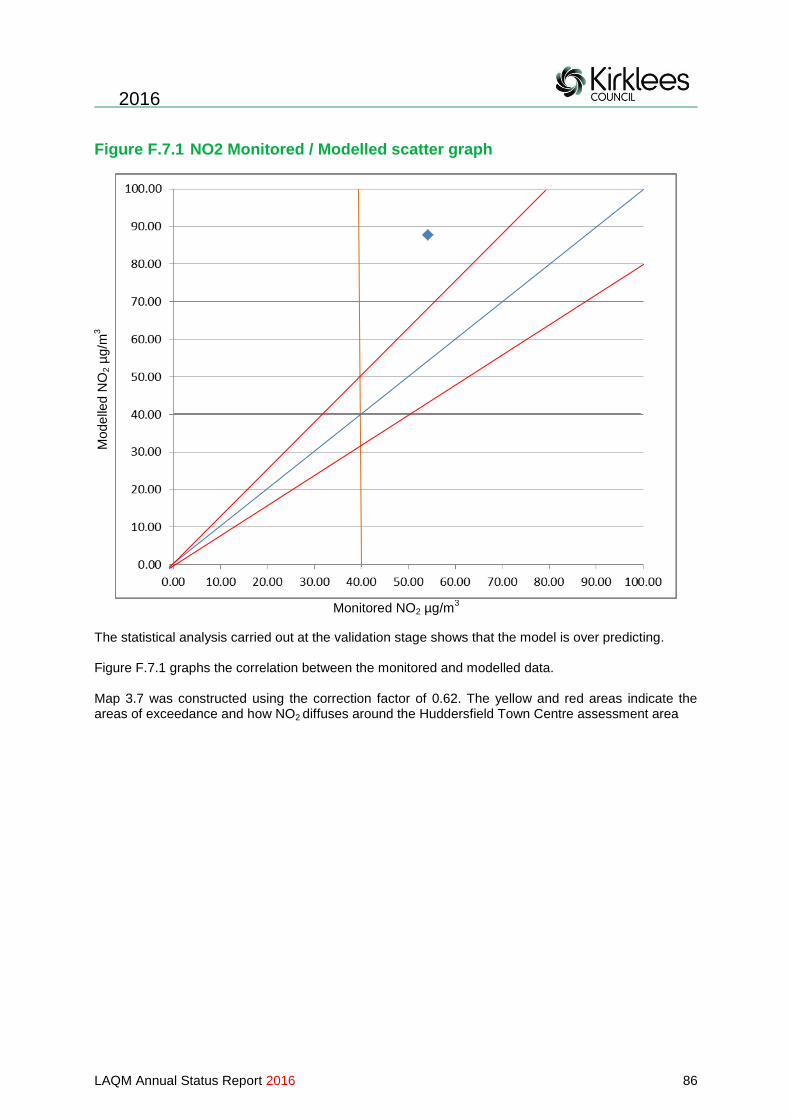
2016
LAQM Annual Status Report 2016 86
Figure F.7.1 NO2 Monitored / Modelled scatter graph
The statistical analysis carried out at the validation stage shows that the model is over predicting.
Figure F.7.1 graphs the correlation between the monitored and modelled data. Map 3.7 was constructed using the correction factor of 0.62. The yellow and red areas indicate the areas of exceedance and how NO2 diffuses around the Huddersfield Town Centre assessment area
Mode
lled N
O2 µ
g/m
3
Monitored NO2 µg/m3
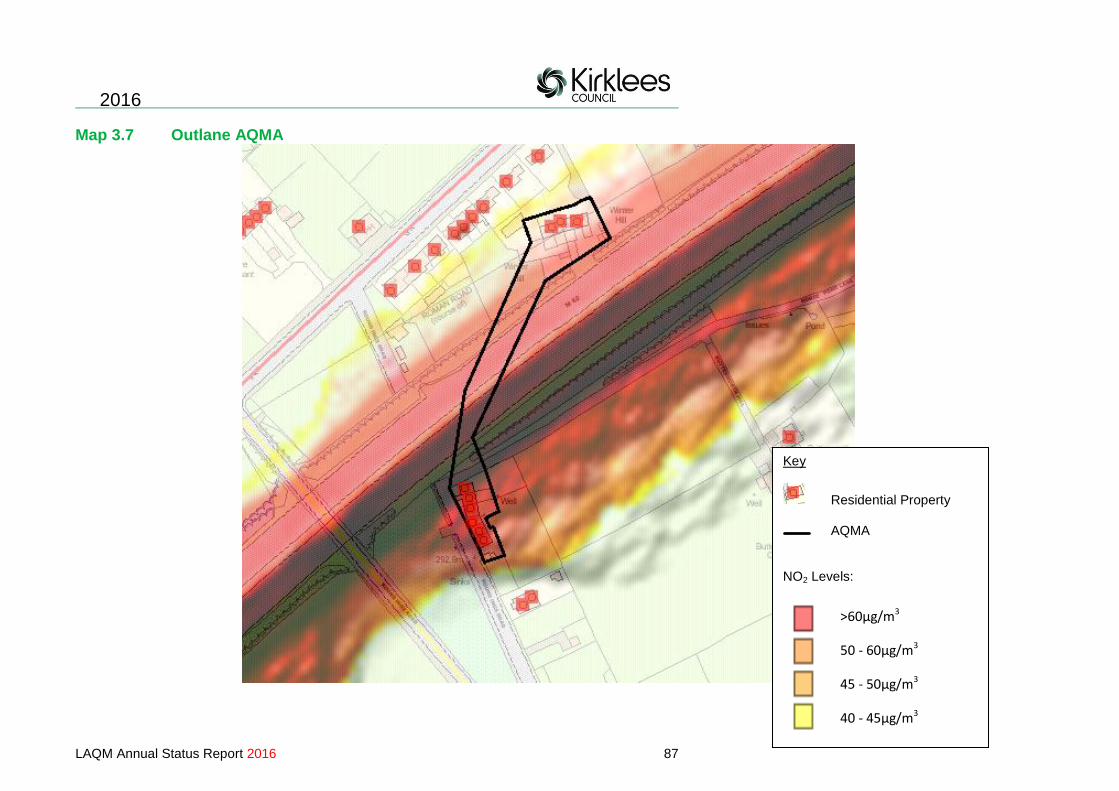
2016
LAQM Annual Status Report 2016 87
Map 3.7 Outlane AQMA
Key
Residential Property
AQMA
NO2 Levels:
>60µg/m3
50 - 60µg/m3
45 - 50µg/m3
40 - 45µg/m3

2016
LAQM Annual Status Report 2016 88
F.8 AQMA1 Detailed Assessment
Kirklees Council has modelled the annual mean NOx for 2015 in the area of Outlane. This modelling was conducted to determine the boundaries of the AQMA.
Kirklees Council has used Atmospheric Dispersion Modelling System for Urban areas (ADMS Urban) to create this model and validated it against the 2015 automatic monitoring data. Meteorological Data for the model has been taken from Huddersfield Civic 3 Weather Station. The weather data for 2004 has been selected as the weather patterns in that year are representative of the usual weather conditions in the district. The Traffic Figures have been obtained from the Department of Transport for 2015 count points in close proximity to the assessment areas. Traffic counts and average speeds were entered into the Emission Factor Toolkit 2014 Background figures for the model have been taken from the 2015 based background maps (DEFRA). The topography and road layout was obtained from Kirklees Council GIS data and ordinance survey records.
Kirklees conducted a statistical procedure as set out in TG(09) to determine the model uncertainty and performance. Table F.8.1 indicates the results at diffusion tube sites and the results of the statistical analysis are contained within Table F.8.2 and Figure F.8.1.
Table F.8.1 Results of Run at diffusion tube sites and statistical analysis of model
Tube result
(µg/m3)
Modelled increment
NOx
(µg/m3)
Calculated NO2
from NOx
(µg/m3)
% Difference
Correction Factor
Roadside 3 36.00 32.31 36.68 2 0.98
Tube 16 41.19 12.92 28.22 -31 1.46
Tube 17 41.25 36.70 38.46 -7 1.07
Tube 20 40.17 29.79 35.63 -11 1.13
Tube 33 47.85 42.46 40.74 -15 1.17
Tube 13 38.64 38.74 39.28 2 0.98
Tube 54 42.90 22.85 32.67 -24 1.31
Table F.8.2 Statistical analysis of the corrected data
AQMA 1 Run - 2015 RMSE 7.10
Fractional Bias 0.13

2016
LAQM Annual Status Report 2016 89
Figure F.8.1 NO2 Monitored / Modelled scatter graph
The statistical analysis carried out at the validation stage shows that the model accuracy is good and the fractional bias indicates that the model average distribution of results is similar to the monitoring results.
Figure F.8.1 graphs the correlation between the monitored and modelled data. It is clear to see that trend line is close to the mid-point and all points fall within the +/- 20% region Map 3.8 was constructed using the correction factor of 0.98. The Red line denotes the previous AQMA and the purple line indicates the new AQMA proposal in accordance with recent modelling study.
Mode
lled N
O2 µ
g/m
3
Monitored NO2 µg/m3
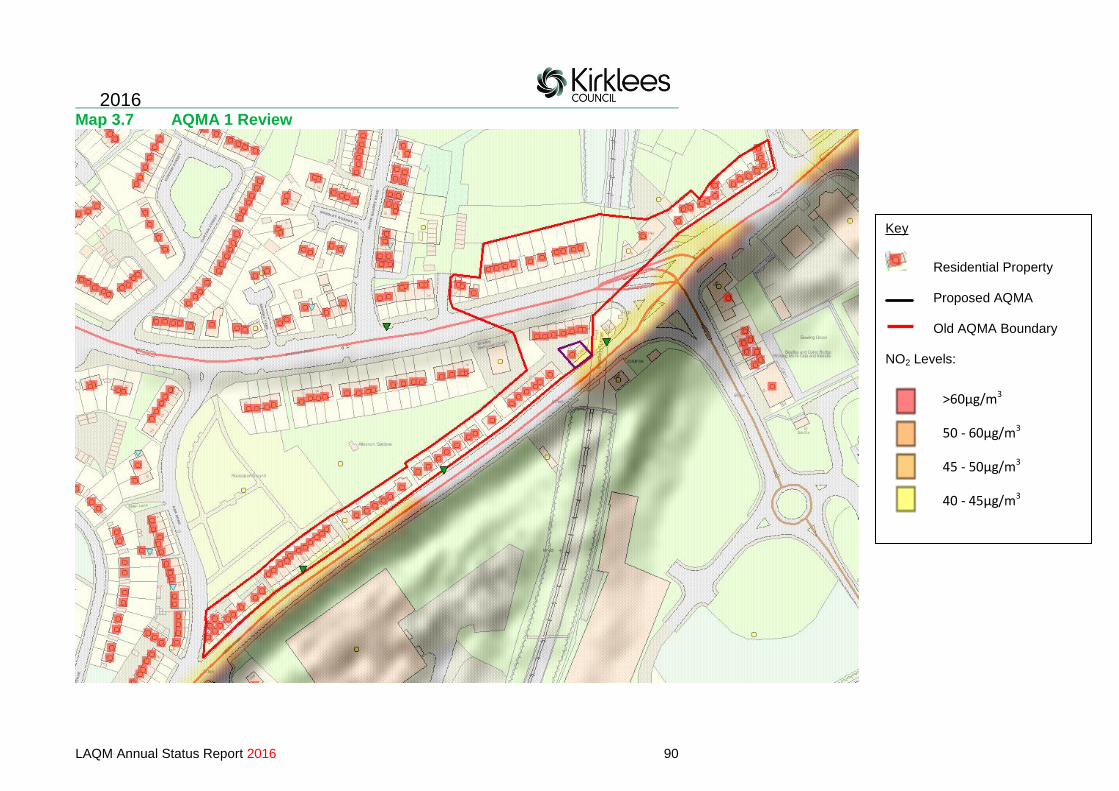
2016
LAQM Annual Status Report 2016 90
Map 3.7 AQMA 1 Review
Key
Residential Property
Proposed AQMA
Old AQMA Boundary NO2 Levels:
>60µg/m3
50 - 60µg/m3
45 - 50µg/m3
40 - 45µg/m3

2016
LAQM Annual Status Report 2016 91
2016
LAQM Annual Status Report 2016 92
Glossary of Terms
Abbreviation Description
AQAP Air Quality Action Plan - A detailed description of measures, outcomes, achievement dates and implementation methods, showing how the local authority intends to achieve air quality limit values’
AQMA Air Quality Management Area – An area where air pollutant concentrations exceed / are likely to exceed the relevant air quality objectives. AQMAs are declared for specific pollutants and objectives
ASR Air quality Annual Status Report
Defra Department for Environment, Food and Rural Affairs
DMRB Design Manual for Roads and Bridges – Air quality screening tool produced by Highways England
EU European Union
FDMS Filter Dynamics Measurement System
LAQM Local Air Quality Management
NO2 Nitrogen Dioxide
NOx Nitrogen Oxides
PM10 Airborne particulate matter with an aerodynamic diameter of 10µm (micrometres or microns) or less
PM2.5 Airborne particulate matter with an aerodynamic diameter of 2.5µm or less
QA/QC Quality Assurance and Quality Control
SO2 Sulphur Dioxide
… …
2016
LAQM Annual Status Report 2016 93
References
Part IV EnvironmentAct1995. (c.25) London: HMSO Local Air Quality Management Technical Guidance LAQM TG (16) DEFRA 2016 Air Quality (England) Regulations 2000. SI 2000/928, London: HMSO Air Quality (England) (Amendment) Regulations 2002. SI 2002/3043, London: HMSO
Paul Bailey - Environmental Health Officer for Air Quality
(Kirklees Environmental Health)
Alex Garry – Environmental Health Officer for PPC
(Kirklees Environmental Health)
Health and Safety Laboratories
(WASP Tubes)
National Physical Laboratories Management Ltd
(Intercomparison Scheme)