klöckner & co se - analysts' and investors' conference fy 2016
TRANSCRIPT

FY 2016 Results
Analysts’ and Investors’ Conference
March 1, 2017
Gisbert Rühl | CEOMarcus A. Ketter | CFOKarsten Lork | Member of the Management BoardBill Partalis | Member of the Management Board

No.2
DisclaimerThis presentation contains forward-looking statements which reflect the current views of the management of Klöckner & Co SE with respect to future events. They generally are designated by the words “expect”, “assume”, “presume”, “intend”, “estimate”, “strive for”, “aim for”, “plan”, “will”, “endeavor”, “outlook” and comparable expressions and generally contain information that relates to expectations or goals for economic conditions, sales proceeds or other yardsticks for the success of the enterprise. Forward-looking statements are based on currently valid plans, estimates and expectations. You therefore should view them with caution. Such statements are subject to risks and factors of uncertainty, most of which are difficult to assess and which generally are outside of the control of Klöckner & Co SE. The relevant factors include the effects of significant strategic and operational initiatives, including the acquisition or disposition of companies. If these or other risks and factors of uncertainty occur or if the assumptions on which the statements are based turn out to be incorrect, the actual results of Klöckner & Co SE can deviate significantly from those that are expressed or implied in these statements. Klöckner & Co SE cannot give any guarantee that the expectations or goals will be attained. Klöckner & Co SE – notwithstanding existing obligations under laws pertaining to capital markets – rejects any responsibility for updating the forward-looking statements through taking into consideration new information or future events or other things.
In addition to the key data prepared in accordance with International Financial Reporting Standards, Klöckner & Co SE is presenting non-GAAP key data such as EBITDA, EBIT, Net Working Capital and net financial liabilities that are not a component of the accountingregulations. These key data are to be viewed as supplementary to, but not as a substitute for data prepared in accordance with International Financial Reporting Standards. Non-GAAP key data are not subject to IFRS or any other generally applicable accounting regulations. Other companies may base these concepts upon other definitions.
FY 2016 Results | Analysts’ and Investors’ Conference | Klöckner & Co SE

No.3
1. Highlights and update on strategy2. Financials3. Outlook4. Appendix
Agenda
FY 2016 Results | Analysts’ and Investors’ Conference | Klöckner & Co SE

No.4
Highlights FY 201601
• Sales decreased by 11.1% to €5.7bn mainly due to lower price level and site closures in Europe as part of the finished restructuring program KCO WIN+
• Despite lower sales and volumes gross profit went up from €1,237m to €1,315m supported by increasing prices over the course of the year and strategic measures
• Consequently gross profit margin increased to 22.9% after 19.2% in FY 2015
• Operating result (EBITDA) of €196m slightly above guidance range of €180m to €190m
• Sales share via digital channels continuously increased from 9% in Q1 to 12% in Q4 2016
• Share of sales with higher value added products and services up from 39% to 46%
• Successfully finished KCO WIN+ program with incremental EBITDA contribution of €28m in 2016
• Organization for “One Europe” to integrate European distribution activities in place since beginning of 2017
• Well on track to strongly improve EBITDA yoy and qoq in Q1 2017 to between €65m and €75m
• EBITDA for FY 2017 expected to increase slightly
FY 2016 Results | Analysts’ and Investors’ Conference | Klöckner & Co SE
No.5
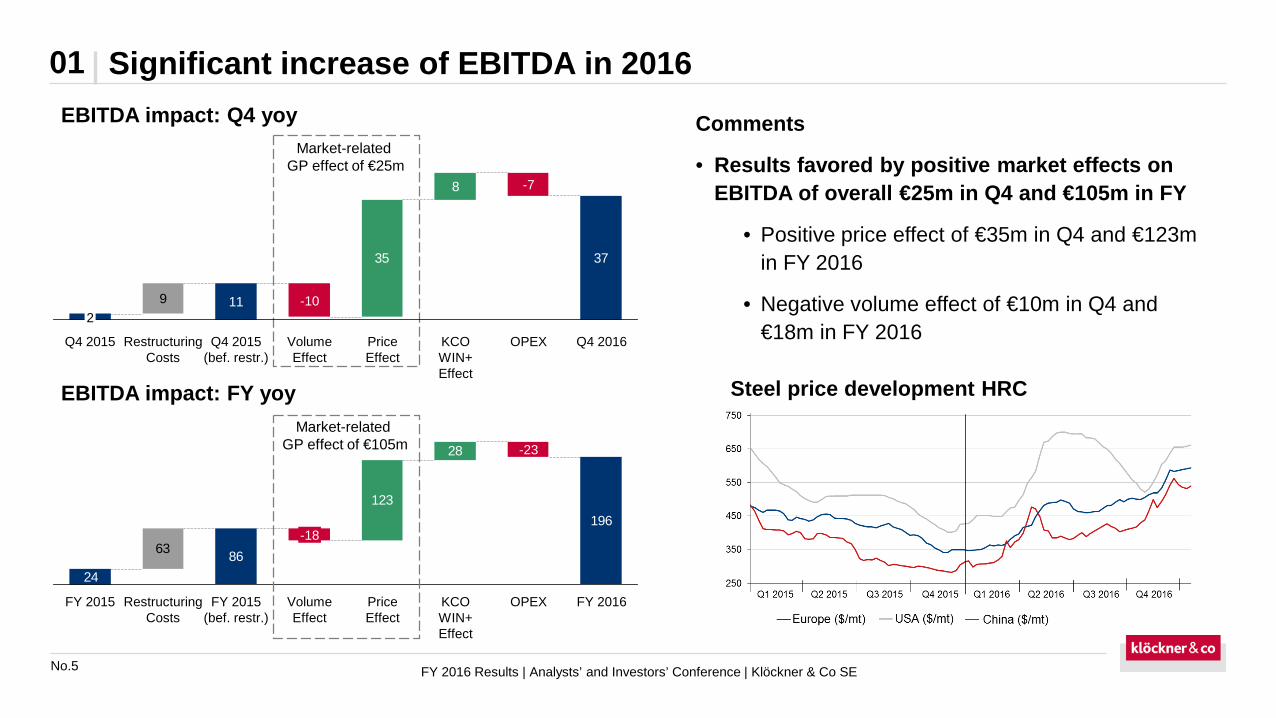
Significant increase of EBITDA in 201601EBITDA impact: Q4 yoy
Market-relatedGP effect of €25m
Comments
• Results favored by positive market effects on EBITDA of overall €25m in Q4 and €105m in FY
• Positive price effect of €35m in Q4 and €123m in FY 2016
• Negative volume effect of €10m in Q4 and €18m in FY 2016
11
35
8
37
92
OPEX
-7
KCO WIN+ Effect
PriceEffect
Volume Effect
-10
Q4 2015 (bef. restr.)
Restructuring Costs
Q4 2015 Q4 2016
86
123
28
196
24
63
FY 2016OPEX
-23
KCO WIN+ Effect
Price Effect
Volume Effect
-18
FY 2015(bef. restr.)
Restructuring Costs
FY 2015
Market-relatedGP effect of €105m
EBITDA impact: FY yoy Steel price development HRC
FY 2016 Results | Analysts’ and Investors’ Conference | Klöckner & Co SE

No.6
01 Klöckner & Co strategy
FY 2016 Results | Analysts’ and Investors’ Conference | Klöckner & Co SE
G R O W T H A N D O P T I M I Z A T I O N
D I F F E R E N T I A T I O N
D I G I T A L I Z A T I O N
K L Ö C K N E R & C O 2 0 2 0
P R O D U C T S A N D S E R V I C E S
O P E R A T I O N S
E X T E R N A L & I N T E R N A L G R O W T H
Digitalization of the supply chain and development of a industry platform
Accelerated expansion of higher value-added products and services
One Europe and further optimization
External growth with focus on higher value-added business, internal growth with focus on the US market

No.7
01 Digitalization strategy futher advanced
FY 2016 Results | Analysts’ and Investors’ Conference | Klöckner & Co SE
• Service platform Kloeckner Connect as central access point for onlineshops, contract portals and order transparency tools very well received by customers
• Transition from service platform to industry platform starting this year
• New office space in Berlin rented for kloeckner.i to enable further growth• Staff of 40 digital experts in the fields of innovation & product, software
development, digital marketing & sales and business intelligence & analytics
• Innovation partnership with arago, a pioneer in artificial intelligence• Cognizant, a leading provider of information technology, selected as strategic
partner for IT services to support digitalization of operations across Europe
Internal organization
Digital platforms
• Sales share via digital channels gradually increased to 12% in Q4 2016• Margins* of onlineshop sales on total cost basis in Germany twice as high and
on marginal cost basis 8x higher • Further acceleration of online sales growth expected through integration of third
parties with additional products and customers through OCI interfaces
New digital partnerships
Online sales
*Related to the German onlineshop and can not be projected on the full digital-generated sales

No.8
Comprehensive roll out of service platform and digital tools01
FY 2016 Results | Analysts’ and Investors’ Conference | Klöckner & Co SE
Contract portal
launched Validation for implementation in 2017
Order transparencytool
launched Validation for implementation in 2017
Onlineshop
launched Validation for implementation in 2017
Service platform
launched Validation for implementation in 2017

No.9
Vertical industry platform as third step of digitalization strategy01
FY 2016 Results | Analysts’ and Investors’ Conference | Klöckner & Co SE
Steel Other materials andcommodities
Building materialsChemicals
I N D U S T R y -P L A T F O R M
Overlap
Amazon BusinessAlibaba Group
ContorionMercateo
Vertical industry specific platforms
Horizontal cross-
industryplatforms
Competition
Com
plem
enta
rypr
oduc
ts
Com
plem
enta
rypr
oduc
ts

No.10
Higher value-added strategy further advanced01
FY 2016 Results | Analysts’ and Investors’ Conference | Klöckner & Co SE
>20%
>30%<30%
>20%
T A R G E T 2 0 1 8
• Further acquisitions in the attractive fabrication segment considered• Fabrication as next strategic step – following expansion of service center
activities – offering higher margins and customer loyalty
• American Fabricators as blueprint for further acquisitions
• Enlargement of 3D Tube Laser Centers in the UK and Germany• Laser number 4,5 and 6 put into operation in Dudley/UK
• Third 3D-Laser in Velten/Germany in ramp-up phase
• Expansion of business with aluminum via Becker Stahl-Service/Germany• Aluminum as key growth material for the automotive industry
• Slitting line with start of operation already this year
• Completion of the entire plant including a complementary cut-to-length line scheduled for 2018
18% Higher value-add
products
28%Higher value-add services
31% Standard products
23% Conventional
services
A C T U A L 2 0 1 6
Higher value-add products and
services:Expansion from 46% in 2016 to more than 50%

No.11
Integration of European distribution activities to increase profitability01
FY 2016 Results | Analysts’ and Investors’ Conference | Klöckner & Co SE
2017
2018 €15mTotal annual impact of around €30m from 2019 onwards
2019 €5m
€10m
Centralized organization will facilitate:
• One CEO and uniform management for both cross border regions in Europe
• A Europe-wide cross functional approach for higher value-add, digitalization, procurement, finance and logistics
Organizational structure
• Additional synergies in procurement
• Improved best practice sharing
• Centrally steered implementation of digitalization and higher value-add strategy
• Cross-border optimized logistics
Region 1: Austria, Belgium, Germany and the Netherlands
Region 2: France and UK

No.12
1. Highlights and update on strategy2. Financials3. Outlook4. Appendix
Agenda
FY 2016 Results | Analysts’ and Investors’ Conference | Klöckner & Co SE

No.13
Shipments and sales02
• Shipments down yoy due to exit of low marginbusiness due to restructuring
• Qoq seasonal decrease in Europe and weakerdemand for industrial products in the US
• Sales decreased yoy and qoq signifcantly lesspronounced than shipments due to higher averagesales prices
Q2 2016
1,643
Q1 2016
1,556
Q4 2015
1,535
Q3 2015
1,636
Q2 2015
Q1 2015
1,661
Q4 2014
1,555
1,645
Q3 2016
1,500
Q4 2016
1,450 1,397
Q3 2016
1,430
Q2 2016
Q4 2016
1,517
Q1 2016
Q4 2014
1,577
1,456
Q3 2015
1,597
Q2 2015
1,693
Q4 2015
1,386
Q1 2015
1,697
-5.5%
-3.4%
-4.0%
-2.3%
Shipments (Tto) Sales (€m)
FY 2016 Results | Analysts’ and Investors’ Conference | Klöckner & Co SE

No.14
Gross profit and EBITDA02
* Before restructuring cost.** 2014 amounts restated due to the initial application of IFRIC 21 (Levies).
7172
11
30
10
33
Q4 2016
37
Q3 2016
Q2 2016
Q1 2016
16
Q4 2015
Q3 2015
Q2 2015
36
Q1 2015
Q4 2014
1.20.71.92.1
0.6
2.12.6
5.04.8
325
Q1 2015
310
Q4 2014
297
Q3 2015
311
Q2 2015
362
Q1 2016
304
Q4 2015
Q3 2016
329
Q2 2016
309
Q4 2016
319
20.4
19.419.2
18.2
19.6
22.0
23.822.823.0
• Margin stabilized with ~ 23% well abovethe 20 percent mark of Q4 2015
• Substantial improvement yoy
• EBITDA in Q4 improved yoy by €26m, qoq EBITDA came down due to usual seasonal pattern
• EBITDA margin in Q4 up by 1.9p% yoy to 2.6%
Gross profit* (€m) / Gross margin* (%) EBITDA*,** (€m) / EBITDA margin*,** (%)
FY 2016 Results | Analysts’ and Investors’ Conference | Klöckner & Co SE

No.15
Segment performance FY201602
• Europe
• EBITDA up from €69m before restructuring by €82m to €151m
• Significant positive price effect (€53m)
• KCO WIN+ contributes €24m to EBITDA improvement
• OPEX includes incremental non-recurring gains on sale of assets of €7m
Europe (€m)
Americas (€m)
35 37
7074
YTD 2016 Actual
OPEX
-11
KCO WIN+ Effect
4
Price Effect
Volume Effect
-26
YTD 2015 Actual(before
restruct.)
Restruct.2015
2
YTD 2015 Actual
(reported)
55 69
53
24
151
14
Volume Effect
8
YTD 2015 Actual(before
restruct.)
Restruct.2015
YTD 2015 Actual
(reported)
YTD 2016 Actual
OPEX
-3
KCO WIN+ Effect
Price Effect
• Americas
• EBITDA up from €37m before restructuring by €37m to €74m
• Negative volume effect due to weaker demand forindustrial products and also due to the sale of pipebusiness in Q2 2016
• Even stronger positive price effect (€70m) than in Europe
Comments
FY 2016 Results | Analysts’ and Investors’ Conference | Klöckner & Co SE

No.16
Cash flow and net debt development02
36
• Despite improving business only moderate NWC build-up of €22m
• Operating cash flow includes €32m pay-out for restructuring
• “Other” includes changes in other provisions and other operating assets/liabilities as well as non-cash items
CommentsCash flow reconciliation FY2016 (€m)
• Net financial debt reported skewed due to prolongation of f/x swaps (€67m) and translation effects (€5m)
Net financial debt 12/2016 vs. 12/2015 (€m)
-4
21
73
196-32
Taxes
-24
Interest
-25
Change in NWC
Other
-7
Disposal gains
-13
Cash-out restr.
Free cash
flow 12M 2016
Capex (net)
-52
Cash flow from operating activities
-22
EBITDA 12M 2016
18
73
F/X, Swaps
-72
Capex (net)
-52
CF from operating activities
Net debt 12.2015
385
Other
-5
Finance Leases
-21
Equity Component Convertible
Net debt 12.2016
444
FY 2016 Results | Analysts’ and Investors’ Conference | Klöckner & Co SE

No.17
Maturity profile Dec. 2016 – well balanced & diversified funding portfolio 02
FY 2016 Results | Analysts’ and Investors’ Conference | Klöckner & Co SE
Facility Committed (€m)Drawn amount (€m, IFRS*)
FY 2016 FY 2015
Syndicated Loan 360 0 0
ABS Europe 300 115 91
ABS/ABL USA 522 218 184
Promissory Notes - - 135
Convertible 2010 - - 25
Convertible 2016 1) 148 131 -
Bilateral Facilities 2) 318 114 115
Total Debt 1,648 578 550
Cash 134 165
Net Debt 444 385
€m FY 2016
Adjusted equity 1,118
Net debt 444
Gearing 3) 40%
Maturity profile of committed facilities & drawn amounts (€m)
Left side: committed facilities Right side: drawn amounts (nominal amounts)
ABS/ABL USA BilateralsSyndicated Loan ABS Europe
* Including interest accrued, excluding deferred transaction costs
1) Principal €148m, equity component €18m at issuance (08.09.2016). 2) Including finance lease.3) Net debt/Equity attributable to shareholders of Klöckner & Co SE less goodwill from business
combinations subsequent to May 23rd, 2013.
14855
522
30306618
43
248
1
1
15
15
18
367
218
148
130
671
115
620
300
30573
2017 2018 2019 2020 2021 Thereafter
Convertible Bond

No.18
1. Highlights and update on strategy2. Financials3. Outlook4. Appendix
Agenda
FY 2016 Results | Analysts’ and Investors’ Conference | Klöckner & Co SE

No.19
Shipbuilding
Segment specific business outlook 201703
Energy industry
Real steeldemand
Europe
~ 1-2%
Construction industry
Manufacturing, machinery and mechanical engineering, etc.
Automotive industry
US
~ 3-4%
FY 2016 Results | Analysts’ and Investors’ Conference | Klöckner & Co SE

No.20
Outlook 03
Q1 2017• Seasonally higher sales • EBITDA anticipated to be significantly up to between €65m and €75m supported by elevated steel price
level
FY 2017• Higher sales anticipated due to better demand and on average higher price level• EBITDA expected to rise slightly compared to the 2016 figure of €196m
FY 2016 Results | Analysts’ and Investors’ Conference | Klöckner & Co SE

No.21
1. Highlights and update on strategy2. Financials3. Outlook4. Appendix
Agenda
FY 2016 Results | Analysts’ and Investors’ Conference | Klöckner & Co SE

No.22
Quarterly and FY results04
(€m) Q42016
Q32016
Q22016
Q12016
Q42015
Q32015
Q22015
Q12015
Q42014*
Q32014*
FY 2016
FY 2015
FY 2014
FY 2013
Shipments (Tto) 1,450 1,500 1,643 1,556 1,535 1,636 1,645 1,661 1,555 1,690 6,149 6,476 6,598 6,445
Sales 1,397 1,430 1,517 1,386 1,456 1,597 1,693 1,697 1,577 1,675 5,730 6,444 6,504 6,378
Gross profit 319 329 362 304 297 311 320 310 309 325 1,315 1,237 1,261 1,188
% margin 22.8 23.0 23.8 22.0 20.4 19.4 18.9 18.2 19.6 19.4 22.9 19.2 19.4 18.6
EBITDA rep. 37 71 72 16 2 28 -17 10 33 61 196 24 191 124
% margin 2.6 5.0 4.8 1.2 0.2 1.8 -1.0 0.6 2.1 3.6 3.4 0.4 2.9 2.0
EBIT -4 48 49 -8 -297 5 -44 -15 8 38 85 -350 98 -6
Financial result -10 -8 -7 -8 -12 -12 -13 -12 -13 -14 -33 -49 -59 -73
Income before taxes -14 40 42 -16 -309 -7 -56 -27 -4 24 52 -399 39 -79
Income taxes 2 -9 -9 2 45 -2 1 6 1 -8 -14 50 -17 -12
Net income -12 31 33 -14 -263 -9 -55 -22 -4 16 38 -349 22 -90
Minority interests 0 0 1 0 -1 0 -1 0 -1 0 -1 -2 0 -6
Net income KlöCo -12 31 32 -14 -263 -9 -54 -21 -4 16 37 -347 22 -85
EPS basic (€) -0.13 0.31 0.32 -0.14 -2.63 -0.09 -0.54 -0.22 -0.04 0.16 0.37 -3.48 0.22 -0.85
EPS diluted (€) -0.13 0.31 0.32 -0.14 -2.63 -0.09 -0.54 -0.22 -0.04 0.16 0.37 -3.48 0.22 -0.85* Restated due to initial application of IFRIC 21.** Restated due to initial application IAS 19 revised 2011.
FY 2016 Results | Analysts’ and Investors’ Conference | Klöckner & Co SE

No.23
Segment performance04
* 2014 amounts restated due to the initial application of IFRIC 21 (Levies).
Q4 2016
867
Q3 2016
873
Q2 2016
950
Q1 2016
903
Q4 2015
891
Q3 2015
931
Q2 2015
970
Q1 2015
979
Q4 2014
893
Q4 2014
973
Q4 2016
883
Q3 2016
891
Q2 2016
963
Q1 2016
870
Q4 2015
919
Q3 2015
986
Q2 2015
1,054
Q1 2015
1,025 49
1112
21
29
18
Q4 2016
36
Q3 2016
55
Q2 2016
Q1 2016
Q4 2015
Q3 2015
Q2 2015
Q1 2015
7
Q4 2014
Q4 2016
583
Q3 2016
627
Q2 2016
693
Q1 2016
652
Q4 2015
644
Q3 2015
705
Q2 2015
675
Q1 2015
682
Q4 2014
662
Q4 2016
515
Q3 2016
539
Q2 2016
554
Q1 2016
516
Q4 2015
537
Q3 2015
611
Q2 2015
639
Q1 2015
672
Q4 2014
604
11 11
30
14
20
Q3 2016
22
Q4 2016
Q2 2016
Q1 2016
Q4 2015
3
Q3 2015
Q2 2015
13
Q1 2015
7
Q4 2014
-2.7%
-9.5%
-4.0%
-4.1%
Eur
ope
Am
eric
as
Restructuring costs (€m)** Q2 2015 Q3 2015 Q4 2015Europe 52 2 2Americas 2
Shipments (Tto) Sales (€m) EBITDA* before restructuring (€m)
Shipments (Tto) Sales (€m) EBITDA* before restructuring (€m)
** €4m are reported in HQ in Q4 2015.
FY 2016 Results | Analysts’ and Investors’ Conference | Klöckner & Co SE

No.24
Strong balance sheet04
• Equity ratio further healthy at 40%
• Net debt of €444m**
• Gearing* at 40%
• NWC decreased from €1,128m to €1,120m**
* Gearing = Net debt/Equity attributable to shareholders ofKlöckner & Co SE less goodwill from businesscombinations subsequent to May 23, 2013.
** Excluding Disposal Group Spain (Net debt -€3m, Net Working Capital €30m).
Comments
Assets Equity & liabilities
39% 39%
656 654
945 897
134206114
961
LiquidityOther current assets
Trade receivables
Inventories
Non-current assets
Dec 31, 2016
2,897
1,006
Dec 31, 2015
2,841
165 354
489 540
340 359
545 571
279Other liabilities
Trade payables
Pensions
Financial liabilities
Equity
Dec 31, 2016
2,897
1,148
Dec 31, 2015
2,841
1,113
39% 40%
FY 2016 Results | Analysts’ and Investors’ Conference | Klöckner & Co SE

No.25
Sales by markets, products and industries04
As of December 31, 2016.
Sales by markets Sales by industry
Sales by product
5%UK
10%France/Belgium
16%Switzerland
27%Germany
37%USA
3%Netherlands
2%Spain
5%Tubes
8%Aluminum
9%Quality steel/
Stainless steel
22%Long products
44%Flat products
12%Others
12%Automotive
industry
7%Miscellaneous6%
Local dealers
31%Machinery/mechanical
engineering
37%Construction
industry
7%Household appl./Consumer goods
FY 2016 Results | Analysts’ and Investors’ Conference | Klöckner & Co SE

No.26
Current shareholder structure04
Geographical breakdown of identified institutional investors
• Identified institutional investors account for 78%
• German investors incl. retail dominate
• Top 10 shareholdings represent around 52%
• Retail shareholders represent 17%
Comments
As of February 2017.
6% Rest of EU
36% US
3% Rest of world
2% Switzerland
5% UK
48% Germany
FY 2016 Results | Analysts’ and Investors’ Conference | Klöckner & Co SE

Financial calendar
Christian Pokropp
Head of Investor Relations & Corporate Communications
Phone: +49 203 307 2050
Fax: +49 203 307 5025
Email: [email protected]
Internet: www.kloeckner.com
April 26, 2017 Q1 interim statement 2017
May 12, 2017 Annual General Meeting 2017, Düsseldorf
July 26, 2017 Q2 interim report 2017
October 25, 2017 Q3 interim statement 2017
Contact details