q2 2011 presentation to investors & analysts
TRANSCRIPT
Q2 2011QPresentation to Investors & Analysts
26th July 2011
Andrew WittyyChief Executive Officer
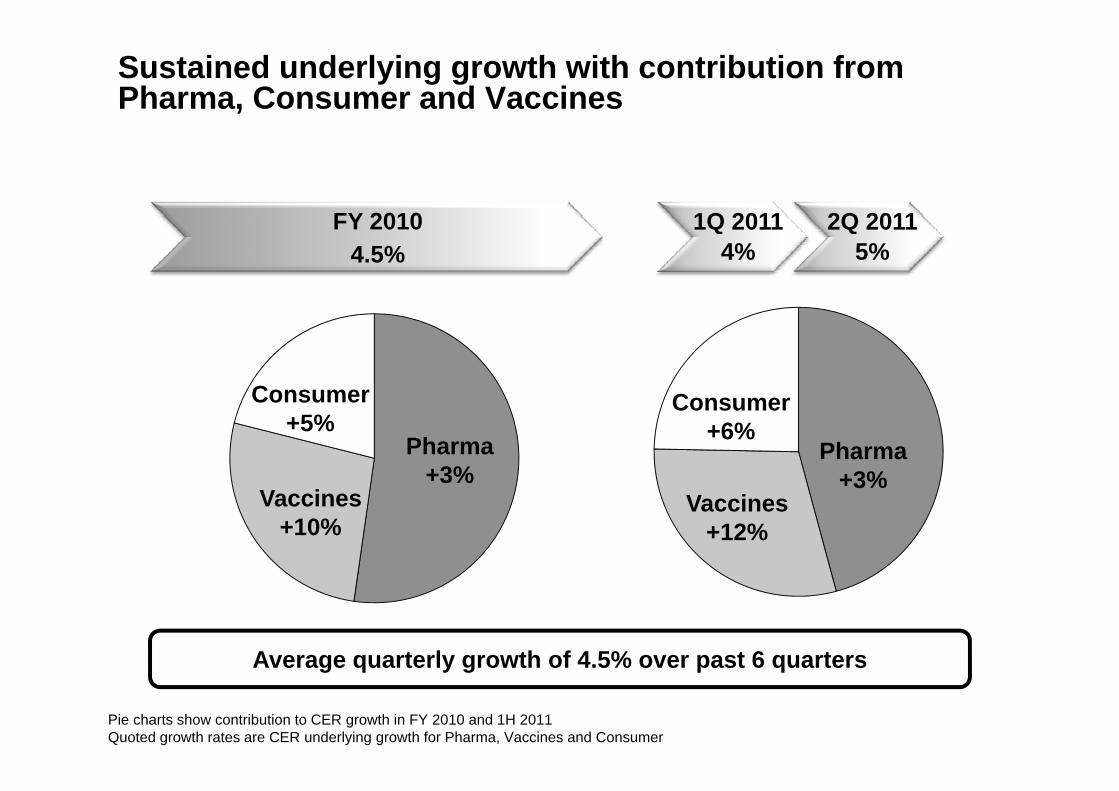
Sustained underlying growth with contribution from Pharma, Consumer and Vaccines
FY 2010 1Q 2011 2Q 2011FY 20104.5%
1Q 20114%
2Q 20115%
CConsumer
Pharma+3%
Consumer+6%Pharma
+3%
Consumer+5%
+3%Vaccines
+12%Vaccines
+10%
Average quarterly growth of 4.5% over past 6 quartersAverage quarterly growth of 4.5% over past 6 quarters
Pie charts show contribution to CER growth in FY 2010 and 1H 2011Quoted growth rates are CER underlying growth for Pharma, Vaccines and Consumer
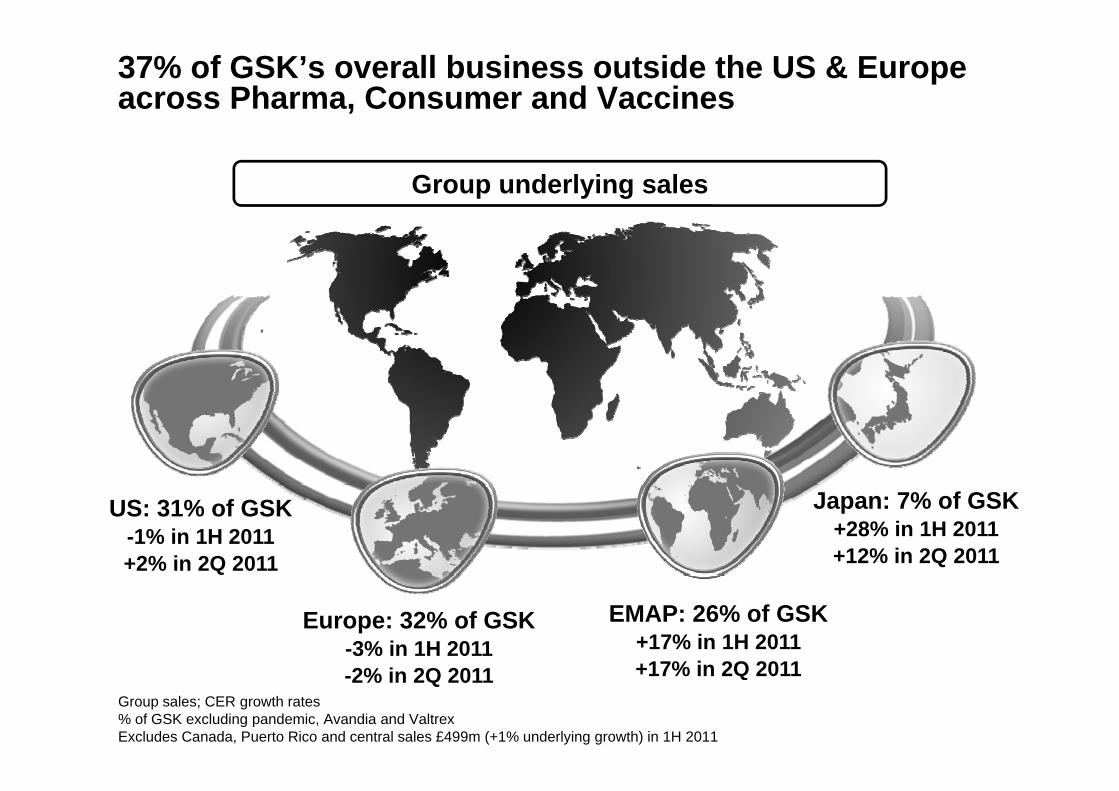
37% of GSK’s overall business outside the US & Europeacross Pharma, Consumer and Vaccines
Group underlying sales
US: 31% of GSK-1% in 1H 2011+2% in 2Q 2011
Japan: 7% of GSK+28% in 1H 2011+12% in 2Q 2011
Europe: 32% of GSK-3% in 1H 2011
EMAP: 26% of GSK+17% in 1H 2011+17% in 2Q 2011
Group sales; CER growth rates% of GSK excluding pandemic, Avandia and ValtrexExcludes Canada, Puerto Rico and central sales £499m (+1% underlying growth) in 1H 2011
-2% in 2Q 2011 +17% in 2Q 2011
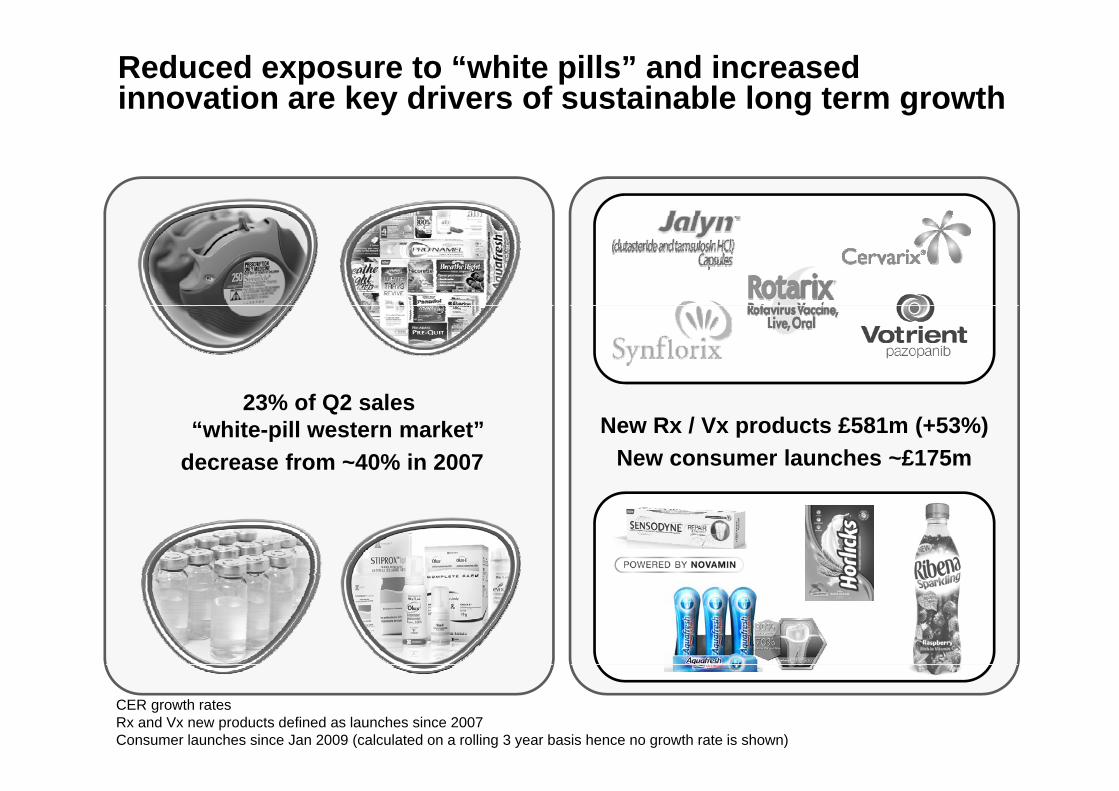
Reduced exposure to “white pills” and increased innovation are key drivers of sustainable long term growth
23% f Q2 lNew Rx / Vx products £581m (+53%)
New consumer launches ~£175m
23% of Q2 sales“white-pill western market”
decrease from ~40% in 2007
CER growth ratesRx and Vx new products defined as launches since 2007Consumer launches since Jan 2009 (calculated on a rolling 3 year basis hence no growth rate is shown)
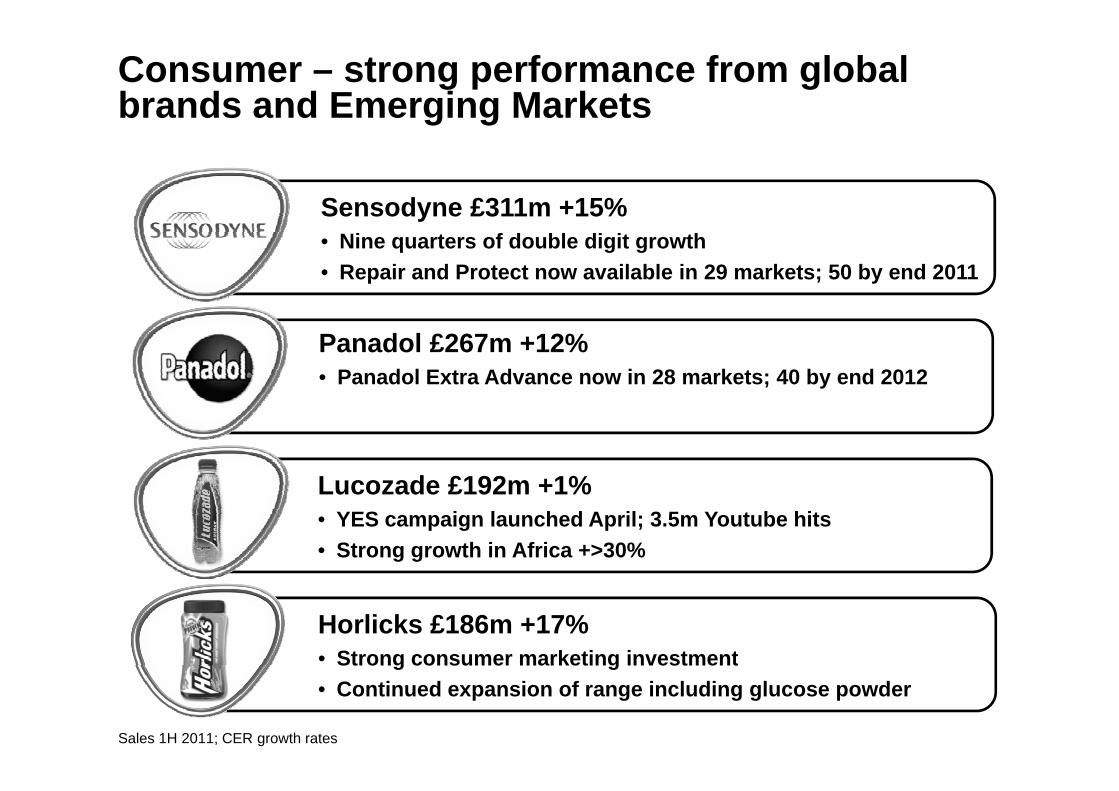
Consumer – strong performance from global brands and Emerging Markets
Sensodyne £311m +15%Sensodyne £311m 15%• Nine quarters of double digit growth• Repair and Protect now available in 29 markets; 50 by end 2011
Panadol £267m +12%• Panadol Extra Advance now in 28 markets; 40 by end 2012
Lucozade £192m +1%Lucozade £192m +1%• YES campaign launched April; 3.5m Youtube hits • Strong growth in Africa +>30%
Horlicks £186m +17%• Strong consumer marketing investmentStrong consumer marketing investment• Continued expansion of range including glucose powder
Sales 1H 2011; CER growth rates
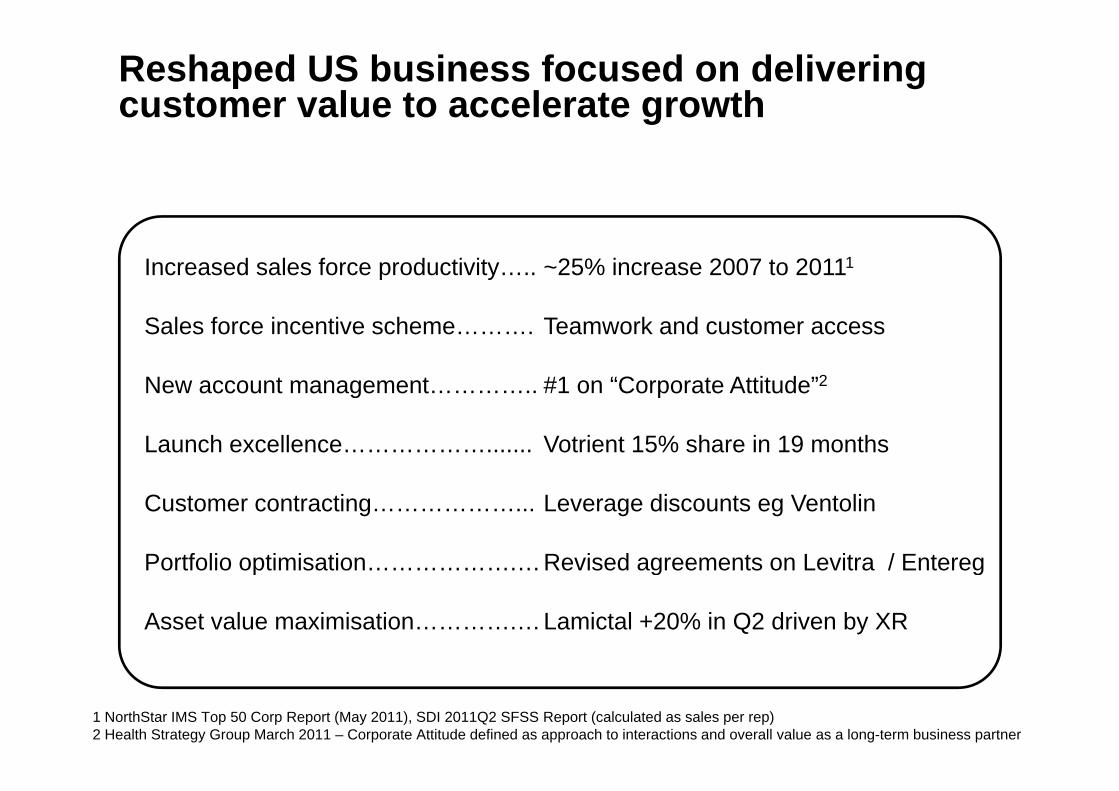
Reshaped US business focused on delivering customer value to accelerate growth
Increased sales force productivity….. ~25% increase 2007 to 20111
Sales force incentive scheme……….
New account management…………..
Teamwork and customer access
#1 on “Corporate Attitude”2g
Launch excellence……………….......
p
Votrient 15% share in 19 months
Customer contracting………………...
Portfolio optimisation……………….…
Leverage discounts eg Ventolin
Revised agreements on Levitra / Entereg
Asset value maximisation………….…
g g
Lamictal +20% in Q2 driven by XR
1 NorthStar IMS Top 50 Corp Report (May 2011), SDI 2011Q2 SFSS Report (calculated as sales per rep)2 Health Strategy Group March 2011 – Corporate Attitude defined as approach to interactions and overall value as a long-term business partner
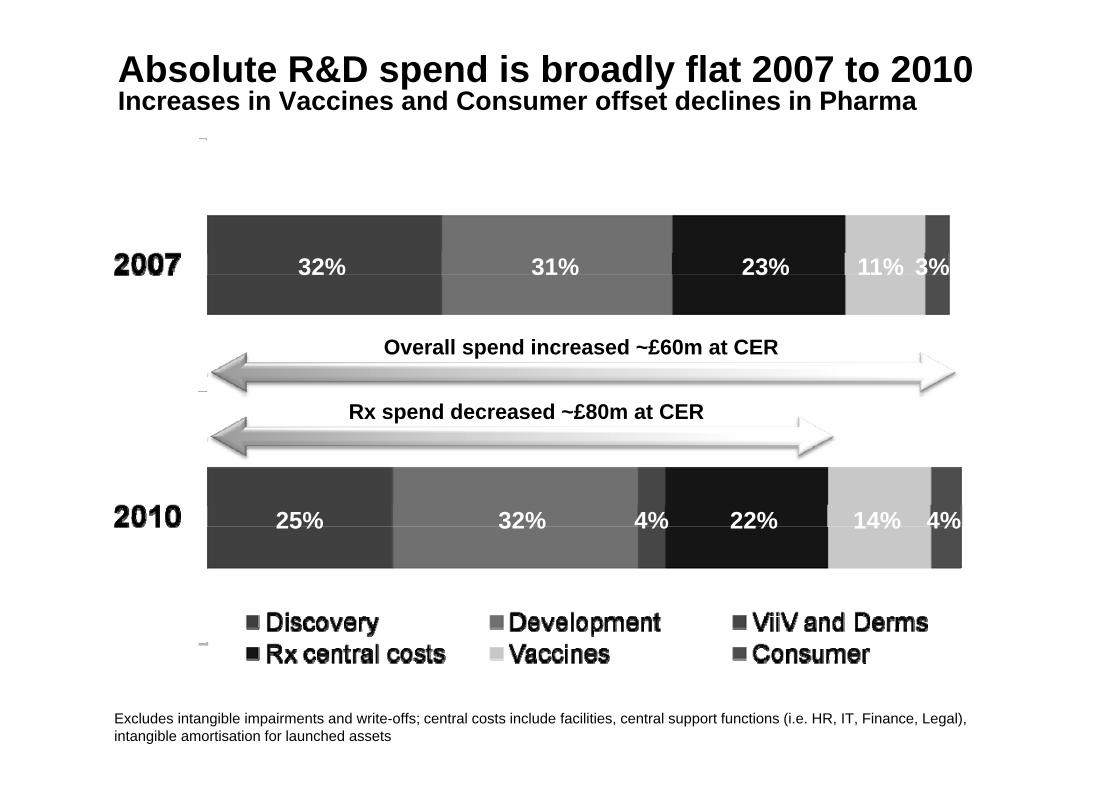
Absolute R&D spend is broadly flat 2007 to 2010Increases in Vaccines and Consumer offset declines in Pharma
32% 31% 23% 11% 3%
Overall spend increased ~£60m at CER
Rx spend decreased ~£80m at CER
25% 32% 22% 14% 4%4%
Excludes intangible impairments and write-offs; central costs include facilities, central support functions (i.e. HR, IT, Finance, Legal),intangible amortisation for launched assets
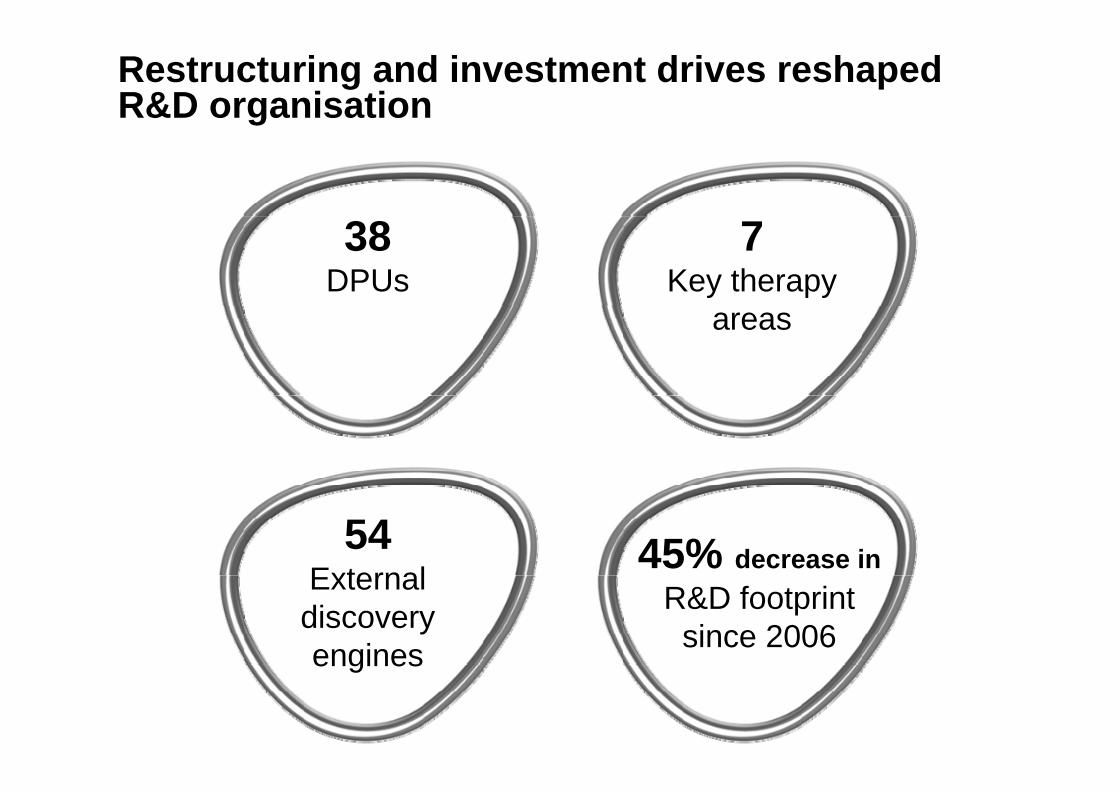
Restructuring and investment drives reshaped R&D organisation
38DPUs
7Key therapy
areas
54External
45% decrease inExternaldiscoveryengines
R&D footprintsince 2006engines
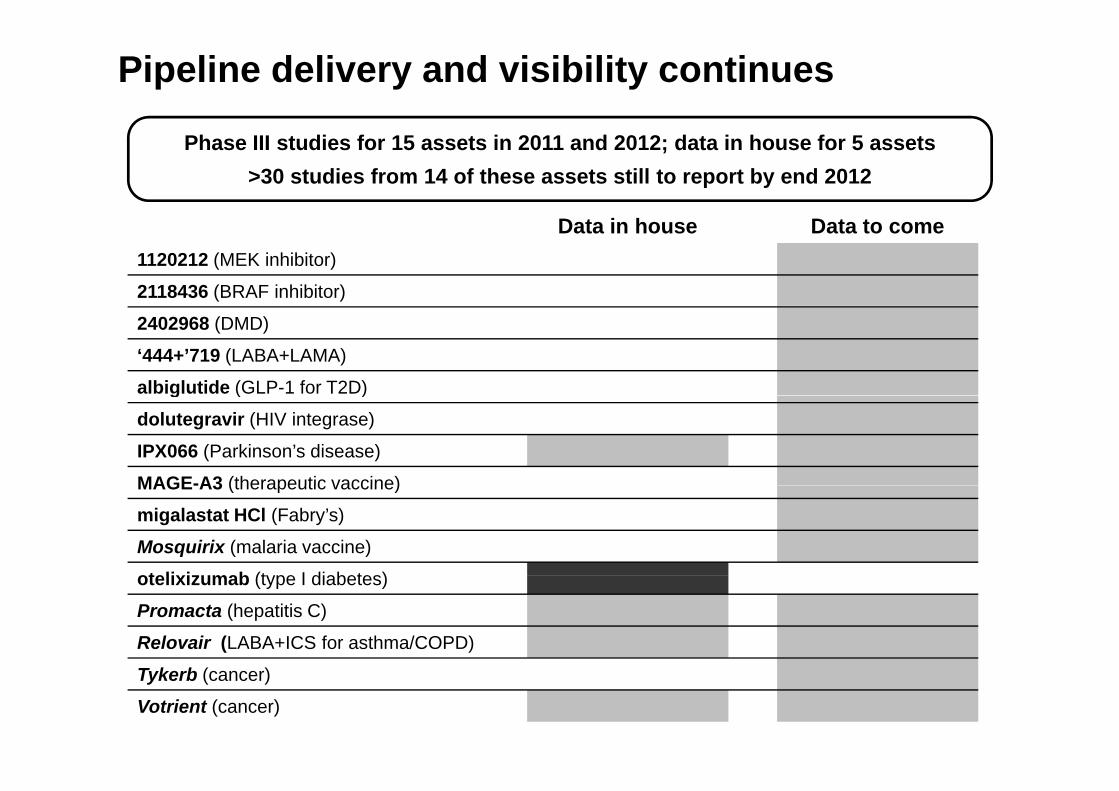
Pipeline delivery and visibility continues
Phase III studies for 15 assets in 2011 and 2012; data in house for 5 assets>30 studies from 14 of these assets still to report by end 2012
Data in house Data to come1120212 (MEK inhibitor)
2118436 (BRAF inhibitor)
2402968 (DMD)
‘444+’719 (LABA+LAMA)
albiglutide (GLP-1 for T2D)g ( )
dolutegravir (HIV integrase)
IPX066 (Parkinson’s disease)
MAGE-A3 (therapeutic vaccine)MAGE-A3 (therapeutic vaccine)
migalastat HCl (Fabry’s)
Mosquirix (malaria vaccine)
t li i b (t I di b t )otelixizumab (type I diabetes)
Promacta (hepatitis C)
Relovair (LABA+ICS for asthma/COPD)
Tykerb (cancer)
Votrient (cancer)
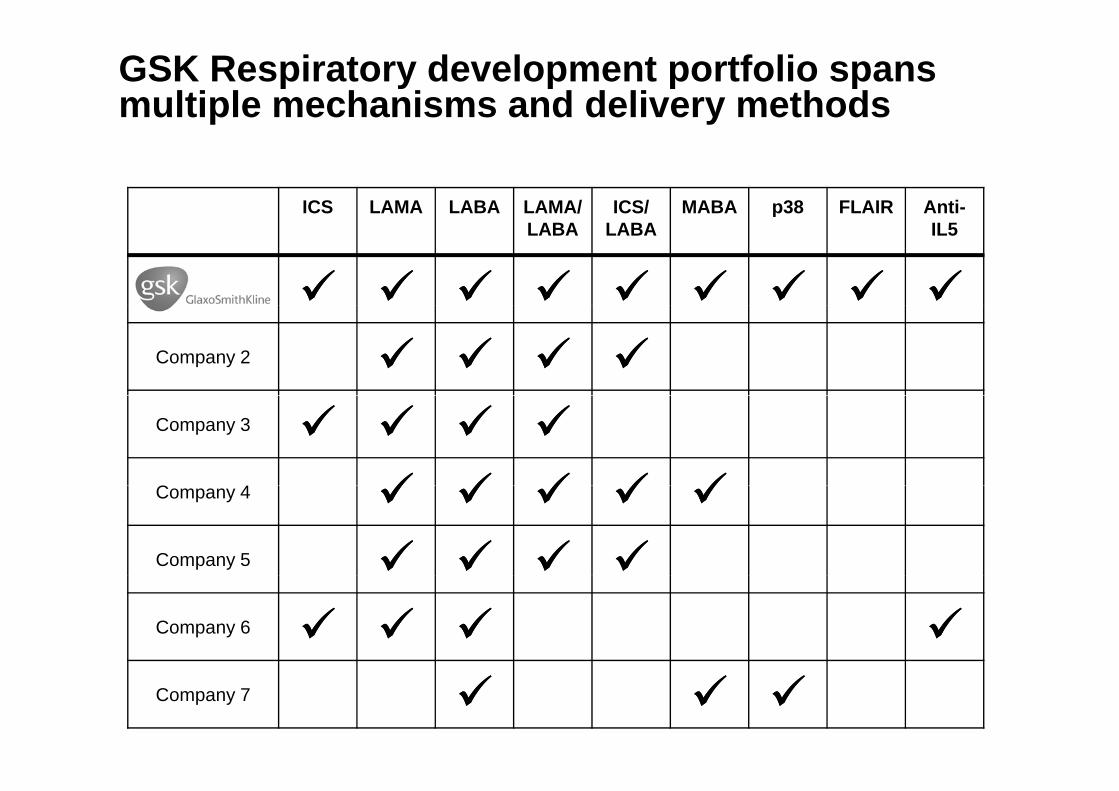
GSK Respiratory development portfolio spans multiple mechanisms and delivery methods
ICS LAMA LABA LAMA/ ICS/ MABA p38 FLAIR Anti-LABA LABA
pIL5
Company 2
Company 3
C 4Company 4
Company 5
Company 6
Company 7
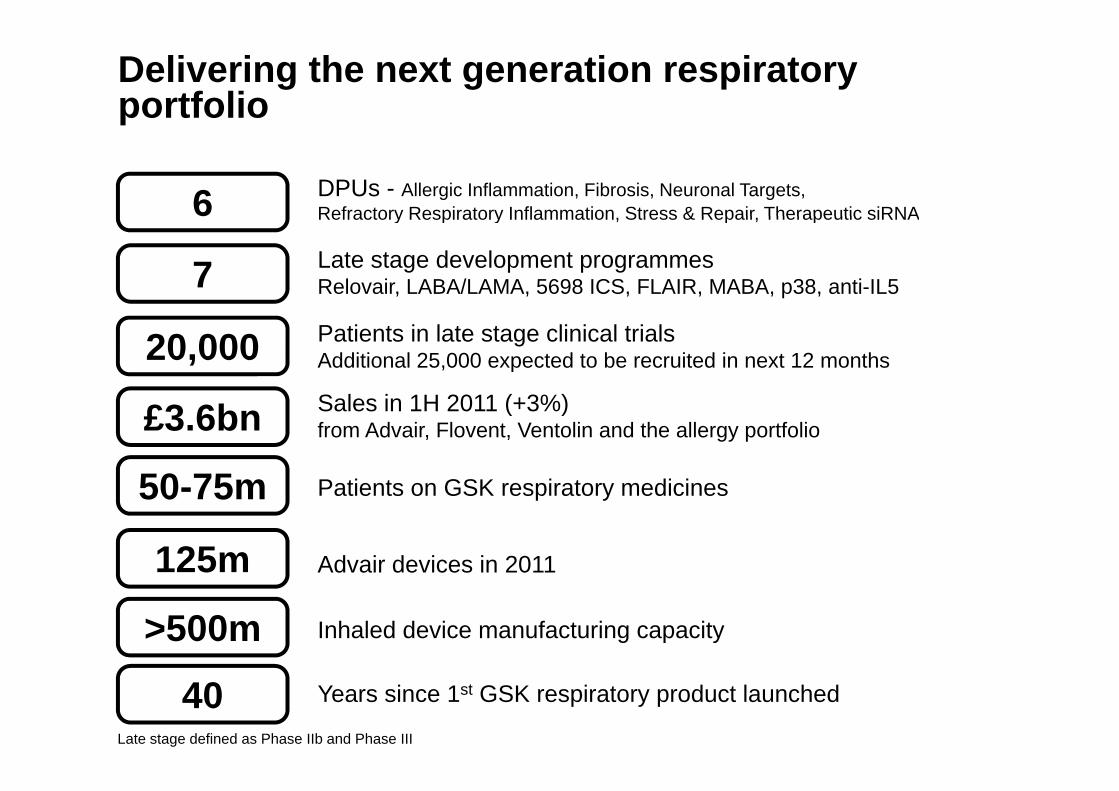
Delivering the next generation respiratory portfolio
DPUs - Allergic Inflammation, Fibrosis, Neuronal Targets,Refractory Respiratory Inflammation Stress & Repair Therapeutic siRNA6Late stage development programmesRelovair, LABA/LAMA, 5698 ICS, FLAIR, MABA, p38, anti-IL5
Refractory Respiratory Inflammation, Stress & Repair, Therapeutic siRNA
7
6
Patients in late stage clinical trialsAdditional 25,000 expected to be recruited in next 12 months
S l i 1H 2011 ( 3%)
20,000
Patients on GSK respiratory medicines
Sales in 1H 2011 (+3%) from Advair, Flovent, Ventolin and the allergy portfolio£3.6bn
50 75m
Advair devices in 2011
Patients on GSK respiratory medicines
125m
50-75m
Inhaled device manufacturing capacity>500mYears since 1st GSK respiratory product launched 40
Late stage defined as Phase IIb and Phase III
Simon DingemansgChief Financial Officer
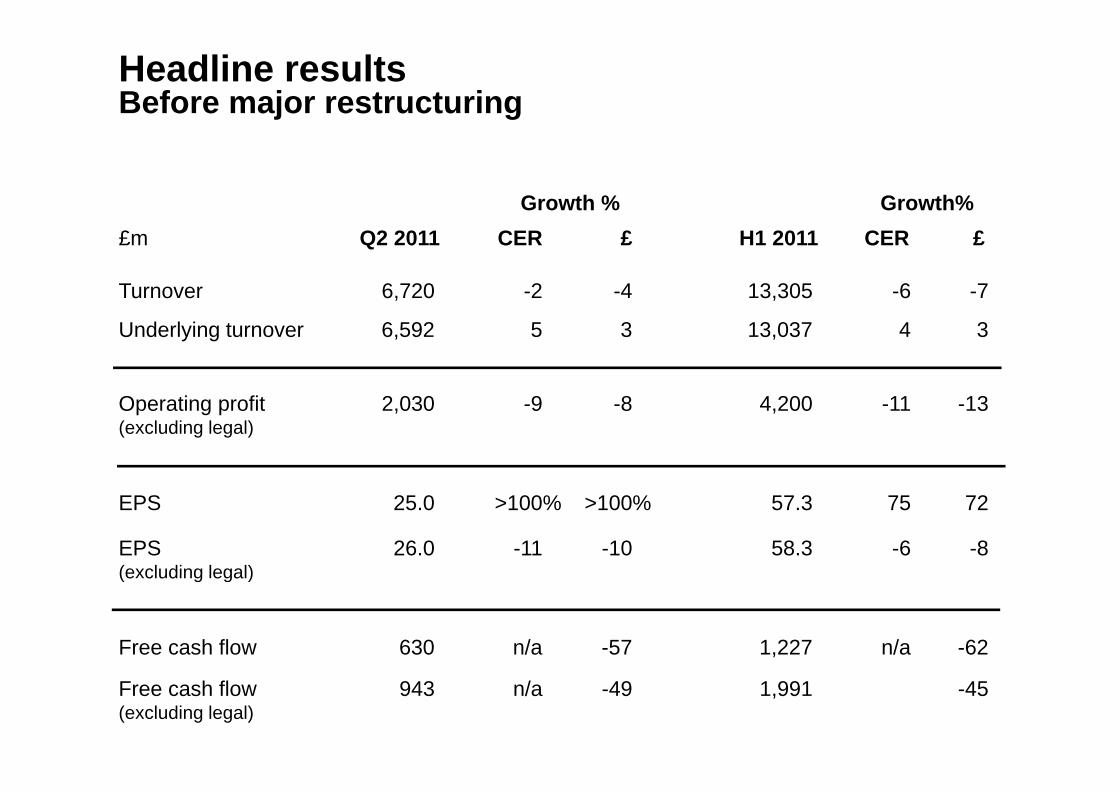
Headline resultsBefore major restructuring
Growth % Growth%£m Q2 2011 CER £ H1 2011 CER £
Turnover 6,720 -2 -4 13,305 -6 -7
Underlying turnover 6,592 5 3 13,037 4 3
O i fi 2 030 9 8 4 200 11 13Operating profit(excluding legal)
2,030 -9 -8 4,200 -11 -13
EPS 25.0 >100% >100% 57.3 75 72
EPS(excluding legal)
26.0 -11 -10 58.3 -6 -8(excluding legal)
Free cash flow 630 n/a -57 1,227 n/a -62
Free cash flow(excluding legal)
943 n/a -49 1,991 -45
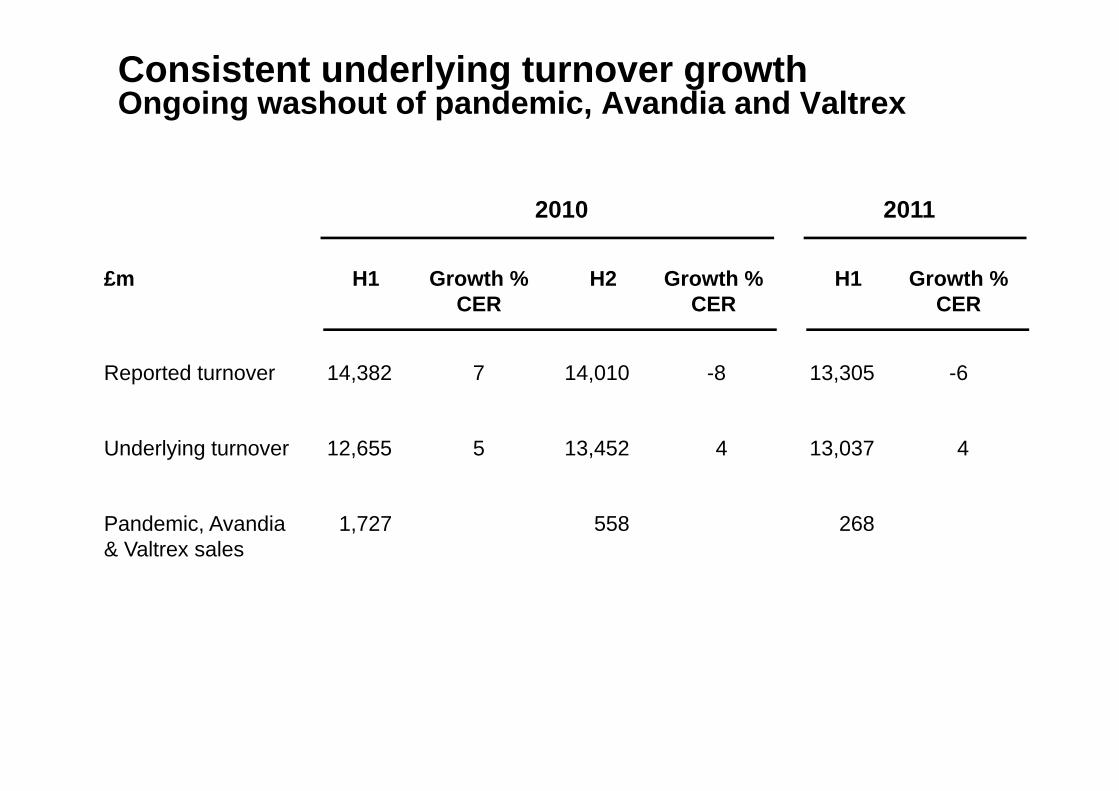
Consistent underlying turnover growthOngoing washout of pandemic, Avandia and Valtrex
2010 2011
£m H1 Growth %CER
H2 Growth %CER
H1 Growth %CER
2010 2011
CER CER CER
Reported turnover 14,382 7 14,010 -8 13,305 -6
Underlying turnover 12,655 5 13,452 4 13,037 4
Pandemic, Avandia& Valtrex sales
1,727 558 268
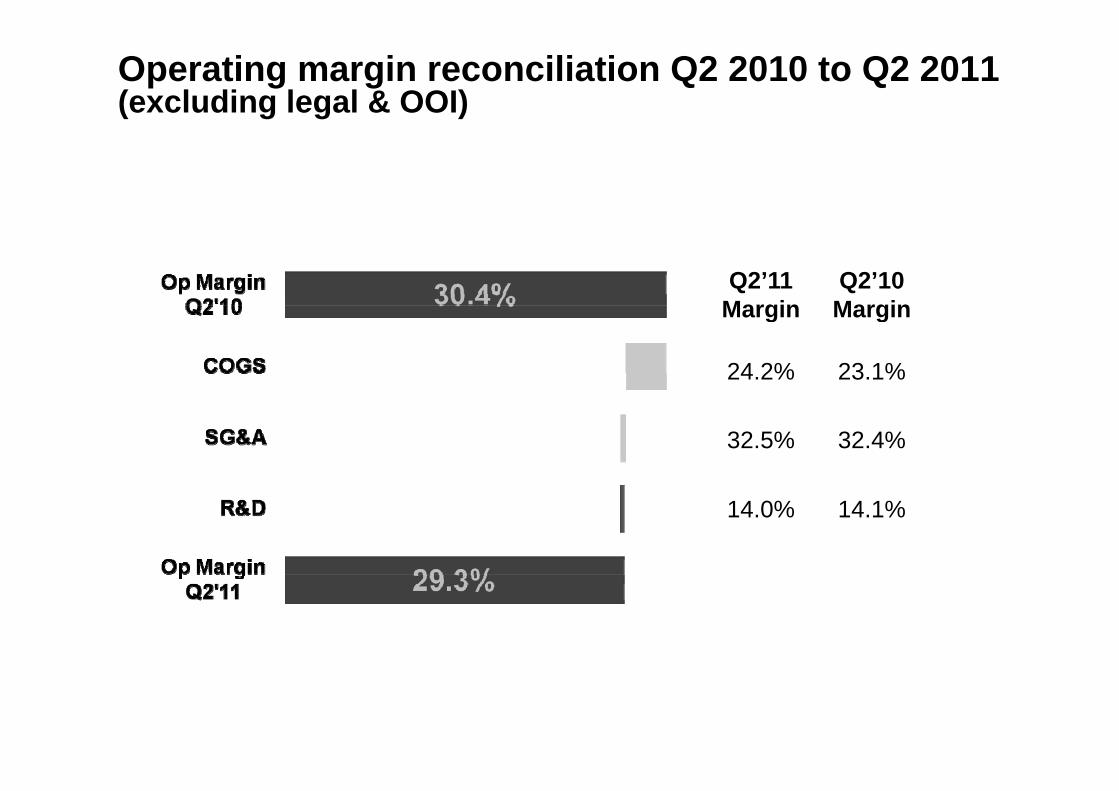
Operating margin reconciliation Q2 2010 to Q2 2011(excluding legal & OOI)
Q2’11 Margin
Q2’10 MarginMargin Margin
24.2% 23.1%
32.5% 32.4%
14.0% 14.1%
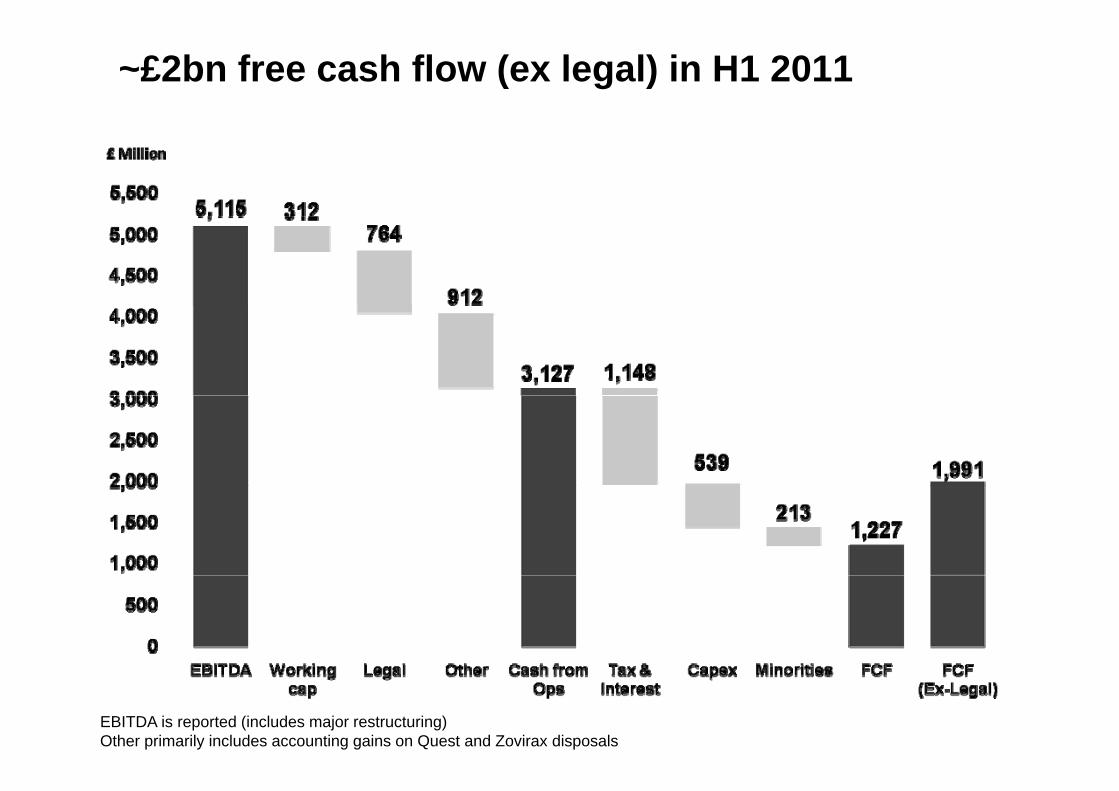
~£2bn free cash flow (ex legal) in H1 2011
EBITDA is reported (includes major restructuring)Other primarily includes accounting gains on Quest and Zovirax disposals
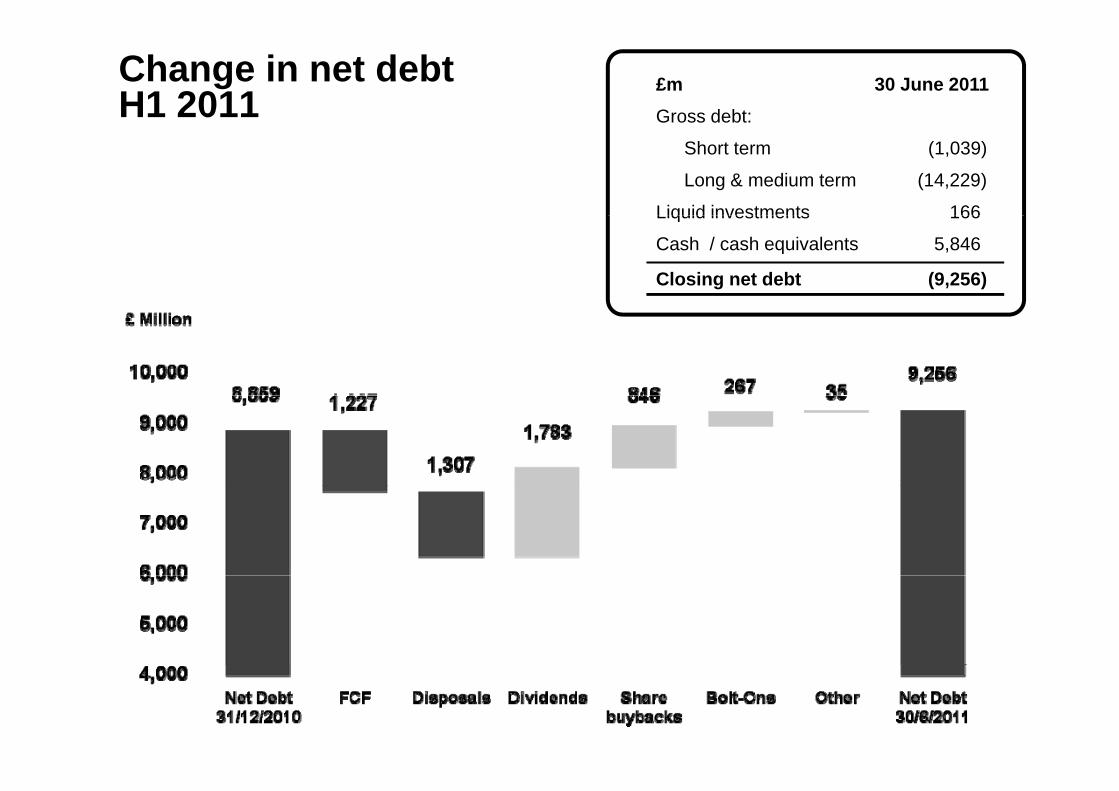
Change in net debtH1 2011
£m 30 June 2011Gross debt:
Short term (1,039)
Long & medium term (14,229)
Liquid investments 166Liquid investments 166
Cash / cash equivalents 5,846
Closing net debt (9,256)
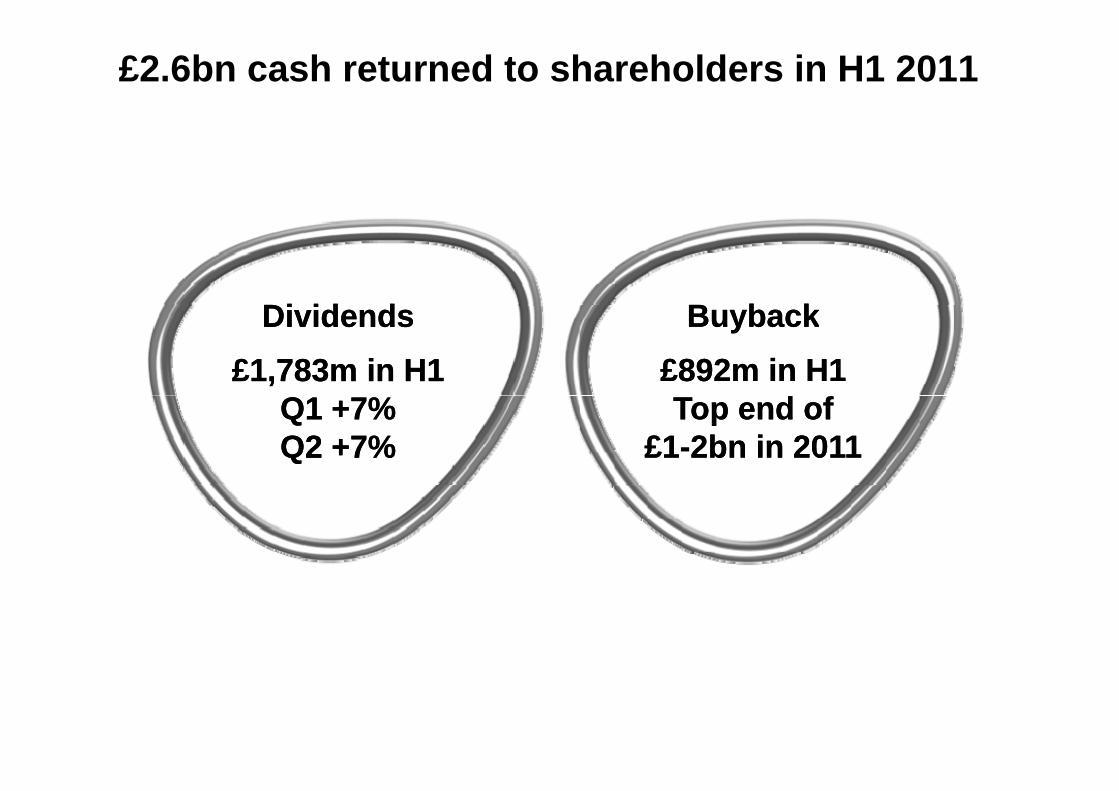
£2.6bn cash returned to shareholders in H1 2011
Di id dDi id d B b kB b kDividends£1,783m in H1
Dividends£1,783m in H1
Buyback£892m in H1
Buyback£892m in H1
Q1 +7%Q2 +7%Q1 +7%Q2 +7%
Top end of£1-2bn in 2011
Top end of£1-2bn in 2011
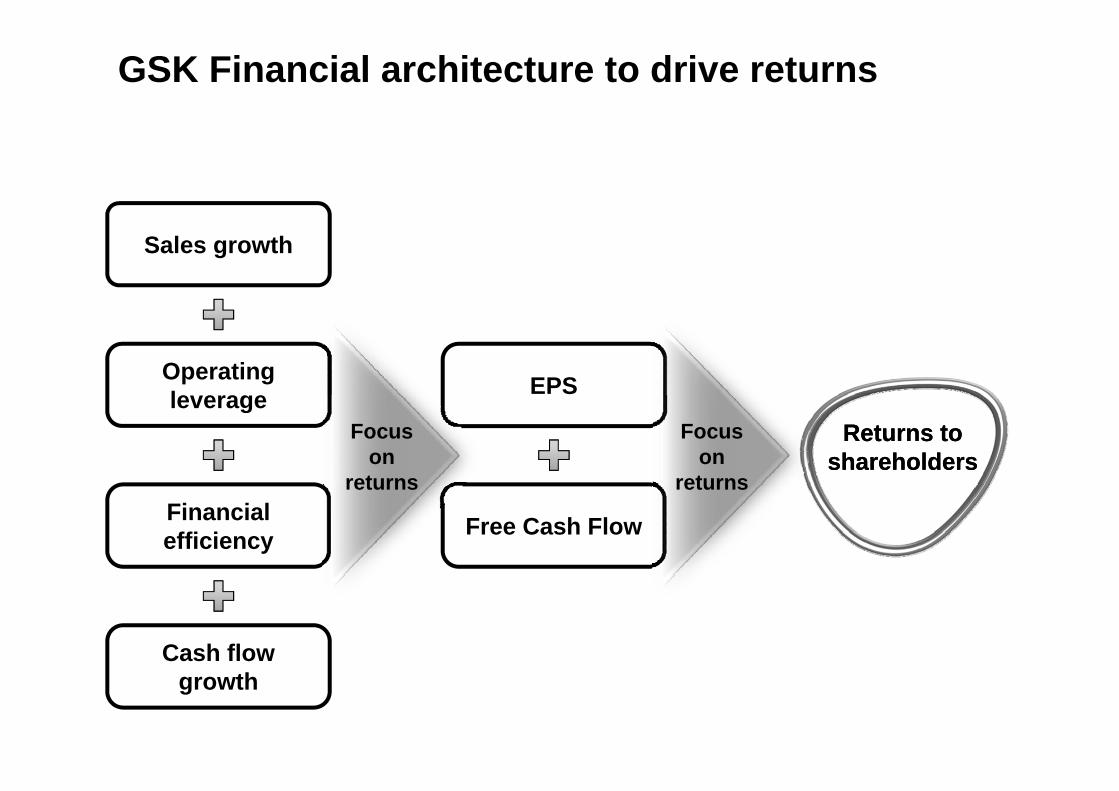
GSK Financial architecture to drive returns
Sales growth
Operating le erage EPSleverage
Returns toshareholders
Returns toshareholders
Focus on
returns
Focus on
returnsFinancial efficiency Free Cash Flow
returns returns
Cash flow growth
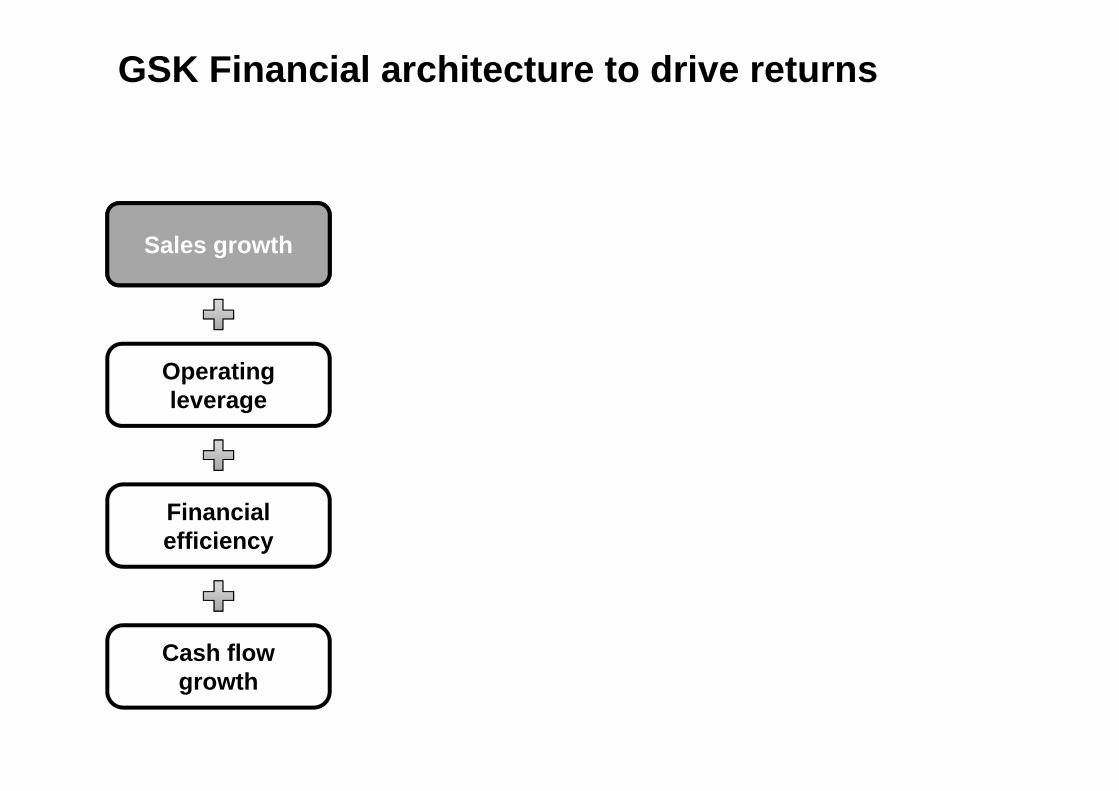
GSK Financial architecture to drive returns
Sales growth
Operating le erageleverage
Financial efficiency
Cash flow growth
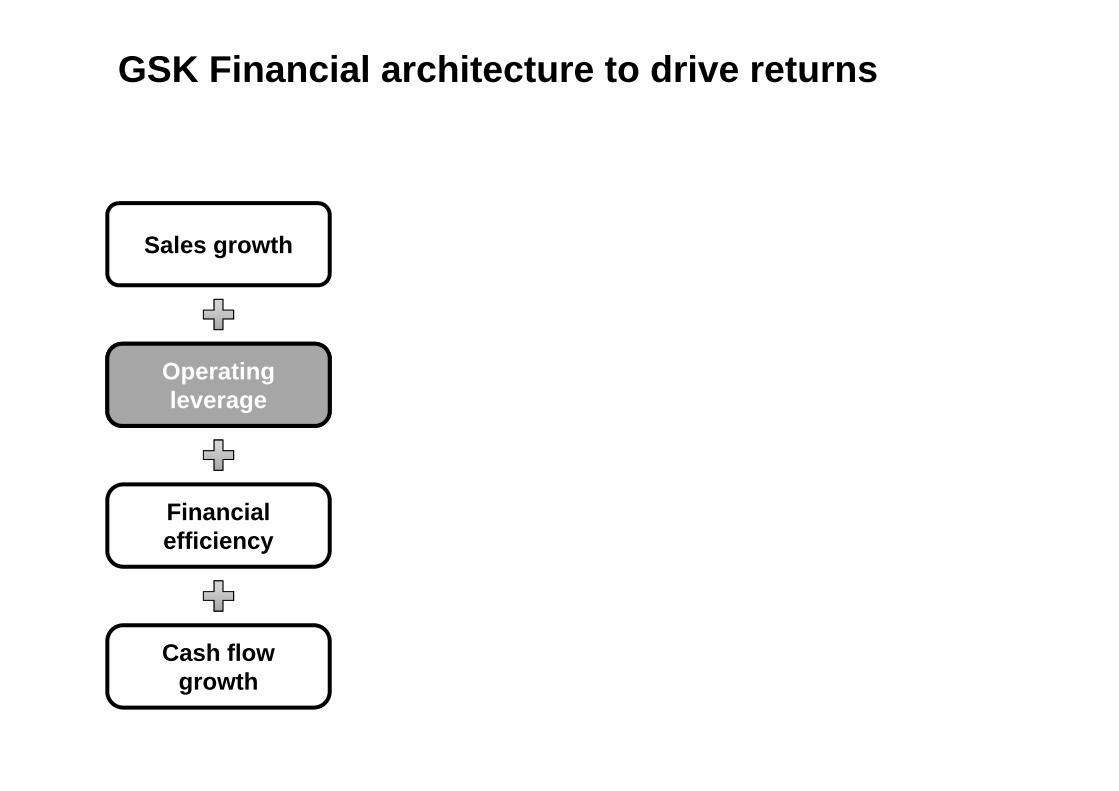
GSK Financial architecture to drive returns
Sales growth
Operating le erageleverage
Financial efficiency
Cash flow growth
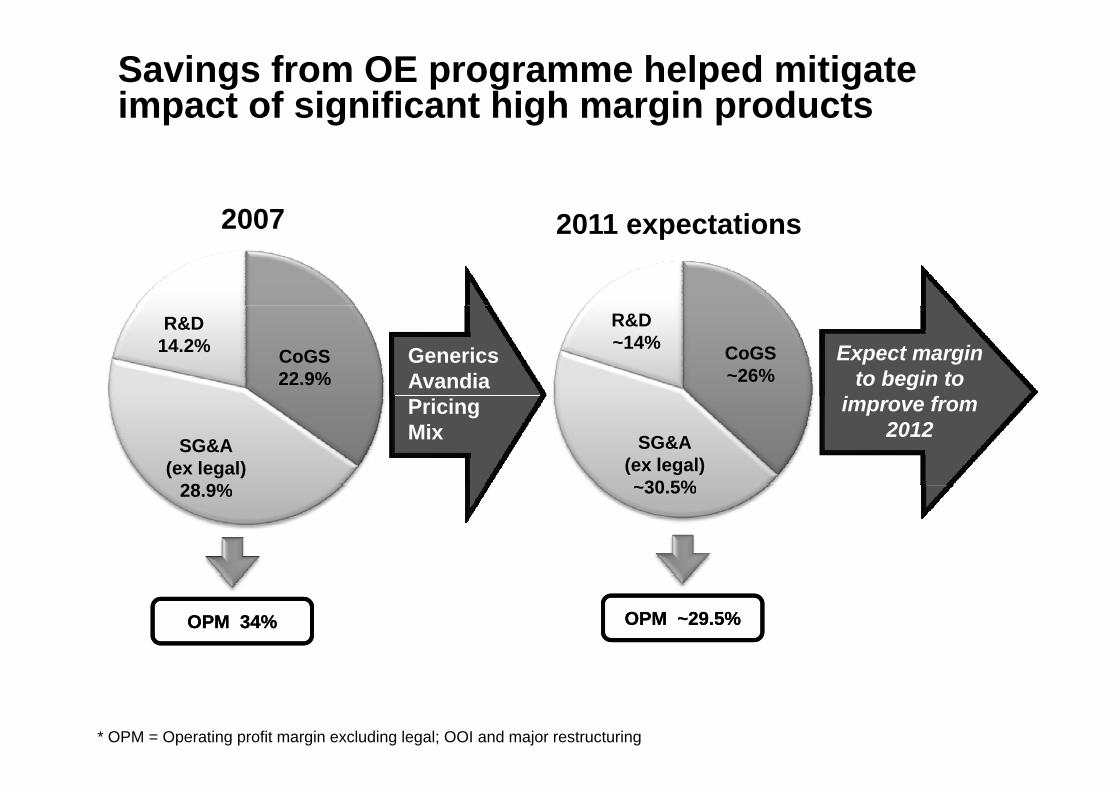
Savings from OE programme helped mitigate impact of significant high margin products
2007 2011 t ti2007 2011 expectations
R&D14.2%
R&D~14% CoGS
~26%CoGS22.9%
GenericsAvandia
Expect margin to begin to
SG&A(ex legal)~30 5%
SG&A(ex legal)
28 9%
PricingMix
improve from 2012
~30.5%28.9%
OPM 34%OPM 34% OPM ~29.5%OPM ~29.5%
* OPM = Operating profit margin excluding legal; OOI and major restructuring
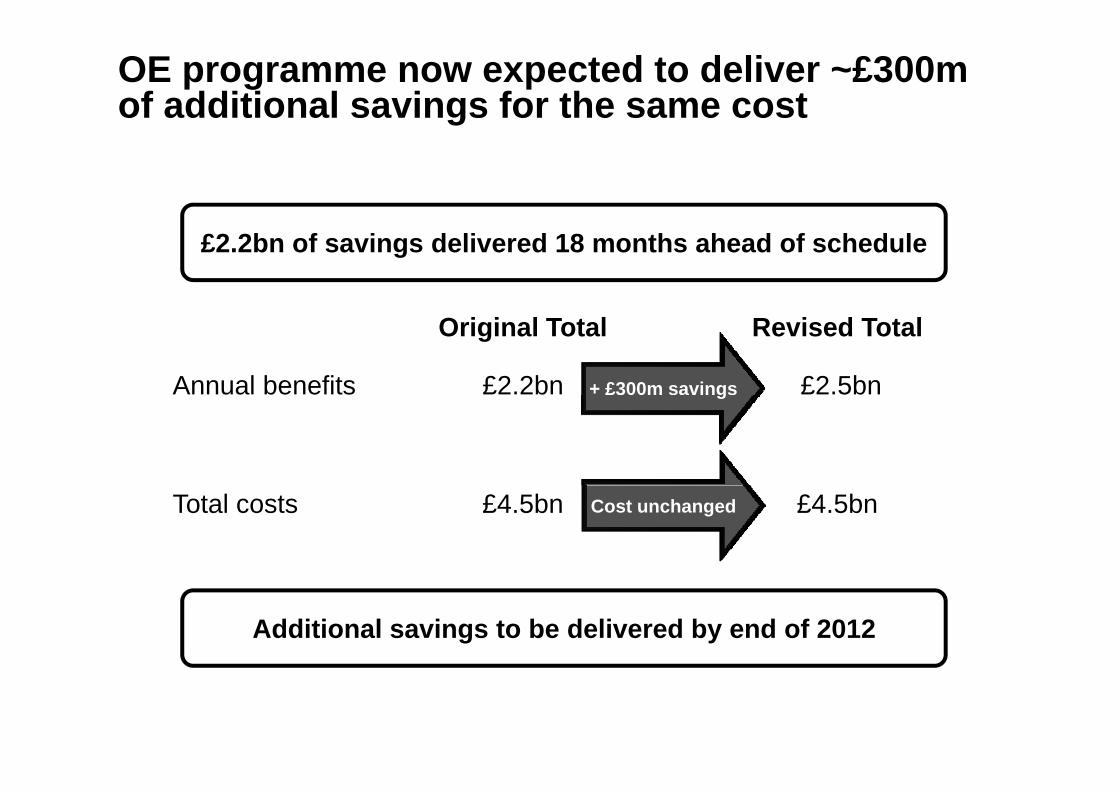
OE programme now expected to deliver ~£300mof additional savings for the same cost
£2.2bn of savings delivered 18 months ahead of schedule
+ £300m savings
Original Total Revised Total
Annual benefits £2.2bn £2.5bng
Cost unchangedTotal costs £4.5bn £4.5bn
Additional savings to be delivered by end of 2012
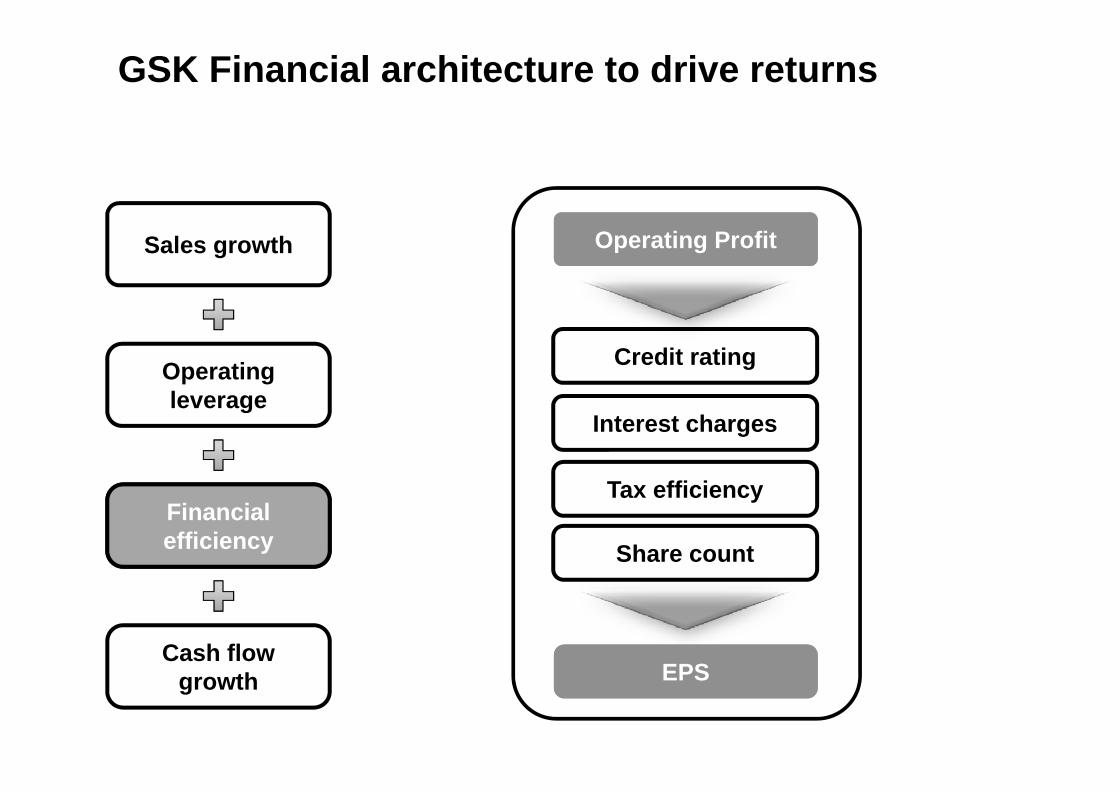
GSK Financial architecture to drive returns
Sales growth Operating ProfitOperating Profit
Operating le erage
Credit rating
leverageInterest charges
Tax efficiencyFinancial efficiency Share count
Tax efficiency
Cash flow EPSEPSgrowth EPSEPS
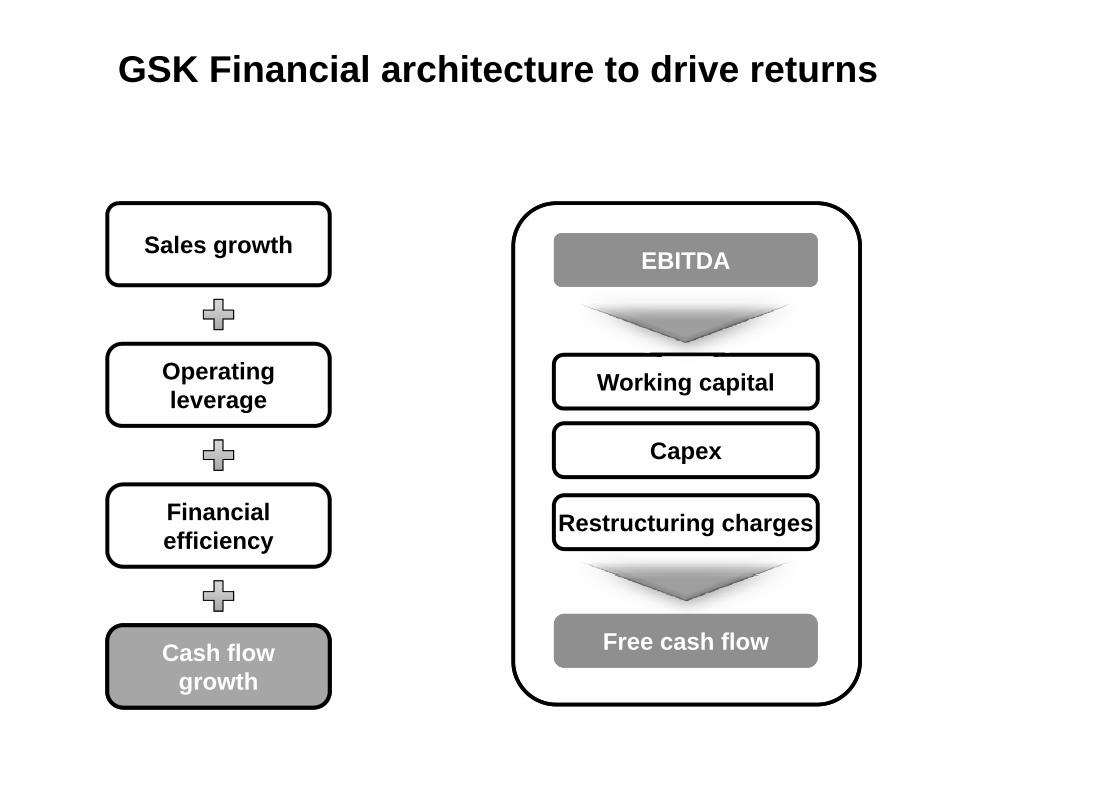
GSK Financial architecture to drive returns
Sales growth EBITDAEBITDA
Operating le erage
Working capitalleverage
Capex
Financial efficiency
Restructuring charges
Cash flow Free cash flowFree cash flowgrowth
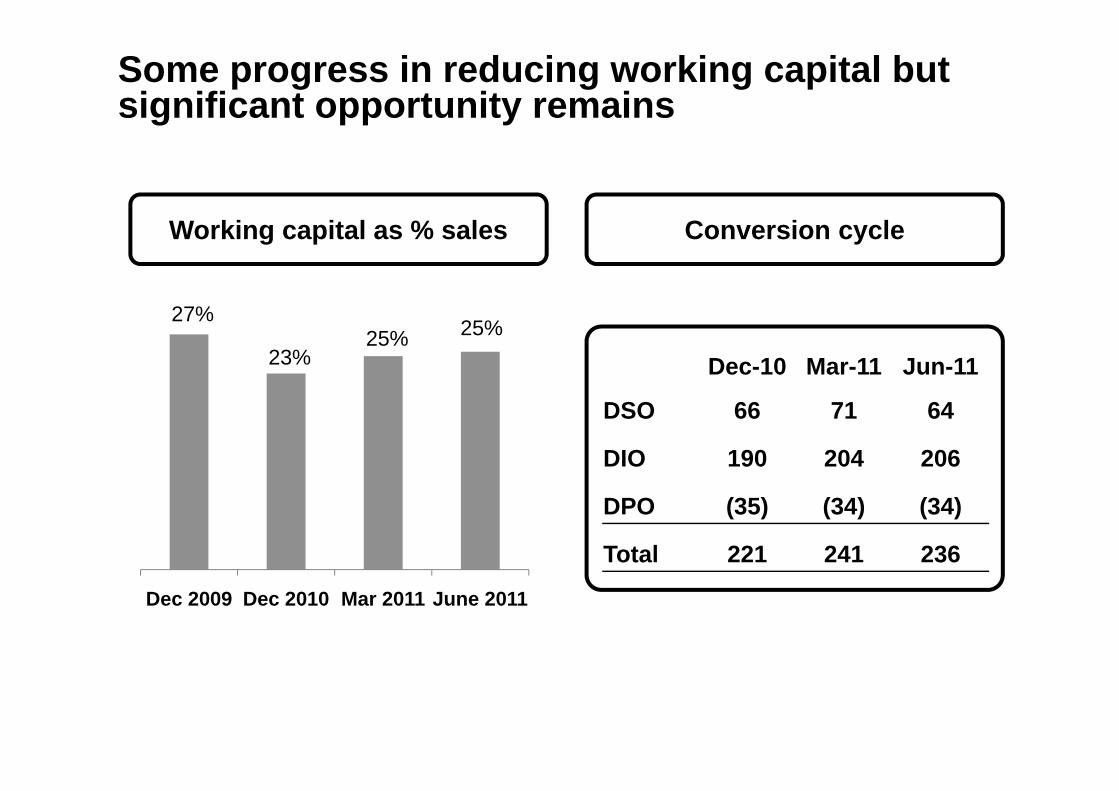
Some progress in reducing working capital but significant opportunity remains
%
Working capital as % sales Conversion cycle
27%
23%25% 25%
Dec-10 Mar-11 Jun-11
DSO 66 71 64
DIO 190 204 206
DPO (35) (34) (34)
Total 221 241 236
Dec 2009 Dec 2010 Mar 2011 June 2011
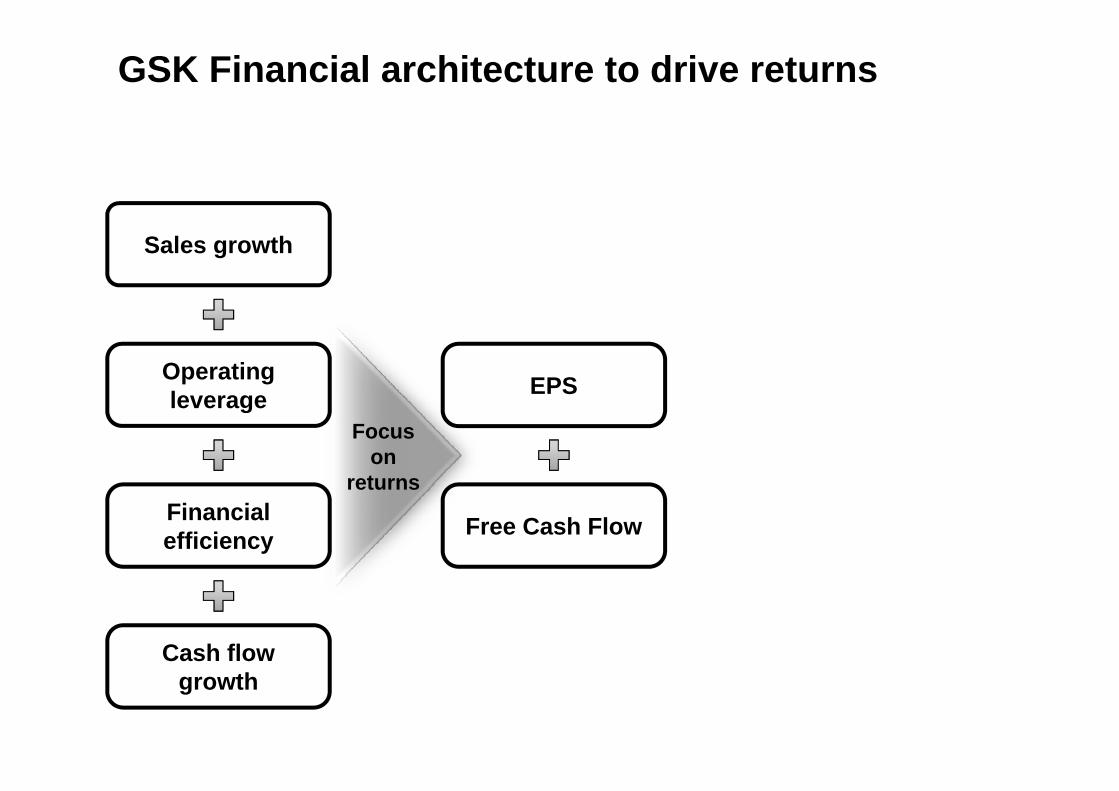
GSK Financial architecture to drive returns
Sales growth
Operating le erage EPS
Focus on
returns
leverage
returnsFinancial efficiency Free Cash Flow
Cash flow growth
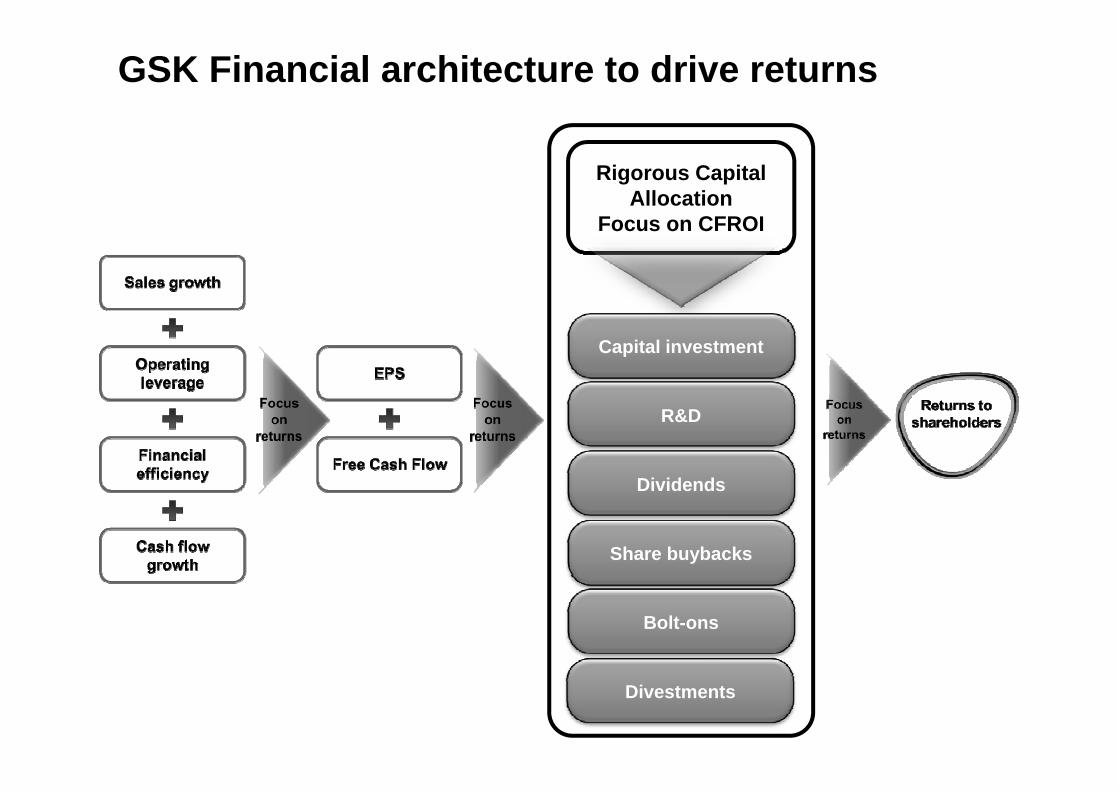
GSK Financial architecture to drive returns
Rigorous Capital Allocation
F CFROIFocus on CFROI
Capital investment
R&D
DividendsDividends
Share buybacks
Bolt-ons
Divestments
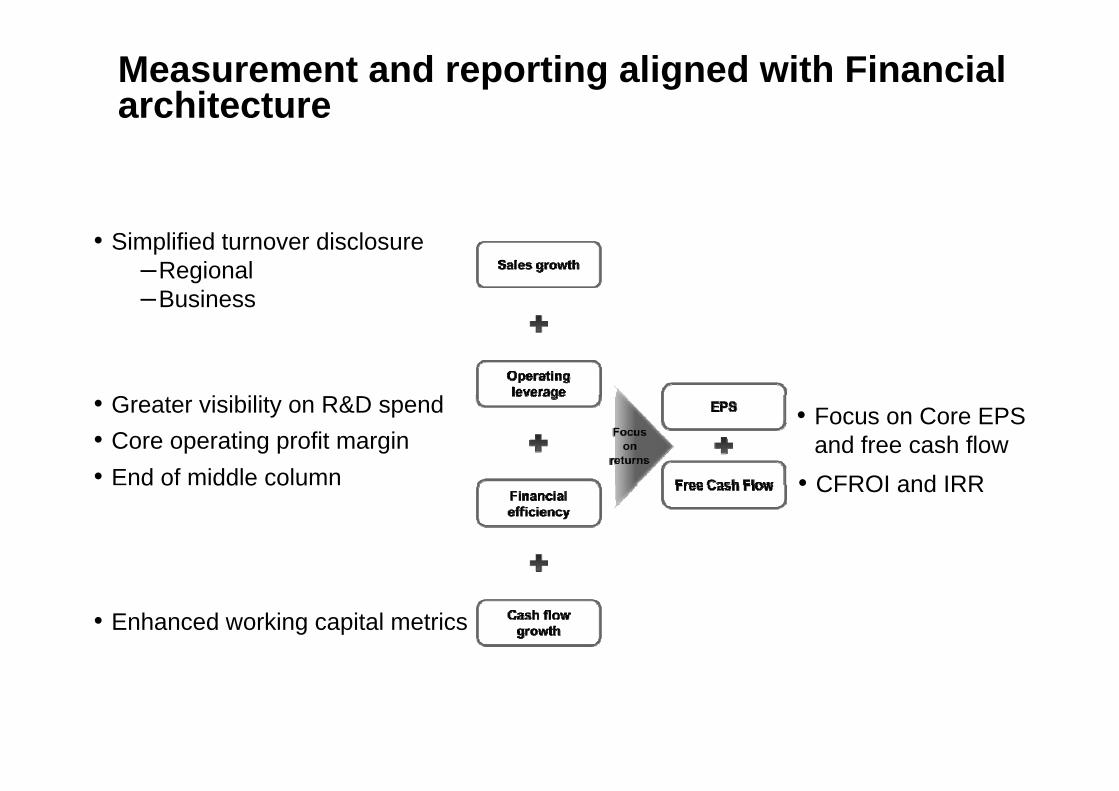
Measurement and reporting aligned with Financial architecture
• Simplified turnover disclosure–Regional–BusinessBusiness
G i ibili R&D d • Focus on Core EPS and free cash flow • Core operating profit margin
• End of middle column
• Greater visibility on R&D spend
• CFROI and IRRd o dd e co u • CFROI and IRR
• Enhanced working capital metrics
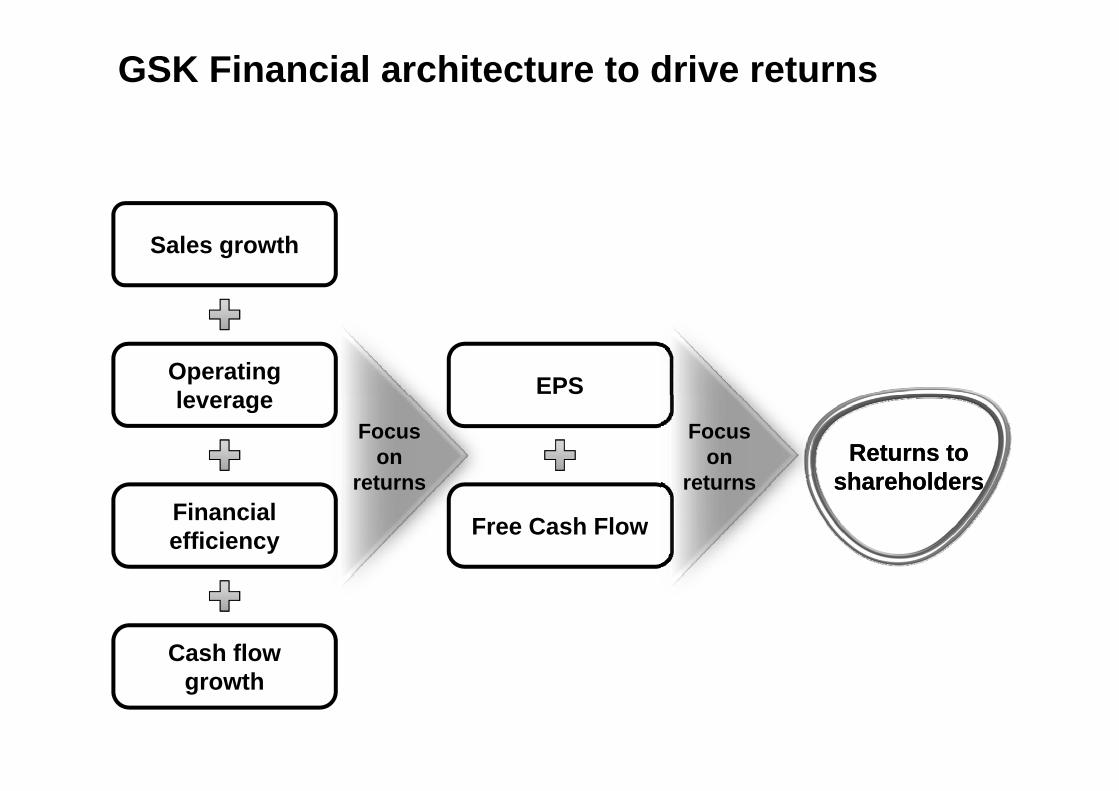
GSK Financial architecture to drive returns
Sales growth
Operating le erage EPS
Focus on
returns
leverage
Returns toshareholders
Returns toshareholders
Focus on
returnsreturnsFinancial efficiency Free Cash Flow
shareholdersshareholdersreturns
Cash flow growth