supplementary information for investors and analysts … · supplementary information for investors...
TRANSCRIPT

Investor Relations
Supplementary Information for Investors and Analysts2005 Third Quarter Results (Unaudited)
Ole Mæhle. View of the Mountain.The painting is part of DnB NOR’s art collection.

Chief Executive Officer
Svein Aaser
For further information, please contact Tom Grøndahl, Chief Financial Officer [email protected] +47 2248 2922
Halfdan Bakøy, Head of Group Financial Reporting [email protected] +47 2248 1071
Per Sagbakken, Head of IR/Long Term Funding [email protected] +47 2248 2072
Helge Stray, IR/Long Term Funding [email protected] +47 2294 9376
Jo Teslo, IR/Long Term Funding [email protected] +47 2294 9286
Thor Tellefsen, IR/Long Term Funding [email protected] +47 2294 9388
Gunn Gjøsæther, IR/Long Term Funding [email protected] +47 2294 9277
Address
DnB NOR ASA, N-0021 Oslo
Visiting address: Stranden 21 (Bryggetorget), Aker Brygge, Oslo
E-mail Investor Relations: [email protected]
Telefax Investor Relations: +47 2248 1994
DnB NOR switchboard: +47 03000
Information on the Internet
DnB NOR Investor Relations www.dnbnor.com
DnB NOR's home page www.dnbnor.no
Financial Calendar 2006
Preliminary results 2005 23 February
Annual general meeting 25 April Ex-dividend date 26 April First quarter 11 May Second quarter 10 August Third quarter 2 November

Second quarter 2005
3
Contents
1. DnB NOR - an overview................................................................... 5 Financial highlights................................................................................................. 6 DnB NOR - Norway's leading financial services group.................................................. 7 Group strategy ...................................................................................................... 8 Legal structure....................................................................................................... 9 Group business structure .......................................................................................11 Synergies - IFRS...................................................................................................13 Accounting principles and transition to IFRS .............................................................15
2. Financial results DnB NOR Group according to IFRS ......................... 17 Financial results - IFRS ..........................................................................................18
Net interest income - IFRS......................................................................................20 Net other operating income - IFRS ..........................................................................22 Operating expenses - IFRS .....................................................................................23 Net gain on sale of assets - IFRS.............................................................................25 Write-downs on loans and guarantees - IFRS............................................................26 Capital adequacy – NGAAP .....................................................................................27 Taxes - IFRS .......................................................................................................27 Financial results DnB NOR Group - IFRS...................................................................28 Key figures - IFRS.................................................................................................30
3. DnB NOR Group – business areas according to IFRS......................... 31 Business areas – extracts from profit and loss accounts - IFRS....................................32 Corporate Banking ................................................................................................34 Retail Banking ......................................................................................................42 DnB NOR Markets .................................................................................................47 Life Insurance and Pensions ...................................................................................52 Asset Management ................................................................................................62
4. Financial results for the banking group according to NGAAP ............. 67 Financial results – banking group - NGAAP ...............................................................68 Net interest income – banking group - NGAAP ..........................................................69 Net other operating income – banking group - NGAAP ...............................................71 Operating expenses – banking group - NGAAP ..........................................................75 Losses on loans and guarantees – banking group - NGAAP .........................................77 Asset quality – banking group - NGAAP....................................................................78 Lending – banking group - NGAAP...........................................................................79 Customer savings – banking group - NGAAP.............................................................81 Capital adequacy – banking group - NGAAP..............................................................81 Financial results – banking group - NGAAP ...............................................................82 Key figures – banking group - NGAAP ......................................................................83
5. Shareholder information ............................................................... 85 Equity-related data ...............................................................................................86 Shareholder structure ...........................................................................................87
6. The Norwegian economy............................................................... 89

Second quarter 2005
In accordance with Section 3-9 of the Norwegian Accounting Act, all listed companies are required to prepare consolidated accounts for 2005 in accordance with IFRS, International Financial Reporting Standards (previously IAS, International Accounting Standards). Financial information in section 1 and 2 refers to the consolidated accounts for DnB NOR ASA and have been prepared on the basis of consolidated accounts according to IFRS principles. Financial information in section 3 refers to operations in the DnB NOR Group business areas according to IFRS. Accounting principles are described in section 1. Information in section 4 refers to operations in DnB NOR banking group. The application ofIFRS is for the time being not allowed when preparing the statutory accounts for the banking group. Section 4 therefore has been prepared on the basis of accounting principles used by the DnB NOR Group up till 31 December 2004 (NGAAP). These principles are described in more detail in the annual report for 2004.
4

5
Section 1
DnB NOR- an overview

1. DnB NOR - an overview Third quarter 2005
(Pro forma accounting figures prior to 2005)
6
Financial highlights
3Q05 results • Pre-tax operating profit up 34 per cent to NOK 3.6 billion (2.7) • Profit for the period up 37 per cent to NOK 2.7 billion (1.9) • Expenses cut back to 48.9 per cent of income (56.5) • Return on equity was 19.5 per cent (16.7) • Earnings per share were NOK 1.99 (1.47) Accounting figures according to IFRS. Pro forma figures for the third quarter of 2004 in parentheses.

Third quarter 2005 1. DnB NOR - an overview (Pro forma accounting figures prior to 2005)
7
DnB NOR – Norway's leading financial services group
DnB NOR Group (IFRS) As at 30 Sept. 2005
• Total combined assets NOK 1 389 billion • Total balance sheet NOK 1 041 billion • Net lending NOK 652 billion • Customer deposits NOK 399 billion
Banking group operations (NGAAP) • Total assets NOK 832 billion • Net lending NOK 648 billion • Customer deposits NOK 409 billion
Asset management (IFRS) • Mutual funds (external clients) NOK 85 billion • Discretionary management (external clients) NOK 263 billion • Total assets under management (external clients) NOK 348 billion
Life Insurance and Pensions (IFRS) • Total assets NOK 193 billion
- of which unit linked NOK 13 billion
Customer base • Serving 2.2 million retail customers throughout Norway with various levels of activity • More than 165 000 corporate customers • Some 925 000 individuals insured • Asset Management has more than 676 000 mutual fund customers in Norway and
around 470 institutional clients in Norway and Sweden Market shares See business areas • Corporate Banking pp. 34-41 • Retail Banking pp. 42-46 • DnB NOR Markets pp. 47-51 • Life Insurance and Pensions pp. 52-61 • Asset Management pp. 62-66 Distribution network • 194 domestic DnB NOR branches • Online equities trading in 13 markets • 17 Nordlandsbanken branches • Online mutual funds trading • 7 international branches • About 300 post office counters 1) • 5 international representative offices • About 1 200 in-store postal outlets 1) • 43 Postbanken sales outlets • About 1 900 rural postmen 1) • Internet banking • 77 DnB NOR Eiendom sales offices • Electronic banking • 22 Vital sales offices • Telephone banking • 22 Vital agent agreements 1) Provided by Norway Post (the Norwegian postal system)
Credit ratings from international rating agencies
Long-term Short-term Long-term Short-term
DnB NOR Bank ASA Aa3 P-1 A + A-1
Moody's Standard & Poor's

1. DnB NOR - an overview Third quarter 2005
8
Group strategy
DnB NOR's strategic platform provides important guidelines for business choices. DnB NOR has Norway's largest customer base and is a leader in most Norwegian market segments. This market position provides a sound basis for generating further growth by developing and strengthening customer relationships. The business idea reflects DnB NOR's ambitions:
A local presence and a full range of services are our strengths
DnB NOR will be customers' best financial partner and will meet their needs for financial solutions throughout Norway and in selected areas in the international arena.
In the corporate and retail customer segments, the process of further developing service concepts and a product range closely adapted to individual customer needs is well under way. Improved advisory services and decision-making as close as possible to the customer are important aspects of the strategy. DnB NOR's various business areas cooperate closely to be able to offer customers good solutions at all times. DnB NOR must develop new products and services in step with the market. It is essential to offer solutions that bring convenience to the everyday lives of customers. Both internal and external communication should be open, sincere and easy to understand.
The Group will base growth in the international arena on comparative advantages in the form of competence within various customer segments and industries, special product expertise or established relationships where it is logical to follow the customer outside Norway. DnB NOR has a strong position within asset management in the Nordic region and a leading position in international shipping. In certain other sectors, such as energy and fisheries, the Group has strong expertise and an international presence. Sweden has now been defined as part of the DnB NOR Group’s home market. This implies that the Group will channel more resources into and maintain a general presence in the Swedish market, also focusing on products other than asset management, where the Group already has a strong position. The Baltic region is an important and rapidly expanding market where many of DnB NOR's Nordic customers have operations. The establishment of DnB NORD is an important strategic move with the aim to follow customers into one of Europe's most dynamic regions. DnB NOR is the preferred partner for international customers doing business in Norway.
A common value base and a common culture are prerequisites for creating a uniform DnB NOR image in the market. The Group's shared values, team spirit, simplicity and value creation, describe what should distinguish the organisation and work processes both internally and in relation to customers. The process of creating a DnB NOR culture will take several years, but is off to a good start through the work on the Group's strategic platform. Under the heading "This is the way we do things", units throughout the Group have defined what the Group's business idea and values mean for individual units and staff members. These values are also reflected in the leadership principles and in how the Group's brands will be projected in the market.
The Group has specified targets with respect to different stakeholder groups: customers, employees, shareholders and society at large. DnB NOR wishes to deliver products and services that are easily understood and adapted to meet the financial needs of customers. The Group seeks to offer a diversified and challenging workplace and wishes to be perceived as a financial services institution showing social responsibility. Finally DnB NOR wishes to be the preferred alternative for investors giving priority to long-term value creation. The financial targets reflect the aim to create shareholder value. The Group seeks to achieve a return on equity and share price increases that are competitive in a Nordic context.
DnB NOR has reviewed its financial target figures in light of the impact of the transition to IFRS. Although the new accounting principles will result in an increase in the cost/income ratio of approximately 2.5 percentage points and an estimated 0.5 percentage points decrease in the return on equity, DnB NOR has decided to maintain its financial targets unchanged. The targets are:
• A return on equity of over 15 per cent • A cost/income ratio under 50 per cent to be reached by 2008 • A core capital ratio of minimum 7 per cent • Around 50 per cent of annual profits should be distributed as dividends, provided that capital
adequacy remains at a satisfactory level • DnB NOR Bank ASA's ratings for ordinary long-term debt should be maintained at an Aa level
Third quarter 2005 1. DnB NOR - an overview
9
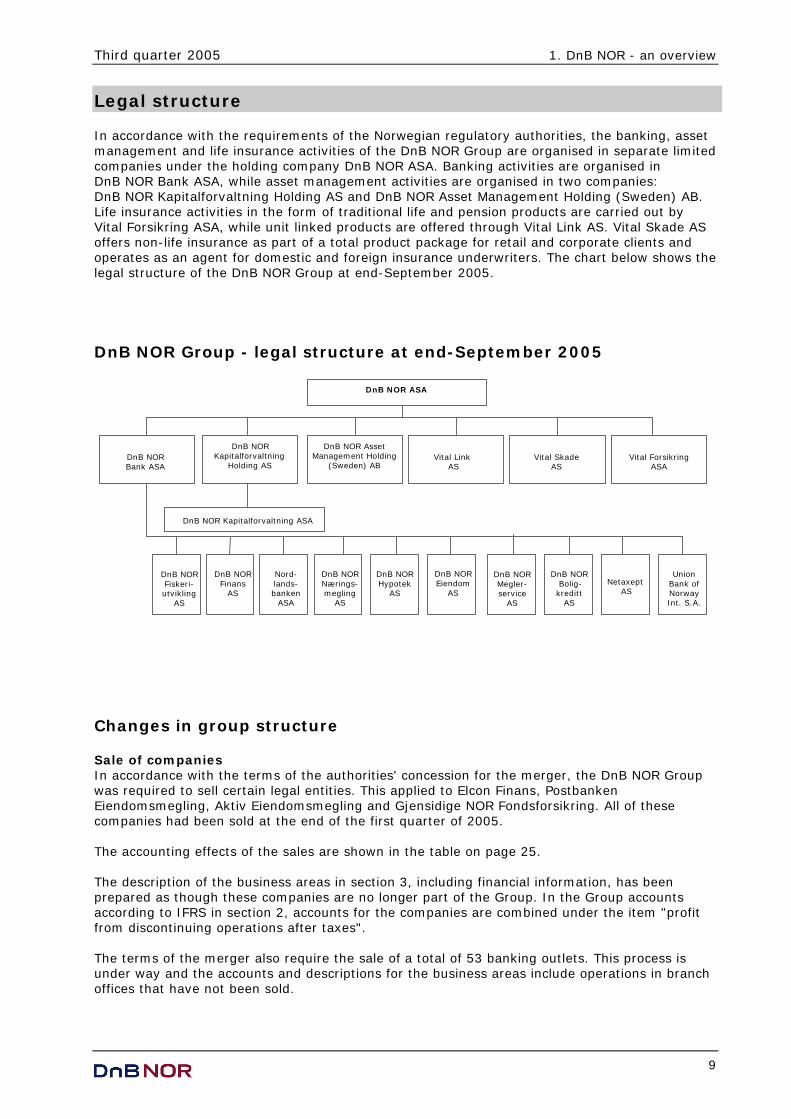
Legal structure In accordance with the requirements of the Norwegian regulatory authorities, the banking, asset management and life insurance activities of the DnB NOR Group are organised in separate limited companies under the holding company DnB NOR ASA. Banking activities are organised in DnB NOR Bank ASA, while asset management activities are organised in two companies: DnB NOR Kapitalforvaltning Holding AS and DnB NOR Asset Management Holding (Sweden) AB. Life insurance activities in the form of traditional life and pension products are carried out by Vital Forsikring ASA, while unit linked products are offered through Vital Link AS. Vital Skade AS offers non-life insurance as part of a total product package for retail and corporate clients and operates as an agent for domestic and foreign insurance underwriters. The chart below shows the legal structure of the DnB NOR Group at end-September 2005.
DnB NOR Group - legal structure at end-September 2005
DnB NOR Asset Management Holding
( Sweden ) AB
DnB NOR ASA
Vital Link AS
DnB NOR Kapitalforvaltning Holding AS
Vital Skade AS
Vital Forsikring ASA
DnB NOR Bank ASA
Nord - lands - banken
ASA
DnB NOR Nærings - megling
AS
DnB NOR Bolig - kreditt
AS
Union Bank of Norway Int . S.A.
DnB NOR Eiendom
AS
DnB NOR Megler - service
AS
Netaxept AS
DnB NOR Hypotek
AS
DnB NOR Kapitalforvaltning ASA
DnB NOR Finans
AS
DnB NOR Fiskeri - utvikling
AS
Changes in group structure Sale of companies In accordance with the terms of the authorities' concession for the merger, the DnB NOR Group was required to sell certain legal entities. This applied to Elcon Finans, Postbanken Eiendomsmegling, Aktiv Eiendomsmegling and Gjensidige NOR Fondsforsikring. All of these companies had been sold at the end of the first quarter of 2005. The accounting effects of the sales are shown in the table on page 25. The description of the business areas in section 3, including financial information, has been prepared as though these companies are no longer part of the Group. In the Group accounts according to IFRS in section 2, accounts for the companies are combined under the item "profit from discontinuing operations after taxes". The terms of the merger also require the sale of a total of 53 banking outlets. This process is under way and the accounts and descriptions for the business areas include operations in branch offices that have not been sold.

1. DnB NOR - an overview Third quarter 2005
10
Sale of shares in Follalaks AS DnB NOR sold its 51 per cent owned subsidiary Follalaks AS in the third quarter of 2005. Gain on the sale of shares in Follalaks amounted to NOK 107 million, see table on page 25. Sale of shares in Helgelandske AS DnB NOR sold its 28.8 per cent holding in Helgelandske AS in the third quarter of 2005. Gain on the sale of shares in Helgelandske was NOK 16 million, see table on page 25.
Establishment of new banking group in the Baltic region – DnB NORD In Norway, DnB NOR sees only a potential for organic growth, while further expansion must take place outside domestic borders. The Baltic region represents a large growth area, and on 21 June 2005, DnB NOR decided to establish a banking group under the name DnB NORD in cooperation with Norddeutsche Landesbank Girozentrale (NORD/LB), with operations in Denmark, Finland, Estonia, Latvia, Lithuania and Poland. The bank's head office will be located in Copenhagen, and an application for a concession was forwarded to the Danish authorities in August 2005. DnB NOR will obtain a significant strategic position in important expanding markets through the agreement. The new entity will be owned 51 per cent by DnB NOR Bank and 49 per cent by NORD/LB. The new bank is scheduled to become operative as from January 2006. DnB NORD will have a sound position in the Baltic Sea region from day one, with 1 450 employees, 111 branch offices, more than 550 000 customers and total assets of EUR 2.7 billion, corresponding to NOK 21 billion. DnB NOR will pay EUR 157.5 million, or NOK 1 240 million, for 51 per cent of the shares in DnB NORD. As part of the agreement, DnB NOR took over NORD/LB's operations in Sweden in September 2005. This transaction doubled DnB NOR's banking activities in Sweden.

Third quarter 2005 1. DnB NOR - an overview
11
Group business structure The activities of DnB NOR are organised into five operational business areas and four staff and support units. As independent profit centres, the business areas carry responsibility for customer segments served by the Group, as well as the products offered. The operational structure of DnB NOR deviates from its legal structure as activities in subsidiaries fall in under the business area relevant to the company's operations.
DnB NOR Group - organisation chart at end-September 2005 1)
Retail Banking
Åsmund Skår
Corporate Banking
Leif Teksum
Markets
Ottar Ertzeid
Asset Management
Øyvind Birkeland
Life Insurance and PensionsBård Benum
Finance/Group Staff
Tom Grøndahl
Payment Services
Leif Teksum
Human Resourcesand Group Services
Evlyn Raknerud
Group RiskManagement and IT
Helge Forfang
Group chief executive
Svein Aaser
1) Reporting structure The business areas carry responsibility for specific customer segments and key distribution channels, including sales of customer products, marketing, customer service, distribution and risk assessment in addition to product development, production and product pricing. The business areas are also responsible for the most business-critical support functions and have the opportunity to influence other staff and support units in the Group. Cooperation between the business areas is an important element in DnB NOR's strategy. A wide range of products, services and distribution channels enables the Group to offer customer solutions across business areas. Financial targets for business areas Differentiated financial requirements have been set for the business areas, which in combination will help the DnB NOR Group reach its financial targets. Return on equity is a key target figure for the DnB NOR Group, and thus also important for the business areas. In the internal management and follow-up of business areas, estimated capital requirements based on the Group's total risk model are used to calculate returns. The resulting capital reflects the inherent risk in the business areas' operations and makes it possible to calculate comparable returns for all business areas. The business areas have differentiated targets for return on capital and also have to meet other financial and non-financial targets. Returns for the business areas are presented in the descriptions of each area, see section 3. In this connection, return on capital is measured as the business area's profits after taxes relative to average capital requirements according to BIS rules (7 per cent capital requirement) for Retail Banking, Corporate Banking and DnB NOR Markets, while for Asset Management and Vital, the calculations are based on average recorded equity. This is consistent with the manner in which most other financial institutions present their business areas.

1. DnB NOR - an overview Third quarter 2005
12
Internal pricing DnB NOR's financial management model and operational organisation entail the sale of products and services between the business areas in the Group. The pricing of such intra-group transactions is regulated by internal agreements generally based on market terms. Services provided by staff and support units will as far as possible be scaled and priced according to use. Joint expenses incurred by group staff units and other group expenditures that cannot be debited according to use, are charged to the business areas' accounts on the basis of special distribution formulas. Costs relating to the Group's equity transactions, including strategic investments, are not charged to the business areas. Nor are the business areas charged with direct shareholder-related expenses and costs concerning the Group's governing bodies. Certain customers and transactions of major importance require extensive cooperation within the Group. To stimulate such cooperation, net income relating to some of these transactions is recorded in the accounts of all relevant business areas. This refers primarily to income from customer trading in Markets. In the third quarter of 2005, such income totalled NOK 217 million. Double entries are eliminated in the group accounts. For presentation of the business areas, see section 3.
Third quarter 2005 1. DnB NOR - an overview (Pro forma accounting figures prior to 2005)
13
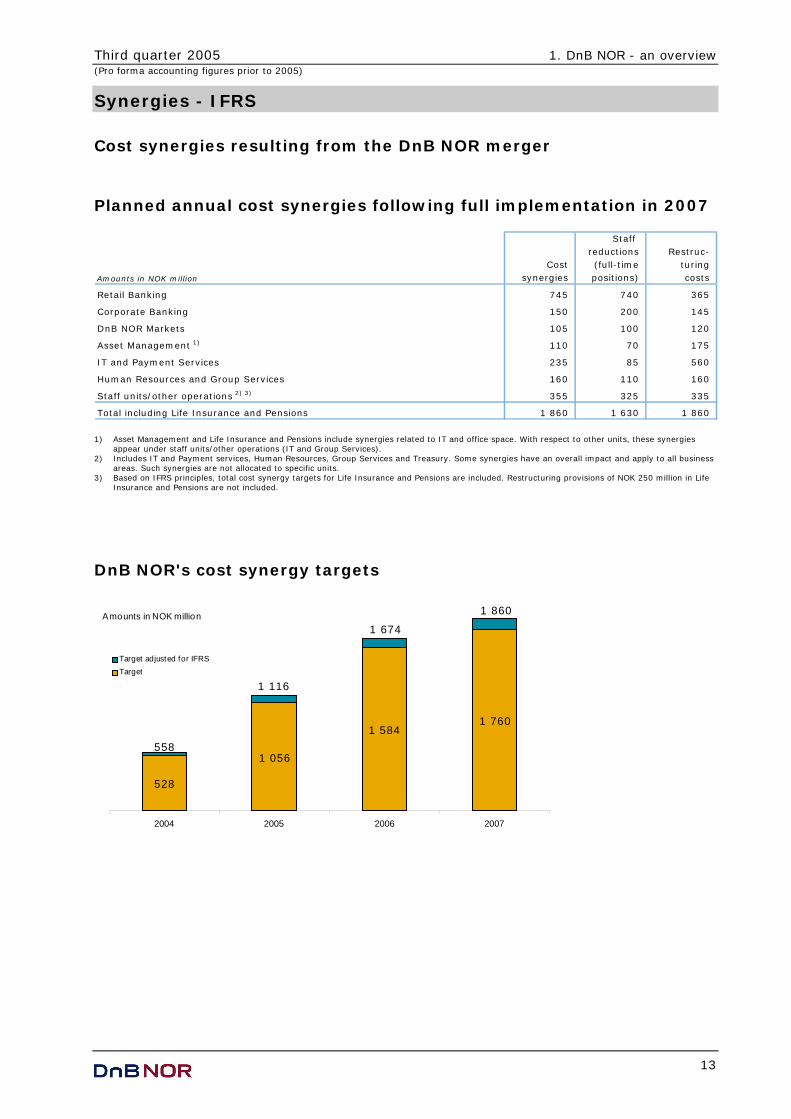
Synergies - IFRS
Cost synergies resulting from the DnB NOR merger
Planned annual cost synergies following full implementation in 2007
Staff reductions Restruc-
Cost (full-time turing
Amounts in NOK million synergies positions) costs
Retail Banking 745 740 365
Corporate Banking 150 200 145
DnB NOR Markets 105 100 120
Asset Management 1) 110 70 175
IT and Payment Services 235 85 560
Human Resources and Group Services 160 110 160
Staff units/other operations 2) 3) 355 325 335
Total including Life Insurance and Pensions 1 860 1 630 1 860
1) Asset Management and Life Insurance and Pensions include synergies related to IT and office space. With respect to other units, these synergies
appear under staff units/other operations (IT and Group Services). 2) Includes IT and Payment services, Human Resources, Group Services and Treasury. Some synergies have an overall impact and apply to all business
areas. Such synergies are not allocated to specific units. 3) Based on IFRS principles, total cost synergy targets for Life Insurance and Pensions are included. Restructuring provisions of NOK 250 million in Life
Insurance and Pensions are not included.
DnB NOR's cost synergy targets
1 056
1 5841 760
528
2004 2005 2006 2007
Target adjusted for IFRSTarget
Amounts in NOK million
558
1 860
1 674
1 116

1. DnB NOR - an overview Third quarter 2005
(Pro forma accounting figures prior to 2005)
14
Accumulated cost synergies • Profit and loss effect 2003: NOK 93 million • Profit and loss effect 2004: NOK 732 million • Profit and loss effect for the first three quarters of 2005: NOK 1 096 million
4 6
3 3
6 0
8 0
76
4 0
2 5
4 1
1Q04 2Q04 3Q04 4Q04 1Q05 2Q05 3Q05
Amounts in NOK million
79
13 9
2 19
3 3 5
2 9 5
4 0 1
3 6 0

Third quarter 2005 1. DnB NOR - an overview
15
Accounting principles and transition to IFRS Transitional effects Up till 31 December 2004, the DnB NOR Group's consolidated accounts were based on Norwegian accounting legislation, accounting regulations issued by Kredittilsynet (the Financial Supervisory Authority of Norway) and Norwegian generally accepted accounting principles. Effects of the transition from NGAAP to IFRS on the Group's profits for the third quarter and first three quarters of 2004 as well as equity as at 30 September 2004 are presented in note 1 in the third quarter report. Effects resulting from the transition to IFRS are described in further detail in note 1 in the first quarter report 2005. A description of transitional changes resulting from the transition to IFRS is presented in the "Supplementary Information for Investors and Analysts – 1Q05". Furthermore, a description of the transitional effects for selected 2004 profit and loss and balance sheet items is provided in "IFRS – new international accounting principles, restated 2004 figures", issued in April 2005. Accounting principles A description of the accounting principles applied by the Group in preparing the accounts for the third quarter of 2005 is found in "Supplementary Information for Investors and Analysts – 1Q05". The DnB NOR Group's annual accounts for 2005 will be presented according to IFRS principles in force as at 31 December 2005. The version of IAS 39 which allows the recording of the institution's issued debt securities not included in the trading portfolio at fair value has yet to be approved by the EU. See description of the fair value option below. Also, the EU has not yet approved stipulations in IAS 39 that open up for using core deposits in portfolio hedging of interest rate risk. The accounts for the third quarter of 2005 have been prepared within the scope of prevailing IFRSs without using the options not yet approved by the EU. However, see description of Eksportfinans ASA below. By employing approved methods for portfolio hedging and assessing fixed-rate loans at fair value, DnB NOR's overall presentation of the accounts will generally be consistent with the Group's interest rate management and actual financial performance. In June 2005, IASB (International Accounting Standards Board) issued the Fair Value Option (FVO). FVO allows for the recording of liabilities outside the trading portfolio at fair value. The DnB NOR Group will consider applying FVO in order to reduce inconsistency in the accounts resulting from collectively managed balance sheet items being assessed according to different valuation principles. The deadline for implementation was set at 1 September 2005. However, EU approval of the standard is not expected until the fourth quarter of 2005. The DnB NOR Group believes that implementation of the rules requires approval by the EU and will thus start applying the FVO in the fourth quarter of 2005. The use of FVO could result in changes in the DnB NOR Group's opening balance sheet. The introduction of the FVO and possible amendments to or new interpretations of other standards will result in certain changes in reporting as of the fourth quarter of 2005. The changes are expected to have no material impact on accounting figures. The accounting principles are applied consistently when consolidating holdings in subsidiaries and associated companies. When incorporating equity from the investment in Eksportfinans ASA, however, the version of IAS 39 - Financial Instruments not yet approved by the EU has been used. Consequently, financial assets and liabilities in Eksportfinans have been recorded at fair value, reflecting the actual underlying financial situation of the company. Pro forma accounting figures DnB NOR Group implemented IAS 39 – Financial Instruments, IFRS 2 – Share-based Payments, IFRS 4 – Insurance Contracts and IFRS 5 – Discontinuing Operations as of 1 January 2005. However, the accounts include pro forma figures for 2004 prepared as if the DnB NOR Group had implemented these standards as of 1 January 2004. Still, the pro forma figures are not fully documented according to requirements in the respective standards. Official comparable figures based on principles in force at any given time will be included in the annual accounts. Due to varying application of principles, however, they will be of limited information value.
1. DnB NOR - an overview Third quarter 2005
16

17
Section 2
Financial results DnB NOR Group
according to IFRS
Unless otherwise specified, figures are based on IFRS
DnB NORKapitalforvaltning
Holding AS andDnB NOR Asset
Management Holding(Sweden)AB
VitalForsikring ASA
andVital Link AS
AssetManagement
Life Insuranceand Pensions
DnB NOR ASA
The banking groupand its subsidiariesand business areas
CorporateBanking
Retail Banking
DnB NORMarkets
DnB NOR Group - IFRS
2. Financial results DnB NOR Group - IFRS Third quarter 2005 (Pro forma accounting figures prior to 2005)
18
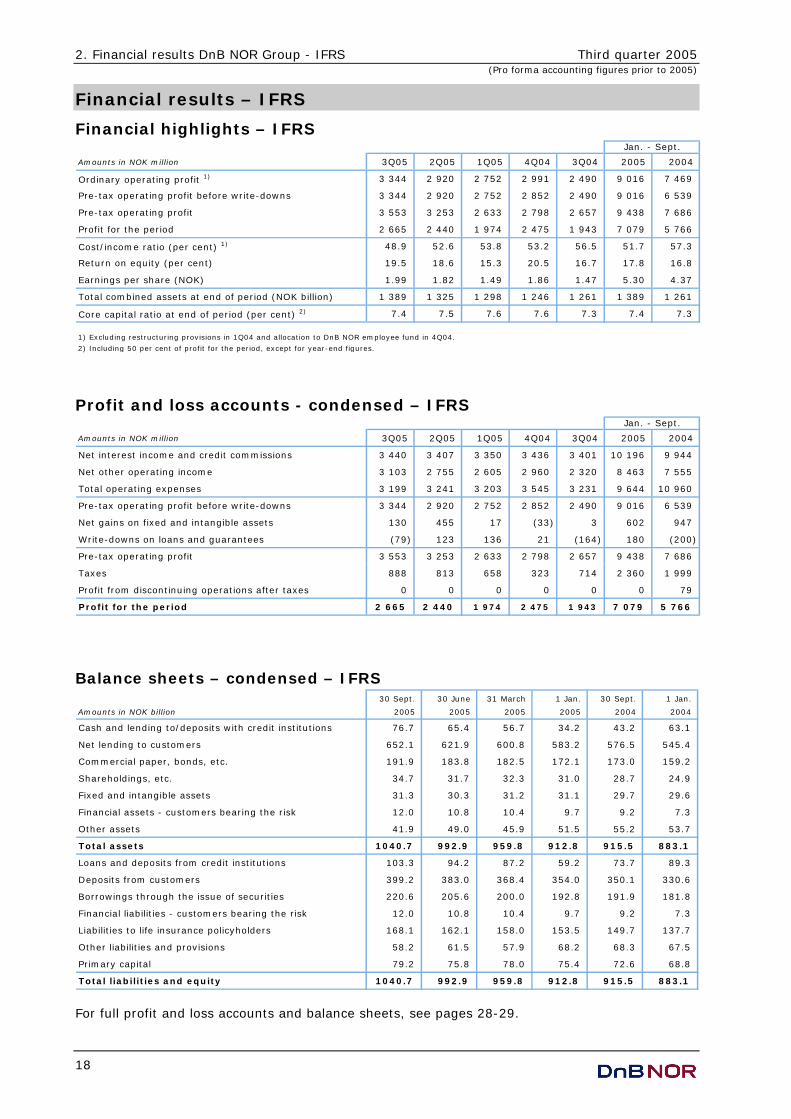
Financial results – IFRS
Financial highlights – IFRS
Amounts in NOK million 3Q05 2Q05 1Q05 4Q04 3Q04 2005 2004
Ordinary operating profit 1) 3 344 2 920 2 752 2 991 2 490 9 016 7 469
Pre-tax operating profit before write-downs 3 344 2 920 2 752 2 852 2 490 9 016 6 539
Pre-tax operating profit 3 553 3 253 2 633 2 798 2 657 9 438 7 686
Profit for the period 2 665 2 440 1 974 2 475 1 943 7 079 5 766
Cost/income ratio (per cent) 1) 48.9 52.6 53.8 53.2 56.5 51.7 57.3
Return on equity (per cent) 19.5 18.6 15.3 20.5 16.7 17.8 16.8
Earnings per share (NOK) 1.99 1.82 1.49 1.86 1.47 5.30 4.37
Total combined assets at end of period (NOK billion) 1 389 1 325 1 298 1 246 1 261 1 389 1 261
Core capital ratio at end of period (per cent) 2) 7.4 7.5 7.6 7.6 7.3 7.4 7.3
1) Excluding restructuring provisions in 1Q04 and allocation to DnB NOR employee fund in 4Q04. 2) Including 50 per cent of profit for the period, except for year-end figures.
Jan. - Sept.
Profit and loss accounts - condensed – IFRS
Amounts in NOK million 3Q05 2Q05 1Q05 4Q04 3Q04 2005 2004
Net interest income and credit commissions 3 440 3 407 3 350 3 436 3 401 10 196 9 944
Net other operating income 3 103 2 755 2 605 2 960 2 320 8 463 7 555
Total operating expenses 3 199 3 241 3 203 3 545 3 231 9 644 10 960
Pre-tax operating profit before write-downs 3 344 2 920 2 752 2 852 2 490 9 016 6 539
Net gains on fixed and intangible assets 130 455 17 (33) 3 602 947
Write-downs on loans and guarantees (79) 123 136 21 (164) 180 (200)
Pre-tax operating profit 3 553 3 253 2 633 2 798 2 657 9 438 7 686
Taxes 888 813 658 323 714 2 360 1 999
Profit from discontinuing operations after taxes 0 0 0 0 0 0 79
Profit for the period 2 665 2 440 1 974 2 475 1 943 7 079 5 766
Jan. - Sept.
Balance sheets – condensed – IFRS 30 Sept. 30 June 31 March 1 Jan. 30 Sept. 1 Jan.
Amounts in NOK billion 2005 2005 2005 2005 2004 2004
Cash and lending to/deposits with credit institutions 76.7 65.4 56.7 34.2 43.2 63.1
Net lending to customers 652.1 621.9 600.8 583.2 576.5 545.4
Commercial paper, bonds, etc. 191.9 183.8 182.5 172.1 173.0 159.2
Shareholdings, etc. 34.7 31.7 32.3 31.0 28.7 24.9
Fixed and intangible assets 31.3 30.3 31.2 31.1 29.7 29.6
Financial assets - customers bearing the risk 12.0 10.8 10.4 9.7 9.2 7.3
Other assets 41.9 49.0 45.9 51.5 55.2 53.7
Total assets 1040.7 992.9 959.8 912.8 915.5 883.1
Loans and deposits from credit institutions 103.3 94.2 87.2 59.2 73.7 89.3
Deposits from customers 399.2 383.0 368.4 354.0 350.1 330.6
Borrowings through the issue of securities 220.6 205.6 200.0 192.8 191.9 181.8
Financial liabilities - customers bearing the risk 12.0 10.8 10.4 9.7 9.2 7.3
Liabilities to life insurance policyholders 168.1 162.1 158.0 153.5 149.7 137.7
Other liabilities and provisions 58.2 61.5 57.9 68.2 68.3 67.5
Primary capital 79.2 75.8 78.0 75.4 72.6 68.8
Total liabilities and equity 1040.7 992.9 959.8 912.8 915.5 883.1
For full profit and loss accounts and balance sheets, see pages 28-29.

Third quarter 2005 2. Financial results DnB NOR Group - IFRS (Pro forma accounting figures prior to 2005)
19
Profits – IFRS
2 852
2 752
2 920
2 490
3 344
2 440
2 665
1 974
2 475
1 943
3Q04 4Q04 1Q05 2Q05 3Q05
NOK million Pre-tax operating profit before write-downs
Profit for theperiod
2. Financial results DnB NOR Group - IFRS Third quarter 2005 (Pro forma accounting figures prior to 2005)
20
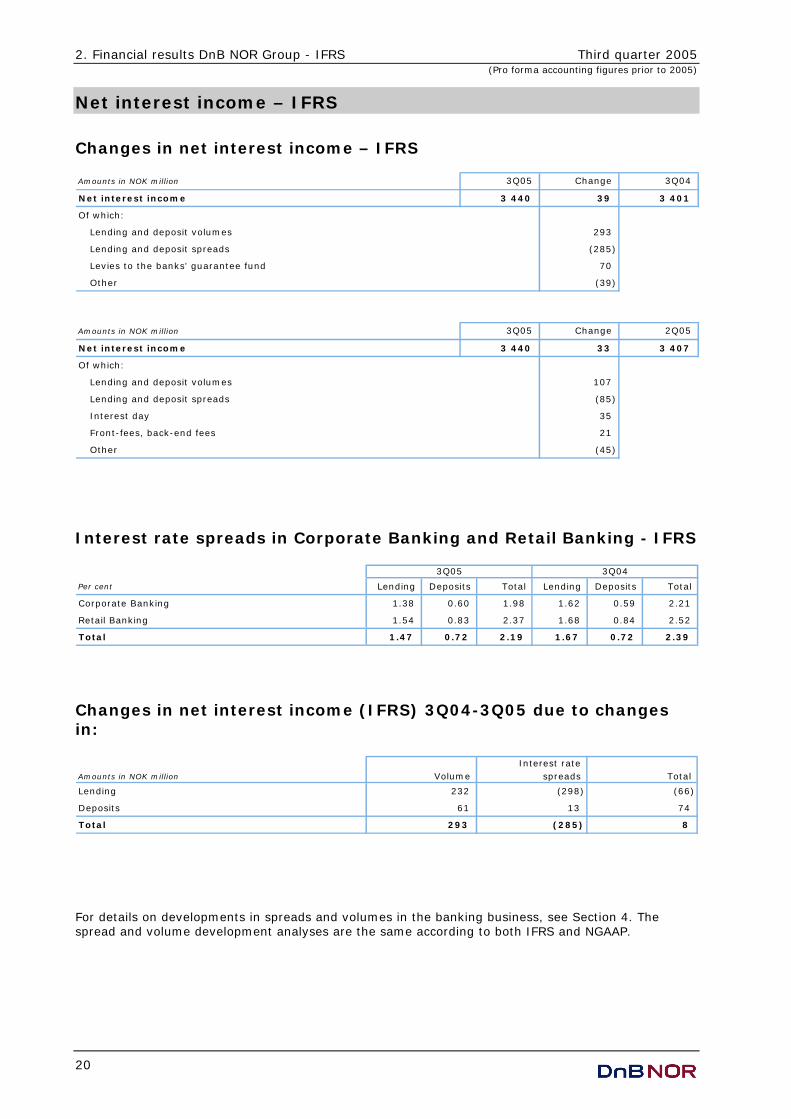
Net interest income – IFRS
Changes in net interest income – IFRS Amounts in NOK million 3Q05 Change 3Q04
Net interest income 3 440 39 3 401
Of which:
Lending and deposit volumes 293
Lending and deposit spreads (285)
Levies to the banks' guarantee fund 70
Other (39)
Amounts in NOK million 3Q05 Change 2Q05
Net interest income 3 440 33 3 407
Of which:
Lending and deposit volumes 107
Lending and deposit spreads (85)
Interest day 35
Front-fees, back-end fees 21
Other (45)
Interest rate spreads in Corporate Banking and Retail Banking - IFRS
Per cent Lending Deposits Total Lending Deposits Total
Corporate Banking 1.38 0.60 1.98 1.62 0.59 2.21
Retail Banking 1.54 0.83 2.37 1.68 0.84 2.52
Total 1.47 0.72 2.19 1.67 0.72 2.39
3Q05 3Q04
Changes in net interest income (IFRS) 3Q04-3Q05 due to changes in:
Interest rate Amounts in NOK million Volume spreads Total
Lending 232 (298) (66)
Deposits 61 13 74
Total 293 (285) 8
For details on developments in spreads and volumes in the banking business, see Section 4. The spread and volume development analyses are the same according to both IFRS and NGAAP.

Third quarter 2005 2. Financial results DnB NOR Group - IFRS (Pro forma accounting figures prior to 2005)
21
Developments in average interest rate spreads
2.292.392.39
2.19
2.24
2.02 1.99 1.992.09
2.27
3Q04 4Q04 1Q05 2Q05 3Q05
Per cent
1) Combined spread for lending and deposits
3-month NIBOR
Combined spread 1)
Developments in volumes 1)
577 583 601 622652
350 354 368 383 399
30 Sept. 04 31 Dec. 04 31 March 05 30 June 05 30 Sept. 05
NOK billion
1) Excluding discontinued operations
Lending (Growth 30 Sept. 2004 - 05: 13.1%)
Deposits (Growth 30 Sept. 2004 - 05: 14.0%)

2. Financial results DnB NOR Group - IFRS Third quarter 2005 (Pro forma accounting figures prior to 2005)
22
Net other operating income – IFRS
Amounts in NOK million 3Q05 2Q05 1Q05 4Q04 3Q04 2005 2004
Money transfer and interbank transactions 478 505 459 512 525 1 441 1 479
Asset management services 299 269 282 287 251 850 763
Credit broking, guarantees etc. 67 65 54 56 67 187 188
Real estate broking 172 175 123 155 145 470 424
Custodial services 47 60 39 49 40 147 120
Securities trading 89 72 83 44 49 244 179
Sale of insurance products through the banking network 101 92 98 82 59 290 204
Other income from banking services 148 109 93 112 89 351 307
Net gains on share investments 456 243 87 141 13 786 279
Corporate finance etc. 88 50 126 83 42 264 164
Other income 91 164 223 192 167 479 631
Net income from Life Insurance and Pension operations 601 555 604 800 512 1 760 1 616
FX and interest rate instruments 1) 464 396 335 448 361 1 195 1 202
Net other operating income 3 103 2 755 2 605 2 960 2 320 8 463 7 555
As a percentage of total income 47.4 44.7 43.8 46.3 40.6 45.4 43.2
1) Of which:
Customer trading in FX and interest rate instruments, DnB NOR Markets - NGAAP 249 251 333 259 209 834 679
Trading in FX and interest rate instruments, DnB NOR Markets - NGAAP 209 147 111 178 110 466 438
Banking portfolio, other 36 (1) 7 36 28 43 79
IFRS adjustments etc. (29) (2) (116) (25) 14 (148) 6
Total FX and interest rate instruments 464 396 335 448 361 1 195 1 202
Jan. - Sept.
Changes in net other operating income – IFRS Amounts in NOK million 3Q05 Change 3Q04
Net other operating income 3 103 783 2 320
Of which:
Commissions receivable 214
Income on financial instruments 542
Net income from life insurance and pension operations 89
Other income (62)

Third quarter 2005 2. Financial results DnB NOR Group - IFRS (Pro forma accounting figures prior to 2005)
23
Operating expenses – IFRS
Amounts in NOK million 3Q05 2Q05 1Q05 4Q04 3Q04 2005 2004
Staff costs 1 730 1 666 1 706 1 711 1 695 5 102 5 163
Other costs 1 306 1 411 1 337 1 458 1 306 4 053 4 143
Depreciation, impairment on fixed and
intangible assets 162 165 161 238 230 488 724
Total ordinary operating expenses 3 199 3 241 3 203 3 406 3 231 9 644 10 030
Other 0 0 0 139 0 0 930
Total operating expenses 3 199 3 241 3 203 3 545 3 231 9 644 10 960
Jan. - Sept.
Changes in total operating expenses – IFRS Amounts in NOK million 3Q05 Change 3Q04
Total operating expenses 3 199 (32) 3 231
Of which:
Wage settlements 31
Performance-based pay 88
Marketing 36
Merger synergies (182)
Other (5)
Cost/income ratio – IFRS
52.653.856.5
53.248.9
3 4063 1993 203 3 2413 231
6 397
5 9556 162
5 721
6 543
2 0 .0
3 0 .0
4 0 .0
5 0 .0
6 0 .0
7 0 .0
8 0 .0
9 0 .0
1 0 0 .0
3Q04 4Q04 1Q05 2Q05 3Q05
2 5 0 0
3 0 0 0
3 5 0 0
4 0 0 0
4 5 0 0
5 0 0 0
5 5 0 0
6 0 0 0
6 5 0 0
Cost/income ratio(per cent)
Total income (NOK million)
Operating expenses(NOK million)
1) Excluding allocations to employee funds
1)
2. Financial results DnB NOR Group - IFRS Third quarter 2005 (Pro forma accounting figures prior to 2005)
24
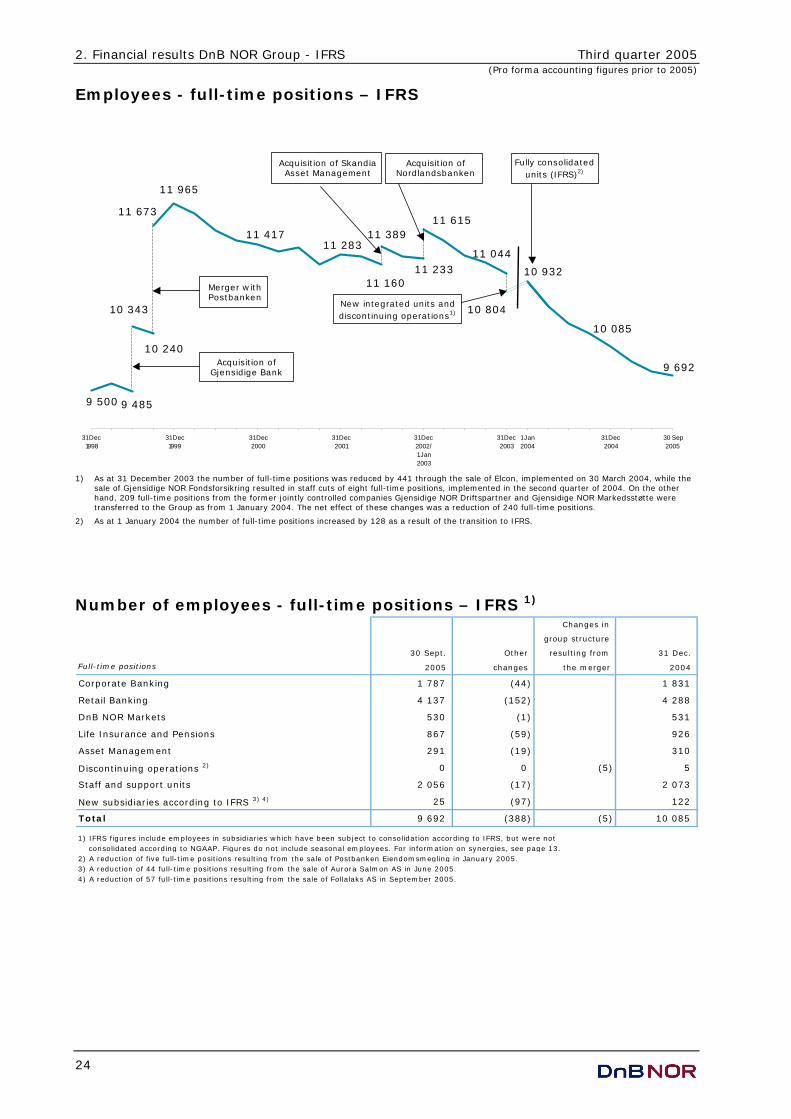
Employees - full-time positions – IFRS
9 692
10 804
10 085
11 673
11 965
11 41711 283
11 160
11 615
11 044
9 4859 500
11 389
11 233
10 240
10 343
31 Dec1998
31 Dec1999
31 Dec2000
31 Dec2001
31 Dec2002/1 Jan2003
31 Dec2003
1 Jan 2004
31 Dec2004
30 Sep2005
Merger with Postbanken
Acquisition of Gjensidige Bank
New integrated units and discontinuing operations1)
Acquisition of Skandia Asset Management
Acquisition of Nordlandsbanken
10 932
Fully consolidated units (IFRS)2)
1) As at 31 December 2003 the number of full-time positions was reduced by 441 through the sale of Elcon, implemented on 30 March 2004, while the
sale of Gjensidige NOR Fondsforsikring resulted in staff cuts of eight full-time positions, implemented in the second quarter of 2004. On the other hand, 209 full-time positions from the former jointly controlled companies Gjensidige NOR Driftspartner and Gjensidige NOR Markedsstøtte were transferred to the Group as from 1 January 2004. The net effect of these changes was a reduction of 240 full-time positions.
2) As at 1 January 2004 the number of full-time positions increased by 128 as a result of the transition to IFRS.
Number of employees - full-time positions – IFRS 1) Changes in
group structure
30 Sept. Other resulting from 31 Dec.
Full-time positions 2005 changes the merger 2004
Corporate Banking 1 787 (44) 1 831
Retail Banking 4 137 (152) 4 288
DnB NOR Markets 530 (1) 531
Life Insurance and Pensions 867 (59) 926
Asset Management 291 (19) 310
Discontinuing operations 2) 0 0 (5) 5
Staff and support units 2 056 (17) 2 073
New subsidiaries according to IFRS 3) 4) 25 (97) 122
Total 9 692 (388) (5) 10 085
1) IFRS figures include employees in subsidiaries which have been subject to consolidation according to IFRS, but were not consolidated according to NGAAP. Figures do not include seasonal employees. For information on synergies, see page 13.2) A reduction of five full-time positions resulting from the sale of Postbanken Eiendomsmegling in January 2005.3) A reduction of 44 full-time positions resulting from the sale of Aurora Salmon AS in June 2005.4) A reduction of 57 full-time positions resulting from the sale of Follalaks AS in September 2005.

Third quarter 2005 2. Financial results DnB NOR Group - IFRS (Pro forma accounting figures prior to 2005)
25
IT expenses – IFRS
Amounts in NOK million 3Q05 2Q05 1Q05 4Q04 3Q04 2005 2004
IT operating expenses 416 423 399 379 417 1 238 1 304
Systems development expenses 142 142 142 143 143 426 439
Life Insurance and Pensions 71 103 98 122 110 271 341
Total IT expenses 1) 626 671 639 644 669 1 935 2 084
1) Including salaries and indirect costs.
Jan. - Sept.
Restructuring provisions – IFRS 1)
Amounts in NOK million 30 Sept. 2005 2) Expenses 1 Jan. 2005 2)
DnB NOR merger 383 575 958
Other restructuring provisions 30 10 40
Total 413 585 998 *) Of which:
IT 245
Staff cuts 220
Real estate 83
Other 27
*)
1) In the fourth quarter of 2004, NOK 250 million was allocated to restructuring measures in Vital in connection with the merger between Vital
Forsikring and Gjensidige NOR Spareforsikring ASA. These provisions are not included in the above table. 2) In connection with the merger between DnB and Gjensidige NOR, a total of NOK 1 860 million was allocated to restructuring measures. The table
shows the provisions remaining to cover restructuring measures not yet implemented.
For information on synergies, see page 13.
Net gains on sale of assets - IFRS
Amounts in NOK million 3Q05 2Q05 1Q05 4Q04 3Q04 2005 2004
Net gains on financial instruments at fair value 820 576 453 563 354 1 849 1 447
of which major gains included:
- Brazil-investments 198 198
Net gains on fixed and intangible assets 130 455 17 (33) 3 602 947
of which major gains included:
- Follalaks 107 107
- Helgelandske 16 16
- Pan Fish 314 314
- Aurora Salmon 59 59
- Akersgt. 64-67 (real estate) 64 64
- Postbanken Eiendomsmegling 16 16
- Elcon Finans 880
- Gjensidige NOR Fondsforsikring 35 35
- Other 7 18 1 (33) (32) 26 32
Jan. - Sept.

2. Financial results DnB NOR Group - IFRS Third quarter 2005 (Pro forma accounting figures prior to 2005)
26
Write-downs on loans and guarantees – IFRS
Write-downs (profit and loss accounts) – IFRS
Amounts in NOK million 3Q05 2Q05 1Q05 4Q04 3Q04 2005 2004
Individual write-downs (57) 183 186 90 (95) 312 7
Group write-downs (22) (60) (50) (69) (69) (132) (207)
Write-downs (79) 123 136 21 (164) 180 (200)
Jan. - Sept.
Write-downs (balance sheets) – IFRS
Amounts in NOK million 30 Sept. 2005 31 Dec. 2004 1 Jan. 2004
Individual write-downs 1) 3 373 3 631 4 524
Group write-downs 1 346 1 478 1 841
Write-downs 4 719 5 109 6 365
1) Include write-downs on guarantees and loans to credit institutions.
Net impaired commitments - IFRS
3.84.1
4.64.8
8.59.0
9.8
9.0
8.3 8.1 8.0
6.9
5.7 5.85.6
4.9
31 March
30June
30Sept.
31Dec.
1Jan.
31 March
30June
30Sept.
31Dec.
31 March
30June
30Sept.
31Dec.
31 March
30June
30Sept.
2002 2003 2004 2005
Net impaired commitments - IFRS (NOK billion)
As a percentage of net loans
Including Nordlandsbanken
0.88%0.95%0.95%
0.74%
For details on losses and non-performing loans according to NGAAP, see Section 4.

Third quarter 2005 2. Financial results DnB NOR Group - IFRS (Pro forma accounting figures prior to 2005)
27
Capital adequacy – NGAAP
Development in primary capital and capital ratios – NGAAP
The Financial Supervisory Authority of Norway has not adapted Norwegian capital adequacy regulations to IFRS. For the time being, capital adequacy calculations are based on special consolidation rules for statutory accounts, which thus far are not allowed to be stated according to IFRS. Amounts in NOK million 30 Sept. 2005 31 Dec. 2004 30 Sept. 2004
Share capital 13 367 13 271 13 220
Other equity 33 620 33 327 29 337
Total equity 46 988 46 598 42 557
Perpetual subordinated loan capital securities 1) 2) 5 590 5 531 5 859
Reductions:
Pension funds above pension commitments (1 263) (1 141) (1 322)
Goodwill (4 394) (4 902) (5 085)
Deferred tax assets (732) (728) (912)
Other intangible assets etc. (217) (299) (247)
Core capital 45 970 45 059 40 850
Perpetual subordinated loan capital 1) 2) 5 648 5 367 5 829
Term subordinated loan capital 2) 14 190 13 538 12 748
Net supplementary capital 19 838 18 905 18 577
Deductions 32 455 291
Total eligible primary capital 3) 65 776 63 509 59 137
Total risk-weighted volume 661 802 591 906 591 794
Core capital ratio (%) 6.9 7.6 6.9
Capital ratio (%) 9.9 10.7 10.0
Core capital ratio incl. 50 per cent of profit for the period (%) 7.4 7.3
Capital ratio incl. 50 per cent of profit for the period (%) 10.4 10.4
Core capital ratio excluding life insurance (%) 7.9 8.5 8.1
Capital ratio excluding life insurance (%) 9.9 10.7 10.2
1) Perpetual subordinated loan capital securities can represent up to 15 per cent of core capital. The excess will qualify as perpetual supplementary
capital. 2) Calculations of capital adequacy include a total of NOK 578 million in subordinated loan capital in associated companies, in addition to subordinated
loan capital in the Group's balance sheet. 3) Primary capital and nominal amounts used in calculating risk-weighted volume deviate from figures in the DnB NOR Group's accounts as a different
consolidation method ("pro rata consolidation") is used in calculating capital adequacy. See also comments above the table. For information on capital adequacy in the bank and banking group, see page 81.
Taxes – IFRS The DnB NOR Group's tax charge for the third quarter of 2005 was NOK 888 million, based on an anticipated average tax rate of 25 per cent of pre-tax operating profits. After the transition to IFRS, taxes on insurance operations are classified as taxes for the DnB NOR Group. In accounts prepared on the basis of NGAAP, the DnB NOR Group incorporated profits from life insurance operations according to the equity method, whereby taxes were netted against income.

2. Financial results DnB NOR Group - IFRS Third quarter 2005 (Pro forma accounting figures prior to 2005)
28
Financial results DnB NOR Group – IFRS
Full profit and loss accounts – IFRS
Amounts in NOK million 3Q05 2Q05 1Q05 4Q04 3Q04 2005 2004
Interest income 7 626 7 275 7 057 7 262 7 229 21 958 21 791
Interest expenses 4 187 3 868 3 707 3 825 3 829 11 762 11 847
Net interest income and credit commissions 3 440 3 407 3 350 3 436 3 401 10 196 9 944
Commissions and fees receivable etc. 2 181 2 081 2 026 2 015 1 923 6 288 5 842
Commissions and fees payable etc. 593 577 587 563 564 1 757 1 704
Net gains on financial instruments at fair value 820 576 453 563 354 1 849 1 447
Net gains on financial assets in life insurance and profits from insurance operations 289 267 337 539 240 893 791
Net realised gains on investment securities (AFS) 100 31 0 26 25 131 33
Profit from companies accounted for by the equity method 22 34 61 2 13 117 92
Other income 283 343 316 379 329 942 1 053
Net other operating income 3 103 2 755 2 605 2 960 2 320 8 463 7 555
Staff costs 1 730 1 666 1 706 1 711 1 695 5 102 5 163
Other costs 1 306 1 411 1 337 1 597 1 306 4 053 5 073
Depreciation, impairment on fixed and intangible assets 162 165 161 238 230 488 724
Total operating expenses 3 199 3 241 3 203 3 545 3 231 9 644 10 960
Pre-tax operating profit before write-downs 3 344 2 920 2 752 2 852 2 490 9 016 6 539
Net gains on fixed and intangible assets 130 455 17 (33) 3 602 947
Write-downs on loans and guarantees (79) 123 136 21 (164) 180 (200)
Pre-tax operating profit 3 553 3 253 2 633 2 798 2 657 9 438 7 686
Taxes 888 813 658 323 714 2 360 1 999
Profit from discontinuing operations after taxes 0 0 0 0 0 0 79
Profit for the period 2 665 2 440 1 974 2 475 1 943 7 079 5 766
Earnings per share 1.99 1.82 1.49 1.87 1.47 5.30 4.37
Jan. - Sept.

Third quarter 2005 2. Financial results DnB NOR Group - IFRS (Pro forma accounting figures prior to 2005)
29
Full balance sheets – IFRS
30 Sept. 30 June 31 March 1 Jan. 30 Sept. 1 Jan.
Amounts in NOK million 2005 2005 2005 2005 2004 2004
Cash and deposits with central banks 24 264 1 593 7 366 8 780 12 802 8 570
Lending to and deposits with credit institutions 52 477 63 825 49 342 25 397 30 448 54 496
Gross lending to customers 656 655 626 712 605 593 588 153 581 935 551 646
- Accumulated write-downs (4 530) (4 778) (4 788) (4 981) (5 427) (6 294)
Net lending to customers 652 125 621 934 600 805 583 172 576 508 545 352
Trading securities - commercial paper and bonds 60 738 57 148 52 999 48 470 48 470 32 221
Trading securities - shareholdings etc. 1 323 412 1 270 1 117 1 117 272
Financial assets - customers bearing the risk 12 016 10 766 10 354 9 747 9 230 7 287
Other financial instruments at fair value through profit and loss - commercial paper and bonds 78 916 75 010 75 152 67 966 67 898 79 550
Other financial instruments at fair value through profit and loss - shareholdings etc. 32 033 29 680 29 288 28 078 25 695 22 660
Financial derivative instruments 32 558 37 021 34 384 41 148 36 493 37 693
Financial derivative instruments used for hedging 1 443 2 189 1 200 1 828 1 828 1 504
Shareholdings - available for sale 0 210 298 303 271 480
Commercial paper and bonds - held to maturity 52 282 51 656 54 390 55 645 56 588 47 414
Investment property 19 703 18 335 18 725 18 616 16 934 16 884
Investments in associated companies 1 362 1 382 1 452 1 507 1 641 1 495
Intangible assets 5 345 5 399 5 524 5 574 5 847 6 089
Deferred tax assets 395 416 427 406 350 183
Fixed assets 5 808 5 990 6 240 6 189 6 250 6 303
Biological assets 0 147 247 278 278 183
Discontinuing operations 0 0 0 25 25 1 479
Accrued income and prepaid expenses 1 872 2 207 2 596 2 311 2 145 2 029
Other assets 6 006 7 586 7 737 6 220 14 722 10 968
Total assets 1 040 665 992 904 959 797 912 779 915 539 883 113
Loans and deposits from credit institutions 103 297 94 150 87 222 59 174 73 734 89 346
Deposits from customers 399 183 382 959 368 358 353 957 350 132 330 635
Financial derivative instruments 30 260 36 636 33 822 44 134 39 796 43 850
Securities issued 220 630 205 636 200 006 192 812 191 869 181 775
Insurance liabilities - customers bearing the risk 12 016 10 766 10 354 9 747 9 230 7 287
Liabilities to life insurance policyholders 168 056 162 143 157 972 153 488 149 713 137 693
Other liabilities 20 590 16 552 14 594 14 721 15 394 12 673
Accrued expenses and prepaid income 2 575 3 161 4 103 3 822 8 004 4 943
Discontinuing operations 0 0 0 24 24 1 227
Provisions 4 822 5 101 5 374 5 486 5 047 4 844
Subordinated loan capital 25 193 24 283 25 523 25 256 24 981 24 504
Total liabilities 986 622 941 387 907 328 862 620 867 925 838 778
Minority interests 6 42 33 33 44 8
Revaluation reserve 0 90 116 122 92 92
Share capital 13 367 13 369 13 366 13 271 13 220 13 090
Other reserves and retained earnings 40 670 38 016 38 954 36 734 34 259 31 144
Total equity 54 043 51 517 52 470 50 159 47 614 44 334
Total liabilities and equity 1 040 665 992 904 959 797 912 779 915 539 883 113

2. Financial results DnB NOR Group - IFRS Third quarter 2005 (Pro forma accounting figures prior to 2005)
30
Key figures – IFRS
3Q05 2Q05 1Q05 4Q04 3Q04 2005 2004 Interest rate analysis1 Combined average spread for lending and deposits (%) 2.19 2.24 2.29 2.39 2.39 2.24 2.36
2 Spread for ordinary lending to customers (%) 1.47 1.54 1.61 1.66 1.67 1.54 1.67
3 Spread for deposits from customers (%) 0.72 0.69 0.68 0.73 0.72 0.70 0.69
Rate of return/profitability 4 Net other operating income, per cent of total income 47.4 44.7 43.7 46.3 40.6 45.4 43.2
5 Cost/income ratio (%) 48.9 52.6 53.8 53.2 56.5 51.7 57.3
6 Return on equity (%) 19.5 18.6 15.3 20.5 16.7 17.8 16.8
7 Average equity including allocated dividend (NOK million) 52 756 51 754 51 282 48 848 46 631 52 000 45 786
Financial strength 8 Core (Tier 1) capital ratio at end of period (%) 6.9 7.2 7.4 7.6 6.9 6.9 6.9
9 Core (Tier 1) capital ratio incl. 50 of profit for the period (%) 7.4 7.5 7.6 - 7.3 7.4 7.3
10 Capital adequacy ratio at end of period (%) 9.9 10.2 10.5 10.7 10.0 9.9 10.0
11 Capital adequacy ratio incl. 50% of profit for the period (%) 10.4 10.5 10.6 - 10.4 10.4 10.4
12 Core capital at end of period (NOK million) 45 970 45 945 45 628 45 059 40 850 45 970 40 850
13 Total eligible primary capital at end of period (NOK million) 65 776 64 897 64 309 63 509 59 137 65 776 59 137
14 Risk-weighted volume at end of period (NOK million) 661 802 634 057 615 011 591 906 591 794 661 802 591 794
Loan portfolio and impairments15 Write-downs relative to gross lending annualised (%) (0.05) 0.08 0.09 0.01 (0.11) 0.04 (0.05)
16 Impaired commitments, per cent of net lending 0.74 0.88 0.95 0.97 1.17 0.74 1.17
17 Accumulated write-downs relative to total gross lending (%) 0.67 0.76 0.79 0.85 0.93 0.67 0.93
18 Net impaired commitments at end of period (NOK million) 4 934 5 571 5 815 5 726 6 864 4 934 6 864
Liquidity 19 Ratio of customer deposits to net lending at end of period (%) 61.2 61.6 61.3 60.7 60.7 61.2 60.7
Total assets owned or managed by DnB NOR 20 Assets under management at end of period (NOK billion) 528 505 506 496 504 528 504
21 Average total combined assets (NOK billion) 1 357 1 311 1 272 1 253 1 269 1 313 1 264
22 Total combined assets at end of period (NOK billion) 1 389 1 325 1 298 1 246 1 261 1 389 1 261
23 Customer savings at end of period (NOK billion) 933 894 883 857 861 933 861
Staff 24 Number of full-time positions at end of period 9 692 9 755 9 874 10 085 10 242 9 692 10 242
25 - of which in Life Insurance and Pensions 867 880 894 926 994 867 994
The DnB NOR share 26 Number of shares at end of period (1 000) 1 336 875 1 336 875 1 336 875 1 327 139 1 321 957 1 336 875 1 321 957
27 Average number of shares (1 000) 1 336 875 1 336 875 1 327 139 1 325 899 1 321 957 1 333 701 1 317 931
28 Earnings per share (NOK) 1.99 1.82 1.49 1.87 1.47 5.30 4.37
29 Total shareholder's return (%) (1.1) 9.6 8.4 12.2 12.6 17.5 26.1
30 Equity per share including allocated dividend at end of period (NOK) 40.42 38.54 39.25 37.79 36.02 40.42 36.02
31 Share price at end of period (NOK) 67.50 68.25 64.75 59.75 53.25 67.50 53.25
32 Price/book value 1.67 1.77 1.65 1.58 1.48 1.67 1.48
33 Market capitalisation (NOK billion) 90.2 91.2 86.6 79.3 70.4 90.2 70.4
Definitions 1,2,3 Excluding discontinuing operations.
4 Including operations in Life Insurance and Pensions.
5 Expenses/Total income, including operations in Life Insurance and Pensions.
Excluding restructuring provisions in the first quarter of 2004 and allocation to DnB NOR employee funds in the fourth quarter of 2004.
6 Net profits excluding discontinuing operations and adjusted for the period's change in fair value recognised directly to equity. Average equity including
net profits, allocated dividend, available-for-sale assets, translation differences and other revaluations recognised directly to equity. Average equity excluding
minority interests and cash flow hedge reserves.
28 Excluding discontinuing operations. Earnings excluding minority interests. Holdings of own shares are not included in the average number of shares.
31 The last quoted share price on Oslo Børs at end of period relative to the book value of equity at end of period.
33 Number of shares multiplied by the share price at end of period.
Jan. - Sept.

31
Section 3
DnB NOR Group - business areas
according to IFRS

3. Financial results - DnB NOR Group - IFRS Third quarter 2005 (Pro forma accounting figures prior to 2005)
32
Business areas – extracts from profit and loss accounts - IFRS The activities of the DnB NOR Group are organised into five functional business areas and four staff and support units. The business areas are set up according to the customer segments served by the Group, as well as the products offered.
Selected profit and loss figures for the business areas have been prepared on the basis of internal financial reporting for the functional organisation of the DnB NOR Group. The figures are based on a number of assumptions, estimates and discretionary distribution.
The transition to IFRS has no impact on the Group's strategy or the business and operative management of the DnB NOR Group.
The DnB NOR Group's income, expenses and balance sheet volumes are allocated to the business areas. Some of the net income generated in DnB NOR Markets related to foreign exchange/ treasury instruments, sales of securities in the primary market, as well as custodial services, is also included in the net other operating income of Retail Banking and Corporate Banking. Extracts from profit and loss accounts, third quarter - IFRS
Amounts in NOK million 3Q05 3Q04 3Q05 3Q04 3Q05 3Q04 3Q05 3Q04 3Q05 3Q04 3Q05 3Q04
Net interest income - ordinary operations 1 496 1 486 1 828 1 794 60 51 0 0 0 3 55 67
Interest on allocated capital 134 112 76 62 13 10 0 0 8 6 (230) (190)
Net interest income 1 630 1 598 1 904 1 856 72 61 0 0 9 9 (175) (123)
Net other operating income 722 429 775 686 684 510 601 512 245 237 76 (53)
Total income 2 352 2 026 2 679 2 542 757 571 601 512 253 246 (99) (176)
Operating expenses *)790 817 1 528 1 573 337 244 236 278 162 156 146 162
Pre-tax operating profit before write-downs 1 562 1 209 1 152 969 420 327 364 233 91 90 (246) (338)
Write-downs on loans and net losses on assets (183) (174) 13 76 10 1 0 0 2 (0) (51) (70)
Pre-tax operating profit 1 745 1 383 1 139 893 409 326 364 233 89 90 (194) (268)
*) of which group overhead 15 17 8 8 3 4 2 3 1 1 (29) (33)
Asset Management Other operationsLife Insuranceand Pensions
DnB NOR MarketsCorporate Banking Retail Banking
Extracts from profit and loss accounts, January-September - IFRS
Amounts in NOK million 2005 2004 2005 2004 2005 2004 2005 2004 2005 2004 2005 2004
Net interest income - ordinary operations 4 225 4 257 5 469 5 250 171 150 0 0 (3) (5) 334 292
Interest on allocated capital 364 343 209 185 35 31 0 0 21 19 (629) (578)
Net interest income 4 588 4 599 5 678 5 435 206 180 0 0 18 15 (295) (285)
Net other operating income 1 900 1 440 2 181 2 073 1 861 1 674 1 760 1 616 726 683 35 70
Total income 6 489 6 039 7 858 7 508 2 067 1 855 1 760 1 616 744 698 (259) (216)
Operating expenses *)2 399 2 517 4 581 4 823 928 816 814 871 496 509 426 1 423
Pre-tax operating profit before write-downs 4 090 3 521 3 277 2 685 1 140 1 039 945 744 249 189 (685) (1 639)
Write-downs on loans and net losses on assets (378) (183) 188 193 10 1 0 0 2 (0) (245) (1 157)
Pre-tax operating profit 4 468 3 705 3 089 2 491 1 129 1 038 945 744 247 189 (440) (482)
*) of which group overhead 46 50 24 25 10 12 5 8 2 3 (86) (99)
Asset Management Other operations 1)
Jan.-Sept. Jan.-Sept.Jan.-Sept.Jan.-Sept. Jan.-Sept. Jan.-Sept.
Life Insuranceand Pensions
DnB NOR MarketsCorporate Banking Retail Banking

Third quarter 2005 3. Financial results - DnB NOR Group - IFRS (Pro forma accounting figures prior to 2005)
33
1) Other operations:
Amounts in NOK million 2005 2004 2005 2004 2005 2004
Net interest income - ordinary operations (9) 9 589 532 (246) (248)
Interest on allocated capital (629) (578)
Net interest income (9) 9 (39) (46) (246) (248)
Net other operating income (645) (455) (32) (146) 712 671
Total income (654) (447) (71) (192) 466 423
Operating expenses (249) (126) 675 1 549
Pre-tax operating profit before write-downs (654) (447) 178 (66) (209) (1 126)
Write-downs on loans and net losses on assets 196 7 (441) (1 165)
Pre-tax operating profit (654) (447) (18) (73) 231 39
Eliminations Group Centre *)
Jan.-Sept. Jan.-Sept.
Double entries, eliminations
Jan.-Sept.
*) "Group Centre" can be split into the following components:
Group Centre - pre-tax operating profit in NOK million 2005 2004
Income on equities 456 169
Group write-downs 132 137
Portfolio hedging, Treasury 78 (15)
Net gains on fixed and intagible assets 28 1 020
Funding costs on goodwill (77) (80)
Unallocated gains/(losses) (148) (68)
Ownership-related expenses (costs relating to shareholders, investor relations, strategic planning etc.) (150) (106)
Goodwill impairments 0 (158)
Restructuring provisions, DnB NOR merger 0 (930)
Other (88) 69
Pre-tax operating profit 231 39
Jan. - Sept.
The Group Centre comprises Human Resources and Group Services, Finance/Group Staff, Risk Management and IT, Payment Services and Corporate Communications, investments in IT infrastructure and shareholder-related expenses. The Group Centre also holds the part of the Group's equity which is not allocated to the business areas.
Main average balance sheet items
Amounts in NOK billion 2005 2004 2005 2004 2005 2004 2005 2004 2005 2004 2005 2004
Net lending to customers 2) 271.7 256.6 342.6 307.3 2.6 1.4 (4.7) 8.6
Customer deposits 2)194.5 173.9 196.1 187.1 9.9 9.3 (9.0) (6.9)
Assets under management 183.5 165.9 493.9 482.6 (156.2) (138.5)
Life Insurance
and Pensions 1)DnB NOR MarketsCorporate Banking Retail Banking
Jan.-Sept.Jan.-Sept. Jan.-Sept. Jan.-Sept.
Asset Management Other operations
Jan.-Sept. Jan.-Sept.
Key figures
Amounts in NOK billion 2005 2004 2005 2004 2005 2004 2005 2004 2005 2004 2005 2004
Cost/income ratio 37.0 41.7 58.3 64.2 44.9 44.0 66.6 73.0
Ratio of deposits to lending 2)71.6 67.8 57.2 60.9
Return on capital BIS 18.9 16.3 22.7 20.3 49.3 51.1 16.3 13.5 18.3 14.6
Full-time positions 4) 5)1 791 1 934 4 137 4 288 530 531 867 926 291 310 2 077 2 097
Life Insurance
and Pensions 3)DnB NOR MarketsCorporate Banking Retail Banking
Jan.-Sept.Jan.-Sept. Jan.-Sept. Jan.-Sept.
Asset
Management 3) Other operations
Jan.-Sept. Jan.-Sept.
1) Assets under management include total assets.
2) Based on nominal values.
3) Return on capital is calculated on the basis of recorded equity.
4) Figures for 2004 are as at 31 December and pro forma.
5) As the transition to IFRS has resulted in certain companies being reclassified as fully consolidated, four full-time positions in Corporate Banking and 21 in the Group Centre have been included as at 30 September 2005. Figures for 2004 have been restated accordingly.

3. Financial results - DnB NOR Group - IFRS Third quarter 2005 (Pro forma accounting figures prior to 2005)
34
Corporate Banking Corporate Banking serves Norwegian enterprises in all segments, Swedish medium-sized and large corporates and international businesses where we have, or can build, up a competitive advantage based on our relationships, expertise or products.
DnB NOR holds a strong position in all segments of the Norwegian corporate market, and is one of the world's leading shipping banks. Corporate Banking is organised in seven divisions and the two subsidiaries DnB NOR Finans and Nordlandsbanken. Leif Teksum, group executive vice president, heads the business area.
DnB NOR Corporate Banking aims to be the customers' best partner, meeting their needs for financing solutions throughout Norway, Sweden and in selected areas in international markets.
Norway and Sweden are the prime targets for market activities and growth. Corporate Banking also offers international services to shipping and energy clients around the globe. Further international expansion will come within shipping, energy and certain other sectors where competitive advantages and a substantial knowledge base provide growth potential.
Financial performance - IFRS
Amounts in NOK million 3Q05 2Q05 1Q05 4Q04 3Q04 2005 2004
Net interest income - ordinary operations 1 496 1 393 1 335 1 362 1 486 4 225 4 257
Interest on allocated capital 134 121 109 112 112 364 343
Net interest income 1 630 1 514 1 444 1 473 1 598 4 588 4 599
Net other operating income 722 550 628 650 429 1 900 1 440
Total income 2 352 2 064 2 072 2 123 2 026 6 489 6 039
Operating expenses 790 800 809 820 817 2 399 2 517
Pre-tax operating profit before write-downs 1 562 1 264 1 263 1 303 1 209 4 090 3 521
Write-downs on loans and net losses on assets (183) (307) 112 46 (174) (378) (183)
Pre-tax operating profit 1 745 1 572 1 151 1 257 1 383 4 468 3 705
Net lending to customers (NOK billion) 1) 281.4 271.4 262.3 259.0 256.0 271.7 256.6
Deposits from customers (NOK billion) 1) 199.9 194.0 189.5 181.4 173.1 194.5 173.9
Cost/income ratio (%) 33.6 38.7 39.0 38.6 40.3 37.0 41.7
Ratio of deposits to lending (%) 71.1 71.5 72.2 70.0 67.6 71.6 67.8
Return on capital BIS (% p.a.) 21.1 20.0 15.2 16.4 18.0 18.9 16.3
1) Average balances. Based on nominal values.
Jan. - Sept.
Comments to the financial performance in the first three quarters of 2005 • Corporate Banking showed healthy performance in a market characterised by intensifying
competition. There was a rise in total income, while non-interest income and reduced costs compensated for narrowing spreads. Sound portfolio quality coupled with a favourable economic climate ensured a continued low level of write-downs on loans.
• There was a slight decrease in net interest income from operations in the first three quarters of 2005 compared with the year-earlier period. Rising lending and deposit volumes compensated for narrowing spreads, but exchange rate movements also had a negative impact on ordinary net interest income.
• The average combined spread was 2.02 per cent in the first three quarters of 2005, compared with 2.18 per cent in the corresponding period in 2004. Portfolio quality improved further in the first three quarters of 2005. Intense competition in the market caused continued pressure on spreads. Pricing reflected credit risk.
• Net other operating income was up NOK 461 million from the first three quarters of 2004. Due to higher market activity, there was a positive trend in income from interest products, corporate finance services, custody and syndication. However, income from payment transfers and margins on guarantees was reduced.
• Corporate Banking gained NOK 198 million on the sale of assets in Brazil in the third quarter of 2005.
• Net write-downs on loans totalled NOK 117 million in the first three quarters of 2005. Net gains on fixed and intangible assets totalled NOK 495 million in the same period.

Third quarter 2005 3. Financial results - DnB NOR Group - IFRS (Pro forma accounting figures prior to 2005)
35
• Average lending and guarantees to customers increased by NOK 19.6 billion from the first three quarters of 2004 to the corresponding period of 2005. Adjusted for exchange rate movements, there was an increase of NOK 27.0 billion in loans and guarantees from the first three quarters of 2004 to the corresponding period in 2005.
• Average deposits were up NOK 20.5 billion from the first three quarters of 2004 to the first three quarters of 2005.
• A total of NOK 129.1 billion in syndicated credits was arranged for customers, in cooperation with DnB NOR Markets, in the first three quarters of 2005. Furthermore, NOK 62.3 billion in commercial paper and bonds was issued in the same period.
Customers and market developments • DnB NOR is the leading financial institution in the market for large Norwegian corporates. In
addition to the Norwegian market, Corporate Banking is offering services in New York, London, Singapore, Copenhagen, Hamburg and Helsinki. In Sweden, our new home market, we have high growth ambitions. It has been decided to establish a full-service branch in Shanghai, which is currently at the planning stage.
• The bank maintained its position in the Norwegian SME market in the first three quarters of 2005. A total of 6 400 new clients were acquired over this period. Through a wide distribution network, DnB NOR offers customers local and regional expertise as well as national sector analysis and a broad product range.
• Corporate Banking has launched new customer loyalty programmes for SME clients in 2005. The programmes 'Partner' and 'Partner pluss' include agreements on the use of Internet banking applications and credit cards as well as favourable prices on a number of the Group's products. The new initiatives aim to strengthen Corporate Banking's offering to this customer segment.
• Statutory occupations pension schemes will be introduced from 2006. To prepare for this, DnB NOR has launched new life insurance products for its corporate customers. The Group's broad regional network as well as telephone will be used to distribute the new product, which is delivered by Vital.
• DnB NOR is committed to maintaining and further enhancing a strong local presence. Local management and employees have extensive pertinent expertise and are authorised to grant credits that meet the requirements of the SME segment as well as most of the larger clients.
• More than 74 000 customers make use of DnB NOR's extensive range of Internet services and Internet-based financial products, and more than 1 million visits to the Internet banks' corporate pages are registered each month. A new and improved Internet bank for corporate clients will be launched by the end of 2005 and all clients will be given access to an increased range of Internet services. Product development will continue, as we strongly believe in providing our clients with first-class Internet services.
• Nordlandsbanken has enhanced DnB NOR's position in the northernmost parts of Norway. The subsidiary serves the county of Nordland and operates under the brand name Nordlandsbanken.
Corporate Banking market shares, excluding off-balance sheet instruments 1) 2)
31 Aug. 30 June 31 March 31 Dec. 30 Sept.
Per cent 2005 2005 2005 2004 2004
Of total lending to corporate clients 3) 15.5 15.2 15.1 15.2 15.3
Of deposits from corporate clients 4) 37.6 37.5 37.6 38.1 39.4
30 June 31 March 31 Dec. 30 Sept. 30 June
Per cent 2004 2004 2003 2003 2003
Of total lending to corporate clients 3) 15.4 15.8 16.0 15.6 15.8
Of deposits from corporate clients 4) 38.2 38.9 38.4 39.9 39.3
1) Based on nominal values.
2) Updated according to adjusted data from Norges Bank.
3) Overall lending includes all credits extended to Norwegian customers by domestic commercial and savings banks, state banks, insurance companies,
finance companies and foreign institutions, as well as bonds and commercial paper. Excluding lending to financial institutions, central government and
social security services.
4) Domestic savings and commercial banks. Excluding deposits from financial institutions, central government and social security services.
Source: Norges Bank, DnB NOR

3. Financial results - DnB NOR Group - IFRS Third quarter 2005 (Pro forma accounting figures prior to 2005)
36
Average total volume
Amounts in NOK billion 3Q05 2Q05 1Q05 4Q04 3Q04 2005 2004
Loans 281 271 262 259 256 272 257
Guarantees 43 44 44 39 41 43 39
Total loans and guarantees 324 315 306 298 297 315 296
Adjusted for exchange rate movements 324 315 306 297 293 315 288
Commercial paper 15 14 14 19 17 43 50
Syndicated loans1) 55 38 36 31 13 129 57
Bond issues 5 8 6 8 3 19 14
1) Total for syndicates in which DnB NOR participates.
Jan. - Sept.
Combined spread and average lending and deposit volumes – NGAAP 1)
240 241 246255
267
159167
175 180 1871.982.03
2.092.172.21
3Q04 4Q04 1Q05 2Q05 3Q05
Lending volume (NOK billion)Deposit volume (NOK billion)Combined spread for lending and deposits (per cent)
1) Excluding loans to and deposits with credit institutions, net impaired commitments and loans included in the Group's balance sheet that are syndicated to Eksportfinans.
Development in lending volumes by risk classification 1)
301
95
22
349
115
16
1-4 5-6 7-10
30 Sept. 200430 Sept. 2005
NOK billion
1) Based on DnB NOR's risk classification system where 1 represents the lowest risk and 10 the highest risk. The volume represents the expected
outstanding amount in the event of default.

Third quarter 2005 3. Financial results - DnB NOR Group - IFRS (Pro forma accounting figures prior to 2005)
37
Organisation and distribution Corporate Banking is organised into seven divisions: • The Nordic Corporate Division and the International Corporate and Institutions Division serve
large Norwegian corporates, the public sector, international companies that do business in Norway, international customers in the oil and energy sectors as well as financial institutions.
• The Shipping Division serves Norwegian and international shipping, offshore and maritime logistics companies.
• Regional Division East and Regional Division Coast serve businesses in two different segments based on geographical location.
• To strengthen the Group’s new initiatives, especially in Sweden, a separate division has been established to cover operations in Sweden, Finland, Denmark and Germany.
• The Business Support Division is divided into customer support, credit and collateral administration, marketing and Internet development departments as well as management support.
Products Corporate Banking offers customers a broad range of financial services, including lending, bond issues, syndicated loans, deposits, cash management, FX/treasury products, corporate finance and acquisition finance, either directly or in cooperation with DnB NOR Markets. Through DnB NOR Markets Inc. in the US, DnB NOR offers investment banking services, including mergers and acquisitions and advisory services, to international clients, particularly in the shipping and energy sectors. Employees • One of Corporate Banking's competitive advantages in the domestic market is the
considerable expertise of the employees with regard to local business, specific industry knowledge, credit risk, customer needs and product offerings. Corporate Banking has a broad competence base and is committed to continuous development. Competence training has top priority and particular emphasis has been placed on systematic specialised training in credit rating and risk and profitability analyses. Competence is also being strengthened in areas that enable Corporate Banking staff to offer customers strategic advice. Corporate Banking believes that competence training will help underpin the growth strategy.
• The integration of the two financial services groups is ahead of schedule in Corporate Banking, and staff synergies corresponding to 208 full-time positions had been achieved by end-September 2005.
• At end-September 2005, the business area had a staff of 1 791 full-time positions, with 1 642 in Norway, of which 550 in subsidiaries, as well as 149 full-time positions in international units.
• Incentive structures and balanced scorecards are tailored to the goals of the different divisions. In order to maximise performance and attract the best account officers, remuneration varies from division to division.
Cooperation with other group entities Through extensive cooperation with other business areas and support functions in the Group, particularly within corporate finance and FX and interest rate instruments, corporate customers are offered a broad range of financial services and life insurance and pension products.

3. Financial results - DnB NOR Group - IFRS Third quarter 2005 (Pro forma accounting figures prior to 2005)
38
Nordic Corporate Division and
International Corporate and Institutions Division - NGAAP Average volumes
Amounts in NOK billion 3Q05 2Q05 1Q05 4Q04 3Q04 2005 2004
Net lending to customers 81 79 78 81 78 80 79
Guarantees 31 32 33 28 29 32 28
Customer deposits 79 79 76 75 71 78 72
Jan. - Sept.
Lending according to sector 1) Risk classification of portfolio 1)
Public sector
Real estate Telecom/IT
Oil/gas/supply
Finance
Energy
Manu- facturing
Trade
11%
3%39%
9%
13%
5%
5%
14%
(8%) (13%)
(5%)
(44%)
(8%)
(5%)
(5%)
(12%) 76%
20%
5%
Normalised losses< 0.25 %
Normalised losses0.25 - 0.75 %
Normalised losses> 0.75 %
(15%)
(4%)
(81%)
1) Figures as at 30 September 2005. Percentages as at 30 September 2004 in parentheses.
Business profile • Serving large Nordic corporates, the public sector, international companies that do business
in Norway, international customers in the oil, energy, TMT and pulp & paper industries as well as financial institutions.
• DnB NOR is market leader in the large corporate segment in Norway. The majority of Norway's largest corporations use DnB NOR as their lead banker. In addition, DnB NOR has extensive interaction with most of the other institutions in this segment.
• Commercial real estate broking services are offered through the subsidiary DnB NOR Næringsmegling.
• DnB NOR Hypotek offers hypothecary financing of commercial real estate. Lending volume was NOK 16.8 billion at end-September 2005.

Third quarter 2005 3. Financial results - DnB NOR Group - IFRS (Pro forma accounting figures prior to 2005)
39
Shipping Division - NGAAP Average volumes
Amounts in NOK billion 3Q05 2Q05 1Q05 4Q04 3Q04 2005 2004
Net lending to customers 50 46 42 39 39 46 39
Guarantees 10 11 11 11 13 11 12
Customer deposits 28 26 24 20 19 26 18
Jan. - Sept.
Lending according to sector 1) Risk classification of portfolio 1)
Chemical
Shuttle
Product
Tankers
RoRo/ Container/
PCC
Aviation
Cruise
Other non-shipping
Dry cargo
Offshore
Other shipping
Gas
Logistics
17%
15%
13%
5%
4%
3%
5%
2%
13%
5%
(18%)
(17%)
(15%)(7%)
(4%)
(5%)
(12%)
(5%)
(6%)
(3%)
2%(3%)
(3%)
(3%)13%
4%
79%
18%
2%
Normalised losses< 0.25 %
Normalised losses> 0.75 %
Normalised losses0.25 - 0.75 %(25%)
(3%)
(73%)
1) Figures as at 30 September 2005. Percentages as at 30 September 2004 in parentheses.
Business profile • Provides commercial and investment banking services to high-quality Norwegian and
international shipping and offshore clients from the Group's offices in Oslo, Bergen, London, New York and Singapore.
• The Shipping Division aims to achieve satisfactory growth in risk-adjusted profitability by maintaining third place among international shipping banks. The division aims to be the preferred strategic discussion partner for clients, expand its client base through further development of the logistics and LNG portfolio and strengthen its market position in Germany and the Nordic countries. Competence development will continue.

3. Financial results - DnB NOR Group - IFRS Third quarter 2005 (Pro forma accounting figures prior to 2005)
40
Regional Division East and Regional Division Coast - NGAAP Average volumes
Amounts in NOK billion 3Q05 2Q05 1Q05 4Q04 3Q04 2005 2004
Net lending to customers 110 106 104 100 103 107 101
Guarantees 11 9 9 9 9 10 10
Customer deposits 81 76 76 73 70 78 71
Jan. - Sept.
Lending according to sector 1) Risk classification of portfolio 1)
Manu- facturing
Energy
Publicsector Primary
industries
Trade
Building and construction
Finance
Transp. and comm.
Services
Property/ real estate
3%8%
2%
12%
9%
3%
10%
46%
5%1%
(43%)
(10%)
(3%)
(13%)
(10%)
(2%)
(9%)(2%)(5%)
(2%)
72%
23%
5%
Normalised losses< 0.25 %
Normalised losses> 0.75 %
Normalised losses0.25 - 0.75 %
(19%)
(6%)
(76%)
1) Figures as at 30 September 2005. Percentages as at 30 September 2004 in parentheses.
Business profile • Serving more than 85 000 businesses divided into two segments: large companies and small
and medium-sized enterprises. • Service is provided by a broad regional network, as well as over the telephone and via the
Internet.
The priorities of clients served by these two divisions when choosing their bankers are local presence combined with the expertise of a major bank. DnB NOR has financial services centres throughout Norway that offer a broad range of products and services and have considerable know-how that is pertinent for the customers. DnB NOR has a sound platform for strengthening its position as the preferred provider of financial products and services for these customer segments.

Third quarter 2005 3. Financial results - DnB NOR Group - IFRS (Pro forma accounting figures prior to 2005)
41
Nordlandsbanken – Corporate Banking - NGAAP Average volumes
Amounts in NOK billion 3Q05 2Q05 1Q05 4Q04 3Q04 2005 2004
Net lending to customers 10 10 10 10 11 10 11
Guarantees 1 1 1 1 1 1 1
Customer deposits 3 3 3 3 3 3 3
Jan. - Sept.
Business profile • Corporate Banking in Nordlandsbanken serves businesses and the public sector in the county
of Nordland. • Nordlandsbanken is represented through 17 branches in Nordland and holds a leading
position in the corporate segment. • Nordlandsbanken aims to be the preferred financial partner for companies in Nordland by
meeting their needs for financial solutions through local expertise and as part of a large national financial institution.
DnB NOR Finans - NGAAP Average volumes
Amounts in NOK billion 3Q05 2Q05 1Q05 4Q04 3Q04 2005 2004
Net lending to customers 21 20 19 18 17 20 17
Jan. - Sept.
Business profile • DnB NOR Finans is one of Norway’s leading finance companies. • The company meets customer requirements for administrative, financial and risk-reducing
services related to investments and operations. • Business operations focus mainly on leasing, leasing concepts for Information and
Communications Technology (ICT), factoring, motor vehicle financing and Autolease car fleet management (Norway and Denmark).
• DnB NOR Finans has a strong local presence through 14 branches, most of which have the same location as DnB NOR Bank.
• There was a 27 per cent increase in new leasing and loan contracts in the first nine months of 2005 compared with the corresponding period in 2004.
• The value of processed factoring invoices was up 19 per cent for the first three quarters of 2005 relative to the corresponding period in 2004.

3. Financial results - DnB NOR Group - IFRS Third quarter 2005 (Pro forma accounting figures prior to 2005)
42
Retail Banking Retail Banking, serving private customers and small companies under the main brand names DnB NOR, Postbanken and Nordlandsbanken, is Norway’s largest retail bank. Åsmund Skår, group executive vice president, is the head of the business area. Retail Banking aims to maintain its leading market position and stand out as the customers' best financial partner. Integration proceeded according to plan with respect to reductions in staff numbers as well as the number of branches. The integration of branches in DnB NOR has been completed and the number of branches have been reduced to 194 by moving geographically overlapping units into joint premises. There are sound prospects for the Norwegian economy in 2005, with an anticipated moderate increase in interest rate levels, a slight improvement in the labour market and rising housing investment. This will provide the basis for continued growth within Retail Banking. Increased focus on pension savings is expected to lead to greater demand for insurance and savings products. Given its current position in the Norwegian banking market, Retail Banking will face competition from both domestic and Nordic participants. Competition for the bank's high net worth customers is expected to increase, and there will be many competitors in the growing market for pension savings. Retail Banking is prepared to meet the competition through good customer relations, new loyalty programmes and a large distribution network. Financial performance - IFRS
Amounts in NOK million 3Q05 2Q05 1Q05 4Q04 3Q04 2005 2004
Net interest income - ordinary operations 1 828 1 856 1 785 1 801 1 794 5 469 5 250
Interest on allocated capital 76 70 63 64 62 209 185
Net interest income 1 904 1 926 1 848 1 865 1 856 5 678 5 435
Net other operating income 775 761 644 696 686 2 181 2 073
Total income 2 679 2 687 2 492 2 562 2 542 7 858 7 508
Operating expenses 1 528 1 546 1 507 1 623 1 573 4 581 4 823
Pre-tax operating profit before write-downs 1 152 1 141 985 938 969 3 277 2 685
Write-downs on loans and net losses on assets 13 105 70 (3) 76 188 193
Pre-tax operating profit 1 139 1 035 915 941 893 3 089 2 491
Net lending to customers (NOK billion) 1)352.6 342.1 333.3 326.6 318.8 342.6 307.3
Deposits from customers (NOK billion) 1)203.2 194.3 190.9 189.3 190.9 196.1 187.1
Cost/income ratio (%) 57.0 57.5 60.5 63.4 61.9 58.3 64.2
Ratio of deposits to lending (%) 57.6 56.8 57.3 58.0 59.9 57.2 60.9
Return on capital BIS (% p.a.) 24.3 22.8 20.9 21.6 20.9 22.7 20.3
Jan. - Sept.
1) Average balances. Based on nominal values.
Comments to the financial performance January - September 2005 • Satisfactory profits – return on BIS capital 22.7 per cent. • Cost/income ratio improved to 58.3 per cent. • Net interest income increased by NOK 243 million, mainly due to higher lending volume. • Lending spreads represented 1.6 percentage points, including consumer finance. Deposit
spreads averaged 0.8 percentage points. • Average lending increased by NOK 35 billion or 11.5 per cent, referring primarily to well-
secured housing loans. Deposits increased by NOK 9 billion or 5 per cent. • Net other operating income increased by NOK 108 million or 5 per cent, mainly due to higher
commission income from the sale of insurance products and mutual funds. • Expenses were scaled back by 5 per cent through restructuring and streamlining measures. • Loan losses remained at a low level. • The volume of non-performing and doubtful commitments was at a satisfactory level.
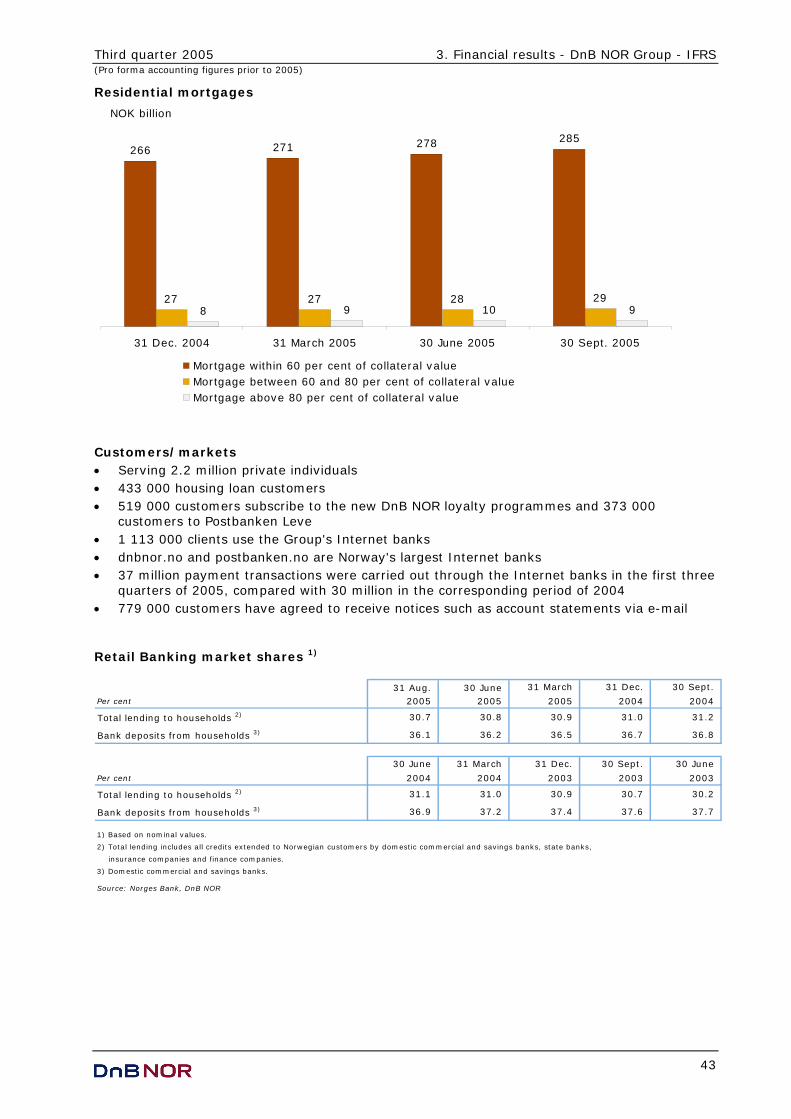
Third quarter 2005 3. Financial results - DnB NOR Group - IFRS (Pro forma accounting figures prior to 2005)
43
Residential mortgages
266 271 278 285
27 27 28 298 9 10 9
31 Dec. 2004 31 March 2005 30 June 2005 30 Sept. 2005
NOK billion
Mortgage within 60 per cent of collateral valueMortgage between 60 and 80 per cent of collateral valueMortgage above 80 per cent of collateral value
Customers/markets • Serving 2.2 million private individuals • 433 000 housing loan customers • 519 000 customers subscribe to the new DnB NOR loyalty programmes and 373 000
customers to Postbanken Leve • 1 113 000 clients use the Group's Internet banks • dnbnor.no and postbanken.no are Norway's largest Internet banks • 37 million payment transactions were carried out through the Internet banks in the first three
quarters of 2005, compared with 30 million in the corresponding period of 2004 • 779 000 customers have agreed to receive notices such as account statements via e-mail
Retail Banking market shares 1)
31 Aug. 30 June 31 March 31 Dec. 30 Sept.
Per cent 2005 2005 2005 2004 2004
Total lending to households 2) 30.7 30.8 30.9 31.0 31.2
Bank deposits from households 3) 36.1 36.2 36.5 36.7 36.8
30 June 31 March 31 Dec. 30 Sept. 30 June
Per cent 2004 2004 2003 2003 2003
Total lending to households 2) 31.1 31.0 30.9 30.7 30.2
Bank deposits from households 3) 36.9 37.2 37.4 37.6 37.7
1) Based on nominal values.
2) Total lending includes all credits extended to Norwegian customers by domestic commercial and savings banks, state banks,
insurance companies and finance companies.
3) Domestic commercial and savings banks.
Source: Norges Bank, DnB NOR

3. Financial results - DnB NOR Group - IFRS Third quarter 2005 (Pro forma accounting figures prior to 2005)
44
Combined spread and average lending 1) and deposit volumes – NGAAP
319 325 332341
191 189 191 194203
351
2.52 2.522.45 2.40 2.37
3Q04 4Q04 1Q05 2Q05 3Q05
Lending volume (NOK billion)
Deposit volume (NOK billion)
Combined spread for lending and deposits (per cent)
1) Average performing loans
Organisation and distribution Through Norway's largest distribution network, Retail Banking offers a wide range of financial products and services. Production, staff and support functions are largely centralised in cost-efficient joint units. The major distribution channels are:
• DnB NOR's, Postbanken's and Nordlandsbanken's branch offices • The postal network • Internet and telephone • Investment Advisory Services
The cooperation with 16 regional savings banks involves the provision of technological solutions and distribution of the Group's products. DnB NOR and Norway Post have a master agreement relating to the distribution of financial services through the postal network. The agreement is mainly based on transaction-specific prices and a common aim to increase the number of financial services distributed through the postal network. The existing agreement will remain effective until 31 December 2005. A new agreement has been signed by DnB NOR Bank ASA and Norway Post and will remain in force untill December 2012. • Postbanken and Norway Post have established joint service solutions provided through 1 194
in-store postal outlets, where customers can carry out everyday banking transactions in their local stores.
• 5.5 million payment transactions were carried out through these channels during the first three quarters of 2005, compared with 8.3 million transactions for the full year 2004.
• Norway Post has entered into an agreement with DnB NOR for the purchase and installation of up to 2 500 payment terminals for use in post offices and in-store postal outlets.

Third quarter 2005 3. Financial results - DnB NOR Group - IFRS (Pro forma accounting figures prior to 2005)
45
New products • First-home loan with interest rate ceiling, with the option to borrow the entire purchase
amount at a favourable interest rate • Credit line secured by residential property/real estate • Special-term deposit account, minimum deposit NOK 1 million • Debt financing of Vital products • New mutual funds Employees The number of full-time positions within Retail Banking totalled 4 137 at the end of September 2005. Staff synergies corresponding to 677 full-time positions have been realised. To achieve the targets for restructuring and staff cuts, measures must be fully implemented. The process must be carried out in a considerate manner in close cooperation with the employee organisations. More efficient production and distribution of services through new and better IT solutions, telephone and Internet banking will reduce the number of employees in the coming years. Changing customer needs and the introduction of new products make it vital to upgrade professional skills. This will mainly be achieved by educating and relocating the existing workforce. Cooperation with other group entities Cross-selling of products is one of the major strengths of the DnB NOR Group. Through its distribution network Retail Banking offers: • Asset management services (DnB NOR Asset Management) • Life and pension insurance (Vital) • Financial instruments (DnB NOR Markets) Residential real estate broking DnB NOR's real estate broking activities are coordinated in DnB NOR Eiendom AS, a market leader within the real estate broking business. DnB NOR Eiendom had 77 outlets located in DnB NOR branches as at 30 September 2005. In addition to fee income, real estate broking operations generate business in the form of residential mortgages and savings.
3 688 3 6043 429
4 868
4 261
131119
110
168156
3Q04 4Q04 1Q05 2Q05 3Q05
Properties sold Fees on real estate broking (NOK million)

3. Financial results - DnB NOR Group - IFRS Third quarter 2005 (Pro forma accounting figures prior to 2005)
46
Properties sold and market shares
Amounts in NOK million 3Q05 2Q05 1Q05 4Q04 3Q04 2005 2004
DnB NOR Eiendom 4 167 4 757 3 361 3 538 3 607 12 285 12 412
NordMegler (Nordlandsbanken) 94 111 68 66 81 273 240
Total properties sold 4 261 4 868 3 429 3 604 3 688 12 558 12 652
Market share, per cent 1) 16 16
1) Management's estimates.
Jan. - Sept.
Consumer finance • DnB NOR's card-based services and consumer finance activities are coordinated in
DnB NOR Kort (an entity within DnB NOR Bank ASA). • DnB NOR Kort's lending volume increased from NOK 9 762 million at end-September 2004 to
NOK 10 559 million at end-September 2005. • Consumer finance activities generated healthy profits in the third quarter of 2005. • DnB NOR Kort is Norway's leading card issuer. As at 30 September 2005, the entity had
issued more than 1.4 million credit and charge cards. Including debit cards, the DnB NOR Group had issued approximately 3.7 million cards.
Non-life insurance Vital Skade was the first company in Norway to develop a totally integrated virtual insurance site where Internet banking customers can buy non-life insurance products (home, car, travel etc.). Products are sold on a commission basis. Vital Skade operates as an agent and assumes no risk on its own. Vital Skade has entered into non-exclusive agreements with 13 academic associations offering non-life insurance products through specialised service centres. Premium income generated in Vital Skade for the first three quarters of 2005 totalled NOK 370 million, an increase of 24 per cent on the 2004 figure. Academic associations account for 47 per cent of total premiums. Sales through the Internet banking application continued to show strong growth compared with the January through September period in 2004, with total premiums of NOK 92 million, up from NOK 63 million in 2004. Net profit before taxes totalled NOK 34 million for the first nine months, increasing from NOK 30 million in the corresponding period of 2004. Commission income increased from NOK 62 million in the first three quarters of 2004 to NOK 77 million in the corresponding period of 2005. Costs increased from NOK 30 million to NOK 43 million compared with the year-earlier period.

Third quarter 2005 3. Financial results - DnB NOR Group - IFRS (Pro forma accounting figures prior to 2005)
47
DnB NOR Markets DnB NOR Markets is Norway's largest provider of a wide range of securities and investment banking services. DnB NOR Markets comprises the following units: FX/Treasury - Customers, FX/Treasury - Trading, Equities Sales/Research, Corporate Finance and Securities Services. The Group Treasury is organised within DnB NOR Markets though profits and losses for the unit are not recorded under this business area. Ottar Ertzeid, group executive vice president, is head of DnB NOR Markets. DnB NOR Markets aims to be the leading investment bank for Norwegian and Norwegian-related customers, as well as international clients requiring services relating to Norway and the Norwegian krone. DnB NOR Markets is a full-service investment bank with leading market positions in Norway. The business area has: • A diversified business/revenues mix (products and customers) • A sound mix of customer and trading activities • Cost and capital-efficient operations Financial performance - IFRS
Amounts in NOK million 3Q05 2Q05 1Q05 4Q04 3Q04 2005 2004
Net interest income - ordinary operations 60 62 49 60 51 171 150
Interest on allocated capital 13 13 10 10 10 35 31
Net interest income 72 75 59 70 61 206 180
Net other operating income 684 574 603 627 510 1 861 1 674
Total income 757 648 662 697 571 2 067 1 855
Operating expenses 337 294 297 272 244 928 816
Pre-tax operating profit before write-downs 420 355 365 425 327 1 140 1 039
Write-downs on loans and net losses on assets 10 - - 2 1 10 1
Pre-tax operating profit 409 355 365 422 326 1 129 1 038
Cost/income ratio (%) 44.5 45.3 44.9 39.0 42.7 44.9 44.0
Return on capital BIS (% p.a.) 52.5 43.2 52.8 59.6 49.6 49.3 51.1
Jan. - Sept.
Comments to the financial performance in the first three quarters of 2005 • DnB NOR Markets achieved record-high revenues and profits in the first three quarters of
2005. • The business area recorded a very satisfactory cost/income ratio and a sound return on
equity. • All merger synergies were fully realised in 2004. • Total revenues increased by NOK 213 million, or 11 per cent. • Market making/trading revenues decreased by NOK 59 million from a high level. The
reduction was partly attributable to the significant narrowing of credit spreads compared with the year-earlier period.
• Customer demand for currency products remained strong. • Brisk demand for capital-guaranteed savings products and direct investments in commercial
property. • Record-high activity within equities sales. • Corporate finance showed healthy performance. Revenues increased from NOK 139 million
for the first three quarters of last year to NOK 276 million one year later. The good results reflect a high level of activity within share issues, initial public offerings and advisory services.

3. Financial results - DnB NOR Group - IFRS Third quarter 2005 (Pro forma accounting figures prior to 2005)
48
Income distribution DnB NOR Markets
417501
603 574
135176
110 133185
552
677 713651
519
759
3Q04 4Q04 1Q05 2Q05 3Q05
Income on customer business Income on trading / market making Total revenue
NOK million
Total revenue 552 677 713 651 759IFRS adjustments 9 9 (61) (16) (15)Interest on allocated capital 10 10 10 13 13Total income 571 697 662 648 757
Products and services • Foreign exchange and interest rate derivatives. • Securities and other investment products. • Debt and equity financing in capital markets, as well as mergers and acquisitions and other
advisory and corporate finance services. • Custodial and other securities services. • During the third quarter, DnB NOR launched new investment products including Private
Equity Feeder Fund and Credit Linked Notes (CLN). Distribution and cooperation with other entities Maintaining a broad distribution network and effective cooperation with other business areas within the Group, such as Corporate Banking and Retail Banking, are key priorities for DnB NOR Markets. Customers are served through: • Central units located in Oslo • International offices (London, Singapore and New York) and 13 regional offices • Electronic channels and the Internet • Cooperating savings banks • External agents Customers and market shares • DnB NOR Markets is Norway's largest investment bank with a market share in the first half of
2005 of 30 per cent in terms of revenues for Norwegian firms. • The merger has enhanced the business area's market position within bonds, commercial
paper, equities, equity derivatives and research. • DnB NOR Markets was the largest equity brokerage house on Oslo Børs (the Oslo Stock
Exchange) in the first three quarters of 2005 and strengthened its position within corporate finance during this period.
• Leading position within derivatives and structured products in Norway. • 25 and 74 per cent respectively of customer trading in equity options and forward contracts
on Oslo Børs was handled by DnB NOR Markets in the first three quarters of 2005. • Approximately 40 per cent market share of capital-guaranteed equity-linked investment
products.

Third quarter 2005 3. Financial results - DnB NOR Group - IFRS (Pro forma accounting figures prior to 2005)
49
• Leading arranger of debt financing in capital markets for Norwegian borrowers. • Leading within domestic securities services with settlement for most foreign members of Oslo
Børs. • An increasing number of customers use DnB NOR Markets as registrar in the Norwegian
Central Securities Depository, with market shares of 57 per cent for limited companies and 33 per cent for bonds.
• DnB NOR Markets was named Best Equity House in Norway by Euromoney in July 2005. • In September Global Finance presented DnB NOR with the "Best Foreign Exchange Bank in
Norway" award. Employees • DnB NOR Markets has a staff of 530 full-time positions located in offices in Norway and
abroad. • DnB NOR Markets achieved the desired stability in staff levels and also recruited new
employees within growth areas during the period. Revenues within various segments - IFRS
Amounts in NOK million 3Q05 2Q05 1Q05 4Q04 3Q04 2005 2004
FX and interest rate derivatives 212 237 244 228 209 693 648
Investment products 202 144 216 148 102 563 382
Corporate finance 101 78 97 70 60 276 139
Securities services 59 60 45 55 47 164 138
Total customer revenues 574 519 603 501 417 1 696 1 307
Market making/trading revenues 185 133 110 176 135 429 488
IFRS adjustments (15) (16) (61) 9 9 (92) 29
Interest income on allocated capital 13 13 10 10 10 35 31
Total income 757 648 662 697 571 2 067 1 855
Jan. - Sept.
Risk profile DnB NOR Markets has a moderate risk profile. Customer activities represent the main business. Trading activities support customer activities with products and prices, with focus on Norwegian krone products. Daily revenue statistics for DnB NOR Markets
Pro forma
Amounts in NOK thousand 2005 2004 2004 2003
Minimum (9 662) (3 806) (3 812) (3 007)
Maximum 75 434 41 601 61 034 51 894
Average 10 893 9 204 9 472 9 654
Loss days 11 9 10 3
Gain days 184 186 251 256
Jan. - Sept.

3. Financial results - DnB NOR Group - IFRS Third quarter 2005 (Pro forma accounting figures prior to 2005)
50
Daily revenue distribution as at 30 September 2005
2 1
8
0
25
13
21
37
22
17
13 14
6
16
<(5 000) (5 000) (2 500) 0 2 500 5 000 7 500 10 000 12 500 15 000 17 500 20 000 22 500 >22 500Revenues, NOK thousand
Number of days
Total income Amounts in NOK million Jan.-Sept. 2005
Total daily revenues 2 124
IFRS adjustments (92)
Interest on allocated capital 35
Total income 2 067 Value at risk Market risk exposures for DnB NOR Markets, i.e. DnB NOR Bank's trading portfolio/activities, were stable during the first three quarters of 2005. Value at risk (one day holding period, 99 per cent confidence level)
30 Sept. 2005
Amounts in NOK thousand Actual Average Maximum Minimum
Currency risk 14 680 4 940 14 680 754
Interest rate risk 11 930 13 626 20 920 4 770
Diversification effects (8 820) (4 017)
Total 17 790 14 549
Jan. - Sept.

Third quarter 2005 3. Financial results - DnB NOR Group - IFRS (Pro forma accounting figures prior to 2005)
51
Interest rate sensitivity The value of financial investments recorded on and off the balance sheet is affected by interest rate movements. The table below shows potential losses for DnB NOR resulting from parallel one-percentage point changes in all interest rates. The calculations are based on a hypothetical situation where interest rate movements in all currencies are unfavourable for DnB NOR relative to the Group's positions. Also, all interest rate movements within the same interval are assumed to be unfavourable for the Group. In the trading portfolio, such losses will be charged to the accounts as they occur. In the banking portfolio, the losses will be amortised over the remaining maturity. The calculations are based on the Group's positions as at 30 September 2005 and market rates on the same date. Potential losses for DnB NOR resulting from parallel one percentage point changes in all interest rates
Amounts in NOK million
Up to1 month
From1 month
to 3 months
From3 monthsto 1 year
From1 year
to 5 yearsMore than
5 years Total
Trading portfolio
NOK 2 1 81 123 65 21
USD 3 3 29 35 8 5
EURO 3 6 0 1 7 2
GBP 0 1 1 1 0 2
Other currencies 4 3 8 2 2 5
Banking portfolio
NOK 2 11 9 2 5 7
Total
NOK 0 11 72 125 70 28
USD 3 3 29 35 8 5
EURO 3 6 0 1 7 2
GBP 0 1 1 1 0 2
Other currencies 4 3 8 2 2 5
The table does not include administrative interest rate risk and interest rate risk relating to non-interest-earning assets.

3. Financial results - DnB NOR Group - IFRS Third quarter 2005 (Pro forma accounting figures prior to 2005)
52
Life Insurance and Pensions Description of the business area Life Insurance and Pensions offers group pension schemes to businesses and the public sector. In the retail market, long-term savings alternatives are offered in the form of individual pension agreements and annuities. Bård Benum, group executive vice president, is head of Life Insurance and Pensions. Life Insurance and Pensions comprises Vital Forsikring ASA including subsidiaries and the sister company Vital Link AS. Vital aims to be Norway's strongest entity within pension savings. Vital seeks continued growth within the company's business segments and aims to deliver competitive results to its owner and policyholders. Devoting further efforts to improving cost efficiency, providing top-quality advisory services, maintaining high levels of service and customer relationship management and serving as an attractive entry portal for customers into the DnB NOR Group will be instrumental in reaching these targets.
Financial results according to IFRS As of 1 January 2005, Vital Forsikring ASA including subsidiaries and Vital Link AS are fully consolidated in the DnB NOR Group's accounts. Profit sharing between policyholders and the owner in life insurance companies is based on special accounting regulations for such operations stipulated by Kredittilsynet (the Financial Supervisory Authority of Norway). Regulations relating to profit sharing between the owner and policyholders in life insurance companies limit the DnB NOR Group’s access to revenues and assets from life insurance operations. In accordance with IFRS, life insurance operations are incorporated in the DnB NOR Group's accounts based on the same principles that apply to the rest of the DnB NOR Group. Any deviations resulting from differences between the special accounting regulations for profit sharing and IFRS are charged directly to the DnB NOR Group's equity. On pages 53-58, the profit and loss accounts and balance sheets for Life Insurance and Pensions as included in the DnB NOR Group's accounts according to IFRS, are included. Financial results according to NGAAP The analyses on pages 59-61 are prepared on the basis of accounting principles according to Norwegian accounting legislation etc. (NGAAP).

Third quarter 2005 3. Financial results - DnB NOR Group - IFRS (Pro forma accounting figures prior to 2005)
53
Financial performance – Life Insurance and Pensions - IFRS
Amounts in NOK million 3Q05 2Q05 1Q05 4Q04 3Q04 2005 2004
Interest result 1) 2) 1 963 543 1 635 502 577 4 141 3 335
Risk result 3) 35 38 (31) (44) (11) 42 (268)
Administration result 4) (1) (29) (38) (287) (31) (68) (100)
Other 2)0 0 0 245 (24) 0 (114)
Transferred to security reserve 7 0 (1) (3) (4) 6 3
Profit for distribution 5) 1 990 552 1 567 419 515 4 109 2 850
Funds transferred to policyholders 1 636 289 1 247 (74) 280 3 172 2 107
Tax charge (11) (8) (10) (161) 11 (28) 97
Profit life insurance 364 270 330 653 224 965 646
Net profit in Vital Link 7 1 (2) 16 (2) 6 1
Net profit from Life Insurance and Pensions 372 271 328 670 222 971 647
Jan. - Sept.
1) For developments in the asset mix, return on assets and financial result in life insurance, see tables on pages 53, 54 and 57. 2) Including pre-tax profits to the owner of NOK 255 million from the sale of operations within non-life and group life insurance in the fourth quarter of
2004. 3) NOK 16 million was charged to the risk result for the third quarter of 2005 to strengthen disability provisions, compared with NOK 42 million in the
corresponding period in 2004. Life Insurance and Pensions plans to strengthen the premium reserve by NOK 140 million to cover insurance claims in 2005.
4) In the fourth quarter of 2004, the administration result was charged with NOK 250 million in restructuring costs in connection with the merger between Vital Forsikring ASA and Gjensidige NOR Spareforsikring ASA.
5) See table on page 54.
Comments to the financial performance in first three quarters of 2005 – Life Insurance and Pensions • Value-adjusted return on assets 6.0 per cent and recorded return on assets 5.2 per cent. • A NOK 5.7 billion rise in solvency capital, to NOK 24.8 billion. • 12 per cent growth in total assets, to NOK 193 billion. • 18 per cent increase in total premiums due and a net inflow of transfers NOK 1.4 billion. • A NOK 324 million rise in net profit. • An 81 per cent increase in policyholders' funds from defined-contribution pension schemes
compared with the figures at end-December. • In the course of the fourth quarter, Vital will enter into an agreement with Norway Post on the
most extensive defined-contribution pension scheme in the market. The scheme will cover 26 000 members and has an estimated annual premium of more than NOK 200 million.
• Preparations for the introduction of statutory occupational pension schemes are on schedule. • Market shares by end-June are stable:
39 per cent within unit linked operations 49 per cent within traditional life insurance, excluding KLP (municipalities' pension funds)
Financial results – life insurance - IFRS
Amounts in NOK million 3Q05 2Q05 1Q05 4Q04 3Q04 2005 2004
Net result from shareholdings 3 153 1 592 1 351 766 (99) 6 096 2 169
Net result from other asset classes 1 216 1 725 860 2 784 2 161 3 801 4 779
Value-adjusted financial result 1) 4 370 3 316 2 211 3 550 2 062 9 897 6 948
Guaranteed return on policyholders' funds 1 431 1 477 1 444 1 176 1 381 4 352 4 095
Financial result 2 939 1 839 767 2 374 681 5 545 2 853
+ From securities adjustment reserve (976) (1 296) 868 (1 572) (104) (1 404) 482
+ Transferred to additional allocations 0 0 0 300 0 0 0
Recorded interest result 1 963 543 1 635 502 577 4 141 3 335
1) Before changes in unrealised gains on long-term securities.
Jan. - Sept.

3. Financial results - DnB NOR Group - IFRS Third quarter 2005 (Pro forma accounting figures prior to 2005)
54
Value-adjusted return on assets – life insurance - IFRS
Per cent 3Q05 2Q05 1Q05 4Q04 3Q04 2005 2004
Financial assets
Norwegian equities 21.5 11.7 8.5 9.5 7.8 41.7 28.6
International equities 7.3 3.9 3.7 0.6 (3.5) 14.9 33.7
Norwegian bonds 0.3 2.5 0.8 1.9 2.5 3.6 4.8
International bonds (0.3) 3.0 0.5 2.0 2.8 3.3 4.3
Money market instruments 0.5 0.6 0.5 0.5 0.7 1.6 1.8
Bonds held to maturity 1.4 1.4 1.4 1.5 1.4 4.2 4.2
Investment property 1.6 1.7 1.7 3.8 1.6 5.0 4.9
Value-adjusted return on assets I 1) 2.7 2.0 1.3 2.5 1.3 6.0 4.6
Value-adjusted return on assets II 2) 2.2 2.3 1.1 2.7 1.7 5.6 5.0
Recorded return on assets 3) 2.1 1.2 1.9 1.5 1.3 5.2 5.0
Value-adjusted return on assets I, annualised 1) 10.8 8.0 5.4 10.0 5.1 8.0 6.1
Value-adjusted return on assets II, annualised 2) 8.8 9.2 4.6 10.8 6.9 7.6 6.8
1) Excluding changes in value of commercial paper and bonds held to maturity.2) Including changes in unrealised gains on commercial paper and bonds held to maturity.
3) Excluding changes in unrealised gains on commercial paper and bonds held to maturity.
Jan. - Sept.
Specification of profit for distribution – life insurance
Amounts in NOK million 3Q05 2Q05 1Q05 4Q04 3Q04 2005 2004
Profit for distribution 1 990 552 1 567 419 515 4 109 2 850
from operations subject to profit sharing1) 1 987 549 1 565 162 539 4 101 2 964
- Funds transferred to policyholders 1 636 289 1 247 (74) 280 3 172 2 107
- Profit for allocation to the owner and taxes 351 260 318 236 259 929 858
from operations not subject to profit sharing 3 3 2 257 (24) 8 (114)
Jan. - Sept.
1) Profit for allocation to the owner and taxes for operations subject to profit sharing in life insurance includes: - return on equity, subordinated loan capital and the security reserve, calculated as the company's return on capital, less accrued interest on
subordinated loans and allocations to the security reserve - a margin of policyholders' funds - a margin of effective risk premium adjusted for survival risk on contracts providing sufficient profits According to regulations, annual profit for allocation to the owner and taxes cannot exceed 35 per cent of profit for operations subject to profit
sharing. If this figure is negative, the entire amount should be charged to the owner. Total profit to the owner and taxes also includes profits from operations not subject to profit sharing.

Third quarter 2005 3. Financial results - DnB NOR Group - IFRS (Pro forma accounting figures prior to 2005)
55
Extracts from balance sheets and key figures – Life Insurance and Pensions
30 Sept. 30 June 31 Mar. 1 Jan. 30 Sept. 1 Jan.
Amounts in NOK million 2005 2005 2005 2005 2004 2004
Total liabilities to life insurance policyholders 168 056 162 143 157 972 153 488 149 713 137 693
of which group pension - defined benefit 108 900 105 693 103 024 99 790 96 733 87 473
of which group pension - defined contribution 333 289 246 193 163 88
Insurance liabilities - customer bearing the risk 12 016 10 766 10 358 9 746 9 230 7 292
of which group pension - defined contribution 575 490 451 364 304 167
Amounts in NOK million 3Q05 2Q05 1Q05 4Q04 3Q04 2005 2004
Solvency capital 1) 24 802 22 432 20 033 19 630 19 112 24 802 19 112
Return on capital (per cent) 2) 17.9 13.7 17.4 28.4 12.1 16.3 13.5
Expenses in per cent of insurance provisions 3) 0.83 0.85 0.88 0.87 0.87 0.85 0.91
1) Life insurance. For the composition of solvency capital, see table on page 60.
2) Calculations of return on capital are based on recorded equity, after tax charges, and are annualised.
3) Life insurance. Annualised according to NGAAP, including costs charged to the administration result.
Jan. - Sept.
Premium income – Life Insurance and Pensions - IFRS
Amounts in NOK million 3Q05 2Q05 1Q05 4Q04 3Q04 2005 2004
Total premiums due 1) 2) 3) 4 569 3 734 5 720 4 535 3 057 14 023 11 429
Inflow of reserves 4) 467 1 003 1 461 896 1 041 2 931 4 840
Outflow of reserves 5) 661 492 502 234 545 1 655 1 937
Net premiums paid 4 375 4 245 6 679 5 197 3 552 15 299 14 332
Outflow of premiums 661 492 502 234 545 1 655 1 937
Total premium income 5 036 4 737 7 181 5 431 4 098 16 954 16 269
1) Of which group pension - defined benefit 1 464 1 132 3 914 1 524 2 065 6 510 6 302 2) Of which group pension - defined contribution 132 107 125 82 53 364 186
3) Premium income from operations sold in 2004 are not included. The figures amount to (104) 66 542 4) Of which transfers between Vital companies 147 158 159 90 40 464 331
Jan. - Sept.
5) The figure for the fourth quarter of 2004 does not include NOK 1 035 million in reserves from the sale of operations within non-life and group life insurance.
Market shares – Life Insurance and Pensions
30 June 31 Dec. 30 JunePer cent 2005 2004 2004
Of insurance funds including unit linked products 1) 34.4 34.6 36.2
- Retail market 49.3 51.3 52.9
- Corporate market 1) 29.2 28.7 30.1
Of insurance funds for unit linked products 38.9 40.6 40.4
All premiums include reserves transferred from other life insurance companies.
Source: Association of Norwegian Financial Managers in the Finance Sector, FNH and DnB NOR
1) Annulment of a large reassurance contract in the fourth quarter of 2004 resulted in a decline in the business area's market shares of insurance funds
including unit linked products and of insurance funds in the corporate market of 0.7 and 0.9 percentage points respectively.
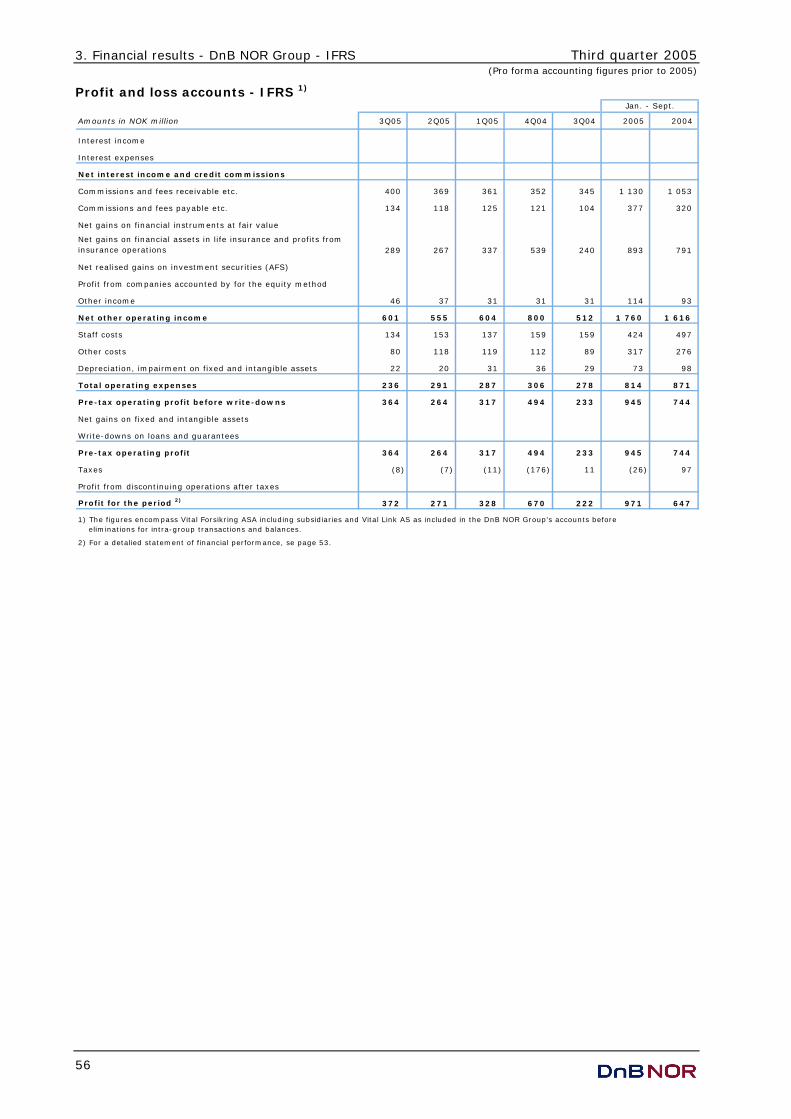
3. Financial results - DnB NOR Group - IFRS Third quarter 2005 (Pro forma accounting figures prior to 2005)
56
Profit and loss accounts - IFRS 1)
Amounts in NOK million 3Q05 2Q05 1Q05 4Q04 3Q04 2005 2004
Interest income
Interest expenses
Net interest income and credit commissions
Commissions and fees receivable etc. 400 369 361 352 345 1 130 1 053
Commissions and fees payable etc. 134 118 125 121 104 377 320
Net gains on financial instruments at fair value
Net gains on financial assets in life insurance and profits from insurance operations 289 267 337 539 240 893 791
Net realised gains on investment securities (AFS)
Profit from companies accounted by for the equity method
Other income 46 37 31 31 31 114 93
Net other operating income 601 555 604 800 512 1 760 1 616
Staff costs 134 153 137 159 159 424 497
Other costs 80 118 119 112 89 317 276
Depreciation, impairment on fixed and intangible assets 22 20 31 36 29 73 98
Total operating expenses 236 291 287 306 278 814 871
Pre-tax operating profit before write-downs 364 264 317 494 233 945 744
Net gains on fixed and intangible assets
Write-downs on loans and guarantees
Pre-tax operating profit 364 264 317 494 233 945 744
Taxes (8) (7) (11) (176) 11 (26) 97
Profit from discontinuing operations after taxes
Profit for the period 2) 372 271 328 670 222 971 647
Jan. - Sept.
1) The figures encompass Vital Forsikring ASA including subsidiaries and Vital Link AS as included in the DnB NOR Group's accounts before eliminations for intra-group transactions and balances.
2) For a detalied statement of financial performance, se page 53.

Third quarter 2005 3. Financial results - DnB NOR Group - IFRS (Pro forma accounting figures prior to 2005)
57
Balance sheets - IFRS 1) 30 Sept. 30 June 31 March 1 Jan. 30 Sept. 1 Jan.
Amounts in NOK million 2005 2005 2005 2005 2004 2004
Cash and deposits with central banks
Lending to and deposits with credit institutions 9 872 7 341 6 095 5 165 5 995 4 206
Gross lending to customers
- Accumulated write-downs
Net lending to customers
Trading securities - commercial paper and bonds
Trading securities - shareholdings etc.
Financial assets - customers bearing the risk 12 016 10 766 10 354 9 747 9 230 7 287
Other financial instruments at fair value through profit and loss - commercial paper and bonds 64 191 65 348 61 361 55 313 53 708 53 744
Other financial instruments at fair value through profit and loss - shareholdings etc. 30 001 27 037 25 496 24 371 22 565 19 398
Financial derivative instruments 118 272 472 2 189 612 442
Financial derivative instruments used for hedging
Shareholdings- available for sale
Commercial paper and bonds - held to maturiy 52 282 51 656 54 390 55 645 56 588 47 414
Investment property 19 445 18 161 18 552 18 445 16 763 16 687
Investments in associated companies 14 14 14 14 14 14
Intangible assets 213 231 270 292 334 416
Deferred tax assets 0 30 0 0 0 0
Fixed assets 1 168 1 104 1 116 1 094 1 083 1 067
Biological assets
Discontinuing operations
Accrued income and prepaid expenses 32 32 4 4 38 64
Other assets 3 155 3 373 2 744 2 830 5 505 7 026
Total assets 192 508 185 364 180 870 175 109 172 434 157 765
Loans and deposits from credit institutions
Deposits from customers
Financial derivative instruments
Securities issued
Insurance liabilities - customers bearing the risk 12 016 10 766 10 354 9 747 9 230 7 287
Liabilities to life insurance policyholders 168 056 162 143 157 972 153 488 149 713 137 693
Other liabilities 938 1 048 699 922 1 628 2 832
Accrued expenses and prepaid income 281 552 1 317 761 2 027 663
Discontinuing operations
Provisions
Deferred tax liabilities 394 405 412 423 680 598
Subordinated loan capital 2 578 2 577 2 538 2 519 2 566 2 732
Total liabilities 184 263 177 491 173 293 167 860 165 844 151 805
Minority interests
Revaluation changes
Share capital 2 423 2 423 2 418 2 418 2 418 2 418
Other reserves and retained earnings 5 821 5 450 5 159 4 831 4 172 3 541
Total equity 8 245 7 873 7 577 7 249 6 591 5 960
Total liabilities and equity 192 508 185 364 180 870 175 109 172 434 157 765
1) The figures encompass Vital Forsikring ASA including subsidiaries and Vital Link AS as included in the DnB NOR Group's accounts before eliminations for intra-group transactions and balances.

3. Financial results - DnB NOR Group - IFRS Third quarter 2005 (Pro forma accounting figures prior to 2005)
58
Products and organisation Life Insurance and Pensions offers: • Group pension schemes to businesses, adapted to customer needs for defined-benefit,
defined-contribution and single premium pension schemes. • Long-term savings alternatives in the form of individual pension agreements and annuities in
the retail market. • Products are offered with guaranteed returns or with a choice of investment profile (unit
linked). • Savings products from other units in the DnB NOR Group, including mutual funds from
DnB NOR Kapitalforvaltning and equity-linked bonds from DnB NOR Markets.
The business area is represented in most parts of Norway through sales offices and provides services through DnB NOR and Postbanken's distribution networks and independent agents, as well as via the Internet. Cooperation with other group entities • By taking advantage of the strength of the DnB NOR Group's total distribution network, Life
Insurance and Pensions is well positioned to enjoy continued market growth. • Life Insurance and Pensions' growth in the retail market is not least due to the business area's
extensive distribution network, where other business areas in the Group play a principal role. • In the third quarter of 2005, other business areas accounted for 69.7 per cent of the sales of
Life Insurance and Pensions' products in the retail market, compared with 52.8 per cent in the corresponding period of 2004.
Employees Life Insurance and Pensions gives priority to retaining and developing a high level of expertise within insurance products, management and other relevant areas of competence. Full-time positions – Life Insurance and Pensions - IFRS
30 Sept. 2005 30 Sept. 2004
Life insurance 838 965
Unit link 29 29
Total 867 994

Third quarter 2005 3. Financial results - DnB NOR Group - NGAAP
59
Balance sheets and capital adequacy according to NGAAP
The analyses below are prepared on the basis of accounting principles according to Norwegian accounting legislation etc. (NGAAP). Tables marked "Life Insurance and Pensions" refer to life insurance operations including unit linked operations in Vital Link AS. Tables marked "life insurance" refer to operations in Vital Forsikring ASA including subsidiaries. Kredittilsynet and the Ministry of Finance have not adapted solvency capital or capital adequacy regulations to IFRS. For the time being, solvency and capital adequacy calculations are based on rules for statutory accounts, which thus far are not allowed to be restated according to IFRS. Balance sheets – Life Insurance and Pensions - NGAAP
Pro forma
30 Sept. 30 June 31 Mar. 31 Dec. 30 Sept. 31 Dec.Amounts in NOK million 2005 2005 2005 2004 2004 2003
Financial assets
Norwegian equities 1) 9 094 7 959 7 509 7 077 7 684 7 518
International equities 2) 21 209 19 376 18 241 17 476 15 062 12 023
Norwegian bonds 3) 25 942 26 439 27 694 26 636 27 442 23 687
International bonds 4) 12 484 17 955 16 579 18 776 16 880 15 746
Money market instruments 5) 34 217 27 201 22 111 15 654 14 475 21 034
Bonds held to maturity 50 846 50 515 52 955 54 172 55 020 46 723
Real estate 20 496 19 167 19 518 19 410 17 723 17 633
Assets related to unit linked insurance business 12 016 10 766 10 353 9 741 9 230 7 287
Other 6 773 6 529 6 593 6 203 8 956 6 157
Total assets 193 077 185 906 181 552 175 145 172 472 157 808
Equity 8 306 7 932 7 638 7 307 6 639 5 991
Subordinated loan capital 2 580 2 577 2 538 2 519 2 566 2 732
Securities adjustment reserve 4 942 3 966 2 670 3 538 1 966 2 448
Insurance provisions
Premium reserve 154 817 150 080 147 189 140 701 139 112 126 193
Additional allocations 2 324 2 331 2 340 2 357 2 053 2 050
Premium fund and pension regulation fund 5 572 5 352 5 367 5 992 5 601 5 678
Security reserve 203 200 200 201 202 200
Other reserves 563 584 577 545 636 1 018
Provisions in unit linked insurance business 12 016 10 766 10 353 9 741 9 230 7 287
Other liabilities 1 756 2 119 2 681 2 244 4 467 4 212
Total equity and liabilities 193 077 185 906 181 552 175 145 172 472 157 808
1) Norwegian equities 9 094 7 480 7 058 6 664 7 684 7 518
2) International equities 31 018 25 382 24 178 20 787 17 659 12 023
- of which investments in hedge funds 1 435 1 485 1 454 1 447 1 406 1 712
3) Norwegian bonds 22 117 22 051 22 516 21 649 19 595 23 687
4) International bonds 4 620 4 433 7 829 8 199 7 855 15 746
5) Money market instruments 36 098 39 583 30 553 28 320 28 749 21 034
Net exposure after adjustment for derivative contracts:
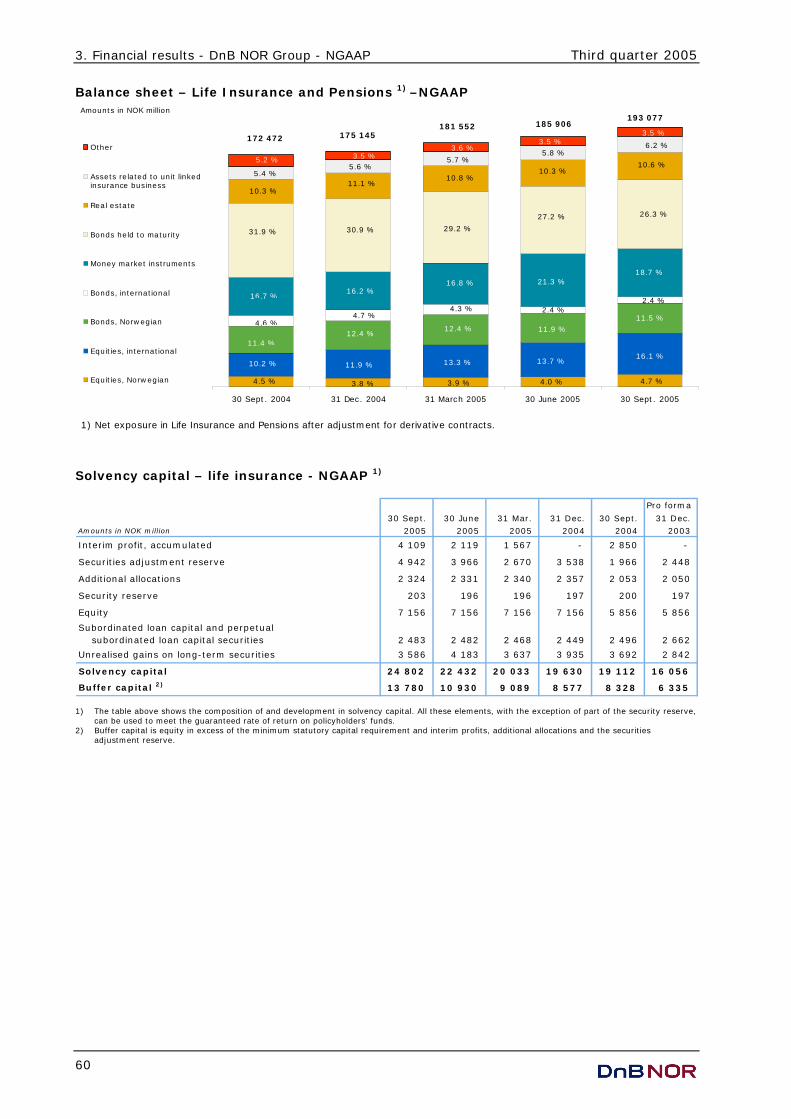
3. Financial results - DnB NOR Group - NGAAP Third quarter 2005
60
Balance sheet – Life Insurance and Pensions 1) –NGAAP
30 Sept. 2004 31 Dec. 2004 31 March 2005 30 June 2005 30 Sept. 2005
Other
Assets related to unit linkedinsurance business
Real estate
Bonds held to maturity
Money market instruments
Bonds, international
Bonds, Norwegian
Equities, international
Equities, Norwegian
172 472 175 145
193 077 181 552 185 906
1) Net exposure in Life Insurance and Pensions after adjustment for derivative contracts.
4.5 %
10.2 %
11.4 %
4.6 %
16.7 %
31.9 %
10.3 %
5.2 %
11.9 %
3.8 %
12.4 %
4.7 %
16.2 %
30.9 %
11.1 %
3.5 %
3.9 %
13.3 %
12.4 %
4.3 %
16.8 %
29.2 %
10.8 %
3.6 %
4.0 %
13.7 %
11.9 %
2.4 %
21.3 %
27.2 %
10.3 %
3.5 %
16.1 %
4.7 %
11.5 %
2.4 %
18.7 %
26.3 %
10.6 %
3.5 %
Amounts in NOK million
5.4 %5.6 %
5.7 %5.8 %
6.2 %
Solvency capital – life insurance - NGAAP 1)
Pro forma
30 Sept. 30 June 31 Mar. 31 Dec. 30 Sept. 31 Dec.Amounts in NOK million 2005 2005 2005 2004 2004 2003
Interim profit, accumulated 4 109 2 119 1 567 - 2 850 -
Securities adjustment reserve 4 942 3 966 2 670 3 538 1 966 2 448
Additional allocations 2 324 2 331 2 340 2 357 2 053 2 050
Security reserve 203 196 196 197 200 197
Equity 7 156 7 156 7 156 7 156 5 856 5 856
Subordinated loan capital and perpetual subordinated loan capital securities 2 483 2 482 2 468 2 449 2 496 2 662
Unrealised gains on long-term securities 3 586 4 183 3 637 3 935 3 692 2 842
Solvency capital 24 802 22 432 20 033 19 630 19 112 16 056
Buffer capital 2) 13 780 10 930 9 089 8 577 8 328 6 335
1) The table above shows the composition of and development in solvency capital. All these elements, with the exception of part of the security reserve, can be used to meet the guaranteed rate of return on policyholders' funds.
2) Buffer capital is equity in excess of the minimum statutory capital requirement and interim profits, additional allocations and the securities adjustment reserve.

Third quarter 2005 3. Financial results - DnB NOR Group - NGAAP
61
Capital adequacy and solvency margin capital – life insurance - NGAAP
Pro forma
30 Sept. 30 June 31 Mar. 31 Dec. 30 Sept. 31 Dec.Amounts in NOK million 2005 2005 2005 2004 2004 2003
Capital adequacy 1)
Total eligible primary capital 9 075 9 035 9 032 8 953 7 661 7 724
Capital adequacy ratio (%) 12.6 12.8 14.1 14.1 12.7 13.8
Core capital 6 818 6 806 6 803 6 801 5 497 5 390
Core capital (%) 9.4 9.6 10.6 10.7 9.1 9.6
Risk-weighted assets 72 239 70 689 64 220 63 325 60 566 56 151
Solvency margin capital 2)
Solvency margin capital 10 351 10 307 10 308 10 238 8 777 8 838
Solvency margin capital exceeding minimum requirement 3 488 3 651 3 605 3 949 2 358 3 045
151 155 154 163 137 153 Solvency margin capital in per cent of solvency margin capital requirement (%)
1) Capital adequacy regulations regulate the relationship between the company's primary capital and the investment exposure on the asset side of the
balance sheet. Life insurance companies are subject to a minimum capital adequacy requirement of 8 per cent. 2) Solvency margin capital is measured against the solvency margin requirement, which is linked to the company's insurance commitments on the
liabilities side of the balance sheet. The solvency margin requirements for Norwegian life insurance companies are subject to regulations on the calculation of solvency capital requirements and solvency margin capital, as laid down by the Ministry of Finance on 19 May 1995.

3. Financial results - DnB NOR Group - IFRS Third quarter 2005 (Pro forma accounting figures prior to 2005)
62
Asset Management Asset Management provides mutual funds and discretionary portfolio management services to Norwegian and other Nordic corporate clients, the public sector, private pension funds and retail customers. Øyvind Birkeland, group executive vice president, heads the business area. Asset Management seeks to provide first-class returns on customer funds within the preferred risk profile and investment horizon. DnB NOR aspires to be the leading asset manager for customers in the Nordic region, providing sound long-term returns and a high level of service based on a thorough understanding of customer needs. The first exchange-traded fund in Norway, DnB NOR OBX, was launched in the first quarter of 2005. The hedge fund operations of Absolute Return Investment AB were taken over in their entirety from Skandia Liv in April 2005. The integration of products, services and the organisations is expected to result in annual cost synergies of NOK 110 million by the end of 2006. The initial integration process in 2003-2004 resulted in staff cuts of 71 full-time positions. In the first three quarters of 2005 synergies reduced staff by 11 full-time positions. In addition new preliminary vacancies reduced staff by eight full-time positions. Planned staff reductions in connection with the merger was 70 full-time positions. Staff reduction are thus ahead of target. New mutual fund packages, the 'Save Smart' concept, launched in September 2005 were well received in the market. Hedge funds are a priority area in 2005. The new tax reform in Norway will be an incentive for mutual fund savings. Financial performance - IFRS
Amounts in NOK million 3Q05 2Q05 1Q05 4Q04 3Q04 2005 2004
Net interest income - ordinary operations 0 (2) (1) (1) 3 (3) (5)
Interest on allocated capital 1) 8 7 6 6 6 21 19
Net interest income 9 5 5 5 9 18 15
Commission income
- from retail customers 90 84 85 95 96 259 265
- from institutional clients 149 148 157 139 127 455 406
Other income 5 4 3 8 13 13 12
Total income 253 241 250 247 246 744 698
Operating expenses 162 164 169 172 156 496 509
Pre-tax operating profit before write-downs 91 77 81 76 90 249 189
Write-downs on loans and net losses on assets 2 0 0 0 0 2 0
Pre-tax operating profit 89 77 81 76 90 247 189
Assets under management 2)
Institutional 464 447 449 440 450 464 450
- of which Life Insurance and Pensions 163 159 154 149 145 163 145
Retail 47 44 43 42 40 47 40
Total 511 491 492 482 490 511 490
Key figures
Cost/income ratio 63.9 68.2 67.6 69.4 63.5 66.6 73.0
Return on capital (% p.a.) 1) 17.8 16.9 20.3 17.5 20.7 18.3 14.6
1) Calculated on the basis of recorded equity.
2) Assets under management at end of period.
Jan. - Sept.

Third quarter 2005 3. Financial results - DnB NOR Group - IFRS (Pro forma accounting figures prior to 2005)
63
Comments to the financial performance in the first three quarters of 2005 • Commission income increased by NOK 44 million from the first three quarters of 2004 to the
first three quarters of 2005. This was mainly due to growth in assets under management. • Operating expenses in the first three quarters of 2005 were NOK 496 million, which was NOK
13 million below operating expenses in the corresponding period of 2004. • Cost synergies representing NOK 58 million were achieved in the first three quarters of 2005,
bringing total synergies from the DnB NOR merger to NOK 106 million so far. Assets under management
450 440 449 447 464
40 42 43 4447
30 Sept. 2004 31 Dec. 2004 31 M arch 2005 30 June 2005 30 Sept. 2005
Institutional clients Retail market
71 %
NOK billion
1)
1)
490511
491492 482
76 %
42 %38 %
1)
1)
1) Share of total assets in the institutional and retail market respectively, invested in bonds, fixed-income funds and money market funds. 30 Sept. 2004 30 Sept. 2005
Institutional clients Retail market Institutional clients Retail market
Bonds and money market
investments3 %
Bonds and money market
investments70 %
Equity and balanced
funds22 %
Equity and balanced
funds5 %
110
340
23 17
Total: NOK 490 billion
Bonds and money market
investments64 %
Bonds and money market
investments4 %
Equity and balanced
funds6 %
Equity and balanced
funds26 % 135
329
29 18
Total: NOK 511 billion
(Amounts in NOK billion and per cent of total assets)

3. Financial results - DnB NOR Group - IFRS Third quarter 2005 (Pro forma accounting figures prior to 2005)
64
Changes in assets under management - net inflow
Amounts in NOK million 3Q05 2Q05 1Q051) 4Q04 3Q04 20051) 20042)
Retail market 88 (668) (572) 909 (480) (1 152) (871)
Institutional clients 3 495 (3 700) 7 098 (17 585) 1 279 6 893 2 899
Total 3 583 (4 368) 6 526 (16 675) 799 5 741 2 027
Jan. - Sept.
3)
1) Excluding dividends of NOK 1 446 million, of which NOK 446 million refers to retail and NOK 1 000 million to institutional
clients. 2) Excluding dividends of NOK 1 821 million, of which NOK 779 million refers to retail and NOK 1 042 million to institutional
clients. 3) The reduction was due to the termination of one large contract which, according to agreement, should have been terminated
two quarters earlier.
Comments to changes in assets under management • Assets under management increased by NOK 29.2 billion or 6.1 per cent in the first three
quarters of 2005. • There was a net inflow of funds from institutional clients of NOK 6.9 billion or 1.6 per cent and
a net outflow from the retail market of NOK 1.1 billion or 2.7 per cent in the first three quarters of 2005.
• New institutional mandates were won in both Sweden and Norway. • Market developments led to a NOK 39.6 billion increase in assets under management,
representing 8.2 per cent measured in customers' base currencies. • The appreciation of NOK against other currencies, especially SEK, reduced assets under
management by NOK 16.2 billion or 3.4 per cent. • During the first three quarters of 2005, Morgan Stanley's global equity index (MSCI World Net
Div.) increased by 6.2 per cent measured in USD and by 14.4 per cent measured in NOK. • The stock exchanges in Stockholm (OMX) and Oslo (OSEBX) climbed by 20.8 and 38.6 per
cent respectively during the first three quarters of 2005.
Development in assets under management and commission income
391
464482
806 814
905
2002 2003 2004
Assets under management, year-end figures (NOK billion)
Commission income, full-year figures (NOK million)
1)
1) Pro forma including Skandia Asset Management as from 1 January 2002

Third quarter 2005 3. Financial results - DnB NOR Group - IFRS (Pro forma accounting figures prior to 2005)
65
Investment returns on assets under management • Returns on a number of major client portfolios and funds outperformed relevant benchmarks,
including Vital Forsikring's total portfolio, as well as Norwegian equity and bond investments and major Swedish equity portfolios.
• Fund managers' specialisation has led to strong performance for several industry-specific funds (percentage point return in excess of benchmark in parentheses): DnB NOR Global Health Care (3.9) DnB NOR Nordic Technology (5.2) DnB NOR Telecom (5.1)
Customers/markets • Asset Management serves the Norwegian and Swedish savings markets, offering domestic and
international asset management services. • Brand names:
DnB NOR Kapitalforvaltning in the Norwegian institutional and retail markets DnB NOR Asset Management and Carlson in the Swedish institutional and retail markets
• A leading position in the institutional market in both Norway and Sweden with around 470 institutional clients. The largest clients are Skandia Liv and Vital
• The number of mutual fund customers in Norway was more than 676 000 at the end of September 2005. The number of savings agreements exceeded 251 000.
• Market shares: DnB NOR Kapitalforvaltning (mutual funds in Norway) 31.7 per cent (as at 31 Aug. 2005) Carlson Fonder (mutual funds in Sweden) 1.3 per cent Institutional market in Norway > 30 per cent Institutional market in Sweden > 20 per cent
Fund capital and market shares in Norway
Fund Market Fund Market Fund Market Fund Market Fund Market
Amounts in NOK million and per cent capital share capital share capital share capital share capital share
Equity funds (Norwegian) 11 911 25.1 10 851 25.8 10 574 26.1 10 280 27.4 10 207 28.5
Equity funds (international) 14 717 18.7 14 313 20.8 15 584 23.3 13 582 23.4 13 557 27.5
Balanced funds 5 007 58.6 4 793 59.8 4 588 60.5 4 251 62.0 3 927 59.7
Fixed-income funds 9 644 35.4 11 526 40.5 11 096 40.1 11 107 39.9 10 397 40.7
Money market funds 27 464 50.1 26 836 50.3 28 131 51.9 26 899 53.1 28 022 53.8
Total mutual funds 68 742 31.7 68 319 34.0 69 973 35.6 66 119 36.6 66 111 39.1
Source: Norwegian Mutual Fund Association
30 Sept. 200431 August 2005 30 June 2005 31 March 2005 31 Dec. 2004
Products and services • Mutual funds, hedge funds and absolute return products • Discretionary portfolio management • Management and monitoring of investment portfolios • Asset allocation and risk management advisory services

3. Financial results - DnB NOR Group - IFRS Third quarter 2005 (Pro forma accounting figures prior to 2005)
66
Organisation • Legal structure simplified through the merging of all operational asset management
companies in Norway. • Customer activity is concentrated in Norway and Sweden. In order to provide competitive
global asset management, investment operations have also been established in London, New York and Hong Kong.
• A combination of regional and sector-oriented management teams with a presence in all major financial markets.
• Asset management services are provided through channels adapted to the various markets: Retail customers in Norway DnB NOR's extensive network of branches and regional financial services centres Post offices and in-store postal outlets The Internet External channels including brokers, investment advisers and regional and local savings banks
Retail customers in Sweden Local distributors
Institutional markets in Sweden and Norway The business area's own sales force and, in Norway, through cooperation with Corporate Banking
Employees • Staff cuts corresponding to 11 full-time positions and new vacancies corresponding to eight
full-time positions in the first three quarters of 2005. • 291 full-time positions at the end of September 2005. Cooperation with other group entities • DnB NOR's extensive network represents the major distribution channel in the Norwegian
retail market. • Asset Management and Corporate Banking cooperate in providing a complete range of
financial services to corporate customers. • Asset Management manages Vital's equity and bond portfolios. • Asset Management cooperates with other group entities in developing products adapted to the
various markets.
67
Section 4
Financial results for the banking group
according to NGAAP
DnB NOR Bank Group

4. Financial results - banking group - NGAAP Third quarter 2005
68
Financial results – banking group - NGAAP
Financial highlights
Amounts in NOK million 3Q05 2Q05 1Q05 4Q04 3Q04 2005 20041)
Pre-tax operating profit before losses 2 620 2 387 2 318 2 187 2 135 7 325 7 056
Pre-tax operating profit 2 929 2 432 2 178 2 172 2 280 7 540 7 011
Profit for the period 2 139 1 775 1 590 1 668 1 663 5 504 5 118
Cost/income ratio excl. goodwill (per cent) 50.7 53.3 53.2 56.6 55.5 52.4 56.1
Cost/income ratio (per cent) 52.0 54.6 54.5 58.0 56.3 53.7 57.4
Return on equity excl. goodwill (per cent) 20.9 18.3 17.2 16.4 16.6 18.8 18.2
Return on equity (per cent) 20.3 17.6 16.5 15.7 16.3 18.1 17.4
Core capital ratio at end of period (per cent) 2) 7.2 7.4 7.4 7.5 7.7 7.2 7.7
1) Including NOK 946 million in gains on the sale of operations and NOK 805 million in restructuring provisions related to the DnB NOR merger.
2) Including 50 per cent of profit for the period, except for year-end figures.
Jan. - Sept.
Profit and loss accounts
Amounts in NOK million 3Q05 2Q05 1Q05 4Q04 3Q04 2005 2004
Net interest income and credit commissions 3 376 3 306 3 236 3 337 3 322 9 918 10 039
Net other ordinary operating income 2 067 1 916 1 824 1 879 1 603 5 807 5 235
Ordinary operating expenses 2 828 2 831 2 772 2 887 2 746 8 431 8 704
Ordinary operating profit 2 616 2 390 2 288 2 329 2 179 7 294 6 569
Net gains on the sale of fixed assets 13 36 31 (6) (40) 80 1 305
Other expenses 9 39 2 135 5 49 818
Pre-tax operating profit before losses 2 620 2 387 2 318 2 187 2 135 7 325 7 056
Net losses on loans etc. (102) (40) 134 70 (121) (8) 97
Net gains on long-term securities 208 5 (5) 55 24 208 51
Pre-tax operating profit 2 929 2 432 2 178 2 172 2 280 7 540 7 011
Taxes 791 657 588 504 617 2 036 1 893
Profit for the period 2 139 1 775 1 590 1 668 1 663 5 504 5 118
Jan. - Sept.
Balance sheets 30 Sept. 30 June 31 March 31 Dec. 30 Sept. 31 Dec.
Amounts in NOK billion 2005 2005 2005 2004 2004 2003
Cash and lending to/deposits with credit institutions 68.1 59.2 51.2 30.4 36.9 36.6
Net lending to customers 648.1 617.2 597.0 577.4 570.7 565.9
Commercial paper, bonds, etc. 77.3 68.2 68.4 63.0 65.4 59.7
Shareholdings, etc. 4.0 3.9 6.1 6.0 5.7 5.3
Fixed and intangible assets 6.3 6.4 6.7 6.8 7.2 7.7
Other assets 27.8 30.7 28.9 29.0 31.7 29.7
Total assets 831.6 785.6 758.3 712.5 717.5 704.9
Loans and deposits from credit institutions 93.4 84.1 77.2 48.9 63.5 78.5
Deposits from customers 409.4 393.0 375.5 360.2 354.5 337.8
Borrowings through the issue of securities 222.2 207.1 199.6 192.4 192.3 181.9
Other liabilities and provisions 38.6 36.2 42.3 49.1 41.7 46.4
Primary capital 68.1 65.2 63.7 61.8 65.4 60.3
Total liabilities and equity 831.6 785.6 758.3 712.5 717.5 704.9
Average total assets for the year to date 772.1 760.0 746.7 739.3 738.3 693.4
Ratio of deposits to net lending (%) 63.2 63.7 62.9 62.4 62.1 59.7
Ratio of average deposits to average net lending (%) 63.2 62.8 63.2 62.5 62.4 63.0
For detailed profit and loss accounts and balance sheets, see page 82.
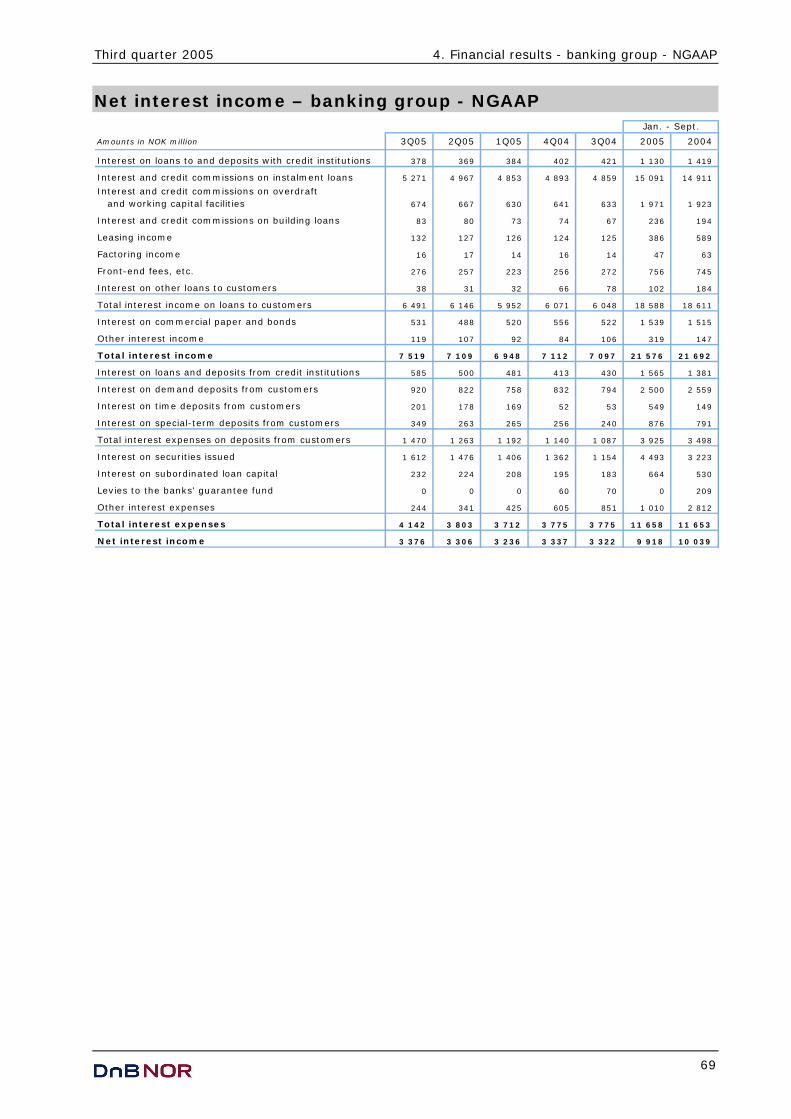
Third quarter 2005 4. Financial results - banking group - NGAAP
69
Net interest income – banking group - NGAAP
Amounts in NOK million 3Q05 2Q05 1Q05 4Q04 3Q04 2005 2004
Interest on loans to and deposits with credit institutions 378 369 384 402 421 1 130 1 419
Interest and credit commissions on instalment loans 5 271 4 967 4 853 4 893 4 859 15 091 14 911
Interest and credit commissions on overdraft and working capital facilities 674 667 630 641 633 1 971 1 923
Interest and credit commissions on building loans 83 80 73 74 67 236 194
Leasing income 132 127 126 124 125 386 589
Factoring income 16 17 14 16 14 47 63
Front-end fees, etc. 276 257 223 256 272 756 745
Interest on other loans to customers 38 31 32 66 78 102 184
Total interest income on loans to customers 6 491 6 146 5 952 6 071 6 048 18 588 18 611
Interest on commercial paper and bonds 531 488 520 556 522 1 539 1 515
Other interest income 119 107 92 84 106 319 147
Total interest income 7 519 7 109 6 948 7 112 7 097 21 576 21 692
Interest on loans and deposits from credit institutions 585 500 481 413 430 1 565 1 381
Interest on demand deposits from customers 920 822 758 832 794 2 500 2 559
Interest on time deposits from customers 201 178 169 52 53 549 149
Interest on special-term deposits from customers 349 263 265 256 240 876 791
Total interest expenses on deposits from customers 1 470 1 263 1 192 1 140 1 087 3 925 3 498
Interest on securities issued 1 612 1 476 1 406 1 362 1 154 4 493 3 223
Interest on subordinated loan capital 232 224 208 195 183 664 530
Levies to the banks' guarantee fund 0 0 0 60 70 0 209
Other interest expenses 244 341 425 605 851 1 010 2 812
Total interest expenses 4 142 3 803 3 712 3 775 3 775 11 658 11 653
Net interest income 3 376 3 306 3 236 3 337 3 322 9 918 10 039
Jan. - Sept.

4. Financial results - banking group - NGAAP Third quarter 2005
70
Developments in average interest rate spreads
2.262.362.35
2.15
2.21
2.02 1.99 1.992.09
2.27
3Q04 4Q04 1Q05 2Q05 3Q05
Per cent
1) Combined spread for lending and deposits.
3-month NIBOR
Combined spread 1)
Developments in average volumes
566 573 585 604625
358 360 370 378399
3Q04 4Q04 1Q05 2Q05 3Q05
NOK billion
Lending (Growth 3Q04-3Q05: 10.5%)
Deposits (Growth 3Q04-3Q05: 11.4%)
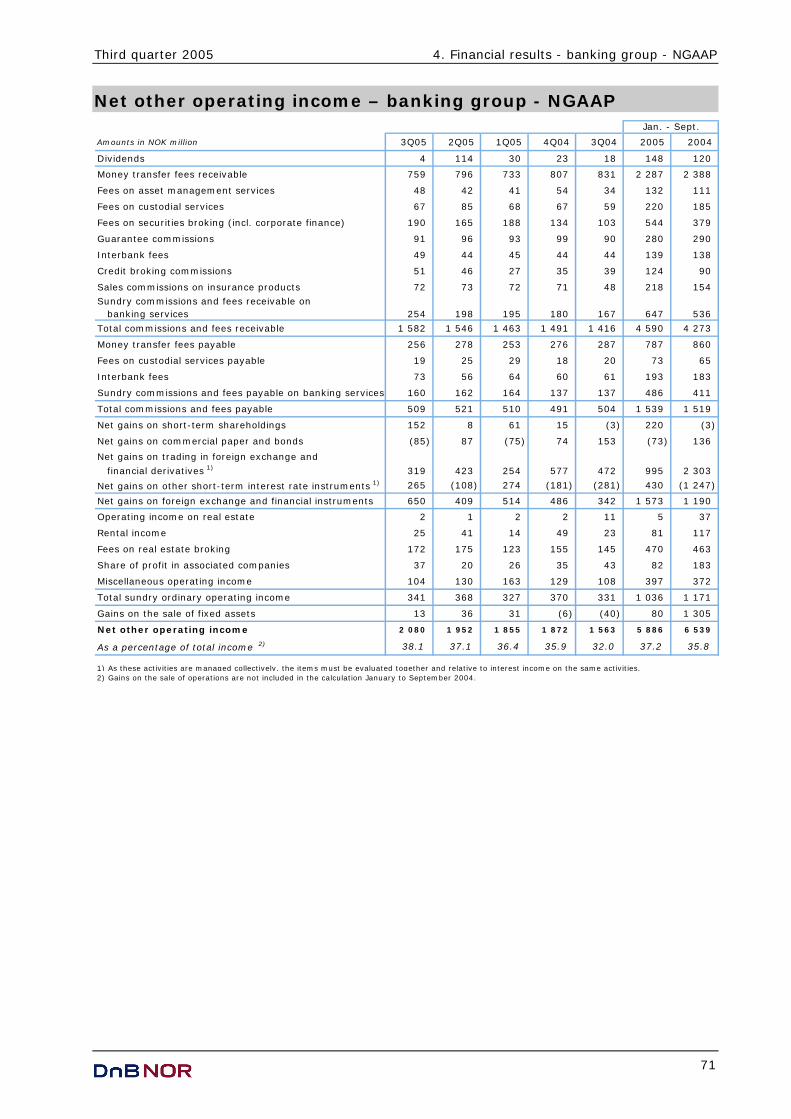
Third quarter 2005 4. Financial results - banking group - NGAAP
71
Net other operating income – banking group - NGAAP
Amounts in NOK million 3Q05 2Q05 1Q05 4Q04 3Q04 2005 2004
Dividends 4 114 30 23 18 148 120
Money transfer fees receivable 759 796 733 807 831 2 287 2 388
Fees on asset management services 48 42 41 54 34 132 111
Fees on custodial services 67 85 68 67 59 220 185
Fees on securities broking (incl. corporate finance) 190 165 188 134 103 544 379
Guarantee commissions 91 96 93 99 90 280 290
Interbank fees 49 44 45 44 44 139 138
Credit broking commissions 51 46 27 35 39 124 90
Sales commissions on insurance products 72 73 72 71 48 218 154
Sundry commissions and fees receivable on banking services 254 198 195 180 167 647 536
Total commissions and fees receivable 1 582 1 546 1 463 1 491 1 416 4 590 4 273
Money transfer fees payable 256 278 253 276 287 787 860
Fees on custodial services payable 19 25 29 18 20 73 65
Interbank fees 73 56 64 60 61 193 183
Sundry commissions and fees payable on banking services 160 162 164 137 137 486 411
Total commissions and fees payable 509 521 510 491 504 1 539 1 519
Net gains on short-term shareholdings 152 8 61 15 (3) 220 (3)
Net gains on commercial paper and bonds (85) 87 (75) 74 153 (73) 136
Net gains on trading in foreign exchange and
financial derivatives 1) 319 423 254 577 472 995 2 303
Net gains on other short-term interest rate instruments 1) 265 (108) 274 (181) (281) 430 (1 247)
Net gains on foreign exchange and financial instruments 650 409 514 486 342 1 573 1 190
Operating income on real estate 2 1 2 2 11 5 37
Rental income 25 41 14 49 23 81 117
Fees on real estate broking 172 175 123 155 145 470 463
Share of profit in associated companies 37 20 26 35 43 82 183
Miscellaneous operating income 104 130 163 129 108 397 372
Total sundry ordinary operating income 341 368 327 370 331 1 036 1 171
Gains on the sale of fixed assets 13 36 31 (6) (40) 80 1 305
Net other operating income 2 080 1 952 1 855 1 872 1 563 5 886 6 539
As a percentage of total income 2) 38.1 37.1 36.4 35.9 32.0 37.2 35.8
1) As these activities are managed collectively, the items must be evaluated together and relative to interest income on the same activities.2) Gains on the sale of operations are not included in the calculation January to September 2004.
Jan. - Sept.

4. Financial results - banking group - NGAAP Third quarter 2005
72
Number of "point-of-sale" transactions
62
54
5959
56
11.412.2 12.3 12.0 12.2
3Q04 4Q04 1Q05 2Q05 3Q05
Number of transactions (million)12-month growth (per cent)

Third quarter 2005 4. Financial results - banking group - NGAAP
73
Net gains on foreign exchange and financial instruments
Amounts in NOK million 3Q05 2Q05 1Q05 4Q04 3Q04 2005 2004
Net gains on short-term shareholdings 152 8 61 15 (3) 220 (3)
Net gains on commercial paper and bonds (85) 87 (75) 74 153 (73) 136
Net gains on trading in foreign exchange
and financial derivatives 319 423 254 577 472 995 2 303
Net gains on other short-term
interest rate instruments 265 (108) 274 (181) (281) 430 (1 247)
Net gains on foreign exchange and
financial instruments 650 409 514 486 342 1 573 1 190
Of which:
DnB NOR Markets (I+II) 498 406 460 440 331 1 365 1 135
Banking portfolio, equity investments 111 0 44 12 (15) 156 (22)
Banking portfolio, other 40 3 10 33 26 53 76
Jan. - Sept.
Total income in DnB NOR Markets
Amounts in NOK million 3Q05 2Q05 1Q05 4Q04 3Q04 2005 2004
Customer business
Net gains on trading in foreign exchange
and financial instruments (I) 273 251 331 254 210 855 677
Net interest income 60 62 49 61 53 171 154
Other income 241 205 223 187 154 669 477
Total income customer business 574 519 603 501 417 1 695 1 307
Trading/market making
Net gains on trading in foreign exchange
and financial instruments (II) 225 155 129 186 121 510 459
Net interest income (34) (24) (17) (14) 15 (75) 29
Other income (5) 1 (2) 4 (2) (6) (1)
Total income trading/market making 185 133 110 176 135 429 488
Total income customer business and
trading/market making 759 651 713 677 552 2 124 1 795
Interest on allocated equity 13 13 10 10 10 35 31
Total income DnB NOR Markets 772 664 723 688 562 2 159 1 825
Jan. - Sept.
Market value above book value, banking portfolio 1)
30 Sept. 30 June 31 March 31 Dec. 30 Sept. 31 Dec.
Amounts in NOK million 2005 2005 2005 2004 2004 2003
Commercial paper and bonds 45 92 80 104 88 57
Short-term shareholdings 66 143 97 110 65 45
1) Unrealised gains have not been included in the profit and loss accounts.
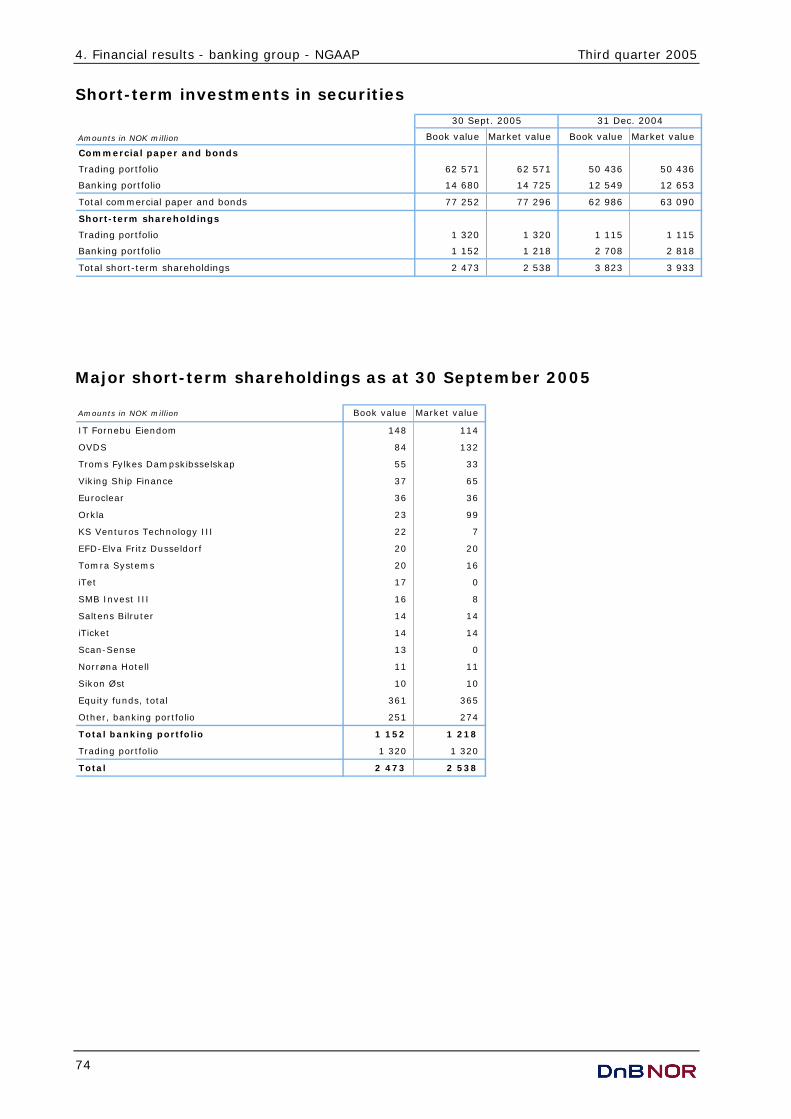
4. Financial results - banking group - NGAAP Third quarter 2005
74
Short-term investments in securities
Amounts in NOK million Book value Market value Book value Market value
Commercial paper and bonds
Trading portfolio 62 571 62 571 50 436 50 436
Banking portfolio 14 680 14 725 12 549 12 653
Total commercial paper and bonds 77 252 77 296 62 986 63 090
Short-term shareholdings
Trading portfolio 1 320 1 320 1 115 1 115
Banking portfolio 1 152 1 218 2 708 2 818
Total short-term shareholdings 2 473 2 538 3 823 3 933
30 Sept. 2005 31 Dec. 2004
Major short-term shareholdings as at 30 September 2005 Amounts in NOK million Book value Market value
IT Fornebu Eiendom 148 114
OVDS 84 132
Troms Fylkes Dampskibsselskap 55 33
Viking Ship Finance 37 65
Euroclear 36 36
Orkla 23 99
KS Venturos Technology III 22 7
EFD-Elva Fritz Dusseldorf 20 20
Tomra Systems 20 16
iTet 17 0
SMB Invest III 16 8
Saltens Bilruter 14 14
iTicket 14 14
Scan-Sense 13 0
Norrøna Hotell 11 11
Sikon Øst 10 10
Equity funds, total 361 365
Other, banking portfolio 251 274
Total banking portfolio 1 152 1 218
Trading portfolio 1 320 1 320
Total 2 473 2 538
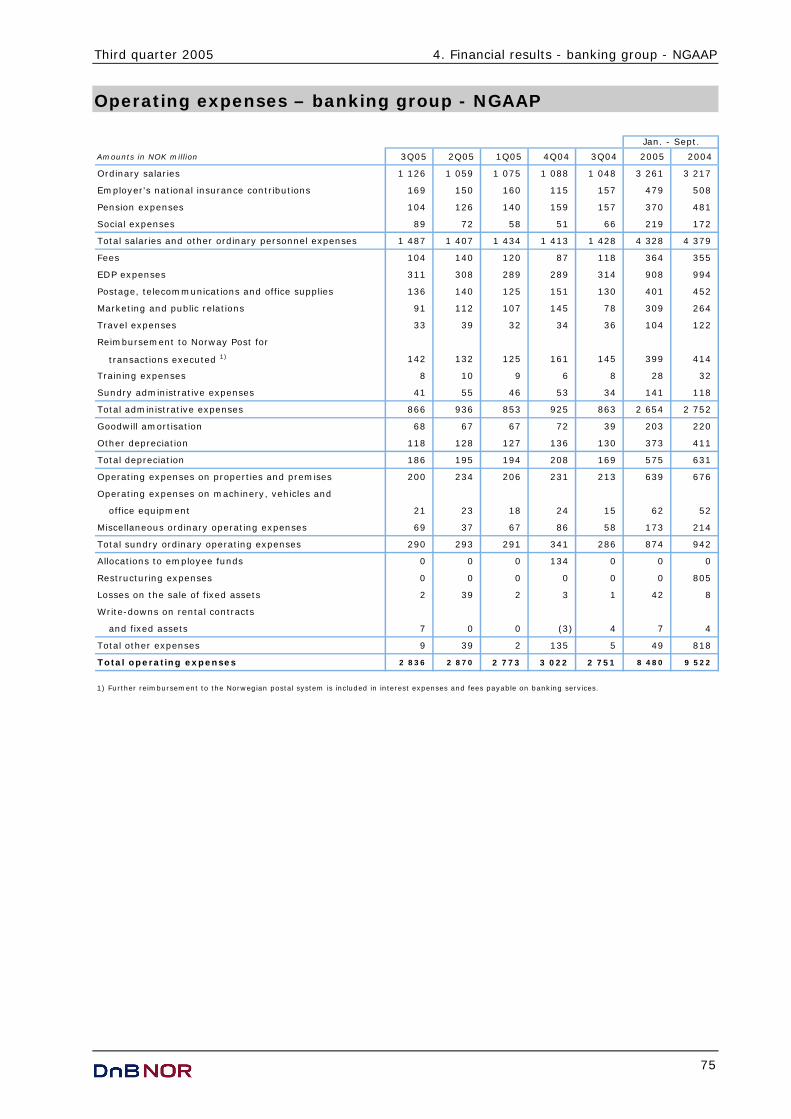
Third quarter 2005 4. Financial results - banking group - NGAAP
75
Operating expenses – banking group - NGAAP
Amounts in NOK million 3Q05 2Q05 1Q05 4Q04 3Q04 2005 2004
Ordinary salaries 1 126 1 059 1 075 1 088 1 048 3 261 3 217
Employer's national insurance contributions 169 150 160 115 157 479 508
Pension expenses 104 126 140 159 157 370 481
Social expenses 89 72 58 51 66 219 172
Total salaries and other ordinary personnel expenses 1 487 1 407 1 434 1 413 1 428 4 328 4 379
Fees 104 140 120 87 118 364 355
EDP expenses 311 308 289 289 314 908 994
Postage, telecommunications and office supplies 136 140 125 151 130 401 452
Marketing and public relations 91 112 107 145 78 309 264
Travel expenses 33 39 32 34 36 104 122
Reimbursement to Norway Post for
transactions executed 1) 142 132 125 161 145 399 414
Training expenses 8 10 9 6 8 28 32
Sundry administrative expenses 41 55 46 53 34 141 118
Total administrative expenses 866 936 853 925 863 2 654 2 752
Goodwill amortisation 68 67 67 72 39 203 220
Other depreciation 118 128 127 136 130 373 411
Total depreciation 186 195 194 208 169 575 631
Operating expenses on properties and premises 200 234 206 231 213 639 676
Operating expenses on machinery, vehicles and
office equipment 21 23 18 24 15 62 52
Miscellaneous ordinary operating expenses 69 37 67 86 58 173 214
Total sundry ordinary operating expenses 290 293 291 341 286 874 942
Allocations to employee funds 0 0 0 134 0 0 0
Restructuring expenses 0 0 0 0 0 0 805
Losses on the sale of fixed assets 2 39 2 3 1 42 8
Write-downs on rental contracts
and fixed assets 7 0 0 (3) 4 7 4
Total other expenses 9 39 2 135 5 49 818
Total operating expenses 2 836 2 870 2 773 3 022 2 751 8 480 9 522
1) Further reimbursement to the Norwegian postal system is included in interest expenses and fees payable on banking services.
Jan. - Sept.

4. Financial results - banking group - NGAAP Third quarter 2005
76
Cost/income ratio before goodwill amortisation
53.353.255.5 56.6
50.7
2 7692 8032 7062 950
2 712
5 2105 091
5 257
4 886
5 456
2 0 .0
3 0 .0
4 0 .0
5 0 .0
6 0 .0
7 0 .0
8 0 .0
9 0 .0
1 0 0 .0
3Q04 4Q04 1Q05 2Q05 3Q05
2 5 0 0
3 0 0 0
3 5 0 0
4 0 0 0
4 5 0 0
5 0 0 0
5 5 0 0
6 0 0 0
6 5 0 0
Cost/income ratio(per cent)
Total income (NOK million)
Operating expenses(NOK million)
Number of employees - full-time positions 1)
Changes in
group structure
30 Sept. Other resulting from 31 Dec.
Full-time positions 2005 changes the merger 2004
Corporate Banking 1 787 (44) 1 831
Retail Banking 4 137 (152) 4 288
DnB NOR Markets 530 (1) 531
Discontinued operations 2) (5) 5
Staff and support units 2 056 (17) 2 073
Total 8 510 (213) (5) 8 728
1) Figures do not include seasonal employees. For information on synergies, se page 13.2) A reduction of five full-time positions resulted from the sale of Postbanken Eiendomsmegling in January 2005.

Third quarter 2005 4. Financial results - banking group - NGAAP
77
Losses on loans and guarantees – banking group - NGAAP Net losses
Amounts in NOK million 3Q05 2Q05 1Q05 4Q04 3Q04 2005 2004
New losses 209 203 335 289 289 748 1 114
Reversals on specified losses 311 243 201 219 410 756 1 017
Net losses (102) (40) 134 70 (121) (8) 97
Jan. - Sept.
Net losses by business area 1)
Amounts in NOK million 3Q05 2Q05 1Q05 4Q04 3Q04 2005 2004
Retail Banking 5 88 0 (26) 54 93 126
Corporate Banking (134) (128) 134 57 (175) (128) (52)
Discontinuing operations 23
Other units 27 0 0 39 0 27 0
Net losses (102) (40) 134 70 (121) (8) 97
1) Expected loan losses represented 0.27 per cent of the loan portfolio at the end of September 2005 (0.30 per cent at the end of 2004).
Jan. - Sept.
Net losses by customer sectors 1)
Amounts in NOK million 3Q05 2Q05 1Q05 4Q04 3Q04 2005 2004
Retail customers 12 91 6 (76) 62 109 133
International shipping 2 17 3 (7) (14) 21 (39)
Real estate 13 (14) (10) 19 (4) (11) (13)
Manufacturing 8 19 2 61 (231) 29 (165)
Services and management (27) (3) 0 13 7 (29) (227)
Trade (9) 6 37 (5) 30 34 56
Oil and gas 3 0 (7) (7) (30) (4) (34)
Transportation and communication 0 6 4 2 5 10 23
Building and construction 2 (4) 8 9 7 6 53
Power and water supply 0 0 2 0 0 2 0
Fishing 4 11 21 44 20 36 134
Other sectors 2) (122) (241) 68 10 25 (295) 176
Total customers (114) (112) 134 63 (123) (92) 97
Credit institutions 12 72 0 7 2 84 0
Net losses (102) (40) 134 70 (121) (8) 97
1) Expected loan losses represented 0.27 per cent of the loan portfolio at the end of September 2005 (0.30 per cent at the end of 2004).
2) Including net losses and reversals in Pan Fish and Follalaks. According to NGAAP Pan Fish and Follalaks were classified as repossessed assets.
Following the sale of the shares in Pan Fish and Follalaks, losses of NOK 223 million were reversed in the second quarter and NOK 85 million
in the third quarter of 2005. According to IFRS these items are classified as fixed assets.
Jan. - Sept.
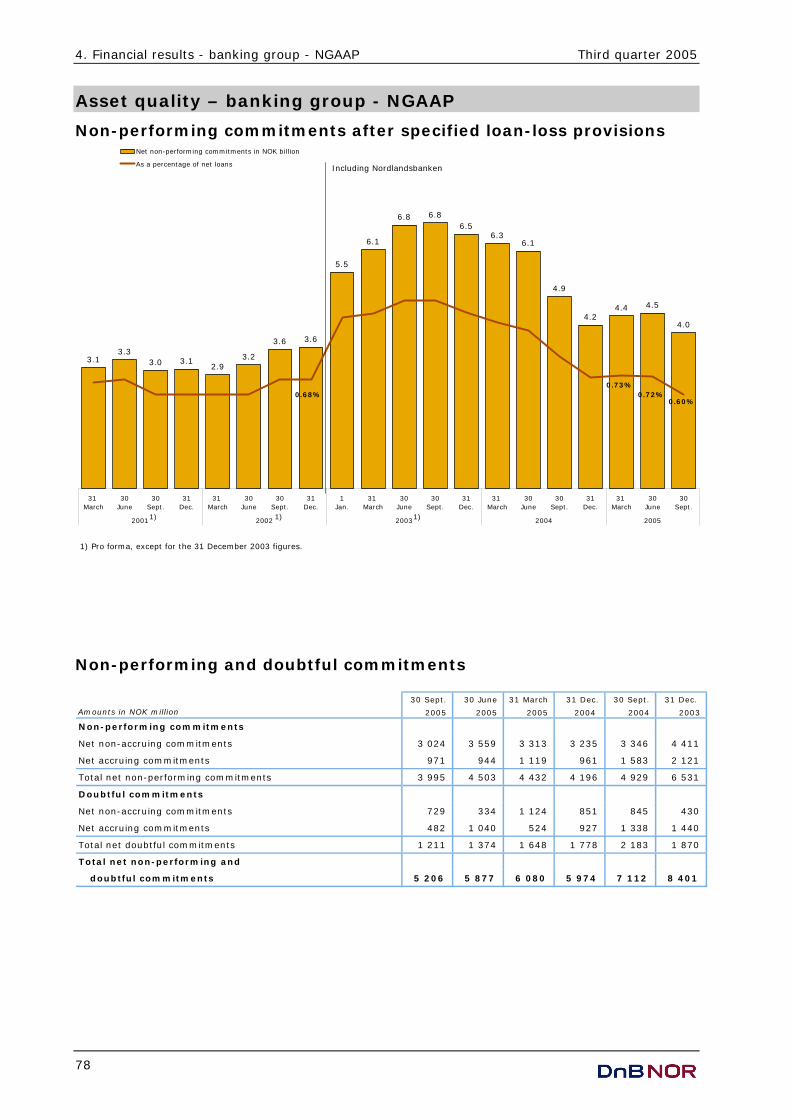
4. Financial results - banking group - NGAAP Third quarter 2005
78
Asset quality – banking group - NGAAP
Non-performing commitments after specified loan-loss provisions
3.13.3
3.0 3.12.9
3.2
3.6 3.6
5.5
6.1
6.8 6.86.5
6.36.1
4.9
4.24.4 4.5
4.0
31 March
30June
30Sept.
31Dec.
31 March
30June
30Sept.
31Dec.
1Jan.
31 March
30June
30Sept.
31Dec.
31 March
30June
30Sept.
31Dec.
31 March
30June
30Sept.
2001 2002 2003 2004 2005
Net non-performing commitments in NOK billion
As a percentage of net loans Including Nordlandsbanken
0.72%
1) Pro forma, except for the 31 December 2003 figures.
1)1)1)
0.73%0.68%
0.60%
Non-performing and doubtful commitments
30 Sept. 30 June 31 March 31 Dec. 30 Sept. 31 Dec.
Amounts in NOK million 2005 2005 2005 2004 2004 2003
Non-performing commitments
Net non-accruing commitments 3 024 3 559 3 313 3 235 3 346 4 411
Net accruing commitments 971 944 1 119 961 1 583 2 121
Total net non-performing commitments 3 995 4 503 4 432 4 196 4 929 6 531
Doubtful commitments
Net non-accruing commitments 729 334 1 124 851 845 430
Net accruing commitments 482 1 040 524 927 1 338 1 440
Total net doubtful commitments 1 211 1 374 1 648 1 778 2 183 1 870
Total net non-performing and
doubtful commitments 5 206 5 877 6 080 5 974 7 112 8 401
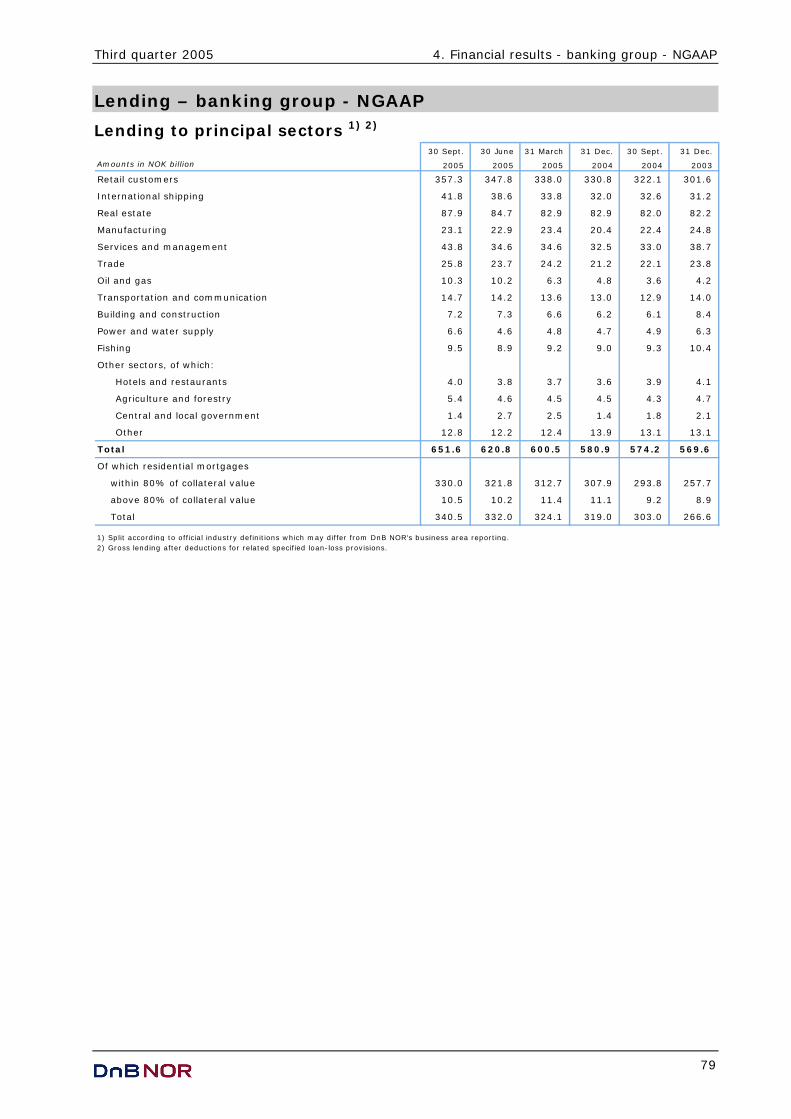
Third quarter 2005 4. Financial results - banking group - NGAAP
79
Lending – banking group - NGAAP
Lending to principal sectors 1) 2) 30 Sept. 30 June 31 March 31 Dec. 30 Sept. 31 Dec.
Amounts in NOK billion 2005 2005 2005 2004 2004 2003
Retail customers 357.3 347.8 338.0 330.8 322.1 301.6
International shipping 41.8 38.6 33.8 32.0 32.6 31.2
Real estate 87.9 84.7 82.9 82.9 82.0 82.2
Manufacturing 23.1 22.9 23.4 20.4 22.4 24.8
Services and management 43.8 34.6 34.6 32.5 33.0 38.7
Trade 25.8 23.7 24.2 21.2 22.1 23.8
Oil and gas 10.3 10.2 6.3 4.8 3.6 4.2
Transportation and communication 14.7 14.2 13.6 13.0 12.9 14.0
Building and construction 7.2 7.3 6.6 6.2 6.1 8.4
Power and water supply 6.6 4.6 4.8 4.7 4.9 6.3
Fishing 9.5 8.9 9.2 9.0 9.3 10.4
Other sectors, of which:
Hotels and restaurants 4.0 3.8 3.7 3.6 3.9 4.1
Agriculture and forestry 5.4 4.6 4.5 4.5 4.3 4.7
Central and local government 1.4 2.7 2.5 1.4 1.8 2.1
Other 12.8 12.2 12.4 13.9 13.1 13.1
Total 651.6 620.8 600.5 580.9 574.2 569.6
Of which residential mortgages
within 80% of collateral value 330.0 321.8 312.7 307.9 293.8 257.7
above 80% of collateral value 10.5 10.2 11.4 11.1 9.2 8.9
Total 340.5 332.0 324.1 319.0 303.0 266.6
1) Split according to official industry definitions which may differ from DnB NOR's business area reporting.2) Gross lending after deductions for related specified loan-loss provisions.

4. Financial results - banking group - NGAAP Third quarter 2005
80
Lending to principal sectors as at 30 September 2005
Other sectors
International shipping
Power and water supply
Trade
Oil and gas
Transportation and communication
Building and construction
Services and management
Manufacturing
Real estate
Retail customers
Fishing
54.8%
6.4%13.5%
3.5%
6.7%
4.0%
1.6%
2.3%
1.1%
3.6%
1.5%
1.0%(4.0%)
(5.7%)(14.3%)
(3.9%)
(5.7%)
(3.8%)
(0.6%)
(2.2%)
(1.1%)
(0.9%)
(1.6%)
(56.1%)
Percentages as at30 Sept. 2004 in parentheses
Retail market lending as at 30 September 2005
Mortgages within 60 per cent of collateral value
Mortgages above 80 per cent of collateral value
Other loans
Mortgages between 60 and 80 per cent of collateral value
80%
8%
3%10%

Third quarter 2005 4. Financial results - banking group - NGAAP
81
Customer savings – banking group - NGAAP
Deposits 30 Sept. 30 June 31 March 31 Dec. 30 Sept. 31 Dec.
Amounts in NOK billion 2005 2005 2005 2004 2004 2003
Retail customers 185 190 176 173 173 167
Corporate customers 224 203 200 187 181 171
Total 1) 409 393 376 360 354 338
1) of which:
NOK 357 351 334 325 320 316
other currencies 52 42 42 35 34 22
Capital adequacy – banking group - NGAAP
Developments in primary capital and capital ratios
Amounts in NOK million 30 Sept. 2005 31 Dec. 2004 30 Sept. 2005 31 Dec. 2004
Share capital 16 964 16 964 16 964 16 964
Other equity 17 830 17 781 20 782 20 774
Total equity 34 795 34 745 37 746 37 738
Perpetual subordinated loan capital securities 1) 2) 5 359 5 270 5 590 5 531
Reductions:
Pension funds above pension commitments (816) (814) (852) (853)
Goodwill (1 367) (1 460) (1 825) (1 967)
Deferred tax assets (705) (717) (651) (646)
Other intangible assets etc. (54) (78) (62) (88)
Core capital 37 212 36 945 39 945 39 715
Perpetual subordinated loan capital 1) 2) 5 548 5 528 5 648 5 367
Term subordinated loan capital 2) 13 549 12 565 14 190 13 538
Net supplementary capital 19 097 18 092 19 838 18 905
Deductions 2 177 2 514 2 177 2 514
Total eligible primary capital 3) 54 131 52 523 57 607 56 105
Total risk-weighted volume 542 306 480 291 591 116 528 240
Core capital ratio (%) 6.9 7.7 6.8 7.5
Capital ratio (%) 10.0 10.9 9.7 10.6
Core capital ratio incl. 50 per cent of profit for the period (%) 7.3 7.2
Capital ratio incl. 50 per cent of profit for the period (%) 10.4 10.2
DnB NOR Bank GroupDnB NOR Bank ASA
1) Perpetual subordinated loan capital securities can represent up to 15 per cent of core capital. The excess will qualify as perpetual supplementary
capital. 2) Calculations of capital adequacy include a total of NOK 578 million in subordinated loan capital in associated companies, in addition to subordinated
loan capital in the banking group's balance sheet. 3) Primary capital and nominal amounts used in calculating risk-weighted volume deviate from figures in the banking group's accounts as a different
consolidation method ("pro rata consolidation") is used in calculating capital adequacy. All figures are presented in accordance with rules prevailing at the time in question.
For information on capital adequacy in the DnB NOR Group, see page 27.

4. Financial results - banking group - NGAAP Third quarter 2005
82
Financial results – banking group - NGAAP
Profit and loss accounts - details
Amounts in NOK million 3Q05 2Q05 1Q05 4Q04 3Q04 2005 2004
Interest income 7 519 7 109 6 948 7 112 7 097 21 576 21 692
Interest expenses 4 142 3 803 3 712 3 775 3 775 11 658 11 653
Net interest income and credit commissions 3 376 3 306 3 236 3 337 3 322 9 918 10 039
Dividends 4 114 30 23 18 148 120
Commissions and fees receivable 1 582 1 546 1 463 1 491 1 416 4 590 4 273
Commissions and fees payable 509 521 510 491 504 1 539 1 519
Net gains on foreign exchange and financial instruments 650 409 514 486 342 1 573 1 190
Sundry ordinary operating income 341 368 327 370 331 1 036 1 171
Gains on the sale of fixed assets 13 36 31 (6) (40) 80 1 305
Net other operating income 2 080 1 952 1 855 1 872 1 563 5 886 6 539
Salaries and other ordinary personnel expenses 1 487 1 407 1 434 1 413 1 428 4 328 4 379
Administrative expenses 866 936 853 925 863 2 654 2 752
Depreciation 186 195 194 208 169 575 631
Sundry ordinary operating expenses 290 293 291 341 286 874 942
Other expenses 9 39 2 135 5 49 818
Total operating expenses 2 836 2 870 2 773 3 022 2 751 8 480 9 522
Pre-tax operating profit before losses 2 620 2 387 2 318 2 187 2 135 7 325 7 056
Net losses on loans, etc. (102) (40) 134 70 (121) (8) 97
Net gains on long-term securities 208 5 (5) 55 24 208 51
Pre-tax operating profit 2 929 2 432 2 178 2 172 2 280 7 540 7 011
Taxes 791 657 588 504 617 2 036 1 893
Profit for the period 2 139 1 775 1 590 1 668 1 663 5 504 5 118
Earnings per share 12.61 10.47 9.37 9.83 9.80 32.45 30.17
Average total assets 796 224 773 396 746 656 742 289 747 255 772 092 738 341
Jan. - Sept.
Balance sheets - details 30 Sept. 30 June 31 March 31 Dec. 30 Sept. 31 Dec.
Amounts in NOK million 2005 2005 2005 2004 2004 2003
Cash and deposits with central banks 24 264 1 593 7 366 8 780 12 802 8 565
Lending to and deposits with credit institutions 43 872 57 643 43 804 21 604 24 052 28 060
Gross lending to customers 654 538 623 856 603 638 584 230 577 929 573 973
– Specified loan-loss provisions (2 912) (3 105) (3 094) (3 255) (3 701) (4 329)
– Unspecified loan-loss provisions (3 534) (3 534) (3 534) (3 534) (3 534) (3 714)
Net lending to customers 648 092 617 217 597 010 577 441 570 694 565 929
Repossessed assets 201 285 412 538 580 576
Commercial paper and bonds 77 252 68 207 68 352 62 986 65 365 59 677
Shareholdings etc. 2 731 2 597 4 873 4 611 4 176 3 905
Investments in associated companies 1 298 1 262 1 264 1 354 1 492 1 384
Intangible assets 2 476 2 463 2 540 2 637 2 993 3 294
Fixed assets 3 869 3 949 4 197 4 155 4 178 4 454
Other assets 21 926 25 069 23 361 22 943 26 012 23 618
Prepayments and accrued income 5 661 5 327 5 109 5 477 5 121 5 484
Total assets 831 642 785 612 758 288 712 526 717 466 704 946
Loans and deposits from credit institutions 93 425 84 107 77 175 48 950 63 511 78 508
Deposits from customers 409 374 392 995 375 533 360 240 354 487 337 807
Securities issued 222 156 207 137 199 575 192 410 192 310 181 949
Other liabilities 28 793 27 053 33 600 41 140 31 234 37 820
Accrued expenses and prepaid revenues 7 415 6 455 5 816 5 013 7 944 5 999
Provisions for commitments 2 378 2 668 2 927 2 994 2 549 2 570
Subordinated loan capital 24 850 24 082 24 308 24 040 23 718 23 709
Share capital 16 964 16 964 16 964 16 964 16 964 16 964
Equity reserves 20 782 20 784 20 799 20 774 19 629 19 620
Profit for the period 5 504 3 366 1 590 0 5 118 0
Total liabilities and equity 831 642 785 612 758 288 712 526 717 466 704 946

Third quarter 2005 4. Financial results - banking group - NGAAP
83
Key figures – banking group - NGAAP
3Q05 2Q05 1Q05 4Q04 3Q04 2005 2004 Interest rate analysis1 Combined average spread for lending and deposits (%) 2.15 2.21 2.26 2.36 2.35 2.21 2.35
2 Spread for ordinary lending to customers (%) 1.44 1.52 1.59 1.64 1.64 1.52 1.64
3 Spread for deposits from customers (%) 0.71 0.69 0.67 0.72 0.71 0.69 0.71
Financial strength
4 Core (Tier 1) capital ratio at end of period (%) 6.8 7.1 7.3 7.5 7.2 6.8 7.2
5 Core (Tier 1) capital ratio incl. 50 per cent of profit for the period (%) 7.2 7.4 7.4 7.5 7.7 7.2 7.7
6 Capital adequacy ratio at end of period (%) 9.7 10.1 10.3 10.6 10.4 9.7 10.4
7 Capital adequacy ratio incl. 50 % of profit for the period (%) 10.2 10.4 10.4 - 10.9 10.2 10.9
8 Core capital at end of period (NOK million) 39 945 39 960 39 915 39 715 38 293 39 945 38 293
9 Total eligible primary capital at end of period (NOK million) 57 607 56 796 56 457 56 105 55 433 57 607 55 433
10 Risk-weighted volume at end of period (NOK million) 591 116 561 352 549 528 528 240 533 292 591 116 533 292
Loan portfolio and loan-loss provisions11 Loan-loss ratio annualised (%) (0.06) (0.03) 0.09 0.05 (0.08) 0.00 0.02
12 Non-performing and doubtful commitments, % of net lending 0.80 0.95 1.02 1.03 1.25 0.80 1.25
13 Loan-loss provisions relative to total gross lending (%) 0.98 1.06 1.11 1.16 1.25 0.98 1.25
14 Non-performing commitments at end of period 3 995 4 503 4 432 4 196 4 929 3 995 4 929
15 Doubtful commitments at end of period 1 211 1 374 1 648 1 778 2 183 1 211 2 183
Liquidity
16 Ratio of customer deposits to net lending at end of period (%) 63.2 63.7 62.9 62.4 62.1 63.2 62.1
Definitions 11 Net losses on loans (excluding guarantees) as a percentage of lending after the deduction of specified loan-loss provisions at end of period.
12 Non-performing and doubtful commitments after the deduction of specified loan-loss provisions relative to lending after the deduction of
specified loan-loss provisions.
13 Accumulated specified and unspecified loan-loss provisions relative to gross lending at end of period.
Jan. - Sept.

4. Financial results - banking group - NGAAP Third quarter 2005
84

85
Section 5
Shareholder information

5. Information on the DnB NOR share Third quarter 2005
86
Equity-related data
Key figures
Jan.-Sept.
2005 1) 2004 2) 2003 2002 3) 2001 3)
Shares outstanding at end of period (1 000) 1 336 875 1 327 139 1 309 027 1 309 007 1 309 968
Average number of shares (1 000) 1 333 701 1 317 744 1 309 027 1 309 552 1 313 965
Earnings per share (NOK) 5.30 6.28 4.11 2.77 4.59
Return on equity (per cent) 17.8 17.7 12.7 8.9 15.5
RARORAC (per cent) 4) 17.3 17.0 n/a n/a n/a
Share price at end of period (NOK) 67.50 59.75 44.40 32.60 40.40
Price/earnings ratio 5) 9.55 9.52 10.81 11.75 8.81
Price/book value 1.67 1.58 1.29 1.00 1.25
Dividend per share (NOK) 2.55 2.20 2.40 2.40
Dividend yield (per cent) 6) 4.27 4.95 7.36 5.94
Equity per share including accrueddividend at end of period (NOK) 40.42 37.79 34.37 32.46 32.27
IFRS NGAAP
5) 5)
1) Including the effect of the 9 736 376 shares issued on 31 March 2005 in connection with the subscription rights programme for employees in the
former DnB Group 2) Including the effect of the 12 929 907 shares issued on 26 March 2004 in connection with the subscription rights for employees in the former DnB
Group and the effect of 5 181 408 shares issued in October 2004 in connection with the subscription rights programme for employees in the former Gjensidige NOR Group.
3) Including the effect of the cancellation of shares at the AGM 2002 (8 067 420 shares) and AGM 2003 (960 000 shares) 4) New principles for measuring risk-adjusted capital implemented in 2005 5) Based on the share price at end of period, and annualised EPS. 6) Dividend per share and dividend yield prior to 2003 are based on DnB Holding ASA's payment of dividend and DnB Holding's share price.
Share price development – 10 October 2004 to 24 October 2005
50
55
60
65
70
75
80
85
okt. 04 nov. 04 des. 04 jan. 05 feb. 05 mar. 05 apr. 05 mai. 05 jun. 05 jul. 05 aug. 05 sep. 05
OSEBX (Rebased)DnB NOR

Third quarter 2005 5. Information on the DnB NOR share
87
Shareholder structure as at 30 September 2005
Major shareholders
Shares in 1 000 Ownership in %
Norwegian government 454 537 34.00
DnB NOR Savings Bank Foundation 145 719 10.90
JPMorgan Chase Bank, Bank Clients NOM 62 103 4.65
State Street Bank, Client Omnibus D NOM 47 977 3.59
Capital Euro Pacific Growth Fund 32 600 2.44
Folketrygdfondet 31 301 2.34
Gjensidige Forsikring 29 472 2.20
JPMorgan Chase Bank Fidelity Lending Account NOM 20 947 1.57
The Northern Trust C Treaty Account NOM 19 415 1.45
Mellon Bank AS Agent NOM 17 831 1.33
Fidelity Funds Europe 17 590 1.32
Orkla ASA (incl. Nordstjernen Holding) 12 649 0.95
The Northern Trust, USL Treaty Account NOM 11 265 0.84
Capital World Growth Fund 10 936 0.82
Deutsche Bank clients account NOM 10 872 0.81
JPMorgan Chase Bank, Omnibus Lending Account NOM 10 592 0.79
Oslo Pensjonsforsikring 10 000 0.75
State Street Bank, Client Omnibus F NOM 8 797 0.66
DnB NOR Employees Fund 8 500 0.64
DnB NOR Norway Fund 7 951 0.59
Total largest shareholders 971 054 72.64
Other 365 821 27.36
Total 1 336 875 100.00
Shareholder structure
UK investors
Other countries
US investors
DnB NOR Savings Bank
FoundationOther Norwegian investors
Norwegian government
34%
10%
11%
17%
12%
15%

5. Information on the DnB NOR share Third quarter 2005
88

89
Section 6
The Norwegian economy
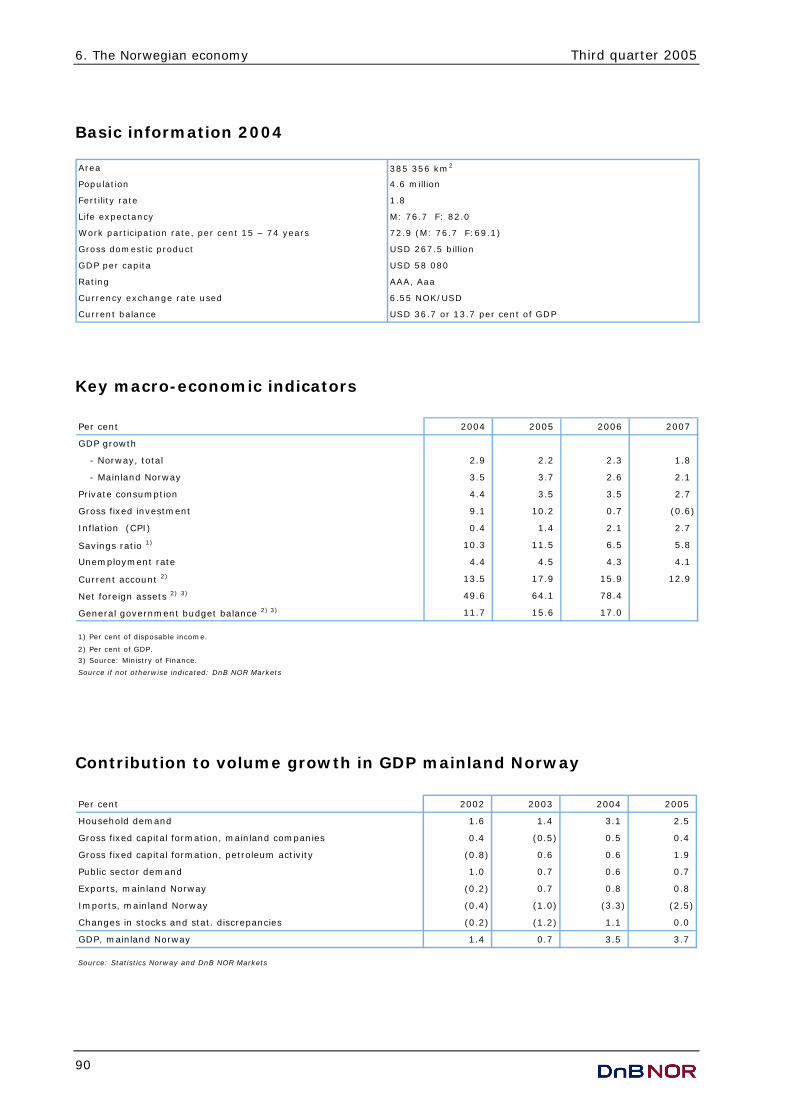
6. The Norwegian economy Third quarter 2005
90
Basic information 2004 Area 385 356 km2
Population 4.6 million
Fertility rate 1.8
Life expectancy M: 76.7 F: 82.0
Work participation rate, per cent 15 – 74 years 72.9 (M: 76.7 F:69.1)
Gross domestic product USD 267.5 billion
GDP per capita USD 58 080
Rating AAA, Aaa
Currency exchange rate used 6.55 NOK/USD
Current balance USD 36.7 or 13.7 per cent of GDP
Key macro-economic indicators
Per cent 2004 2005 2006 2007
GDP growth
- Norway, total 2.9 2.2 2.3 1.8
- Mainland Norway 3.5 3.7 2.6 2.1
Private consumption 4.4 3.5 3.5 2.7
Gross fixed investment 9.1 10.2 0.7 (0.6)
Inflation (CPI) 0.4 1.4 2.1 2.7
Savings ratio 1) 10.3 11.5 6.5 5.8
Unemployment rate 4.4 4.5 4.3 4.1
Current account 2) 13.5 17.9 15.9 12.9
Net foreign assets 2) 3) 49.6 64.1 78.4
General government budget balance 2) 3) 11.7 15.6 17.0
1) Per cent of disposable income.
2) Per cent of GDP.
3) Source: Ministry of Finance.
Source if not otherwise indicated: DnB NOR Markets
Contribution to volume growth in GDP mainland Norway
Per cent 2002 2003 2004 2005
Household demand 1.6 1.4 3.1 2.5
Gross fixed capital formation, mainland companies 0.4 (0.5) 0.5 0.4
Gross fixed capital formation, petroleum activity (0.8) 0.6 0.6 1.9
Public sector demand 1.0 0.7 0.6 0.7
Exports, mainland Norway (0.2) 0.7 0.8 0.8
Imports, mainland Norway (0.4) (1.0) (3.3) (2.5)
Changes in stocks and stat. discrepancies (0.2) (1.2) 1.1 0.0
GDP, mainland Norway 1.4 0.7 3.5 3.7
Source: Statistics Norway and DnB NOR Markets
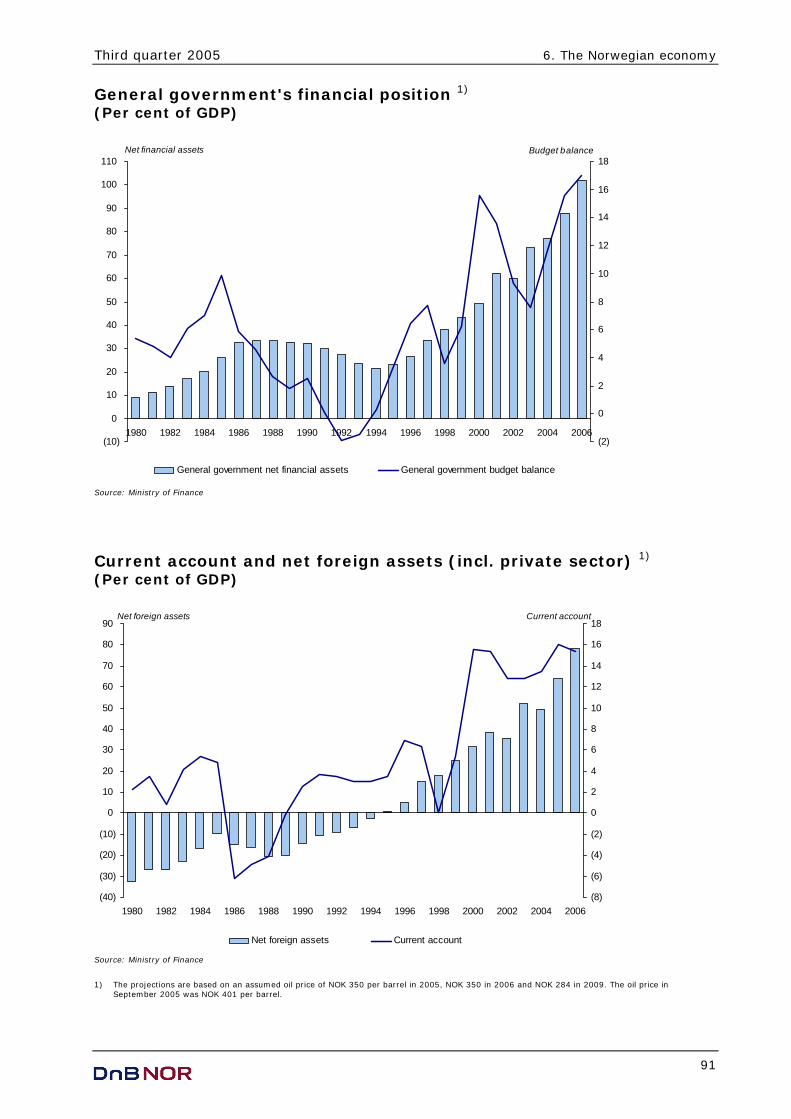
Third quarter 2005 6. The Norwegian economy
91
General government's financial position 1) (Per cent of GDP)
(10)
0
10
20
30
40
50
60
70
80
90
100
110
1980 1982 1984 1986 1988 1990 1992 1994 1996 1998 2000 2002 2004 2006
Net financial assets
(2)
0
2
4
6
8
10
12
14
16
18Budget balance
General government net financial assets General government budget balance
Source: Ministry of Finance
Current account and net foreign assets (incl. private sector) 1) (Per cent of GDP)
(40)
(30)
(20)
(10)
0
10
20
30
40
50
60
70
80
90
1980 1982 1984 1986 1988 1990 1992 1994 1996 1998 2000 2002 2004 2006
Net foreign assets
(8)
(6)
(4)
(2)
0
2
4
6
8
10
12
14
16
18Current account
Net foreign assets Current account
Source: Ministry of Finance 1) The projections are based on an assumed oil price of NOK 350 per barrel in 2005, NOK 350 in 2006 and NOK 284 in 2009. The oil price in September 2005 was NOK 401 per barrel.

6. The Norwegian economy Third quarter 2005
92
Household debt servicing capacity (debt in per cent of disposable income)
100
110
120
130
140
150
160
170
180
190
200
210
1987 1989 1991 1993 1995 1997 1999 2001 2003 2005 2007
Per cent
100
110
120
130
140
150
160
170
180
190
200
210
Source: Norges Bank
---Forecast---
Household interest burden
0
2
4
6
8
10
12
1987 1989 1991 1993 1995 1997 1999 2001 2003 2005 2007
Per cent
0
2
4
6
8
10
12
Source: Norges Bank
Debt interest (aftertax) in per cent ofcash surplus
Average lending rate(after tax)
---Forecast---
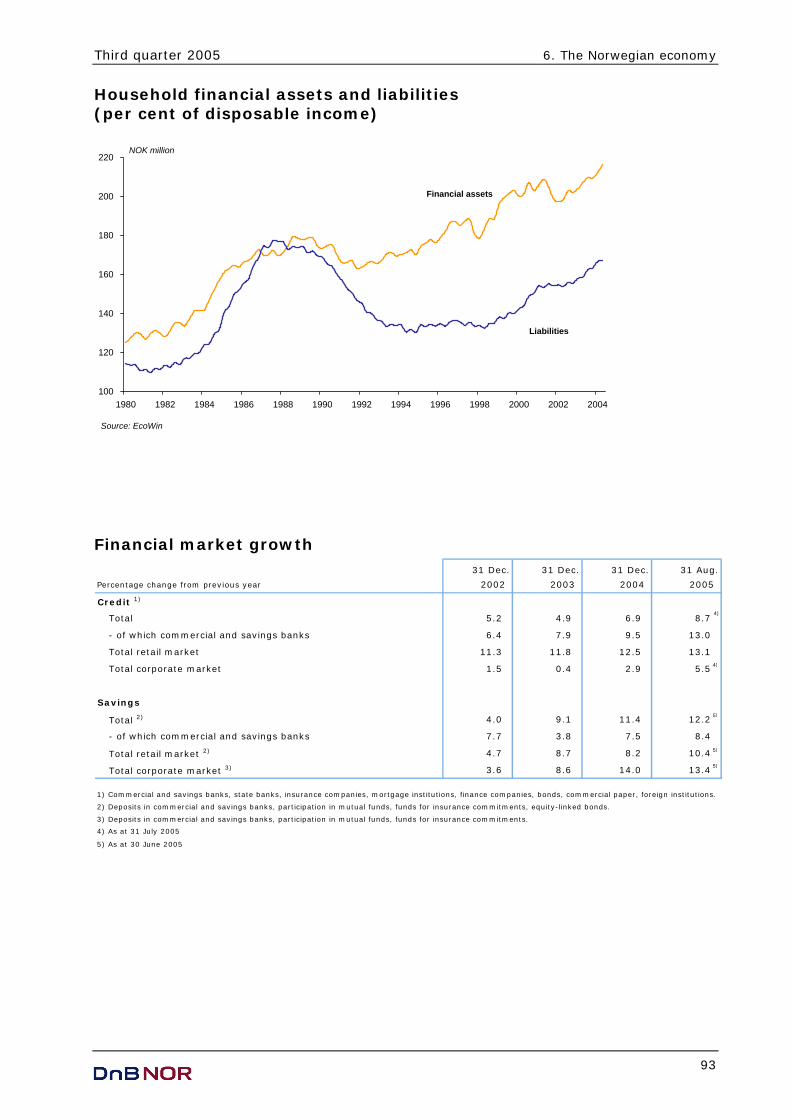
Third quarter 2005 6. The Norwegian economy
93
Household financial assets and liabilities (per cent of disposable income)
100
120
140
160
180
200
220
1980 1982 1984 1986 1988 1990 1992 1994 1996 1998 2000 2002 2004
Source: EcoWin
NOK million
Financial assets
Liabilities
Financial market growth 31 Dec. 31 Dec. 31 Dec. 31 Aug.
Percentage change from previous year 2002 2003 2004 2005
Credit 1)
Total 5.2 4.9 6.9 8.7
- of which commercial and savings banks 6.4 7.9 9.5 13.0
Total retail market 11.3 11.8 12.5 13.1
Total corporate market 1.5 0.4 2.9 5.5
Savings
Total 2) 4.0 9.1 11.4 12.2
- of which commercial and savings banks 7.7 3.8 7.5 8.4
Total retail market 2) 4.7 8.7 8.2 10.4
Total corporate market 3) 3.6 8.6 14.0 13.4
1) Commercial and savings banks, state banks, insurance companies, mortgage institutions, finance companies, bonds, commercial paper, foreign institutions.
2) Deposits in commercial and savings banks, participation in mutual funds, funds for insurance commitments, equity-linked bonds.
3) Deposits in commercial and savings banks, participation in mutual funds, funds for insurance commitments.
4) As at 31 July 2005
5) As at 30 June 2005
4)
4)
5)
5)
5)

6. The Norwegian economy Third quarter 2005
94
House prices and household liabilities
(20)
(10)
0
10
20
30
40
1980 1982 1984 1986 1988 1990 1992 1994 1996 1998 2000 2002 2004
Per cent growth 12 month
Household liabilities
House prices
Corporates: domestic credit and gross capital formation, mainland
(30)
(20)
(10)
0
10
20
30
1989 1991 1993 1995 1997 1999 2001 2003 2005
Per cent growth 12 month
Domestic Credit
Gross capital formation, mainland

Third quarter 2005 6. The Norwegian economy
95
Corporates' interest-bearing debt and interest paid 1)
0
100
200
300
400
500
600
700
800
1987 1989 1991 1993 1995 1997 1999 2001 2003 2005 2007
Per cent
0
10
20
30
40
50
60
70
80Per cent
Source: Norges Bank
---Forecast---
Interest-bearing debt as apercentage of cash surplusminus interest expenses(left-hand-scale) 2)
Debt interest in per centof cash surplus(right-hand scale)
1) For non-financial corporates excluding petroleum and international shipping. 2) Interest-bearing debt is defined as loans from domestic and financial institutions and from the bond and short-term paper markets. Cash surplus is
defined as the sum of value added and wealth income less wages and tax. Interest expenses are deducted from the cash surplus to provide a measure of the sector's ability to make principal payments.
Business surveys, manufacturing sector (general judgement of outlooks for next quarter, trend)
35
40
45
50
55
60
65
70
1983 1985 1987 1989 1991 1993 1995 1997 1999 2001 2003 2005
Source: EcoWin
Per cent