knob power plant, and the coachella canal —before it ... hydrology and water quality water...
TRANSCRIPT

3.1 HYDROLOGY AND WATER QUALITY
WATER CONSERVATION AND TRANSFER PROJECT FINAL EIR/EIS, OCTOBER 2002SFO\SEC_3.1 P1.DOC\022950038 3.1-25
Knob Power Plant, and the Coachella Canal—before it reaches the IID water service areaand branches off to three primary main canals: East Highline, Central Main, and WestsideMain. The East Highline Canal, an unlined 49-mile canal, serves the eastern part and aportion of the central part of the IID water service area. The canal follows the easternboundary of the irrigated portion of the IID water service area and conveys irrigation waterto agricultural fields via a series of east-to-west laterals. The second primary main canal, theCentral Main Canal, connects to the AAC just north of Calexico and serves most of thecentral part of the IID water service area. The Central Main Canal is about 27 miles long andis also unlined. The Westside Main Canal joins the AAC near the western edge of the IIDwater service area and serves the western portion of the IID water service area. It is nearly45 miles long and is unlined, except for 5.5 miles at its northern end. These three primarymain canals serve as the main arteries of an irrigation system consisting of approximately1,667 miles of canals and laterals that distribute irrigation water to individual farm fieldswithin the IID water service area (see Figure 3.1-9).
Flow measurements (collected from 1986 to 1999 at Drop No. 1, just before the AAC entersthe IID water service area) show that Colorado River irrigation deliveries generally rangefrom approximately 2.4 MAFY to more than 3.1 MAFY. The average annual delivery ofirrigation water during the same period is approximately 2.8 MAFY (see Figure 3.1-10). Theremaining balance of diverted water is discharged into the Yuma Main Canal, smaller canalsserving the Yuma Project Reservation Division, Pilot Knob Power Plant and Wasteway, orthe Coachella Canal, or is lost to spillage, evaporation, or seepage along the length of theAAC.
Colorado River diversions account for approximately 90.5 percent of all water flowingthrough the IID water service area. The remaining sources include: flow from the New Riveracross the International Boundary (5.2 percent), rainfall (3.6 percent), net groundwaterdischarge into the irrigation system (less than 1.0 percent), and flow from the Alamo Riveracross the International Boundary (less than 0.1 percent). A summary of the average overallwater input to the IID water service area for the period 1987 to 1998 is presented inFigure 3.1-11.
Water delivered for agricultural use accounts for approximately 85 percent of IID'sdiversion from the Colorado River, as measured at Pilot Knob. Approximately 2 percent ofIID's diversion is delivered to municipal, industrial, and other uses. Approximately3 percent of IID's diversion is lost as seepage from the AAC. The remaining 10 percent is lostto seepage and evaporation within the IID delivery system, or discharged to the drainagesystem as operational discharge.
Delivery of Colorado River water to farms in the IID water service area is driven by userdemand. This demand is not constant throughout the year but varies in response to acombination of influences, such as changes in climate and local rainfall conditions, cropcycles, crop prices and government crop programs. Demand is typically highest in Apriland remains fairly high until August, at which time it starts to decline. This period of time isalso the driest and hottest of the year in the Imperial Valley.


3.1 HYDROLOGY AND WATER QUALITY
WATER CONSERVATION AND TRANSFER PROJECT FINAL EIR/EIS, OCTOBER 2002SFO\SEC_3.1 P1.DOC\022950038 3.1-29
IID Drainage System. IID’s drainage system includes a network of 1,456 miles of open andclosed (pipeline) drains, 750 surface and subsurface drainage pumps, thousands of miles ofsubsurface drains (tile) and associated collection pipelines and water recovery systems.Water entering the drainage system can originate from the following sources (seeFigure 3.1-12):
• Delivery system losses include canal seepage and operational discharge. Operationaldischarge is water that has traveled through portions of the distribution system toensure full farm deliveries and is ultimately discharged to the drains from the surfacecanals and laterals of the system. Canal seepage is water lost to shallow groundwaterand intercepted by the drains;
• On-farm tailwater runoff (i.e., surface water runoff occurring at the end of an irrigatedfield when total water applied exceeds the soil infiltration rate);
• On-farm tilewater (i.e., water passing the crop root zone which normally enters a tiledrain, also referred to as tilewater or leach water);
• Stormwater runoff; and
• Groundwater (i.e., intercepted groundwater that has moved up into the drains from thedeeper aquifer near the east boundary of the irrigated area (Loeltz et al. 1975).
Approximately 15 percent of the water applied to fields runs off as tailwater. Except in fieldswith tailwater recovery systems (TRSs), this water is no longer available for on-farm use andis discharged into either the drainage system or rivers within the IID water service area.Irrigation water that percolates through the soil into the drainage system is collected bysubsurface tile drains and, to a lesser extent, by surface drains. The open drains (mostly thelateral drains) collect tailwater and tilewater from farms as well as operational dischargeand canal seepage water emanating from IID’s delivery system.
Collectively, tilewater and tailwater drainage accounts for roughly 67 percent (34 and33 percent, respectively) of all of the drainage discharged either directly to the Salton Sea orvia the New and Alamo Rivers. The Alamo and New River drainage water and the surfacedrains that discharge directly to the Salton Sea represent significantly different waterregimes and are affected by different segments of the IID water service area. The AlamoRiver receives approximately 61 percent of the discharge from the drainage system, and theNew River receives roughly 29 percent of the drainage. The remaining 10 percent isdischarged to surface drains that flow directly to the Salton Sea (see Figure 3.1-13).
Drainage to the Salton Sea. With the exception of drainage water that is returned to the fieldsas irrigation water or flow lost to shallow and deep groundwater aquifers (throughpercolation that is not captured by the tile drains), essentially all flow collected by thedrainage system is ultimately conveyed to the Salton Sea. Total discharge to the Salton Seafrom the IID water service area averaged approximately 0.98 MAF (1.16 MAF with inflowfrom Mexico) during the period 1986 to 1999. Figure 3.1-14 shows the annual variability ofthe IID water service area’s total surface discharge to the Salton Sea during the same timeperiod.

Tilewater
E082002013CVO (10/11/02)
Figure 3.1-12Water SchematicIID Water Conservation and Transfer Project Final EIR/EIS


3.1 HYDROLOGY AND WATER QUALITY
WATER CONSERVATION AND TRANSFER PROJECT FINAL EIR/EIS, OCTOBER 2002SFO\SEC_3.1 P1.DOC\022950038 3.1-33
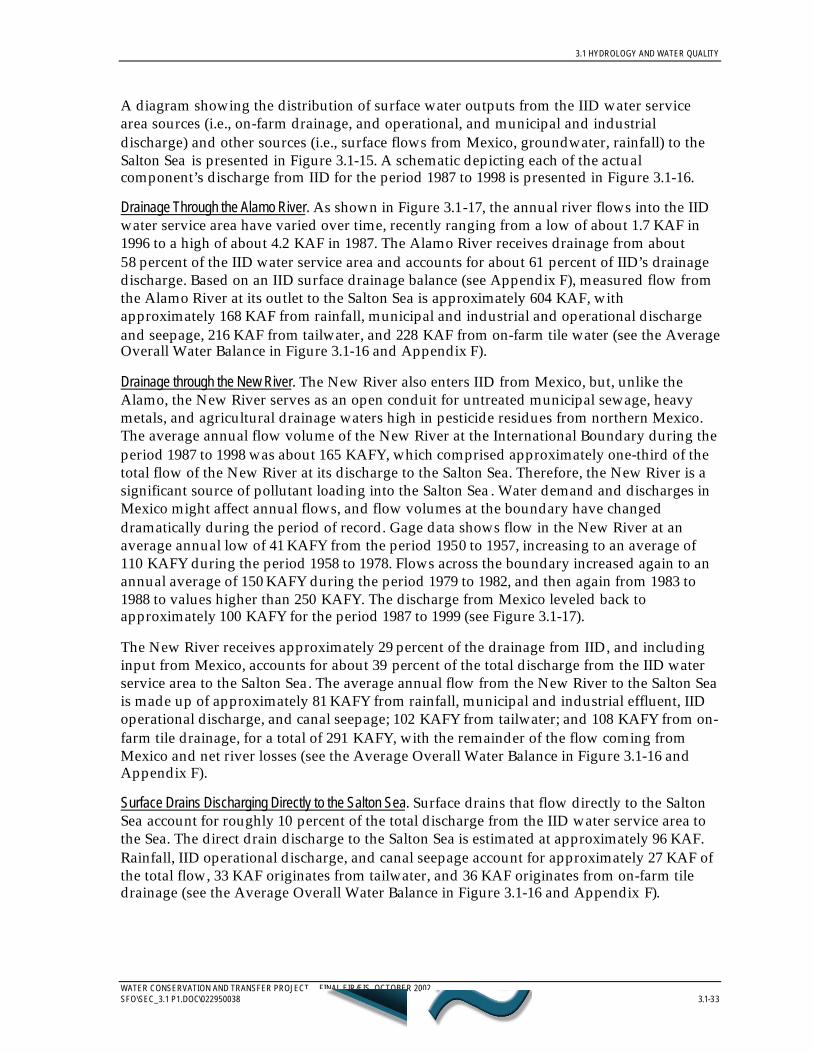
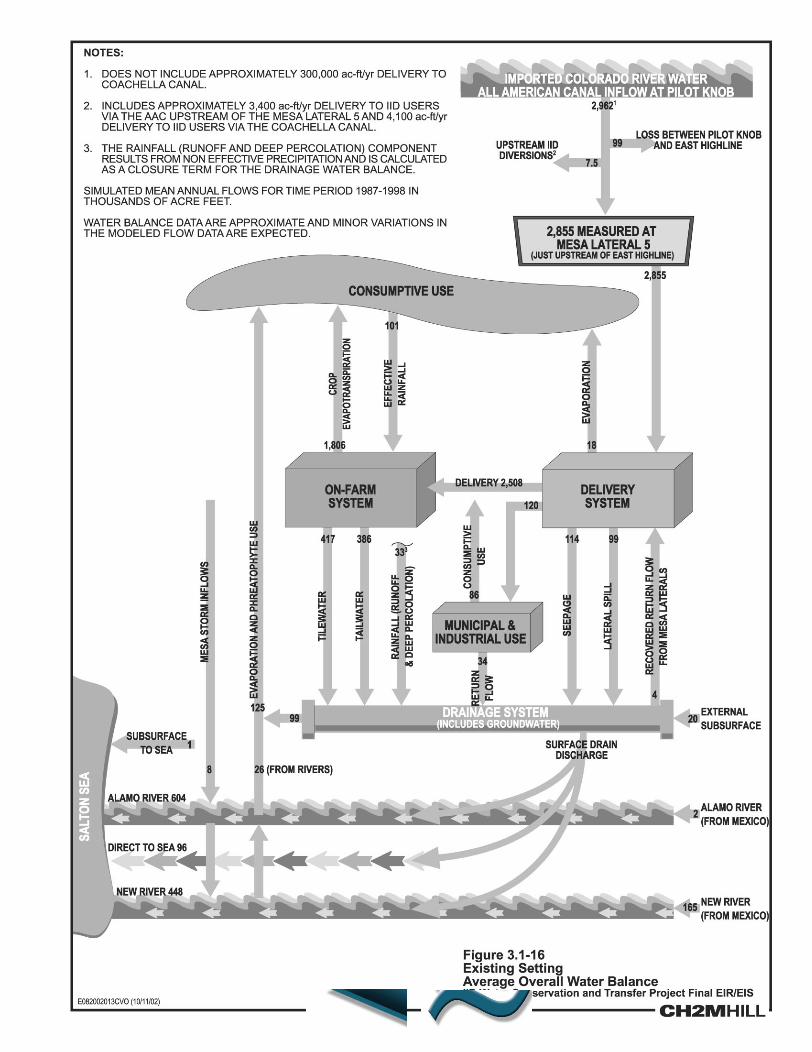
A diagram showing the distribution of surface water outputs from the IID water servicearea sources (i.e., on-farm drainage, and operational, and municipal and industrialdischarge) and other sources (i.e., surface flows from Mexico, groundwater, rainfall) to theSalton Sea is presented in Figure 3.1-15. A schematic depicting each of the actualcomponent’s discharge from IID for the period 1987 to 1998 is presented in Figure 3.1-16.
Drainage Through the Alamo River. As shown in Figure 3.1-17, the annual river flows into the IIDwater service area have varied over time, recently ranging from a low of about 1.7 KAF in1996 to a high of about 4.2 KAF in 1987. The Alamo River receives drainage from about58 percent of the IID water service area and accounts for about 61 percent of IID’s drainagedischarge. Based on an IID surface drainage balance (see Appendix F), measured flow fromthe Alamo River at its outlet to the Salton Sea is approximately 604 KAF, withapproximately 168 KAF from rainfall, municipal and industrial and operational dischargeand seepage, 216 KAF from tailwater, and 228 KAF from on-farm tile water (see the AverageOverall Water Balance in Figure 3.1-16 and Appendix F).
Drainage through the New River. The New River also enters IID from Mexico, but, unlike theAlamo, the New River serves as an open conduit for untreated municipal sewage, heavymetals, and agricultural drainage waters high in pesticide residues from northern Mexico.The average annual flow volume of the New River at the International Boundary during theperiod 1987 to 1998 was about 165 KAFY, which comprised approximately one-third of thetotal flow of the New River at its discharge to the Salton Sea. Therefore, the New River is asignificant source of pollutant loading into the Salton Sea . Water demand and discharges inMexico might affect annual flows, and flow volumes at the boundary have changeddramatically during the period of record. Gage data shows flow in the New River at anaverage annual low of 41 KAFY from the period 1950 to 1957, increasing to an average of110 KAFY during the period 1958 to 1978. Flows across the boundary increased again to anannual average of 150 KAFY during the period 1979 to 1982, and then again from 1983 to1988 to values higher than 250 KAFY. The discharge from Mexico leveled back toapproximately 100 KAFY for the period 1987 to 1999 (see Figure 3.1-17).
The New River receives approximately 29 percent of the drainage from IID, and includinginput from Mexico, accounts for about 39 percent of the total discharge from the IID waterservice area to the Salton Sea. The average annual flow from the New River to the Salton Seais made up of approximately 81 KAFY from rainfall, municipal and industrial effluent, IIDoperational discharge, and canal seepage; 102 KAFY from tailwater; and 108 KAFY from on-farm tile drainage, for a total of 291 KAFY, with the remainder of the flow coming fromMexico and net river losses (see the Average Overall Water Balance in Figure 3.1-16 andAppendix F).
Surface Drains Discharging Directly to the Salton Sea. Surface drains that flow directly to the SaltonSea account for roughly 10 percent of the total discharge from the IID water service area tothe Sea. The direct drain discharge to the Salton Sea is estimated at approximately 96 KAF.Rainfall, IID operational discharge, and canal seepage account for approximately 27 KAF ofthe total flow, 33 KAF originates from tailwater, and 36 KAF originates from on-farm tiledrainage (see the Average Overall Water Balance in Figure 3.1-16 and Appendix F).


3.1 HYDROLOGY AND WATER QUALITY
WATER CONSERVATION AND TRANSFER PROJECT FINAL EIR/EIS, OCTOBER 2002SFO\SEC_3.1 P1.DOC\022950038 3.1-37
Drainage Water Quality. The following provides an evaluation of the influence of agriculturaloperations within the IID water service area on New and Alamo River water quality anddescribes the quality of drainage discharged directly from the IID water service area to theSalton Sea . The COCs in the New and Alamo Rivers at the International Boundary arecompared with those at the outlets to Salton Sea , and with those in drainage waterdischarged to the New and Alamo Rivers and the Salton Sea . Other than changes resultingfrom evaporation, the difference between the constituent concentrations in the New andAlamo Rivers at the International Boundary and at the outlets to the Salton Sea can belargely attributed to drainage water discharges from fields within the IID water service area.
COC concentration values for the collective drains that discharge directly to the Salton Seacould not be determined because of the lack of reliable flow data for these drains. As aresult, this information is not provided in this EIR/EIS.
Constituents of Concern. Various studies in the IID water service area have identified a numberof COCs in IID drainage water. The rationale for identifying these constituents is presentedin Section 3.1.4.2, Significance Criteria. The COCs identified in irrigation and drainage waterinclude the following:
• Salinity (also referred to as TDS)• Selenium• Total suspended solids (also referred to as TSS)• Nitrogen and phosphorus• Organochlorine insecticides (DDT and its metabolites DDE and DDD, and toxaphene)• Organophosphorus insecticides (diazinon and chlorpyrifos (Lorsban, Dursban))• Organochlorine herbicides (Dacthal)• Boron
A brief discussion of the COCs is provided below. For information on the effects that theseconstituents might have on biological resources, see Section 3.2, Biological Resources.
Salinity: Salinity (also referred to as TDS —these terms are interchangeable throughout thisdocument) is one of the most prevalent COCs in the IID water service area. Chlorides andother dissolved solids all contribute to soil and water salinity. At high concentrations, soilsalinity can be detrimental to seed germination and crop yields. Salt compounds includeelements, such as selenium, that can also be toxic to humans, fish, and wildlife if theelements are biologically available in high enough concentrations.
The primary source of salts in the IID water service area soils is imported Colorado Riverwater. These salts are applied to fields with irrigation water and are carried off by tailwateror tilewater drainage into surface drains. Evapotranspiration removes only water; thereforesalts are concentrated in or below the root zone. Additional irrigation water is used to leachthe salts out of the root zone and into the tile drainage system. As noted previously, the IIDdrainage system discharges to the Salton Sea either directly or via the New and AlamoRivers. Thus, the Salton Sea ultimately serves as a sink for salts.
Selenium: Selenium is the constituent of greatest concern for toxic risk in the IID waterservice area and Salton Sea system (Setmire and Schroeder 1998). Selenium, in traceconcentrations, is an essential element for both plants and animals but can be toxic at higher
3.1 HYDROLOGY AND WATER QUALITY
WATER CONSERVATION AND TRANSFER PROJECT FINAL EIR/EIS, OCTOBER 20023.1-38 SFO\SEC_3.1 P1.DOC\022950038
concentrations (Rosenfeld and Beath 1946). Selenium enters IID’s soils, groundwater, andsurface waters through imported Colorado River irrigation water. As described in thesalinity discussion above, selenium is also concentrated in irrigated lands throughevapotranspiration and flushed into water sources through irrigation practices.
Sediment: Surface runoff carries suspended sediment (also referred to as TSS when measuredin solution) to agricultural drains and to the New and Alamo Rivers. These sediments mightbe deposited in slow-moving portions of drains, such as the mouths and vegetated areas ofthe drains, and/or transported into rivers where deposition can occur in vegetated areas,slow-moving backwaters, and at the New and Alamo River deltas at the Salton Sea .Sediment can carry DDT, its metabolites, and other insoluble pesticides, includingtoxaphene.
Nitrogen and Phosphorus: The IID water service area has a long history of agricultural use offertilizers. Therefore, high concentrations of nitrogen and phosphorous are present in soilsand drainage waters as these elements are primary components of fertilizers.
Organochlorine Insecticides: Organochlorine insecticides have been measured in drainagewater, and in some sediments. Although banned in 1972, DDT and its metabolites are stillpresent in the environment. In addition, organochlorine insecticides can be mobilized fromsoils and carried into the drainage system by irrigation water.
Organophosphorus Insecticides: Like the organochlorine insecticide DDT, theorganophosphorus insecticides diazinon and chlorpyrifos were first introduced into the IIDwater service area as agricultural insecticides. The main concern about these chemicalsrelates to their toxicity to aquatic organisms. Because of their molecular weight and density,organophosphate compounds, such as chlorpyrifos, typically settle in sediments and persistin soil. Even though they are less persistent than organochlorines, organophosphates canalso be transported into surface waters through irrigation and drainage practices.
Organochlorine Herbicides: As in the case of insecticides, irrigation systems mobilizeorganochlorine herbicides, depositing them in surface drainage systems throughout the IIDwater service area. It is likely that organochlorine herbicides have been introduced into theSalton Sea via runoff and irrigation drains.
Boron: Boron exists in several forms in soil in the IID water service area and appears to beleaching from its irrigated soils. Though beneficial in small quantities, elevatedconcentrations of boron can lead to adverse effects in organisms. In aquatic environments,sediments often absorb boron.
Laboratory analysis of water discharging to the IID drainage system indicates the following:
• Operational discharges are considered to have the best water quality because they arenot applied to the land. Operational discharges have a water quality similar to thatentering the IID water service area directly from the LCR.
• Tailwater is considered to have the next best water quality, relative to operationaldischarge. However, tailwater accumulates sediment and solutes (including potentiallysignificant concentrations of agricultural fertilizers and pesticides) from the soil as itflows across cultivated fields.

3.1 HYDROLOGY AND WATER QUALITY
WATER CONSERVATION AND TRANSFER PROJECT FINAL EIR/EIS, OCTOBER 2002SFO\SEC_3.1 P1.DOC\022950038 3.1-39
• Tilewater is generally considered to have the poorest water quality because dissolvedsalts and other constituents tend to concentrate in the water as it percolates through theroot zone and is collected in subsurface drainage.
Data Collection Parameters. The data presented below provide an average concentration of theCOCs in IID drains and rivers under existing conditions.
Historical Water Quality Data: Historical water quality data include data collected duringnumerous monitoring events from sites located throughout the IID water service area. Thisdatabase was compiled for modeling purposes and was obtained from various sources,including EPA’s Storage and Retrieval Environmental Data System, USGS’ Water QualityNetwork, RWQCB, and published papers and documents. These sources contained waterquality data collected within the IID water service area over many years. However, for thisEIR/EIS, the data were limited to those collected for the period between 1970 to 1999.
Although the water quality data set contained many samples, the data tended to becollected sporadically over time and favored readily accessible sites. For example, eventhough the time period for sample collection ranged from 1970 to 1999, samples were notcollected on a regular (e.g., monthly, annual, etc.) basis or at a uniform group of sites.Furthermore, the numbers of analyses of any one COC ranged from very few to severalhundred. Because of the lack of good temporal coverage, the data were grouped by monththroughout the entire study period. The data were then grouped spatially and assigned todistinct geographic locations to quantify flow and COC concentrations from each of thevarious sources that flow into and discharge out of the IID water service area. As a result,the data are reported as mean concentrations of COCs, which represent cumulative flows atthe following geographic locations:
• IID irrigation delivery water
− AAC
• Alamo River drainage basin
− Alamo River at the International Boundary− IID surface drain discharge to the Alamo River (South Central and Holtville drains)− Alamo River at the outlet to the Salton Sea
• New River drainage basin
− New River at the International Boundary (Greeson and Trifolium 12 drains)− IID surface drain discharge to the New River− New River at the outlet to the Salton Sea
A summary of the historical water quality data associated with each of the individual drainsand the cumulative drainage is provided below. Following these summaries, a list of themean flows and COC concentrations according to particular drains and geographic sourcesis presented in Table 3.1-4. The table also shows state and federal water quality criteria.