know your chances 16-9
TRANSCRIPT

8/13/21
1
Know Your ChancesMAKING PRECISE CLINICAL DECISIONS
IN MEDICAL EYE CARE
Jordan Keith, OD, FAAOMinneapolis, MN
1
Maple Grove Fridley Maplewood
Katelyn McDevitt, OD
Jordan Keith, ODAshley Herde, OD
Tina McCarty, ODAlicia Alvarado, OD Mitch Albers, OD
Brad Richter, ODBreanna Ruesch, OD
2
ObjectivesDefine a structured question
Find the best evidence and apply it clinically
See through hype in medical news and advertisements
4
Last Week Tonight – John Oliver 2016
5
Eye Doctor Roles
VisionPainRehabilitationIatrogenicSystemicEmotional/Psych
6
“Science is a way to keep us from fooling ourselves”-Richard Feynman, PhD
“The most dangerous words in medicine are ‘In my experience’”
-Mark Crislip, MD
7

8/13/21
2
“One has only to review the graveyard of discarded therapies to discover how many patients might have benefited from being assigned to a control group.”-Thomas Chalmers, MD
10
Steps of EBM1. Formulate an answerable question2. Find the best evidence3. Critically appraise the evidence4. Apply the evidence
11
Macula
Vitreous Attachments
#1
#5
#2
#3#4Vessels
Strong à Weak
1) Ora2) Posterior lens3) ONH4) Macula5) Retinal Vessels
12Macula
Posterior Vitreous Detachment
#1
#5
#2
#3#4Vessels
13
“I see new flashes and floaters”
How often should I expect a RRD?
Which patients without RRD need further monitoring?
I found a RRD without symptoms. Now what?
14
“I see new flashes and floaters”
Meta-analysis of
1568 patients
Acute, symptomatic
PVD
At initial presentation
20% retinal break
80% PVD
Coffee RE, et al. Am J Ophthalmol 2007;144(3):409-414
15

8/13/21
3
Follow-up?
1.8% delayed retinal breaks
New symptoms
Hemorrhage in peripheral
retinaHemorrhage in vitreous
Coffee RE, et al. Am J Ophthalmol 2007;144(3):409-414
16
Clinical Findings Increasing Risk of Retinal Break
1) Shafer’s Sign2) V-heme3) Retinal heme4) Visible vitreoretinal
traction5) New Symptoms
17
Acute symptomatic PVD
Retinal break
Refer for treatment
No retinal break, risk factors
- Pigmented vitreous cells
- Retinal hemorrhage
- Vitreous hemorrhage
- New/many symptoms- Lattice degeneration
- High myopia
F/U 2-6 weeks
No retinal break, no risk factors
Patient eduNo F/U
18
Asymptomatic Retinal BreaksProgression to clinical retinal detachment
Observed 1-18 (average 7.5) years without treatment
231 phakicnon-fellow eyes
149 (64.5%) eyes had lattice degeneration
359 retinal breaks
276 atrophic holes
None
50 traction tears attached flap
None
33 traction tears free opercula
None
Byer NE. Ophthalmology 1982; 89(9): 1033-39
19
Type of Lesion TreatmentAcute symptomatic horseshoe tears Treat promptly
Acute symptomatic dialyses Treat promptly
Traumatic retinal breaks Usually treated
Acute symptomatic operculated holes Treatment may not be necessary
Asymptomatic horseshoe tears (without subclinical RD)
Often can be followed without treatment
Asymptomatic operculated tears Treatment is rarely recommended
Asymptomatic atrophic round holes Treatment is rarely recommended
Asymptomatic lattice degeneration with holes Usually does not require treatment
Asymptomatic lattice degeneration without holes
Not treated unless PVD causes a horseshoe tear
PVD, Retinal Breaks, Lattice Degen PPP. American Academy of Ophthalmology 2014
Surgical Management
20
1. Good Questions Lead to Good AnswersWhat is my diagnosis?What are the threats to vision?Are there treatments for this supported by evidence?If so, when do we treat?What do I do with the patient in my chair now?
21

8/13/21
4
2. Find the Best Evidence• Randomized clinical trials (RCT)
with low study errorsLevel 1
• RCT with high study errorsLevel 2
• Nonrandomized clinical trials
Level 3
• Intervention Case Series
Level 4
• Intervention Case Report
Level 5
22
3. Critical AppraisalWho (where) did the study?The goal of the study?
Outcomes used?
How was the study carried out?Blind? Double blind? Randomized?Sample size (N) adequate?
What did they find out?How does this affect us clinically?
Are the benefits greater than the risk?
23
Last Week Tonight – John Oliver 2016
24
Discrepancy between Results and Abstract Conclusionsin Industry- vs Nonindustry-funded Studies Comparing
Topical Prostaglandins
TARIQ ALASBALI, MICHAEL SMITH, NOA GEFFEN, GRAHAM E. TROPE, JOHN G. FLANAGAN,YAPING JIN, AND YVONNE M. BUYS
● PURPOSE: To investigate the relationship betweenindustry- vs nonindustry-funded publications compar-ing the efficacy of topical prostaglandin analogs byevaluating the correspondence between the statisticalsignificance of the publication’s main outcome measureand its abstract conclusions.● DESIGN: Retrospective, observational cohort study.● METHODS: English publications comparing the ocularhypotensive efficacy between any or all of latanoprost,travoprost, and bimatoprost were searched from theMEDLINE database. Each article was reviewed by threeindependent observers and was evaluated for source offunding, study quality, statistically significant main out-come measure, correspondence between results of mainoutcome measure and abstract conclusion, number ofintraocular pressure outcomes compared, and journalimpact factor. Funding was determined by publisheddisclosure or, in cases of no documented disclosure, thecorresponding author was contacted directly to confirmindustry funding. Discrepancies were resolved by con-sensus. The main outcome measure was correspondencebetween abstract conclusion and reported statistical sig-nificance of the publications’ main outcome measure.● RESULTS: Thirty-nine publications were included, ofwhich 29 were industry funded and 10 were nonindustryfunded. The published abstract conclusion was not con-sistent with the results of the main outcome measure in18 (62%) of 29 of the industry-funded studies comparedwith zero (0%) of 10 of the nonindustry-funded studies(P ! .0006). Twenty-six (90%) of the industry-fundedstudies had proindustry abstract conclusions.● CONCLUSIONS: Twenty-four percent of the industry-funded publications had a statistically significant mainoutcome measure; however, 90% of the industry-funded
studies had proindustry abstract conclusions. Both read-ers and reviewers should scrutinize publications carefullyto ensure that data support the authors’ conclusions.(Am J Ophthalmol 2009;147:33–38. © 2009 byElsevier Inc. All rights reserved.)
F INANCIAL RELATIONSHIPS BETWEEN PHARMACEUTI-cal companies and researchers and funding of med-ical research by drug companies has increased
dramatically during the last two decades.1–4 This can resultin industry bias where the source of funding of clinicaltrials either affects the results in a systematic way or leadsto selective presentation of the results. Industry fundingoften has been associated with proindustry results2,5–20 andpublication bias,21–23 which can affect the interpretationand presentation of outcomes resulting in conclusions thatoverstate results without statistical support. The purposeof this study was to investigate the relationship betweenindustry- vs nonindustry-funded publications comparingocular hypotensive efficacy of the topical prostaglandinanalogs (PGA) latanoprost 0.005%, travoprost 0.004%,and bimatoprost 0.03% by evaluating the correspondencebetween the statistical significance of the publication’s mainoutcome measure and its published abstract conclusions.
METHODS
A MEDLINE SEARCH FROM 1966 TO THE SECOND WEEK OFNovember 2007 using any combination of the keywordslatanoprost, travoprost, and bimatoprost was conducted. Thetitle and abstracts from the initial search were reviewedand those included were English language publicationscomparing the intraocular pressure (IOP)-lowering efficacyof any combination of latanoprost; travoprost; or bimato-prost. The complete articles were obtained and the refer-ences also were searched to identify relevant publicationsmissed during the initial search.
Each publication was reviewed by three independentobservers using a standardized data collection sheet eval-uating: source of funding, industry author, study quality,main outcome measure, statistical significance (P ! .05) ofmain outcome measure, abstract conclusion, correspon-dence between statistical significance (P ! .05) of main
See accompanying Editorial on page 1.Accepted for publication Jul 1, 2008.
From the Department of Ophthalmology and Vision Sciences, Uni-versity of Toronto, Toronto Western Hospital, Toronto, Ontario, Canada(T.A., M.S., N.G., G.E.T., J.G.F., Y.M.B.); the Department of Ophthal-mology, King Faisal University, King Fahad Hospital of the University,Riyad, Saudi Arabia (T.A.); the School of Optometry, University ofWaterloo, Waterloo, Ontario, Canada (J.G.F.); and the Departmentof Public Health Sciences, University of Toronto, Toronto, Ontario,Canada (Y.J.).
Inquiries to Yvonne M. Buys, Toronto Western Hospital, 399 BathurstStreet, EW6-405, Toronto, Ontario, Canada M5T 2S8; e-mail: [email protected]
© 2009 BY ELSEVIER INC. ALL RIGHTS RESERVED.0002-9394/09/$36.00 33doi:10.1016/j.ajo.2008.07.005
“The published abstract conclusion was not consistent with the results of the main outcome measure in 62% of
the industry-funded studies compared with 0% of the nonindustry funded studies.”
“Twenty-four percent of the industry-funded publications had a statistically significant main outcome measure; however, 90% of the industry-funded studies
had proindustry abstract conclusions.”
Alasbali T et al. Am J Ophthalmol 2009; 147(1): 33-38
25
4. Apply the Evidence: Which is Best?• Reduced the rate of blindness by 34%Treatment A
• Produced an absolute reduction in blindness of 0.06%Treatment B
• Increased patients’ success rate from 99.82% to 99.88%Treatment C
• 1592 patients needed to be treated to prevent 1 case of blindnessTreatment D
26
MA’sDot/Blot Heme
Flame hemeHard Exudates
CWS’s
Venous beading
IRMA
CSME
NVE
NVD
V-heme
Pre-retinal heme
TRD
27

8/13/21
5
Bruch'sRPE
Retina
Choroid
CRANeovascularization
VEGF
Preretinal space
Vitreous
Preretinal Heme
VitreousHeme
(ischemia)TRD
28
Threats to
vision?
What is my dx?
DiabeticRetinopathy
NPDR
Macular Disease
Ischemia
EdemaPDR
PDR
Macular Disease
Ischemia
EdemaPre-retinal/
V-heme
TRD
NVG
29
Courtesy Erica Ittner, OD
Proliferative Diabetic Retinopathy (PDR)
31
Proliferative Disease: Vitreous Hemorrhage
33
Clinically Significant Macular Edema
CSME Retinal thickening within 500 microns of fovea
Exudate within 500 microns of fovea with adjacent thickening
Thickening of at least one disc area any part within one disc diameter of center of fovea
ETDRS. Ophthalmology. 1985; 103:1796-1806 ETDRS. Ophthalmology. 1987; 94: 761-774
37
Clinically Significant Macular Edema
CSME Retinal thickening within 500 microns of fovea
Exudate within 500 microns of fovea with adjacent thickening
Thickening of at least one disc area any part within one disc diameter of center of fovea
ETDRS. Ophthalmology. 1985; 103:1796-1806 ETDRS. Ophthalmology. 1987; 94: 761-774
38

8/13/21
6
“In patients with CSME, focal laser reduced the risk of moderate vision loss by 50%...”
ETDRS. Ophthalmology. 1985; 103:1796-1806 ETDRS. Ophthalmology. 1987; 94: 761-774
39
Threats to
vision?
What is my dx?
DiabeticRetinopathy
NPDR
Macular Disease
Ischemia
EdemaPDR
PDR
Macular Disease
Ischemia
EdemaPre-retinal/
V-heme
TRD
NVG
40
4-2-1 Rule: Raising the (Risk) Bar
Severe retinal hemorrhages in 4 quadrants
Venous beading in 2 quadrants
IRMA in 1 quadrant
4
1
2
41
NPDR à PDR in 1 Year
• 5% risk of progression to PDRMild
• 15% risk of progression to PDRModerate
• 52% risk of progression to PDR
• Meets ONE criteria of 4-2-1 RuleSevere
• 75% risk of progression to PDR
• Meets TWO criteria of 4-2-1 ruleVery Severe
Klein R, et al. Arch Ophthalmol. 1984;102(4):527-532
4-2-1Rule
42
Follow-up intervals in monthsSeverity of NPDR American Academy
of OphthalmologyAmerican
Optometric Association
None 12 12
Mild 6-12 12
Moderate 6-12 12
Severe 2-4 3-4
Very Severe 2-4 2-3
AAO. Preferred Practice Pattern. Diabetic Retinopathy. 2013AOA. Evidence-Based Clinical Practice Guidelines. Eye Care of the Patient with Diabetes Mellitus.
2014
4-2-1Rule
43
8-year Incidence of CHD and Stroke as a Hazard Ratio (HR) in Japanese Type 2 Diabetics (N=2033)
Retinal Finding Coronary Heart Disease Stroke
Mild-Mod NPDR 1.69 (95% CI 1.17-2.97) 2.69 (95% CI 1.03-4.86)
Retinal hemes/MA 1.63 (95% CI 1.04-2.56) Not associated (P=0.06)
CWS Not associated (P=0.66) 2.39 (95% CI 1.35-4.24)
Kawasaki R, et al. Ophthalmology 2013;120(3)574-582
Communicate Diabetic Eye Exam Results to PCP!
44

8/13/21
7
Threats to
vision?
What is my dx?
DiabeticRetinopathy
NPDR
Macular Disease
Ischemia
EdemaPDR
PDR
Macular Disease
Ischemia
EdemaPre-retinal/
V-heme
TRD
NVG
4-2-1 Rule
45
High-Risk CharacteristicsNVD ≥ ¼ disc areaAny NVD or NVE with pre-retinal or vitreous hemorrhage
DRS. Am J Ophthalmol .1976; 81:383-369 DRS. Ophthalmology. 1988; 88: 583-600
46
Proliferative Diabetic Retinopathy (PDR)
47
Proliferative Diabetic Retinopathy (PDR)
NVD = on or within 1DD of ONH
48
Proliferative Diabetic Retinopathy (PDR)
49
“In patients with HRC, PRP reduces the risk of profound vision loss by 50%...”
DRS. Am J Ophthalmol .1976; 81:383-369 DRS. Ophthalmology. 1988; 88: 583-600
50

8/13/21
8
What Are the Chances?
90%25%10% 5%2/million 1/million
50%50%
ARR NNT45%12.5%
0.0001%5%
1,000,0002082
“In patients with CSME, focal laser reduced the risk of moderate vision loss by 50%...”
“In patients with HRC, PRP reduces the risk of profound vision loss by 50%...”
RRR
50%50%
45%TxNo Tx
12.5%
51
• Reduced the rate of blindness by 34%Treatment A
• Produced an absolute reduction in blindness of 0.06%Treatment B
• Increased patients’ success rate from 99.82% to 99.88%Treatment C
• 1592 patients needed to be treated to prevent 1 case of blindnessTreatment D
Which Treatment is Best?
RRR
ARR
No Tx vs. Tx
NNT
52
Treatment StudiesRelative Risk Reduction (RRR) nEfficacy of treatments commonly reported this way in headlines/media/by
pharmaceutical companiesnUse caution when reading this stat: can be misleading and commonly
overstates the benefit
Absolute Risk Reduction (ARR)nMuch more meaningful clinicallynTells us what % of patients benefited from the treatment
Number Needed to Treat (NNT)
53
Treatments for DMELaser
ETDRS
Steroids
DRCR.net
Anti-VEGF
RESTORE
RISE and RIDE
DA VINCI
VIVID/VISTA
54
Few (<3%) had improvement of 15 letters or more
ARR 12%NNT 8
Moderate vision loss (15 letters on ETDRS) at 3 years
24% untreated 12% treated
Early Treatment Diabetic Retinopathy Study (ETDRS)
ETDRS. Ophthalmology. 1985; 103:1796-1806 ETDRS. Ophthalmology. 1987; 94: 761-774
55
Other Treatments for DME?Laser
ETDRS
Steroids
DRCR.net
Anti-VEGF
RESTORE
RISE and RIDE
DA VINCI
VIVID/VISTA
DR Clinical Research Network. Ophthalmology 2008;115(9):1447-1459
56

8/13/21
9
DRCR.net4 mg >
1 mg/laser• 4 months
4 mg = 1 mg = laser • 1 year
laser > 4 mg/1 mg
• 2 years
DRCR.net. Ophthalmology. 2008:115(9):1447-1459
58
DRCR.net
41316
2333
51
IOP ≥ 10mmHg Cataract Surgery
Complications (%)
Laser 1 mg 4 mg
DRCR.net. Ophthalmology. 2008:115(9):1447-1459
59
Other Treatments for DME?Laser
ETDRS
Steroids
DRCR.net
Anti-VEGF
RESTORE
RISE and RIDE
DA VINCI
VIVID/VISTA
DR Clinical Research Network. Ophthalmology 2008;115(9):1447-1459
60
RESTORE
ARR 33%, NNT 3 ARR 29%, NNT 3 ARR 9%, NNT 11
20/40 BCVA or better in patients with mild visual lossRanibizumab + sham laser:
20% à 53%Ranibizumab + active laser:
16% à 45%Active laser + sham
injections: 15% à 24%
Average change in visual acuity from baseline to month 12Ranibizumab + sham laser: +6.1 ± 6.4 letters (p<.0001)
Ranibizumab + active laser: +5.9 ± 7.9 letters (p<.0001)
Active laser + sham injections: +0.8 ± 8.6 letters
RESTORE study. Ophthalmology 2011;118:615-25
62
RISE and RIDE
Progression to PDR and needing PRP
< 1% ranibizumab 11% sham
% with BCVA ≥20/40
60% ranibizumab 36% sham ARR 24% NNT 4
Mean change from baseline BCVA
+8.5-9.9 letters more in ranibizumab vs. sham
RISE and RIDE. Ophthalmology 2012: 119: 789-801
65
DA VINCI
Do DV, et al. Ophthalmology 2012;119(8):1658-1665
ARR = 27%NNT = 3
Eyes gained ≥ 3 lines BCVA38% 11%
Mean change in BCVA from baseline at 1 yearGain 11 letters Loss 1 letter
GroupsTrap-Eye anti-VEGF Macular laser
68

8/13/21
10
Anti-VEGF Iatrogenic?Endophthalmitis = 1%Transient IOP increaseMonthly injections
70
Summary DME TreatmentDME Tx Laser maintains vision rather than improving it
Steroids work as well as laser but the side effects are worse
Anti-VEGF has shown to improve vision although requires a lengthy course of treatment of monthly injections
71
Treatments for PDR
Laser
DRS
Anti-VEGF
72
ARR 4%NNT 25
Severe vision loss (20/800) in eyes with PDR < HRC at 2 years 7% untreated 3% treated
ARR 15%NNT 8
Severe vision loss (20/800) in eyes that met HRC at 2 years 26% untreated 11% treated
Diabetic Retinopathy Study (DRS)
DRS. Am J Ophthalmol. 1976;81:383-396 DRS Report No. 8. Ophthalmology. 1988;88:583-600
73
“My vision was fine until you sent me to that retinal specialist for laser”
74
PRP for PDR
DRCR.net. Arch Ophthalmol.2009 Feb;127(2):132-40
0%
5%
10%
15%
20%
25%
30%
3 da y 4 weeks 17 week s 34 week s
5-9 letters loss from baseline1 sitti ng (N =84) 4 sitti ng s (N =71)
75

8/13/21
11
PRP for PDR
0%
5%
10%
15%
20%
25%
30%
3 da y 4 weeks 17 weeks 34 weeks
≥ 10 letters loss from baseline1 sitti ng (N =84) 4 sitti ng s (N =71)
DRCR.net. Arch Ophthalmol.2009 Feb;127(2):132-40
76
Anti-VEGF for PDR: 2 Year Results
Eyes without PDR on fundus photosLucentis: 35% PRP: 30%
DME development Lucentis: 9% PRP: 28%
Change in visual field total point scoreLucentis: -23 dB PRP: -422 dB
Mean change in visual acuityLucentis: +2.8 letters PRP: +0.2 letters
DRCR.net. JAMA 2015;314(20):2137-2146
78
Patient Education§Answer the question, “Why do I need yearly dilated eye exams?” every year even if they don’t ask it.§Help them understand their vascular disease.§Encourage them to be intimately aware of their numbers (BS, HbA1C, BP, cholesterol).§Keep in mind number one indicator of complications is duration.§You don’t “know” how hard it is to control the disease unless you have lived with it.
79
Ocular HTNThreats to vision?Treatment?When/who do we treat?
Everyone?No one?
Depends?
87
Kass MA et al. OHTS. Arch Ophthalmol. 2002;120:701-713
“Treating a patient with ocular hypertension reduces the risk of glaucoma by 50%...”
88
How Effective is Treatment?
90%25%10% 5%2/million 1/million
50%50%
ARR NNT45%12.5%
0.0001%5%
1,000,0002082
RRR
50%50%
45%TxNo Tx
12.5%
“Treating a patient with ocular hypertension reduces the risk of glaucoma by 50%...”
Kass MA et al. OHTS. Arch Ophthalmol. 2002;120:701-713
89

8/13/21
12
What Were the Outcomes Used?
Surrogate endpoints vs. clinical endpoints
Glaucoma
Reproducible VF
abnormality
Reproducible ONH
deterioration
Kass MA et al. OHTS. Arch Ophthalmol. 2002;120:701-713
90
How Was Ocular HTN Defined?Age 40 – 80IOP 24-32 mmHg in one eye and 21-32 mmHg in the otherGonioscopically open angles2 normal HVF tests each eyeNormal ONHs
Kass MA et al. OHTS. Arch Ophthalmol. 2002;120:701-713
91
Treatment?Reduction of IOP by 20% or more and reach an IOP of 24 or less
Kass MA et al. OHTS. Arch Ophthalmol. 2002;120:701-713
92
Treat everyone?
Treat no one?
It depends?
93
Iatrogenic to Treating Everyone?
$20/bottle x 12 months x 5 years x 20 NNT =
$24,000
% of patients we didn’t help = 95%
% of complication = 100%
94
Treat no one?
95

8/13/21
13
Is there penalty in delaying treatment?
At 13 yearsDelayed Tx = 22% Early Tx = 16%
At 7.5 yearsStart Tx Continue Tx
At 5 yearsNo Tx = 10% Tx = 5%
Kass MA et al. OHTS. Arch Ophthalmol. 2002;120:701-713Kass MA et al. OHTS. Arch Ophthalmol. 2010;128(3):276-287
96
It Depends?nAge, health status, patient preferencenBaseline risk determined by OHTS/EGPS calculator?nAgenIOPnCCTnPSDnC/D
97
After 13 years % developing glaucoma based on initial risk
High risk at baseline (>15%)Delayed Tx = 40% Early Tx = 28% NNT = 8
Moderate risk at baseline (5-15%)Delayed Tx = 19% Early Tx = 14 % NNT = 20
Lowest risk at baseline (<5%) Delayed Tx = 8% Early Tx = 7% NNT = 100
Kass MA et al. OHTS. Arch Ophthalmol. 2010;128(3):276-287
98
What Do I Do With this Patient?Assess risk◦ Age, IOP, CCT, C/D
Testing◦ HVF, ONH/RNFL analysis, stereo ONH photos,
gonioscopy, pachymetry
99
Testing
100
“Medicine is a science of uncertainty and an art of probability”-Sir William Olser, MD
101

8/13/21
14
Sensitivity vs. Specificity
Positive Predictive Value vs. Negative Predictive Value
102
Riddle
103
Probability of breast cancer =
0.8%
Mammography screening program
of 40-50 yowomen with no
symptoms
Has breast cancer
Positive mammogram
90%
Does not have
breast cancer
False positive mammogram
7%
What is the probability that a
positive mammogram is actually breast
cancer?
104
8 (+) cancer 992 (-) cancer
7 TP 1 FN
1000
0.8% with breast cancer90% sensitivity93% specificity
922 TN 70 FP
Positive Predictive Value = 7/77 = 9%
105
10 w/ glc 990 w/o glc
9 TP 1 FN
1000
1% adult population w/ glaucoma90% sensitivity90% specificity
891 TN 99 FP
Positive Predictive Value = 9/108 = 8%
106
100 w/ glc 900 w/o glc
90 TP 10 FN
1000
10% adult population w/ glc when IOP >2190% sensitivity90% specificity
810 TN 90 FP
Positive Predictive Value = 50%
107

8/13/21
15
TestingSensitivity vs. Specificity
◦ Efficacy of tests commonly reported this way◦ Clinically not valuable information in isolation◦ Usefulness of test depends on initial risk of population
More judicious testing leads to fewer false positives and higher positive predictive value
108
“In general, tests do not make a diagnosis – you do, based on the test result in the context of how likely you believed the disease was to begin with.”-Richard Gross, MD
109
“Because there is no need to show that an instrument has any real value in disease detection or management before it is
brought to market, we have become enamored with sophisticated analysis algorithms and colorful printouts
before we have studies that show what the results of the tests mean. This approach is fueled, of course, by economic
interests. Industry is motivated to create product and we [ophthalmologists] provide the key opinion leaders to drive
the use of what is developed . . .”
-Paul Lichter, MD
Lichter P. Glaucoma Volume 1: Medical Diagnosis & Therapy. London: Saunders/Elsevier; 2009:506
110
“. . . Cynical as it seems, these devices belong in the laboratory, before they are marketed as being of value and
before billing codes are established for their use, which simply drive up the costs of care without making any impact
whatsoever on the critical outcome in glaucoma—preservation of vision related QOL.”
-Paul Lichter, MD
Lichter P. Glaucoma Volume 1: Medical Diagnosis & Therapy. London: Saunders/Elsevier; 2009:506
111
Patient Education§You don’t know your patient’s risk for glaucoma.§Help them understand what the risk is for people like them.
§Empower patients to make the decision to treat or not to treat on their own. §Acknowledge their fear and help them understand why that won’t happen.§Have a philosophy for treating glaucoma.
112
Dry ARMD
Nutrients
WasteBruch’s
RPE
Retina
Choroid
113

8/13/21
16
Dry AMD
114
Dry AMD
115
Wet ARMD
Bruch’sRPE
Retina
Choroid
116
Wet AMD
117
Wet AMD
118
AMD
Dry90%
90% functional vision
10% severe vision loss (GA)
Wet10%
90% severe vision loss
119

8/13/21
17
Threats to vision?
What is my dx?
AMD
Dry RPE Atrophy
Wet
RPE Atrophy
CNVM
120
MARINA for CNVM
Improved ≥ 3 lines BCVA from baseline
Lucentis = 30% Sham = 5% NNT = 4
Lost ≤ 3 lines BCVA from baseline
Lucentis = 94% Sham = 62% NNT = 3
20/40 BCVA or better
Lucentis = 40% Sham = 11% NNT = 3.5
Rosenfeld PJ, et al. N Engl J Med 2006;355:1419-31
121
Iatrogenic?Endophthalmitis = 1%Transient IOP increaseMonthly injections
122
“Despite the lack of convincing evidence, the marketing and use of antioxidants and zinc in eye-targeted formulations has become common practice.”- AREDS I
AREDS Research Group. Arch Ophthalmol. 2001;119:1417-1436
123
“Taking AREDS I supplements reduces the risk of AMD progression by 25%...”
AREDS Research Group. Arch Ophthalmol. 2001;119:1417-1436
124
AMD
Category 1
No AMD
BCVA 20/32 or better in both eyes
Category 2
Mild/borderline AMD
BCVA 20/32 or better in both eyes
Category 3
Moderate AMD
BCVA 20/32 or better in one eye
Category 4
No signs of advanced AMD in the study eye and BCVA 20/32
Adv AMD fellow eye
AREDS 1
AREDS Research Group. Arch Ophthalmol. 2001;119:1417-1436
125

8/13/21
18
AMD
Category 1Placebo
Antioxidants
Zinc
Antioxidants + Zinc
Category 2Placebo
Antioxidants
Zinc
Antioxidants + Zinc
Category 3Placebo
Antioxidants
Zinc
Antioxidants + Zinc
Category 4Placebo
Antioxidants
Zinc
Antioxidants + Zinc
AREDS 1
AREDS Research Group. Arch Ophthalmol. 2001;119:1417-1436
126
Outcome: Progression to ADV AMD at 5 years
Combined categories 3 AND 4
Placebo = 28%Antioxidants + Zinc =
20%ARR = 8% NNT = 12.5
Probability by Treatment (Placebo vs. Treatment)Category 1
Data not evaluated
Category 2
No sig difference
Category 3
Data not reported
Category 4
Data not reported
Probability by CategoryCategory 1
0.004%
Category 2
1.3%
Category 3
18%
Category 4
43%
AREDS Research Group. Arch Ophthalmol. 2001;119:1417-1436
127
Outcome: 15-letter decrease from baseline at 5 years
Combined categories 3 AND 4
Placebo = 29% Antioxidants + Zinc = 23% ARR = 6% NNT = 17
Probability by Treatment (Placebo vs. Treatment)Category 1
Data not evaluated
Category 2
No sig difference
Category 3
Data not reported
Category 4
Data not reported
AREDS Research Group. Arch Ophthalmol. 2001;119:1417-1436
128
Iatrogenic?
$142/year x 5 years x 17 NNT =
$12,070
% of patients we didn’t help = 92-94%
% of complication = 100%
129
Iatrogenic?
“We do not know the long-term health effects of supplementation with these high doses of vitamins and minerals”-AREDS I
AREDS Research Group. Arch Ophthalmol. 2001;119:1417-1436
130
ORIGINAL CONTRIBUTION
Vitamin E and the Risk of Prostate CancerThe Selenium and Vitamin E Cancer Prevention Trial (SELECT)Eric A. Klein, MDIan M. Thompson Jr, MDCatherine M. Tangen, DrPHJohn J. Crowley, PhDM. Scott Lucia, MDPhyllis J. Goodman, MSLori M. Minasian, MDLeslie G. Ford, MDHoward L. Parnes, MDJ. Michael Gaziano, MD, MPHDaniel D. Karp, MDMichael M. Lieber, MDPhilip J. Walther, MD, PhDLaurence Klotz, MDJ. Kellogg Parsons, MD, MHSJoseph L. Chin, MDAmy K. Darke, MSScott M. Lippman, MDGary E. Goodman, MDFrank L. Meyskens Jr, MDLaurence H. Baker, DO
LIFETIME RISK OF PROSTATE CAN-cer in the United States is cur-rently estimated to be 16%.1 Al-though most cases are found at
an early, curable stage, treatment iscostly and urinary, sexual, and bowel-related adverse effects are common.2
Even men who choose active surveil-lance as an initial management strat-egy face anxiety, uncertain prognosis,and a measurable risk of sepsis with fol-low-up biopsies,3 and more than one-third of those who initially defer therapyare ultimately treated.4,5 With such a
high prevalence, risk of morbidity fromtreatment, and treatment-related costs,primary prevention of prostate canceris an attractive option.
With considerable preclinical andepidemiological evidence that sele-nium and vitamin E may reduce pros-tate cancer risk, we conducted and re-ported the results of a prospectiverandomized trial examining the effect
of these 2 agents for prostate cancer pre-vention.6 Coordinated by SWOG, a fed-erally funded cancer research coopera-tive group, the Selenium and VitaminE Cancer Prevention Trial (SELECT)
Author Affiliations are listed at the end of this ar-ticle.Corresponding Author: Eric A. Klein, MD, GlickmanUrological and Kidney Institute, Cleveland Clinic, DeskQ10-1, 9500 Euclid Ave, Cleveland, OH 44195 ([email protected]).
Context The initial report of the Selenium and Vitamin E Cancer Prevention Trial(SELECT) found no reduction in risk of prostate cancer with either selenium or vitaminE supplements but a statistically nonsignificant increase in prostate cancer risk withvitamin E. Longer follow-up and more prostate cancer events provide further insightinto the relationship of vitamin E and prostate cancer.
Objective To determine the long-term effect of vitamin E and selenium on risk ofprostate cancer in relatively healthy men.
Design, Setting, and Participants A total of 35 533 men from 427 study sites inthe United States, Canada, and Puerto Rico were randomized between August 22,2001, and June 24, 2004. Eligibility criteria included a prostate-specific antigen (PSA)of 4.0 ng/mL or less, a digital rectal examination not suspicious for prostate cancer,and age 50 years or older for black men and 55 years or older for all others. The pri-mary analysis included 34 887 men who were randomly assigned to 1 of 4 treatmentgroups: 8752 to receive selenium; 8737, vitamin E; 8702, both agents, and 8696, pla-cebo. Analysis reflect the final data collected by the study sites on their participantsthrough July 5, 2011.
Interventions Oral selenium (200 µg/d from L-selenomethionine) with matched vi-tamin E placebo, vitamin E (400 IU/d of all rac-!-tocopheryl acetate) with matchedselenium placebo, both agents, or both matched placebos for a planned follow-up ofa minimum of 7 and maximum of 12 years.
Main Outcome Measures Prostate cancer incidence.
Results This report includes 54 464 additional person-years of follow-up and 521additional cases of prostate cancer since the primary report. Compared with the pla-cebo (referent group) in which 529 men developed prostate cancer, 620 men in thevitamin E group developed prostate cancer (hazard ratio [HR], 1.17; 99% CI, 1.004-1.36, P =.008); as did 575 in the selenium group (HR, 1.09; 99% CI, 0.93-1.27; P =.18),and 555 in the selenium plus vitamin E group (HR, 1.05; 99% CI, 0.89-1.22, P =.46).Compared with placebo, the absolute increase in risk of prostate cancer per 1000 person-years was 1.6 for vitamin E, 0.8 for selenium, and 0.4 for the combination.
Conclusion Dietary supplementation with vitamin E significantly increased the riskof prostate cancer among healthy men.
Trial Registration Clinicaltrials.gov Identifier: NCT00006392JAMA. 2011;306(14):1549-1556 www.jama.com
Author Video Interview available atwww.jama.com.
©2011 American Medical Association. All rights reserved. JAMA, October 12, 2011—Vol 306, No. 14 1549Corrected on October 11, 2011
at on October 19, 2011jama.ama-assn.orgDownloaded from
LESS IS MORE
ORIGINAL INVESTIGATION
Dietary Supplements and Mortality Ratein Older WomenThe Iowa Women’s Health Study
Jaakko Mursu, PhD; Kim Robien, PhD; Lisa J. Harnack, DrPH, MPH;Kyong Park, PhD; David R. Jacobs Jr, PhD
Background: Although dietary supplements are com-monly taken topreventchronicdisease, the long-termhealthconsequences of many compounds are unknown.
Methods: We assessed the use of vitamin and mineralsupplements in relation to total mortality in 38 772 olderwomen in the Iowa Women’s Health Study; mean age was61.6 years at baseline in 1986. Supplement use was self-reported in 1986, 1997, and 2004. Through December31, 2008, a total of 15 594 deaths (40.2%) were identi-fied through the State Health Registry of Iowa and theNational Death Index.
Results: In multivariable adjusted proportional hazardsregression models, the use of multivitamins (hazard ratio,1.06; 95% CI, 1.02-1.10; absolute risk increase, 2.4%), vi-tamin B6 (1.10; 1.01-1.21; 4.1%), folic acid (1.15; 1.00-1.32; 5.9%), iron (1.10; 1.03-1.17; 3.9%), magnesium (1.08;1.01-1.15; 3.6%), zinc (1.08; 1.01-1.15; 3.0%), and cop-
per (1.45; 1.20-1.75; 18.0%) were associated with in-creased risk of total mortality when compared with corre-sponding nonuse. Use of calcium was inversely related(hazard ratio, 0.91; 95% confidence interval, 0.88-0.94; ab-solute risk reduction, 3.8%). Findings for iron and cal-cium were replicated in separate, shorter-term analyses (10-year, 6-year, and 4-year follow-up), each with approximately15%of theoriginalparticipantshavingdied, starting in1986,1997, and 2004.
Conclusions: In older women, several commonly useddietary vitamin and mineral supplements may be asso-ciated with increased total mortality risk; this associa-tion is strongest with supplemental iron. In contrast tothe findings of many studies, calcium is associated withdecreased risk.
Arch Intern Med. 2011;171(18):1625-1633
I N THE UNITED STATES, THE USE OFdietary supplements has in-creased substantially during thepast several decades,1-3 reachingapproximately one-half of adults
in 2000, with annual sales of more than$20 billion.1,3 Sixty-six percent of womenparticipating in the Iowa Women’s HealthStudy2 used at least 1 dietary supplementdaily in 1986 at an average age of 62 years;in 2004, the proportion increased to 85%.Moreover, 27% of women reported using4 or more supplemental products in 2004.2
At the population level, dietary supple-ments contributed substantially to the totalintake of several nutrients, particularly inelderly individuals.1,2
Supplemental nutrient intake clearly isbeneficial in deficiency conditions.4 How-ever, in well-nourished populations, supple-ments often are intended to yield benefitby preventing chronic diseases. Results of
epidemiologic studies5-9 assessing supple-ment use and total mortality risk have beeninconsistent. Several randomized con-trolled trials (RCTs),10,11 concentratingmainly on calcium and vitamins B, C, D,and E, have not shown beneficial effects of
dietary supplements on total mortality rate;in contrast, some12,13 have suggested thepossibility of harm. Meta-analyses14,15 con-cur in finding no decreased risk and po-tential harm. Supplements are widely used,and further studies regarding their healtheffects are needed. Also, little is knownabout the long-term effects of multivita-min use and less commonly used supple-ments, such as iron and other minerals.
See Invited Commentaryand Editor’s Noteat end of article
Author Affiliations:Department of Health Sciences,Institute of Public Health andClinical Nutrition, University ofEastern Finland, KuopioCampus, Kuopio, Finland(Dr Mursu); Division ofEpidemiology and CommunityHealth, School of Public Health,University of Minnesota,Minneapolis (Drs Mursu,Robien, Harnack, and Jacobs);Department of Food andNutrition, YeungnamUniversity, Gyeongbuk,Republic of Korea (Dr Park);and Department of Nutrition,School of Medicine, Universityof Oslo, Oslo, Norway(Dr Jacobs).
ARCH INTERN MED/ VOL 171 (NO. 18), OCT 10, 2011 WWW.ARCHINTERNMED.COM1625
©2011 American Medical Association. All rights reserved.
“Dietary supplementation with vitamin E significantly increased the risk of prostate
cancer among healthy men”Klein EA, et al. SELECT. JAMA 2011;306(14):1549-1556
“In older women, several commonly used dietary vitamins and mineral supplements
may be associated with increased total mortality rate”
Mursu J, et al. Arch Intern Med 2011;171(18):1625-33
“In patients with vascular disease or DM, long-term vitamin E supplementation may
increase the risk for heart failure”Lonn E, et al. HOPE. JAMA 2005;293(11):1338-47
High dose vitamin E supplementation may increase the risk for hemorrhagic
stroke and should be used with caution in people with heart disease
Schurks et al. BMJ 2010; 341:c5702
131
8/13/21
19
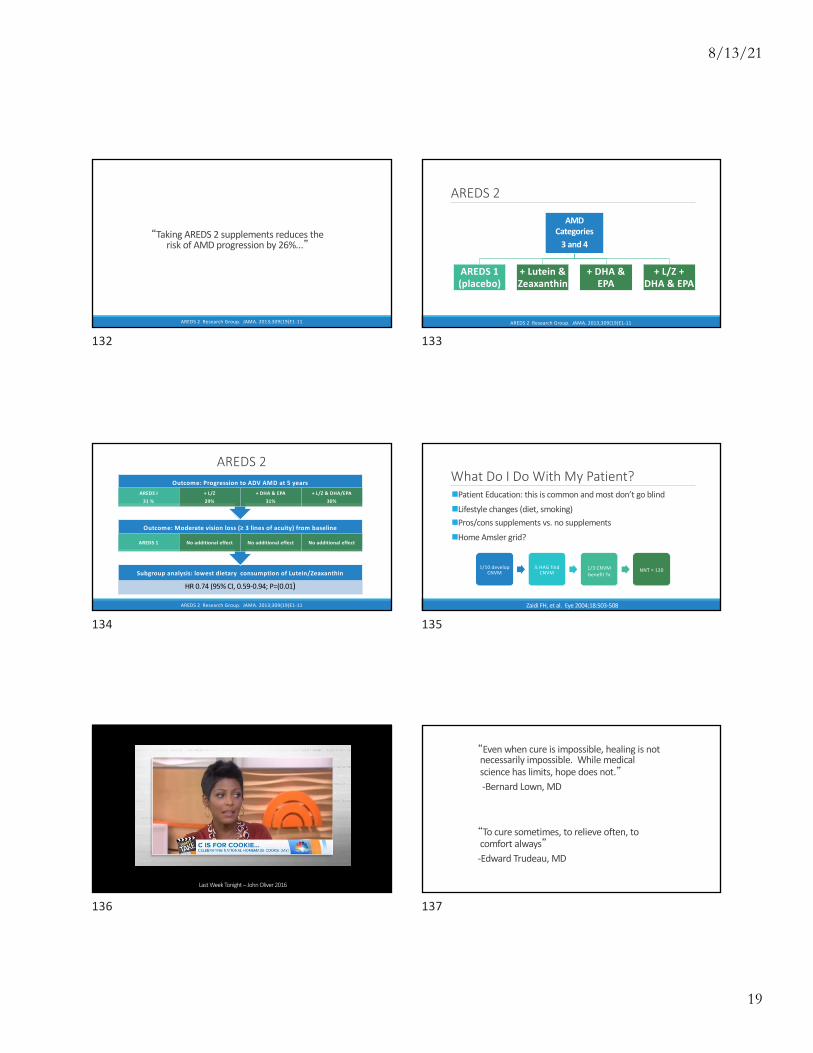
“Taking AREDS 2 supplements reduces the risk of AMD progression by 26%...”
AREDS 2 Research Group. JAMA. 2013;309(19)E1-11
132
AMD Categories
3 and 4
AREDS 1 (placebo)
+ Lutein & Zeaxanthin
+ DHA & EPA
+ L/Z + DHA & EPA
AREDS 2
AREDS 2 Research Group. JAMA. 2013;309(19)E1-11
133
AREDS 2
Subgroup analysis: lowest dietary consumption of Lutein/Zeaxanthin
HR 0.74 (95% CI, 0.59-0.94; P=(0.01)
Outcome: Moderate vision loss (≥ 3 lines of acuity) from baseline
AREDS 1 No additional effect No additional effect No additional effect
Outcome: Progression to ADV AMD at 5 years
AREDS I
31 %
+ L/Z
29%
+ DHA & EPA
31%
+ L/Z & DHA/EPA
30%
AREDS 2 Research Group. JAMA. 2013;309(19)E1-11
134
What Do I Do With My Patient?nPatient Education: this is common and most don’t go blindnLifestyle changes (diet, smoking)nPros/cons supplements vs. no supplementsnHome Amsler grid?
Zaidi FH, et al. Eye 2004;18:503-508
1/10 develop CNVM
¼ HAG find CNVM
1/3 CNVM benefit Tx
NNT = 120
135
Last Week Tonight – John Oliver 2016
136
“Even when cure is impossible, healing is not necessarily impossible. While medical science has limits, hope does not.”-Bernard Lown, MD
“To cure sometimes, to relieve often, to comfort always”-Edward Trudeau, MD
137

8/13/21
20
ObjectivesDefine a structured question
Find the best evidence and apply it clinically
See through hype in medical news and advertisements
138
Resources
Contact [email protected]
139