knowledge analytics - apqc analytics... · knowledge analytics can reveal strengths and ... social...
TRANSCRIPT
By Carla O’Dell
President, APQC
Developed in collaboration with APQC’s 2011-2012 Knowledge Management Advanced Working Group, which
included representatives from:
APQC
Baker Hughes Inc.
ConocoPhillips
Deloitte Touche Tohmatsu Limited
The Federal Reserve Bank of Cleveland
Marathon Oil Corp.
Rockwell Collins
U.S. Army ARDEC
Knowledge AnalyticsSM
A FRESH WAY OF THINKING ABOUT AN OLD PROBLEM
Page 2 of 12
Research provided by APQC, the international resource for benchmarks and best practices
Knowledge AnalyticsSM
K03636
©2012 APQC. ALL RIGHTS RESERVED
Introduction At APQC’s annual knowledge management (KM) conference in 2011 attendees were asked,
“What poses the biggest challenge to your KM program today?” Measurement came in third
place—evidence that the relationship among investments, knowledge-sharing behaviors, and
business outcomes continues to be an important and challenging endeavor. Not surprisingly,
making a business case for KM came in second. But the most startling answer came when a
whopping 61 percent reported “change mastery” as their biggest challenge.
A new idea and technique in KM—Knowledge AnalyticsSM—tackles all three challenges at once.
It is probably the next breakthrough in how organizations think about and measure the impact
of KM. Its raison d'être is to assimilate new, data-driven insights about knowledge (e.g., what we
know, who knows it, and how we use it) into business decision making. And perhaps most
importantly, the Knowledge Analytics process is a change management technique: It is built on
dialogue with executives about data these leaders really want and care about.
Going beyond simply showing value, this new way of thinking can reveal how KM approaches
interact with and illuminate a much broader spectrum of questions and decisions facing today’s
organizations.
Can we detect leading trends from the streams of content and conversations in our
communities of practice?
Are our social media tools fostering knowledge flow across departments and locations while
aiding retention of young talent?
Can we learn what new requests our customers are making by what our employees search
for?
Can we use work force demographics and patterns of sharing to predict and prevent the loss
of critical knowledge?
Can we identify people with expertise not obvious on their résumés?
Building on prior APQC work, under the direction of Carla O’Dell, Ph.D., the 2011-2012 APQC KM
Advanced Working Group (AWG) developed a process it came to call Knowledge Analytics. This
white paper explains the seven-step Knowledge Analytics process and how to apply it to your
organization.
What Is Knowledge Analytics? Knowledge Analytics is a measurement, analysis, reporting, and decision-support process that
combines measures and information from KM approaches and business processes to guide
investments. When KM statistics are combined with data from HR, talent, content management,
social analytics, finance, marketing, operations, etc., KM professionals can see important
patterns in employee knowledge creation, sharing, and use. This process reveals the impact of
KM approaches, as well as insights that might be beneficial to the business in other ways.
Page 3 of 12
Research provided by APQC, the international resource for benchmarks and best practices
Knowledge AnalyticsSM
K03636
©2012 APQC. ALL RIGHTS RESERVED
The purpose of Knowledge Analytics is to help everyone understand the impact of KM
approaches on business processes and make better decisions about KM investments.
Knowledge Analytics will:
1. help leaders make better decisions;
2. enable operations experts, product development executives, and project managers to use
organizational capabilities more wisely;
3. help the KM team spot important patterns of sharing early on; and
4. allow organizations to seize business opportunities that involve competing on knowledge.
By bringing together disparate data sources and knowledge assets, the process can guide an
organization’s KM program and business leaders in making knowledge-related investment
decisions, in addition to predicting outcomes based on patterns of behavior and performance.
Those same leaders can use organizational capabilities more wisely, spot patterns early on, and
seize business opportunities. “Knowledge Analytics will have its biggest payoff by helping
leaders apply the organization’s knowledge where the business needs it most: strategic decision
making,” said Amy Edwards, the senior manager of global consulting KM at Deloitte Touche
Tohmatsu Limited (DTTL). 1
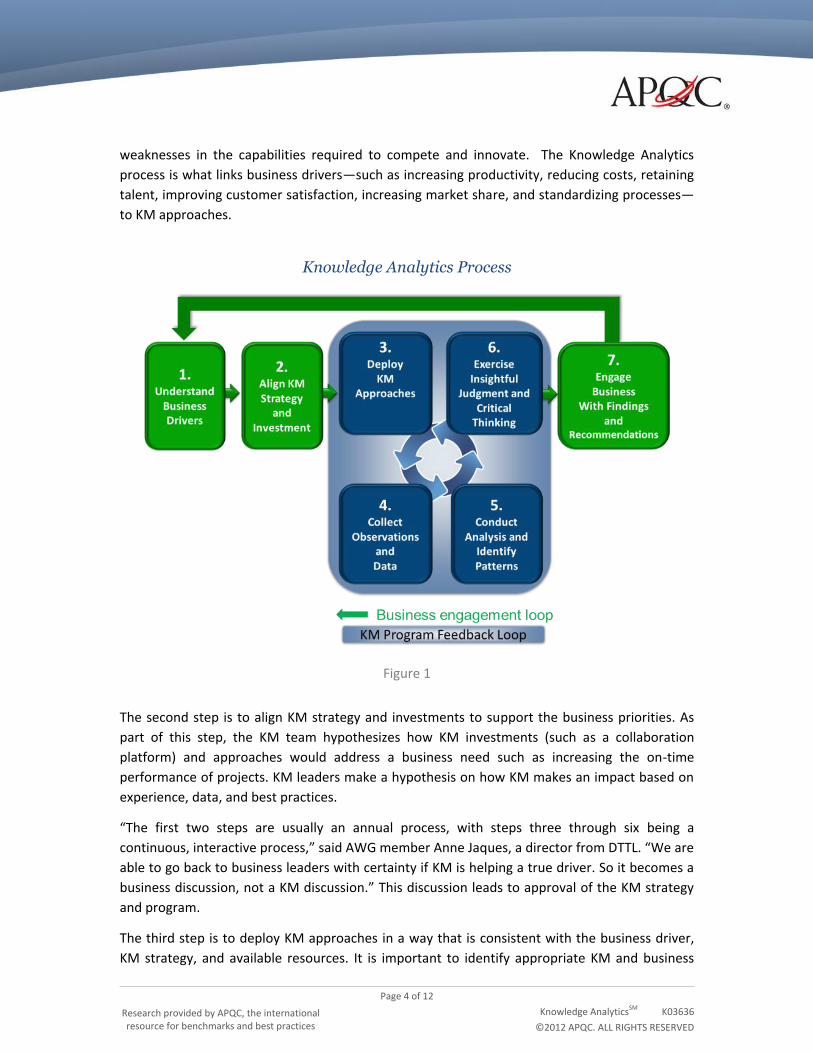
The Knowledge Analytics Process The centerpiece of Knowledge Analytics is a seven-step process that allows KM professionals to
align KM with key business drivers and measures (Figure 1).
The first step is to understand business drivers and priorities. Similar to the final step (also noted
in green), the first step involves conversations with senior management. The conversations go
something like this: What are your business priorities and desired outcomes? What do you
believe drives those outcomes now? How is the flow or quality of knowledge involved? What
does the organization measure today, and why? Who provides that data? What other data is
available?
This initial step sets direction and determines what success looks like in management terms.
AWG members have been using the process with their business leaders and found it a
wonderful guide to conversations—zooming in on what really matters. It is a discussion and
planning technique to map a path forward and should fit nicely with annual business planning or
refreshed strategies.
Step 1 enables—and pushes—KM professionals to focus on an organizational goal such as
reducing response time to business opportunities, identifying experts, staffing people on
projects more quickly, or reducing errors. Knowledge Analytics can reveal strengths and
1 The views expressed in this white paper reflect those of the author, APQC, and/or the individual participants quoted and not
necessarily their parent organizations.
Page 4 of 12
Research provided by APQC, the international resource for benchmarks and best practices
Knowledge AnalyticsSM
K03636
©2012 APQC. ALL RIGHTS RESERVED
weaknesses in the capabilities required to compete and innovate. The Knowledge Analytics
process is what links business drivers—such as increasing productivity, reducing costs, retaining
talent, improving customer satisfaction, increasing market share, and standardizing processes—
to KM approaches.
Knowledge Analytics Process
Figure 1
The second step is to align KM strategy and investments to support the business priorities. As
part of this step, the KM team hypothesizes how KM investments (such as a collaboration
platform) and approaches would address a business need such as increasing the on-time
performance of projects. KM leaders make a hypothesis on how KM makes an impact based on
experience, data, and best practices.
“The first two steps are usually an annual process, with steps three through six being a
continuous, interactive process,” said AWG member Anne Jaques, a director from DTTL. “We are
able to go back to business leaders with certainty if KM is helping a true driver. So it becomes a
business discussion, not a KM discussion.” This discussion leads to approval of the KM strategy
and program.
The third step is to deploy KM approaches in a way that is consistent with the business driver,
KM strategy, and available resources. It is important to identify appropriate KM and business
Page 5 of 12
Research provided by APQC, the international resource for benchmarks and best practices
Knowledge AnalyticsSM
K03636
©2012 APQC. ALL RIGHTS RESERVED
measures at this time. (The deployment of effective KM approaches, from social networks to
communities of practice to expertise location to the transfer of best practices, is a multifaceted
process covered in more detail in other APQC resources.)
The fourth step is to set up the data collection system, including methodology, technology,
metrics and measures (qualitative and quantitative), and relevant data from functions such as
finance and HR. Appropriate data and measures may come from anywhere in the organization,
depending on your original hypothesis. Data about organizational knowledge can be harvested
from classic KM metrics (participation and satisfaction), social analytics (from social networking
approaches), sentiment analysis, content and text analysis, and recommendation systems.
The fifth step is to apply a variety of analytic techniques to identify patterns relevant to the KM
program, the business drivers, and the hypothesis about the relationship between the two. The
richer the data, the more challenging but also the more fruitful the analysis will be. Partnering
with the new breed of statistically trained business analysts in finance and marketing would be a
smart move here.
The sixth step is to exercise insightful judgment and critical thinking. The KM program and
internal partners derive meaning from the data gathered and determine its significance to the
KM program and the business. The AWG found that creative approaches to displaying data and
trends could play an important role here, again drawing on the newer techniques emerging in
social media analytics.
Steps 3 through 6 provide insights and conclusions to address the needs identified in Step 1 and
the hypothesis created in Step 2. The shaded area around steps 3 through 6 shows the iterative
nature of feedback for an agile KM program. The KM group might cycle through these steps
multiple times over the course of a year. Course redirection occurs throughout the feedback
loop as problem patterns emerge.
Therefore, the seventh and final step is to circle back to the business leaders and talk about the
implications of the findings for the business and the KM program. This may only happen once or
twice a year. The dialogue will lead to insights and creative problem solving, as well as inform
richer decision making about investments and strategy.
“The process helped me clarify our program’s requirements,” said AWG member Scott Miller of
the U.S. Army. “Then I could understand and explain how KM’s work links to their needs and the
larger agenda. It also revealed other, similar KM efforts in additional parts of the organization—
departments now more willing to work together as budgets shrink.”
The Process in Use It is helpful to illustrate the Knowledge Analytics process with two examples. The first explores
the dynamics and impact of a specific KM approach (in this case engineering communities of
Page 6 of 12
Research provided by APQC, the international resource for benchmarks and best practices
Knowledge AnalyticsSM
K03636
©2012 APQC. ALL RIGHTS RESERVED
practice), whereas the second addresses how to enable strategic business goals, such as growth
through work force development.
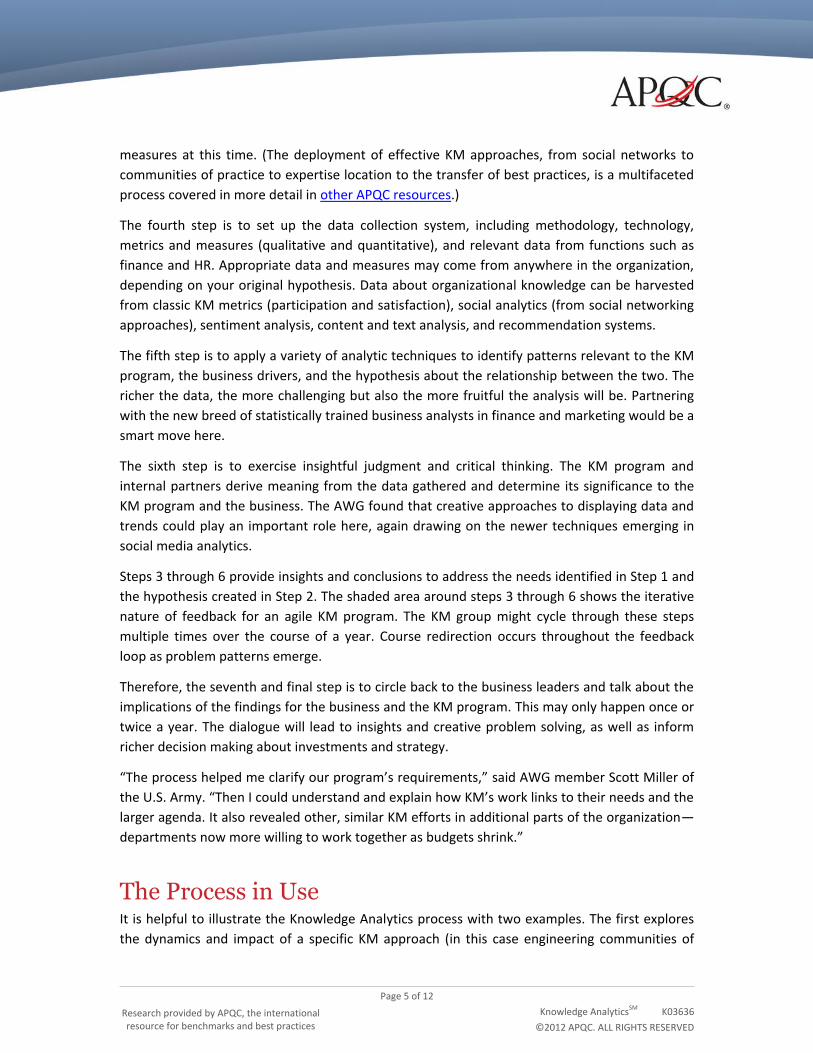
The first high-level example focuses on three engineering communities of practice. Figure 2
shows the process steps adapted to this example. A KM team believes that engineering
communities will support the business’s strategic goal of standardizing practices globally to
reduce risk and cost. The hypothesis: Sharing curated content via a single portal (with extensive
Q&A opportunities to reach out to experts) will lead to the adoption of standardized best
practices and reduce cost and error.
Knowledge Analytics Process Customized to Examine Communities of Practice
Figure 2
To test its hypothesis, the team tracks classic KM community measures such as participation and
content ratings, along with demographic information (within the bounds of privacy) and error
rates on common engineering projects. By performing steps 3 through 6 of the Knowledge
Analytics process, the team discovers that new employees participate in the communities a lot
and that their questions vary greatly by region. Further scrutiny of the data reveals that six
categories of project errors declined when global experts provided responses to questions
posed to the communities by newer engineers. Conversely, errors and problems persisted at the
same rate when experts didn’t respond. The KM team uncovers that senior engineers (i.e., the
Page 7 of 12
Research provided by APQC, the international resource for benchmarks and best practices
Knowledge AnalyticsSM
K03636
©2012 APQC. ALL RIGHTS RESERVED
experts) are not credited with utilization for unbillable time spent responding to questions. So
the KM team meets with engineering leadership and creates a business case comparing
overhead costs of experts’ unbilled time to errors avoided and the ability to ship engineering
work to low-cost countries. As a result of the analysis, the KM team and engineering leadership
see the business value of freeing up experts’ time to participate in communities and recognizing
their contributions.
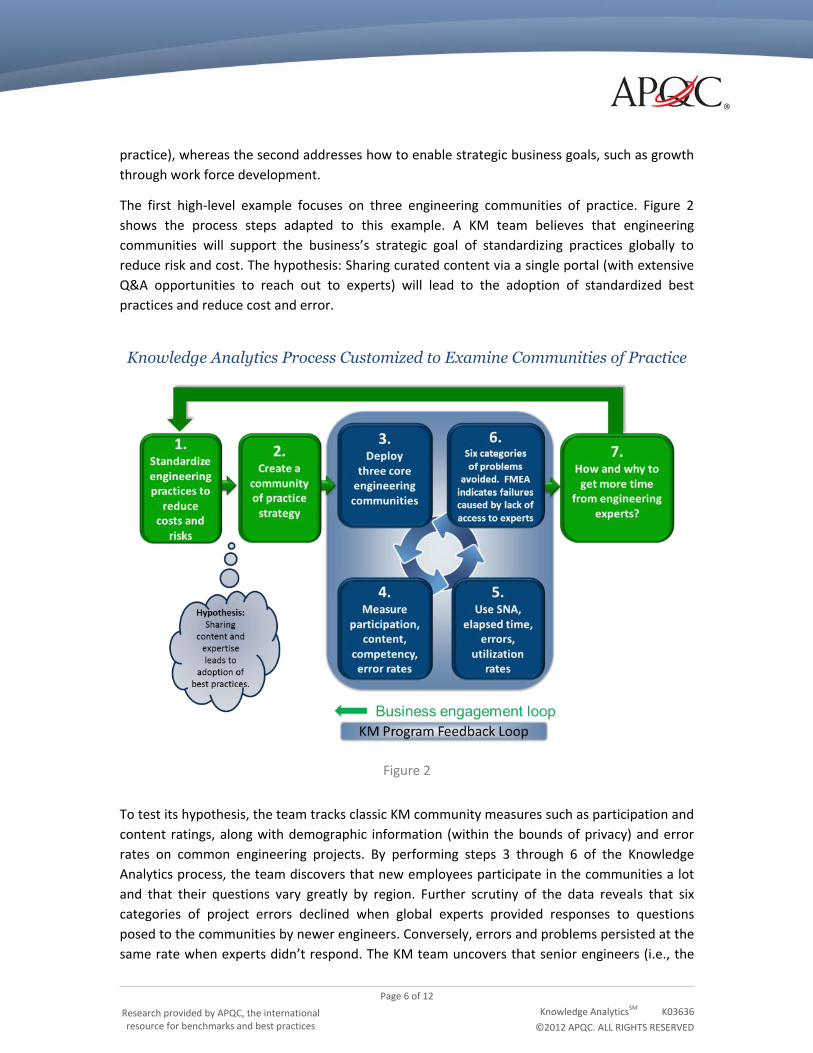
The second, more detailed example comes from AWG members Andrea Stevenson and Amy
Edwards from the global consulting KM team at DTTL. It focuses on the Deloitte member firms’
strategy to grow through employee hiring and skill development. From the KM perspective, this
problem is a matter of connecting people to others who can help them engage faster. “We need
to focus on understanding our talent’s expertise and getting people together at the right time,”
said Edwards. “Helping connect and staff professionals could boost utilization rates and prepare
employees for future opportunities. The strategy we would propose to our management is to
identify and strengthen networks via our single profile system. The expertise location system
currently used by our consultants could help the entire company and inform our conversations
with business leaders” (Figure 3).
Knowledge Analytics Process Customized to Address a Specific Business Need
Figure 3
Page 8 of 12
Research provided by APQC, the international resource for benchmarks and best practices
Knowledge AnalyticsSM
K03636
©2012 APQC. ALL RIGHTS RESERVED
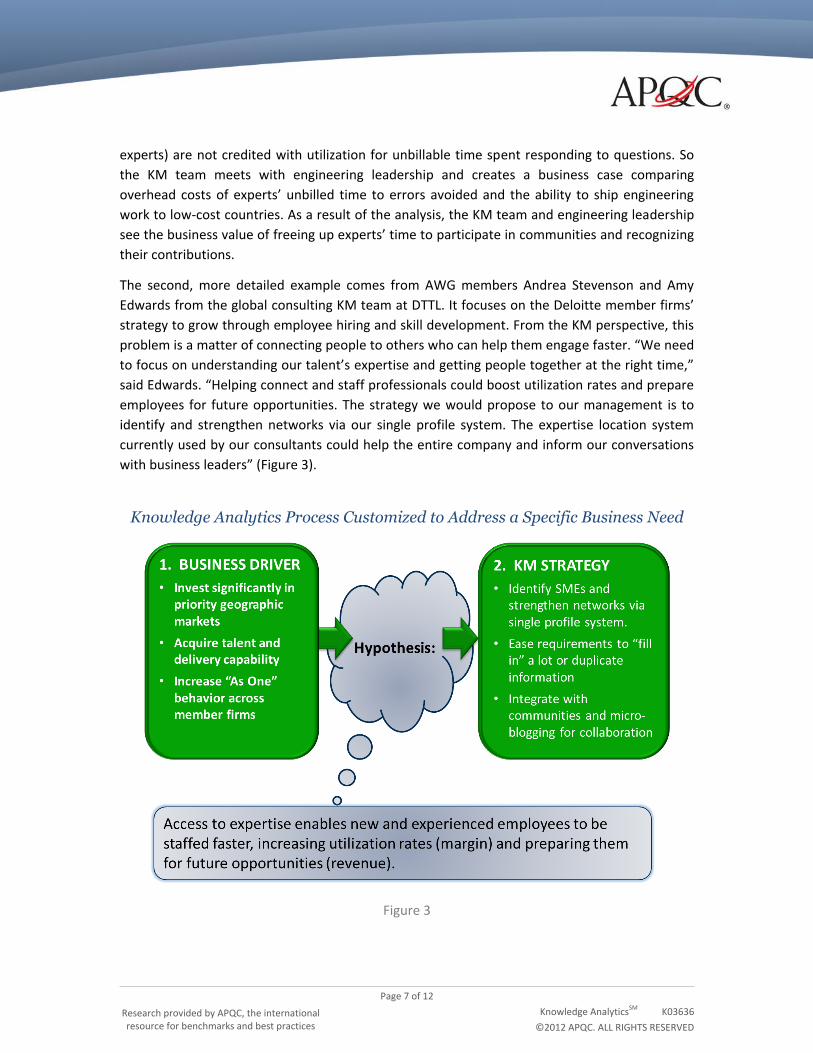
The KM team recommends looking at an existing set of measures for expertise location and
profile creation (Figure 4), as well as identifying and evaluating available business measures such
as project utilization and sales opportunities.
Indicators and Measures for Expertise Location
Figure 4
In Step 5 of this example, the Deloitte member firms’ KM team focuses the analysis by asking
questions relevant to the business drivers, including:
In what regions are the true experts located?
Do we need to transfer skilled resources from another country?
Do we have expertise to support emerging demands?
Are those who update profiles regularly:
Frequently staffed on projects?
Staffed on the most profitable projects?
Staffed more quickly, especially as new hires?
Better connected in the business?
Considered thought leaders?
With the firm longer?
Promoted more quickly?
Insights emerge when, in Step 6, the KM team thinks about what correlations would address
these questions. If the team measures the right things, then the results can help it
Expertise Location indicators/measures
Profiles MUVs as % of headcount (global, geography, practice)
Usage growth rate in line with headcount
Page views of other peoples’ profiles Profile completion rates Awareness, need and satisfaction with
the Profile tool (via on-line survey)
Other indicators and measures
Demographics of users (e.g., geo, tenure, function)
Business measures: Headcount, utilization, skills available, sales opportunities identified, win rates
Success statements and testimonial
3.Improve
completion rates and usage
of the global profile system
4.Collect
Observations and Data
Page 9 of 12
Research provided by APQC, the international resource for benchmarks and best practices
Knowledge AnalyticsSM
K03636
©2012 APQC. ALL RIGHTS RESERVED
authoritatively say that the highest utilized experts are the most profitable and that the
expertise location system enables the Deloitte member firms to staff experts a certain number
of days faster, increasing the speed of competitive bids that gain more work for the company. In
Step 7, the team can also use this information to help the business further develop expertise,
identify expertise gaps, and recommend disciplines to hire (by expertise and location).
These two examples of the Knowledge Analytics process illustrate how new insights and
business advantage can come from aligning a KM strategy with a specific business problem,
using multiple sources of information and data, and sharing insights and recommendations with
business management.
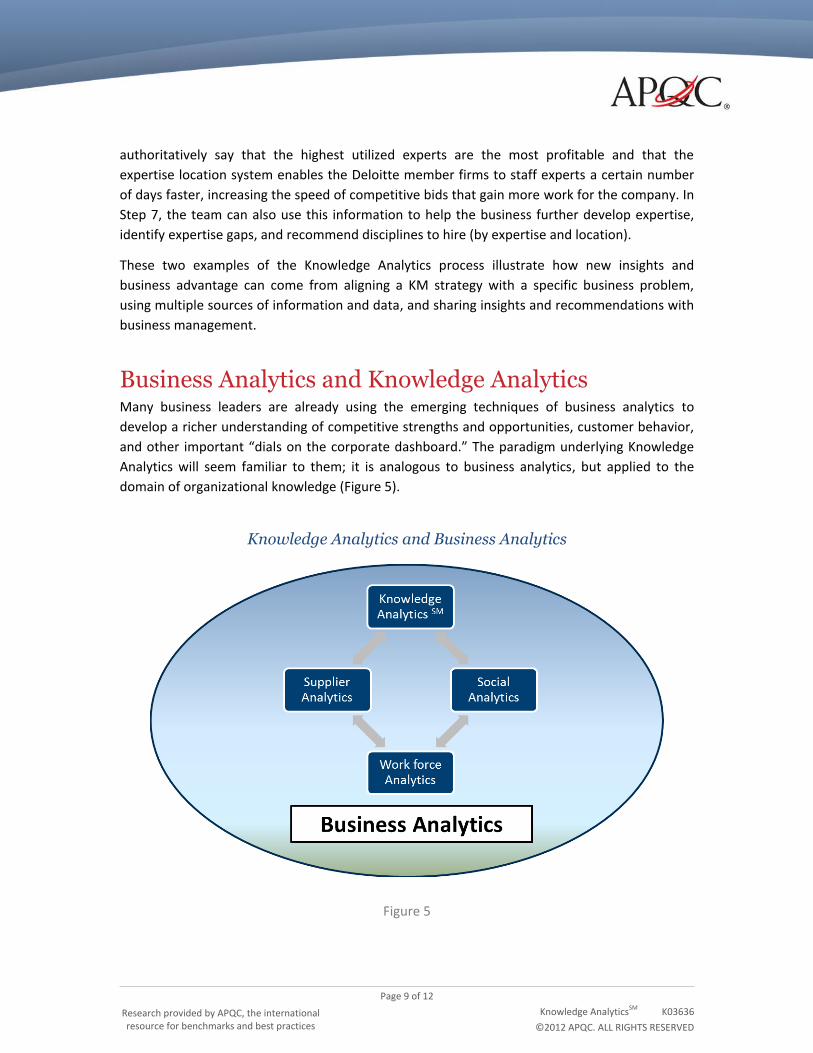
Business Analytics and Knowledge Analytics Many business leaders are already using the emerging techniques of business analytics to
develop a richer understanding of competitive strengths and opportunities, customer behavior,
and other important “dials on the corporate dashboard.” The paradigm underlying Knowledge
Analytics will seem familiar to them; it is analogous to business analytics, but applied to the
domain of organizational knowledge (Figure 5).
Knowledge Analytics and Business Analytics
Figure 5
Page 10 of 12
Research provided by APQC, the international resource for benchmarks and best practices
Knowledge AnalyticsSM
K03636
©2012 APQC. ALL RIGHTS RESERVED
Business analytics mines data for patterns and relationships, identifies key performance signals,
gauges results, determines why a result occurred, and anticipates outcomes. Knowledge
Analytics also combines data from multiple sources and disciplines to support enhanced strategy
and action. Both strive to improve performance and human productivity.
Until now, KM metrics have been missing from business analytics. KM metrics has missed the
insights that come from tapping into and using work force analytics and business process
measures. The Knowledge Analytics process is the missing link strengthening the two.
“A KM team can tap into a wider, corporate knowledge,” said AWG member Tim Stouffer,
knowledge manager, Marathon Oil Co. “You need both Knowledge Analytics and business
analytics to link to corporate drivers.”
What Makes Knowledge Analytics Different? The Knowledge Analytics process draws on best practices in KM, but with some new twists.
It is a simple guide to meaningful conversations with business leaders.
Rather than trying to explain all the details required to make a KM strategy work (which your
business leaders probably don’t want to know), this process is all about the business and
whatever problems leaders want to solve. The Knowledge Analytics process map doesn’t replace
the real development of a KM strategy or implementation plan, but it makes the discussion of
the process and its payoff easier and simpler for business partners to grasp.
It uses business data, as well as KM metrics.
Knowledge Analytics recruits measures and data from other parts of the business (e.g., work
force analytics and demographics, sales and leads pipelines, process-level performance,
operational reporting around projects, and budgets and utilization) to reveal new insights and
support strategic decisions and investments. It also adds another layer of meaning and
sophistication to classic approaches to measuring KM activity and results. (Sophisticated KM
leaders are good at measuring KM activity and collecting evidence of its impact on the business.)
In much the same way that business analytics does for other aspects of the organization,
Knowledge Analytics combines multiple data sources and perspectives to create a richer picture
of how knowledge—and KM—can affect a business process. According to Hartley H. Downs,
Ph.D., technology fellow at Baker Hughes Inc., “Baker Hughes views Knowledge Analytics as an
essential part of KM, which complements and cements our existing program and approaches.
Our KM team is already implementing Knowledge Analytics as a structured methodology within
targeted business units to further demonstrate the return on investment that our KM program
delivers.”
It is hypothesis-driven.
Rather than a lot of hand-waving about how KM and collaboration will “help” the business,
Knowledge Analytics emulates the scientific method: create a hypothesis, set up a way to
Page 11 of 12
Research provided by APQC, the international resource for benchmarks and best practices
Knowledge AnalyticsSM
K03636
©2012 APQC. ALL RIGHTS RESERVED
observe and measure, analyze the data, and finally, figure out what it means you should do.
Better than an academic exercise, Knowledge Analytics poses questions and reveals answers
that KM and business leaders can understand and act on.
Richer insights lead to better decisions.
Of course, linking KM investments to what business leaders care about is a big payoff of using
the Knowledge Analytics process. The biggest payoff, however, may be from deeper insights and
more assured actions to support continuous improvement. Seeing new patterns and new
relationships between people’s behavior and even simple organizational variables (such as
location, function, or employee tenure) should lead to a richer understanding and better and
more confident decisions. It may not be rocket science, but seeing and acting on patterns before
the competition has always been the hallmark of winning organizations.
It’s a way of thinking.
At its heart, the Knowledge Analytics process describes a way of thinking: thinking about why a
selected KM approach makes sense for a business problem, thinking through how one would
measure the impact, and thinking through how to analyze the data and what you might find.
Conclusion These are exciting times for KM. Social media solutions have reinvigorated many programs. We
know best practices to develop and implement a KM strategy. Mobile devices have
revolutionized the way we work. And measurement has gotten more sophisticated. What better
time is there for a leap forward in how we understand KM’s impact on the business? Knowledge
Analytics will provoke great interest and new conversations with business leaders. It will appeal
to both analytical and intuitive types, directly align KM investments and business needs, and
enhance decision making and understanding of how KM can make a difference.
ABOUT APQC
APQC is a member-based nonprofit and one of the leading proponents of benchmarking and
best practice business research. Working with more than 500 organizations worldwide in all
industries, APQC focuses on providing organizations with the information they need to work
smarter, faster, and with confidence. Every day we uncover the processes and practices that
push organizations from good to great. Visit us at www.apqc.org and learn how you can make
best practices your practices.