knowledge management systems in higher education …
TRANSCRIPT

KNOWLEDGE MANAGEMENT SYSTEMS IN HIGHER EDUCATION
INSTITUTIONS IN THAILAND: A HOLISTIC MODEL OF ENABLERS,
PROCESSES, AND OUTCOMES
A Dissertation
by
SURAVEE SUNALAI
Submitted to the Office of Graduate and Professional Studies of
Texas A&M University
in partial fulfillment of the requirements for the degree of
DOCTOR OF PHILOSOPHY
Chair of Committee, Michael Beyerlein
Committee Members, Jia Wang
Lynne Walters
Dan Chiaburu
Head of Department, Fredrick Nafukho
December 2015
Major Subject: Educational Human Resource Development
Copyright 2015 Suravee Sunalai

ii
ABSTRACT
Higher education institutions (HEIs) have applied knowledge management
(KM) to leverage organizational knowledge in support of their institutional
achievements. HEIs need a holistic conceptualization of how KM processes dynamically
interact with KM enablers and outcomes, but seem to typically lack an inclusive KM
model. This research study aimed to develop and test a correlational model linking KM
key enablers and processes to quality performance of HEIs.
Data were collected using an online survey of 142 universities in Thailand with
archival data. A key informant method was used with KM committee members serving
as respondents. The 181 respondents from 60 universities voluntarily participated in the
e-survey. After deleting inadmissible cases, 150 respondents were used as true response
cases.
The exploratory factor analysis (EFA) constructed six scales describing KM
enablers and processes: Technology, Strategic Context, Culture, Leadership with a
Directive Role, Knowledge Transfer, and Knowledge Generation. Then, confirmatory
factor analysis (CFA) with structural equation modeling (SEM) showed that the
hypothesized model with seven factors (six EFA scales and quality performance score)
was acceptable based on the following fit indices ( = 1581.515, df = 845, p < .001;
CFI = .809; TLI = .795; RMSEA = .083, 90% CI: .077 – .089; SRMR = .065). This
hypothesized model adequately represented the actual data set. The thematic analyses
from open ended questions provided emerging themes to support the hypothesized

iii
model that focuses on human-oriented enablers, including leadership, individual
attitudes, and levels of KM understanding.
This study revealed that knowledge becomes a process of individuals’ insights,
experiences, know-how, and values that are to be justified through social interactions
among participants to make knowledge actionable and embedded in institutions’
repositories and routines. Since knowledge requires dynamic management within each
institution’s system, KM provides the activity of creating and sharing knowledge across
the whole system. HEIs require a dedicated position for KM oversight and need to find a
way to enable members to participate in social interaction processes that make
knowledge flow fluently throughout their institutions. With a well-organized KM system
that consists of enablers, processes, and outcomes drawn from this study, KM will keep
on track and stimulate individual, group, and organizational knowledge development and
retention.
iv
ACKNOWLEDGEMENTS
The successful completion of my degree involved the support of my committee
members and the love of my friends and family. First and foremost, I would like to thank
Professor Dr. Michael Beyerlein for acting as my advisor and mentor and for his
guidance throughout my learning process. In my Asian culture, we have a proverb
stating that “a single conversation with a wise man is better than ten years of study.”
What I have learned from Dr. Beyerlein is not only how to strive to advance my research
knowledge and skill, but also how to strive to learn throughout my life. Due to his
constant care and effort, I have finally concluded my journey in obtaining this degree. I
will carry his mentorship as my guidance for my long-term academic career.
Thank you to Associate Professor Dr. Jia Wang, Associate Professor Dr. Lynne
Walters, and Assistant Professor Dr. Dan Chiaburu for the time they spent as committee
members with their standards of excellence. Their willingness to give continuous and
quality feedback far surpassed my expectations. Their suggestions have always been
valuable assistance in improving my research work.
I also want to extend my gratitude to the American Productivity and Quality
Center (APQC) and Dr. Sharimllah Devi Ramachandran, which provided the survey
instruments, to the expert panels for their feedback toward the instrument, and to all
participants from Thai universities who were willing to engage in this study.

v
I thank the Department of Educational Administration and Human Resource
Development (EAHR) and staff who have worked with me over the years. Thank you to
the TAMU Writing Center for tremendous consultations for my writing improvement.
I feel grateful not to travel alone in this journey, but with the compassion and
wishes of numerous people. This journey would never have reached the destination
without the assistance and support of the kind people around me. I owe sincere and
earnest thanks to Montalee Kapilakanchana and Pimkanya Phuong Huynh for being very
wonderful friends. Thanks also goes to Phuong To Tam, Hyounju Kang, and Huyen Van
for making my time at Texas A&M University a great experience. I am obliged to my
boss and colleagues from Dhurakij Pundit University, Associate Professor Dr.
Somboonwan Satyarakwit, Usaroj Dirdjosubroto, and Numpung Aimpalud, who
supported me throughout these 4 years. The financial support of Dhurakij Pundit
University is gratefully acknowledged.
Finally, I would like to express my heart-felt appreciation to my parents, Sophon
Sunalai and Wanwisa Klangsathorn for their love, to my cousins for their constant
support, and to Jaroot Busarathid for his patience and encouragement.
vi
TABLE OF CONTENTS
Page
ABSTRACT .......................................................................................................................ii
ACKNOWLEDGEMENTS .............................................................................................. iv
TABLE OF CONTENTS .................................................................................................. vi
LIST OF FIGURES ........................................................................................................... ix
LIST OF TABLES ............................................................................................................. x
CHAPTER I INTRODUCTION ....................................................................................... 1
Statement of the Problem ............................................................................................... 3 Purpose of the Study ...................................................................................................... 5
Conceptual Framework .................................................................................................. 5 Knowledge Creation Theory ...................................................................................... 5 Organizational Epistemology Theory ........................................................................ 6
Contingency Theory ................................................................................................... 6
Development of Conceptual Framework ................................................................... 6 Significance of the Study ............................................................................................... 9
Theoretical Significance ........................................................................................... 10
Research Significance .............................................................................................. 10 Practical Significance ............................................................................................... 11
Research Questions and Hypotheses ............................................................................ 11 Methodology and Methods........................................................................................... 13
Population and Sample ............................................................................................. 14
Data Collection ......................................................................................................... 14 Data Analysis ........................................................................................................... 15
Definition of Terms ...................................................................................................... 15
Summary ...................................................................................................................... 18
CHAPTER II LITERATURE REVIEW ......................................................................... 20
Definition of Knowledge Management ........................................................................ 20
Distinct Perspectives to Develop Knowledge Management Definition ................... 21 Knowledge Management Definition of This Study ................................................. 26
Relevant Concepts to Knowledge Management .......................................................... 27 Iterative Process ....................................................................................................... 28 Knowledge ................................................................................................................ 30
Learning .................................................................................................................... 35

vii
Organizational Performance ..................................................................................... 40 Conceptual Framework ................................................................................................ 41
Knowledge Creation ................................................................................................. 41 Von Krogh and Roos’s Organizational Epistemology ............................................. 49
Lawrence and Lorsch’s Contingency Theory .......................................................... 51 Development of Conceptual Framework ................................................................. 54
Knowledge Management Components ........................................................................ 59 Knowledge Management Enablers ........................................................................... 60 Knowledge Management Processes ......................................................................... 75
Organizational Performance ..................................................................................... 85
Relationships of Knowledge Management Enablers, Processes, and Organizational
Performance ................................................................................................................. 91 Relationship between Organizational Culture and KM Processes ........................... 91 Relationship between Leadership and KM Processes .............................................. 93 Relationship between Technology and KM Processes ............................................. 95
Relationship between Performance Measurement and KM Processes .................... 97 Relationship between KM Processes and Organizational Performance .................. 98
Knowledge Management in Higher Education in Thailand ....................................... 100 Summary .................................................................................................................... 103
CHAPTER III METHODOLOGY ................................................................................ 106
Restatement of Study Purpose and Research Question .............................................. 106
Research Paradigm and Methodology........................................................................ 111 Method ....................................................................................................................... 113
Population and Sample ........................................................................................... 113
Instrument ............................................................................................................... 115 Instrument development for this study ................................................................... 117
Data Collection ....................................................................................................... 131 Data Analysis ......................................................................................................... 135
Summary .................................................................................................................... 144
CHAPTER IV FINDINGS ............................................................................................ 146
Descriptive Statistics .................................................................................................. 148 Demographic Characteristics ................................................................................. 148 Descriptive Statistics for the Quality Performance Scores .................................... 150 Descriptive Statistics for the Quantitative Items .................................................... 151
Results of Factor Analysis.......................................................................................... 153
Results of Exploratory Factor Analysis .................................................................. 153 Results of Confirmatory Factor Analysis ............................................................... 163
Results of Reliability Analysis ................................................................................... 172 Results of Structural Equation Modeling ................................................................... 172 Results of Thematic Analysis ..................................................................................... 175

viii
Supporting Factors for Successful KM .................................................................. 175 Blocking Factors for Successful KM ..................................................................... 177 Emerging KM Factors from Thematic Analysis .................................................... 180
Summary .................................................................................................................... 187
CHAPTER V SUMMARY ........................................................................................... 189
Discussions ................................................................................................................. 189 Hypothesized Research Models ............................................................................. 189
Contextualized KM Factors of Thai Higher Education Institutions ....................... 200 Implications ................................................................................................................ 204
Implications for Theory .......................................................................................... 204 Implications for Research ....................................................................................... 206 Implications for Practice ........................................................................................ 207
Limitations ................................................................................................................. 210 Recommendations for Future Research ..................................................................... 211 Conclusion .................................................................................................................. 212
REFERENCES ............................................................................................................... 215
APPENDIX A QUESTIONNAIRE .............................................................................. 233
APPENDIX B PERMISSION LETTER TO CONDUCT THE STUDY ..................... 242
APPENDIX C FORM OF PERMISSION TO CONDUCT THE RESEARCH
STUDY ........................................................................................................................... 243
APPENDIX D INVITATION EMAIL TO PARTICIPATE IN THE STUDY ............ 244
APPENDIX E CORRELATION AND COVARIANCE MATRICES OF THE
KNOWLEDGE MANAGEMENT SYSTEM FACTORS ............................................. 245

x
LIST OF TABLES
Page
Table 1 Number of the Survey Items in the Previous Versions and the Modified
Version in This Study ..................................................................................... 119
Table 2 Comparison of the Previous Survey Items and the Modified Items Used in
This Study ....................................................................................................... 120
Table 3 Demographic Characteristics: Type, Mission, and Location of Universities ... 149
Table 4 Demographic Characteristics: Unit of Respondents ......................................... 149
Table 5 Demographic Characteristics: Number Respondents of Each University ........ 150
Table 6 Descriptive Statistics for the Quality Performance Scores ............................... 151
Table 7 Descriptive Statistics for the KM Enablers ....................................................... 151
Table 8 Descriptive Statistics for the KM Processes ..................................................... 152
Table 9 Total Variance Explained of KM Enablers ....................................................... 156
Table 10 Pattern Matrix of KM Enablers ....................................................................... 157
Table 11 Correlation Matrix of KM Enablers ................................................................ 157
Table 12 Total Variance Explained of KM Processes ................................................... 160
Table 13 Pattern Matrix of KM Processes ..................................................................... 161
Table 14 Correlation Matrix of KM Processes .............................................................. 161
Table 15 Fit Indices of the Four Enabler CFA models .................................................. 165
Table 16 Items of the KM Enabler Model ..................................................................... 167
Table 17 Items of the KM Process Model ...................................................................... 171
Table 18 Estimates of Reliability ................................................................................... 172
Table 19 Supporting Factors for Successful KM ........................................................... 176
Table 20 Blocking Factors for Successful KM .............................................................. 178

xi
Table 21 Emerging Themes for KM Influential Factors ................................................ 186
Table 22 Correlation Matrix for Knowledge Management System Analysis ................ 245
Table 23 Covariance Matrix for Knowledge Management System Analysis ................ 245
1
CHAPTER I
INTRODUCTION
Most organizations recognize knowledge as a major resource to obtain and
sustain competitive advantage. Knowledge has become an organizational asset that
increases an organization’s productive and adaptive capabilities (Marquardt, 2011). This
organizational asset increases members’ abilities to improve products, services, and
changes in organizations’ systems and processes. Knowledge helps to stimulate ideas
and actions that result in performance improvement and innovation development.
Knowledge has resided in individuals during doing their jobs over the years.
Knowledge in individuals helps their organizations keep their businesses intact because
employees know product lines, operations, and customers; knowledge of all three assist
a business in achieving its goals (Leonard & Walter, 2005). When individuals leave,
organizations will lose not only their labor force but also their knowledge asset that
evolved for the workplace. This knowledge asset— an intangible organizational resource
in a form of individuals’ insights and experiences— is not easy to develop overnight.
Many organizations strive to retain their knowledge sustainably.
Knowledge management (KM) becomes a management approach to create
knowledge value built in organizational members’ mindsets (Leonard & Walter, 2005;
Nonaka & Takeuchi, 2004). Individuals are a foundation unit in working with
knowledge (O’Dell & Hubert, 2011). KM encourages a management strategy of “getting
the right knowledge to the right people, in the right place, at the right time” (NHS

2
National Library for Health, 2005, p.2) and then ensuring people share and transfer their
knowledge into action to improve their work performance. The primary goal of
managing knowledge is to capture knowledge that serves the needs of employees and the
organization’s strategic goals (O’Dell & Hubert, 2011).
Previous studies indicated that, like other business organizations, higher
education institutions (HEIs) can apply the KM approach to support their performance
achievements (Kidwell, Vander Linde, & Johnson, 2000; Ramachandran, Chong, &
Wong, 2013). HEIs can apply KM to support their missions by aiming at increasing
knowledge-based activities in line with their institutional achievements, particularly the
improvement of quality performance.
KM plays a significant role in quality performance in educational institutions.
The famous international quality award, the Malcolm Baldrige National Quality Award
(MBNQA), sets the KM category as one of the seven criteria for the Education Criterion
Performance Excellence to examine educational organization performance (National
Institute of Standards and Technology [NIST], 2013). This KM category is recognized
as “the brain center for the alignment of the organization’s operations with its strategic
objectives” (NIST, 2011, p.40). KM becomes the practical means that provides a holistic
view to measure, analyze, improve, and manage organizational knowledge (NIST,
2011). This holistic view provides valuable knowledge to enhance organizational
improvement and competitiveness.

3
An effective KM model assists HEIs to implement and monitor their KM
successfully. The KM model provides self-checks of KM enablers and processes that
maximize the HEIs’ capabilities to manage their knowledge assets.
Statement of the Problem
Over the past decade, KM has taken place in various settings, including
businesses, service sectors, and academic sectors. However, few studies have explored
KM in academic institutions (Ramachandran et al., 2013). HEIs are difficult because of
the lack of an inclusive KM application. Firstly, researchers have been studying various
KM enablers and processes. Heisig (2009) and Lehner and Haas (2010) conducted the
latest two KM meta-analysis studies in business. Although these meta-analysis studies
provide a cohesive and comprehensive list of KM enablers and processes, they have a
limited basis of making inferences to the higher education context. Currently, not many
KM research studies, especially research with large samples of academic institutions,
have explored the unified KM processes and key success factors in higher education
(Ramachandran et al., 2013).
Secondly, based on an extensive search of previous publications during 2001-
2014 in Academic Search Complete (Ebsco) and ProQuest, Sunalai and Beyerlein (in
press) found 22 publications that studied the KM application in the higher education
arena. Eighteen publications described outcomes of KM in higher education
performance. Most of these research studies used indirect measures to assess
organizational performance. They used rating-scale surveys to ask respondents’ opinions
about their institutions’ performance. These indirect data were used regardless of actual

4
evidence (Jupp, 2006) that could come in the form of a direct measure. Generally,
various direct measures include scores from a performance management tool, such as
Balanced Scorecard (Rašula, Bosilj Vukšić, & Indihar Štemberger, 2012), and
performance scores assessed by an accrediting agency (Watcharadamrongkun, 2012).
Out of 18 outcome studies, only one study (Watcharadamrongkun, 2012) used the direct
measure of accreditation scores as the representative of KM outcomes.
Finally, HEIs need a holistic conceptualization of how KM processes
dynamically interact with KM enablers and outcomes. During the past decade, only
seven KM research studies in HEIs investigated the relationships of three KM themes—
enablers, processes, and outcomes (Sunalai & Beyerlein, in press). For example, the
most current study by Tan and Noor (2013) proposed a KM–knowledge sharing–
collaboration research model. They also examined KM enablers, including individual,
organizational, technological, and communication influences. Although they studied the
relationship of the three KM themes, their study explored only one organizational
performance aspect— collaboration research, which is a single angle of the multiple
aspects of HEIs’ missions. In addition, another study by Watcharadamrongkun (2012)
examined the institution-wide performance represented by rating and accrediting scores;
however, the KM enablers used in her study were limited to two organizational
interfaces— structure and IT resources. These previous studies have a research gap in
the completeness of the studied variables.
The overall state of KM— enablers, processes, and outcomes— is not inclusive
in the higher education context. HEIs need empirical evidence to guide decisions for

5
better management of KM. The empirical research study helps explore whether or not
and how KM influences HEIs’ performance. This study leads to an understanding of the
effect of KM enablers and KM processes on organizational performance in the context
of academic institutions.
Purpose of the Study
The purpose of this study was to develop and test a correlational model linking
KM enablers and processes on quality performance of HEIs. The outcomes of this study
were twofold: (a) to support the process of HEIs acquiring an inclusive tool to measure
and monitor their KM enablers and processes; and (b) to describe and empirically
support the theoretical construct of how knowledge is dynamically managed within these
institutions.
Conceptual Framework
The assumption of this study was that KM enablers affect KM processes that
then contribute to effective organizational performance. This assumption was guided by
three theories: knowledge creation, organizational epistemology, and contingency. These
three theories focus on two aspects of inquiries: (a) the creation of knowledge at the
individual, group, and organizational levels; and (b) the connectionist approach as a
foundation of organizations’ systems.
Knowledge Creation Theory
The knowledge creation theory aims to understand how knowledge is
dynamically created within an organization (Nonaka & Takeuchi, 2004). This theory
relies on an assumption that knowledge is created through social interactions between

6
tacit and explicit knowledge. Tacit knowledge has a cognitive dimension, such as mental
models and conceptual frameworks (Nonaka, 1991). It can be described as experiences,
know-how, competencies, or skills. Tacit knowledge is difficult to document. In
contrast, explicit knowledge comes in the form of documents, formulas, contracts,
process diagrams, and manuals (O’Dell & Hubert, 2011).
Organizational Epistemology Theory
The theory of organizational epistemology provides a theoretical cornerstone for
a systematic and organization-wide KM model used in organizations. This theory
involves interactions of individualized and socialized organizational knowledge as well
as impediments to organizational knowledge (Dalkir, 2005).
Contingency Theory
The contingency theory is often called the ‘it all depends’ theory (Burke, 2011).
This theory takes the view that the management of an organization depends on
environmental contexts of its organization— internal and external environments
(Lawrence & Lorsch, 1967).
Development of Conceptual Framework
These aforementioned theories provide the lens to develop the conceptual
framework of this study. This conceptual framework (Figure 1), modified from the study
of Watcharadamrongkun (2012), shows the linkage of continuity and dynamism between
a KM system and organizational performance.

7
Figure 1. Conceptual Framework
H. External environment
G. Internal environment
B. KM enabler
- Leadership
- Culture
- Technology
- Performance
measurement
C. Organizational
performance
- Quality assurance
scores
A. KM process
Generate - Codify - Transfer
Tacit Explicit
knowledge knowledge
E. Individual and group
learning
F. Organizational learning D. Learning Organization
Knowledge Creation theory:
Interaction between tacit and explicit
from the individual and group levels to
the organizational level
A, D, E, F
Organizational Epistemology Theory:
Interactions of individualized and socialized organizational knowledge
A, B, C, D, E, F, G, H
Contingency Theory: How it all depends
A, B, C, D, E, F, G, H
8
The KM system reflects how HEIs perform by using the KM approach to
improve their performance. The KM process (A) displays the flow of knowledge in
conjunction with tacit and explicit knowledge. Then KM enablers (B) associated with an
organization can influence KM processes. These enablers include organizational
contingency aspects that involve leadership, culture, technology, and performance
measurement. Organizational performance (C), represented by quality performance
scores, indicates the effectiveness of the organizational management through managing
knowledge.
Proper management of knowledge develops a learning organization (D). HEIs
have looked for ways to continuously transform themselves into learning organizations
in which their individuals and groups can increase their performance improvement
(Marquardt, 2011). A learning organization refers to an organization where members
learn collectively and effectively and that transforms itself for better management
through the use of knowledge across the organization (Marquardt, 2011). According to
Marquardt (2011), learning in organizations can take place at three levels: individual,
group, and organizational (E and F). Individuals are the basic unit of groups and
organizations. Individual learning includes changes in knowledge, attitudes, and skills
acquired through self-study, technology-based instruction, and observation. Group
learning refers to an increase in knowledge, attitudes, and skills accomplished by and
with groups. Organizational learning represents the enhanced intellectual and productive
capacity gained through shared commitment (knowledge, beliefs, or assumptions of
members) to the organization.

9
Although individuals and groups are the agents by which organizational learning
occurs, their learning processes are influenced by a set of internal and external
environments of their organizations. With this interrelated nature, organizational
learning involves the sharing of knowledge, beliefs, or assumptions among individuals
and groups.
Internal and external environments (G and H) are included in this framework.
Other institutionalized aspects are not included in the KM enablers (B), such as
university’s missions, policies, sizes, and types, exist in the organization’s internal
environment. The outside organizational aspects, such as contexts of national culture,
Ministry of Education’s regulations, communities’ requirements, and employers’
expectations toward graduates, exist in the organization’s external environment. These
environmental aspects provide the context for this study. They impact how the HEIs
think and act (Marquardt, Berger, & Loan, 2004). The environmental aspects are
recognized, but they are not focal points of this investigation.
Significance of the Study
This study was primarily conducted in the field of Human Resource
Development (HRD). HRD is defined as “a process for developing and unleashing
human expertise through organization development and personnel training and
development for the purpose of improving performance” (Swanson & Holton, 2001, p.
4). The purpose of HRD in this study focused on the learning improvement of
individuals who contribute their competencies to organizational performance (Yang,
2004). Competencies in employees were primarily developed through learning processes

10
to improve work performance, which impacted the organization’s development. Thus,
two major links between KM and HRD were learning and Organization Development
(OD). This study viewed learning as a process of creating knowledge in a workplace,
while OD was viewed as an improvement at the organization level. The significance of
this KM study in higher education within the context of HRD was discussed regarding
theory, research, and practice.
Theoretical Significance
This KM study expanded the current scope of HRD theories. First, this study
captured how learning at individual, group, and organizational levels contributed to
institutions’ performance through the creation of knowledge. It described and
empirically supported the theoretical construct of how knowledge was dynamically
created, shared, and used within these institutions through various learning processes.
Therefore, the findings of this study proposed the values of learning in the KM field to
extend the boundary of HRD theories.
Second, this study provided empirical content to explain the linkage of continuity
and dynamism between three KM elements (enablers, processes, and outcomes). With
the organizational lens, these findings contributed to a comprehensive OD approach that
involves an interaction of organizational components (i.e., leadership, organizational
culture, technology, KM processes, and performance scores).
Research Significance
Concerned with the research significance, this study applied quality assurance
scores, one type of performance rating score, to represent the variable for organizational

11
performance. At present in the academic institution research, there is only one study, by
Watcharadamrongkun (2012), related to the KM field that applied the performance
rating scores as representative outcomes. This study suggested the application of quality
assurance scores as the alternative organizational performance outcome for further OD
research studies in other settings.
Practical Significance
The practical significance of this study was twofold. The first practical
significance involved individual development. This study may increase an understanding
of KM by recognizing institutions’ performance as a part of the impact of individual and
group learning. The understanding of the KM contribution may help HEIs better plan
and implement individual and group learning efforts.
The second practical significance contributed to OD. The nature of KM offers a
learning environment that enhances a commitment to lifelong learning in the institutions
(Keeley, 2004). In the OD context, KM can shift an organization’s learning paradigm to
becoming a learning organization (Ramachandran et al., 2013). HEIs can use the
proposed model from this study not only for better conducting their KM systems but also
for transforming them to a learning organization.
Research Questions and Hypotheses
The research purpose of this study was to develop and test a correlational model
linking KM enablers and processes to HEIs’ outcomes. The assumption was that KM
enablers affect KM processes that contributed to effective organizational performance.
Thus, the research model was designed to represent the relationship between KM

12
enablers and processes and the relationship between KM processes and quality assurance
performance scores to measure the impact of KM on organizational performance. This
led to a research question as follows:
How do KM enablers and KM processes affect performance of HEIs?
This overarching question was supported by several research hypotheses (see
Figure 2). These hypotheses were described more closely in the review of literature. The
hypotheses were the following:
H1.1 Organizational culture will correlate positively and significantly with KM
processes.
H1.2 Leadership will correlate positively and significantly with KM processes.
H1.3 Technology will correlate positively and significantly with KM processes.
H1.4 Performance measurement will correlate positively and significantly with
KM processes.
H1.5 KM processes will correlate positively and significantly with
organizational performance scores.
13
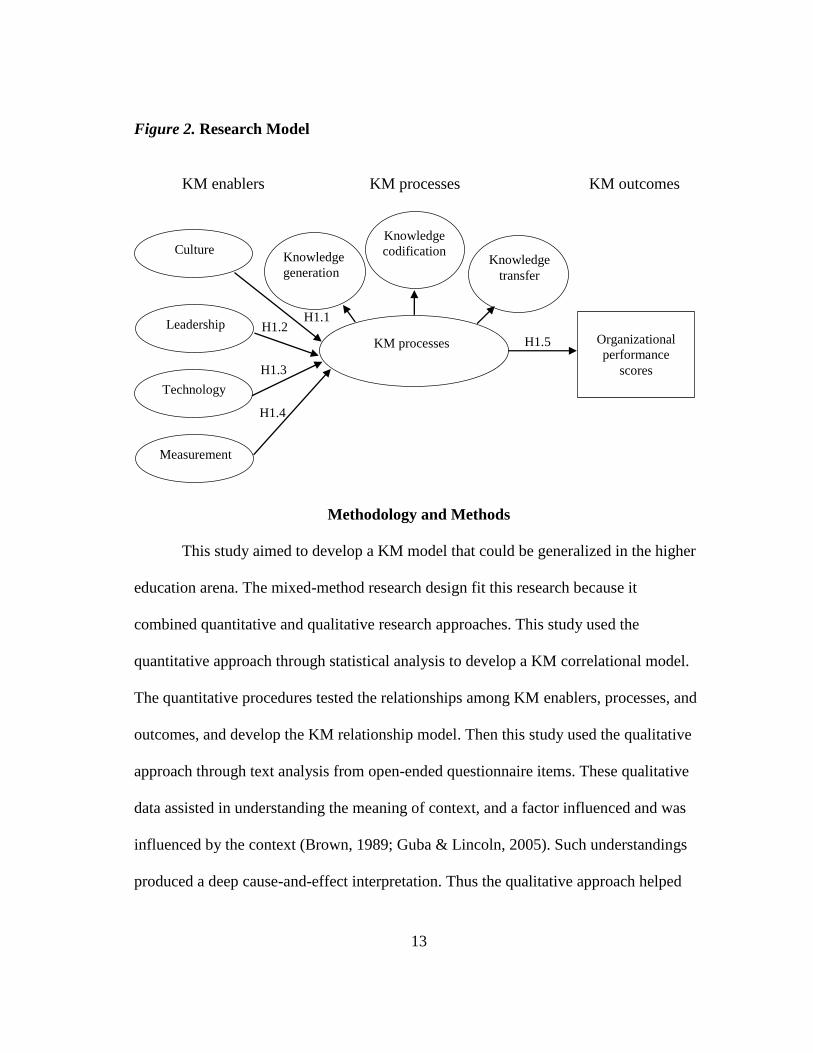
Figure 2. Research Model
KM enablers KM processes KM outcomes
Methodology and Methods
This study aimed to develop a KM model that could be generalized in the higher
education arena. The mixed-method research design fit this research because it
combined quantitative and qualitative research approaches. This study used the
quantitative approach through statistical analysis to develop a KM correlational model.
The quantitative procedures tested the relationships among KM enablers, processes, and
outcomes, and develop the KM relationship model. Then this study used the qualitative
approach through text analysis from open-ended questionnaire items. These qualitative
data assisted in understanding the meaning of context, and a factor influenced and was
influenced by the context (Brown, 1989; Guba & Lincoln, 2005). Such understandings
produced a deep cause-and-effect interpretation. Thus the qualitative approach helped
H1.2
H1.4
H1.3
Leadership
H1.5
Measurement
Technology
Culture
H1.1
Knowledge
generation Knowledge
transfer
KM processes
Knowledge
codification
Organizational
performance
scores

14
develop the proposed KM model more contextually. The research procedures were
briefly explained below.
Population and Sample
The population for this study consisted of 142 Thai higher education institutions
(Bureau of Standards and Evaluation, 2015). The sample was 60 HEIs that granted the
researcher permission to conduct the study. The unit of analysis was a university.
At least one key informant from each university was the targeted respondents to
provide information at the organizational unit of analysis by reporting on behalf of their
institutions. Key informants in this study were members of the KM committees who
were responsible for managing the KM system at the institutional level.
Data Collection
Data came from two resources: a questionnaire survey and an archival source. A
questionnaire survey in online version was provided for key informants in each
institution. Archival data consisted of the QA performance scores from the Ministry’s
published database.
The questionnaire included four sections: institutional demographic information,
KM enablers, KM processes, and open-ended questions. This study adapted the
Knowledge Management Assessment Tool (KMAT), a widely recognized KM tool used
in industry across countries, to collect the data for the HEI KM enablers and processes.
Open-ended questions was included to ask the respondents to describe the internal
factors that significantly support or block successful KM. These data provided both
unique and contextual understandings of the state of KM in each university.

15
The second resource, called archival data, was derived from the QA scores from
the academic year 2014 from the Bureau of Standards and Evaluation, the Commission
of Higher Education (CHE) in Thailand. This study examined the archival data because
these data were publicly available on the Commission’s database called the CHE QA
online system and they were expected to have better accuracy than the survey responses
for QA data. Moreover, the archival data method could reduce the response burden for
respondents to providing the QA scores.
Data Analysis
For the quantitative analysis to test a correlational model linking KM enablers
and processes on organizational quality performance, this study used descriptive
statistics, path analysis, exploratory factor analysis (EFA), and Confirmatory Factor
Analysis (CFA) with structural equation modeling (SEM). SEM analyzed the overall
model with the actual data set collected from the survey and the archival data to identify
how well the model fit with these data. If the hypothesized model captures the data, this
model can indicate the relationship of variables (Meyers, Gamst, & Guarino, 2013).
Qualitative analysis involved a variety of coding, categorizing, and assigning meaning to
the collected data.
Definition of Terms
This glossary defined a set of terms related to variables of this study. Each term
included related and sequential meanings relevant to KM. These definitions were useful
for developing a common understanding of the subject necessary for this research.

16
KM enablers refers to influential factors for managing knowledge efficiency and
effectively (Gold, Malhotra, & Segars, 2001). Four enablers in this study includes
organizational culture, leadership, information technology, and performance
management. This study used this set of KM enablers from the KMAT tool by the
American Productivity and Quality Center (APQC) because it denotes two major
categories with a focus on human-oriented and organization-oriented factors that are able
to lead to a foundational understanding of the entire KM system of any organization.
KM processes involves an organization’s activities that manage a flow of
knowledge throughout an organization (Heisig, 2009). This study applied the KM
processes from the KMAT tool by APQC. The KM processes operate through three
types of activities: generation, codification, and transfer. These three activities assist
institutions in planning, implementing, and assessing of how well they manage
knowledge.
Knowledge is a cognitive process of individuals’ insights, experiences, know-
how, and values (Dalkir, 2005) that are to be justified through social interactions among
participants (Nonaka & Takeuchi, 2004) to make knowledge actionable and embedded
in institutions’ repositories and routines (Davenport & Prusak, 1998).
Knowledge codification is the activity of embedding knowledge by transforming
tacit and explicit knowledge back and forth into organizational knowledge (Nonaka,
1991; Wiig, 1993). This embedded organizational knowledge, then, is made accessible
so that organizational members can clearly understand and easily retrieve it (Coukos-
Semmel, 2002; Ramachandran et al., 2013; Wiig, 1993). It aims to give permanence to

17
knowledge that may exist in forms that could be shared, stored, and combined to retain
essential knowledge (Dalkir, 2005).
Knowledge generation refers to the activity of acquisition and development of
knowledge (Ramachandran et al., 2013; Shoham & Perry, 2009). Knowledge generation
has a purpose to build needed knowledge for the use of an organization.
Knowledge management (KM) is defined as an iterative process of handling
actionable knowledge that results from individual, group, and organizational learning to
improve organizational performance. This definition is influenced by (a) the integration
of the economic and cognitive perspectives, and (b) the interactions between individuals,
groups, and organizations when learning. This study focused on an intellectual capital as
an organizational asset that can be managed. Then it finds a way to gain organizational
actionable knowledge from the learning interactions between individuals, groups, and
organizations through managing the flow of knowledge.
Knowledge transfer represents sharing and distributing of knowledge between an
organization’s members (Aujirapongpan, Vadhanasindhu, Chandrachai, & Cooparat,
2010; Shoham & Perry). It aims to apply knowledge to individuals’ daily work that is
embedded in organizational operations.
Leadership involves leaders’ abilities to align KM with an organizational
strategy and operations (Coukos-Semmel, 2002; Golden, 2009; Lee, 2007), promote
values of KM (Arntzen, Worasinchai, & Ribière, 2009; Chumjit, 2012), and encourage
individuals’ learning to create individual, group, and organizational knowledge (Tan &
Noor, 2013).

18
Organizational culture refers to an organizational environment and a behavioral
pattern (Lee, 2007) that enables individuals and groups to learn and share their
knowledge within an organization.
Organizational performance implies an integrated view of KM outcomes that
results from managing organizational knowledge (Yoopetch, 2009). Organizational
performance indicates the quality and effectiveness of the overall process of HEIs. This
study used performance scores as the representative of institutional performance
assessment.
Performance measurement refers to the collection of information about the
efficiency and effectiveness of KM processes when managing the flow of knowledge
(Lee, 2007; Ramachandran et al., 2013) and the productivity of individuals and
organizations that results from the KM implementation (O’Dell & Hubert, 2011).
Technology refers to tools and processes that facilitate and sustain individual and
collective activities (Marquardt, 2011) to help manage the flow of knowledge throughout
an organization (Gold et al., 2001).
Summary
Chapter I provided an overview of this KM research study. It started with the
introduction of what and why the research topic should be studied. In the last decade,
KM has received a great deal of attention from scholars in various settings, including
business, service, and academic sectors. However, few studies have explored KM
implementation in the higher education context. HEIs are difficult because of the lack of
an inclusive KM application. These institutions need a holistic conceptualization of how

19
KM processes dynamically interact with KM enablers and outcomes. Thus, the purpose
of this study was to develop and test a correlation model linking KM enablers and
processes to organizational quality performance of HEIs.
Chapter I also provided the conceptual framework that includes three theories
(knowledge creation, organizational epistemology, and contingency) in relation to the
creation of knowledge and the connectionist approach. This KM study in higher
education intended to contribute to the HRD field covering its theory, research, and
practice. It used the mix-method approach as its research methodology. Both quantitative
and qualitative research methods were employed to collect data from 60 universities in
Thailand.
Finally, chapter I presented delimitations and limitations to gain an
understanding of the boundaries and the uncontrollable influences in conducting the
study. It also defined the terms used in this study.
The next chapter offered a review of the literature related to KM. The first and
second sections identified definitions of KM and its relevant concepts that assist in
developing the KM definition of this study. Then the third section elaborated the
conceptual framework. The fourth section discussed three KM components: enablers,
processes, and organizational performance. Finally, the last section summarized previous
research results regarding the relationship of the three KM components.

20
CHAPTER II
LITERATURE REVIEW
Chapter II provided literature relevant to a KM definition, a conceptual
framework, and related constructs that lead to a hypothesized model. The extensive
search, based on key words, was conducted on electronic databases, including Academic
Search Complete (Ebsco), ProQuest, and Google Scholar, to summarize, assimilate, and
synthesize the scholarly literature. Chapter II explained the development of the KM
definition and its relevant concepts, including iterative process, knowledge, learning, and
organizational performance. Literature sources in KM and higher education studies were
scanned to identify the conceptual framework. This process was followed by illustrating
the essence of KM enablers, processes, and organizational performance, which are the
focus of this study. Finally, the explanation of KM in Thai HEIs was provided to gain an
understanding about its context.
Definition of Knowledge Management
This section explains the development of KM definitions from various
perspectives. Each perspective has its own assumption that guides the understanding of
rationales of KM definitions. Furthermore, this section brings up various related
concepts in the field of KM, such as knowledge, learning at different levels, and learning
organization, to better understand the essence of KM. These terms are elaborated to
provide an insight of the connection of these terms and KM.

21
Distinct Perspectives to Develop Knowledge Management Definition
The definition of KM has been controversial with respect to its complex nature
(Lee, 2007). The multidisciplinary roots of KM are enumerated, including organizational
science, information technology, information and library science, education and training,
and sociology. Dalkir (2005) asserted that the multidisciplinary nature of KM represents
“a double-edged sword” (p. 6). He explained that the diversity of KM provides an
advantage because it is not too difficult for anyone to find a familiar foundation based on
their backgrounds. For example, someone with technical database backgrounds can
easily use their skill sets to design and implement knowledge repositories that will serve
as the corporate memory for their organizations. In contrast, the multidisciplinary field
of KM also presents some challenges due to its boundaries. Dalkir (2005) further noted
that “KM is not and cannot be said to be a separate discipline with a unique body of
knowledge” (p. 7). Some scholars view KM just as the management of information or
the application of new business practices. Thus it is necessary to be able to describe what
KM is. This description assists in constituting KM both as a discipline and as a field of
practice, which distinguishes KM from other fields.
Although there has been a lack of consensus over a global definition of KM,
there is a widespread agreement to the goal of KM. Many scholars admit that the
common goal of KM is to leverage knowledge posed in an organization to an
organization’s advantage (Dalkir, 2005). KM represents a systematic approach to ensure
the maximized utilization of knowledge, together with the potential of individuals’ skills,
22
competencies, and ideas to create a more efficient and effective organization (Dalkir,
2005).
KM has been broadly applied not only for the business sector, but also for the
higher education arena. The goal of KM in academic institutions also relates to the
management of knowledge to achieve an institution’s advantages (Coukos-Semmel,
2002; Mohayidin, Azirawani, Kamaruddin & Margono, 2007; Yusoff, Mahmood, &
Jaafar, 2012). These advantages cover the achievement of higher education missions
(teaching, conducting research, and community servicing) and improvement of
organization management (developing strategic plans and improving decision making
processes).
The review of the existing KM literature in higher education suggests that
various KM definitions can be categorized into three distinct perspectives: economic,
cognitive process, and information management (Lee, 2007; McCarthy, 2006; Wiig,
1993). Each perspective leads to underlying assumptions of each KM definition. The
three perspectives are described below.
Economic perspective. The economic perspective originated from the traditional
notion of economic resources, including land, labor, and capital (Wiig, 1993). One type
of economic capital includes knowledge, which is recognized as an integral part of
intellectual capital. From the viewpoint of the economic perspective, KM definitions
involve the management of intellectual capital (Dalkir, 2005; Wiig, 1993). Intellectual
capital is an intangible organizational resource that represents an individual’s insight and
experiences (such as contextual information, opinions, and stories) owing to its emphasis
23
on actionable knowledge and know-how (Dalkir, 2005; Wiig, 1993). Some KM
definitions in higher education research influenced by the economic perspective include:
a) “The management of an organization’s knowledge resources” (Yusoff et al.,
2012, nd.).
b) “KM is related to a view advancing the organization goals by exploring and
enhancing the asset of an organization, i.e., knowledge” (Rahimi,
Arbabisarjou, Allameh, & Aghababaei, 2011, p. 19).
c) “The combination of processes of creating, capturing, and using knowledge
to enhance organizational performance” (Coukos-Semmel, 2002, p. 30-31).
d) “Locating and identifying all of the concealed and open knowledge assets of
an organization so that they can be used to attain the organization’s goals”
(Shoham & Perry, 2009, p. 244).
e) “A range of practices used by organizations to generate, store, and
disseminate knowledge for reuse, especially in research, teaching and
learning, decision making and others” (Mohayidin et al., 2007, p. 311).
f) “A key facility that a research university requires in order to provide a
conducive environment for research and innovation” (Tan & Noor, 2013, p.
253).
These KM studies, which used the economic perspective to underlie their KM
definitions, view knowledge as a key element for increasing an institution’s productivity
and efficiency. Consequently, KM has become one of the strategic solutions to achieve
effective organizational performance.

24
Cognitive process perspective. The second perspective focuses on the cognitive
process of knowledge creation at individual, group, and organizational levels. Related
KM definitions are presented below.
a) “All personnel, facilities, and services associated with the creation,
processing, and distribution of knowledge that an organization or its members
possess and obtain” (Lee, 2007, p. 38).
b) “A systematic process of gathering, organizing, sharing and analyzing
knowledge in terms of resources, documents and people skills within and
across an organization” (Watcharadamrongkun, 2012, p. 9).
c) “An integrated and collaborative approach to the creation, organization,
access, and use of cumulative knowledge that an organization possesses
among its people, records, and documents. It addresses the actions that an
organization should take to derive the greatest value from the experience and
understanding of its people as well as from other internal and external
sources.” (Keeley, 2004, p. 2).
d) “A conscious strategy of putting both tacit and explicit knowledge into action
by creating infrastructure and learning cycles that enable people to
collectively use the knowledge of the enterprise” (American Productivity and
Quality Center, 2000, p. 1).
e) “A systematic process of connecting people to people and people to the
knowledge and information they need to effectively act and create new
knowledge” (American Productivity and Quality Center, 2003, p. 8).

25
These aforementioned research studies investigate how knowledge is created,
shared, and used between and among individuals within an organization. Individuals and
their interactions become focal points of managing knowledge. The KM definitions of
these studies highlight that knowledge depends on organizational members who create,
share, and use it (Lee, 2007).
Information management perspective. Information management assumes that
KM enhances the use of organizational knowledge through the management of
information (Lee, 2007). An organization is responsible for cultivating usable
knowledge and making it readily accessible across an organization (McCarthy, 2006).
KM definitions under this category are termed as follows:
a) “Organizational processes that seek synergetic combination of data and
information processing capacity of information technologies, and the creative
and innovative capacity of human beings” (McCarthy, 2006, p. 15).
b) “The process of creating, capturing, and using knowledge to enhance
organizational performance, such as documenting and codifying knowledge
and disseminating it through databases and other communication channels”
(Golden, 2009, p.19-20).
These KM definitions involve the technological processes of transforming data
and information into knowledge. With the information management perspective,
knowledge refers to a set of transformed information that is made available in a usable
form. Then, knowledge enables an organization to learn and adapt to its changing
environment.

26
The three perspectives provide the description of the nature of KM. Although
KM is increasingly being viewed as the management of an organization’s intangible
resources (intellectual capital, data, or information), each perspective has unique
characteristics that influence the development of KM definitions.
Knowledge Management Definition of This Study
The KM definition of this study uses an integration of the economic and
cognitive perspectives. It focuses on intellectual capital as an organizational asset that
can be managed. Intellectual capital is defined as the possession of knowledge, applied
experience, and professional skills that provide organizations with value and a
competitive advantage (Coukos-Semmel, 2002). Normally, intellectual capital is based
on the process of exchanging knowledge within a workplace (Wiig, 1993). This process
makes an organization’s focus shift from the building of information systems to the
development of learning at the individual, group, and organizational levels (Dalkir,
2005). Rather than viewing KM as the process of summing the information held by an
organization’s employees, the KM definition of this study attempts to find a way to gain
organizational knowledge from employees’ learning. It focuses on the learning
interactions between individuals, groups, and organizations through managing the flow
of knowledge.
From a viewpoint of the KM contribution, KM is expected to properly function
so organizational members and organizations have abilities to use knowledge effectively
to improve job performance and increase productivity. Effective KM should have the
following characteristics: (a) all knowledge assets available in an organization are put to

27
optimum use, (b) everyone can access the best knowledge at every place and time when
they require, (c) crucial knowledge is converted into the form of understandable
processes and structures, (d) knowledge is used successfully in the development of
innovative products, services, and process, (e) individual learning experiences (positive
and negative) are turned into knowledge and made available to others who can make use
of them, and (f) there is a platform of lessons learned and best practices (Van der Spek &
Spijkervet, 1997). These characteristics show how usable and accessible knowledge
results from the interaction processes between organizational members through the
leveraging of knowledge possessed by individual into organizational knowledge.
A good definition of KM should incorporate the managing of knowledge flow,
coupled with the valuing of intellectual capital (Dalkir, 2005). The two underlying
perspectives and the KM characteristics influence the development of the KM definition
of this study. The term KM in this study is defined as an iterative process of handling
actionable knowledge that results from individual, group, and organizational learning to
improve organizational performance.
Relevant Concepts to Knowledge Management
The KM definition of this research study is constituted with multiple concepts,
including an iterative process, knowledge, learning, and organizational performance. The
key concepts drawn from the proposed definition can be explained as the following
(Figure 3).

28
Figure 3. Concepts Related to Definition of Knowledge Management
Iterative Process
An iterative process, influenced by a process-orientation, consists of a
reoccurring sequence of activities, with previously completed activities being repeated as
subsequent activities (Rubenstein-Montano, Liebowitz, Buchwalter, McCaw, Newman,
Rebeck, 2001). In the KM field, Nonaka (1991) is a scholar who developed his theory
with the process-oriented approach. He noted that organizational knowledge originates
from the iterative process of articulation (also known as externalization) and
internalization. Articulation occurs when organizational members’ tacit (uncodified)
knowledge is captured as explicit (codified) knowledge. Internalization occurs when this
captured explicit knowledge is then transformed into another employee’s tacit
knowledge. Organizational knowledge occurs through the intersection of tacit and

29
explicit knowledge during the interaction of organizational members. Nonaka’s cycle is
an iterative process directed by the interactions of the knowledge transformation.
KM becomes an iterative process when organizational members acquire, create,
store, share, use, and assess knowledge repeatedly over time. This study has an
underlying assumption that knowledge should flow within institutions through the
iterative process. The iteration occurs through dynamic and interrelated KM activities
consisting of creating, storing, sharing, and using through the support of assessing
This iterative KM cycle includes six activities (Sunalai & Beyerlein, in press).
Acquire combines the accessibility, collection, and assimilation of acquired knowledge.
Create involves the development of new knowledge or the replacement of existing
knowledge. Store is the embedding and categorization of knowledge so that
organizational knowledge can be easily retrieved. Share refers to the sharing and
distributing of knowledge between an organization’s members. Use aims to apply
knowledge to individuals’ daily work embedded in organizational operations. Assess
includes two purposes—to provide the opportunity to reflect the use of shared
knowledge and to evaluate the effectiveness of an overall KM process. The detailed
explanation of KM processes will be discussed in the KM process section.
The management of knowledge is iterative in that it involves the refinement of
the ongoing knowledge activities by the repetitive application of the activities. The
refining process assumes an ongoing need for iterative improvement. The KM definition
of this study is viewed as an iterative process that aims to assist an organization in
performing better management of knowledge for its continual improvement.

30
Knowledge
Investigating the definition of knowledge is essential because it lays out the
boundary of knowledge, which is aligned with the implementation of KM initiatives.
Since scholars do not have a single definition of the knowledge term, reviewing the
literature suggests that a way to understand this term is to explore perspectives that guide
the development of its definition.
Distinct perspectives to define knowledge. The development of the knowledge
term draws from various perspectives, and its definition can be categorized into three
categories: economic, cognitive process, and semantic distinction. The first two
categories are similar to the category of the KM definitions, whereas the last category
focuses on the comparison with other similar terms.
Economic perspective. As mentioned in the KM definition section, the definition
of knowledge can also be discussed with respect to the economic perspective.
Knowledge is perceived as a valuable asset or intellectual capital. Some scholars claim
that knowledge is not just another resource alongside traditional resources (production,
land, and labor); rather, it is the most meaningful resource in today’s workforce
(Drucker, 1994). Based on the economic perspective, knowledge has become more
valuable than traditional resources (Dalkir, 2005; Drucker, 1994). Given its importance
as an asset, many organizations are interested in managing knowledge to maximize it for
better advantage of an organization.
Cognitive process perspective. The cognitive process perspective emphasizes
that knowledge results from social interaction processes. This perspective defines

31
knowledge as “the insights, understandings, and practical know-how that [individuals
and organizations] possess” (Dalkir, 2005, p. 5). Nonaka and Takeuchi (2004) are
widely recognized as scholars who influenced the development of the knowledge term in
relation to the cognitive process. Their publication about knowledge creation has been
cited over 3,000 times, according to Google Scholar database in November 2014.
Nonaka and Takeuchi (2004) studied how knowledge is created at an individual level by
examining the notion of tacit knowledge. To them, knowledge is a cognitive process of
individuals’ thoughts and experiences that are to be justified through social interactions
between tacit and explicit knowledge. They endorse knowledge as an organizational
resource, and also acknowledge the social interactions between and among individuals to
create knowledge.
Semantic distinction perspective. In order to better understand the essence of
knowledge in KM studies, it is important to compare it with other similar terms that
consist of data and information. These terms have often been used interchangeably,
without clear distinctions. The comparison can clarify semantic confusions and create
consistency in the definition of knowledge (Lee, 2007).
Davenport and Prusak (1998) made distinctions between data, information, and
knowledge. Data are sets of discrete and raw materials about events. Information
normally represents a form of a document or an audible or visible communication that
can impact decision making. Data become information when people add meaning to
them through the process of contextualization, categorization, calculation, correction,
32
and condensation. The complete definition of knowledge defined by Davenport and
Prusak (1998) is as follows:
A fluid mix of framed experience, values, contextual information, and expert
insight that provides a framework for evaluating and incorporating new
experiences and information. It originates and is applied in the minds of knowers.
In organizations, it often becomes embedded not only in documents or
repositories but also in organizational routines, processes, practices, and norms
(p. 5).
In sum, knowledge refers to a set of transformed information that offers a
framework to examine, evaluate, and link new experiences.
The three perspectives help establish the boundary of knowledge definitions.
They provide the inquiries that scholars can use to conduct a knowledge study in various
fields. A clear understanding of studied terms, such as knowledge, is essential because it
guides researchers or scholars to accurately comprehend the nature of the terms.
Type of knowledge. Another distinguishing characteristic of knowledge can be
viewed by its forms. Knowledge exists in two forms: explicit and tacit. The statement of
Michael Polanyi (1997, p. 144), “We can know more than we can tell” portrays the
sound explanation of tacit knowledge. According to Nonaka (1991) tacit knowledge is
highly personal and has a cognitive dimension, such as mental models and conceptual
frameworks. It can be described as experiences, know-how, competencies, or skills. In
short, it is personal knowledge residing in individuals’ heads. This type of knowledge is
difficult to formalize, articulate, and document.

33
In contrast, explicit knowledge is formal and systematic (Nonaka, 1991). Explicit
knowledge holds a form of written knowledge, such as documents, formulas, contracts,
process diagrams, and manuals (O’Dell & Hubert, 2011). It is easily codified,
communicated, and shared.
Observations drawn from definitions of knowledge. Regarding the literature
review on the definitions of knowledge, the following observations are drawn:
a) Some previous studies used the terms knowledge and information
interchangeably. These two terms have natural differences. Information comes in the
form of transformed data while knowledge is the set of information derived from
individuals’ competencies, insights, experiences, know-hows, and values. Knowledge is
a high-value form of information (Coukos-Semmel, 2002). If an organization uses these
terms interchangeably, the management of knowledge will be conducted with different
purposes. Using the term knowledge with the meaning of information can change the
purpose of managing knowledge (Lee, 2007). It manages information in a computer-
based information processing system rather than knowledge from individuals’ insights.
If these two terms are used similarly, the differences between “knowledge management
and information management [will] be negligible” (Lee, 2007, p. 29).
b) Humans become the focal point of the creation of knowledge. Many studies
are interested in the interactions of organizational members at the individual, group, and
organizational levels. These members play their roles in KM in terms of creating,
sharing, and using knowledge across an organization. Thus, knowledge is created and
applied in their minds. Knowledge becomes embedded not only in organizational

34
documents or repositories, but also in organizational routines, practices, and norms
(Davenport & Prusak, 1998). The latter form is considered more unique for each
organization, because it is contextual knowledge that has evolved over the years and
then has resided in individuals’ and organizations’ behaviors (Davenport & Prusak,
1998). Consequently, many organizations have attempted to find a way to improve
individuals’ interaction processes that enhance the flow of knowledge throughout their
organizations.
Knowledge definition of this study. The definition of knowledge in this study is
influenced by the economic perspective and the cognitive process. This study recognizes
knowledge as an intellectual resource that is a result from individuals’ competencies.
Consequently, the definition of knowledge in this study involves intellectual capital that
is a combination of individual insights, experiences, know-how, and values that have
potential to improve individual and organizational performance.
Connection of knowledge management and knowledge. KM contributes to the
transformation of information into knowledge. Davenport, Harris, De Long, and
Jacobson (2001) explored a process of knowledge formation in an organization. They
found that information exists in the form of raw data, then organizational members
transform raw data into information by assigning it values. KM plays a role in this
process. It assists individuals and organizations in transforming information into
knowledge by analyzing causes and trends and by drawing conclusions. This
transformation makes information more usable for an organization. Knowledge in the
minds of organizational members is an organization’s most valuable resource. If an

35
organization manages it efficiently, knowledge may transfer into intellectual capital so
that the organization can use it to be more productive and competitive (Coukos-Semmel,
2002).
Learning
This study views learning as a process of creating knowledge in a workplace.
The essence of learning needs to be discussed to provide a clear understanding of
relationships between learning and the management of knowledge, which is a result from
individual, group, and organizational learning. The literature of learning shows that a
wide variety of the learning definitions exist. Researchers have explored how particular
identities of learning are created and how learning processes are involved. This study
discusses its definition and contribution to an organization with multiple levels.
Definition of learning. Scholars define learning as a process of gaining
knowledge through developing (Sun, 2003). This term consists of three components:
process, knowledge, and developing. The learning definition by Merriam, Caffarella, and
Baumgartner (2007) addresses to two components of learning— process and developing.
They stated that “learning is a cognitive process internal to the learner; it is what the
learner does in a teaching-learning transaction, as opposed to what the educator does.
Learning also includes the unplanned, incidental learning that is part of everyday life”
(p.6). With their statement, learning includes a cognitive process of development that
combines planned and unplanned activities taking place in individuals’ daily lives.
Learning in this context is treated as processes from formal and informal developing
activities. It is embodied not only in conscious cognitive activities, but also in everyday
36
practices, actions, and conversations (Fenwick, 2008). The third component, knowledge,
is a result of learning that refers to a change in an individual. This study views
knowledge as a change in an individual’s insights, experiences, know-how, and values.
The occurrence of learning has become an interesting issue over the years.
Learning can occur through diverse aspects— “learning is active, constructive, goal-
oriented, cumulative, self-regulated, [and] situated and collaborative” (Sun, 2003, p.
154). Learning is active and constructive because individuals do not passively learn.
This means that acquiring knowledge involves a mindful activity that requires efforts
and cognitive processes from learners. Learners actively construct their knowledge
through interactions with their environment and through reorganizations of their own
mental structures. Learning is goal-oriented because effective learning is motivated by
an explicit awareness of individuals’ goals. Learning results from a cumulative process
with respect to formal and informal knowledge. Learning has a self-regulated nature.
Learners manage and monitor their own knowledge acquisition. Learning involves
situated and collaborative processes. It occurs in an interaction with social and cultural
contexts through processes of communication, collaboration, and negotiation.
Levels of learning in organizations. Marsick and Watkins (1994) mentioned
that learning results in individuals’ changes in knowledge, beliefs, and behaviors. They
stated that learning involves a social process and occurs at individual, group, and
organizational levels.
Marquardt (2011) also supported Marsick and Watkins’s statement. Learning in
organizations can occur at three levels, and they depend on each other. Individuals are

37
the basic unit of groups and organizations. Individual learning includes changes in
knowledge, beliefs, and behaviors acquired through self-study, technology-based
instruction, and observation. Individual learning impacts the continual transformation of
an organization because it enhances an organization’s capability. Group learning refers
to an increase in knowledge, beliefs, and behaviors accomplished by and with groups.
Groups learn to generate knowledge by analyzing complex issues, solving problems
collectively, and taking innovation actions. Group learning includes a process of aligning
and developing groups’ capacities to create desired knowledge for its members.
Organizational learning represents the enhanced intellectual and productive capacity
gained through shared commitment (knowledge, attitudes, or assumptions of members)
to an organization. Organizational learning depends on an organization’s mechanism,
including policies, strategies, cultures, and resources to store knowledge.
Knowledge occurs when individuals develop habits of learning, including asking
questions and giving feedback (Marsick & Watkins, 1994). Then they share their
knowledge, gained from their learning, with others through varied methods, such as
face-to-face conversation and virtual communication. This individual and group
knowledge becomes an organization’s knowledge. Organizational knowledge is, then,
rewarded and supported through a shared learning commitment. Most scholars agree that
organizations learn through individuals who learn, but individual learning does not
guarantee organizational learning (Marsick & Watkins, 1994). It might be that individual
learning does not transfer to a group effort or group learning cannot be put into action

38
(Marsick & Watkins, 1994). However, without individual learning, no organizational
learning takes place because individuals are the basic unit of groups and organizations.
The most interesting observation from the arguments of Marsick and Watkins
(1994) and Marquardt (2011) is that learning in an organization is not a single activity.
Learning cannot occur without collaboration and participation in cultural and contextual
activities and practices (Sun, 2003). A learning environment should be open to both
formal and informal learning. Moreover, the effective learning environment should offer
opportunities for social interaction.
Since there is confusion between organizational learning and learning
organization, this study also discusses the distinction between these two terms. It starts
with the term organization, which is a part of the two compared terms. Organization is
an artefact and it does not exist in nature (Sun, 2003). Organization is created and
sustained by humans. Consequently, organization is a social entity because it is
composed of more than one person.
Organizational learning refers to a learning process of an organization and by an
organization in a collective or organizational way (Sun, 2003). Organizational learning
provides an organization’s intellectual and productive capacity through shared
knowledge, beliefs, or assumptions of an organization’s members (Marquardt, 2011).
For the learning organization study, organizational learning is a collective learning and
improving process aiming to build up a learning organization (Marquardt, 2011).
Learning organization is a concept that offers an image of continuous learning
and improving of an organization (Sun, 2003; Marsick & Watkins, 1994). It can be

39
expressed as an organization that continuously learns (Marsick & Watkins, 1994) and
can transform itself into an adaptive environment (Marquardt, 2011). Learning
organization functions as a vision (Sun, 2003). A vision encompasses a direction for the
future that an organization wants to take. Learning organization serves as a guiding
vision “that pictures an organization as a living organism with an open [and] powerful
learning environment which inspires, facilitates and empowers the learning of its
members so as to enhance its capacity for change, adaptability, improvement and
competition” (p. 157). For this study, a learning organization refers to an organization
where members learn collectively and effectively and which transforms itself for better
management through the use of knowledge across the organization (Marquardt, 2011).
Marsick and Watkins (1994) proposed six imperatives to promote a learning
organization: (a) create continuous learning opportunities, (b) promote inquiry and
dialogue, (c) encourage collaboration and team learning, (d) establish systems to capture
and share learning, (e) empower people toward a collective vision, and (f) connect an
organization to its environment. This means that an organization empowers its people to
create continuous learning by promoting open dialogue, encouraging collaboration and
team learning, and acknowledging an interdependence of individuals, organizations, and
communities in which they reside.
The significant observations from these two terms (organizational learning and
learning organization) are the following. First, organizational learning refers to a
learning process of an organization, whereas learning organization represents a concept

40
functioning as a vision. Second, both terms recognize the value of continuous learning, a
process of knowledge creation and sharing, and a team-orientation.
Organizational Performance
The last concept in relation to the KM definition includes organizational
performance. Organizational performance refers to the effectiveness and efficiency of an
organization’s overall process (Watcharadamrongkun, 2012). Several studies have
explored the measurement of organizational performance. Organizational performance
can combine both effectiveness (quality of results) and efficiency (quality of processes).
KM benefits organizational performance as the following: (a) avoidance of costly
organizational mistakes, (b) sharing of best practices within the organization, (c) faster
and timely problem solving, (d) faster development and innovation, (e) better customer
solutions and relations, and (f) gaining new business (Skyrme, 2000).
The common measurement to assess organizational performance can be
classified into two dimensions: direct and indirect. The direct dimension consists of
financial indicators, such as market share, stock price, price earnings ratio, R&D
expenditure, and business growth (Chang, Lee, & Kang, 2005; Choi & Lee, 2003;
Chuang, 2004); scores from performance management tools, such as Balanced Scorecard
(Rašula et al., 2012); and performance score assessment by an accrediting agency
(Watcharadamrongkun, 2012).
The indirect dimension focuses the perception of stakeholders (i.e. top
management, staff, customers, and suppliers) toward organizational practices and results
(Chuang, 2004; Gold et al., 2001; Rašula et al., 2012; Yoopetch, 2009). The latter

41
dimension can be grouped into three performance measurements, including efficiency,
adaptability, and innovativeness (Aujirapongpan et al., 2010; Gold et al., 2001).
This study views organization performance as an organization’s effectiveness
and efficiency through managing knowledge. The explanation of organization
performance will be expanded in the knowledge management components section.
Conceptual Framework
In constructing the conceptual framework of this study, this section starts with
the explanation of three related theories. The guiding development theories for this work
include three theories: knowledge creation, organizational epistemology, and
contingency. These three theories are selected with respect to two aspects of inquiries:
(a) the creation of knowledge at the individual, group, and organizational levels, and (b)
the connectionist approach as a foundation of organizations’ systems. Each theory is
discussed in terms of its origin, summary, related research and findings, and implications
to this research study.
Then, this section elaborates the development of conceptual framework. This
framework is the synthesized work from literature relevant to a KM definition and its
related concepts, and the guiding theories. It aims to propose the set of ideas to generate
the studied conceptual framework, including the relationships among variables and the
context surrounding the inquiry.
Knowledge Creation
The theory of organizational knowledge creation has achieved paradigmatic
status since its publication in the mid-1990s (Gourlay & Nurse, 2005). The aim of the

42
knowledge creation theory is to understand how knowledge is dynamically created
within an organization. This theory relies on the assumption that knowledge is created
through social interaction between tacit and explicit knowledge.
Origin of the theory. Nonaka and Takeuchi developed an idea of knowledge
creation in 1991 from a study of information creation in innovating Japanese companies
(Gourlay & Nurse, 2005). Then, in 1993, they conducted another study to further test
their emerging theory. The samples of this study were 105 Japanese male middle
managers. The questionnaire survey comprised of 185 items, 38 of which concerned the
content of organizational knowledge creation that was measured by the amount of time
spent on specific activities. They used the hierarchical confirmatory factor analysis to
confirm the hypothesis about the four-mode model called SECI, which is Socialization,
Externalization, Combination, and Internalization. This study validated that knowledge
creation comprised the four modes of knowledge conversion.
Subsequently, Nonaka and Takeuchi published a more extensive theoretical
paper that was derived from the validated SECI model. In 1995, they wrote “The
Knowledge-Creating Company” to propose the theory to explain the phenomenon of
organizational knowledge creation focusing on the SECI model.
Summary of the theory. Nonaka and Takeuchi (2004) defined the
organizational knowledge creation as “the capability of a company as a whole to create
new knowledge, disseminate it throughout the organization, and embody it in products,
services and systems” (Nonaka & Takeuchi 2004, p. 13). They asserted that knowledge
is initially created by individuals. Then knowledge created by individuals becomes

43
organizational knowledge through processes described by their knowledge creation
theory.
Nonaka and Takeuchi (2004) considered two dimensions of knowledge
creation—epistemological and ontological. On the epistemological dimension, they
described two types of knowledge—tacit and explicit. Explicit knowledge is the written
knowledge that quite easily transfers from one person to another. In contrast, tacit
knowledge is more difficult to articulate because it is often created from individuals’
extensive experience. The other dimension, ontological, is knowledge processed form
different levels, including individuals, group, organization, and beyond. In summary, the
epistemological dimension is related to the conversion of knowledge from tacit to
explicit, and from explicit to tacit. The ontological dimension is related to the conversion
of knowledge from individuals to groups and further to organization (Bratianu, 2010;
Gourlay & Nurse, 2005).
Combining these two dimensions, Nonaka and Takeuchi further develop a spiral
model for knowledge creation. They mentioned that a spiral emerges when the
interaction between tacit and explicit knowledge is elevated dynamically from lower
levels to higher levels (from the individual level to the group and organizational levels).
This spiral is created by the four modes of knowledge conversion through which
knowledge is converted from one knowledge type to another. The modes of knowledge
conversion include socialization (from tacit to tacit knowledge), externalization (from
tacit to explicit knowledge), combination (from explicit to explicit knowledge), and
internalization (from explicit to tacit knowledge).

44
Organizational knowledge can be created when explicit and tacit knowledge
interact with each other. This interaction occurs through four modes of SECI:
socialization, externalization, combination, and internalization.
Socialization is the transformation of tacit knowledge into tacit knowledge
(Nonaka & Takeuchi, 2004). Tacit knowledge is created and shared through direct
experiences. Socialization occurs when an individual shares tacit knowledge with
another in face-to-face contact (Rahimi et al., 2011). This tacit knowledge is hard to
formalize and to express using language because it is context related. An individual can
acquire tacit knowledge directly from others without using language through an
interaction, including observation, imitation, and practicing (Nonaka & Takeuchi, 2004).
Externalization is the transformation of tacit knowledge into explicit knowledge
(Nonaka & Takeuchi, 2004). Tacit knowledge can be transformed into explicit
knowledge through continuous interaction, such as dialogue and reflection.
Externalization requires the expression of tacit knowledge and its translation into
comprehensible forms that can be understood by others (Rahimi et al., 2011). Among the
four modes of SECI, Nonaka and Takeuchi (2004) suggest that externalization is the
most important mode because it creates new explicit knowledge from tacit knowledge.
Externalization helps individuals clearly identify hidden tacit knowledge. It involves
processes that help transform ideas into words, visuals, or figurative language (Keeley,
2004). For example, externalization is utilized to improve ideas that are created during
formal meetings or brainstorming sessions.
45
Combination is the transformation of explicit knowledge into more complicated
forms of explicit knowledge (Nonaka & Takeuchi, 2004). In other words, it is the
activity of creating new formal knowledge that can be used directly by others. For
combination, explicit knowledge is processed and categorized into different collections
in order to create new knowledge, such as documented or discussed knowledge gained
from meetings (Rahimi et al., 2011). This transformation is best supported by
information systems through knowledge capture, categorization, and search (Keeley,
2004).
Internalization is the transformation of explicit knowledge into tacit knowledge
(Nonaka & Takeuchi, 2004). Explicit knowledge is learned and then internalized into
individuals’ tacit knowledge. Internalizing knowledge is effective in developing a
learning culture through experience-based learning (Rahimi et al., 2011). Experiences
that took place in the past may change an individual’s mental model. When this mental
model is shared by members of the organization, tacit knowledge becomes part of the
organizational culture (Keeley, 2004).
Along with the spiral model for knowledge creation, Nonaka and Takeuchi
(2004) addressed “ba”, the last element of knowledge creation. Ba is a Japanese term
that refers to a place at a specific time (Chumjit, 2012). In the knowledge creation
theory, ba is the shared context for creating knowledge and the place to create
knowledge. Knowledge is always created within a context that consists participants and
the way they participate. This context, which refers to the cultural, social, and historical
setting, influences organizational members to make new experiences from social
46
interaction processes become contextual knowledge. An organization’s contextual
knowledge refers to specific knowledge about the elements of organization, such as
products, services, and work processes.
The ba concept is similar to the situated learning approach in adult learning
science. Situated learning considers of learning as a sociocultural phenomenon.
Individuals’ knowledge and skills are developed in the contexts that reflect how
knowledge is obtained and applied in everyday situations (Stein, 1998).
In summary, the essence of the knowledge creation theory is based on four main
ideas (Bratianu, 2010):
a) Knowledge creation at individual level is a direct result of the continuous
dialogue between tacit and explicit knowledge.
b) There are four basic knowledge conversion processes: socialization,
externalization, combination and internalization.
c) Knowledge creation at the organizational level is based on these four
conversion processes and a spiral driving force.
d) Ba is one of the key mental factors that helps individuals interact with each
other and then create knowledge derived from the contextual setting.
Research based on the theory. In higher education studies, Nonaka and
Takeuchi’s theory was used in four studies. Three studies used four modes of SECI to
examine relationships between KM processes, and organizational processes as well as
outcomes, including planning and decision-making (Keeley, 2004), KM enablers
(Rahimi et al., 2011), and creativity (Rahimi et al., 2011). Differently, the study of

47
Chumjit (2012) used SECI as a lens to analyze how KM was implementation in
academic institutions. The findings of these four studies are listed below:
Keeley (2004) examined the extent and effectiveness of KM processes in
improving planning and decision-making in different types of 450 U.S. higher education
institutions. The results revealed that SECI processes were significant contributors in
improving planning and decision making.
Rahimi et al. (2011) investigated a relationship between SECI and creativity of
85 faculty members in the University of Isfahan. They found that there was a positive
and significant relationship between SECI and creativity. Knowledge combination had
the highest place in SECI, which was followed by externalization, socialization, and
internalization.
Yusoff et al. (2012) used the SECI model to examine a relationship of KM
processes and enablers from 21 faculty members in a Malaysian community college. The
results indicated that there was no significant relationship between KM processes and
enablers.
Chumjit (2012) conducted a qualitative research study using SECI as a
framework to analyze how four Thai universities implemented KM. The findings
showed that these universities had methods to manage knowledge transfer. All
universities used a variety of knowledge transfer (such as community of practice, note
taking, and database) to recreate knowledge across organizations. New knowledge was
managed and installed in databases, and organizational members can access and use it
for making decisions.

48
The knowledge creation theory in higher education studies has been used to
examine relationships between KM processes and other organizational dimensions. Most
studies applied the SECI model to investigate the KM processes used in an institution
and then identified the relationship between the KM processes and management
processes (i.e., planning and decision-making; Keeley, 2004) or outcomes (i.e.,
creativity; Rahimi et al., 2011). It should be noted that the element of this theory that
was mostly used in previous studies is the SECI model. Other elements, such as ba, are
not addressed.
Implication for this research study. The knowledge creation theory assists an
understanding of roles of KM and how to apply KM into higher education institutions.
Firstly, the knowledge creation theory assists an understanding of what and how
knowledge flows within the workplace through the SECI model. The SECI model helps
institutions plan, implement, and assess where the flow of knowledge is undergoing.
Secondly, this theory addresses the importance of building a learning platform
(known as “ba” in the knowledge creation theory) that influences individuals’ contextual
knowledge. In order to accept new knowledge for the surrounding environment, people
must have appropriate mental receptors that align with an organization’s belief (Leonard
& Swap, 2005). The mental receptors help shape new experiences into knowledge—not
just information. It is vital to establish a learning environment in which people are
encouraged to create, share, and use knowledge together for the benefits of the
organization. Thus the effective learning platform with the ba concept is able to be a
framework to study the creation of contextual knowledge within an institution.

49
Finally, the knowledge creation theory focuses on the interaction between
individuals and organizations. Nonaka and Takeuchi (2004) pointed out that “knowledge
is created only by individuals. In other words, an organization cannot create knowledge
on its own without individuals” (p.16). An organization needs to support and stimulate
knowledge-creating activities for organizational members. Thus organizational
knowledge creation leads to an insight that an organization should facilitate processes
that organizationally amplify individuals’ knowledge and crystallize it at the group level.
Von Krogh and Roos’s Organizational Epistemology
Von Krogh and Roos (1995, 1996) took an epistemological approach— the
relationship between the knower and the knowable (Guba & Lincoln, 2005)— to manage
organizational knowledge. They initiated a theory called ‘organizational epistemology’
that distinguishes between individual and social knowledge (Gomez, 1996). This theory
emphasizes that knowledge resides both in individuals and in the relationships they form
with others (Von Krogh & Roos, 1995). Both von Krogh and Roos as well as Nonaka
and Takeuchi’s theories involve the development of knowledge but their focuses are
different. Krogh and Roos tried to understand the process of organizational knowledge
development at the individual and social levels. Nonaka and Takeuchi focused on the
transformation of tacit knowledge into explicit knowledge.
Origin of the theory. In 1995, von Krogh and Roos (1995, 1996) published a
book called “Organizational Epistemology” to address the epistemological approach in
organizational knowledge development. Then in 1998, they examined a nature of KM in
organizations in terms of five factors: a mind-set of the individuals, communication in an

50
organization, an organizational structure, a relationship between organizational
members, and management of human resources (Dalkir, 2005). They found that these
five factors hinder the success of managing organizational knowledge for innovation,
competitive advantage, and other organizational goals. They explained that if individuals
do not value knowledge as a crucial component of an organization, the organization will
have trouble in developing knowledge-based competencies. If individuals are not
willing to share their experiences among groups on a basis of mutual trust and respect,
there will be no generation of collective knowledge. Finally, if the top management of an
organization does not acknowledge the individuals’ knowledge contribution, individuals
will lose their motivation to innovate and develop new knowledge for the firm.
Summary of the theory. Von Krogh and Roos (1995) applied the connectionist
approach as a foundation of their organizational epistemology theory. They assumed that
knowledge resides in and between an organization’s members at a social level. This
assumption leads to four issues to manage organizational knowledge as follows:
a) How and why individuals within an organization come to know.
b) How and why organizations, as social entities, come to know.
c) What counts for knowledge of the individual and the organization.
d) What are the impediments in organizational KM.
Organizational epistemology provides a theoretical cornerstone for a KM model
used in organizations. It assists an understanding of dynamics of individualized and
socialized organizational knowledge, and impediments to organizational knowledge.

51
Research based on the theory. The organizational epistemology theory was
cited by 419 publications according to the Google Scholar search engine in November
2014. By randomly searching the first ten pages of Google Scholar, most publications
cited it partly in their literature review. Only one study directly applied this theory to
guide their study. Cook and Brown (1999) conducted a conceptual paper employing
organizational epistemology as an approach to analyze the development of knowledge in
an organization. They offered the notions of various kinds of knowledge, productive
inquiry, dynamic affordance, and generative characters of knowing. These notions enrich
the development of organizational knowledge in terms of knowledge creation,
knowledge-based organizations, and the management of the intellectual capital.
Implication for this research study. Although the number of previous studies
that applied the organizational epistemology theory are limited, this theory contributes to
this research study in terms of an importance of interactions of individuals and their
organizations in managing knowledge. Organizational epistemology is comprehensive
and considers multiple factors existing in an entire organization (e.g., people,
relationships between people and organizations, and organizational processes). It gives a
clearer view that organizations need to put KM enablers in place that will stimulate the
development of individual knowledge, group sharing of knowledge, and organizational
knowledge retention.
Lawrence and Lorsch’s Contingency Theory
The theory of Lawrence and Lorsch (1967) relates to a contingency theory that
claims that there is no one best way for management to deal with an organization’s

52
systems. Contingency theory is often called the “it all depends” theory because it views
the management of an organization depending on the internal and external
environmental contexts of the organization (Burke, 2011).
Origin of the theory. Lawrence and Lorsch (1967) initially studied ten US firms
in three industries (plastic, food, and container) that confronted varying degrees of
uncertainty, complexity, and change. They studied the relationships between
environmental characteristics and effective organizational structures. The results showed
that each organization had a different degree of differentiation. Organizations operating
in uncertain, complex, and rapidly changing environments had more highly
differentiated internal structure. Organizations in more homogeneous and stable
environments were more formalized and hierarchical in their forms. Furthermore, they
conducted other studies in different types of industries (i.e., steel, agriculture, hospitals,
and telecommunication). The findings also confirmed their first results (Pugh &
Hickson, 2007). They finally concluded that organizations must have internal structures
as complex as the environments in which they operate.
Summary of the theory. Lawrence and Lorsch (1967) used an assumption of the
open systems theory to develop their study. They defined an organization as a system of
interrelated behaviors of people that has been differentiated into several distinct
subsystems. Each subsystem performs a section of the task. The efforts of each
subsystem are integrated to achieve effective performance of the system.
Their contingency theory tailors the organizational management to the sources of
environmental uncertainties faced by the organizations (Burke, 2011). External and

53
internal environments influence organizations in a varied number of ways. The external
environment includes labor markets, availability and cost of capital, competitors,
governmental laws and policies, and ecological concerns. The internal environments
vary in the forms of managerial assumptions about employees, organizational strategies,
structures, and technologies used. Consequently, organizations and organizational sub-
units need to adapt to the demands of their immediate environments (Pugh & Hickson,
2007).
To summarize, the contingency theory of Lawrence and Lorsch addresses the
nature and characteristics of the multiple relationships beginning with the environment-
organization interface (Burke, 2011). These relationships affect the interactions among
all organizational elements within the entire organization.
Research based on the theory. Two previous research studies in the education
context were influenced by the contingency theory. One used the qualitative approach,
the other used quantitative for conducting research. Both studies applied this theory to
develop a model or a framework that showed the influence of the internal environment
on organization performance.
The qualitative research is represented by the study of Gregory and Jones (2009).
They mentioned a research gap of their study that not many education studies emphasize
the importance of contextual or environmental factors and teachers’ conceptions that
influence the approach of teachers. They applied the contingency theory to generate a
model of teaching approaches for Australian university academics who teach
heterogeneous student cohorts. The result of their study was the proposed contingency

54
model, comprised of four separate teaching approaches: distancing, adapting, clarifying,
and relating. Their model emphasizes the interplay between structure (forces in the
environment) and the agency of individual lecturers (forces in the lecturer) in
determining teaching approaches.
Another study, the quantitative research conducted by Trisnaningsih (2013),
applied the contingency theory as a lens to examine the relationship among lecturers’
performance in an Indonesian university and their behavioral aspects. The researcher
used path analysis to analyze the relationship among four variables: lecturers’
performance, organizational commitment, professional commitment, and motivation.
The results showed that individuals’ performance is likely to depend on the internal
environment— lecturers’ commitment to their institutions.
Implication for this research study. The contingency theory raises an
awareness of how the environment-organization interface impact organization’s systems.
This theory influences the development of this study’s conceptual framework that
focuses on the interaction among systems, subsystems, and their components
systematically.
Development of Conceptual Framework
The conceptual framework developed here is based on the relationships between
the KM enablers, KM processes, and organizational performance. The three
aforementioned theories can be applied to generate the ideas surrounding the study. This
conceptual framework (Figure 4), modified from the study of Watcharadamrongkun
(2012), shows the iterative process between KM and organizational performance. This

55
study assumes that knowledge should flow within institutions through the iteration that
occurs through dynamic, continuous, and interrelated KM activities. The management of
knowledge is also iterative in that it involves the refinement of the ongoing knowledge
activities by the repetitive application of the activities. This KM definition aims to assist
an institution in performing better knowledge management to continually improve
performance.
This study applies the economic perspective and the cognitive process
perspective to define the term KM. KM refers to an iterative process of handling
actionable knowledge that results from individual, group, and organizational learning to
improve organizational performance. This KM definition expects to gain organizational
knowledge from employees’ learning. Furthermore, this study is interested in the
learning interactions between individuals, groups, and organizations through managing
the flow of knowledge. Knowledge here is treated as an intellectual capital that
combines individual insights, experiences, know-how, and values. This knowledge has
the potential to improve individual and organizational performance. Knowledge plays
significant roles in a workplace because it becomes embedded in organizational
documents or repositories, routines, practices, and norms (Davenport & Prusak, 1998).
These forms of knowledge are contextual and unique because they reside in individuals’
and organizations’ behaviors.

56
Figure 4. Conceptual Framework
H. External environment
G. Internal environment
B. KM enabler
- Leadership
- Culture
- Technology
- Performance
measurement
C. Organizational
performance
- Quality assurance
scores
A. KM process
Generate - Codify - Transfer
Tacit Explicit
knowledge knowledge
E. Individual and group
learning
F. Organizational learning D. Learning Organization
Knowledge Creation theory:
Interaction between tacit and explicit
from the individual and group levels
to the organizational level
A, D, E, F
Organizational Epistemology Theory: Interactions of individualized and socialized
organizational knowledge A, B, C, D, E, F, G, H
Contingency Theory: How it all depends
A, B, C, D, E, F, G, H

57
The KM process (A), including activities of generating, codifying, and
transferring knowledge, displays the flow of knowledge in conjunction with tacit
(uncodified) and explicit (codified) knowledge. KM enablers (B) associated with an
organization can influence KM processes. These enablers include organizational
contingency aspects that involve leadership, culture, technology, and performance
measurement. Organizational performance (C), represented by quality performance
scores, indicates the effectiveness of the organizational management through managing
knowledge. Since KM processes, enablers, and organizational performance are the
studied variables of this study, they will be more explained in the next section entitled
variables used in the study.
Proper management of knowledge possibly develops a learning organization (D).
As mentioned earlier in the KM definition and its related concepts, learning organization
is a concept of continuous learning functioning as a vision. A learning organization
refers to an organization where members learn collectively and effectively and
transforms itself for better management through the use of knowledge across the
organization (Marquardt, 2011).
Learning is a process of creating knowledge. It can take place in an organization at
three levels: individual, group, and organizational (E and F). Individual learning includes
changes in knowledge, attitudes, and skills acquired through self-study and observation.
Group learning refers to an increase in knowledge, attitudes, and skills accomplished by
and with groups. Organizational learning represents the enhanced intellectual and
productive capacity gained through shared commitment (knowledge, beliefs, or

58
assumptions of members) to the organization. Learning in an organization is not a single
activity. It relies on collaboration and participation in cultural and contextual practices.
Knowledge occurs when individuals develop their learning and share their knowledge with
others. Then, individual and group knowledge is attained through a shared learning
commitment and is transformed into contextual organizational knowledge.
Although individuals and groups are the agents by which organizational learning
occurs, their learning processes are influenced by internal and external environments of
their organizations. With this interrelated nature, organizational learning involves the
sharing of knowledge, beliefs, or assumptions among individuals and groups.
Internal and external environments (G and H) are included in this framework
because they influence organizations in multiple ways. The internal environments vary
in the forms of managerial assumptions about employees, organizational strategies, and
structures. The external environment includes labor markets, availability and cost of
capital, competitors, governmental laws and policies, and ecological concerns.
Consequently, organizations need to adapt to the demands of their immediate
environments (Pugh & Hickson, 2007).
For this study, the KM enablers (B) are performed as forms of internal
environments. Other institutionalized aspects are not included in the KM enablers (B),
such as university’s missions, policies, sizes, and types, exist in the organization’s
internal environment. The outside organizational aspects, such as contexts of national
culture, regulations, communities’ requirements, and employers’ expectations toward
graduates, exist in the organization’s external environment. These environmental aspects

59
provide the context for this study. They impact how the HEIs think and act (Marquardt
et al., 2004). The environmental aspects are recognized, but they are not focal points of
this investigation.
Knowledge Management Components
The implementation of KM needs to fit within an organizational context in order
to optimize the KM advantages (Aujirapongpan et al., 2010; Chen, Yeh, & Huang, 2012;
Zheng, Yang, & McLean, 2010). According to the contingency theory by Lawrence and
Lorsch (1967), an organization confronts various degrees of uncertainty, complexity, and
change. The effectiveness of the organization relies on its internal and external
environments. The internal environment represents the forms of an organization’s
management, including organizational processes, strategies, structures, and mind-sets of
employees. The external environment includes aspects from outside the organization that
impact the management, such as communities’ requirements and expectations,
competitors, and changes in technology. The organization must have its internal
environments be as complex and dynamic as the external environment in which they
operate. Consequently, the achievement of the KM implementation needs an effective
operation in line with both.
Some scholars conducting KM research studies in the corporate context (e.g.,
Choi & Lee, 2003; Gold et al., 2001) and the higher education sector (e.g., Cranfield,
2011; Watcharadamrongkun, 2012) have suggested three major components for
implementing KM. The three components, which are KM enablers, processes, and
outcomes, engage in an organization’s internal environment. KM enablers refer to

60
organizational factors that influence an organization’s ability to manage knowledge in an
efficient and effective manner (Gold et al., 2001). KM processes involve an
organization’s activities or practices that handle knowledge throughout an organization
(Heisig, 2009). KM outcomes, also characterized as organizational performance, imply
the quality and effectiveness of an organization’s overall process. These three
components become the environment-organization interfaces that impact the
achievement of KM.
Knowledge Management Enablers
Researchers have studied enablers affecting the KM implementation for the past
decade. KM enablers refers to influential factors to manage knowledge efficiency and
effectively (Gold et al., 2001).Various research studies (i.e., Heisig 2009; Lehner &
Haas, 2010) were conducted to explore the importance of having the supportive KM
factors to underpin KM success.
For example, one of the common perspectives to study KM enablers is resource-
based capability (Aujirapongpan et al., 2010). Resource-based capability assumes that
organizations with different resources will have different KM capacities. Resource-based
capability focuses on organizational resources that infer tangible assets, such as land,
buildings, and instruments (Aujirapongpan et al., 2010), and intangible assets, such as
organizational structure, culture, and management systems (Gold et al., 2001).
Another most widely cited KM enabler is the study by Gold et al. (2001). They
grouped a variety of KM enablers into three components: organizational culture,
structure, and technology. They termed these three components as knowledge

61
infrastructure capability. The cultural infrastructure is the integration of an
organizational value and vision. The value and vision should support knowledge-related
activities and be clearly communicated through an entire organization. The structural
infrastructure refers to the presence of organizational policy and process. Organizational
structure should be flexible to encourage knowledge interactions among employees.
Last, the technological infrastructure addresses the technology-enabled ties that exist
within an organization. The technical systems should determine how knowledge is
distributed throughout a firm and how knowledge is accessed.
Heisig (2009) did a content analysis study of 160 KM frameworks in a corporate
context, regarding the most frequently used terms for the description of KM critical
success. He classified KM success factors into four main categories with 10 sub-
categories: (a) human-oriented factor: culture, people, and leadership, (b) organization:
process and structure, (c) technology: infrastructure and application, and (d)
management process: strategy, goal, and measurement. The largest portion is allotted to
culture (a sub-category of the human-oriented factor), which is the most frequently
mentioned.
Lehner and Haas’s study is consistent with Heisig’s work. Lehner and Haas
(2010) collected over 60 KM studies and then classified KM factors into three
dimensions: human being, organization, and technology. They merged the management
process factor, which is the fourth dimension of Heisig, with the organization dimension.
The dimension of human being involves leadership support and individual attitude
facing KM. Organization includes eight components: personnel development, meta-

62
communication of KM, KM goal, KM responsibility, delegation/ participation, staff
member motivation, existing social net, and KM corporate culture. Technology, the last
dimension, is composed of an IT system, an organizational system, and a KM content.
This study focuses on intangible assets, including organizational culture,
leadership, information technology, and performance management (Figure 5). These
four enablers are included in the KMAT tool, a widely recognized KM tool used in
industry and higher education sectors across countries. This study uses this set of KM
enablers because it denotes two major categories with a focus on human-oriented and
organization-oriented factors that are able to lead to an understanding of the entire KM
system of any organizations.
Figure 5. Definition of Knowledge Management Enablers

63
Organizational culture. Culture has been long on the agenda of organizational
management studies. Schein (1999), a well-recognized scholar of organizational culture,
defined organizational culture as
“a pattern of basic assumptions—invented, discovered, or developed by a given
group as it learns to cope with its problems of external adaptation and internal
integration—that has worked well enough to be considered valid and, therefore,
to be taught to new members as the correct way to perceive, think and feel in
relation to those problems” (p. 385).
His definition implies that culture is powerfully subjective and reflects how an
organization gives meanings to situations and solutions for solving problems.
In the KM literature, culture is a broad term that has multiple characteristics.
Ramachandran et al. (2013) defined culture as “a set of beliefs [including] organizational
purpose, criteria of performance, the location of authority, legitimate base of power,
decision-making orientation, leadership style, compliance, evaluation, and motivation”
(p.79). Lee (2007) described culture as “an organizational environment and a behavioral
pattern that enables people to share their ideas and knowledge.” (p. 13). A study of
Coukos-Semmel (2002) referred to culture as “the general knowledge sharing climate of
the organization as related to an integrated pattern of human behavior—including
thoughts, speech, actions, and artifacts” (p. 14). Tan and Noor (2013) have a specific
focus on individuals’ willingness to share knowledge. Culture in these studies has
diverse characteristics but the same purpose, regarding individuals’ values, beliefs, and
environments or climates to conduct KM.
64
A definition of organizational culture can be divided in terms of its process and
outcome (Dalkir, 2005). Using the process perspective, culture involves a set of
mechanisms, such as values, norms, and practices that control how individuals and
groups in an organization interact with each other and people outside an organization.
For the outcome perspective, culture includes a manifest pattern of behaviors or the way
individuals do things. Culture in the outcome perspective becomes committed ways in
which individuals perform their tasks, solve problems, and provide products and
services.
Culture is reflected in values, norms, and practices (Lee, 2007). Values, which
are tacit in nature, are difficult to articulate. Values inspire members in an organization
to do something. Norms are formulated by values but are more visible than values. For
example, if members believe that sharing knowledge will benefit them, they are more
likely to support an idea of sharing their knowledge. Practices are the most tangible form
of culture. These three forms of culture influence behaviors of members in an
organization.
Organizational culture is regarded as the most important factor impacting KM
(Heisig, 2009). If an organizational culture is willing to accept changes in valuing
knowledge, the KM implementation will possibly succeed (Gold et al., 2001). Shaping a
culture is an important ability for effectively managing knowledge.
Gold et al. (2001) proposed six characteristics of organizational culture to
enhance the KM implementation: (a) an individual attitude toward KM, (b) an individual
participation in knowledge-related activities, (c) a recognition of expertise, (d) a
65
collaboration among organizational members, (e) a clear KM vision and value, and (f)
support of top management. An organization needs to establish and create a knowledge-
friendly culture to achieve effective knowledge sharing that results in more
organizational knowledge (Lee, 2007).
Not only shaping culture, but also maintaining culture is necessary. Culture that
encourages KM should be clearly communicated through an entire organization to
support knowledge-related activities (Aujirapongpan et al., 2010). Communication is the
tool that helps to transmit culture to existing employees and to newcomers. It also
enables culture to be maintained and developed in its certain way.
In examining what leverages organizational knowledge capability, two KM
studies in higher education examined organizational culture that promotes sharing
knowledge and organizational learning. Lee (2007) listed several cultural characteristics:
community-orientation, trust or openness, collaboration, entrepreneurship, and
responsiveness to training and professional development. Coukos-Semmel (2002)
offered examples of cultural strategies to achieve organizational learning, including
communities of practice, and staff development opportunities. These cultural
characteristics require the support of the organization for learning and sharing
knowledge activities.
The management of sharing knowledge and organizational learning leads to a
learning organization. Marquardt (2011) suggested that in a learning organization,
culture is one factor in which learning is recognized. Learning has become a habitual and
integrated part of all organizational functions. Culture enhances learning by encouraging

66
knowledge values, such as self-learning, learning collaboration or team learning,
empowerment, and knowledge sharing. Employees are responsible not only for their
own learning, but also for learning of others. They are expected to teach and learn from
their colleagues. These values and practices are embedded in organizational culture and
help an organization become a learning organization.
A proper organizational culture should be an initial requirement for effective
KM. This study defines organizational culture as an organizational environment and a
behavioral pattern (Lee, 2007) that enables individuals and groups to learn and share
their knowledge within an organization.
Leadership. Leaders have exceptional and imperative roles to play in managing
knowledge. They establish policies and create an organizational culture that promotes a
KM initiative in their organizations (Ramachandran et al., 2013).
Similar to culture, leadership has a complex description with a variety of
definitions and components. Leaders act as change agents who send a signal of
organizational change adopting KM in their organizations (Coukos-Semmel, 2002; Lee,
2007). Leadership is defined as an ability to align KM behaviors with organizational
strategies, identify opportunities to use KM, promote values of KM, communicate best
strategies, facilitate the evolution of a learning organization, and provide guidelines for
assessing an impact in knowledge. Leaders act as drivers who lead to effective KM
(Yusoff et al., 2012).
Golden (2009) viewed leadership with a different perspective. He was interested
in leaders with technological skills. KM leaders are expected to have both management

67
and technological skills. They should possess basic communication skills, good
management instincts, abilities to articulate organizational goals and visions, and,
importantly, technical skills to be able to communicate with technical staff, comprehend
the trend of information technology, and understand the business of an institution.
In the KM literature, some studies examined leadership in terms of top
management’s attitudes and supportive actions toward KM. One of these studies
examined top management’s attitudes, it explored top management’s understandings of
the importance of KM and their engagement in knowledge sharing practices (Tan &
Noor, 2013). Other studies explored administrator visions, strategic planning, values of
learning, and motivation toward a KM initiative (Arntzen et al., 2009; Lee, 2007). These
works illustrate the strategic focus on KM.
Dalkir (2005) suggested appointing a specific leader position in handling KM. A
role for a KM executive includes a Chief Knowledge Officer (CKO) or a Chief Learning
Officer (CLO). The CKO or CLO position heads KM teams and is primarily responsible
for setting KM strategies, handling KM operations, influencing changes in organizations,
and managing KM staff teams. KM executives should create an environment that fosters
knowledge sharing informally so that they can interact with teams in a work context.
Furthermore, they have responsibilities to decide how information and knowledge are
created, processed, inventoried, retrieved, and evaluated, so that KM activities are
aligned with an organization’s goals. This executive KM role also often incorporates
change management.

68
Leaders are required to have abilities to align KM processes with organizational
strategies and operations. This study applies the economic perspective as a lens to
manage knowledge. It views managing knowledge as managing an organizational asset.
Thus, this study defines leadership as leaders’ abilities to align KM with an
organizational strategy and operations (Coukos-Semmel, 2002; Golden, 2009; Lee,
2007), promote values of KM (Arntzen et al., 2009; Chumjit, 2012), and encourage
individuals’ learning to create individual, group, and organizational knowledge (Tan &
Noor, 2013).
Leadership addresses how leaders’ actions guide and sustain an organization by
setting organizational vision, values, and performance expectations (NIST, 2013). A
leader can successfully manage knowledge by following three practices. First, leaders
have a vision for managing knowledge. Leaders with KM vision can provide a sense of
direction that helps their members to create knowledge (Lee, 2007). Vision for managing
knowledge should be communicated clearly and across an entire organization (Gold et
al., 2001). Furthermore, leaders should link KM with an organizational strategic plan
(Golden, 2009). A strategic plan provides a road map to lead a workplace from where it
is now to where it would like to be (McLean, 2006). Strategic planning assists an
organization in clearly defining its objectives and assessing internal and external
environments to determine a direction of a firm. This planning process provides an
overall strategic direction to organizational management, and gives a specific direction
(such as, financial strategy, organizational development strategy, and human resources
strategy) to achieve an overall organization’s success. KM plays a role in this process

69
and function as a strategy to support the improvement of the organization’s knowledge
assets.
Second, leaders should promote values of KM through motivation and reward
systems. The motivation and reward systems range from monetary, such as bonuses and
incentives, to non-monetary incentives, such as recognition and promotion (Chumjit,
2012; Tan & Noor, 2013). By offering motivation, an organization can promote
knowledge sharing and encourage people to participate in creating knowledge (Arntzen
et al., 2009).
Third, leaders are required to prepare and educate employees in order to be able
to understand and implement KM effectively (Chumjit, 2012). KM training programs
help assure that individuals obtain needed knowledge for their jobs. Competencies in
KM enhance employees’ ability to utilize the management of knowledge in their jobs.
For example, employees can use technology for searching, codifying, and sharing
knowledge (Marquardt, 2011). Collaboration among employees also occurs when
applying KM processes, because the essence of KM eases knowledge dissemination and
sharing (O’ Dell & Hubert, 2011). Networking is important for organizational
development since a firm can perform better and create innovations through intra-
organizational collaboration of employees from various functions (Chumjit, 2012).
All in all, KM leaders require a multidisciplinary skill set that consists of such
competencies as having a vision for managing knowledge, aligning KM with an
organization’s strategies and operations, recognizing the importance of KM (in particular

70
an economic benefit), motivating employees to engage in the development of
knowledge, and facilitating individuals’ learning to enhance their competencies.
Technology. Literature of the developmental stage of KM mainly focused on
capturing technology, codifying, storing, and distributing information (Lee, 2007). This
overemphasis on technology often creates confusion between information management
and knowledge management because most people perceive these two terms as
interchangeable. The purpose of KM is to manage the knowledge from individuals’
experiences, know-how, and values, rather than the management of data in information
processing systems.
Technology in the KM literature focuses on “how knowledge travels throughout
an organization and how knowledge is accessed” (Gold et al., 2001, p. 193). With this
focus, the definition of technology commonly refers to an infrastructure of devices and
systems that enhance the distribution of knowledge across an organization.
Most researchers have addressed the significant impact of technology and its role
in effectively managing knowledge. The purpose of technology is to support the
development of organizational knowledge by enabling the flow of KM processes (Gold
et al., 2001; Marquardt, 2011). Technology, an organizational infrastructure, is
composed of integrated hardware, software, technological networks, and information
tools with access to and exchange of information and learning, which then are turned
into knowledge.
Marquardt (2011) addressed two major components of technology: an application
for managing knowledge and an enhancement of learning. Technology for managing

71
knowledge includes the computer-based technology (such as, web-based networks and
electronic databases) that gathers, codes, stores, and transfers information and
knowledge across and outside organizations (Marquardt, 2011). Technology facilitates
communication between organizational members and increases networking between
people within and beyond the workplace (Lee, 2007). The use of technology helps
overcome differences in time and distance so organizational isolated members can work
together and share their ideas and knowledge (Chumjit, 2012).
Technology for enhancing learning encompasses the utilization of computer-
based technology and multi-media for the purpose of the delivering and developing
knowledge and skills (Marquardt, 2011). Technology enhances learning opportunities
and learning environments for individuals. It offers a collaborative learning environment
among organizational members interactively (Gold et al., 2001) through various types of
the technological tools, such as blogs, wikis, social tagging, podcasts, social networking,
and e-learning (O’Dell & Hubert, 2011).
Measurement of the management in information, knowledge, and information
technology examines how an organization ensures the quality and availability of needed
data, information, software, and hardware, normally and in the event of an emergency
(NIST, 2013). The ultimate goal of this measurement is to improve organizational
efficiency and effectiveness and to stimulate innovation through the management of
knowledge assets.
Gold et al. (2001) proposed common indicators of the technology capabilities
affecting KM effectiveness. These indicators consist of an accessibility of business

72
intelligence, collaboration and distributed learning technology, knowledge discovery,
knowledge mapping, knowledge application, opportunity to generate and store
knowledge, and security.
Business intelligence technology supports an organization to generate
knowledge, regarding its competition and broader economic environment. Collaboration
and distributed learning technology allows individuals to gain interaction and
collaboration without the limitations of structural and geographical impediments (such
as time and distance). Knowledge discovery technology helps find new knowledge from
inside and outside the workplace. An organization can effectively track sources of
knowledge from knowledge mapping technology by creating an inventory or a catalog of
internal organizational knowledge. Knowledge application technology helps a firm use
its existing knowledge, while opportunity generation technologies allow knowledge to
be tracked by customers, partners, employees, or suppliers. In addition to creating,
storing, and transferring knowledge through the technological infrastructure, an
organization must consider that knowledge is secured— it is not stolen or used
inappropriately.
Technology is a major facilitator of managing the flow of knowledge. It involves
information and communication technologies, technological equipment, and knowledge
platforms that facilitate KM processes. Based on the literature review, this study defines
technology as tools and processes that facilitate and sustain individual and collective
activities (Marquardt, 2011) to help manage the flow of knowledge throughout an
organization (Gold et al., 2001).

73
Performance measurement. KM is an iterative process that involves many
activities, such as acquisition, creation, storing, sharing, usage, and assessing of
knowledge. Once the KM processes are implemented, their effectiveness or achievement
needs to be examined. Since an organization faces a massive amount of knowledge, not
all knowledge is valuable and applicable to future competitive advantage and to justify
for costs of retaining and transferring them (American Productivity and Quality Center,
2003). KM performance measurement assists in identifying what and where knowledge
is, and by what means that knowledge can be captured and transmitted.
Based on previous analysis of 17 KM processes models in higher education,
measurement is less applied (Sunalai & Beyerlein, in press). Several institutions
disregard the measurement of KM processes and rarely use evaluation tools to monitor
the management of knowledge flow. It seems that the deficiency of knowledge
measurement is one of the impediments to manage the flow of knowledge.
Performance measurement plays a vital role in KM processes, because it focuses
on the analysis of the efficiency and effectiveness of the KM implementation.
Performance measurement aims to control, evaluate, and improve KM processes to
ensure that the implementation stays on track (Ramachandran et al., 2013). This
measurement can be conducted at the beginning and ending steps of any KM process.
Measurement at the beginning identifies the right knowledge for the right person at the
right place. Measurement at the ending step assists in refining knowledge for the long-
term use. Measuring KM processes examines their current statuses and provides

74
justification for modifying their alignment with an organization’s strategies and
operations (Lee, 2007).
An organization not only measures the efficiency and effectiveness of KM on-
going processes, but also assesses relationships between KM impacts and organizational
performance (Lee, 2007; Yusoff et al., 2012). From the economic perspective,
measurement, as a strategy, serves to identify knowledge assets and capabilities of an
organization, and to align the measurement activities with organizational strategies (Lee,
2007). Measuring the outcomes of KM helps justify investments in managing
knowledge, and reinforce the support for its implementation.
Three categories of the indicators that an organization can apply to measure KM
impacts include: activity, process efficiency, and business performance and output
(O’Dell & Hubert, 2011). First, the activity indicator focuses on measures of
involvement. The engagement of participants can be represented by the degree of an
individual’s interest in provided learning activities. Better learning is affected by
participants’ reactions and motivation to learn (Holton, Bates, Ruona, 2001). Second, the
process efficiency indicator assists monitoring and understanding how KM processes
help knowledge flow. This indicator helps track learning efforts that involve knowledge
capture process, participant satisfaction, and reuse of knowledge. Last, the business
performance and output indicator evaluates the performance of business operation.
Commonly in the KM literature, performance measurement consists of as an
instrument that collects information with appropriate metrics to assess effective and
efficient KM implementation (American Productivity and Quality Center, 2003; Lee,

75
2007; Ramachandran et al., 2013). This study uses two approaches of measurement
(measurement for efficiency and effectiveness of KM processes and measurement for the
KM impacts on organizational performance). Thus, the performance measurement of
this study refers to the collection of information about the efficiency and effectiveness of
KM processes when managing the flow of knowledge (American Productivity and
Quality Center, 2003; Lee, 2007; Ramachandran et al., 2013) and the productivity of
individuals and organizations that results from the KM implementation (O’Dell &
Hubert, 2011).
Knowledge Management Processes
KM processes involve an organization’s activities that manage a flow of
knowledge throughout an organization (Heisig, 2009). This study has an underlying
assumption that knowledge should flow within institutions through iterations. The
management of knowledge activities is iterative in that it involves the refinement of the
ongoing knowledge activities by the repetitive application of the activities.
Researchers have studied KM processes for the past decade. The analysis of KM
processes increases understandings of how knowledge interacts among individuals and
organizations. Various KM processes have been identified in higher education. Sunalai
and Beyerlein (in press) conducted an integrative literature review studying KM
processes in the higher education context. They systematically searched previous
research works from 2001 to 2014 (September 13) in Academic Search Complete
(Ebsco), ProQuest, and Google Scholar databases. The KM literature search yielded 15
relevant academic papers published between 2002 and 2013. Five papers are

76
dissertations and 10 papers are articles in 10 different peer reviewed journals. Based on
these 15 publications, 16 KM processes models were found. Fourteen papers used one
model and one paper used two models. The development of these models can be divided
into two categories: those that adopted a well-known model and those that created a new
model.
Of those publications that adopted well-recognized KM process models, the
SECI model by Nonaka and Takeuchi was the most used (four publications). The
KMAT by Arthur Andersen Consulting Services and the American Productivity and
Quality Center (APQC) was the second most cited (two publications). Of the seven
publications that developed their own unique model, many found solutions by adopting
KM processes found during their extensive literature review.
Based on the analysis of the 16 KM process models, Sunalai and Beyerlein (in
press) found 39 different activity terms related to KM processes. They combined similar
activity terms within a category and divided them into six categories that consist of
Acquire, Create, Store, Share, Use, and Assess knowledge (to avoid a confusion of
similar terms that can be placed at the category and construct level, the capital letter for
terms represent the category level).
Acquire is a combination of accessibility, collection, and assimilation of acquired
knowledge. Similar terms found in the Acquire category include acquire, buy, capture,
gain, and get. These terms have a common purpose to obtain necessary knowledge for
the use of an organization.

77
Create refers to the development of new knowledge or the replacement of
existing knowledge. The synonymous terms include build, create, generate, improve, and
learn. Knowledge creation may occur through reasoning with existing knowledge,
innovating by individuals to improve the way they perform their tasks, or buying
knowledge from subject matter experts.
Store covers activities of embedding and categorizing knowledge so that
organizational knowledge can be easily retrieved. Codify, combine, storage, organize,
and sustain knowledge are similar terms in this category. The aim of knowledge storage
is to put organizational knowledge into a form that makes knowledge accessible.
Share combines the activities of sharing and distributing knowledge between an
organization’s members. Knowledge sharing is the most frequent occurrence of KM
processes and it is mentioned in all 16 models. The synonyms of Share are comprised of
allocate, contribute, disseminate, distribute, integrate, present, share, transfer among
organizational members, externalization, and socialization. Share focuses on an
interaction of sharing and distributing knowledge between individual, group, and
organizational levels.
Use refers to an application of knowledge to individuals’ daily work that is
embedded in organizational operations. The similar terms consist of apply, use, transfer
to job, transform, internalization, and institutionalization. Use aims to apply established
knowledge when performing a routine task.
Assess focuses on the analysis of knowledge to assure the usefulness of
knowledge and the evaluation of an effectiveness of an overall KM process. This

78
category is comprised of analyze, assess, define organizational purpose, evaluation,
identify, measure, and validation. An assessment of knowledge can be performed before
or after KM processes. The purpose of the assessment at the beginning of the process is
to identify what knowledge should be possessed or used for an organization. The
assessment after KM processes aims to monitor and then refine knowledge being used
with existing and future needs.
The six categories of KM processes provide a coherent lens of KM processes
used in previous research. They represent a clearer view of how knowledge flows
through interactive processes within an institution.
For KM studies, the KMAT tool, initiated by Arthur Andersen Consulting and
APQC, is frequently used to study KM processes in both corporate and higher education
contexts. The KMAT tool consists of five aspects: process, culture, leadership,
technology, and measurement in managing knowledge (American Productivity and
Quality Center, 2003). KMAT places all the major KM processes and enablers together
in a system. This tool is designed to help organizations make an initial high-level
assessment of how well they manage knowledge. The KMAT process operates through
three types of activities: generation, codification, and transfer (Figure 6).

79
Figure 6. Definition of Knowledge Management Processes
Knowledge generation. The first KM process starts with knowledge generation.
It refers to the activity of acquisition and development of knowledge (Ramachandran et
al., 2013; Shoham & Perry, 2009). Knowledge generation has a purpose to build needed
knowledge for the use of an organization.
For the acquisition of knowledge, this activity starts with finding what essential
knowledge should be possessed or used in an organization (Shoham & Perry, 2009). It
identifies a detected knowledge gap and needed knowledge (Dalkir, 2005) for the use of
making decisions, solving problems, or innovating products and services (Bukowitz &
Williams, 2000). A knowledge gap is the difference between what individuals knows
and what they need to know in order to accomplish their task (Leonard & Swap, 2005).

80
The knowledge gap analysis can be conducted through creating a knowledge map
that functions as a snapshot to help an organization understand what knowledge it has
and lacks (O’Dell & Hubert, 2011). Knowledge maps include three different types of
functions. Enterprise knowledge map aims to identify and measure an organization’s
level of competency and expertise to meet its strategic goals. Cross-functional
knowledge map is used to identify specific individuals who are experts and their areas of
expertise and to understand the strength and gaps within specific technical or functional
knowledge of each area. Process-explicit knowledge map includes the identification of
specific knowledge assets and contents that function as resources for an organization,
such as knowledge inventories and directories (O’Dell & Hubert, 2011).
When accomplishing the acquisition of essential knowledge in an organization,
the next step moves to an activity of developing knowledge. The development of needed
knowledge includes the creation of new knowledge (Ramachandran et al., 2013) and the
replacement of existing knowledge (Dagli, Silman, & Birol, 2009). This activity
develops knowledge, particularly know-how, defined as innovations that have not had a
previous existence within an organization. It attempts to access, collect, and assimilate
existing internal knowledge within an organization and/or external knowledge from
outside (Dalkir, 2005; Watcharadamrongkun, 2012).
The current challenge of building knowledge is not in finding knowledge but in
dealing with the massive volume of knowledge that can be obtained (Bukowitz &
Williams, 2000). An organization needs to select and match the wide stream of
knowledge with the best possible content in an organization’s context. Dalkir (2005)
81
suggested a criterion to develop needed knowledge is to identify a sufficient value to an
organization such that it should be added to the store of intellectual capital.
Knowledge generation aims to build needed knowledge, particularly know-how
that fits in the context of an organization. This KM process assists an organization in the
acquisition and development of the right knowledge in the right people, in the right
places, at the right time, and for the right reasons.
Knowledge codification. Knowledge codification is the activity of embedding
knowledge by transforming tacit and explicit knowledge back and forth into an
organizational knowledge (Nonaka, 1991; Wiig, 1993). This embedded organizational
knowledge, then, is made accessible so that organizational members can clearly
understand and easily retrieve (Coukos-Semmel, 2002; Ramachandran et al., 2013;
Wiig, 1993).
According to Nonaka (1991), the transformation of organizational knowledge
from tacit into explicit does not occur in a linear fashion that ends at the creation of
explicit knowledge. Explicit knowledge can be recreated and then internalized into
individuals’ tacit knowledge. This explicit knowledge imbeds itself in an organization’s
members’ mind-sets and mental models. Wiig (1993) asserted that codifying knowledge
encompasses how individuals represent knowledge in their mind-sets or mental models,
how they assemble knowledge into coherent models, how they document knowledge
(such as, manuals), and how they encode knowledge in order to post it to a knowledge
repository. Consequently, explicit knowledge becomes tacit knowledge that is
recognized as part of the organizational norms, routines, and practices.

82
Another aim of codification is to put organizational knowledge into a form that
makes knowledge accessible. Codification gives permanence to knowledge that may
exist in forms that can be shared, stored, and combined to retain essential knowledge
(Dalkir, 2005). Knowledge, being stored or retrieved, is physical (such as, file folders,
printed information) and digital (database). Managing knowledge incorporates not only
traditional explicit forms (a physical or digital document), but also tacit knowledge that
resides in individuals’ mind-sets (Bukowitz & Williams, 2000). This implies that
effective knowledge needs to be connected through both visible forms and values added
by those individuals who use it. Thus, codification involves major tasks to organize
knowledge content, as well as to maintain timeliness, completeness, and accuracy in
order to respond to users’ needs. Furthermore, an organization needs to offer training
programs to enhance users’ capabilities with new knowledge repository technologies
(information literacy) to ensure that they are able to access and retrieve knowledge that
they need.
Individual and group learning represents the first step in organizational learning
(Marquardt, 2011). Knowledge is information until it is validated and codified at an
organizational level (Dalkir, 2005). Codifying knowledge is an essential step in
leveraging knowledge values (Coukos-Semmel, 2002). Codifying knowledge adds value
by creating more readily usable knowledge in objective forms and by storing an essential
knowledge content more flexibly for future use (Dalkir, 2005).
Knowledge transfer. The last process, knowledge transfer, aims to apply
knowledge to individuals’ daily work that is embedded in organizational operations.

83
This process represents sharing and distributing of knowledge between an
organization’s members (Aujirapongpan et al., 2010; Shoham & Perry, 2009). The
purpose of knowledge transfer is not only distributing knowledge, but sharing
knowledge (Bouthillier & Shearer, 2002). Sharing of knowledge goes beyond the
distribution of knowledge because it helps ensure the exchange of knowledge within an
organization’s communities. Consequently, knowledge transfer deals with combining
knowledge in new and interesting ways in order to foster knowledge utilization and
encouraging employees to share their own knowledge to a knowledge repository
(Bukowitz & Williams, 2000).
Knowledge transfer covers the mechanical, electronic, and interpersonal
movement of knowledge (Marquardt, 2011). It can be undertaken formally and
informally through various media, meetings, changes in positions or duties, and
mentoring (Watcharadamrongkun, 2012). Other interesting knowledge transfer forms
involve learning from experiences, including best practices and lessons learned among
organizational members (O’Dell & Trees, 2014). Best practices and lessons learned
influence knowledge transfer by building organizational memory (Bukowitz &
Williams, 2000). An organizational memory is created so that organizational knowledge
becomes possible from both successes (best practices) and failures (lessons learned).
Individuals, groups, and organizations learn when new knowledge is shared in a
socialization process.
Misconception about transferring knowledge is about managing all knowledge
made public (Bukowitz & Williams, 2000). The purpose of KM is not to post everything

84
on an organization’s digital platform, such as intranet, but to find out essential
knowledge from individuals (their experiences and know-how in relation to their jobs).
Knowledge to be shared organization-wide must be organized in an accessible form in
order to be widely used.
An outcome of knowledge transfer is to apply knowledge to individuals’ works
and embed knowledge in organizational operations (Aujirapongpan et al., 2010). The
ability to transfer knowledge is significant for the improvement of organizational
operations because knowledge transfer aims to apply established knowledge when
performing a routine task.
Based on previous KM studies in the higher education setting, two research
studies used the KMAT model to represent KM processes (generation, codification, and
transfer) in the context of higher education their studies. Both studies examined the gap
of KM processes in terms of importance and use in universities in different countries—
257 research universities in the United States (Coukos-Semmel, 2002) and four
Malaysian universities (Ramachandran et al., 2013). The study of Coukos-Semmel
(2002) indicated that the overall use of KM processes was below the moderate level and
the importance was above the moderate level. Ramachandran et al. (2013) found that the
KM processes were considered to be important. Codification scored the highest mean,
followed by transfer and generation. However, for the degree of use, the scores showed
the average use of the KM processes. Knowledge transfer scored the highest mean,
followed by generation and codification. These two studies provide a clear statement that
the implementation (use) does not match the importance.

85
Organizational Performance
This study assumes that KM enablers affect KM processes that contribute to
effective organizational performance. Performance refers “to outputs and their outcomes
obtained from processes, products, and customers that permit the organization to
evaluate and compare its results relative to performance projections, standards, past
results, goals, and the results of other organizations” (NIST, 2012, p. 60). Organizational
performance here implies an integrated view of KM outcomes that results from
managing organizational knowledge (Yoopetch, 2009). Organizational performance
should be more successful if an institution manages knowledge effectively (Keeley,
2004).
This section explains the contribution of KM in organizational performance to
provide an insight into how KM impacts an academic institution’s effectiveness and
efficiency. The measurement of organizational performance has long been argued, in
particular, to link an investment in KM with the measurable outcomes (American
Productivity and Quality Center, 2003). This study tries to measure KM outcomes by
using performance scores in higher education as the representative measurement.
Contribution of knowledge management in organizational performance in
higher education. In the academic institution context, the analysis of the previous 18
KM outcome studies suggest that education performance can be divided into three
categories: improvement of organization management, achievement of higher education
missions, and performance score assessment (Sunalai & Beyerlein, in press).

86
The improvement of organization management includes two different levels of
management perspectives: organizational development and individual performance.
Organizational development involves any practices or interventions aimed at
improving an institution’s processes through the lens of change at the organizational
level (Burke, 2011). KM strengthens an organization’s management and supports
adaptation to change. Previous higher education research works showed that KM
significantly benefits better management processes, such as strategic planning (Chumjit,
2012), decision-making (Keeley, 2004), change management (Mohayidin et al., 2007),
creativity (Rahimi, et al., 2011), and quality control (Cranfield, 2011). The effective
management of knowledge provides accessible and actionable knowledge to support
managerial decisions based on empirical evidence.
The benefits of KM also contribute to performance development. KM supports
competency development of an institution’s members, in particular faculty members. It
directly impacts the quality of teaching and the number of research publications, which
lead to faculty growth (Basu & Sengupta, 2007). Furthermore, by using KM, university
staff members develop their managerial skills by analyzing and writing their workflow
descriptions and workflow procedures (Chumjit, 2012).
Most previous research studies agree that KM contributes to the achievement of
higher education missions: teaching, research and publications, and academic services.
KM helps improve teaching competencies through the value-added change in teaching
(Arntzen et al., 2009; Arsenijević & Arsenijević, 2010; Chumjit, 2012; Cranfield, 2011;
McCarthy, 2006; Mohayidin et al., 2007). Better teaching can be enhanced through

87
knowledge sharing processes among faculty members. Furthermore, KM increases
research collaboration across a university, resulting in an increase in the number of
research projects and publications (Chumjit, 2012; Cranfield, 2011; Tan & Noor, 2013).
Collaboration improves accessibility to scholarly communication, such as conducting
research projects and writing publications (McCarthy, 2006). Last but not least, KM
positively influences an enterprise’s product innovation through a relationship between
networks of university–industry collaboration (Chen & Wei, 2008).
During the past decade, only one KM study has used a performance score
assessed by an accrediting agency to infer organizational performance. The study of
Watcharadamrongkun (2012) integrates three achievement scores including accreditation
score, rating score, and North American Pharmacist Licensure Examination (NAPLEX)
pass rate to measure academic performance of pharmacy schools in the US. Using a
performance assessment from a national agency to represent the KM outcome is not
common in higher education studies.
Organizational performance closely relates to KM outcomes aiming to produce
knowledge assets in an academic institution. The analysis of the KM outcomes indicates
that KM contributes to the improvement of organizational management processes and
the achievement of academic institution’s missions.
Performance score in higher education. A performance score assessment by an
independent agency offers a direct measurement to assess an institution’s performance.
This measurement involves institutional evaluation (frequently known as programmatic
evaluation). Institutional evaluation refers to “the evaluation of the institution’s entire

88
curriculum to determine its effectiveness in meeting its educational outcomes” (Bouldin
& Wilkin, 2000, p. 381). It aims to understand how an institution achieves its mission
and goals, how it contributes to students and staff members’ growth and development,
what its strengths and weaknesses are, and how to bring about the organization’s change
or transformation (Bouldin & Wilkin, 2000; Watcharadamrongkun, 2012). The ultimate
emphasis of institutional evaluation addresses the institutional level rather than an
individual student level (Bouldin & Wilkin, 2000; Watcharadamrongkun, 2012).
Institutional evaluation affects organizational performance because it reflects and
publicly reports on the effectiveness and quality of an institution. Two of the most
recognized institutional performance assessments include benchmarking and external
accreditation (Mok, 2005; Watcharadamrongkun, 2012).
Benchmarking, as a component of quality management, is a measurement tool in
which an academic institution seeks information to analyze its current work processes.
The term benchmarks refers to “processes and results that represent best practices and
performance for similar activities, inside or outside an organization’s industry” (NIST,
2013, p. 56). When doing the process of benchmarking, an institution learns how well
other institutions perform. Benchmarking starts by identifying the best institution in an
area that HEIs need to compare. Then, HEIs compare their results or outcomes and
processes to those studied. Furthermore, HEIs can benchmark not only other institutions,
but also themselves with the same process over time to determine how well they are
doing. Benchmarking provides information for identifying the directions of institutions

89
and facilitating activities that efficiently accomplish their missions and goals
(Watcharadamrongkun, 2012).
An example of university benchmarking is the university ranking system. Over
the past decade, a rise in national and international systems for comparing and ranking
universities has come from across the world. The purpose of this system is to measure
performance dictating what an institution’s performance should be (Taylor & Braddock,
2007). The two best-known international university ranking systems include the Times
Higher Education Supplement (THES) World University Rankings and the Shanghai
Jiao Tong Academic Ranking of World Universities (Taylor & Braddock, 2007). There
have been debates on the criteria being adopted to assess and evaluate university
performance. Some academics argue benchmarking systems are counterproductive to
university development, while others criticize that benchmarking weakens academic
freedom and institutional autonomy (Mok, 2005). A suggestion to use the university
ranking systems effectively is to look carefully at their criteria, and then read their
rankings as a measurement of achievement according to those criteria in particular
(Taylor & Braddock, 2007).
Accreditation is another type of institutional performance assessment. In general
terms accreditation can be defined as “a process, based on professional judgment, for
evaluating whether or not an educational institution or program meets specified
standards of educational quality” (Prados, Peterson, & Lattuca, 2005, p.165). It aims to
assure that graduates of accredited programs are prepared for professional practice
(Prince, 2004). Two types of accreditation include institutional or specialized.

90
Institutional accreditation aims to evaluate the overall operation of a university from a
broad perspective. Specialized accreditation focuses in detail on programs that prepare
graduates for their professions. In some countries, such as the USA, accreditation is a
peer-review process conducted by non-governmental organizations associated with
educational institutions or professional societies. In other countries, such as Thailand,
accreditation is performed by both governmental organizations (Ministry of Education)
and professional societies.
The advantages of the university ranking systems and accreditation contribute to
three different levels: individual, institutional, and national (Taylor & Braddock, 2007).
The published information provides a resource for prospective students to compare
institutional performance. HEIs can compare their performances with other universities
to analyze and evaluate their university’s comparative strengths and weaknesses in
particular academic areas. Parent organizations (Ministry of Education), government,
and other higher education decision makers can use ranking systems to develop higher
education policies.
Organization performance portrays an organization’s effectiveness and efficiency
through managing knowledge. This study aims to use performance scores as a
representative of KM outcome. Performance scores offer a direct measurement to assess
an institution’s performance. It comes in a form of the institutional evaluation that
publicly reflects the effectiveness and quality of higher education.

91
Relationships of Knowledge Management Enablers, Processes, and Organizational
Performance
This study incorporates KM processes into organizational performance of higher
education institutions. This section investigates the relationship between KM enablers
and processes and the relationship between KM processes and organizational
performance to measure the impact of KM on higher education performance. Since
previous empirical KM studies in the context of higher education are limited, the
literature in the corporate arena is used to support the investigation of the relationship
among the studied variables.
Relationship between Organizational Culture and KM Processes
Organizational culture refers to an organizational environment (climate) and a
behavioral pattern that enables individuals and groups to learn and share their knowledge
within an organization. Most research findings have suggested that organizational
culture is critical for managing knowledge. Culture has a greater contribution to KM
than other factors (Zheng et al., 2010). Several studies found that culture is positively
associated with KM processes (Chuang, 2004; Rašula et al., 2012; Zheng et al., 2010).
Zheng et al. (2010) explained that culture influences KM processes through shaping the
behaviors of organizational members. The changed behaviors contribute the successful
KM implementation.
Many studies found critical characteristics of culture supporting KM. The ability
of an organization to learn, develop, and share knowledge is dependent on its values in
knowledge and behaviors in collaborative learning. Basu and Sengupta (2007) found that

92
in some universities, knowledge interactions are restricted to “closed pockets of the
individual rooms” (p. 277). This silo hinders the knowledge sharing effort because it is
limited to internal peer groups (Basu & Sengupta, 2007). Consequently, communication
is low or absent among other external departments.
Yoopetch (2009) found that internal communication and social networking in a
firm have a strong influence on KM. Furthermore, Tan and Noor (2013) found that
openness in communication has a significant and positive influence on knowledge
sharing by faculty members at research universities. Consistent with the study of Basu
and Sengupta (2007), their findings revealed that openness in the communication climate
increases the awareness of effective communication and the willingness of members to
share knowledge with each other. Basu and Sengupta (2007) implied that members are
willing to exchange their opinions and knowledge through seminars, workshops, and
meetings, even if those ideas and knowledge contradict popular opinions. Open
communication among members is an evolving about sharing knowledge across an
entire institution.
Trust is also critical to organizational culture. Both studies by Ellingsen (2003)
and Tan and Noor (2013) found that trust encourages knowledge sharing by facilitating a
more proactive and open relationship among members; this relationship allows
knowledge to be exchanged smoothly. Their results indicated that HEIs should build a
trustworthy environment where members feel comfortable when sharing knowledge
(Tan & Noor, 2013).

93
Based on previous studies, they showed that the characteristics of culture that
support KM include valuing knowledge sharing; supporting collaborative learning;
fostering learning value to individual, group, and organizational learning; facilitating
open communication; and building trust among members. These cultural characteristics
can encourage organizational members to think and behave in managing knowledge.
They represent the cultural enablers (or organizational climates and behavioral patterns)
that significantly relate to individual and group efforts to learn and share their
knowledge within the workplace.
Relationship between Leadership and KM Processes
This study defines leadership as the leaders’ abilities to align KM with an
organizational strategy and operations; promote values of knowledge; and encourage
individuals’ learning to create individual, group, and organizational knowledge. Many
previous research works have been interested in the relationships of leadership toward
KM processes. They used two different terms to portray leadership— one is the term
leadership itself, another is the structure term that refers to management styles, such as
chains of command, motivation and reward systems, and development of human
resources.
Leadership with respect to the top management’s attitudes and supportive actions
toward KM is one of the most important supporting enablers. Several research papers
addressed that leadership relates to KM processes. Gold et al. (2001) found a positive
relationship between leadership and the discovery, creation, and sharing of knowledge.

94
Gold et al. (2001) proposed that a flexible structure (decentralization) facilitates
transferring of new knowledge across structural boundaries in corporate sectors.
Similarly, Zheng et al. (2010) found that centralization relates negatively to KM
processes. Unlike the studies of Gold et al. (2001) and Zheng et al. (2010), Chumjit
(2012) indicated that centralization works well for some universities. Chumjit (2012)
conducted a qualitative study in four autonomous universities in Thailand. She found
that the chains of command in these four institutions are top down. In the case of KM,
university administrators have deployed policies, and have allowed schools and
departments to implement KM under their supervisions. These universities also have
appointed the Chief Knowledge Officer (CKO) and KM teams to facilitate schools and
departments to develop their KM strategic plans. The administrators focus on how KM
actions of the university staff members impact the university’s achievement.
Reward systems encourage sharing knowledge among organizational members
(Gold et al., 2001). Results from Tan and Noor’s (2013) study demonstrated that
organizational rewards have a strong positive influence to predict knowledge sharing.
For example, rewards (incentives or recognitions) from leaders to members, who share
knowledge and then receive organizational rewards for their contributions, can influence
the commitments of other members.
The support of leadership in KM involves individual development. KM training
programs enhance individuals to be able to utilize the management of knowledge in their
jobs (Chumjit, 2012). Golden (2009) mentioned that an increase in employees’ KM
understandings and skills influence the success of managing knowledge efforts. Some

95
examples of the developing activities can be explained by Chumjit’s study (2012). She
found that university staff members are taught the process of the KM implementation.
Universities provide KM training programs, learning spaces or platforms (such as,
weblogs, KM days, and community of practices), and incentives for KM best practices.
However, the result of Tan and Noor’s (2013) study indicated that the top
management support was not a knowledge sharing predictor. Their findings indicated
that top management support may be an antecedent of other KM enablers, such as
organizational rewards or culture, instead of the KM enabler, because top management
plays a crucial role in providing incentives to members and promoting a knowledge
culture.
All in all, leadership becomes a vital element to foster KM processes. Leadership
can be either a predictor or an antecedent of other KM enablers. The characteristics of
leadership consist of the abilities to align KM with the organizational strategies and
operations, promote values of managing knowledge, and encourage individual learning
and sharing in the workplace.
Relationship between Technology and KM Processes
KM involves the sharing of information and knowledge; therefore, technology
becomes a means for searching, storing, retrieving, and accessing needed knowledge
(Tan & Noor, 2013). This study views technology as tools and processes that facilitate
individual and collective activities to help manage the flow of knowledge throughout an
organization. Technology plays a role in academic society of supporting communication
and collaboration, and searching for knowledge and information.
96
Over the past decade, there has been an increase in the study of technology
affecting KM. These research findings can be generally divided into three conclusions.
First, correlational research confirms that technology is important for KM practices.
Rašula et al. (2012) studied the relationship of KM processes and technology in
companies in Slovenia and Croatia. Their research revealed that KM heavily relies on
technology. Technology has been called the most extensively used KM enabler in newly
established public HEIs in Malaysia (Ramachandran et al., 2013). Technology is used in
these institutions due to the campus-wide adoption of computers, internet, intranet, and
software applications. The use of technology in those universities allows many KM
activities to take place, such as knowledge capture, storage, and transfer.
Second, technology influences KM process and outcomes to a lesser degree than
other enablers, such as culture (Rašula et al., 2012), internal communication and social
networking (Yoopetch, 2009), and an HRM strategy (Chen et al., 2012). When
technology is combined with other enablers, it can enhance performance and lead to
business advantages (Chuang 2004; Mills & Smith, 2011).
The third conclusion argues that technology has a non-significant relationship
with KM. Tan and Noor (2013) found that technology does not influence the
achievement of KM in research universities in Malaysia because knowledge is well-
embedded in the members and universities’ values and work practices.
Based on the literature review, the reported relationship of technology and KM
processes is diverse— it performs as a predictor, an antecedent of other KM enablers, or
not a predictor. One observation is that the relationship of these two variables depends

97
on the nature of institutions, such as institutional ages and types (i.e. university with
research orientation). However, this study assumes that technology plays the important
role in KM processes because technological tools and processes can facilitate individual
and collective activities to manage the flow of knowledge throughout the institution.
Relationship between Performance Measurement and KM Processes
Performance measurement refers to the collection of information about the
efficiency and effectiveness of KM processes when managing the flow of knowledge
and the productivity of individuals and organizations that results from managing
knowledge. In practice, performance measurement is the least-developed KM enabler
(Ramachandran et al., 2013). This could be due to the difficulty in defining KM which
makes it difficult for organizations to understand the performance outcomes resulting
from the KM implementation (Ramachandran et al., 2013).
Little research used performance measurement as a KM enabler to investigate its
impact on KM processes. To examine a relationship between performance measurement
and KM processes, this study reviews the literature in both empirical and conceptual
studies. Empirical research was found in a study by Ramachandran et al. (2013). They
examined the perception of use and importance of performance measurement in
Malaysian universities. The correlational results suggest that performance measurement
is important for KM processes (generation, codification, and transfer).
From a conceptual perspective, performance measurement is necessary as a
foundation to control, evaluate, and improve knowledge processes or activities to ensure
that KM stays on track (Coukos-Semmel, 2002). It is a systematic evaluation mechanism

98
that proves the KM investment to be worthwhile (Lee, 2007). For example, Lee (2007)
found that departments of colleges of education in the United States, where they include
the value of KM in their mission statements, are more likely to consider cost-effective
strategies in their annual reports. These departments set annual indicators reflecting
changes in the KM implementation in the departments.
Although the empirical studies in KM performance measurement are limited, the
literature review suggests that performance measurement is expected to relate to KM
processes. In other words, KM processes require the presence of performance
measurement to manage knowledge successfully.
Relationship between KM Processes and Organizational Performance
Organizational performance implies an integrated view of KM outcomes that
result from managing organizational knowledge. Most KM literature reviews associate a
success of the KM processes with organizational performance. Some quantitative studies
indicate a positive relationship between KM and organizational effectiveness (Gold et
al., 2001; Rašula et al., 2012; Watcharadamrongkun, 2012).
Gold et al. (2001) correlated four KM processes (called knowledge process
capability in their study) with organizational performance. Organizational performance
was measured by perceptions toward abilities of an organization to innovate, improve
coordination of efforts, improve rapid commercialization of new products, anticipate
surprises, respond to market change, and reduce redundancy of information or
knowledge. They found that knowledge acquisition, knowledge application, and
knowledge protection positively impact organizational performance.

99
The study of Rašula et al. (2012) about companies in Slovenia and Croatia
indicated that KM processes positively affect organizational performance. Their KM
processes include the accumulation, utilization, and sharing and ownership of
knowledge. Organizational performance in their study is divided into two perspectives:
internal process, and innovation and learning. The internal process perspective focuses
on (a) operations management by improving asset utilization and supply chain
management, (b) customer management by expanding and deepening relations, (c)
innovation by new products and services, and (d) social regulations by establishing good
relations with external stakeholders. The innovation and learning perspective focuses on
internal skills and capabilities to support the value creating internal processes.
Watcharadamrongkun (2012) addressed that KM processes (knowledge
acquisition, knowledge integration, and institutionalization) are related to direct
measures of performance (i.e., NAPLEX pass rates and accreditation actions) for
colleges and schools of pharmacy in the US. The study of Watcharadamrongkun (2012)
is the only study known that used direct measures of performance represented by pass
rates and accreditation actions.
The study of Watcharadamrongkun (2012) is the initial KM outcome research
using pass rates and accreditation actions to represent the quality of organizational
performance. In education, there has been an emerging of using quality scores to
represent organizational performance. International accreditation bodies have been
established to recognize commitment to quality and continuous improvement in
universities, such as the European Quality Improvement System and, for education in the

100
US, the Malcolm Baldrige Criteria for Performance Excellence. These scores result from
criteria (such as, organizational mission, faculty’s productivity, and student’s
achievement) that capture the comprehensive image of the current status of the academic
institutions. However, no research investigates the relationship of other types of quality
scores (such as, scores from a national accrediting body) and KM. This study will use
the quality scores from the Ministry of Education, which is a national accrediting
agency, to represent the overall performance of HEIs resulting from the management of
knowledge in higher education settings.
In summary, KM processes reflects how HEIs describe how they perform and
how to improve their performance through managing the flow of knowledge. However,
several enablers can influence the KM processes and lead to varying levels of
organizational performance. Organizational performance indicates the efficiency and
effectiveness of the overall process of HEIs. The aforementioned literature suggests that
organizational performance should improve if an organization has effective KM
processes.
Knowledge Management in Higher Education in Thailand
Higher education in Thailand is provided at universities, technical institutes
(known collectively as the Rajamangala Institute), and teachers’ colleges (known
collectively as the Rajabhat Institute). The Thai Higher education system is divided
between two types of institutions. Firstly, institutions which fall under the Ministry of
Education, including 74 public universities and 81 private institutions for higher
education (Bureau of Standards and Evaluation, 2010). Secondly, specialized training

101
institutions which fall under various ministries (such as nursing colleges, and police and
military academies).
In Thailand, the Ministry of Education has developed national policies since
1999 by the use of quality assurance principles to ensure improvement of educational
quality and standards (Bureau of Standards and Evaluation, 2010). Chapter VI in the
National Education Act of 1999 (2nd amendment in 2002; Office of the National
Education Commission, 2003) indicated that there shall be a system of educational
quality assurance to ensure improvement of educational quality and standards at all
levels. This system shall comprise both internal and external quality assurance. Parent
organizations shall establish a quality assurance system in the institutions. Internal
quality assurance shall be regarded as a part of educational administration. The Office
for National Education Standards and Quality Assessment (ONESQA) shall be
responsible for the development of criteria and methods of external evaluation, and for
conducting evaluation of educational achievements in order to assess the quality of those
institutions. With the focus on quality, all Thai HEIs are assessed regularly. They are
internally assessed every year by the Bureau of Standards and Evaluation, whereas they
are externally assessed by the ONESQA at least once every five years.
The Thai quality assurance has continually improved its systems and practices
since it has been implemented. In 2005, KM has been set as one of the key performance
indicators for Thai educational quality assurance because of the influence of the
Malcolm Baldrige National Quality Award (MBNQA) approach in Thai organizations
(Bureau of Standards and Evaluation, 2010). KM is expected to be the intervention for

102
transforming institutions into effective learning organizations. The KM indicator focuses
on KM processes that are implemented in each HEI. The criteria or requirements to
measure the KM application are as follows (Bureau of Standards and Evaluation, 2010):
a) There is a formulation of goals concerning knowledge and knowledge
management, and these goals align with the institution’s mission of
producing graduates and performing research;
b) There is a promotion of human resource development which aims to develop
potential faculties and staff’s knowledge and skills in order to produce
graduates and perform research as clearly defined in requirement 1;
c) There is a process of sharing and exchanging knowledge and skills acquired
from faculties and staff’s experience (tacit knowledge) to find the best
practices and there is a distribution of this tacit knowledge to appropriate
persons;
d) There is a process of storing explicit knowledge derived from the tacit
knowledge in requirement 3;
e) There is an implementation of the knowledge in requirement 4 and the
practices that appear to work the best are identified and implemented in the
work of faculties and staff in order to make improvement.
As can be seen, these criteria have an emphasis on the processes of KM that
cover knowledge identifying, sharing, storing, and utilizing. Each institution has an
opportunity to develop its own KM systems and practices.

103
Summary
Chapter II reviewed the literature concerning the foundation of KM, including
its definitions and relevant concepts from diverse perspectives. It addressed three
guiding theories (knowledge creation, organizational epistemology, and contingency) to
help develop the conceptual framework of this study. This framework illustrates the
relationships of three KM components: KM enablers, processes, and organizational
performance.
This study defined KM as an iterative process of handling actionable knowledge
that results from individual, group, and organizational learning to improve
organizational performance. This definition was influenced by the learning interactions
between individual, group, and organization that results in actionable knowledge.
Actionable knowledge plays significant roles in the workplace because it is imbedded in
an institution’s routines and behaviors. This knowledge is considered unique for each
organization since it is contextual and has evolved over the years through the
individuals’ interactions. Then it resided in individuals’ and organizations’ behaviors,
and consequently, it is used and transferred into actual work.
The KM effort is also influenced by internal and external environments through
its processes and enablers. The KM processes include activities of generating, codifying,
and transferring knowledge. The KM enablers involve culture, leadership, technology,
and performance measurement. Then, organizational performance depends on the
relationship of KM components among enablers, processes, and outcomes.
Organizational performance indicates the efficiency and effectiveness of organizational

104
management through managing knowledge. This study used performance scores as the
representative of institutional performance assessment.
The results of the literature review suggested that the relationship of the three
KM components could be explained by two different research models. The first model,
Figure 7, showed the conceptual model that encompasses the three KM components at
the conceptual level, based on the extensive literature review. The second model, Figure
8, represented the general empirical model resulting from the empirical data from this
research study. It aimed to expand HEI KM conceptualization. This general empirical
model is further analyzed through the statistical analysis since there has not been any
previous research studies that examine the relationship among each KM enabler and
process, as well as each KM process and organizational performance score.
Figure 7. Conceptual Model Summarizing HEI KM Literature
KM enablers KM processes KM outcomes
Culture
Leadership
Knowledge
codification Knowledge
generation Knowledge
transfer
KM processes
Measurement
Technology
Organizational
performance
score

105
Figure 8. General Empirical Model to Explain HEI KM Conceptualization
KM enablers KM processes KM outcomes
Chapter III presented a detailed design of the study. It described research
methodologies and methods used to answer the study’s research questions. It also
presented the hypotheses of this study regarding the two research models (Figures 7 and
8).
Culture
Leadership
Measurement
Technology
Knowledge
generation
Knowledge
codification
Knowledge
transfer
Organizational
performance score

106
CHAPTER III
METHODOLOGY
Included in this methodology chapter was a description of the study purpose,
research question, and hypothesis followed by an explanation of the research paradigm
and methodology. The majority of this chapter presented the method used to conduct this
research. Chapter III consisted of the population and sample, instrument, data collection
methods, and data analysis methods. Furthermore, the issues of validity and reliability
were addressed to ensure the quality of this study. Finally, this chapter identified the
limitation of the research design.
Restatement of Study Purpose and Research Question
HEIs need empirical research evidence to explore whether or not and how KM
influences HEIs’ performance. The purpose of this study was to develop and tested a
correlational model in conjunction with KM enablers and processes on organizational
performance of HEIs.
This study assumed that KM enablers affect KM processes that contribute to
effective organizational performance. The hypothesized conceptual model was designed
to represent the relationship between KM enablers and processes and the relationship
between KM processes and quality performance scores. Consequently, this hypothesized
conceptual model (Figure 9) was guided by one main research question— how do KM
enablers and KM processes affect performance of HEIs? The hypotheses were:

107
H1.1 Organizational culture will correlate positively and significantly with KM
processes.
H1.2 Leadership will correlate positively and significantly with KM processes.
H1.3 Technology will correlate positively and significantly with KM processes.
H1.4 Performance measurement will correlate positively and significantly with
KM processes.
H1.5 KM processes will correlate positively and significantly with quality
performance scores.
Figure 9. Hypothesized Conceptual Model Summarizing HEI KM Literature
KM enablers KM processes KM outcomes
H1.5
H1.4
H1.3
H1.2 H1.1
Measurement
Technology
Culture
Leadership
KM processes
Knowledge
generation
Knowledge
codification Knowledge
transfer
Quality
performance
scores

108
Based on the literature review, Figure 9 showed the hypothesized conceptual
model that encompassed the three KM components (KM enablers, processes, and
outcomes) at the conceptual level. It was hypothesized that there were relationships
between each KM enabler and the KM overall process, and between the KM overall
process and quality performance scores.
Currently, no previous research study in the higher education arena examines the
relationship between each KM enabler and process, as well as each KM process and
quality performance score. The KM processes operate through three types of activities:
generation, codification, and transfer. Each activity has its own function and purpose to
manage the flow of knowledge. For example, knowledge generation refers to activities
of acquisition and development of knowledge (Ramachandran et al., 2013; Shoham &
Perry, 2009). Its purpose is to build needed knowledge for the use of an organization.
Knowledge codification involves embedding knowledge by transforming tacit and
explicit knowledge back and forth into organizational knowledge (Nonaka, 1991; Wiig,
1993), then making organizational knowledge accessible (Coukos-Semmel, 2002;
Ramachandran et al., 2013; Wiig, 1993). It aims to give permanence to knowledge that
may exist in forms that can be shared, stored, and combined to retain essential
knowledge. Each enabler may influence each process to a different degree. The deep
investigation provides clearer understandings of the relationship between each enabler
and process, as well as each process and organizational performance.
Thus, the second model (Figure 10), called the hypothesized general empirical
model, was developed to investigate the relationships of each KM enabler and each KM
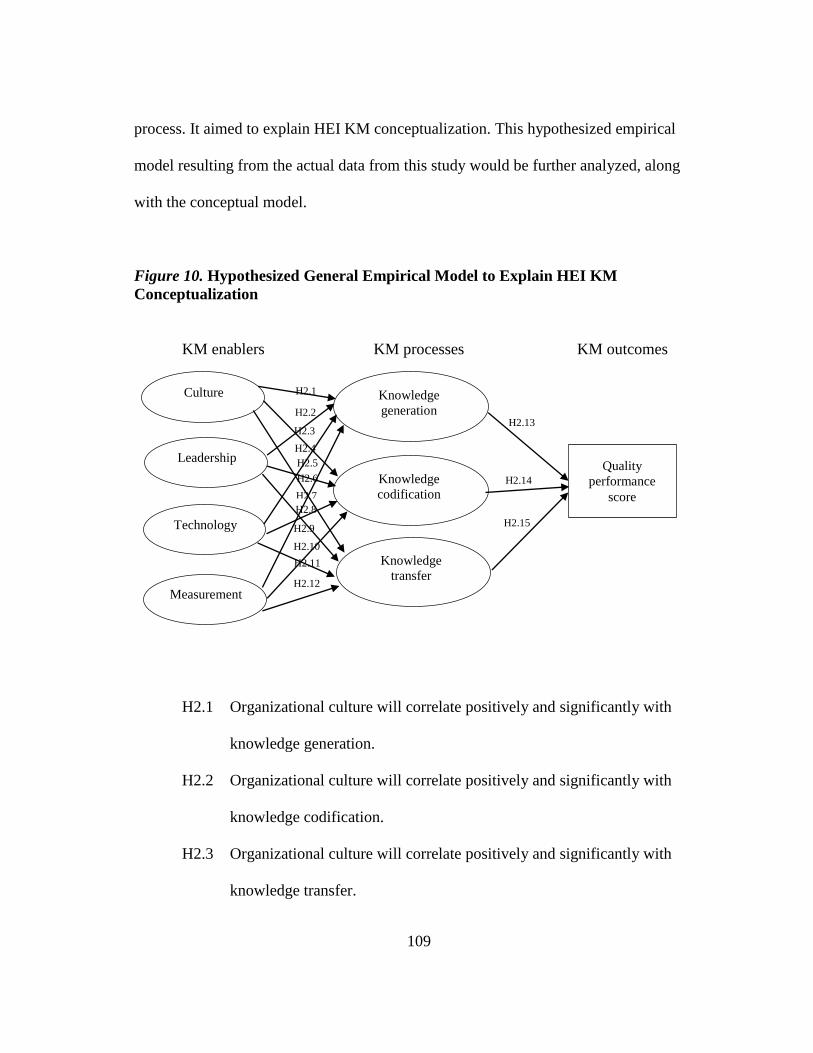
109
process. It aimed to explain HEI KM conceptualization. This hypothesized empirical
model resulting from the actual data from this study would be further analyzed, along
with the conceptual model.
Figure 10. Hypothesized General Empirical Model to Explain HEI KM
Conceptualization
KM enablers KM processes KM outcomes
H2.1 Organizational culture will correlate positively and significantly with
knowledge generation.
H2.2 Organizational culture will correlate positively and significantly with
knowledge codification.
H2.3 Organizational culture will correlate positively and significantly with
knowledge transfer.
H2.10
H2.7
H2.5
H2.2
H2.12
H2.11
H2.9
H2.8
H2.6
H2.4
H2.3
H2.1
Quality
performance
score
H2.15
H2.14
H2.13
Culture
Leadership
Measurement
Technology
Knowledge
generation
Knowledge
codification
Knowledge
transfer

110
H2.4 Leadership will correlate positively and significantly with knowledge
generation.
H2.5 Leadership will correlate positively and significantly with knowledge
codification.
H2.6 Leadership will correlate positively and significantly with knowledge
transfer.
H2.7 Technology will correlate positively and significantly with knowledge
generation.
H2.8 Technology will correlate positively and significantly with knowledge
codification.
H2.9 Technology will correlate positively and significantly with knowledge
transfer.
H2.10 Performance measurement will correlate positively and significantly with
knowledge generation.
H2.11 Performance measurement will correlate positively and significantly with
knowledge codification.
H2.12 Performance measurement will correlate positively and significantly with
knowledge transfer.
H2.13 Knowledge generation will correlate positively and significantly with
quality performance scores.
H2.14 Knowledge codification will correlate positively and significantly with
quality performance scores.

111
H2.15 Knowledge transfer will correlate positively and significantly with quality
performance scores.
Research Paradigm and Methodology
This exploratory study was a cross-sectional descriptive research design using a
mixed-method methodology. According to Creswell and Creswell (2005), mixed-method
research is “a research design or methodology for collecting, analyzing, and mixing both
quantitative and qualitative data in a single study or series of studies in order to better
understand research problems” (p. 317). They proposed three different aspects of the
mixed-method research definition in relation to the combination of data collection, data
analysis, and research problem achievement.
The first aspect relates to the form of data collection. A mixed-method researcher
collects both quantitative and qualitative data (Creswell, 2014; Creswell & Creswell,
2005). Quantitative data consist of close-ended information in which the researcher sets
the response possibilities in advance (e.g., an opinion instrument with responses from
strongly disagree to strongly agree). In contrast, qualitative data consist of open-ended
information without predetermined response categories (e.g., unstructured observations).
Some research studies collect both forms of data. For example, an ethnography
researcher gathers quantitative survey data and qualitative observation data (Creswell &
Creswell, 2005). A quantitative researcher can use a survey instrument that combines
both close-ended and open-ended questions (Gliner & Morgan, 2000).
The second aspect deals with an integration of data analysis. Generally, the forms
of quantitative and qualitative approaches are distinct. Quantitative approach are usually

112
gathered with an instrument that can be scored reliably (e.g., test and questionnaire).
Qualitative approach deals with procedures of gathering more subjective details (i.e.,
text and image) for interpreting the meaning (Gliner & Morgan, 2000). Regardless of the
limited boundary, some researchers incorporate both approaches. In a grounded theory
design, some quantitative researchers build themes or categories from the numeric data
to generate the thematic development (Creswell, 2014). Some qualitative researchers
analyze text data and then convert them into frequencies in a quantitative fashion
(Creswell, 2014).
The completeness of research problems is the last aspect of the mixed-method
definition. The mixing or interrelating of data provide better insights into research
problems than only one type of data does. Quantitative data offer generalizable trends or
inferences while qualitative data provide in-depth experiences within specific contexts
(Creswell & Creswell, 2005). Both data assist each other by capturing both inferences
and in-depth perspectives.
With the aforementioned rationales, this study combined both quantitative and
qualitative research approaches. It used a mixed-method design called explanatory
sequential design to collect both quantitative and qualitative data simultaneously
(Creswell & Clark, 2011). Explanatory sequential design uses two methodologies in
studying the same phenomenon by using qualitative data to explain quantitative results
(Creswell & Clark, 2011). In this study, explanatory sequential design gathered both data
to compare between the normative quantitative data and the detailed contextualized
qualitative data.
113
This study used the quantitative approach through statistical analysis to develop a
KM correlational model. The quantitative procedures tested the relationships among KM
processes, enablers, and outcomes, and develop the KM correlational model. Then this
study used the qualitative approach through text analysis from open-ended questionnaire
items. These qualitative data provided understandings of the meaning of context
surrounding the gathered data. These understandings produced a wider and deeper
interpretation. Thus the qualitative approach did not only validate quantitative data but
also helped develop the proposed KM model more contextually.
From the utilization standpoint, the mixed-method design aligned well with this
research question— to develop the KM model that explains the relationships among KM
enablers, processes, and performance of HEIs. This design provided both trends and in-
depth perspectives of the KM application in the higher education arena.
Method
This section explained the research procedures covering population and sample,
instrument, data collection method, and data analysis method.
Population and Sample
The population of this study consisted of 142 higher education institutions under
the responsibility of the Ministry of Education (Bureau of Standards and Evaluation,
2015). The sample was 60 Thai universities which gave the researcher permission to
conduct the study. The unit of analysis was a university.
Sampling. This study used the purposive sampling method to select key
informants of each university to provide organization-wide data. Key informants were

114
persons, assigned by universities, who were responsible for managing the KM system at
the institutional level. They were asked to report the KM data on behalf of their
institutions.
The key informant method is a technique to obtain data from persons who are
considered expert sources of information (Hughes & Preski, 1997; Lavrakas, 2008). This
method was established in traditional anthropological research aiming at studying
collective behaviors in a variety of topics, such as family organization, economic system,
and political structure (Hughes & Preski, 1997; Tremblay, 1957). The original purpose
was to provide a relatively ethnographical description of the social and cultural patterns
of groups.
Although the key informant method emphasizes the qualitative technique through
interviewing, it is also possible to get concrete quantitative data (Tremblay, 1957).
According to Hughes and Preski (1997), this method has become one of the collecting
methods for quantitative studies, particularly in survey research. The key informant
method can be applied in organizational survey research through the collection of data
from organizational members. Organizational members can function as either
respondents or informants. As respondents, participants have a role as singular members
to provide data that reflect their own personal perceptions. These data represent the
individual unit of analysis because organizational members respond according to their
own attitudes or beliefs. In contrast, as informants, organizational members are asked to
provide data based on their access to organizational information or specialized
knowledge about organizational phenomena. Thus, these data represent a characteristic
115
of the organization itself. Data from the informant role inherently represent the
organizational unit of analysis.
The 60 universities assigned the KM functions differently. Some appointed only
a key person to be responsible for KM. Others established a KM committee that included
representatives from academic and non-academic units across the institution. Thus, the
number of the respondents in each university was various.
Sample size. This study used Exploratory Factor Analysis (EFA), Confirmatory
Factor Analysis (CFA) with Structural Equation Modeling (SEM) to analyze the
gathered data. These analytical methods are sensitive to the sample size and rely on large
samples. According to Kline’s guideline (2011), a sample size of less than 100 is small,
between 100 and 200 is medium, and more than 200 is large.
Instrument
This study used a questionnaire survey to collect data. The questionnaire
instrument was adapted from the Knowledge Management Assessment Tool (KMAT) to
acquire the data for the KM processes and enablers. This instrument was discussed in
terms of its origin, previous related research, its development for this study, its validity
and reliability, and translation process.
Origin of the instrument. Arthur Andersen Consulting Services and the
American Productivity and Quality Center (APQC) created KMAT in 1997 for use in
industry. KMAT has become a widely recognized KM benchmarking tool used in the
business sector. This tool was designed to help organizations make an initial high-level
assessment of how well they manage knowledge (Jager, 1999). It placed all the major

116
KM processes (knowledge generation, codification, and transfer) and KM enablers
(leadership, culture, technology, and measurement) together in a single system.
Related research. Based on Academic Search Complete (Ebsco) and ProQuest
databases with the search terms “Knowledge Management,” “Higher Education,” and
their related expressions, three research studies that used the KMAT instrument were
found. These three previous studies used the modified version of KMAT to examine
relationships between an organization’s perceived use and importance of KM processes,
and strategic enablers in different higher education settings.
Coukos-Semmel (2002) conducted a dissertation study to examine the
perceptions of university administrators in 161 public and private United States research
universities. He used internal consistency reliability and the face validity to measure the
quality of his instrument. In terms of the internal consistency reliability, this instrument
was greater than the prescribed .70 of the Cronbach alpha values. The reliability values
for each of the seven KMAT constructs varied from .72 (codification) to .93
(technology), indicating the instrument was sufficiently reliable for research purposes.
For the face validity, all constructs’ means, ranging between 3.41-4.21, were above the
moderate level (3.0 on a 5-point scale).
The dissertation of Lee (2007) investigated the perceptions of 319 academic
department chairs in Colleges of Education in the North Central regional states in the
United States. Her instrument (a 5-point scale per item) was acceptably reliable. The
reliability values of seven constructs varied from .66 (leadership) to .86 (technology). In
addition, she invited three experts to review and validate the content of the instrument.

117
This method helped ensure that the modified instrument was appropriate for higher
education settings.
An updated KMAT application in HEIs was used in the study of Ramachadran et
al. (2013) published in Campus-Wide Information Systems Journal. They explored the
perceptions toward KM importance and use of 191 academic staff in four Malaysia
public universities. The reliability of seven constructs ranged between .79 (technology)
to .90 (leadership). Furthermore, they applied two types of validity measurements: face
validity and construct validity. The face validity was used to check for appropriateness,
readability, and comprehensiveness of the instrument. Twenty academics rated the
validity of the modified KMAT based on a criterion that the instrument could measure
what it was intended to measure in the higher education setting. For the construct
validity, they performed factor analysis. With eigenvalues of 1.00 or greater, all items
loaded above .40 (the cut-off value of this analysis). The reliability and the validity of
this instrument supported the adequacy of the measurement used in their study.
The aforementioned research studies endorsed the applicability and usability of
the KMAT instrument in this KM research study. This instrument assisted this study in
examining its research question because it measured the KM processes and enablers, and
it responded to the nature of the population being studied (academic institutions).
Instrument development for this study. The survey instrument used in this
research was the modified version of KMAT. The researcher received permission to use
the instrument from APQC who was the original developer and the researcher who
modified the latest version used in Malaysia. This instrument primarily measured the

118
data for the KM processes and enablers. Since the design of this study was based on the
mixed-method research approach, this instrument collected both quantitative and
qualitative data simultaneously. It combined both close-ended and open-ended
questionnaire items aimed at gathering data that provide numeric data and in-depth
perspectives of the KM application in each institution. The questionnaire included four
sections: institutional demographic information, KM enablers, KM processes, and open-
ended questions.
For the measure of KM processes and enablers, all items were adapted from the
original version of the KMAT instrument and the latest version of the instrument used in
prior KM study (conducted by Ramachadran et al., 2013). The KMAT original version,
used in the business sector, consisted of 24 items while the latest instrument, used in four
Malaysian public universities, was comprised of 42 item. The Malaysian instrument
slightly modified the original items that measured KM enablers and generated more
items on KM processes to cover three components of KM processes (knowledge
generation, codification, and transfer).
The KM instrument used in this study was somewhat different from the original
assessment instrument regarding the clarity of contents, such as (a) separating an original
item that combined more than one action in the same question into two items, (b)
rewording a statement with technical terms into simple and more understandable terms,
(c) changing a passive voice statement into active voice, and (d) adding more items on
KM processes to measure three process components. These revised items helped the
respondents in HEIs better understand the questions and they also covered the

119
measurement of processes and enablers that were the variables in the research model.
Consequently, KM enablers include 25 items while the KM processes consisted of 17
items. Tables 1 and 2 compared the items between KMAT, the updated version used in
Malaysia universities, the modified version used in the subject matter expert (SME)
analysis, and the modified version used in this study. The version used in the SME
analysis would be explained in the next section. Table 1 shows the number of items and
Table 2 illustrates the items in different versions.
Table 1 Number of the Survey Items in the Previous Versions and the Modified
Version in This Study
Variables Original
KMAT items
(APQC, 1997)
Updated items used
in Malaysia
universities
(Ramachadran et
al., 2013)
Modified
items used in
the SME
analysis
Modified
items used
in this study
KM enablers 19 27 27 25
- Culture 5 6 7 7
- Leadership 4 8 9 7
- Technology 6 8 6 6
- Measurement 4 5 5 5
KM processes 5 15 15 17
- knowledge
generation
- 6 6 6
- knowledge
codification
- 5 5 5
- knowledge
transfer
- 4 4 6
Total 24 42 40 42

120
Table 2 Comparison of the Previous Survey Items and the Modified Items Used in
This Study Original KMAT
items
Items used in
Malaysia universities
Modified items
used in the SME
analysis
Modified items
used in this study
(based on the SME
comment)
KM Enablers
Culture
1. The organization
encourages and
facilitates
knowledge sharing.
The university
encourages and
facilitates
knowledge sharing.
The university
facilitates
knowledge
building and
sharing.
The university
culture facilitates
knowledge
building and
sharing.
2. A climate of
openness and trust
permeates the
organization.
A climate of
openness is present
in the university.
The university has
a climate of
openness in sharing
knowledge.
The university has
a culture of
1. openness in
sharing
knowledge.
2. trust in sharing
knowledge.
A climate of trust
is present in the
university.
The university has
a climate of trust in
sharing knowledge.
3. Customer value
creation is
acknowledged as a
major objective of
knowledge
management.
Student value
creation is
acknowledged as a
major objective of
knowledge
management.
The university
acknowledges
student value
creation as a major
objective of
knowledge
management.
The university’s
KM system creates
a knowledge value
for the university’s
achievement of its
missions.
4. Flexibility and a
desire to innovate
drive the learning
process.
Flexibility and a
desire to innovate
drive the learning
process.
The university has
flexibility that
facilitates the
employees’
learning process.
The university’s
KM system
facilitates the
employees’
learning process.
The university has a
desire to innovate
that drives the
employees’ learning
process.
The university’s
desire to innovate
drives employees’
learning processes.
5. Employees take
responsibility for
their own learning.
Individuals take
responsibility for
their own learning.
The university’s
employees take
responsibility for
their own learning.
The university has
a culture of
accountability for
individual learning.

121
Table 2 (continued) Original KMAT
items
Items used in
Malaysia universities
Modified items
used in the SME
analysis
Modified items
used in this study
(based on the SME
comment)
Leadership
6. Managing
organizational
knowledge is
central to the
organization’s
strategy.
Managing
organizational
knowledge is
important in the
university’s
strategic plan.
The university
includes the
management of
organizational
knowledge in the
university’s strategic
plan.
The university
administrators
include the
management of
organizational
knowledge in the
university’s
strategic plan.
7. The organization
understands the
revenue-
generating
potential of its
knowledge assets
and develops
strategies for
marketing and
selling them.
The university
understands the
income generating
potential of its
knowledge assets
(product of R&D,
books, and
consultation).
The university
acknowledges that
managing
organizational
knowledge helps
increase the
incomes from
products of R&D,
books, and
consultations.
The university
administrators
acknowledge that
managing
organizational
knowledge helps
increase income
(e.g., from products
of R&D, books,
and consultations).
8. The university
develops strategies
for selling its
knowledge assets.
The university
develops strategies
for selling its
knowledge assets.
The university
administrators
develop strategies
for selling its
knowledge assets.
9. The organization
uses learning to
support existing
core competencies
and create new
ones.
The university uses
learning to support
existing core
competencies and
create new ones.
The university
administrators
deliberately use
learning to develop
core competencies.

122
Table 2 (continued) Original KMAT
items
Items used in
Malaysia universities
Modified items
used in the SME
analysis
Modified items
used in this study
(based on the SME
comment)
10. Individuals are hired,
evaluated, and
compensated for
their contributions to
the development of
organizational
knowledge.
Individuals are
hired for their
contributions to the
development of
organizational
knowledge.
The university
administrators
reward employees
for their
contributions to the
development of
organizational
knowledge. 11. Individuals are
evaluated for their
contributions to the
development of
organizational
knowledge.
The university
evaluates employees
for their
contributions to the
development of
organizational
knowledge.
12. Individuals are
rewarded for their
contributions to the
development of
organizational
knowledge.
The university
rewards employees
for their
contributions to the
development of
organizational
knowledge.
13. A position (e.g.
chief knowledge
officer) has been
created in the
university to
promote
development of
knowledge relating
to the university’s
core competencies.
The university
creates a position
(e.g. chief
knowledge officer)
to promote the
development of
organizational
knowledge.
The university
administrators need
a specific person to
oversee the
development of
organizational
knowledge.
14. The university has
a vision for
managing
knowledge.
The university has
a vision for
managing
knowledge.
The university
administrators have
a vision for
managing
organizational
knowledge.
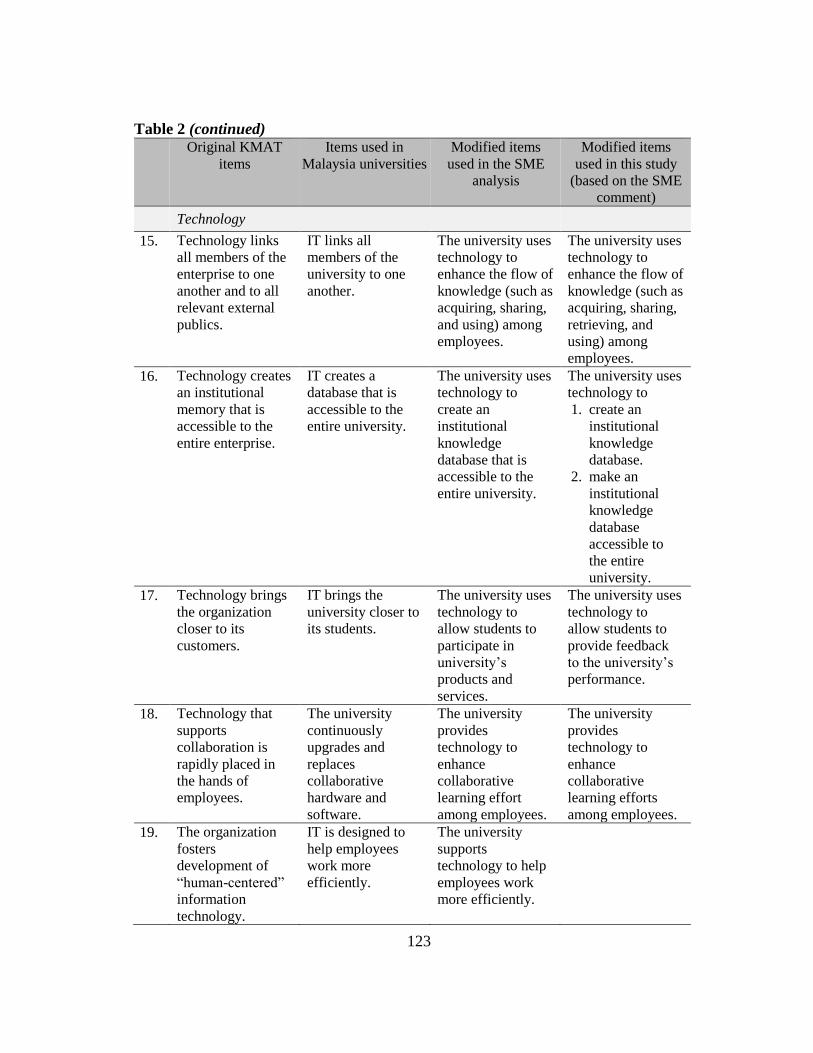
123
Table 2 (continued) Original KMAT
items
Items used in
Malaysia universities
Modified items
used in the SME
analysis
Modified items
used in this study
(based on the SME
comment)
Technology
15. Technology links
all members of the
enterprise to one
another and to all
relevant external
publics.
IT links all
members of the
university to one
another.
The university uses
technology to
enhance the flow of
knowledge (such as
acquiring, sharing,
and using) among
employees.
The university uses
technology to
enhance the flow of
knowledge (such as
acquiring, sharing,
retrieving, and
using) among
employees.
16. Technology creates
an institutional
memory that is
accessible to the
entire enterprise.
IT creates a
database that is
accessible to the
entire university.
The university uses
technology to
create an
institutional
knowledge
database that is
accessible to the
entire university.
The university uses
technology to
1. create an
institutional
knowledge
database.
2. make an
institutional
knowledge
database
accessible to
the entire
university.
17. Technology brings
the organization
closer to its
customers.
IT brings the
university closer to
its students.
The university uses
technology to
allow students to
participate in
university’s
products and
services.
The university uses
technology to
allow students to
provide feedback
to the university’s
performance.
18. Technology that
supports
collaboration is
rapidly placed in
the hands of
employees.
The university
continuously
upgrades and
replaces
collaborative
hardware and
software.
The university
provides
technology to
enhance
collaborative
learning effort
among employees.
The university
provides
technology to
enhance
collaborative
learning efforts
among employees.
19. The organization
fosters
development of
“human-centered”
information
technology.
IT is designed to
help employees
work more
efficiently.
The university
supports
technology to help
employees work
more efficiently.

124
Table 2 (continued) Original KMAT
items
Items used in
Malaysia universities
Modified items
used in the SME
analysis
Modified items
used in this study
(based on the SME
comment)
20. Information
systems are real-
time, integrated,
and “smart.”
Information
reaches appropriate
decision makers in
a timely fashion.
The university
facilitates
information system
to help employees
make better decisions
in a timely fashion.
The university’s
information system
is designed to help
employees make
better decisions in
a timely fashion.
Performance
measurement
21. The organization
has invented ways
to link knowledge
management to
financial results.
The university has
ways to link
knowledge
management to the
budget allocated.
The university has
ways to link
knowledge
management to the
budget allocated.
The university’s
assessment process
has ways to link
KM to the budget
allocated.
22. The organization
has developed a
specific set of
indicators to
manage
knowledge.
The university has
developed a
specific set of
indicators to
manage
knowledge.
The university
develops a specific
set of indicators to
manage
knowledge.
The university has
a specific set of
indicators to
measure KM
outcomes.
23. The organization’s
set of measures
balances hard and
soft as well as
financial and non-
financial
indicators.
The measurement
system measures
intangible assets
(e.g. intellectual
capital).
The university
develops the
measurement
system that
incorporates
measures of
intangible assets
(e.g. intellectual
capital).
The university has
a measurement
system that
incorporates
measures of
intangible assets
(e.g., intellectual
capital)
24. The organization
allocates resources
toward efforts that
measurably
increase its
knowledge base.
The university
allocates resources
toward efforts that
measurably
increase its
knowledge base.
The university
allocates resources
toward efforts that
measurably
increase its
knowledge base.
The university
allocates resources
for efforts that
measurably
increase its
knowledge.
25. The university’s
annual report
includes an
assessment of how
knowledge capital
has contributed to
bottom line use.
The university’s
annual report
includes an
assessment of how
knowledge has
contributed to
organizational
performance.
The university’s
annual report
includes an
assessment of how
knowledge has
contributed to
organizational
performance.

125
Table 2 (continued) Original KMAT
items
Items used in
Malaysia universities
Modified items
used in the SME
analysis
Modified items
used in this study
(based on the SME
comment)
KM Processes
Knowledge
generation
26. Knowledge gaps
are systematically
identified, and well-
defined work
processes are used
to close them.
Knowledge gaps
are systematically
identified.
The university
identifies
organizational
knowledge gaps
systematically.
The university
identifies
organizational
knowledge needs
systematically.
27. Well-defined work
practices are used
to close knowledge
gaps.
The university uses
well-defined work
practices to close
knowledge gaps.
The university uses
well-defined work
practices to address
knowledge needs.
28. The university
creates a map of its
organizational
knowledge,
indicating where
information is
located and how to
access it.
The university creates
a map or diagram of
its organizational
knowledge, indicating
where information is
located and how to
access it.
The university
creates its
organizational
knowledge
directories that list
employees’ skills,
knowledge, and
location.
29. Knowledge
directories that list
employees’ skills,
knowledge,
location, and how
to reach them exist.
The university
creates knowledge
directories that list
employees’ skills,
knowledge,
location, and how
to reach them.
30. Knowledge
directories of other
groups aligned
with the university
are also
disseminated.
The university
disseminates
knowledge
directories of other
groups (outside the
university) aligned
with the university.
The university
creates directories
with specialized
knowledge of other
groups (outside the
university) aligned
with the university.
31. Sophisticated and
ethical intelligence-
gathering
mechanism has
been developed.
The university
excels at scanning
the environment
for information.
The university
develops mechanisms
to gather intellect
knowledge
systematically and
ethically.
The university
develops
mechanisms to
1. gather knowledge
systematically.
2. gather knowledge
ethically.

126
Table 2 (continued) Original KMAT
items
Items used in
Malaysia universities
Modified items
used in the SME
analysis
Modified items
used in this study
(based on the SME
comment)
Knowledge
codification
32. “Tacit” knowledge
(what employees
know how to do
but cannot express)
is valued and
transferred across
the university.
“Tacit” knowledge
(what employees
know how to do
but cannot express)
is valued across the
university.
The university
values “tacit”
knowledge (what
employees know
how to do but
cannot express)
across the
university.
The university
transfers its tacit
knowledge (what
employees know
how to do but
cannot express)
across the
university through
1. supporting
knowledge
platforms to
share tacit
knowledge, such
as a KM sharing
day, a story
telling activity,
or mentoring.
2. supporting
technology to
make tacit
knowledge
accessible and
retrievable.
33. “Tacit” knowledge
(what employees
know how to do
but cannot express)
is transferred
across the
university.
The university
transfers “tacit”
knowledge (what
employees know
how to do but
cannot express)
across the
university.
34. The university has
systems for
identifying and
passing on the
internal knowledge
of individual
employees (e.g.
rotation of divisional
personnel,
apprenticeship, site
visits, sabbaticals,
and mentoring).
The university has
systems for
identifying and
passing on the
internal knowledge
of individual
employees.
The university has
mechanisms in
place to make
employees’ past
know-how
1. explicit.
2. accessible.
3. remain within
the university
when they leave
the university.
35. Past know-how is
made explicit and
accessible.
The university
makes employees’
past know-how
explicit and
accessible.

127
Table 2 (continued) Original KMAT
items
Items used in
Malaysia universities
Modified items
used in the SME
analysis
Modified items
used in this study
(based on the SME
comment)
36. Most of the
employees’
knowledge remains
within the
university when
they leave the
university.
The university
makes sure
employees’ know-
how remains
within the
university when
they leave the
university.
Knowledge transfer
37. All members of the
organization are
involved in looking
for ideas in
traditional and
nontraditional
places.
The university
provides locations
and occasions for
employees to talk
and to listen to one
another and
interact informally.
The university
provides locations
and occasions for
employees to meet,
talk and listen to
one another and
interact informally.
The university
provides
opportunities for
employees to
1. meet informally
to share
knowledge.
2. build their
knowledge
networks.
38. The organization
has formalized the
practice of
transferring best
practice, including
documentation and
lessons.
The university has
formalized the
practice of
transferring best
practice, such as
documentation and
lessons learned.
The university
shares the best
practices and
lessons learned to
improve work
performance in the
university.
The university
widely
communicates
1. the best
practices to
improve work
performance.
2. lessons learned
to improve work
performance.
3. success stories
to improve work
performance
39. Success stories
involving new
approaches are
widely
communicated in
the university.
The university
widely
communicates
success stories in
improving
organization
performance.
40. Knowledge
practices are
rapidly
communicated
through the
university, making
it easy to transfer
best practices.
The university
invests in
transferring an
individual’s
knowledge to
others more
effectively.
The university
strategically invests
resources in
applying
organizational
knowledge into
job.

128
All in all, the final questionnaire included 48 items. In the first section of the
instrument, the respondents were asked to provide four institutional demographic
information that would support further analysis regarding other contextual factors that
comprised an institution’s type and mission orientation. Furthermore, 42 items of the
KM processes and enablers were measured on a Likert-type scale ranging from 1
(Almost Never) to 5 (Almost Always). Finally, this instrument incorporated two open-
ended questions to ask the respondents to describe the three internal factors that
significantly support or block successful KM. These data for open-ended questions
provided the unique and contextual understandings of the state of KM in each university,
including its KM processes and enablers.
Validity and reliability of instrument. The instrument of this study was used in
the academic sector and in Thai language. The use of this modified instrument differed
from the original English version that was commonly used in business. Thus, the validity
and reliability analysis was performed to ensure the study’s quality. Validity is widely
known as accuracy that the instrument is measuring what it intends to measure (Gliner &
Morgan, 2000). A valid measure is a measure that can be used to answer a research
question accurately (Russ-Eft & Hoover, 2005). The nature of reliability relates to
replication. If a reliable measurement is repeated, it will produce similar results. In the
instrument measurement context, reliability is the degree to which a test consistently
measures whatever it measures (Gliner & Morgan, 2000; Russ-Eft & Hoover, 2005).
Validity. This study conducted two pre-pilot tests by using the SME analysis
technique to measure the content validity. The first pre-pilot test involves a panel of

129
three KM experts who know the English language. Commonly, a minimum of three
experts is an appropriate number for the content validity measurement (Lynn, 1986).
These three experts were selected from (a) practitioners who work in the KM field or
have a responsibility for KM implementation in their organizations, and (b) professors
who teach KM courses or have KM publications. This panel was formed to review the
contents of the survey questionnaires. It aimed to verify that the content of the
instrument matches the contents of what this study intends to measure (Gliner &
Morgan, 2000). The researcher translated instrument into Thai language because this
study was conducted in Thailand. Thus, the second pre-pilot test, a panel of the three
Thai KM experts was also assigned to review the survey contents to match the Thai
language and cultural context. These three Thai experts were conveniently selected from
either KM managers or KM committee members from Thai universities. The translation
process would be explained more in the next section.
This study had two purposes to measure content validity (Devriendt, Van den
Heede, Coussement, Dejaeger, Surmont, Heylen, Schwendimann, Sexton, Wellens,
Boonen, & Milisen, 2012). The first purpose involved the relevance of each
questionnaire item to its construct. The experts were asked to rate each item on its
relevance to its construct using a 4-point scale, ranging from not relevance (score 1),
somewhat relevant (score 2), quite relevant (score 3), and highly relevant (score 4). The
second purpose involved the clarity of the items. The experts were asked to comment
whether the item should be revised and propose a better statement if the item is not

130
understandable. The items that were rated 1 or 2 were carefully considered to remain or
delete from the list.
Reliability. The pilot test was done to develop an appropriate measure for the
targeted samples and to examine the reliability of the revised instrument. For this
research, reliability analysis was conducted to determine if the results of using the
selected instruments are consistent and replicable. Reliability is estimated by internal
consistency. The internal consistency reliability helps determine if an instrument is
consistent among its items— an instrument measures a single construct or concept
(Gliner & Morgan, 2000). One of the most common internal consistency reliability
measurements is Cronbach’s alpha. Cronbach’s alpha is an index of reliability associated
with the variation accounted for by a true score of a hypothetical variable that is being
measured (Santos, 1999). Cronbach’s alpha values greater than .70 (> .70) is considered
reliable for the internal consistency of the instruments (Kline, 2011).
The sample size of the pilot test was 30 participants (Isaac & Michael, 1995). A
web-based survey instrument for the pilot study was randomly sent to quality assurance
assessors of 30 universities. Twenty five participants completed the survey. Cronbach’s
alpha values of seven constructs were as the followings: culture (.90), leadership (.83),
technology (.92), measurement (.81), knowledge generation (.84), knowledge
codification (.90), and knowledge transfer (.96).
Translation of instrument. The original research instrument was developed in a
Western context, whereas this study was conducted in an Eastern culture which differs in
language and culture. Thus this study used the forward-backward translation to translate

131
instruments into the language of the culture being studied. This translation conducted
both from the original language of the instruments (English) to the language of
participants (Thai) and in the reverse direction, called forward and backward translation
(Degroot, Dannenburg, & Vanhell, 1994). This instrument was originally developed by
the English language, then the researcher translated it into Thai. Finally, the IRB cultural
evaluators, a Thai professor who understands both Thai and English languages,
translated back into English. Backward translation helped the researcher verify whether
the translation covers all aspects of the original language (Degroot et al., 1994).
Equivalence of meaning was checked after each translation.
Data Collection
Data collection included two components, including the data source and the data
collection procedure.
Source of data. Data came from two resources: the questionnaire survey and the
archival source. The online questionnaire survey was provided for key informants in
each institution. Archival data consisted of quality assurance performance scores from
the Ministry’s published database.
The 48-item questionnaire survey provided the data in relation to institutional
demographic information, KM enablers, KM processes, and factors for supporting and
blocking successful KM (Appendix 1). The explanation of the development of this
survey instrument was discussed previously.
The archival data were any sort of data previously collected by others and
amenable to systematic study (Jones, 2010). Normally various archival sources included
132
public documents and official records, private documents, mass media, physical or
nonverbal materials, and social science data archives. This study derived the archived
QA scores from the 2014 academic year from the Commission of Higher Education in
Thailand. The researcher examined the archival data because these data were publicly
available on the Commission’s website and they were expected to have better accuracy
than the survey responses for QA data. Moreover, the archival data method could reduce
the respondents’ burden to provide the QA scores (Russ-Eft & Preskill, 2009).
The QA scores portrayed overall organizational performance scores that were
assessed by appointed QA teams from the Commission. This study retrieved the QA
scores from the Commission’s database, called the CHE QA online system. This system
was the single integrated database that combined the universities’ self-assessment
reports and the assessors’ reports based on the QA performance criteria. Under the QA
scoring system, the QA criteria were classified into nine groups that represented multiple
institutional achievements: philosophy, mission, objectives and identities; production
and quality of graduates; student development activity; research; academic services and
social responsibility; preservation of art and culture; administrative management; finance
and budgeting; and quality assurance system and mechanism. This study used the total
score of all nine criteria used by the Ministry, since it represented the institution-wide
performance.
Data collection procedure. The data collection followed these procedures
(Figure 11).

133
Figure 11. Timeline for Data Collection
April May June
July
August
Week 2
a) IRB
approval for
a pilot study
b) Pre-pilot
study
c) Pilot study
d) Instrument
revision
based on the
pilot study
IRB
approval
for this
study
a) Letter of
introduction
from the Office
of Association of
Higher
Education
Institutions of
Thailand
b) Recruitment
process
- Letter to each
university
asking for
permission to
conduct the
study and
assign a
contact person
- Reminder letter
to not-yet-
responded
universities
a) Online survey
administration
- Email to an
assigned contact
person of each
university to
forward an
email with a
survey link to
participants
- Reminder email
and call to
contact persons
to forward the
- Thank you
email to contact
persons
b) Archived QA
scores from the
CHE QA online
system
Close the
survey
The first step involved a logistics pilot study starting at April 2015. It started with
obtaining the Texas A&M University Institutional Review Board (IRB) approval for the
pilot study. The survey instrument used in this study was tested during the pre-pilot test
and the pilot test to examine its reliability and validity as mentioned in the instrument
development section. Then the researcher revised the instrument to improve the

134
effectiveness of the survey administration. In May, the researcher submitted the IRB
application for the regular study to obtain the IRB approval.
The next step was to ask for a letter of introduction from the Office of
Association of Higher Education Institutions of Thailand. This letter was sent to
universities to request their participation in the study. This strategy was expected to lead
to greater cooperation and response from institutions. Then the recruitment was
processed in the middle of June. The researcher sent an official letter to 142 universities
to ask permission to include the institution in the study and collect data from the
institution’s staff members. This letter introduced the study, the researcher, and the
benefits and potential harm to participants and institutions (Appendix 2). The
universities that granted the permission returned the permission form, including a name
and an email address of the contact person at the institution (Appendix 3). The contact
person had a role in distributing the e-survey to persons who were responsible for KM,
such as KM committee members. After one month, the researcher followed up by
sending a reminder letter to not-yet-responded institutions.
The administration of questionnaire surveys was performed beginning in July.
Sixty institutions (42 percent) agreed to take part in this study. Upon agreement of the
decision maker of each institution, the researcher emailed a letter to the contact persons
of the 60 universities to forward the researcher’s email with the Qualtrics online survey
link. After two weeks (Nulty, 2008), a reminder email was sent to contact persons who
did not forward the survey email to participants. One week after sending the reminder
email, the researcher called to persons who did not forward the email. Then, the

135
researcher sent a thank you email to the contact persons to thank them for their
assistance.
During July, the researcher also accessed the CHE QA online system to retrieve
the QA scores of the 60 universities. Then the researcher entered the scores in the data
spreadsheet for further analysis.
Finally, the process of questionnaire survey administration was completed in the
middle of August. The researcher downloaded the data from the Qualtrics system for
data analysis. The 181 respondents from 60 universities voluntarily participated in
completing the e-survey. Then the researcher identified true response cases. This step
aimed to delete inadmissible cases when respondents partially complete the survey
questions. The true response cases were the case that at least 77% of survey questions
were answered (Cohen & Cohen, 1983). Thirty-one of the 181 cases in the raw data had
missing values on 13 or more items out of the 42 quantitative items. Finally, the 150
cases were used for data analysis. The target for the sample size was greater than 100 to
reach the acceptable analysis.
Data Analysis
This study used the mixed-method research approach to guide the research
protocol. Two distinct approaches were used to analyze data.
Quantitative analysis. The quantitative analysis was performed to test a
correlational model linking KM enablers and KM processes on organizational
performance. The data from the questionnaire survey and archival sources was entered
and coded.

136
The data analysis included descriptive statistics, EFA, and CFA with SEM. The
IBM Statistical Package for Social Sciences (SPSS) version 22 was used for descriptive
statistics, EFA, and reliability Cronbach’s alpha. Mplus version 7.3 was used for CFA
and SEM analysis. SEM was utilized to investigate the hypothesized theoretical model
and structural relationships.
Descriptive statistics. To describe the main features of a sample, this study
calculated descriptive statistics for key variables, including institutions’ profiles, KM
enablers, processes, and QA scores. Continuous variables (KM enablers, processes, and
QA scores) was presented in terms of means and standard deviations. Categorical
variables (institutions’ profiles) was presented in terms of percentages and counts. Then,
a correlation matrix and alpha coefficients were provided for the statistical analysis.
Exploratory Factor Analysis (EFA). EFA is one of the two types of factor
analysis. The fundamental idea of factor analysis is that some variables cannot be
directly observed (Kline, 2011). These unobserved variables are referred to as latent
factors. Latent factors can be generated by observing their influences on measured or
observed variables (Meyers et al., 2013). Factor analysis examines covariation among a
set of measured variables, trying to identify structure with the minimum latent factors.
EFA is often used in scale construction to explore the dimensionality of a
measurement instrument (Muthén & Muthén, 2008). This analysis finds the smallest
number of factors needed to explain the correlations among a set of variables (Muthén &
Muthén, 2008). At the conclusion of the analysis, the interpretation of the factor is based
on measured variables that are most strongly associated with it (Meyers et al., 2013).

137
Confirmatory factor analysis (CFA). This study also used CFA because the
factor analysis is driven by the theoretical relationships among the measured variables
and the latent factors (Schreiber, Stage, King, Nora, Barlow, 2006). The objective of
CFA is to determine if the relationships between the variables in the hypothesized model
capture the relationships between the variables in the actual or observed data set (Meyers
et al., 2013). In other word, CFA is widely used to study how well a hypothesized factor
model fits a new sample from the same population or a sample from a different
population (Muthén & Muthén, 2008).
Technically, when CFA is conducted, a hypothesized model will be used to
estimate a population covariance matrix that is compared with the observed covariance
matrix (Schreiber, et al., 2006). The goodness of fit index comparing the two matrices
provides support for the model.
CFA models are usually presented in the form of diagrams as graphic
representations of theoretical models or conceptual structures (Meyers et al., 2013). CFA
models contain three components (as shown by Figures 9 and 10): (a) measured
(observed) variables, represented in the diagrams by rectangles or squares; (b) latent (not
directly observed) factors or constructs, represented in the diagrams by ovals or circles;
and (c) paths (direction of hypothesized cause or influence) represented in the diagram
by lines with arrows pointing in a given direction or directions (Meyers et al., 2013).
CFA can be either a stand-alone analysis or an embedded analysis in a study of a
larger structural model (Meyers et al., 2013). The stand-alone analysis (a relatively
simple structural model) aims to test the viability of a hypothesized factor structure.

138
When CFA is included in a larger structural model, it aims to relate the latent factors to
other variables or constructs.
In the SEM analysis, the confirmatory portion is a measurement model because it
assesses the statistical quality of the latent factors based on the measured variables that
represent them (Schreiber, et al., 2006). A poor fit of the measurement (CFA) model to
the data can cause the entire structural model to perform poorly (Meyers et al., 2013).
However, a good fit of the measurement model does not ensure that the larger structural
model will work well but only that its analysis is justified.
Structural equation modeling. This study aimed to develop and test a
relationship model linking KM enablers and KM processes to organizational quality
performance. SEM helps suggest how the variables (KM processes, enablers, and QA
scores) affect each other in the theorized or hypothesized model. Then SEM analyzes the
overall model with the actual data set collected from the survey and the archival data to
identify how well the model fits with these data. If the hypothesized model captures the
data, this model can indicate the relationship of variables (Meyers et al., 2013).
Causality in SEM should be discussed. Some scholars use the causal
terminology in SEM because they believe that SEM can establish a causal relationship
with their studied models so it implies causation between variables (Bollen & Pearl,
2013). If a model is estimated and shows a significant coefficient, then the researcher
feels justified to conclude that a significant causal influence exists between the two
variables. However, this belief is incorrect because SEM does not establish causality
from models of partial associations alone. For example, a father’s occupation leads to his

139
child’s performance on an intelligence test, and these two variables (father’s occupation
and child's intelligence score) are correlated. This does not mean that the father’s
occupation directly causes the child’s intelligence (Anderson & Gerbing, 1988).
SEM is a statistical inference technique that “takes in two inputs, qualitative
causal assumptions and empirical data, and derives two logical consequences of these
inputs: quantitative causal conclusions and statistical measures of fit for the testable
implications of the assumption” (Bollen & Pearl, 2013, p. 13). Fitting the data does not
prove the causal assumptions, but it makes them tentatively more plausible. Failure to fit
the data shows weak causal assumptions of zero coefficients or zero covariances, and
guides a researcher to further diagnose the models. With the aforementioned discussion,
this study avoids use of the causal terminology in SEM.
SEM is the combination of the measurement model and the structural model. The
measurement model represents the degree to which the indicator variables capture the
essence of the latent factors (Anderson & Gerbing, 1988; Meyers et al., 2013). This
model is the CFA portion of the SEM model (Holbert & Stephenson, 2002; Kline, 2011;
Schreiber, et al., 2006). Another model called the structural model tests a set of
hypothesized relations among two or more latent variables (Holbert & Stephenson,
2002). It looks at the relationships between the latent variables of interest in the theory
(Meyers et al., 2013). This model is the path analysis portion of the SEM model (Kline,
2011). The path model is a structural model for observed variables and it is represented
by a single arrowhead ( ) that points from X to Y representing a direct effect (Kline,
2011).

140
When a SEM model is proposed (relationships between variables are
hypothesized), a correlation or covariance matrix is created (Kline, 2011). Then the
estimates of the relationships between the variables in the model are calculated using the
maximum likelihood estimation procedure. Finally, the overall SEM model is compared
with the actual or observed data set. If the two matrices (the one based on the
hypothesized model and the one derived from the actual or observed data) are consistent
with one another, the model can be considered a credible explanation for the
hypothesized relationships. The structure emerging from analysis of the actual or
observed data matches the hypothesized structure in the theoretical model.
The SEM analysis can be performed through four steps, the first of which is
model specification. Model specification refers to setting hypotheses in the form of the
structural equation model (Kline, 2011) or setting the metric (variances) of the factors
(Anderson & Gerbing, 1988). The structural equation model can be specified by two
types of variables (Meyers et al., 2013): (a) an exogenous variable is a variable that has
not presumed to be explained by other variables in the model; and (b) an endogenous
variable, in contrast, is a variable that is explained by other variables in the model. In
this study, the exogenous latent variables includes KM enablers (leadership, culture,
technology, and measurement). The endogenous latent variables consist of KM
processes and QA scores.
Second, model identification involves the step when the SEM software (Mplus)
generates a set of model parameter estimates (Kline, 2011). The requirements for
identifying any structural equation model involve: (a) the model degrees of freedom (the

141
number of observations minus some values that limit the observations’ freedom to vary)
must be at least zero, and (b) every latent factor must be assigned a scale (metric) that
leads to a number of parameters and observations (Kline, 2011).
There are three scenarios for model identification (Holbert & Stephenson, 2002).
Over-identification occurs when there are more known parameters (or known values) for
the model than unknown parameters (or estimated parameters). The number of known
parameters is the number of covariances or r(r + 1)/2; where r is the number of variables
in the model. Unknown parameters are those for which the SEM process will generate
numerical values. If a model has one or more degrees of freedom, then it is over-
identified. If a model has zero degrees of freedom, then it is just-identified. If a model is
under-identified, most SEM programs will not perform the analysis. Thus, the
hypothesized model should be over-identified—the model has more numbers of known
parameters than unknown parameters.
Third, estimation of the model aims to find a set of parameter estimates that can
minimize the Maximum Likelihood (ML) estimate. The ML estimate is one of the most
common methods for estimations of structural path coefficients and model-fitting
(Anderson & Gerbing, 1988; Kline, 2011). ML describes the statistical principle that
underlies the derivation of parameter estimates. The estimates are the ones that
maximize the likelihood (the continuous generalization) that the data (the observed
covariances) were drawn from (Kline, 2011).
The fourth step is model evaluation. This step involves testing the hypothesized
model through ML estimation. Model fit will be tested to determine if the hypothesized

142
model should be accepted or rejected. Two methods of overall model evaluations
include: (a) chi-square test and (b) goodness-of-fit index.
Chi-square (χ2) aims to test the fit of the hypothesized model by comparing with
the actual or observed data set (Meyers et al., 2013). If the two matrices (the one based
on the hypothesized model and the one derived from the actual data) are consistent with
one another, then the model is acceptable for explaining the hypothesized relationships
as shown by a chi-square value that is nonsignificant meaning there is minimal
difference between the observed and computed matrices. Chi-square (χ2) is the product
(N-1) FML where FML is the value of the statistical criterion (fit function) minimized in
ML estimation and (N-1) is one less than the sample size (Kline, 2011). The
hypothesized model with an acceptable fit should yield a p value that is ≥ 0.05. A non-
significant chi-square (χ2) score (p > .05) leads to the acceptance of the hypothesized
model (Holbert & Stephenson, 2002). It implies that the hypothesized model can capture
the data of the actual or observed data model. If the hypothesized model fits, the pattern
coefficients of the observed variables and the structural path coefficients of the latent
factors will be examined (Holbert & Stephenson, 2002). If the model does not fit,
adjustments can be made to improve the match between the two matrices.
Goodness-of-fit index explains the size of misfit (Kline, 2011). Two types of
goodness-of-fit indices include Root Mean Square Error of Approximation (RMSEA)
and Comparative Fit Index (CFI).
RMSEA is scaled as a badness-of-fit index where a value of zero indicates the
best fit (Kline, 2011). It represents the difference between each cell in the observed

143
matrix and the computed matrix where a zero would mean perfect match. The cut-off
values of RMSEA are 0.05 or less (≤ .05) indicating good fit, and 0.08 or less (≤ .08)
indicates fair fit of the hypothesized model to the actual data (Hu & Bentler, 1999).
CFI measures the relative improvement in the fit of a hypothesized model over
that of a baseline or null model (Kline, 2011). The CFI index ranges between 0 and 1,
with values near 1 indicating a better fit. CFI with a good fit is greater than .90 (> .90;
Hu & Bentler, 1999).
In sum, SEM helps verify the hypothesized interrelationships model. SEM
primarily tests a relationship model that suggests how the variables might affect each
other. Then it assesses how well the hypothesized model reproduces the relationships
found in the data. (Meyers et al., 2013).
Qualitative analysis. Qualitative data of this study were drawn from the open-
ended questions asking internal factors for supporting and blocking successful KM.
Qualitative analysis involved a variety of processes of coding, categorizing, identifying
themes, and assigning meaning to the collected text data. The identification of themes
requires coding and sorting that are necessary for qualitative research (Cardona, Jain, &
Canfield-Davis, 2012).
The analysis process started with looking for patterns within the data and sorting
them into general themes. Then, the data were identified in specific thematic categories
and coded using colored markers. The qualitative analysis followed four guidelines of
Guba and Lincoln (1981) to develop the categories: (a) the frequent occurrence of an
activity or mention of an issue, (b) the comments and activities that participants

144
considered realistic and credible, (c) the unique concerns and issues, and (d) the items
facilitating inquiry pertinent to the study. Finally, the meaning of the organized data
were interpreted so that it answers the research question. These qualitative data led to a
context of KM process and enablers in each Thai university.
Summary
Chapter III elaborated on how to conduct this study. It started with restating the
study’s purpose and research question— to develop an inclusive KM model that can be
generalized in higher education. The mixed-method methodology guided the research
protocols. The population of this study was 142 higher education institutions in
Thailand.
Data came from the revised 48-item questionnaire survey and the online archival
data. The survey instrument for the KM processes and enablers was the modified version
of KMAT, originated by APQC. This instrument was tested validity and reliability
through three steps: (a) the panel of the three KM experts verified the match of the
instrument contents and the construct’s contents that this study intended to measure; (b)
the panel of the three Thai KM experts reviewed the instrument contents to match the
Thai language and cultural context; and (c) the 25 respondents were asked to complete
the pilot-test survey to examine the reliability of the instrument. Consequently, the
instrument included 42 items (5-scale) of the KM processes and enablers, four
measurements of institutional demographic information, and two open-ended questions.
Data collection started in June 2014 after the approval of the TAMU IRB. The
electronic questionnaire survey administration was completed in the middle of August.

145
The 181 respondents from 60 universities voluntarily participated in the e-survey. Then
the researcher identified true response cases, which were 150 cases from 60 universities,
for data analysis.
Data analysis combined quantitative and qualitative approaches. Quantitative
analysis using descriptive statistics, EFA, CFA, and SEM tested a correlational model
linking KM enablers and KM processes on quality assurance scores. The use of
qualitative analysis led to the contextual understandings of KM processes and enablers
in each university.

146
CHAPTER IV
FINDINGS
Chapter IV reported the results of the study from the quantitative and qualitative
data. This chapter included the quantitative analyses from descriptive statistics, EFA,
CFA, reliability analysis, and SEM. The thematic analysis was also reported for the
qualitative data.
Before analyzing the quantitative data, the researcher checked the original raw
data set for accuracy, missing data, multivariate normality, and univariate normality. For
accuracy, the researcher examined the frequency tables of the 42 quantitative variables
to identify the existence of out-of-range values (Meyers et al., 2013). The accurate
values should range from 1 to 5. Missing data can affect the accuracy of data analyses.
Therefore, the researcher identified true response cases by deleting inadmissible cases
when respondents partially completed the survey questions, as previously mentioned in
Chapter III. Since this study provided the choice of not applicable (NA) in the rating
scale, the raw data were carefully checked to identify the case that at least 77% of survey
questions were answered. Therefore, the researcher used 150 cases as the final sample size
for this study.
The issue of sample size is critical in SEM. However, there is no absolute
standard with regard to an appropriate sample size to all situations in SEM (Muthen and
Muthen, 2002). Some researchers (Boomsma & Hoogland, 2001; Kline, 2011)
considered that a sample size greater than 200 is adequate for SEM. Inversely, SEM

147
models can be meaningfully tested even if sample size is less than 200 (Wang & Wang,
2012). Muthen and Muthen (2002) suggested that an appropriate sample size for a
simple SEM model with normally distributed indicator variables is 150. The recent
study, by Sideridis, Simos, Papanicolaou, and Fletcher (2014), assessed the impact of
sample size on the power and fit of SEM using chi-square Type I errors, model
convergence, RMSEA, and confidence intervals of the RMSEA. The results showed that
a sample size between 50 and 70 is acceptable to conduct SEM since it can maintain low
Type-I error rates and ensure RMSEA values between .05 and .08. Based on the
previous studies, 150 is acceptable for conducting this study.
Not only the determination of appropriate sample size needs to be considered, but
also the assumption of multivariate normality is required to achieve. The underlying
procedure in SEM is based on the assumption of multivariate normality that expects to
see the variables that are normally distributed (Kline, 2011). The instance of multivariate
normality can be examined by the inspection of univariate distributions (Kline, 2011).
Therefore, univariate normality was utilized for the multivariate normality inspection in the
study. Univariate normality in the study that has more than 40 cases could be examined by
skew and kurtosis (Kline, 2011). Skew implies that the shape of a unimodal distribution is
asymmetrical about the mean of a variable. Positive skew indicates that most of the scores
are below the mean, and negative skew indicates that most of the scores are above the mean.
Kurtosis represents the peakedness of the distribution. The results of this study indicated
no extreme skewness or kurtosis or of any variables (the criteria of normality is ± 1). The
skewness measures ranged from -0.09 (TR37) and 0.95 (CU3), with the exception of

148
these three items: -1.03 (CU1), -1.06 (CU7), and -1.20 (ME22). The kurtosis measures
ranged from -0.06 (CU22) and -0.97 (TE17); except six items: -1.01 (CU7), -1.08
(LE19), 1.13 (ME22), 1.03 (CO32), -1.12 (TR37), and -1.01 (TR38). The researcher did
not perform transformation of data because the departures from the normal distribution
were not extreme and a sample size that was more than 40 cases could affect a possible
threat of non-normality in multivariate analyses (Meyers et al., 2013).
Descriptive Statistics
The researcher used SPSS version 22 for computing descriptive statistics. The
150 respondents completed 4 demographic questions and 42 quantitative items.
Demographic Characteristics
Table 3 reports the respondents’ demographic variables: type, mission
orientation, and location of the universities. Most respondents (n = 101, 67.3%) were
from public universities while others (n = 49, 32.7%) were form private universities. The
majority of the respondents worked at teaching universities (n = 135, 90.0%) and 10%
worked at research universities (n = 15, 10.0%). One third of the respondents working at
the universities that located in Bangkok and metropolitan areas (n = 54, 36.0%). Overall,
the sample of this study can represent the characteristic of the Thai universities by
covering their different types, missions, and locations.
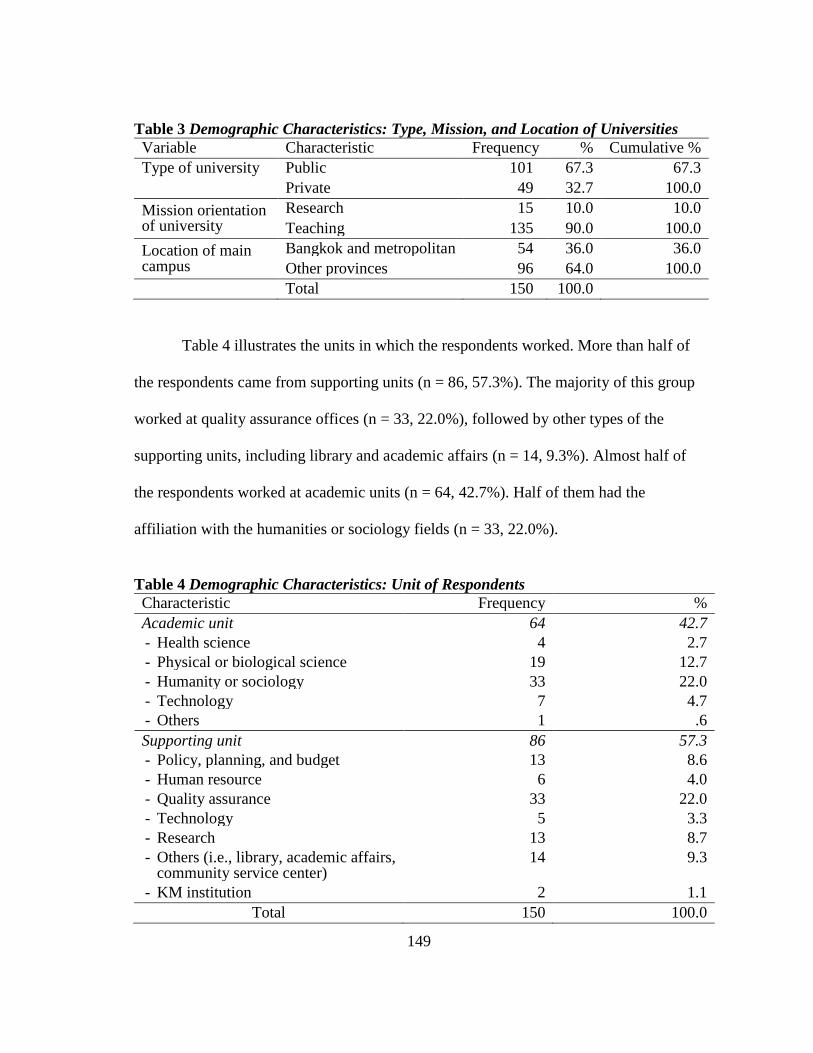
149
Table 3 Demographic Characteristics: Type, Mission, and Location of Universities
Variable Characteristic Frequency % Cumulative %
Type of university Public 101 67.3 67.3
Private 49 32.7 100.0
Mission orientation of university
Research 15 10.0 10.0
Teaching 135 90.0 100.0
Location of main campus
Bangkok and metropolitan 54 36.0 36.0
Other provinces 96 64.0 100.0
Total 150 100.0
Table 4 illustrates the units in which the respondents worked. More than half of
the respondents came from supporting units (n = 86, 57.3%). The majority of this group
worked at quality assurance offices (n = 33, 22.0%), followed by other types of the
supporting units, including library and academic affairs (n = 14, 9.3%). Almost half of
the respondents worked at academic units (n = 64, 42.7%). Half of them had the
affiliation with the humanities or sociology fields (n = 33, 22.0%).
Table 4 Demographic Characteristics: Unit of Respondents
Characteristic Frequency %
Academic unit 64 42.7
- Health science 4 2.7
- Physical or biological science 19 12.7
- Humanity or sociology 33 22.0
- Technology 7 4.7
- Others 1 .6
Supporting unit 86 57.3
- Policy, planning, and budget 13 8.6
- Human resource 6 4.0
- Quality assurance 33 22.0
- Technology 5 3.3
- Research 13 8.7
- Others (i.e., library, academic affairs, community service center)
14 9.3
- KM institution 2 1.1
Total 150 100.0

150
The number of the respondents in each university was summarized in Table 5.
Thirty-three universities (55.0%) had one representative who responded to the survey.
Multiple respondents were the representatives of the 27 other universities (45.0%). The
highest number of respondents who represented in one university was 12.
Table 5 Demographic Characteristics: Number Respondents of Each University
Number of the respondents
of each university Frequency % Cumulative %
1 33 55.0 55.0
2 8 13.3 68.3
3 2 3.3 71.7
4 7 11.7 83.3
5 5 8.3 91.7
6 1 1.7 93.3
7 2 3.3 96.7
10 1 1.7 98.3
12 1 1.7 100.0
Total 60 100.0
Descriptive Statistics for the Quality Performance Scores
The quality performance scores are summarized in to three groups in Table 6.
Among the 150 respondents from the 60 universities, two respondents (1.3%) were in
the universities that had scores between 2.00 to 3.50. The majority of the respondents
(62.7%) were in the range of 3.51 - 4.50 on a 5-scale. Fifty-four respondents were in the
range of 4.51 and higher.

151
Table 6 Descriptive Statistics for the Quality Performance Scores
Score range Frequency % Cumulative %
2.00 – 3.50 2 1.3 1.3
3.51 – 4.50 94 62.7 64.0
4.51 – 5.00 54 36.0 100.0
Total 150 100.0
Descriptive Statistics for the Quantitative Items
Descriptive statistics for the 42 quantitative items were analyzed separately into
each construct in two tables: KM enablers (4 factors and 25 items) in Table 7 and KM
processes (3 factors and 17 items) in Table 8. The statistics were calculated by using
SPSS 22 that showed the means and the standard deviations (SD) along with the
minimum (Min) and maximum (Max) scores for each item. The means for KM enablers
ranged between 3.33 - 4.38 and the means for KM processes varied between 3.12 - 3.96.
Table 7 Descriptive Statistics for the KM Enablers
Factor Item N Min Max Mean SD
Culture CU1 150 2 5 4.31 0.86
CU2 150 2 5 4.23 0.86
CU3 145 1 5 4.16 0.87
CU4 150 1 5 3.84 0.94
CU5 148 1 5 4.21 0.92
CU6 150 1 5 3.88 0.94
CU7 147 2 5 3.78 0.98
Leader LE8 149 1 5 4.38 0.96
LE9 146 1 5 3.75 1.08
LE10 147 1 5 3.44 1.14
LE11 147 1 5 3.99 0.97
LE12 148 1 5 3.52 1.21
LE13 145 1 5 4.16 1.08
LE14 146 1 5 3.96 1.05

152
Table 7 (continued)
Factor Item N Min Max Mean SD
Technology TE15 149 1 5 3.81 1.12
TE16 145 1 5 3.79 1.06
TE17 145 1 5 3.79 1.07
TE18 146 1 5 3.87 1.07
TE19 148 2 5 3.86 1.00
TE20 148 1 5 3.59 1.09
Measurement ME21 146 1 5 3.89 1.07
ME22 148 1 5 4.17 0.97
ME23 144 1 5 3.33 1.13
ME24 141 1 5 3.62 1.09
ME25 144 1 5 3.65 1.28
Table 8 Descriptive Statistics for the KM Processes
Factor Item N Min Max Mean SD
Knowledge
generation
GE26 148 1 5 3.87 1.08
GE27 149 1 5 3.96 1.02
GE28 144 1 5 3.12 1.17
GE29 145 1 5 3.20 1.19
GE30 146 1 5 3.60 1.06
GE31 145 1 5 3.88 1.09
Knowledge
codification
CO32 149 1 5 3.63 1.10
CO33 148 1 5 3.47 1.12
CO34 148 1 5 3.57 1.07
CO35 148 1 5 3.57 1.07
CO36 144 1 5 3.29 1.17
Knowledge
transfer
TR37 150 1 5 3.60 1.07
TR38 149 1 5 3.68 1.05
TR39 149 1 5 3.62 1.11
TR40 149 1 5 3.69 1.14
TR41 148 1 5 3.59 1.10
TR42 150 1 5 3.61 1.02

153
Results of Factor Analysis
This section reports the results of EFA and CFA for the two constructs: KM
enablers and KM processes. Due to the limited sample size, the total 150 cases were
used for EFA and CFA, respectively.
Results of Exploratory Factor Analysis
As prerequisites for factor analysis, two tests, the Kaiser-Meyer-Olkin (KMO) of
sampling adequacy and the Bartlett’s Sphericity test, were conducted to determine if the
sample has met the requirements for factor analysis (Hair, Black, Babin, & Anderson,
2010; Meyers et al., 2013).
The KMO index can be interpreted as follows: KMO ≥ .80 is meritorious; .70 ≤
MSA < .80 is middling; .60 ≤ MSA < .70 is mediocre; .50 ≤ MSA < .60 is miserable;
and MSA < .50 is unacceptable (Hair et al., 2010). Bartlett’s Sphericity tests the null
hypothesis that the correlation matrix is an identity matrix. An identity matrix represents
a matrix in which all of the diagonal elements are 1 and all of diagonal elements are 0. In
short, a significant Sphericity value indicates that the correlation matrix of variables in a
scale has significant correlations among at least some of the variables. Consequently, the
variables can be factor analyzed.
To determine the factor structures of the scales, EFA requires two criteria:
percentage of variance and factor loadings (Costello & Osborne, 2005; Meyers et al.,
2013). The percentage of variance criterion refers to a requirement that usually 60% or
larger amount of the total variance can be explained by the extracted factors. Factor
loadings equal to or greater than .40 can be retained in EFA (Meyers et al., 2013).

154
For a factor rotation method, Costello and Osborne (2005) explained that factors
can be extracted by unweighted least squares, generalized least squares, maximum
likelihood, principal axis factoring, alpha factoring, and image factoring. They suggested
that if data are relatively normally distributed, maximum likelihood (ML) will provide
the best results because ML allows for “the computation of a wide range of indexes of
the goodness of fit of the model [and] permits statistical significance testing of factor
loadings and correlations among factors and the computation of confidence intervals.”
(Costello & Osborne, 2005, p. 2). Inversely, if multivariate normality is severely
violated, the principal axis factors is the practical option. As mentioned earlier, the
normal distribution of some variables in this study were not perfect, thus the principal
axis factors was used to extract for this EFA.
Since the results of factor extraction were usually difficult to interpret, the
rotation method assists in simplifying and clarifying the data structure (Costello &
Osborne, 2005). Two representative approaches to factor rotation are orthogonal rotation
and oblique rotation. Conventionally, researchers have used orthogonal rotation because
it produces more easily interpretable results. However, in the social science studies,
behaviors are rarely partitioned into complete units. Social science researchers expect
some correlation among factors. Orthogonal rotation results in a loss of valuable
information if the factors are correlated, while oblique rotation assumes rotated factors
are correlated. Thus, this study used the oblique factor rotation because oblique rotation
allows the factors to correlate.

155
Direct oblimin, quartimin, and promax are available oblique methods of rotation.
The study of Costello and Osborne (2005) found that these methods produce similar
results. This study used the direct oblimin technique because it simplifies factors by
minimizing the sum of cross-products of squared loadings in the pattern matrix. Then
pattern coefficients in the pattern matrix are used in determining which items
meaningfully correlate with the rotated factor. Finally, a pattern coefficient of .40 was
used in this study because it provides strong loaders (.32 is acceptable and .50 or higher
is strong, Costello & Osborne, 2005). In addition, this study expected to see a factor that
included more than three items because a factor with fewer than three items is weak and
unstable (Costello & Osborne, 2005).
Exploratory factor analysis of the KM enablers. To analyze the 25 items in
this construct, the researcher chose not to set the number of factors in order to see how
many meaningful factors might be extracted in the data set. The KMO index was .928,
indicating that the present data were suitable for EFA. Bartlett’s Sphericity test was
significant (= 2383.749, df = 300, p = .000), indicating sufficient correlation between
the variables to proceed with the analysis. For the first factor structure requirement,
percentage of variance, Table 9 shows four factors with an eigenvalue larger than 1. A
total of the initial eigenvalues of the four factors cumulatively accounted for 68.264% of
the total variance, indicating the requirement of the 60% of variance criterion for factor
extraction. Factor 1 accounted for the most variance (51.651%). Furthermore, the
eigenvalues of the four factors after rotation ranged from 1.088 to 12.913.

156
Table 9 Total Variance Explained of KM Enablers
Factor Initial Eigenvalues Extraction Sums of Squared Loadings
Total % of
Variance
Cumulative
%
Total % of
Variance
Cumulative
%
1 12.913 51.651 51.651 12.552 50.206 50.206
2 1.608 6.434 58.085 1.279 5.114 55.320
3 1.456 5.826 63.911 1.132 4.528 59.848
4 1.088 4.353 68.264 .750 3.001 62.849
5 .858 3.432 71.696
6 .780 3.121 74.817
7 .699 2.794 77.611
8 .632 2.527 80.137
9 .582 2.329 82.467
10 .530 2.121 84.588
11 .482 1.927 86.515
12 .425 1.702 88.217
13 .407 1.627 89.844
14 .355 1.419 91.262
15 .344 1.376 92.639
16 .288 1.152 93.790
17 .286 1.143 94.933
18 .234 .938 95.871
19 .213 .854 96.725
20 .197 .786 97.511
21 .169 .678 98.189
22 .152 .609 98.798
23 .129 .516 99.313
24 .111 .444 99.758
25 .061 .242 100.000
Factor loadings is another requirement of factor structure. As shown in Table 10,
the factor loadings of 23 out of the 25 variables ranged from .403 to .913, meeting the
factor loading criterion for extraction. Empirically, some of these 25 items were not
loaded onto the theoretical factors. Table 11 shows the correlation matrix of KM
Enablers ranged from .397 to .537, indicating a moderate positive relationship.
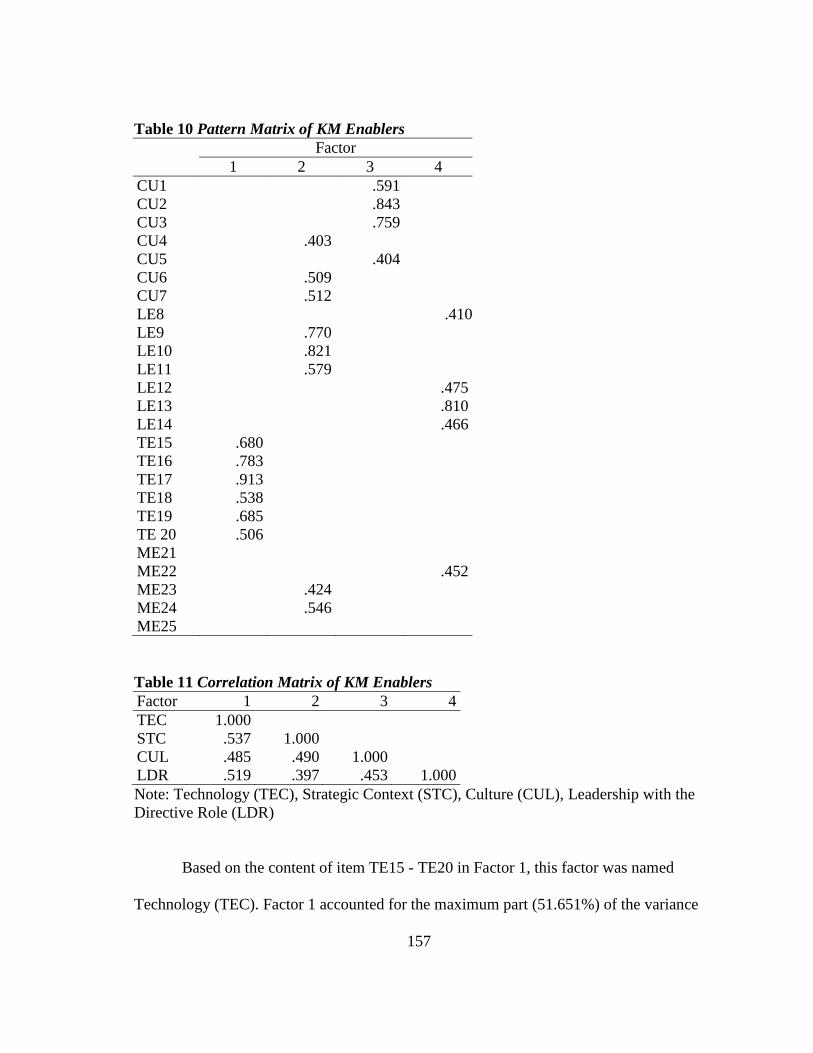
157
Table 10 Pattern Matrix of KM Enablers
Factor
1 2 3 4
CU1 .591
CU2 .843
CU3 .759
CU4 .403
CU5 .404
CU6 .509
CU7 .512
LE8 .410
LE9 .770
LE10 .821
LE11 .579
LE12 .475
LE13 .810
LE14 .466
TE15 .680
TE16 .783
TE17 .913
TE18 .538
TE19 .685
TE 20 .506
ME21
ME22 .452
ME23 .424
ME24 .546
ME25
Table 11 Correlation Matrix of KM Enablers
Factor 1 2 3 4
TEC 1.000
STC .537 1.000
CUL .485 .490 1.000
LDR .519 .397 .453 1.000
Note: Technology (TEC), Strategic Context (STC), Culture (CUL), Leadership with the
Directive Role (LDR)
Based on the content of item TE15 - TE20 in Factor 1, this factor was named
Technology (TEC). Factor 1 accounted for the maximum part (51.651%) of the variance

158
of all items. It also provided the clear extraction and matched the theoretical factor.
Factor 1 included the use of technology to enhance the flow of knowledge (TE15), to
create an institutional knowledge database (TE16), to make an institutional knowledge
database accessible (TE17), to allow students to provide feedback (TE18), to enhance
collaborative learning effort among employees (TE19), and to help employees make
better decision in a timely fashion (TE20).
Factor 2, accounted for 6.434% of variance, was titled Strategic Context (STC).
Interestingly, this factor included 8 items that covered some aspects of the theoretical
culture, leadership, and performance measurement factors. The eight items of Factor 2
were interrelated and reflected multi-aspects of culture, leadership, and performance
measurement at the strategic viewpoint. This factor reflected the strategic context that
involved the creation of knowledge value to achieve an institution’s mission (CU4), the
desire to innovate (CU6), the accountability for individual learning (CU7), the increase
in income (LE9), the strategy for selling knowledge (LE10), the development of core
competency (LE11), the measure of intangible assets (ME23), and the allocation of
resources (ME24).
In addition, due to the extracted results, the researcher further analyzed these
eight items with the same EFA procedure in order to determine how many subfactors
were under Factor 2. The results showed that all eight items were not extracted; they
were under the single factor. The results of this additional extraction were as follows: the
KMO index was .905; Bartlett’s Sphericity test was significant (= 548.002, df = 28, p
= .000); a total of the initial eigenvalues of the factor cumulatively accounted for

159
59.877%; the loadings of each items ranged between .658 - .792. Consequently, this
study retained these eight extracted items to represent Factor 2 called Strategic Context.
Factor 3, accounted for 5.826% of variance, was named Culture (CUL). This
factor retained four out of the seven theoretical items. Among four items in Factor 3,
three items, which were the university culture facilitates knowledge building and sharing
(CU1), the university has a culture of openness in sharing knowledge (CU2) and trust in
sharing knowledge (CU3), included the term culture in their statements. Only one item,
the university’s KM system facilitates the employees’ learning process (CU5) did not
obviously mention the term culture. The term culture might lead to bias because it was a
guiding word in the statements. Thus the items that included the term culture were
extracted to the same factor.
Leadership with the Directive Role (LDR) was named for Factor 4 that
accounted for the minimum part (4.353%) of variance. This factor maintained four (LE8,
LE12, LE13, and LE14) out of the seven theoretical leadership items and added one item
from the theoretical measurement factor (ME22). This factor reflected the obvious roles
of the leaders that related to plan setting (LE8), rewarding (LE12), KM positioning
(LE13), setting the KM vision (LE14), and setting the KM performance indicator
(ME22). These roles were recognized as the aspects of directive leaders.
Exploratory factor analysis of the KM processes. The researcher used the
same EFA procedure to analyze the 17 KM process items. The KMO index was .934,
indicating that the present data were suitable for EFA. Bartlett’s Sphericity test was
significant (= 2489.072, df = 136, p = .000), indicating sufficient correlation between

160
the variables to proceed with the analysis. Table 12 shows two factors with an
eigenvalue larger than 1. A total of the initial eigenvalues of the two factors
cumulatively accounted for 72.810% of the total variance, indicating the requirement of
the 60% of variance criterion for factor extraction. Factor 1 accounted for the most
variance (66.419%). Furthermore, the eigenvalues of the two factors after rotation were
1.087 and 11.291.
Table 12 Total Variance Explained of KM Processes
Factor Initial Eigenvalues Extraction Sums of Squared Loadings
Total % of
Variance
Cumulative
%
Total % of
Variance
Cumulative
%
1 11.291 66.419 66.419 11.001 64.710 64.710
2 1.087 6.391 72.810 .858 5.048 69.758
3 .919 5.406 78.217
4 .670 3.939 82.155
5 .540 3.175 85.330
6 .464 2.728 88.058
7 .404 2.374 90.432
8 .324 1.909 92.340
9 .247 1.455 93.795
10 .222 1.306 95.101
11 .195 1.146 96.247
12 .166 .979 97.226
13 .148 .873 98.100
14 .105 .616 98.715
15 .086 .505 99.220
16 .082 .483 99.703
17 .051 .297 100.000
As shown in Table 13, the factor loadings of 17 variables ranged from .403
to .974, meeting the factor loading criterion for extraction. Empirically, without a priori
criteria for determining the number of factors, the extraction produced only two factors

161
that did not match the number of the theoretical factors. Furthermore, as shown in Table
14, it represents the correlation matrix of KM enablers ranged from .397 to .537,
indicating a moderate positive relationship.
Table 13 Pattern Matrix of KM Processes
Factor
1 2
GE26 .509
GE27 .550
GE28 .747
GE29 .833
GE30 .620
GE31 .633
CO32 .866
CO33 .794
CO34 .760
CO35 .706
CO36 .453 .403
TR37 .733
TR38 .787
TR39 .960
TR40 .974
TR41 .972
TR42 .647
Table 14 Correlation Matrix of KM Processes
Factor 1 2
KTR 1.000
KGE .638 1.000
Note: Knowledge Transfer (KTR), Knowledge Generation (KGE)
Based on the extraction, Factor 1, which accounted for the maximum part
(66.419%) of the variance, was named Knowledge Transfer (KTR). This factor
combined the two theoretical factors: knowledge codification (CO32 - CO36) and

162
knowledge transfer (TR37 - TR42). The theoretical knowledge codification factor aimed
to make organizational knowledge accessible by transforming tacit and explicit
knowledge. It involved the activities of supporting knowledge platforms to share tacit
knowledge (CO32), supporting technology to make tacit knowledge accessible (CO33),
making past know-how explicit (CO34) and accessible (CO35), and making past know-
how remain within the university when employees’ leave the university (CO36). The
theoretical knowledge transfer factor aimed to apply knowledge to individuals’ daily
work through knowledge sharing and distributing activities. It involved the activities of
providing opportunities for employees to meet informally to share knowledge (TR37)
and build knowledge networks (TR38), communicating the best practices (TR39),
lessons learned (TR40), and success stories in improving organization’s performance
(TR41), and strategically investing resource in applying knowledge into job (TR42).
From the contents of the 11 items, they merged the two theoretical factors and
had a common theme to make tacit knowledge into explicit knowledge through the
process of sharing knowledge. The activities of sharing and distributing knowledge were
the core element of this extracted factor, consequently Knowledge Transfer was named
to cover the aspects of this factor.
Another finding, which needed to be carefully interpreted, was a cross-loading
item (CO36). CO36 loaded higher than .32 on two factors (.453 and .403).
Conventionally, if a cross-loading item has a strong loading (.50 or better) on each
factor, this item should be dropped from the analysis (Costello & Osborne, 2005). This
study retained CO36 because its loadings were lower than .50.

163
Factor 2, accounted for the minimum part (6.391%) of variance, was named
Knowledge Generation (KGE). This factor still included all six theoretical knowledge
generation items (GE26 - GE31) that focused on the activity of acquisition and
development of knowledge. These six items related to the activities of identifying
knowledge needs (GE26), using well-defined work practices to address knowledge needs
(GE27), creating organizational knowledge directories (GE28), creating directories with
specialized knowledge of other groups aligned with the organizational knowledge
(GE29), developing mechanisms to gather knowledge systematically (GE30), and
gathering knowledge ethically (GE31).
Results of Confirmatory Factor Analysis
The researcher used Mplus 7.3 to analyze CFA for the two constructs: KM
enablers and KM processes. CFA aims to evaluate how well the measurement models
established in EFA fits the data.
Confirmatory factor analysis of the KM enablers. The CFA results showed
that the hypothesized 4-factor KM enabler model provided an unsatisfactory fit for the
data. The (2430.256) was statistically significant (df = 271, p < .001) due to its
sensitivity. Many researchers addressed that chi-square values can be affected by the
following situations: (a) the failure to meet the assumption of multivariate normality can
lead to an overestimation of the chi-square statistic, even when the model is properly
specified (Jackson, Gillaspy, & Purc-Stephenson, 2009); (b) complex models with many
variables and degrees of freedom are likely to make chi-squares significant (Marsh, Hau,
& Wen, 2004); (c) large samples are likely to produce large chi-squares that are more

164
likely to be significant (Type I error) (Bentler & Bonnet, 1980), whereas small samples
tend to accept poor models (Type II error) because they cannot discriminate between
good fitting models and poor fitting models (Kenny & McCoach, 2003). Due to the
restrictiveness of chi-square, this study has sought alternative indices, such as CFI and
RMSEA, to assess model fit. The CFI (.689) was below the standard .95 cutoff (Hu &
Bentler, 1999). The RMSEA was .230 with a 90% confidence interval (CI) of .222 to
.239, indicating an unacceptable fit. All in all, this model did not fit the data.
Since the CFA model did not fit data satisfactorily, modification was applied to
determine what was specifically wrong with this initial model. Generally, modification
examines fixed parameters in the initial model to capture model misspecfication and
then re-test the model using the same data set (Wang & Wang, 2012). With the guideline
from the modification indices, CFA modification of this model suggested adding ME21
and ME25 in the extracted EFA factors. The researcher added these two items into the
three factors: Technology, Strategic Context, and Leadership with the Directive Role.
Table 15 shows all modified CFA models provided satisfactory fits (good CFI and fair
RMSEA). The researcher decided to keep these two items in the Leader with the
Directive Role because ME21 and ME25 were the characteristics of directive leadership
that include setting clear objectives, clarifying of the criteria for success, and providing
psychological support. ME21 related to the managerial task of allocating budget
regarding the achievement of the performance assessment, while ME25 described the
task of reporting the performance achievement.

165
Table 15 Fit Indices of the Four Enabler CFA models
Fit indices Initial CFA
model
Modified TEC
CFA model
Modified STC
CFA model
Modified LDR
CFA model
Chi-square test = 2430.256
(df = 271,
p < .001)
= 510.815
(df = 269,
p < .001)
= 498.651
(df = 269,
p < .001)
= 481.185
(df = 269,
p < .001)
CFI (>.90) .689 .965 .967 .969
RMSEA (<.05) .230
(90% CI of .222
to .239)
.077
(90% CI of .067
to .088)
.075
(90% CI of .065
to .086)
.073
(90% CI of .062
to .083)
The modified LDR model revealed a good fit for the data. Although the
(481.185) was statistically significant (df = 269, p < .001) due to its restrictiveness, CFI
(.969) was good. RMSEA was .073 with a 90% confidence interval (CI) of .062 to .083,
indicating a fair fit. These fit indices provided a support for the model fit. Furthermore,
Figure 12 shows the standardized factor loadings (regression weights, p < .001) ranged
from .590 (V12) to .916 (V16), exceeding the minimum standard of .5 for convergent
validity of each factor (Hair et al., 2010; Hu & Bentler, 1999).

166
Figure 12. CFA Model of KM Enablers

167
Based on the EFA and CFA results, Table 16 shows the KM Enabler
measurement model with 4 factors and 25 items.
Table 16 Items of the KM Enabler Model
Technology
TE15 The university uses technology to enhance the flow of knowledge (such
as acquiring, sharing, retrieving, and using) among employees.
The university uses technology to
TE16 1) create an institutional knowledge database.
TE17 2) make an institutional knowledge database accessible to the
entire university.
TE18 The university uses technology to allow students to provide feedback to
the university’s performance.
TE19 The university provides technology to enhance collaborative learning
efforts among employees.
TE20 The university’s information system is designed to help employees
make better decisions in a timely fashion.
Strategic Context CU4 The university’s KM system creates a knowledge value for the
university’s achievement of its missions.
CU6 The university’s desire to innovate drives employees’ learning
processes.
CU7 The university has a culture of accountability for individual learning.
LE9 The university administrators acknowledge that managing
organizational knowledge helps increase income (e.g., from products of
R&D, books, and consultations).
LE10 The university administrators develop strategies for selling its
knowledge assets.
LE11 The university administrators deliberately use learning to develop core
competencies.
ME23 The university has a measurement system that incorporates measures of
intangible assets.
ME24 The university allocates resources for efforts that measurably increase
its knowledge.

168
Table 16 (continued)
Culture
CU1 The university culture facilitates knowledge building and sharing.
The university has a culture of
CU2 1) openness in sharing knowledge.
CU3 2) trust in sharing knowledge.
CU5 The university’s KM system facilitates the employees’ learning
process.
Leadership with the Directive Role LE8 The university administrators include the management of organizational
knowledge in the university’s strategic plan.
LE12 The university administrators reward employees for their contributions
to the development of organizational knowledge.
LE13 The university administrators need a specific person to oversee the
development of organizational knowledge.
LE14 The university administrators have a vision for managing
organizational knowledge.
ME21 The university’s assessment process has ways to link KM to the budget
allocated.
ME22 The university has a specific set of indicators to measure KM
outcomes.
ME25 The university’s annual report includes an assessment of how
knowledge has contributed to organizational performance.
Confirmatory factor analysis of the KM processes. According to the
hypothesized models, this study examined two research models: the general empirical
model to explain HEI KM conceptualization and the conceptual model summarizing HEI
KM literature. The general empirical model was focused on the relationship among each
KM enabler and process, as well as each KM process and outcome. Thus the factors
used in this analysis included four KM enabler factors (Technology, Strategic Context,
Culture, and Leadership with the Directive Role), two KM process factors (Knowledge
Generation and Knowledge Transfer), and one performance score. With this model’s

169
requirement, the CFA of the KM processes were analyzed at the factor level from the
first-order factor.
The conceptual model encompassed the three KM constructs: enablers,
processes, and outcomes at the conceptual level. It examined the construct of the KM
processes. Unexpectedly, the result from EFA dropped KM processes from three into
two factors so the number of the factor did not meet the requirement of higher-order
factor analysis. The rule for identification of higher-order factor is that a second-order
factor must have a minimum of three first-order factors to be identified (Kwok, 2014).
With only three-first order factors, the second-order factor model is equivalent to the
first-order model with correlated factors. Thus, the researcher did not analyze the
hypothesized conceptual model (Figure 9 in Chapter III).
The CFA result from the general empirical model showed the acceptable fit for
the data. Although the (597.462) was statistically significant (df = 120, p < .001), the
other indices were within a range that would be associated with good fit. The CFI (.913)
was greater than .90 cutoff. The RMSEA was .163 with a 90% confidence interval (CI)
of .150 to .176, indicating an unacceptable fit.
To further identify the fitness of the model with the data, the researcher
examined another two indices: Tucker-Lewis Index (TLI) and Weighted Root Mean
Square Residual (WRMR). TLI is computed by comparing the normed values for the
null and specified measurement model (Muthen & Muthen, 2008). TLI equal to or
greater than .90 exceeding the cut-off value. The WRMR, a variance-weighted approach,
is recommended for models that variables are measured on different scales or have

170
widely unequal variances (Muthen & Muthen, 2008). It is also appropriate for data that
are not distributed normally (Muthen & Muthen, 2008). The acceptable WRMR value is
1. The results of this model reported the two fit indices yielded at .901 and 1.019,
indicating that goodness of fit was satisfied. The standardized factor loadings (p < .001)
ranged from .455 (V32) to .891 (V41), meeting the requirement for convergent validity
(Figure 13).
Figure 13. CFA Model of KM processes
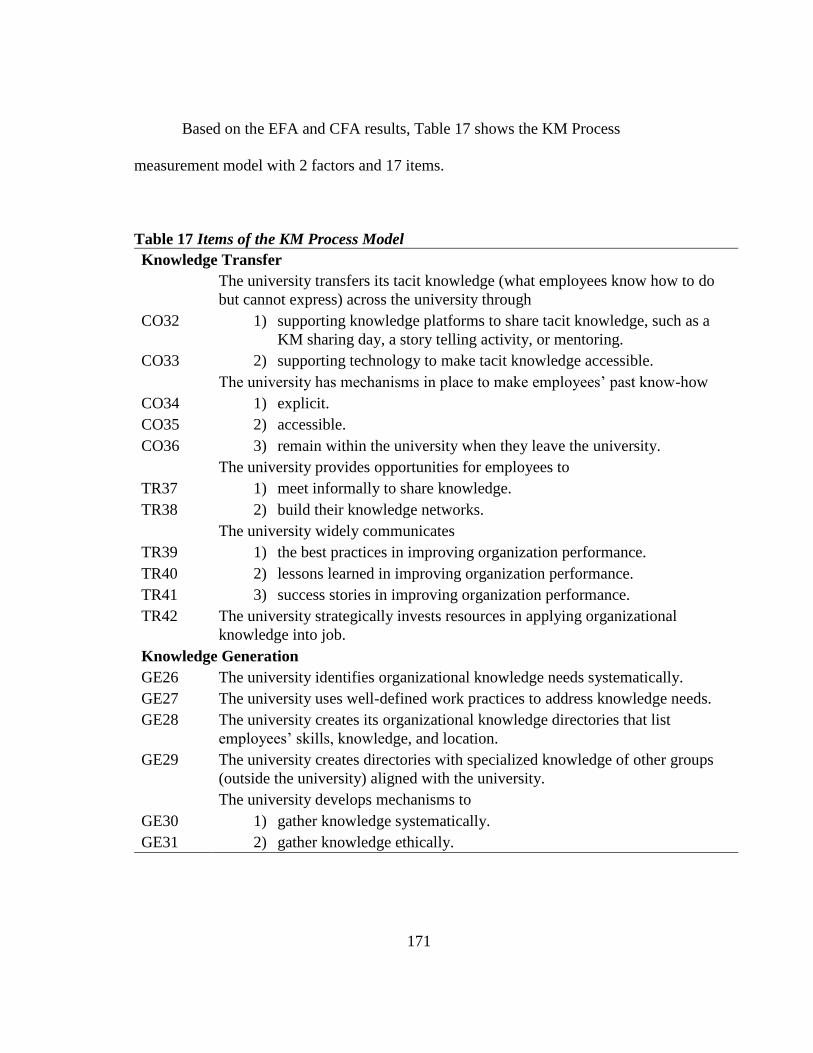
171
Based on the EFA and CFA results, Table 17 shows the KM Process
measurement model with 2 factors and 17 items.
Table 17 Items of the KM Process Model
Knowledge Transfer
The university transfers its tacit knowledge (what employees know how to do
but cannot express) across the university through
CO32 1) supporting knowledge platforms to share tacit knowledge, such as a
KM sharing day, a story telling activity, or mentoring.
CO33 2) supporting technology to make tacit knowledge accessible.
The university has mechanisms in place to make employees’ past know-how
CO34 1) explicit.
CO35 2) accessible.
CO36 3) remain within the university when they leave the university.
The university provides opportunities for employees to
TR37 1) meet informally to share knowledge.
TR38 2) build their knowledge networks.
The university widely communicates
TR39 1) the best practices in improving organization performance.
TR40 2) lessons learned in improving organization performance.
TR41 3) success stories in improving organization performance.
TR42 The university strategically invests resources in applying organizational
knowledge into job.
Knowledge Generation
GE26 The university identifies organizational knowledge needs systematically.
GE27 The university uses well-defined work practices to address knowledge needs.
GE28 The university creates its organizational knowledge directories that list
employees’ skills, knowledge, and location.
GE29 The university creates directories with specialized knowledge of other groups
(outside the university) aligned with the university.
The university develops mechanisms to
GE30 1) gather knowledge systematically.
GE31 2) gather knowledge ethically.

172
Results of Reliability Analysis
Reliability estimation using the Cronbach’s alpha technique was conducted for
the six factors that were established from the series of EFA and CFA procedures. As
indicated in Table 18, all of the factors in this study had very good reliabilities, ranging
from .861 to .965 (> .85, Meyers et al., 2013).
Table 18 Estimates of Reliability
Constructs Factors N of Items Cronbach’s
KM enabler Technology (TEC) 6 .919
Strategic Context (STC) 8 .903
Culture (CUL) 4 .861
Leadership with the Directive Role
(LDR)
7 .862
KM processes Knowledge Transfer (KTR) 6 .905
Knowledge Generation (KGE) 11 .965
Results of Structural Equation Modeling
Based on the measurement model from CFA, the researcher further analyzed the
SEM model to investigate the hypothesized models and the structural relationships. Prior
to performing SEM using Mplus 7.3, the researcher revised the hypothesized general
empirical model (Figure 10 in Chapter III) based on the results from the EFA. The
revisions involved renaming the two factors for KM enablers (Strategic Context and
Leadership with the Directive Role) and dropping KM processes from three into two
factors. The researcher did not analyze the hypothesized conceptual model (Figure 9 in

173
Chapter III), because this model did not meet the requirement of higher order factor
analysis, as previously mentioned in the CFA section.
The results of the SEM analysis showed that although the test was statistically
significant ( = 1581.515, df = 845, p < .001), indicating not a good fit, the other
indices were within a range that would be associated with acceptable fit: CFI = .809; TLI
= .795; RMSEA = .083 (90% CI: .077 – .089); SRMR = .065. As shown in Figure 14,
the path coefficients ranged from .032 (between KGE and SCO) to .557 (between LTR
and KGE). Furthermore, six of the standardized (STDYX) parameters were statistically
significant (p < .01). Four parameters (CUL to KTR, CUL to KGE, KTR to SCO, and
KGE to SCO) were not statistically significant. The variance of SCO was high. The
measure of SCO, that was a single latent variable, may be faulty rather than the model.
In this model, six hypotheses (H2.4, H2.6, H2.7, H2.9, H2.10, and H2.12) were
accepted, and five (H2.1, H2.3, H2.13, and H2.15) were rejected.

174
Figure 14. Results of Structural Equation Modeling with the Hypothesized General
Empirical Model
H2.9 (+)
H2.7 (+)
H2.12 (+)
H2.3 (-)
H2.1 (-)
H2.6 (+)
H2.4 (+)
H2.10 (+)
H2.15 (-)
H2.13 (-)

175
Results of Thematic Analysis
This study incorporated two open-ended questions, which asked the respondents
to describe the three internal factors that significantly support or block successful KM.
The qualitative findings resulted from various processes of coding, categorizing,
identifying themes, and assigning meaning to the text data. The researcher looked for
patterns within the data and sorted them into general themes based on the four guidelines
of Guba and Lincoln (1981), as mentioned in Chapter III. Then, the researcher identified
data in specific thematic categories and codes. Microsoft Excel was a facilitating tool for
coding and categorizing these qualitative data. Tables 19 and 20 report the main themes
and subthemes of factors for supporting and blocking successful KM that were tabulated
in a frequency order. For this data analysis, 129 of the 150 respondents completed the
two qualitative questions.
Supporting Factors for Successful KM
The researcher generated 301 initial codes from the 129 respondents who
identified the supporting factors for successful KM. Table 19 represents qualitative data
for 13 main themes and 24 subthemes: the KM process with four subthemes (53 codes);
leadership with three subthemes (45 codes); the KM unit or person with two subthemes
(31 codes); the individual engagement with two subthemes (29 codes); the KM policy
and strategic planning with two subthemes (28 codes); technology with two subthemes
(26 codes); budget allocation with one subtheme (23 codes); the corporate culture with
two subthemes (22 codes); the individual’s KM understanding with two subthemes (18
codes); motivation with one subtheme (16 codes); the influence of the quality assurance

176
system with one subtheme (5 codes); the external KM network with one subtheme (4
codes); and the organization’s structure with one subtheme (1 code).
Table 19 Supporting Factors for Successful KM
Main theme Subtheme Frequency of codes
KM process - Integrative and continuous KM process 20
- Effective knowledge sharing 16
- Clear knowledge identification 9
- Use of knowledge into practice 8
Subtotal 53
Leadership - Good supportive management 32
- Positive attitude of the leaders’ toward KM significance
11
- Good governance in KM implementation
2
Subtotal 45
KM unit or person
- Assigned KM unit, team, or key person 24
- Effective KM unit or team 7
Subtotal 31
Individual engagement
- High engagement in KM practices 18
- Positive attitude toward KM 11
Subtotal 29
KM policy and strategic planning
- Clear KM policy 24
- Integrative KM strategic planning 4
Subtotal 28
Technology - Efficient and effective KMIS 14
- Efficient and effective IS for decision making
12
Subtotal 26
Budget allocation
- Adequate budgeting 23
Subtotal 23
Corporate culture - Supportive organizational culture 13
- Supportive KM culture 9
Subtotal 22

177
Table 19 (continued)
The largest portion of the supporting KM factors’ main theme was the KM
process with four subthemes of 53 codes. This KM process’s main theme focused on the
integration and continuousness of the KM process and related to three core KM process
components (knowledge identification, knowledge sharing, and use of knowledge into
practices). The second portion was allotted to leadership with three subthemes of 45
codes. The last frequently mentioned main theme included the organization’s structure
(1 code). Among the 24 subthemes, good supportive management in leadership was the
most mentioned main theme (32 codes). The assigned KM unit, team, or key person and
the clear KM policy, which included 24 codes equally, were the second frequently
mentioned subthemes.
Blocking Factors for Successful KM
The researcher extracted 283 initial codes of the blocking factors for successful
KM. Both blocking and supporting factors had 12 main themes in common. Inversely,
Main theme Subtheme Frequency of codes
Individual’s KM - Correct KM understanding 13
understanding - Having knowledgeable staff’s members 5
Subtotal 18
Motivation - Strong motivation system 16
Subtotal 16
Influence of the quality assurance
- Positive influence of the quality assurance system
5
system Subtotal 5
External KM - Established external KM network 4
network Subtotal 4
Organization’s - Small sized campus 1
structure Subtotal 1
Total 301
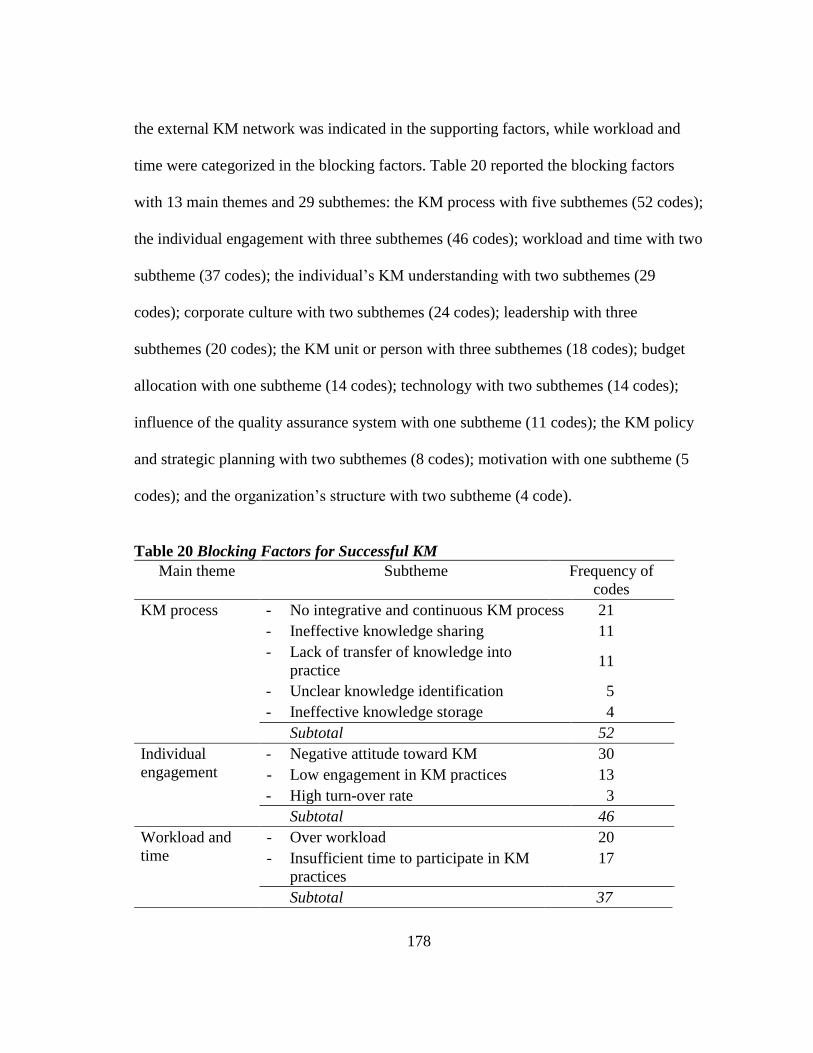
178
the external KM network was indicated in the supporting factors, while workload and
time were categorized in the blocking factors. Table 20 reported the blocking factors
with 13 main themes and 29 subthemes: the KM process with five subthemes (52 codes);
the individual engagement with three subthemes (46 codes); workload and time with two
subtheme (37 codes); the individual’s KM understanding with two subthemes (29
codes); corporate culture with two subthemes (24 codes); leadership with three
subthemes (20 codes); the KM unit or person with three subthemes (18 codes); budget
allocation with one subtheme (14 codes); technology with two subthemes (14 codes);
influence of the quality assurance system with one subtheme (11 codes); the KM policy
and strategic planning with two subthemes (8 codes); motivation with one subtheme (5
codes); and the organization’s structure with two subtheme (4 code).
Table 20 Blocking Factors for Successful KM
Main theme Subtheme Frequency of
codes
KM process - No integrative and continuous KM process 21
- Ineffective knowledge sharing 11
- Lack of transfer of knowledge into
practice 11
- Unclear knowledge identification 5
- Ineffective knowledge storage 4
Subtotal 52
Individual
engagement
- Negative attitude toward KM 30
- Low engagement in KM practices 13
- High turn-over rate 3
Subtotal 46
Workload and
time
- Over workload 20
- Insufficient time to participate in KM
practices
17
Subtotal 37

179
Table 20 (continued)
Main theme Subtheme Frequency of
codes
Individual’s KM
understanding
- Incorrect KM understanding 28
- Lack of knowledgeable staff’s members 1
Subtotal 29
Corporate culture - Lack of supportive KM culture 14
- Lack of supportive organizational
culture 10
Subtotal 24
Leadership - Negative attitude of leaders’ toward
KM significance 13
- Unsupportive management 5
- Bad governance in KM implementation 2
Subtotal 20
KM unit or
person
- Ineffective KM unit or team 8
- Ineffective KM key person 6
- No assigned KM unit or key person 4
Subtotal 18
Budget allocation - Inadequate budgeting 14
Subtotal 14
Technology - Inefficient and ineffective IS for
decision making
9
- Inefficient and ineffective KMIS 5
Subtotal 14
Influence of the
quality assurance
System
- Negative influence of the quality
assurance system
11
Subtotal 11
KM policy and
strategic
planning
- Lack of the KM policy 6
- Lack of the KM strategic planning 2
Subtotal 8
Motivation - No motivation system 5
Subtotal 5
Organization’s
Structure
- No interaction between units 3
- Frequent change of the organization’s
structure
1
- Big sized campus 1
Subtotal 5
Total 283

180
The largest portion of the blocking KM factors’ main theme was the KM process
with five subthemes of 52 codes. The second portion was allotted to individual
engagement with three subthemes of 46 codes. Similar to the supporting factors, the last
frequently mentioned main theme included the organization’s structure (5 codes).
Among the 29 subthemes, the negative attitude toward KM in the individual engagement
main theme was the most frequent mention (30 codes), followed by the individual’s
incorrect KM understanding (28 codes).
Emerging KM Factors from Thematic Analysis
The qualitative data from the open-ended questions provided unique findings
regarding the institutional contexts of each university. This section reflects the emerging
themes of the factors supporting and blocking successful KM that differ from the
quantitative findings. It aims to provide missing pieces that the quantitative procedure
failed to capture.
Leadership. Consistent with the quantitative results, leadership relates to an
ability to align KM behaviors with organizational strategies, promote values of KM, and
provide guidelines for assessing an impact in knowledge. Furthermore, many
respondents expected to see their leaders play various roles to facilitate the KM practice
as follows: (a) having a vision of learning organization; (b) supporting learning
environment; (c) having skills to apply KM into actual practices or to integrate KM into
routine work; (d) participating in KM activities; (e) allocating KM budget; and (f)
planning and monitoring KM implementation regularly.

181
The qualitative data portray the qualifications of the KM leaders and teams as
follows: have a positive attitude toward KM, understand the KM concept and
implementation correctly, act as a KM specialist (be able to guide and provide a
consultation to the school and supporting units that conduct KM at the unit level), and
keep maintaining the KM leader and staff (do not change the core KM persons often).
Interestingly, one unique finding from qualitative data showed the issue of good
governance. Some respondents expect the equitable KM implementation. They stated
that all their organization’s members should have opportunities to participate in the KM
activities. The KM activities should be provided and communicated equally across the
entire institution, not only the group who takes the administrator’s side.
Assigned KM unit and person. The results of this study showed that the current
agency bodies in charge of KM are diverse. KM managed by quality assurance offices,
planning departments, research and development centers, human resource departments,
libraries, and KM institutions, along with the KM committee at the institutional level.
The qualitative findings suggest that the universities that officially assigned the specific
units or persons to oversee KM are more likely to manage their organizational
knowledge effectively.
KM policy and strategic planning. Aligning with the quantitative results,
respondents widely mentioned the establishment of the KM policy and strategy. The
quantitative data provide the specific elements of KM policy and strategy. The KM
policy should identify clear objectives, procedures, activities, resources, and individual

182
roles. The KM strategy needs to include performance indicators that are explicit and
measurable.
Inversely, the universities can use KM as the institutional strategy to achieving
HEIs' goals. KM can function as the strategy to support the improvement of the
organization’s knowledge assets. Several respondents stated that the universities should
allign KM practices with the individual development plan that support competency
improvement.
Budget allocation. KM budget allocation needs to be considered when HEIs
manage knowledge. The financial aspect is necessary to drive the KM mechanism in
relation to an IT infrastructure and necessary for learning and sharing activities (i.e.,
workshop, seminar, and incentive). Budget should be distributed across the institutional
functions (both teaching and supporting units).
Organizational structure. The qualitative data reveal that the size of the
institution can be a predictor of KM implementation. A university with multiple
campuses is likely to have a difficulty in conducting KM activities due to the chain of
command. In contrast, smaller institutions can deploy the KM activities smoothly.
Organizational culture and KM culture. The qualitative data assists in
clarifying the characteristics of culture. Interestingly, this thematic analysis differentiates
the terms corporate culture and KM culture. The characteristics of corporate culture that
support KM implementation include the value of unity, generosity, and helpfulness; the
value of continuous learning and self-development; the acceptance of change; and a
working environment that enhances the learning and sharing knowledge. It should be

183
noted that change acceptance was not mentioned in the quantitative instrument. For KM
culture, the higher education institutions should hold the KM culture that values learning
and knowledge sharing; aims to become learning organization or learning society;
supports collaborative learning; and has trust in individuals’ knowledge.
Staff members’ engagement. The qualitative data reveal that universities should
motivate their employees to participate in KM activities. In particular, the individuals
should engage in KM activities at all levels and all functions. Many respondents
expressed that academic staff engage in KM activities less than supporting staff.
Additionally in findings related to a high turn-over rate, three respondents raised
the issue that their universities have difficulty in conducting KM due to employee turn-
over. These universities invest significant effort to make new employees understand the
KM approach and shape them into their corporate and KM culture. This expression is
not a frequent occurrence in the qualitative results but it is considered realistic and
unique.
Motivation and reward system. Aligning with previous studies, reward systems
encourage the creation and distribution of knowledge among organizational members
(Gold et al., 2001). Rewards (incentives or recognitions) from leaders to members can
influence the commitments of other members. Practices to motivate values of KM can
come in various forms, such as counting the KM participation as a workload and
rewarding or recognizing a person or a unit that has a good KM practice (i.e., good KM
websites, good KM activities, and KM role models).

184
Technology. Similar to the quantitative finding, the use of technology in KM can
be classified into two aspects: KM information system (KMIS) and information system
(IS). It seems that the respondents differentiate IS from KMIS. They use IS for making
decisions about university administration. KMIS is viewed as the technological tool that
supports processes of acquiring, storing, sharing, and using explicit knowledge. Many
KM activities can be developed and performed through an electronic network, such as
Google Plus, Facebook, Web Blog, and Knowledge bank/system. KMIS becomes a
source that brings individuals together to participate and exchange more knowledge
based on their interests.
Workload and time constraint. The obstacles to conduct KM involve a heavy
workload and time conflict. A heavy workload is claimed to be an impeding factor of
KM engagement. Time conflict reduces the effort to participate in KM activities.
KM process. The effectiveness and efficiency of the KM process can influence
the management of organizational knowledge. A strong KM effort should occur through
dynamic, continuous, and interrelated KM activities. The identification of knowledge
should serve individuals' interests and job relevancy. The environment of knowledge
sharing should be friendly and collaborative. The university should set a strong
mechanism to apply knowledge in the actual work of employees. Heavy investment in
KM will not be worthwhile if individuals do not apply what they learn in their real-life
work. The measurement of the use of knowledge was missed by the quantitative
instrument.
185
The management of knowledge also involves the refinement of the ongoing
knowledge activities by the repetitive application of activities. This finding showed that
many respondents require systematic measurement, such as KM indicators, to assess the
outcome of KM investment. The assessment assists in refining knowledge for the
institution’s long-term use.
External KM network. The external KM network is the big missing piece in the
quantitative instrument. Some universities develop KM networks that have the same
context, such as the University of Technology. One university in the rural area
mentioned that it has developed the KM network by incorporating surrounding
communities in order to learn local knowledge and wisdom. This kind of knowledge
assists in improving the direction of the university to better serve the need of its society
and community.
Influence of the quality assurance system. Since KM is set as one of the QA
criteria, the influence of QA becomes two sides of the same coin. Positively, the QA
system has driven the universities to conduct KM to achieve the QA standard, so many
universities set strategic and action plans to conduct KM. With the obvious direction,
KM keeps on track through a well-planned mechanism (such as, clear goals, clear
procedures, adequate resources, and proper measurement).
On the other hand, QA can hinder the value of KM. Some faculties expressed
that they are forced to implement KM, while they have already managed their
knowledge in their day-to-day jobs. Some universities implement KM to meet the QA
requirement that is not embedded in their organizational culture. The KM indicator, set

186
by the Commission of Higher Education, is problematic. It is not flexible since it
assesses all universities with the same measurement that cannot capture the uniqueness
of each institution.
The findings from the thematic analysis fill the gap of KM factors that the
quantitative measurement cannot capture. Table 21 summarizes the compatible themes,
which are measured by both quantitative and qualitative approaches, and the emerging
themes of the influential KM factors, resulting from the thematic analysis. These themes
are classified into the five factors, corresponding to the hypothesized factors.
Table 21 Emerging Themes for KM Influential Factors
KM Enablers Compatible themes Emerging themes
Technology - Efficiency and effectiveness of
KMIS
- Efficiency and effectiveness IS
for decision making
Strategic Context - Attitude of the leaders’ toward
KM significance
- KM strategic planning
Culture - KM culture - Organizational culture
Leadership with the
Directive Role
- Supportive management
- Clear KM policy
- Assigned KM unit, team, or key
person
- Budget allocation
- Motivation system
- Good governance in KM
implementation
- Effectiveness of KM
unit or team
KM Process - Integrative and continuous KM
process
- Effectiveness of knowledge
sharing
- Clarification of knowledge
identification
- Effectiveness of knowledge
storage
- Use of knowledge into
practice

187
Table 21 (continued)
KM Enablers Compatible themes Emerging themes
Others - Employee engagement
in KM practices
- KM understanding of
employees
- Influence of the quality
assurance system
- External KM network
- Time conflict
- Employee turnover rate
- Size of campus
Summary
Chapter IV reported the quantitative analyses from descriptive statistics, EFA,
CFA, reliability analysis, and SEM. It also presented qualitative data from the thematic
analysis. 150 responses from 60 different universities formed the sample of this study.
Prior to running the factor analyses, data were screened to examine accuracy, missing
data, and multivariate and univariate normality. Two statistical software programs in this
study included SPSS version 22, for computing descriptive statistics, and EFA and
Mplus 7.3, for CFA and SEM.
The results from EFA generated KM Enablers included 4 factors and 25 items,
while KM Processes included 2 factors and 17 items. Based on their characteristics, the
six factors were named Technology (TEC), Strategic Context (STC), Culture (CUL),
Leadership with the Directive Role (LDR), Knowledge Transfer (KTR), and Knowledge
Generation (KGE). These EFA extractions did not closely match the theoretical factors
that indicated 4 factors for KM enablers and 3 factors for KM processes and some items
were misclassified on the theoretical factors.

188
According to this EFA analysis, the limited two-factor model of KM Processes
(KTR and KGE) did not meet the requirement for higher-order factor analysis in CFA
and SEM. Consequently, this study could not further analyze the hypothesized
conceptual research model, which encompassed the three KM constructs (KM enablers,
processes, and outcome) at the conceptual level. Another model, the general empirical
model examining the relationships among each KM enabler and process as well as each
KM process and organizational performance score, was used to investigate the structural
relationships from the SEM approach. The SEM analysis showed that the hypothesized
general empirical model with seven factors indicated an acceptable fit by the four fit
indices. This hypothesized model captured the actual data set fairly well.
The qualitative data from two open-ended questions, asking about the three
internal factors that significantly support or block successful KM, were coded and
categorized into specific themes. The thematic analysis resulted in 13 main themes with
24 subthemes for the supporting KM factors and 13 main themes with 29 subthemes for
the blocking KM factors.
These quantitative and qualitative findings will lead to the discussion, with
regard to the research question and hypotheses, in Chapter V.

189
CHAPTER V
SUMMARY
This chapter included three major sections. It started with the discussion of the
research questions and hypotheses. Then it described the implications for HRD research,
practice, and theory. Last, the limitations and recommendations of the study were
provided.
Discussions
This study explored the use of KM in HEIs by developing and testing a
correlational model linking KM enablers and processes on organizational performance
of HEIs. It was framed by a single research question that will be presented first, along
with the answers drawn from the results of the study. The research question was as
follows: “How do KM enablers and KM processes affect performance of HEIs?” This
question was supported by the quantitative and qualitative results. The quantitative
results supported several research hypotheses testing the relationships of the
hypothesized factors (presented with the capital letter), while the qualitative results
assisted in understanding the meaning of context and filling the gap that the quantitative
data did not capture. Findings in this study offered mixed answers to the research
question.
Hypothesized Research Models
As mentioned in Chapters II and III, the results of the literature review suggested
that the relationships of the three KM components (KM enablers, processes, and
190
outcome) could be explained by two different research models. The first model (Figure 9
in Chapter III) showed the conceptual model that encompasses the three KM
components at the conceptual level. The second model (Figure 10 in Chapter III)
illustrated the general empirical model to examine the relationships among each KM
enabler and process, along with KM process and quality performance scores.
Unexpectedly, EFA’s quantitative procedures did not generate results that
completely matched the hypothesized research models. This caused two major revisions
for further CFA and SEM analyses. First, the researcher needed to rename the two
factors of the KM enablers (Strategic Context and Leadership with the Directive Role)
related to their contents. The hypothesized conceptual model (Figure 9) and its
hypotheses (H1.1 - H1.5) were dismissed, because this model did not meet the
requirement of the insufficient number of factors for higher order factor analysis.
The researcher tested the hypothesized general empirical model (Figure 10) and
its structural relationships using the empirical data of the study sample. The SEM
analysis indicated that the hypothesized model with seven factors was acceptable based
on the following fit indices ( = 1581.515, df = 845, p < .001; CFI = .809; TLI = .795;
RMSEA = .083, 90% CI: .077 – .089; SRMR = .065). This hypothesized model
adequately represents the actual data set. Overall, the data match the model of the KM
system, implying that KM enablers and KM processes affect performance of HEIs. This
study is the first attempt to test the relationships of the entire KM system through KM
enablers, processes, and outcomes. The findings of this study contribute to further KM
research in the higher education setting.

191
Hypothesis 2.1 culture and knowledge generation. Hypothesis 2.1 was not
supported by the empirical data of the study sample. The path coefficient from Culture to
Knowledge Generation ( = .102) was not significant (p > .05), indicating that Culture is
not a predictor of Knowledge Transfer.
The results from Hypothesis 2.1 revealed that Culture in this study does not have
an influence on Knowledge Generation. Knowledge Generation, in this study, refers to
the activity of acquisition and development of knowledge (Ramachandran et al., 2013;
Shoham & Perry, 2009) and aims to build needed knowledge, particularly know-how
that fits in the context of an institution. The aspects of Culture are comprised of
facilitation of knowledge building and sharing, trust in the source of knowledge, and
openness in communication.
The non-significant result may occur due to two possibilities. First, the three
aspects of Culture cannot completely capture Knowledge Generation. Second, the
limited understanding of the term Culture of the study sample can deter the results since
it is the abstract term with less consensus.
Hypothesis 2.2 culture and knowledge codification. Hypothesis 2.2 was not
analyzed because the EFA results dropped the Knowledge Codification factor.
Hypothesis 2.3 culture and knowledge transfer. Hypothesis 2.3 was not
supported by the empirical data of the study sample. The path coefficient from Culture to
Knowledge Transfer ( = .090) was not significant (p > .05), indicating that Culture is
not a predictor of Knowledge Transfer.

192
The results from Hypothesis 2.3 contradicts previous studies that found a
significant relationship between Culture and Knowledge Transfer. Earlier studies
indicated that trust encourages knowledge sharing by facilitating a more proactive and
open relationship among members (Ellingsen, 2003; Tan & Noor; 2013). Furthermore,
openness in communication has a significant and positive influence on knowledge
sharing (Tan & Noor, 2013) and increases the willingness of members to share
knowledge with each other (Basu & Sengupta, 2007).
Similar to the results of Hypothesis 2.1, the contradictory result in this study may
occur due to the limited understanding of the term Culture. This study opens the avenue
to conduct further research that investigates the influence of trust in knowledge and
openness in communication in the Thai context.
Hypothesis 2.4 leadership (leadership with the directive role) and knowledge
generation. Hypothesis 2.4 was supported by the empirical data of the study sample.
Leadership (the term used in the original model) or Leadership with the Directive Role
(the renamed term resulting from the EFA) had a significant and positive relationship
with Knowledge Generation. The path coefficient from Leadership with the Directive
Role to Knowledge Generation ( = .557) was significant (p < .01), indicating that
Leadership with the Directive Role is a predictor of Knowledge Generation.
The results from Hypothesis 2.4 is aligned with earlier studies. Although EFA
resulted in the factor renamed of Leadership with the Directive Role, this factor captures
several aspects of directive leadership in relation to the supportive management styles
toward KM processes. These aspects include the establishment of clear KM visions and

193
policies, the formation of the KM team, the clarification of the KM performance criteria,
and psychological support.
Previous studies suggest that the clarification of KM visions and policies is a
primary visible symbol of Thai structure that calls for obvious rules (Sarawanawong et
al., 2009). Thai employees expect to see clear and explicit vision and policies. Leaders
should identify objectives, activities, IT support, measurement, and individual roles
related to managing knowledge in their institutions (Sarawanawong et al., 2009).
Furthermore, the correlational results showed that KM measurement is important for
KM processes in Malaysian universities (generation, codification, and transfer,
Ramachandran et al., 2013). Leaders can measure the KM performance to ensure that
KM stays on track (Coukos-Semmel, 2002). Departments of colleges of education in the
United States set annual indicators that reflect changes in KM implementation,
considering the cost-effective strategy (Lee, 2007). In conclusion, this study supports
that Leadership with the Directive Role impacts Knowledge Generation.
Hypothesis 2.5 leadership (leadership with the directive role) and knowledge
codification. Hypothesis 2.5 was not analyzed because the EFA results dropped the
Knowledge Codification factor.
Hypothesis 2.6 leadership (leadership with the directive role) and knowledge
transfer. Hypothesis 2.6 was supported by the empirical data of the study sample.
Leadership (the term used in the original model) or Leadership with the Directive Role
(the renamed term resulting from the EFA) had a significant and positive relationship
with Knowledge Transfer. The path coefficient from Leadership with the Directive Role

194
to Knowledge Transfer ( = .343) was significant (p < .01), indicating that Leadership
with the Directive Role is a predictor of Knowledge Transfer.
Knowledge Transfer in this study represents sharing and distributing of
knowledge between an organization’s members (Aujirapongpan et al., 2010; Shoham &
Perry, 2009). Sharing of knowledge goes beyond the distribution of knowledge because
it helps ensure the exchange of knowledge within an organization’s communities.
Similar to Hypothesis 2.4, Leadership with the Directive Role impacts Knowledge
Transfer. Earlier study in relation to knowledge sharing found that organizational
rewards have a strong positive influence on knowledge sharing (Tan & Noor, 2013).
Rewards, both incentives and recognitions, from leaders to employees, who share
knowledge and then receive organizational rewards for their contributions, can influence
the commitments of other members.
Hypothesis 2.7 technology and knowledge generation. Hypothesis 2.7 was
supported by the empirical data of the study sample. Technology had a significant and
positive relationship with Knowledge Generation. The path coefficient from Technology
to Knowledge Generation ( = .180) was significant (p < .01), indicating that
Technology is a predictor of Knowledge Generation.
Generally, previous studies examined the influence of technology on the entire
KM process. The use of technology in public HEIs in Malaysia allows many KM
activities, such as knowledge capture, storage, and transfer, to take place (Ramachandran
et al., 2013). No research has investigated the relationship of Technology and
Knowledge Generation in the higher education context. This study provides the initial

195
result that Technology impacts Knowledge Generation in Thai HEIs. Thai people
usually use technology to search for information rather than to share discussion forum
(Sarawanawong et al., 2009). Technology allows employees to access, collect, and
assimilate existing internal knowledge within an organization and/or external knowledge
from outside (Dalkir, 2005; Watcharadamrongkun, 2012). The technological system
provides a knowledge database and repository to provide accessible organizational
knowledge.
Hypothesis 2.8 technology and knowledge codification. Hypothesis 2.8 was
not analyzed because the EFA results dropped the Knowledge Codification factor.
Hypothesis 2.9 technology and knowledge transfer. Hypothesis 2.9 was
supported by the empirical data of the study sample. Technology had a significant and
positive relationship with Knowledge Transfer. The path coefficient from Technology to
Knowledge Transfer ( = .343) was significant (p < .01), indicating that Technology is a
predictor of Knowledge Transfer.
The results from Hypothesis 2.9 supports the study of Ramachandran et al.
(2013), stating that technology becomes the most extensively used KM enabler in public
HEIs in Malaysia. Furthermore, these results seem to contrast the study of Tan and Noor
(2013) that claims that technology does not influence the achievement of KM in research
universities in Malaysia. They explained that knowledge is well-embedded in the values
and work practices of the well-established research universities. Since most of the
respondents (90%) in this study worked at teaching universities, the context of the
respondents differ from the study of Tan and Noor (2013) which focuses on research

196
universities. Based on the study sample, this study demonstrates that Technology
impacts Knowledge Transfer at least in some HEI contexts.
Hypothesis 2.10 performance measurement (strategic context) and
knowledge generation. Hypothesis 2.10 was supported by the empirical data of the
study sample. Performance measurement (the term used in the original model) or
Strategic Context (the renamed term resulting from the EFA) had a significant and
positive relationship with Knowledge Generation. The path coefficient from Strategic
Context to Knowledge Generation ( = .336) was significant (p < .01), indicating that
Strategic Context is a predictor of Knowledge Generation.
The results from Hypothesis 2.10 is consistent with earlier studies. Strategic
Context, renamed KM enabler factor, reflects several aspects of the strategic role of
leadership in promoting values for managing knowledge. Previous studies addressed that
HEIs need a synchronized strategy of KM that aligns with institutional missions and
goals (Ramachandran et al., 2013). The strategic support of leadership can show in a
form of the understanding of leadership toward the value of knowledge. This strategic
support influences individual learning, because it extensively increases an individual
commitment to collaborative learning within the workplace (Arntzen et al., 2009) and
encourages strong knowledge sharing activities (Sarawanawong, Tuamsuk, Vongprasert,
& Khiewyoo, 2009). Not only does the positive perception toward KM increase the
commitment in engaging the KM processes, but also the KM budget allocation is needed
to be considered to support the activities of acquiring, creating, storing, and sharing
knowledge (Arntzen et al., 2009).

197
Interestingly, this study also shows that leaders with a positive attitude toward
the benefit of KM, especially in increasing organizational incomes and knowledge
assets, becomes the influential KM indicator. However, no research study has deeply
investigated the cause and effect of this strategic aspect, showing the research gap in
relation to the cost-effective strategy for future studies.
Hypothesis 2.11 performance measurement (strategic context) and
knowledge codification. Hypothesis 2.11 was not analyzed because the EFA results
dropped the Knowledge Codification factor.
Hypothesis 2.12 performance measurement (strategic context) and
knowledge transfer. Hypothesis 2.12 was supported by the empirical data of the study
sample. Strategic Context had a significant and positive relationship with Knowledge
Transfer. The path coefficient from Strategic Context to Knowledge Transfer ( = .186)
was significant (p < .01), indicating that Strategic Context is a predictor of Knowledge
Transfer.
As mentioned in Hypothesis 2.10, Strategic Context influences KM processes,
not only on Knowledge Generation, but also on Knowledge Transfer. From the
economic perspective, measurement, one aspect of the strategic context, assists in
identifying knowledge assets and capabilities of an organization and aligning the
measurement activities with organizational strategies (Lee, 2007). Commonly,
measuring the outcomes of KM helps justify investments in managing knowledge, and
reinforce the support for its implementation.

198
All in all, this study demonstrates that Strategic Context impacts Knowledge
Generation and Knowledge Transfer. It becomes a strategic element to foster KM
processes through the mechanisms of encouraging individual learning and promoting
KM values in the workplace.
Hypothesis 2.13 knowledge generation and quality performance scores.
Hypothesis 2.13 was not supported by the empirical data of the study sample. The path
coefficient from Knowledge Generation to Quality Performance Scores ( = -.032) was
not significant (p > .05), indicating that Knowledge Generation is not a predictor of
Quality Performance Scores.
The results from Hypothesis 2.13 do not show significant relationships between
Knowledge Generation and Quality Performance Scores. However, no research has
specially investigated the relationship of Knowledge Generation and Quality
Performance Scores. It is unclear why the presence of Knowledge Generation does not
influence on Quality Performance Scores as found in this study. Further research
concerning this question is needed.
Hypothesis 2.14 knowledge codification and quality performance scores.
Hypothesis 2.14 was not analyzed because the EFA results dropped the Knowledge
Codification factor.
Hypothesis 2.15 knowledge transfer and quality performance scores.
Hypothesis 2.15 was not supported by the empirical data of the study sample. The path
coefficient from Knowledge Transfer to Quality Performance Scores ( = .121) was not

199
significant (p > .05), indicating that Knowledge Transfer is not a predictor of Quality
Performance Scores.
More notably, the results from Hypotheses 2.13 and 2.15 do not show the
significant relationships between KM processes (Knowledge Generation and Knowledge
Transfer) and Quality Performance Scores. These results contradict most previous
qualitative research studies that endorse the idea that KM contributes to the achievement
of higher education missions. For example, teaching can be enhanced through
knowledge sharing processes among faculty members (Chumjit, 2012; Cranfield, 2011;
McCarthy, 2006; Mohayidin et al., 2007). KM enhances research collaboration across a
university, resulting in an increase in the number of research projects and publications
(Chumjit, 2012; Cranfield, 2011; Tan & Noor, 2013). KM brings practical benefits to the
higher education achievement.
According to the scale of the quality performance score, the majority of Thai
universities get scores in the range of 3.51 – 4.50 (62.7%) and 4.51 and higher (36%).
These results lead to an error called a restriction of range that refers to the clustering of
ratings around a particular portion of the rating scale (Saal, Downey, & Lahey, 1980). A
restriction of range arbitrarily affects the rating to one particular polarity of the scale
(either lenient or severe ratings). This error fails to use ratings in other portions of the
scale, so it leads to a restriction in the range of variables. In correlational studies, this
type of statistical error can inflate or deflate the results.
Given the lack of empirical studies that have applied the direct performance
(such as accreditation scores) to measure the HEI performance outcome, this study is the

200
first attempt to apply Quality Performance Scores, accredited by the national education
agency, to represent alternative KM measurement. Although the specific findings with
regard to Hypotheses 2.13 and 2.15 were not anticipated, these findings were reported at
the model level that the hypothesized general model with seven factors was acceptable
based on the fit indices. The specific findings of Hypotheses 2.13 and 2.15 bring up
ideas that need to be verified regarding the use of the direct measurement to assess the
investment in KM.
In summary, the quantitative analysis supports that the hypothesized model can
capture the actual data set. The KM system model implies that KM enablers and KM
processes affect performance of HEIs. Considering the specific hypotheses, inversely,
the results seem not to be clear for two clear relationships (Culture and KM processes as
well as KM processes with Quality Performance Score). Culture is not always the
significant predictor of KM processes and KM processes may not necessarily result in
improved quality performance. Since empirical KM studies in higher education are
limited, more investigations are necessary to solve the puzzle.
Contextualized KM Factors of Thai Higher Education Institutions
The thematic analysis provided emerging themes of the supporting and blocking
factors based on the context of the universities in Thailand. The three following themes
have a people-focus that includes leadership, staff members’ attitudes toward KM, and
KM understandings.
Leadership. Consistent with previous studies, the qualitative data endorse that
the HEIs need strong KM support from top management (Coukos-Semmel, 2002; Lee,

201
2007; Ramachandran et al., 2013; Yusoff et al., 2012). Since the Thai people respect a
distant hierarchy, top management has strong influence in leading organizational
members in the required direction. University administrators can motivate a strong
commitment to KM initiatives by setting and communicating the KM vision, policies,
strategies, and goals.
An organization needs to consider whether to appoint a KM position (such as, a
chief knowledge officer) to develop and drive KM processes. When a leader is made up
of top management, an institution is likely to encourage its members to the KM
implementation more progressively and proactively (Yusoff et al., 2012). The assigned
KM leader is extensively mentioned by respondents as a supportive mechanism to
conduct successful KM. Thai universities reflect the national culture that calls for
clarification, structure, and rules. An assigned KM unit or team can be designed to meet
Thai social culture.
The KM leaders and teams should perform two major roles: to support top
management and to support academic and supporting units. These assigned KM leaders
and teams are primarily responsible for setting and monitoring the KM plan at the
institutional level and reporting KM performance to top management. At the same time,
they should facilitate KM resources and monitor the KM implementation of the school
and supporting units. Especially, the fundamental role is to communicate the
significance of KM and how to implement KM across the institution.
Staff members’ attitudes toward KM. Positive attitudes toward KM
significantly influence higher engagement in KM practices. Attitudes toward KM refers

202
to a level of individual perceptions (Arsenijević et al., 2010) and participation in
knowledge-related activities (Cranfield, 2011; Yusoff et al., 2012). The finding of this
study is consistent with previous empirical studies, claiming that the ability of an
organization to learn, develop, and share knowledge is dependent on individuals’
attitudes toward learning and knowledge sharing (Basu & Sengupta, 2007; Rašula et al.,
2012). Positive KM attitudes drive individuals’ commitments to participate in KM
activities that create a collaborative learning process. The collaborative learning provides
a social interaction through dialogue with others to see different perspectives and
experiences. When the organization’s members perceive the contribution of KM, they
tend to interact with others through good practices and lessons shared within groups that
can directly help increase productivity of their institutions.
Furthermore, the commitment to the job and loyalty to the workplace become
influential factors that change individuals’ behaviors to contribute to the successful KM
implementation. The passion for job and organization is an unspoken promise in the
Thai society (Sunalai, 2014). When the institution acknowledges employees’
contributions and employees receive fair treatment in return, they potentially engage
more in the organization’s achievement.
Interestingly, this study reflects the major unique finding, mentioned by
respondents, in the Thai context that “KM should be treated as a regular work; not an
occasional event.” This phenomenon occurs because KM has been set as the indicator in
the quality assurance assessment by the Ministry of Education. Many respondents
express that their universities should implement KM, aiming at leveraging the

203
organizational knowledge to achieving their university’s missions. With this intention,
the KM system is likely to be built in the regular work operations, so organizational
knowledge will reside in individuals’ and organizations’ behaviors where it can be
expressed as actionable knowledge. In contrast, some respondents point out that their
universities conduct KM assessment only occasionally in order to meet the requirement
of the QA criteria, rather than the purpose of using KM to leverage their knowledge.
This misled purpose creates unpleasant KM attitudes in the institution’s staff members.
The negative attitude toward KM, “to implement KM to get higher QA scores,” hinders
the effort in managing knowledge.
KM understandings of staff members. The most interesting finding from the
thematic analysis involves the variety of levels of KM understanding of the staff
members. The majority of respondents are not sure that their colleagues understand the
KM concept and practice correctly. Several comments express the concern that some
KM key persons and KM staff teams perceive KM as equivalent to training and
workshops. Consequently, these KM units and teams invest heavily in professional
training programs, seminars, and workshops to improve individuals’ competency levels.
They do not view KM as the activity of creating and sharing knowledge across the whole
KM system that aims to enhance self-developed, informal, and collaborative learning
within the workplace. The essence of KM is to enable members to participate in the flow
of knowledge. Surprisingly, some QA assessors, who evaluate the KM indicators,
misunderstand the KM concept. They measure the KM performance with the wrong
assumption. This is the most critical issue in managing knowledge since it leads the KM

204
effort in the wrong direction. This study draws attention to the way that the level of KM
understandings influences the KM implementation across the whole system. KM
activities and resources rely on the understandings that KM key persons hold.
Implications
The findings, which emerged from the current study, have several implications.
These following implications reinforce the existing HRD theory, research, and practice.
Implications for Theory
From a theoretical perspective, the implications are double. First, this study
offers a holistic model on the KM system by showing the linkage of continuity and
dynamism between three KM elements (enablers, processes, and outcomes). The model
develops an intention based theoretical model using the lens of three theories:
knowledge creation, organizational epistemology, and contingency theory.
The knowledge creation theory relies on the assumption that knowledge is
created through transformation of tacit knowledge into explicit knowledge. This study
endorses the importance of building the learning platform (known as “ba” in the
knowledge creation theory, Nonaka & Takeuchi, 2004). The learning platform helps
employees shape new experiences into knowledge, not just information. Several KM
activities in the Knowledge Transfer factor (such as, supporting knowledge platforms to
share tacit knowledge and providing opportunities for employees to build their
knowledge networks) assist in creating a community for dissemination and sharing
within the institution. Organizational performance depends on establishing a learning

205
environment in which individuals are encouraged to create, share, and use knowledge for
the benefit of the institution.
This study extends the organizational epistemology and contingency theories—
how the environment-organization interface impacts organization’s systems. The results
of the study provide the inclusive model for managing organizational knowledge due to
the comprehensiveness of hypothesized factors. The model identifies a variety of factors
that predict KM processes and outcomes. The coefficient paths from Figure 10 in
Chapter IV showed the multiple relationships affecting the interactions among
organizational elements within the institution. For example, the paths explained about 56
percent of the variance in Leader with the Direct Role to Knowledge Generation and 34
percent of the variance in the Technology to Knowledge Transfer relationship. These
results give a clearer view that HEIs need to put KM enablers in place that will stimulate
the development of individual knowledge, group sharing of knowledge, and
organizational knowledge retention.
The second implication proposes the values of KM to extend the boundary of
HRD, in particular the theory of learning. Chapter II identified the characteristics of
learning (Sun, 2003) and primarily focuses on three of these characteristics: learning is
active, constructive, and collaborative. The empirical result shows that the management
of organizational knowledge assists in leveraging individual and organizational learning.
KM activities help individuals actively construct their knowledge through interactions
with their knowledge sharing environment. Since learning involves situated and
collaborative processes, individuals can learn from informal knowledge, such as best

206
practices, lessons learned, and success stories. This learning occurs in an interaction
through processes of communication and collaboration. In other words, when
environment is not supportive, potential of individual to learn or share knowledge is
unused. Consequently, new knowledge is not generated and the opportunity to increase
the institution’s capital asset is lost.
Implications for Research
The current study reveals research implications in relation to the measurement of
KM enablers and processes in the academic institutions. The measurement in this study
corporates part of the modified KMAT questionnaire, designed from the western
business context. It is the first attempt to apply this instrument in Asian academic
institutions with the sophisticated statistical analyses (EFA, CFA, and SEM). Multiple
test construction steps were used to ensure the quality of the instrument in the specific
context—higher education institutions in Thailand. Although the results from EFA
generates the misclassified factors, the SEM proved that the entire instrument can
capture the general aspects of KM enablers and processes in the higher education setting.
This instrument contributes to establishing a more practical and accessible instrument for
researchers in the academic arena. It provides measurable constructs that researcher may
use to further investigate the organizational KM mechanisms of higher education, in
particular roles of leadership, levels of culture (institutional and national levels), and
individuals’ KM understandings and attitudes.
Likewise, this modified instrument provides an important starting point for study
of reliability and validity of KM measurement by developing the corresponding

207
theoretical dimensions (or factors). The understanding of the KM dimensions will allow
researchers to explore new insights into the field of KM enablers and processes. This
instrument can be applicable via the quantitative survey method, allowing scholars to
explore the relationship between KM enablers and processes along with other
organizational parameters, such as creativity (Rahimi et al., 2011) and planning and
decision-making (Keeley, 2004).
Implications for Practice
From a pragmatic perspective, this study has multiple implications that can be
classified into micro and macro levels. The micro level focuses on the institutions in
initiating or striving to promote the management of knowledge. The macro perspective
focuses on the KM system of higher education at the national level.
The micro level incorporates the four theoretical enablers of KM. First, prior to
launching KM initiatives, organizations should create an organizational culture that is
conducive to the creation and distribution of knowledge. The characteristics of culture
that support KM include fostering learning values, facilitating open communication, and
building trust among members. Organizations should develop and nurture KM culture
and practices that build trust, collective cooperation, and positive social interactions
among organizations’ members. Work context exemplified by high levels of trust,
collective cooperation, formal and informal networks facilitate knowledge exchanges
among individuals (Ellingsen, 2003; Tan & Noor, 2013).
The results of this study also showed that Thai universities need an incremental
change to manage their KM by embedding the KM values in their routine jobs. This

208
incremental change impacts an operation of each institution gradually, so does not
significantly threaten existing institution’s norms and practices (Burke, 2011). The
institution that values knowledge always motivates staff to learn and encourage a strong
knowledge culture.
The effect of culture is unclear from the quantitative findings in this study.
Though expected to have a positive and significant effect, it was found to have non-
significant relationships with KM processes. This might be due to the quantitative
questions not capturing the actual impact of culture on KM processes. Further research is
needed to determine the aspects of culture (e.g., national culture, corporate culture, and
knowledge culture) that influence the managing of knowledge.
Second, organizations should employ technology to increase the accessibility of
knowledge. Technology represents a set of important tools that facilitate individual and
collective activities to help manage the flow of knowledge throughout an organization.
Technology plays a significant role by supporting communication and collaboration and
searching for knowledge and information.
Third, the results of the study suggest that the managerial roles of leadership
have a positive influence on KM processes. Leaders are required to prepare and educate
employees in order to be able to understand and implement KM effectively. Leaders
should promote the values of KM through motivation and reward systems. By offering
motivation, an organization can promote knowledge sharing and encourage people to
participate in creating knowledge (Arntzen et al., 2009). Furthermore, the qualitative
study strongly suggests appointing a specific leader position or a unit in handling KM.

209
The role for a KM executive should involve acting as supervisor of heads of KM teams,
setting strategies, handling operations, and influencing changes in organizations. When a
leader is made up of top management, an institution is likely to encourage its members
to participate in KM implementation more progressively and proactively (Yusoff et al.,
2012). All in all, these directive roles affect intention and further the actual behavior of
an organization’s members in Thai institutions.
Last, the strategic context of the institution significantly influences the KM
initiative. The strategic context becomes the mechanism in which leaders use to facilitate
the flow of knowledge within their institutions. The HE institutions need to set clear KM
objectives, clarify of the criteria and indicator for measuring KM success, build learning
supportive environment, and consider cost-effective strategies in KM investment.
This KM study reflects the national KM system in higher education in Thailand.
First, KM provides components that HEIs can apply for performance improvement. KM
assists the universities in performing better management of knowledge for its continual
improvement. University administrators can measure KM enablers and processes and
then use this information as part of a performance benchmarking (Mok, 2005) or a
SWOT analysis (Watcharadamrongkun, 2012) to maintain quality of education. These
analyses provide information for identifying the directions of institutions and facilitating
activities that efficiently accomplish their missions and goals.
The qualitative results suggest that the key informants of each university have
different KM perspectives. These key informants have diverse backgrounds, such as
fields of education and functions. KM activities and resources will vary by definition of

210
KM that leaders hold. They have invested substantial time and resources based on their
KM definitions. This study reveals that some key informants misunderstand the essence
of KM. They view KM merely as professional training and workshops. Consequently,
these key KM persons provide learning interventions that cannot serve the purpose of
KM that aims to leverage knowledge posed in an organization to become actionable
knowledge applied into routine work. Since, the key informants have a role of change
agents, who send a signal of organizational change adopting KM in their organizations
(Coukos-Semmel, 2002; Lee, 2007), the correct understanding by the key persons is vital
to leading the KM direction.
Limitations
Several limitations to this study are important for discussion: (a) sample size, (b)
self-reported measures, and (c) validity of KM measure.
The first potential study limitation is a relatively small sample (150 respondents
from 60 universities) was used to develop scales and to examine the relationships in the
hypothesized model. This limitation is inescapable, given the size of the sample (n =
150). If a larger sample had been studied, the results of the statistical analyses may have
changed, such as better fit CFA and SEM models and additional significant paths
(Muthen & Muthen, 2002). Although this study was limited to quantitative methods of
data collection, the sample size was adequate to allow qualitative approaches for
examining KM enablers and processes.
The second potential limitation relates to self-reported measures. This study used
the survey instrument that relied on self-reported measures. It had distinct sample

211
groups. The findings depended on the diverse perceptions of key informants, regarding
their understandings, attitudes, and experiences, rather than on observable organizational
practices. Key informants may reflect their individual perceptions and have limited
understandings about the KM mechanisms occurring in their universities. Self-reports
are often criticized in terms of response bias and inaccuracy to make findings less robust
(Watcharadamrongkun, 2012).
The last potential limitation is the validity of KM measures. This study
constructed KM measures only in universities in Thailand that may have varying
relevancy and accuracy. Universities are considered as being in the academic services,
making them different from other types of organizations. The uniqueness of the
respondents means the findings cannot be generalized to other types of organizations or
other settings.
Recommendations for Future Research
Future research can extend the findings of this study in the following areas. First,
this study is based on the modest sample size of 150 respondents. A larger sample will
permit more statistical power for SEM (Muthen & Muthen, 2002) and allow the
conducting of the analysis with different demographic subgroups, such as university
type, size, age, location, and mission orientation. A multi-group analysis can be
conducted to analyze whether there are differences between the combined group model
and the multi-group model, and also whether there were differences between the groups.
Second, the KM enablers used in this study were limited to four organizational
interfaces that influence KM systems: culture, technology, strategic context, and

212
leadership. As such, these antecedents explain only a portion of the variance in the
dependent variable (knowledge generation and knowledge transfer). There may be other
factors which are not part of this study but may have significant influence on the KM
implementation. Future research should examine additional constructs that influence the
completeness of the KM system. The possible constructs include attitude toward KM,
KM understanding, role of KM key person or unit, organizational culture, external
network, and external environment (e.g., national policy, culture).
Last, the data in this study were drawn from a single method (survey and a
single set of respondents). Conclusions came from self-reported measures based on
individual perception. As such, the study may suffer from common method bias, a
statistical measurement error referring to “variance that is attributable to the
measurement method rather than to the constructs the measures represent” (Podsakoff,
MacKenzie, Lee, & Podsakoff, 2003, p.897). Future research can use case studies to
provide richer understanding of supportive factors and barriers of KM implementation.
A further study can examine universities that are recognized for having KM best
practices by investigating their accomplishments— what strategies and practices they
use and what organizational factors are significantly important.
Conclusion
The results of this study reveal that KM enablers and KM processes affect the
performance of higher education institutions in Thailand. The statistical analysis
generated four KM enablers (Technology, Strategic Context, Culture, and Leadership
with the Directive Role) and two KM processes (Knowledge Transfer and Knowledge
213
Generation) to explore the key relationships in KM systems. The thematic analysis
provides unique enablers for successful KM in the Thai context in relation to roles and
qualifications of KM leaders, impacts of corporate and national culture, individual
understandings and attitudes toward KM.
This study showed that successful KM is created depends on social interaction
that consists of collaborating participants and the way they participate in the flow of
knowledge. This social interaction is influenced by an organizational environment to
transform tacit knowledge into explicit knowledge through knowledge sharing.
Participants become the focal point of managing knowledge because they engage
in the flow of knowledge. Knowledge is a cognitive process of individuals’ insights,
experiences, know-how, and values that are to be justified through social interactions
among participants to make knowledge actionable and embedded in institutions’
repositories and routines. Participants need to have positive attitudes toward KM and
correct KM understandings that lead to higher engagement in KM practices. If
participants are not willing to share their knowledge among groups, there will be no
generation of organizational knowledge.
Knowledge should flow within institutions through dynamic and continuous KM
activities. The flow of knowledge arises from the process of creating, sharing, and using
knowledge on the job. Organizational knowledge is a direct result of the continuous
dialogue between tacit and explicit knowledge of the participants. Higher education
institutions need to find a way to improve participants’ interaction processes that make
knowledge flow fluently throughout their institutions.

214
The organization’s environment relies on KM enablers that vary in each
university based on their contextualized aspects, such as their missions, values, norms,
preference, and resources. These aspects vary in the forms of managerial assumptions
about employees, organizational strategies, structures, and technologies used.
These three mentioned elements (participants, flow of knowledge, and
organizational environment) reflect how the environment-organization interface impacts
the KM system. HEIs need to put KM enablers and processes in place that will stimulate
the development of individual knowledge, group sharing of knowledge, and
organizational knowledge retention.

215
REFERENCES
American Productivity and Quality Center (2000). Knowledge management: A guide for
your journey to best-practice processes. Houston, TX: American Productivity
and Quality Center.
American Productivity and Quality Center (2003). Measuring the impact of knowledge
management. Houston, TX: American Productivity and Quality Center.
Anderson, J. C. & Gerbing, D. W., (1988). Structural equation modeling in practice: A
review and recommended two-step approach. Psychological Bulletin, 103(3),
411-423. doi:10.1037/0033-2909.103.3.411
Arntzen, A., Worasinchai, L., & Ribière, V. (2009). An insight into knowledge
management practices at Bangkok University. Journal of Knowledge
Management, 13(2), 127-144. doi:10.1108/13673270910942745
Arsenijević, J., Tot, V. & Arsenijević, D. (2010). The comparison of two groups in
perception of knowledge management in the environment of higher education.
African Journal of Business Management, 4(9), 1916-1923. Retrieved from
http://www.academicjournals.org/journal/AJBM/article-abstract/A49D11732422
Aujirapongpan, S., Vadhanasindhu, P., Chandrachai, A., & Cooparat, P. (2010).
Indicators of knowledge management capability for KM effectiveness. VINE,
40(2), 183-203. doi:10.1108/13673270910942745
Basu, B. & Sengupta, K. (2007). Assessing success factors of knowledge management
initiatives of academic institutions–A case of an Indian business school.

216
Electronic Journal of Knowledge Management, 5(3), 273-282. Retrieved from
http://www.ejkm.com
Bentler, P. M., & Bonett, D. G. (1980). Significance tests and goodness of fit in the
analysis of covariance structures. Psychological bulletin, 88(3), 588-606.
http://dx.doi.org/10.1037/0033-2909.88.3.588
Bollen, K. A. & Pearl, J., (2013). Eight myths about causality and structural equation
models. In S. L. Morgan (Ed), Handbook of causal analysis for social research
(301-328). Dordrecht, Netherlands: Springer.
Boomsma, A. & Hoogland, J.J. (2001). The robustness of LISREL modeling revisited.
In R. Cudeck, S. Du Toit, & D. Sorbom (Eds.), Structural equation models:
Present and future (pp. 139-168). Chicago, IL: A Festschrift in Honor of Karl
Jeoreskog Scientific Software International.
Bratianu, C. (2010). A critical analysis of Nonaka’s model of knowledge dynamics.
Electronic Journal of Knowledge Management, 8(2), 193-200. Retrieved from
http://www.ejkm com
Brown, M. M. (1989). What are the qualities of good research. In F. H. Hultgren & D. L.
Coomer (Eds.), Alternate modes of inquiry in home economics research. Yearbook
9, American Home Economics Association. (pp. 257-297). Peoria, IL: Glencoe
Publishing Company.
Bukowitz, W. &Williams, R. (2000). The knowledge management fieldbook. London:
Prentice Hall.
217
Bureau of Standards and Evaluation (2015). CHE QA Online System [Database].
Retrieved from http://www.cheqa.mua.go.th/che2556/
Bureau of Standards and Evaluation. (2010).
คมอการประกนคณภาพการศกษาภายในสถานศกษาระดบอดมศกษา พ.ศ. 2553 [Manual for the Internal
Quality Assurance for Higher Education Institutions]. Office of the Higher
Education Commission Bangkok, Thailand: Author.
Burke, W. W. (2011). Organization change: Theory and practice (3rd ed.). Thousand
Oaks, CA: SAGE Publications.
Cardona, B., Jain, S., & Canfield-Davis, K. (2012). Home-school relationships: A
qualitative study with diverse families. The Qualitative Report, 17(70), 1-20.
http://www.nova.edu/ssss/QR/QR17/cardona.pdf
Chang, L. K., Lee, S., & Kang, I. W. (2005). KMPI: Measuring knowledge management
performance. Information & Management, 42(3), 469-482. Retrieved from
http://www.sciencedirect.com/science/article/pii/S0378720604000473
Chen, J. & Wei, S. (2008). University–industry collaboration, knowledge management
and enterprise innovation performance: An empirical study. Industry & Higher
Education, 22(5), 275-287. Retrieved from http://eric.ed.gov/?id=EJ813877
Chen, Y. Y., Yeh, S. P., & Huang, H. L. (2012). Does knowledge management “fit”
matter to business performance? Journal of Knowledge Management, 16(5), 671-
687. doi:2048/10.1108/13673271211262745

218
Choi, B. & Lee, H. (2003). An empirical investigation of KM styles and their effect on
corporate performance. Information & Management, 40(5), 403-417.
doi:10.1016/S0378-7206(02)00060-5
Chuang, S. H. (2004). A resource-based perspective on knowledge management
capability and competitive advantage: an empirical investigation. Expert Systems
with Applications, 27(3), 459-465. doi:10.1016/j.eswa.2004.05.008
Chumjit, S. (2012). Knowledge management in higher education in Thailand (Doctoral
dissertation). Available from ProQuest Dissertations and Theses database. (UMI
No.3553606).
Cohen, J. & Cohen, P. (1983). Applied multiple regression/correlation analysis for the
behavioral sciences (2nd ed.). Hillsdale, NJ: Erlbaum.
Cook, S. D. N. & Brown, J. S., (1999) Bridging epistemologies: The generative dance
between organizational knowledge and organizational Knowing. Organization
Science, 10(4), 381-400. doi:10.1287/orsc.10.4.381
Costello, A. B., & Osborne, J. W. (2005). Best practices in exploratory factor analysis:
Four recommendations for getting the most from your analysis. Practical
Assessment Research and Evaluation, 10(7), 1-9.
Coukos-Semmel, E. D. (2002). Knowledge management: Processes and strategies used
in United States research universities (Doctoral dissertation). Available from
ProQuest Dissertations and Theses database. (UMI No. 3041780). Retrieved
from pareonline.net/pdf/v10n7.pdf

219
Cranfield, D. (2011). Knowledge management and higher education: A UK case study
using grounded theory (Doctoral dissertation). Retrieved from
http://eprints.soton.ac.uk/
Creswell, J. W. & Clark, V. L. (2011). Designing and Conduction Mixed Methods
Research. Thousand Oaks, CA: Sage.
Creswell, J. W. (2014). Research design: Qualitative, quantitative, and mixed methods
approaches (4th ed.). Thousand Oaks, CA: Sage.
Creswell, J. W. & Creswell, J. D. (2005). Mixed methods research: Developments,
debates, and dilemmas. In R. A. Swanson & E. F. Holton (Eds.), Research in
organizations: Foundations and methods in inquiry. (pp. 315-327). San
Francisco, CA: Berrett-Koehler Publishers.
Dagli, G., Silman, F., & Birol, C. (2009). A qualitative research on the university
administrators’ capacity to use management knowledge tools (The case of TRNC
universities). Educational Sciences: Theory and Practice, 9(3), 1269-1290.
doi:10.1016/j.sbspro.2009.01.438
Dalkir, K. (2005). Knowledge management in theory and practice. Burlington, MA:
Elsevier Butterworth–Heinemann.
Davenport, T. H. & Prusak, L. (1998). Working knowledge: How organizations manage
what they know. Boston, MA: Harvard Business School Press.
Davenport, T. H., Harris, J. G., De Long, D. W., & Jacobson, A. A. (2001). Data to
knowledge to results: Building an analytic capability. California Management
Review, 43(2), 117-138. Retrieved from http://web.b.ebscohost.com.lib-

220
ezproxy.tamu.edu:2048/ehost/pdfviewer/ pdfviewer?sid=50615596-2c5a-44fe-
8250-b705bc407a8a%40sessionmgr114&vid= 0&hid=107
Degroot, A. M. B., Dannenburg, L., & Vanhell, J. G. (1994). Forward and backward
word translation by bilinguals. Journal of Memory and Language, 33(5), 600-
629. http://www.sciencedirect.com/science/article/pii/S0749596X84710291
Devriendt, E., Van den Heede, K., Coussement, J., Dejaeger, E., Surmont, K., Heylen,
D., Schwendimann, R., Sexton, B., Wellens, N., Boonen, S., & Milisen, K.,
(2012). Content validity and internal consistency of the Dutch translation of the
Safety Attitudes Questionnaire: An observational study. International Journal of
Nursing Studies, 49, 327-337. doi:10.1016/j.ijnurstu.2011.10.002
Drucker, P. (1994, November). The social age of transformation. Atlantic Monthly,
274(5), 51-80. Retrieved from https://docs.google.com/file/d/0B-5-
JeCa2Z7hd0pSYkV6S3FwOTA/ edit?pli=1
Ellingsen, G. (2003). The role of trust in knowledge management: A case study of
physicians at work at the university hospital of Northern Norway. Informing
Science, 6, 193-207. Retrieved from
http://www.inform.nu/Articles/Vol6/v6p193-207.pdf
Fenwick, T. (2008). Workplace learning: Emerging trends and new perspectives. New
Directions for Adult and Continuing Education, 119, 17-26. doi:10.1002/ace.302
pp
Gliner, J. A. & Morgan, G. A. (2000). Research methods in applied settings: An
integrated approach to design and analysis. Mahwah, NJ: Lawrence Erlbaum.

221
Gold, A. H., Malhotra, A., & Segars, A. H. (2001). Knowledge management: An
organizational capabilities perspective. Journal of management information
systems, 18(1), 185-214. Retrieved from http://public.kenan-
flagler.unc.edu/faculty/malhotra/kmjmis.pdf
Golden, C. (2009). Knowledge management and historically black colleges and
universities (Doctoral dissertation). Available from ProQuest Dissertations and
Theses database. (UMI No.3355016).
Gourlay, S. & Nurse, A. (2005). Flaws in the engine of knowledge creation. In A. F.
Bouno & F. Poulfelt (Eds.), Challenges and issues in knowledge management
(pp. 293-251). Charlotte, NC: Information Age Publishing.
Gregory, J. & Jones, R. (2009). Maintaining competence: A grounded theory typology of
approaches to teaching in higher education. Higher Education, 57, 769-785.
doi:10.1007/s10734-008-9175-8
Guba, E. G. & Lincoln, Y.S. (2005). Paradigmatic controversies, contradictions, and
emerging confluences. In N. K. Denzin & Y. S. Lincoln (Eds.), The Sage handbook
of qualitative research (3rd ed.). (pp. 191-215). Thousand Oaks, CA: Sage.
Guba, E. G. & Lincoln, Y. S. (1981). Effective evaluation: Improving the usefulness of
evaluation results through responsive and naturalistic approaches. San
Francisco, CA: Jossey Bass.
Hair, J. F., Black, W. C., Babin, B. J., & Anderson, R. E. (2010). Multivariate data
analysis. Upper Saddle River, NJ: Prentice Hall.
222
Heisig, P. (2009). Harmonisation of knowledge management–Comparing 160 KM
frameworks around the globe. Journal of Knowledge Management, 13(4), 4-31.
doi:10.1108/13673270910971798
Holbert, R. L. & Stephenson, M. T. (2002). Structural equation modeling in the
communication sciences, 1995–2000. Human Communication Research, 28(4),
531–551. doi:10.1111/j.1468-2958.2002.tb00822.x
Holton, E. F., Bates, R. A., & Ruana, W. E. A. (2001). Development of a generalized
learning transfer system inventory. Human Resource Development Quarterly,
11(4), 333-360. doi:10.1002/1532-1096(200024)11:4<333::AID-
HRDQ2>3.0.CO;2-P
Holton, E. F. & Burnett, M. F. (2005). The basic of quantitative research. In R. A.
Swanson & E. F. Holton (Eds.), Research in organizations: Foundations and
methods in inquiry. (pp.29-44). San Francisco, CA: Berrett-Koehler Publishers.
Hu, L. & Bentler, P. M. (1999). Cutoff criteria for fit indexes in covariance structure
analysis: Conventional criteria versus new alternative. Structural Equation
Modeling, 6, 1-55. doi: 10.1080/10705519909540118
Isaac, S., & Michael, W. B. (1995). Handbook in research and evaluation: A collection
of principles, methods, and strategies useful in the planning, design, and
evaluation of studies in education and the behavioral sciences. (3rd ed.). San
Diego, CA: Educational and Industrial Testing Services.

223
Jackson, D. L., Gillaspy Jr, J. A., & Purc-Stephenson, R. (2009). Reporting practices in
confirmatory factor analysis: an overview and some recommendations.
Psychological methods, 14(1), 6-23. doi: 10.1037/a0014694
Jager, M. (1999). The KMAT: Benchmarking knowledge management. Library
Management, 20(7), 367-372. doi:10.1108/01435129910285136
Jones, C. (2010). Archival data: Advantages and disadvantages for research in
psychology. Social and Personality Psychology Compass, 4(11), 1008-1017.
doi:10.1111/j.1751-9004.2010.00317.x
Jupp, V. (2006). The SAGE dictionary of social research methods. Thousand Oaks, CA:
Sage. doi:10.4135/9780857020116
Keeley, E. J. (2004). Institutional research as the catalyst for the extent and effectiveness
of knowledge-management practices in improving planning and decision-making
in higher education organizations (Doctoral dissertation). Available from
ProQuest Dissertations and Theses database. (UMI No. 3152488).
Kenny, D. A., & McCoach, D. B. (2003). Effect of the number of variables on measures
of fit in structural equation modeling. Structural equation modeling, 10(3), 333-
351. doi: 10.1207/S15328007SEM1003_1
Kidwell, J., Vander Linde, K., & Johnson, S. (2000). Applying corporate knowledge
management practices in higher education. Educause Quarterly, 23(4), 28-33.
Retrieved from https://net.educause.edu/ir/library/pdf/EQM0044.pdf
Kline, R. B. (2011). Principles and practice of structural equation modeling (3rd ed.).
New York, NY: Guilford Press.

224
Kwok, O.M. (2014). EPSY 651 Theory of Structural Equation Modelling. [Class
handout]. Department of Educational Psychology, Texas A&M University,
College Station, TX.
Lavrakas, P. J. (2008). Encyclopedia of survey research methods. Thousand Oaks, CA:
Sage Publications, Inc.
Lawrence, P. & Lorsch, J. (1967). Differentiation and integration in complex
organizations. Administrative Science Quarterly, 12, 1-30. Retrived from
http://faculty.babson.edu/ krollag/org_site/org_theory/Scott_articles/lawren_
lorsch_cont.html
Lee, H. Y. (2007). Department chairs’ perceptions of knowledge management strategies
in colleges of education: Measurement of performance and importance by
organizational factors (Doctoral dissertation). Retrieved from Dissertation
Abstracts International. (AAI3292171)
Lehner, F. & Haas, N. (2010). Knowledge management success factors–Proposal of an
empirical research. Electronic Journal of Knowledge Management, 8(1), 79-90.
Retrieved from http://www.ejkm.com
Leonard, D. & Swap, W. (2005). Deep smarts: How to cultivate and transfer enduring
business wisdom. Boston, MA: Harvard Business School Press.
Lynn, M.R. (1986). Determination and quantification of content validity. Nursing
Research, 35(6), 382-385. Retrieved from http://ovidsp.tx.ovid.com.lib-
ezproxy.tamu.edu
225
Marquardt, M. J. (2011). Building the learning organization: Achieving strategic
advantage through a commitment to learning (3rd ed.). Boston, MA: Nicholas
Brealey Publishing.
Marquardt, M., Berger, N., & Loan, P. (2004). HRD in the age of globalization.
Cambridge, MA: Basic Books.
Marsh, H. W., Hau, K. T., & Wen, Z. (2004). In search of golden rules: Comment on
hypothesis-testing approaches to setting cutoff values for fit indexes and dangers
in overgeneralizing Hu and Bentler's (1999) findings. Structural equation
modeling, 11(3), 320-341. doi:10.1207/s15328007sem1103_2
Marsick, V. J. & Watkins, K. E. (1994). The learning organization: An integrative vision
for HRD. Human Resource Development Quarterly, 5(4), 353-360.
doi:10.1002/hrdq.3920050406
McCarthy, A. F. (2006). Knowledge management: Evaluating strategies and processes
used in higher education (Doctoral dissertation). Available from ProQuest
Dissertations and Theses database. (UMI No. 3221289).
McLean, G. N. (2006). Organization Development: Principles, Processes, Performance.
San Francisco, CA: Berrett-Koehler Organizational Performance.
Merriam, B., Caffarella, S., & Baumgartner, M. (2007). Learning in adulthood: A
comprehensive guide (3rd ed.). San Francisco, CA: Jossey-Bass.
Meyers, L. S., Gamst, G., & Guarino, A.J. (2013). Applied multivariate research (2nd
ed.). CA: Thousand Oaks.

226
Mohayidin, M.G., Azirawani, N., Kamaruddin N., & Margono, M. I. (2007). The
application of knowledge management in enhancing the performance of
Malaysian universities. Electronic Journal of Knowledge Management, 5(3),
301-312. Retrieved from http://www.ejkm.com
Mok, K. H. (2005). The quest for world class university. Quality Assurance in
Education, 13(4), 277-304. doi:10.1108/09684880510626575
Muthen, L. K. & Muthen, B. (2008). Exploratory factor analysis, confirmatory factor
analysis, and structural equation modeling for continuous outcomes. Retrieved
from http://www.ats.ucla.edu/stat/seminars/muthen_08/2008_March_Hopkins_
Topic_1-_v4.pdf
Muthen, L.K. & Muthen, B. (2002) How to use a Monte Carlo study to decide on sample
size and determine power. Structural Equation Modeling, 4, 599-620. doi:
10.1207/S15328007SEM0904_8
National Institute of Standards and Technology, Baldrige National Quality Program.
(2013). 2013 Education criteria for performance excellence. Gaithersburg, MD:
National Institute of Standards and Technology.
NHS National Library for Health. (2005). ABC of knowledge management. Retrieved
from http://www.fao.org/fileadmin/user_upload/knowledge/docs/ABC_ of_
KM.pdf
Nonaka (1991). Knowledge creation company. Harvard Business Review, July, 96-104.
Retrieved from https://hbr.org/2007/07/the-knowledge-creating-company

227
Nonaka, I. & Takeuchi, H. (2004). Knowledge creation and dialectics. In H. Takeuchi, I.
Nonaka (Eds.), Hitotsubashi on knowledge management (pp.1-28). Singapore:
John Wiley & Sons (Asia).
Nulty, D. D. (2008). The adequacy of response rates to online and paper surveys: What
can be done? Assessment & Evaluation in Higher Education, 33(3), 301-314. doi:
10.1080/02602930701293231
O’Dell, C. & Hubert, C. (2011). The new edge in knowledge: How knowledge
management is changing the way we do business. Hoboken, NJ: John Wiley &
Sons.
O’Dell, C. & Trees, L. (2014). How smart leaders leverage their experts. Retrieved from
http://www.apqc.org/knowledge-base/download/K04979
Podsakoff, P. M., MacKenzie, S. B., Lee, J. Y., & Podsakoff, N. P. (2003). Common
method biases in behavioral research: a critical review of the literature and
recommended remedies. Journal of applied psychology, 88(5), 879-903.
doi:10.1037/0021-9010.88.5.879
Polanyi, M. (1997). The tacit dimension. In L. Prusak (Ed), Knowledge in organizations
(pp. 135-146). Woburn, MA: Butterworth-Heinemann.
Prados, J. W., Peterson, G. D., & Lattuca, L. R. (2005). Quality assurance of engineering
education through accreditation: The impact of engineering criteria 2000 and its
global influence. Journal of Engineering Education, 94, 165-184.
doi:10.1002/j.2168-9830.2005.tb00836.x

228
Prince, C. (2004). University accreditation and the corporate learning agenda. Journal of
Management Development, 23(3), 256-269. doi:10.1108/02621710410524113
Pugh, D. & Hickson, D. J. (2007). Writers on Organizations (6th ed.). London: Penguin
Books.
Rahimi, H., Arbabisarjou, A., Allameh, S. M., & Aghababaei, R. (2011). Relationship
between knowledge management process and creativity among faculty members
in the University. Interdisciplinary Journal of Information, Knowledge, and
Management, 6, 17-33. Retrieved from
http://www.ijikm.org/Volume6/IJIKMv6p017-033Rahimi517.pdf
Ramachandran, S. D., Chong, S. C., & Wong, K. Y. (2013). Knowledge management
practices and enablers in public universities: A gap analysis. Campus-Wide
Information Systems, 30(2), 76-94. doi:10.1108/10650741311306273
Rašula, J., Bosilj Vukšić, V., & Indihar Štemberger, M. (2012). The impact of
knowledge management on organizational performance. Economic and Business
Review, 14(2), 147-168. Retrieved from http://edr.ef.uni-lj.si.hosting-
7.domovanje.com/ojs/index.php/ebr/ article/view/85
Rubenstein-Montano, B., Liebowitz, J., Buchwalter, J., McCaw, D., Newman, B., &
Rebeck, K. (2001). A systems thinking framework for knowledge management,
Journal Decision Support Systems, 31(1), 5-16. doi:10.1016/S0167-
9236(00)00116-0
Russ-Eft, D. & Hoover, A. L. (2005). Experimental and quasi-experimental designs. In
R. A. Swanson & E. F. Holton (Eds.), Research in organizations: Foundations

229
and methods in inquiry. (pp.75-95). San Francisco, CA: Berrett-Koehler
Publishers.
Saal, F. E., Downey, R. G., & Lahey, M. A. (1980). Rating the ratings: Assessing the
psychometric quality of rating data. Psychological Bulletin, 88(2), 413-428.
Santos, R. A. (1999). Cronbach’s alpha: A tool for assessing the reliability of scales.
Journal of Extension, 37(2). Retrieved from http://www.joe.org/joe/1999april/
tt3.php
Sarawanawong, J, Tuamsuk, K., Vongprasert, C., & Khiewyoo, J. (2009). Development
of a strategic knowledge management model for Thai universities. Proceedings of
the Asia-Pacific Conference on Library & Information Education & Practice,
288-298. Retrieved from http://www.slis.tsukuba.ac.jp/a-
liep2009/proceedings/Papers/a33.pdf
Schein, E. (1999). The corporate culture survival guide: Sense and nonsense about
cultural change. San Francisco: Jossey-Bass.
Schreiber, J. B., Nora, A., Stage, F. K., Barlow, E. A., & King, J. (2006). Reporting
structural equation modeling and confirmatory factor analysis results: A review.
The Journal of Educational Research, 99(6), 323-338.
doi:10.3200/JOER.99.6.323-338
Shoham, S. & Perry, M. (2009). Knowledge management as a mechanism for
technological and organizational change management in Israeli universities.
Higher education, 57(2), 227-246. doi:10.1007/s10734-008-9148-y

230
Sideridis, G., Simos, P., Papanicolaou, A., & Fletcher, J. (2014). Using structural
equation modeling to assess functional connectivity in the brain power and
sample size considerations. Educational and psychological measurement, 74(5),
733-758. doi: 10.1177/0013164414525397
Skyrme, D. J. (2000). Developing a knowledge strategy: From management to
leadership. In D. Morey, M. Maybury & B. Thuraisingham (Eds.), Knowledge
management: Classic and contemporary works (pp. 61-83). Cambridge, MA:
The MIT Press.
Stein, D. (1998). Situated learning in adult education. ERIC Clearinghouse on Adult
Career and Vocational Education Columbus OH, No.195. Retrieved from
http://ericae.net/edo/ed418250.htm
Sun, H. C. (2003) Conceptual clarifications for organizational learning, learning
organization and a learning organization. Human Resource Development
International, 6(2), 153-166. doi: 10.1080/13678860110086465
Sunalai, S. (2014). Understanding career development in Thailand through the lens of
the national cultural perspective. Proceedings of the 2014 Academy of Human
Resource Development International Research Conference in the Americas.
Houston, TX, USA.
Sunalai, S. & Beyerlein, M., (in press). Exploring knowledge management in higher
education institutions: Processes, influences, and outcomes. Academy of
Educational Leadership Journal.

231
Swanson, R. A. & Holton, E. F. (2001). Research in organizations: Foundations and
methods in inquiry. San Francisco, CA: Berrett-Koehler Publishers.
Tan, C. N. L. & Noor, S. (2013). Knowledge management enablers, knowledge sharing
and research collaboration: A study of knowledge management at research
universities in Malaysia. Asian Journal of Technology Innovation, 21(2), 251-
276. doi:10.1080/19761597.2013.866314
Taylor, P. & Braddock, R. (2007). International university ranking systems and the idea
of university Excellence. Journal of Higher Education Policy and Management,
29(3), 245-260. doi:10.1080/13600800701457855
Tremblay, M. D. (1957). The key informant technique: A nonethnographic application.
American Anthropologist, 59(4), 688-701. doi:10.1525/aa.1957.59.4.02a00100
Trisnaningsih, S. (2013). Contingency model to improve lecturers’ performance with
motivation as an intervening variable. International Journal of Academic
Research, 5(1), 54-59. doi:10.7813/2075-4124.2013/5-1/B.10
Van der Spek, R. & Spijkervet, A. (1997). Knowledge management: Dealing intelligently
with knowledge. In J. Liebowitz, & L.C. Wilcox (Eds), Knowledge management
and its integrative elements (pp. 31-60). Boca Raton, FL: CRC Press.
Von Krogh, G. & Roos, J. (1995). Organizational epistemology. New York, NY: St.
Martin’s Press.
Von Krogh, G. & Roos, J. (1996). An essay on corporate epistemology. In G. Von
Krogh, & J. Roos (Eds.), Managing knowledge: Perspectives on cooperation and
competition (pp. 157-183). Thousand Oaks, CA: SAGE Publications.
232
Wang, J. & Wang, X. (2012). Structural Equation Modeling: Applications Using Mplus.
West Sussex, United Kingdom: John Wiley & Sons.
Watcharadamrongkun, S. (2012). Predictors and effects of knowledge management in
US colleges and schools of Pharmacy (Doctoral dissertation). Available from
ProQuest Dissertations and Theses database. (UMI No. 3543736).
Wiig, K. (1993). Knowledge management foundations: Thinking about thinking how
people and organizations create, represent and use knowledge. Arlington, TX:
Schema Press.
Yang, B. (2004). Holistic learning theory and implications for human resource
development. Advances in Developing Human Resources, 6(2), 241-262. doi:
10.1177/1523422304263431
Yoopetch, C. (2009). Knowledge management outcomes of bank branches in Thailand.
University of the Thai Chamber of Commerce Journal, 29(2), 21-33. Retrieved
from http://utcc2.utcc.ac.th/utccjournal/291/Chanin%20Yoopetch.pdf
Yusoff, M., Mahmood, A., & Jaafar, J. (2012). A study of KM process and KM enabler
in a Malaysian community college. Journal of Knowledge Management Practice,
13(1), np. Retrieved from http://www.tlainc.com/articl297.htm
Zheng, W., Yang, B., & McLean, G. N. (2010). Linking organizational culture,
structure, strategy, and organizational effectiveness: Mediating role of knowledge
management. Journal of Business Research, 63(7), 763-771.
doi:10.1016/j.jbusres.2009.06.005

233
APPENDIX A
QUESTIONNAIRE
Knowledge Management Systems in Higher Education Institutions in Thailand:
A Holistic Model of Enablers, Processes, and Outcomes
Knowledge management (KM) plays an important role in higher education
institutions because it provides a holistic view with which to measure, analyze, improve,
and manage organizational knowledge that enhances organizational achievement. This
research study defines KM as a process of handling knowledge that results from
individual, group, and organizational learning to improve organizational performance
related to teaching, research, community service, and university management. The
objective of this study is to develop a model linking KM enablers and processes to
quality performance of higher education institutions.
Your participation in this research study is very much appreciated. The
completion of this questionnaire is very important to the overall design of the study.
Please allow 15-20 minutes to complete this questionnaire that contains 48 items. While
answering the questionnaire, please rate the KM system for the entire university. The
design of this dissertation study concentrates on the organizational level of analysis. In
other words, your responses will be used as a proxy for the university’s overall status.
Please be open and candid with your responses. All information you provide will
be strictly confidential in accordance with the protocol of Texas A&M University
Institutional Review Board (IRB). The records of this study will be kept private. No
identifiers linking you to this study will be included in any sort of report that might be
published. Research records will be stored securely and only Principal Investigator,
Protocol Director, and IRB Protocol will have access to the records. Furthermore, your
responses will only be presented in aggregate, and no single individual’s results will be
highlighted.
Thank you for participating in this survey. If you would like a summary copy of
this study and the result of your university benchmarking with the overall universities,
please fill in the request form at the last page of the questionnaire.

234
If you have any questions or concerns, please do not hesitate to contact me
directly at [email protected] or Professor Michael Beyerlein, Principal Investigator at
[email protected]. For questions about your rights as a research participant, to
provide input regarding research, or if you have questions, complaints, or concerns about
the research, you may call the Texas A&M University Human Subjects Protection
Program office by phone at 1-979-458-4067, toll free at 1-855-795-8636, or by email at
This research is voluntary and you have the choice whether or not to be in this
research study. You may decide to not begin or to stop participating at any time. You do
not need to answer any questions that make you uncomfortable. The following statement
is a consent from required by Texas A&M University. By choosing “I Accept” below,
you agree that you have had the opportunity to read this consent from and understand it
or have contacted me and had your questions answered. Now you are prepared to
participate in the research project described above. If you wish, you can print this form
for your records before continuing.
Consent statement
I voluntarily agree to participate in the research survey of “Knowledge
Management Systems in Higher Education Institutions in Thailand: A Holistic Model of
Enablers, Processes, and Outcomes” being conducted by Suravee Sunalai, of the
Department of Educational Administration & Human Resource Development at Texas
A&M University.
The procedures have been explained to me, and my questions have been
answered. I understand that any identifiable information in regard to my university
name will remain confidential, that is, this information will not be listed in the
dissertation of any future publication (s).
I accept
I do not accept

235
Knowledge Management Systems in Higher Education Institutions in Thailand:
A Holistic Model of Enablers, Processes, and Outcomes
Please allow 15-20 minutes to complete this questionnaire that contains 39 items
and includes 4 sections.
1) Institutional demographic information
2) KM enablers
3) KM processes
4) Internal factors for supporting or blocking successful KM
Section 1 Institutional Demographic Information
For a research purpose, please indicate your institutional demographic information.
Your responses will only be presented in aggregate, and no single individual’s results
will be highlighted.
1. Type of university
Public Private
2. Mission orientation of university
Research-oriented university
Teaching-oriented university
Community service-oriented university
3. University name………………………………………………………………….
4. Your unit (Please choose only one choice)
College or School Supporting unit
Health science
Physical or biological science
Humanity or sociology
Technology
Others…………………
Policy, planning, and budgeting
Human resource
Quality assurance
Technology
Others…………………

236
Section 2 KM Enablers
Please indicate your level of agreement with each statement regarding KM
enablers within your university. Mark one number on the scale (1-5) with 1 being
“almost never” and 5 being “almost always”.
No. KM Enablers 1
almost
never
2
seldom
3
some-
times
4
often
5
almost
always
N/A
5. The university culture facilitates
knowledge building and sharing.
6. The university has a culture of
6.1 openness in sharing knowledge.
6.2 trust in sharing knowledge.
7. The university’s KM system creates a
knowledge value for the university’s
achievement of its missions.
8. The university’s KM system facilitates
the employees’ learning process.
9. The university’s desire to innovate drives
employees’ learning processes.
10. The university has a culture of
accountability for individual learning.
11. The university administrators include the
management of organizational knowledge
in the university’s strategic plan.
12. The university administrators
acknowledge that managing
organizational knowledge helps increase
income (e.g., from products of R&D,
books, and consultations).
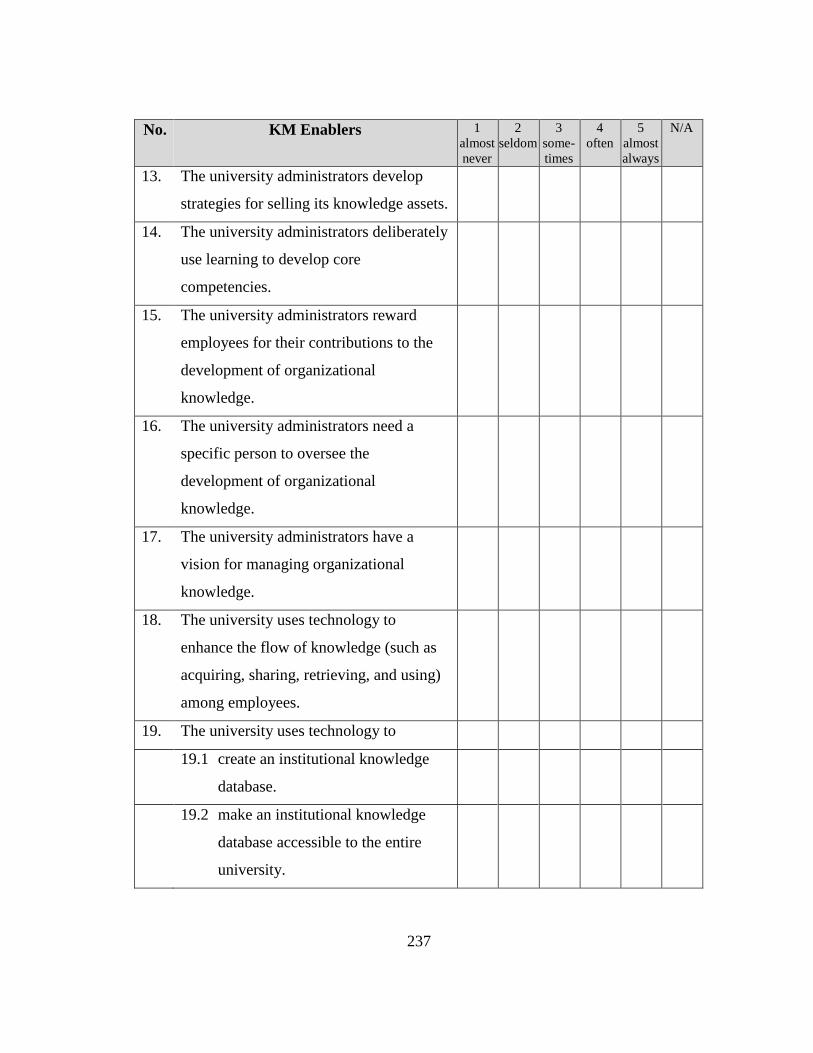
237
No. KM Enablers 1
almost
never
2
seldom
3
some-
times
4
often
5
almost
always
N/A
13. The university administrators develop
strategies for selling its knowledge assets.
14. The university administrators deliberately
use learning to develop core
competencies.
15. The university administrators reward
employees for their contributions to the
development of organizational
knowledge.
16. The university administrators need a
specific person to oversee the
development of organizational
knowledge.
17. The university administrators have a
vision for managing organizational
knowledge.
18. The university uses technology to
enhance the flow of knowledge (such as
acquiring, sharing, retrieving, and using)
among employees.
19. The university uses technology to
19.1 create an institutional knowledge
database.
19.2 make an institutional knowledge
database accessible to the entire
university.

238
No. KM Enablers 1
almost
never
2
seldom
3
some-
times
4
often
5
almost
always
N/A
20. The university uses technology to allow
students to provide feedback to the
university’s performance.
21. The university provides technology to
enhance collaborative learning efforts
among employees.
22. The university’s information system is
designed to help employees make better
decisions in a timely fashion.
23. The university’s assessment process has
ways to link KM to the budget allocated.
24. The university has a specific set of
indicators to measure KM outcomes.
25. The university has a measurement system
that incorporates measures of intangible
assets.
26. The university allocates resources for
efforts that measurably increase its
knowledge.
27. The university’s annual report includes an
assessment of how knowledge has
contributed to organizational
performance.

239
Section 3 KM Processes
Please indicate your level of agreement with each statement regarding usual KM
practices and approaches within your university. Mark one number on the scale (1-5)
with 1 being “almost never” and 5 being “almost always”.
No. KM Processes 1
almost
never
2
seldom
3
some-
times
4
often
5
almost
always
N/A
28. The university identifies organizational
knowledge needs systematically.
29. The university uses well-defined work
practices to address knowledge needs.
30. The university creates its organizational
knowledge directories that list
employees’ skills, knowledge, and
location.
31. The university creates directories with
specialized knowledge of other groups
(outside the university) aligned with the
university.
32. The university develops mechanisms to
32.1 gather knowledge systematically.
32.2 gather knowledge ethically.
33. The university transfers its tacit
knowledge (what employees know how
to do but cannot express) across the
university through
33.1 supporting knowledge platforms to
share tacit knowledge, such as a
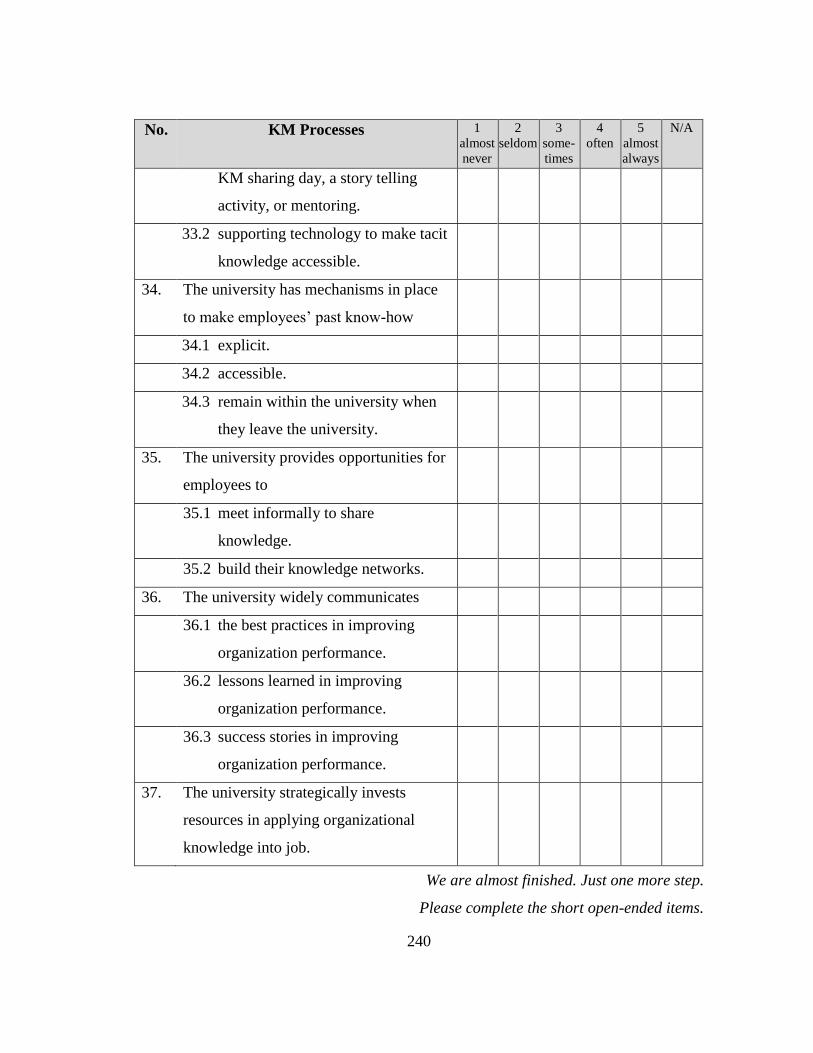
240
No. KM Processes 1
almost
never
2
seldom
3
some-
times
4
often
5
almost
always
N/A
KM sharing day, a story telling
activity, or mentoring.
33.2 supporting technology to make tacit
knowledge accessible.
34. The university has mechanisms in place
to make employees’ past know-how
34.1 explicit.
34.2 accessible.
34.3 remain within the university when
they leave the university.
35. The university provides opportunities for
employees to
35.1 meet informally to share
knowledge.
35.2 build their knowledge networks.
36. The university widely communicates
36.1 the best practices in improving
organization performance.
36.2 lessons learned in improving
organization performance.
36.3 success stories in improving
organization performance.
37. The university strategically invests
resources in applying organizational
knowledge into job.
We are almost finished. Just one more step.
Please complete the short open-ended items.

241
Section 4 Internal Factors for Supporting or Blocking Successful KM
KM refers to a process of handling knowledge that results from individual,
group, and organizational learning to improve organizational performance related to
teaching, research, community services, and university management.
38. Please describe at least three internal factors that significantly support successful
KM in your university and give an example.
39. Please describe at least three internal factors that significantly block successful KM
in your university and give an example.
Thank you so much for filling out this questionnaire. Please fill in the request if you
would like to receive a summary copy of this study.
I request a summary copy of this study.
Email address ……………………………
University name…………………………..
I do not request a summary copy of this study.

242
APPENDIX B
PERMISSION LETTER TO CONDUCT THE STUDY
June 15, 2015
Dear President
I am Suravee Sunalai, a PhD student at Human Resource Development, Texas A&M
University. I am conducting a study entitled “Knowledge Management Systems in Higher
Education Institutions in Thailand: A Holistic Model of Enablers, Processes, and Outcomes” that
is supervised by Professor Michael Beyerlein, PhD. The purpose of this study is to examine how
higher education institutions link KM enablers and processes to quality performance of
institutions. The variables used in this study include KM enablers (i.e., organizational culture,
leadership, technology, and performance measurement), processes, and outcomes represented by
internal quality assurance scores. The unit of analysis is 142 Thai universities. The sources of
data come from electronic questionnaire surveys and archival data from the CHE QA system.
I am writing you to request permission to include your institution in my study. Please
grant me permission to collect data from the knowledge management committee (or quality
assurance committee) of your institution. If you give your permission, please return the enclosed
form to [email protected]. I will also need a contact person at your institution (preferably a
secretary of the committee) in order to assist in distributing my invitation email to the committee
members. The survey will be conducted in July 2015. Upon completion of the study, I will send
you a summary of the research findings and a brief report comparing your institution with other
universities in the aggregate.
Thank you in advance for your consideration and assistance to this study. Please let me
know if you have any questions or concerns. I look forward to hearing from you soon.
Sincerely yours,
Suravee Sunalai
PhD candidate, Texas A&M University

243
APPENDIX C
FORM OF PERMISSION TO CONDUCT THE RESEARCH STUDY
Knowledge Management Systems in Higher Education Institutions in Thailand: A Holistic
Model of Enablers, Processes, and Outcomes
I give permission to Ms. Suravee Sunalai, a PhD student at Texas A&M University to
include the institution in her study and collect data from the institution’s staff members.
I understand that this research is voluntary and all information obtained in this study is
confidential regarding the protocol of Texas A&M University Institutional Review Board
(IRB2015-265D). This study incorporates several procedures to protect the privacy of the
institution and respondents. First, the responses will be confidential and no effort will be made to
link individuals with responses. Second, no record of the participants’ involvement in the study
will be kept indicating their participation by name. Third, all responses received will be stored in
a secured area with access limited to the researcher.
The contact person at the institution assisting in distributing the e-survey to the
institutional knowledge management (KM) committee members (preferable a person who is a
secretary of the committee) is
Name (in English)……………………………….……………………….……………………...….
Name (in Thai)………………………………..……………………………………………….....…
Email………………………………………….…………………………….…….….………..……
Phone number…………………………………... Fax number……………………………….……
Signature …………….…..…………..……….………………….
Name …...……….…...……………………….……..……....
Position …...……...….……………………..………..………….
University …...………………..……………………...………….
Please scan this form and return it to [email protected]

244
APPENDIX D
INVITATION EMAIL TO PARTICIPATE IN THE STUDY
July 1, 2015
Dear Knowledge Management Committee
I am Suravee Sunalai, a PhD student at Human Resource Development, Texas A&M
University. I am conducting a study entitled “Knowledge Management Systems in Higher
Education Institutions in Thailand: A Holistic Model of Enablers, Processes, and Outcomes.”
The purpose of this study is to examine how higher education institutions link Knowledge
Management (KM) enablers and processes to quality performance of institutions.
This research study received permission from your university to collect data from the
KM committee members. Please allow 15-20 minutes to complete this online questionnaire that
contains 48 items by following the link
https://tamucehd.qualtrics.com//SE/?SID=SV_4Jl6cOyMRnQ9nnf (if you complete the survey
through a smart phone or a tablet, please touch your preferable choice of each item and then
touch a >> mark to continue to the next page). If you cannot open the link, please fill in the MS
word file attached below and return it to [email protected] by July 31, 2015.
Since the design of this study concentrates on the organizational level of analysis, while
answering the questionnaire, please rate the KM system for the entire university. Your
participation in this research study is very much appreciated. Your information will reflect the
KM implementation in Thai universities that may help institutions better plan and implement the
KM system in Thai academic institutions. Furthermore, your information will assist in validating
the KM instrument in the Thai context. The instrument used in this study was modified from the
Knowledge Management Assessment Tool (KMAT), initiated by Arthur Andersen Consulting
Services and the American Productivity and Quality Center (APQC). The original KMAT has
been used widely in industries across countries.
Thank you for participating in this survey. Please let me know if you have any questions
or concerns. If you would like a summary copy of this study and the result of your university
benchmarking across universities, please fill in the request form on the last page of the
questionnaire. Sincerely yours,
Suravee Sunalai

245
APPENDIX E
CORRELATION AND COVARIANCE MATRICES OF THE KNOWLEDGE
MANAGEMENT SYSTEM FACTORS
Table 22 Correlation Matrix for Knowledge Management System Analysis
TEC STC CUL LDR KTR KGE SCO
TEC 1.000
STC 0.730* 1.000
CUL 0.676* 0.750* 1.000
LDR 0.788* 0.851* 0.790* 1.000
KTR 0.810* 0.796* 0.732* 0.843* 1.000
KGE 0.795* 0.864* 0.711* 0.903* 0.807* 1.000
SCO 0.072 0.068 0.066 0.073 0.095 0.065 1.000
* p < .01 (Two-tailed)
Table 23 Covariance Matrix for Knowledge Management System Analysis
TEC STC CUL LDR KTR KGE SCO
TEC 0.896*
STC 0.453* 0.430*
CUL 0.433* 0.333* 0.456*
LDR 0.509* 0.381* 0.364* 0.465*
KTR 0.678* 0.461* 0.437* 0.508* 0.782*
KGE 0.586* 0.441* 0.374* 0.480* 0.556* 0.607*
SCO 0.038 0.025 0.025 0.028 0.047 0.029 0.317
* p < .01 (Two-tailed)