kogarah employment lands and economic development strategy
TRANSCRIPT

Kogarah Employment Lands and Economic Development Strategy 1
Kogarah Employment Lands and Economic Development Strategy Final Report Kogarah City Council March 2013
Kogarah Employment Lands and Economic Development Strategy 2
This report has been prepared on behalf of Kogarah City Council. SGS Economics and Planning and its associated consultants are not liable to any person or entity for any damage or loss that has occurred, or may occur, in relation to that person or entity taking or not taking action in respect of any representation, statement, opinion or advice referred to herein. SGS Economics and Planning Pty Ltd ACN 007 437 729 www.sgsep.com.au Offices in Brisbane, Canberra, Hobart, Melbourne, Sydney

Kogarah Employment Lands and Economic Development Strategy 0
TABLE OF CONTENTS
TABLE OF CONTENTS 0 EXECUTIVE SUMMARY 3 1 INTRODUCTION 0 1.1 Study background 0 1.2 Study objectives 0
2 LOCAL PROFILE 1 2.1 Strategy and policy framework 1 2.2 Population profile 1
Estimated Resident Population 1 Population projections 2 Qualifications 2
2.3 Employment and industry profile 3 Labour market 3 Unemployment rate 3 Employment by industry 4 Employment by occupation 5 Local jobs 5 Home based work 6
2.4 Location quotient analysis 9 2.5 Growth share analysis 10 2.6 Employment Self-Containment and Self-Sufficiency 12
Self-containment 12 Self-sufficiency 15
2.7 Market data 17 Sales and median price for commercial and industrial uses 17
2.8 Summary and emerging issues 20 Population 20 Employment and industry profile 20 Market data 21
3 TRENDS AND DRIVERS 22 3.1 Industry trends 22
Retail trends 22 Issues affecting the manufacturing sector 23 Skills in the New Economy 24
3.2 Land use trends 24 Industrial zones 24 Bulky Goods 25 Business Parks 25
3.3 Local drivers 25 Health and Education: Magnet Infrastructure 25 Lifestyle and Desirability 26 Home Based Work 26
3.4 Stakeholder consultation 27

Kogarah Employment Lands and Economic Development Strategy 1
3.5 Economic development 28 What is economic development? 28 What role can local government play in economic development? 29
4 EMPLOYMENT LAND SUPPLY 32 4.1 Audit method 32 4.2 Audited areas 33 4.3 Audit results 34 4.4 Introduction 34
Current floorspace by precinct 34 Penshurst 35 Floorspace by BLC 36 Floorspace by ANZSIC 37 ANZSIC-BLC Matrix 38
4.5 Supply of supermarket floorspace in Kogarah LGA 40
5 DEMAND ANALYSIS 41 5.1 Step 1: Calculating employment growth rates by industry 41 5.2 Step 2: Converting employment projections to floorspace demand 43 5.3 Higher employment scenario 46
6 GAP ANALYSIS 48 6.1 Calculating floorspace capacity 48 6.2 Gap analysis: comparing capacity and demand 49
Base case floorspace demand 49 Higher floorspace demand 50
7 COMPETITOR ASSESSMENT 52 7.1 Hurstville 55 7.2 Rockdale 56 7.3 Other areas 58
Rockdale industrial area 58 Kogarah industrial area (Production Avenue) 58
7.4 Summary 58
8 VIABILITY OF CURRENT PLANNING FRAMEWORK 60 8.1 Suitability of enterprise corridors 60 8.2 Assessment of planning framework and planning recommendations 61 8.3 Economic viability of controls 61 8.4 Method and assumptions 61
Scenario1 62 Scenario 2 62 Scenario 3 63 Scenario 4 63 Scenario 5 64 Scenario 6 64 Cost and revenue assumptions 64
8.5 Results 65 Enterprise corridor 65 South Hurstville 67 Summary 68
8.6 Carparking 69 Background 69

Kogarah Employment Lands and Economic Development Strategy 2
Problems with the Conventional Approach to Parking 69 Alternative parking strategies 70
9 KEY ISSUES AND RECOMMENDATIONS 74 9.1 Review of findings and key issues 74
Economic profile 74 Kogarah’s sectoral findings 75 Kogarah’s employment precincts 76 Other issues 78
9.2 Strategies and actions 79 Strategy 1: Translate zones into Standard Instrument zones 79 Strategy 2: Consider changes to the FSR and carparking controls 80 Strategy 3: Support and expand the medical cluster in the Kogarah Town Centre 81 Strategy 4: Consolidate the role of Kogarah Town Centre as a vibrant, pedestrian friendly retail precinct 82 Strategy 5: Create an Enterprise Corridor zone along the Princes Highway 84 Strategy 6: Protect existing industrial land 84 Strategy 7: Encourage home based businesses 85 Strategy 8: Build relationships and partnerships between key stakeholders and Council 85
10 REFERENCES 87
APPENDIX 1: PRECINCT BY PRECINCT ANALYSIS 88 APPENDIX 2: AUDIT METHOD 117 APPENDIX 3: STRATEGY AND POLICY REVIEW 119 APPENDIX 4: CONSULTATION REPORT 135

Kogarah Employment Lands and Economic Development Strategy 3
EXECUTIVE SUMMARY
Introduction SGS Economics and Planning was commissioned by Kogarah City Council to complete an employment lands study and economic development strategy to inform their new Standard Instrument LEP. A number of analytical tasks were conducted as a part of this study including a policy review, economic profiling, an audit of current employment lands, demand forecasting, stakeholder consultation and feasibility testing. The key findings and recommendations from the study are outlined below.
Economic profile
The following key points were revealed from the economic profiling:
Kogarah LGA experienced relatively strong population growth over the past five years, however, population growth is expected to slow in the LGA to a moderate 0.4 percent up to 2036.
There were a total of 15,800 jobs located in Kogarah as of 2006. Kogarah LGA is specialised in the health and finance sectors with the majority of jobs in ‘Health Care and Social Assistance’ (33.7 percent) and the ‘Financial and Insurance Services’ industry (13.2 percent).
Kogarah LGA is forecast to meet its Subregional employment capacity target: Kogarah LGA’s employment will increase by a total of 5,747 jobs from 2006 to 2031 and 5,588 jobs from 2011 to 2036. The projected employment level by 2031 is above the additional employment capacity target of 4,000 jobs to 2031 indicated for the LGA by the draft South Subregional Strategy.
Employment is driven heavily by several big players including the St George bank, The St George Public and Private Hospitals, St George TAFE, the ATO office in Hurstville and police stations in Hurstville and Kogarah centres. Together these employers comprise approximately 63 percent of total employment in Kogarah LGA.
Employment self-containment and self-sufficiency rates are low: Kogarah LGA has a low self-containment rate of 16.6 percent compared to other LGAs in the St George-Sutherland SSD. More than two-thirds (70.8 percent) of Kogarah’s residents are employed in the surrounding LGAs (Hurstville, Rockdale, Sutherland Shire and Botany Bay) and City of Sydney. The self-sufficiency rate of 23.5 percent in the Kogarah LGA is also lower than the other St George-Sutherland region LGAs.
Compared to other subregions, Kogarah has a lower share of home based workers. The number of home based workers in Kogarah in 2006 represented 2.8 percent of the total employed residents in the LGA. This is slightly lower than the rate in St George-Sutherland SSD (3 percent) and also lower than the average share of 4.2 percent across the Sydney SD.
Growth in employment in Kogarah LGA is likely to be driven by the health (3,205 jobs), public administration (803 jobs) and education (432 jobs)

Kogarah Employment Lands and Economic Development Strategy 4
Market and viability assessment
Kogarah’s employment precincts have capacity to cater for the forecast future growth up to 2036. Even under the low capacity (25 percent of maximum theoretical development potential) and high growth (20 percent above base case) scenario there is capacity in the following precincts:
Allawah
Blakehurst
Carlton IA
Carss Park
Oatley
Ramsgate
Sans Souci
South Hurstville Industrial
South Hurstville Village
There are some precincts that might need to be considered for expansion, with Kogarah Town Centre and Hurstville (Kogarah LGA part) facing the greatest shortage. There is demand for around 21,000 square metres of supermarket and grocery floorspace in the Kogarah LGA. Our land audit found that there is currently 13,472 supermarket and grocery floorspace. Hence, there is an ostensible undersupply of supermarket and grocery floorspace in the Kogarah LGA of around 7,500 square metres. Two to three additional supermarkets, depending on their size, could be supported in the LGA. Kogarah Town Centre is not an important higher-order retail destination. Rather than being a major shopping destination, the Kogarah Town Centre is important as a health and education destination, as well as being a destination for office employment. In terms of office development, most demand is for medical suites and smaller locally-oriented professional tenants, such as accountants and legal firms. There is not a strong market for new office development and Kogarah is not as prominent in the office market as Hurstville centre (Hurstville LGA section). Nevertheless, Kogarah Town Centre is a more attractive proposition for office development than Rockdale centre. The FSR or carparking controls in South Hurstville Village and the potential Princes Highway corridor are currently inhibiting viable development. Our feasibility testing indicated that feasible development cannot be achieved under the current FSR and carparking controls. Consultation indicated that the low FSR limits in the planning controls (Interim DCP No. 2) for South Hurstville Village were discouraging development in this centre. Our feasibility testing indicated that the carparking controls were the most prohibitive control on development; a problem which is not unique to the Kogarah LGA.
Recommendations Local governments often assume the role of promoting economic development. And while governments do not drive economic growth and development (industry does), they can influence the ‘pre-conditions for economic prosperity’. Aside from the obvious levers such as planning controls and development approvals, there are broadly four strategic theme areas in which Council usually facilitate economic development:
Managing a coordinated approach
Supporting a conducive business/people environment
Facilitating local investment, business & employment growth
Attracting / facilitating new investment With these strategic themes in mind, and based on the weight of evidence from both quantitative and qualitative sources, the following strategies and actions have been formulated to generate the pre-conditions for economic prosperity:
Strategy 1: Translate zones into Standard Instrument zones
Strategy 2: Consider changes to the FSR and carparking controls
Action 2.1: Consider higher FSR controls for the potential enterprise corridor and South Hurstville Village
Action 2.2: Council should give consideration to reviewing the current car parking controls
Strategy 3: Support and expand the medical cluster in the Kogarah Town Centre
Action 3.1: Facilitate expansion of medical related activities via rezoning additional land to SP1 or SP2in the block surrounded by Short and Chapel Street to the south of the hospital

Kogarah Employment Lands and Economic Development Strategy 8
Action 3.2: Facilitate expansion of medical related activities by encouraging higher density these uses development in and around the hospital to the north of the hospitals in the block surrounded by South, Hogben and Montgomery Streets
Action 3.3: Earmark other sites for future medical uses
Strategy 4: Consolidate the role of Kogarah Town Centre as a vibrant, pedestrian friendly retail precinct
Action 4.1: Council to encourage transition of sites for major redevelopment
Action 4.2: Continue to improve safety in Kogarah Town Centre
Action 4.3: Improve legibility in the KTC by providing clear and direct connections through the CBD. It is recommended that this encompass development of a signage strategy.
Strategy 5: Create an Enterprise Corridor zone along the Princes Highway
Action 5.1: Create a B6 Enterprise Corridor zone on part of the Princes Highway
Strategy 6: Protect existing industrial land
Action 6.1: Ensure there are complying uses in IN2 the industrial zones, but also allow for flexibility
Strategy 7: Encourage home based businesses
Action 7.1: Ensure planning controls allow for Home Based Work and Home Based Business
Action 7.2: Facilitate the establishment of a network of Home Based Businesses
Strategy 8: Build relationships and partnerships between key stakeholders and Council
Action 8.1: Consult with relevant business stakeholders when developing plans
Action 8.2: Actively engage with the business community

Kogarah Employment Lands and Economic Development Strategy 0
1 INTRODUCTION
1.1 Study background
The Kogarah LGA is currently in the process of creating a Standard Instrument LEP. As a part of the plan making process the Council have received Planning Reform Funding (PRF) from the Department of Planning and Infrastructure (DP&I) to review their employment based lands, as part of the LEP Acceleration Program. This study will inform planning changes in the new LEP.
1.2 Study objectives
The broad aim of the Economic Development and Employment Lands Strategy is to provide the framework to help realise the community’s vision as outlined in Bright Future, Better Lifestyle: Kogarah 2020 for "a thriving and prosperous City". The specific objectives for this project are:
To review the roles and hierarchy of existing employment areas within the Kogarah LGA and where appropriate make recommendations for changes.
To review existing zones along the major transport corridors (Princes Highway, King Georges Road, Rocky Point Road) and identify areas that may be suitable for future employment based land
To identify the medium-term (approximately 20 years) demand for employment land growth within the Kogarah Town Centre, so as to meet the defined employment capacity targets as set by the draft South Subregional Strategy
Identify current employment trends (such as the influence of home businesses and technological change) and identify opportunities for appropriate employment development.
To provide guidance for the preparation of new development controls (with an emphasis on economic viability) within the Kogarah Town Centre (referred to as Kogarah Major Centre in the draft South Subregional Strategy)
To identify strategies to promote economic growth within the City, in particular options to support growth of small to medium enterprises.
This will enable the Kogarah LGA and other stakeholders to:
Identify the strategic context, key trends and constraints affecting economic development and employment land supply in the Kogarah LGA; and
Encourage local skill development and local employment; and
Identify, foster and support new enterprises and home based businesses to build local employment;
Proactively develop stronger partnerships between business and Council to promote and facilitate economic development in the City; and
Develop strategies to promote economic growth and identify potential future employment lands, particularly around the existing Kogarah Town Centre; and
Facilitate strategic and integrated decision making in the development of Council's LEP and other plans. The study area is the Kogarah Local Government Area. Consideration of the sub-regional context will be important when preparing the Strategy.

Kogarah Employment Lands and Economic Development Strategy 1
2 LOCAL PROFILE
To provide a comprehensive picture of the local economy in relation to the rest of the subregion and Sydney, and to help inform targeted directions for sustainable growth, it is necessary to consider the economic profile of Kogarah and the linkages and interactions between industries and areas.
2.1 Strategy and policy framework
The planning strategies, policies and plans applying to the Kogarah LGA have been assessed and can be found in Appendix 3. The strategic metropolitan and regional plans applying to Kogarah LGA have been assessed for their pertinence to local industries and particular areas in Kogarah. The following strategies were assessed:
Metropolitan Plan for Sydney 2036
Draft South Subregional Strategy
Kogarah Economic Development Strategy Southern Sydney Regional Profile
St George Economic and Employment Strategy, and
Development near Rail Corridors and Busy Roads – Interim Guideline. The following Development Control Plans (DCPs) applying to built-form in commercial and industrial areas in Kogarah have also been analysed:
Kogarah Town Centre Development Control Plan No.5
Commercial and Industrial Lands Development Control Plan
Development Control Plan No. 2 – Interim Commercial and Industrial Development Plan, and
Ramsgate Centre DCP. The DCPs have been assessed with a focus on their economic viability. High level feasibility testing was undertaken using generic controls (derived from the Kogarah City Council DCPs), site details and price structures. While the feasibility model captures a broad picture of viability, it is not definitive. Determining the viability of controls as a whole is difficult as there are numerous variables that are subject to change based on location, developer's cost structure (e.g. equity/loan ratio, factors of production, prevailing interest rates, vertical or horizontal integration, overheads, etc.) and revenue structure (e.g. operate, sell, lease or combination). Furthermore, the specificity of the controls in Kogarah LGA made it very difficult to determine whether they are, as a whole, unviable without completing detailed site specific tests. Therefore, consultation has been used to supplement the quantitative analysis.
2.2 Population profile
Estimated Resident Population
The resident population of the Kogarah LGA at June 2011 was estimated to be 59,999 persons, which is an increase of 902 persons from June 2010. This represents a 1.5 percent growth rate over the year to June 2011. The Kogarah LGA also recorded the highest annual population growth of all LGAs comprising the St George-Sutherland Statistical Subdivision (SSD), ahead of Hurstville (0.9 percent), Rockdale (0.4 percent) and Sutherland Shire (0.2 percent). The Kogarah LGA has experienced a population increase of 5,089 persons, over the past five years, at an average annual growth rate of 1.8 percent (Figure 1). As a comparison, this was higher than the average annual population growth for both the Sydney Region (1.6 percent) and New South Wales (1.4 percent) over the same period. As a proportion of the Sydney Region the Kogarah LGA’s population was 1.3 percent in 2011. It also recorded the highest average annual growth over the period 2006-11 of all LGAs constituting the St George- Sutherland SSD, ahead of Rockdale (1.4 percent), Hurstville (1.3 percent) and Sutherland Shire (0.8 percent) (Lawrence Consulting, 2012, p. 3).

Kogarah Employment Lands and Economic Development Strategy 2
FIG URE 1. ESTIM ATE D RESI DENTI A L P OPUL ATIO N
Source: Lawrence Consulting, 2012.
Population projections
By 2036 the Kogarah LGA is expected to grow by an additional 6,116 persons to reach a total population of approximately 66,115 persons; an average annual growth rate of 0.4 percent (Figure 2). This rate is less than half of the predicted growth rate for the Sydney Region (1.0 percent) and New South Wales (0.9 percent) (Lawrence Consulting, 2012, p. 4).
FIG URE 2. PROJECTE D PO PUL AT IO N , KOGARAH LG A
Source: ABS 3218.0, 2010; NSW Department of Planning and Infrastructure, 2012; Lawrence Consulting, 2012.
Qualifications
In the Kogarah LGA in 2006, 58.8 percent of persons aged 15 years and over had gained some form of qualification (Figure 3). This figure was slightly higher than the averages for the Sydney Region (57.3 percent) and New South Wales (54.4 percent). The most common form of qualification was a bachelor degree, which comprised 27.6 percent of those persons who had gained a qualification. The Kogarah LGA contained a higher percentage of bachelor degree holders than there were in the Sydney Region (25.5 percent) and the State (22.2 percent) as a whole (Lawrence Consulting, 2012, p. 10).

Kogarah Employment Lands and Economic Development Strategy 3
FIG URE 3. QUAL IF IC ATIO NS – P OPUL AT IO N 1 5 YEARS & OVER , 2006
Source: ABS, 2006.
2.3 Employment and industry profile
Labour market
The number of employed persons in the Kogarah LGA was estimated to be 30,451 in the December Quarter 2011; an increase of 5,687 since 2006 (Figure 4). This was an annual increase of 964 persons, or 3.3 percent, from the December Quarter 2010 (Lawrence Consulting, 2012, p. 17).
FIG URE 4. ANNUAL EMPLOYMENT G R OWT H
Source: DEEWR, Lawrence Consulting, 2012.
Unemployment rate
The number of unemployed persons in Kogarah LGA is 1,592 (December Quarter 2011) with an overall unemployment rate of 5.0 percent; representing a 0.9 percent fall from 2010 (Figure 5). The unemployment rate in is slightly lower than the averages for the Sydney Region (5.1 percent), New South Wales (5.2 percent) and Australia (5.1 percent) (Lawrence Consulting, 2012, pp. 17,18).

Kogarah Employment Lands and Economic Development Strategy 4
FIG URE 5. UNEMPLOYME NT R ATE
Source: Lawrence Consulting, 2012.
Employment by industry
The number of employed residents in the Kogarah LGA was approximately 24,764 persons in 2006 (Figure 6). ‘Retail Trade’ represented the largest share of employment in the Kogarah LGA, accounting for 10.5 percent of total resident employment, followed by ‘Health Care & Social Assistance’ (10.3 percent), ‘Professional, Scientific & Technical Services’ (8.7 percent) and ‘Manufacturing’ (8.4 percent) (Lawrence Consulting, 2012, pp. 22,23).
FIG URE 6. EMPLOYMENT BY I NDU ST RY, 20 06
Source: ABS,2006.
The number of employed residents in the Kogarah LGA increased by 1,610 between 2001 and 2006 (Figure 7). The largest proportional increase was in the ‘Health Care & Social Assistance’ sector, which was up 1.3 percentage points. ‘Retail Trade’ and ‘Financial & Insurance Services’ were the next fastest growing industries, increasing by 0.8 and 0.6 percentage points, respectively (Lawrence Consulting, 2012, p. 23).

Kogarah Employment Lands and Economic Development Strategy 5
FIG URE 7. EMPLOYMENT BY I ND U ST RY - C H ANGE I N EMPLOYM ENT SH ARE 200 1 -2 00 6
Source: ABS,2006.
Employment by occupation
‘Professionals’ were the occupation group most represented in the Kogarah LGA in 2006, accounting for 24.5 percent of total employment (Figure 8). This was followed by ‘Clerical & Administrative Workers’ (18.3 percent) and ‘Managers’ (13.3 percent). In 2006, the Kogarah LGA had a proportionately larger occupational share of ‘Professionals’, ‘Clerical & Administrative Workers’ and ‘Sales Workers’ than both the Sydney Region and New South Wales. Between 2001 and 2006, the largest proportional increase in employment was recorded by the occupation of ‘Professionals’ (up 1.2 percentage points), followed by ‘Community & Personal Service Workers’ (up 0.9 percentage points) and ‘Labourers’ (up 0.4 percentage points) (Lawrence Consulting, 2012, pp. 24,25).
FIG URE 8. EMPLOYMENT BY OCCUPATIO N, 20 06
Source: ABS, 2006.
Local jobs
There were a total of 15,800 jobs located in Kogarah LGA as of 2006 (Table 1). Consultation indicated that the St George Bank had signed up to another ten year lease and is not planning to change its operations in the short to medium term. There was also indication that the St George Public Hospital was planning expansion and that it would continue to grow in future years. The police stations in Hurstville and Kogarah should be expected to grow in line with population growth. The same could be surmised for the St George TAFE, although there is the very real possibility that the trend towards online education might diminish the importance of bricks and mortar. The ATO building in Hurstville is a strategic employer (i.e. not providing services to the local population) and its future is unknown. The majority of these were in the ‘Health Care and Social Assistance’ (33.7 percent). The ‘Financial and Insurance Services’ industry was also a significant local employer (13.2 percent), as were – albeit to a lesser extent – the ‘Public Administration and Safety’ (7.9 percent) and ‘Education and Training’ (7.8 percent) industries.

Kogarah Employment Lands and Economic Development Strategy 6
There are several big players in Kogarah that drive employment in these sectors including the St George bank, The St George Public and Private Hospitals, St George TAFE, the ATO office in Hurstville and police stations in Hurstville and Kogarah centres. Together these employers comprise approximately 63 percent of total employment in Kogarah LGA. This suggests there is a lack of employment diversity in the LGA. Lack of employment diversity is not bad per se, but it does mean that Kogarah is more exposed to changes from single employers.
TABLE 1 . JOBS LOCATED I N KOG A RAH
Industry of employment No. of jobs % of jobs
Health Care and Social Assistance 5,332 33.7% Financial and Insurance Services 2,082 13.2% Public Administration and Safety 1,252 7.9% Education and Training 1,227 7.8% Accommodation and Food Services 905 5.7% Professional, Scientific and Technical Services 874 5.5% Retail Trade 864 5.5% Construction 621 3.9% Other Services 469 3.0% Manufacturing 441 2.8% Electricity, Gas, Water and Waste Services 327 2.1% Wholesale Trade 306 1.9% Transport, Postal and Warehousing 286 1.8% Rental, Hiring and Real Estate Services 268 1.7% Administrative and Support Services 240 1.5% Arts and Recreation Services 142 0.9% Inadequately described 73 0.5% Information Media and Telecommunications 58 0.4% Not Stated 21 0.1% Agriculture, Forestry and Fishing 12 0.1% Total 15,800 100.0%
Source: BTS, 2009.
Home based work
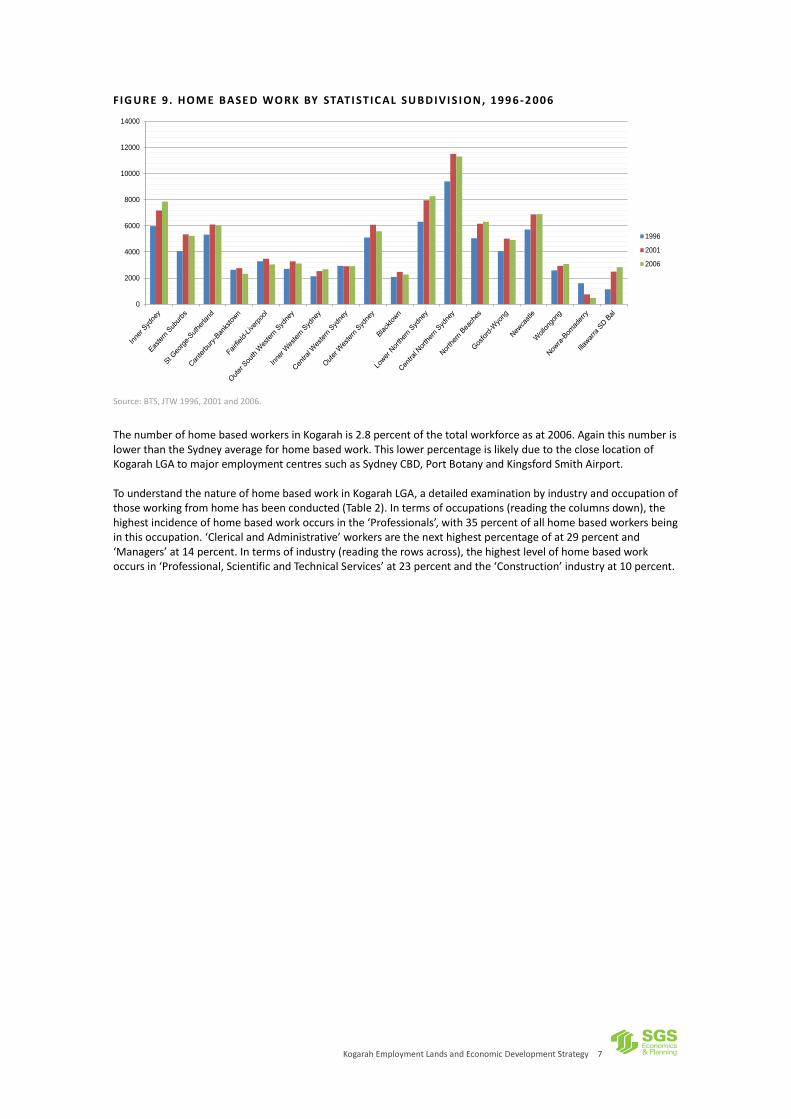
To analyse the structure of employees working from home, the Bureau of Transport Statistics (BTS) Journey to Work (JTW) dataset has been used. An important point to note is that the data on ‘home based work’ does not distinguish between those that have a home based business or those that work from home occasionally, but who have an office located elsewhere. In 2006, around 6,026 residents in the St George-Sutherland Statistical Subdivision (SSD) worked from home, representing an increase of 704 people or 13 percent from 1996 (Figure 9). The number of home-based workers in the St George SSD represents approximately 3 percent of total jobs in the SSD, which is lower than the average share of 4.2 percent across the Sydney SD.
Kogarah Employment Lands and Economic Development Strategy 7
FIG URE 9. HOME BASE D WORK BY STATI STIC AL SU BD IVI S I ON, 199 6 -2 006
Source: BTS, JTW 1996, 2001 and 2006.
The number of home based workers in Kogarah is 2.8 percent of the total workforce as at 2006. Again this number is lower than the Sydney average for home based work. This lower percentage is likely due to the close location of Kogarah LGA to major employment centres such as Sydney CBD, Port Botany and Kingsford Smith Airport. To understand the nature of home based work in Kogarah LGA, a detailed examination by industry and occupation of those working from home has been conducted (Table 2). In terms of occupations (reading the columns down), the highest incidence of home based work occurs in the ‘Professionals’, with 35 percent of all home based workers being in this occupation. ‘Clerical and Administrative’ workers are the next highest percentage of at 29 percent and ‘Managers’ at 14 percent. In terms of industry (reading the rows across), the highest level of home based work occurs in ‘Professional, Scientific and Technical Services’ at 23 percent and the ‘Construction’ industry at 10 percent.
0
2000
4000
6000
8000
10000
12000
14000
1996
2001
2006

Kogarah Employment Lands and Economic Development Strategy 8
TABLE 2 . HOME BASE D WO RK I N KO GAR AH BY I ND U STRY T YPE AND OCCUPATIO N, 20 06
Managers Professionals Technicians and Trades Workers
Community and Personal Service Workers
Clerical and Administrative Workers
Sales Workers
Machinery Operators And Drivers
Labourers Others Total
Agriculture, Forestry and Fishing 0.0% 0.0% 0.0% 0.0% 0.0% 0.0% 0.0% 0.0% 0.0% 0.0%
Mining 0.0% 0.0% 0.0% 0.0% 0.0% 0.0% 0.0% 0.0% 0.0% 0.0%
Manufacturing 1.4% 0.7% 1.3% 0.0% 1.6% 0.0% 0.0% 0.0% 0.0% 5.0%
Electricity, Gas, Water and Waste Services 0.0% 0.0% 0.0% 0.0% 0.0% 0.0% 0.0% 0.0% 0.0% 0.0%
Construction 0.7% 0.4% 1.0% 0.4% 5.7% 0.0% 0.0% 0.7% 0.7% 9.8%
Wholesale Trade 3.3% 1.0% 0.0% 0.0% 1.6% 2.0% 0.0% 0.0% 0.0% 7.9%
Retail Trade 1.9% 1.7% 0.0% 0.4% 1.4% 1.6% 0.0% 0.0% 0.0% 7.0%
Accommodation and Food Services 0.6% 0.0% 0.7% 0.0% 0.0% 0.0% 0.0% 0.0% 0.0% 1.3%
Transport, Postal and Warehousing 1.1% 0.4% 0.0% 0.0% 2.0% 0.0% 0.4% 0.0% 0.4% 4.4%
Information Media and Telecommunications 0.0% 0.6% 0.7% 0.0% 0.7% 0.0% 0.0% 0.0% 0.0% 2.0%
Financial and Insurance Services 0.7% 3.9% 0.0% 0.0% 2.2% 0.6% 0.0% 0.0% 0.0% 7.3%
Rental, Hiring and Real Estate Services 0.0% 1.1% 0.0% 0.0% 1.6% 0.4% 0.0% 0.4% 0.4% 4.0%
Professional, Scientific and Technical Services 1.9% 14.1% 2.0% 0.0% 4.9% 0.0% 0.0% 0.0% 0.0% 22.8%
Administrative and Support Services 1.7% 0.4% 0.0% 0.0% 1.4% 0.0% 0.0% 0.6% 0.6% 4.7%
Public Administration and Safety 0.0% 0.4% 0.0% 0.0% 0.6% 0.0% 0.0% 0.0% 0.0% 1.0%
Education and Training 0.4% 4.6% 0.0% 0.0% 0.0% 0.0% 0.0% 0.0% 0.0% 5.0%
Health Care and Social Assistance 0.4% 2.6% 0.0% 2.2% 3.3% 0.0% 0.0% 0.0% 0.0% 8.5%
Arts and Recreation Services 0.0% 0.7% 0.0% 0.0% 0.4% 0.0% 0.0% 0.0% 0.0% 1.1%
Other Services 0.0% 1.9% 0.6% 0.0% 0.6% 0.0% 0.0% 1.1% 1.1% 5.3%
Inadequately descry bed 0.0% 0.6% 0.0% 0.0% 1.3% 0.0% 0.4% 0.0% 0.4% 2.7%
Total 14.2% 35.2% 6.3% 3.0% 29.3% 4.6% 0.9% 2.9% 3.7% - Source: ABS, 2006.

Kogarah Employment Lands and Economic Development Strategy 9
2.4 Location quotient analysis
A Location Quotient (LQ) is calculated by dividing the proportion of local jobs within a particular industry by the proportion of jobs within that industry in a benchmark area. The purpose of an LQ is to determine the degree of specialisation of industries within a chosen area – in this case the Kogarah LGA. If the proportion of jobs in a local industry is higher than that of the benchmark area, the industry will show a location quotient of greater than one. This may indicate that the local industry is relatively strong with local specialisation, and suggests that the industry is ‘export focused’, possibly serving markets outside just the local area. Table 3 below shows the Location Quotients for one digit ANZSIC industries in Kogarah, which constitute at least 1 percent of total employment in the LGA. The LQ analysis using the 1 digit ANZSIC codes shows that relative to Sydney SD and St George-Sutherland region, the Kogarah LGA has particular strengths in ‘Financial and Insurance services’ as well as the ‘Health Care and Social Assistance’ sector. Both industries have high LQs and industry shares, especially the ‘Health Care and Social Assistance’ sector as it accounts for 34 percent of employment within the Kogarah LGA. The St George bank headquarters and the St George Public and Private Hospitals and Calvary Hospital account for the significance of these industries. Although the ‘Electricity, Gas, Waste and Water Services’ industry exhibits a very high specialisation within the Kogarah LGA, its share of total employment within the area is very low at only two percent. The high specialisation of this industry is due to the location of the Ausgrid maintenance headquarters in Oatley.
TABLE 3 . LOCAT ION QUOTIE NT BY O NE DIGI T ANZ SIC IND U STRY
Industry (with shares greater than 1%) LQ relative to Sydney SD
LQ relative to St George-Sutherland region
Share of total employment in Kogarah LGA
Manufacturing 0.28 0.28 3%
Electricity, Gas, Water and Waste Services 2.38 4.72 2%
Construction 0.75 0.59 4%
Wholesale Trade 0.33 0.40 2%
Retail Trade 0.50 0.34 5%
Accommodation and Food Services 0.93 0.74 6%
Transport, Postal and Warehousing 0.34 0.33 2%
Financial and Insurance Services 1.91 3.86 13%
Rental, Hiring and Real Estate Services 0.87 0.77 2%
Professional, Scientific and Technical Services 0.59 0.84 6%
Administrative and Support Services 0.48 0.54 2%
Public Administration and Safety 1.34 1.35 8%
Education and Training 1.02 0.93 8%
Health Care and Social Assistance 3.27 3.13 34%
Other Services 0.78 0.60 3% Source: ABS, 2006.
An LQ analysis has also been conducted using the much more detailed four digit ANZSIC codes (Table 4). The LQ analysis suggests that the Kogarah LGA has particular strengths in the ‘Electricity Distribution’ sector relative to the St George-Sutherland region, exhibiting a very high LQ of 63.23. Again, this is due to the location of Ausgrid maintenance headquarters in Oatley although it does only account for two percent of employment within the Kogarah LGA. We also see a similar pattern here as was established with the LQ analysis with one digit ANZSIC codes in that the ‘Banking’ and ‘Hospitals’ sector both have relatively high LQs as well as accounting for a large share of employment within the Kogarah LGA.

Kogarah Employment Lands and Economic Development Strategy 10
TABLE 4 . LOCAT ION QUOTIE NT BY FOUR D IGIT ANZS IC I N DU ST RY
Industry (with shares greater than 1%) LQ relative to Sydney SD
LQ relative to St George-Sutherland region
Share of total employment in Kogarah LGA
Electricity Distribution 6.64 63.23 2%
House Construction 1.07 0.86 1%
Supermarket and Grocery Stores 0.58 0.37 1%
Cafes and Restaurants 0.83 0.70 1%
Takeaway Food Services 0.93 0.57 1%
Clubs (Hospitality) 2.04 1.38 2%
Banking 5.39 13.21 12%
Real Estate Services 1.18 0.89 1%
Legal Services 0.69 1.43 1%
Accounting Services 1.04 1.06 1%
Central Government Administration 3.93 2.06 3%
Police Services 3.27 3.40 2%
Primary Education 1.35 0.88 2%
Secondary Education 1.39 0.98 2%
Hospitals (except Psychiatric Hospitals) 6.15 10.98 21%
General Practice Medical Services 2.74 2.04 2%
Specialist Medical Services 5.90 8.67 2%
Pathology and Diagnostic Imaging Services 4.66 7.59 2%
Aged Care Residential Services 1.06 0.66 1% Source: ABS, 2006.
The location quotient analysis will serve as a filter to identify industries of comparative strength for additional consideration and analysis. Successful economic development strategies are focused on building and nurturing local businesses with the capacity to generate ‘export income’ for the local region. In broad terms, the above analysis reveals that Kogarah LGA is specialised in ‘Banking’, and the health sector including ‘Hospitals’, ’Specialist Medical Services’ and ‘Pathology and Diagnostic Imaging Services’.
2.5 Growth share analysis
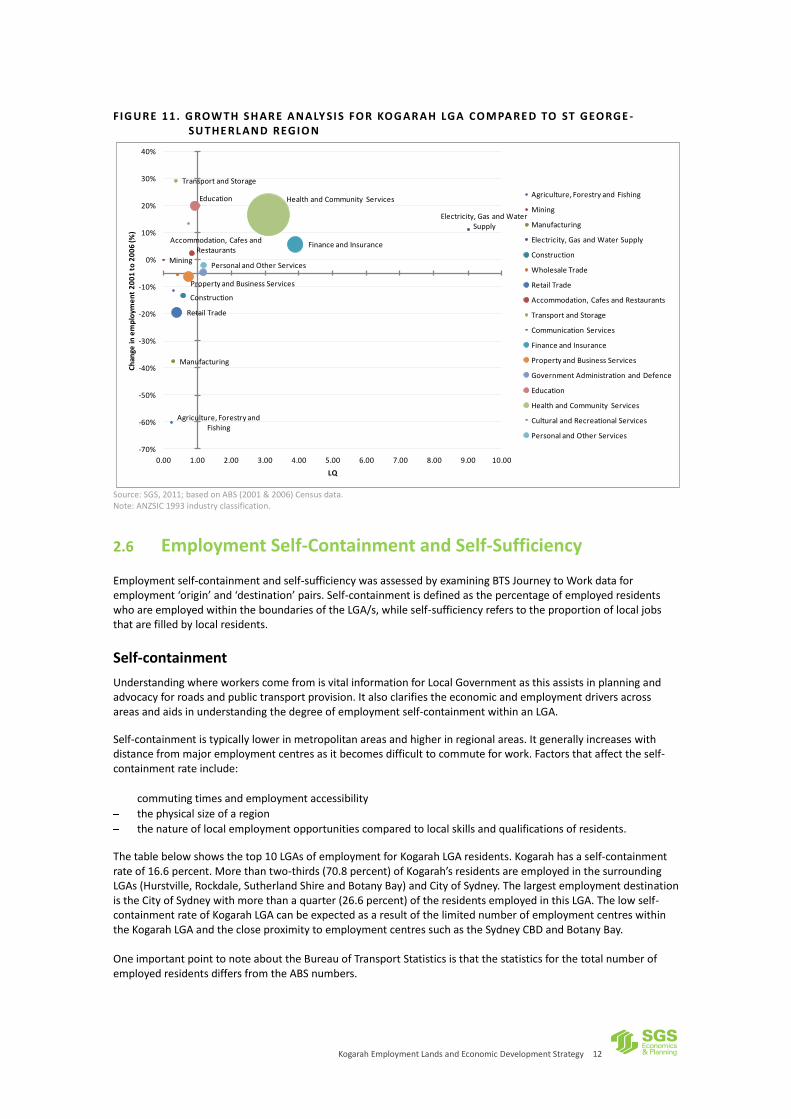
Building on the LQ analysis, a growth-share analysis involves an assessment of not only the relative size and specialisation of key industries, or industry clusters, but also their recent change (growth or decline) relative to the change in employment in a benchmark area. Progression can be understood and assessed by comparing the recent relative change against the benchmark, specialisation and size of key industries. Analysing industries or clusters in this way assists in the understanding of appropriate policies to guide their further growth and development, or to prioritise actions for economic development facilitation across various industry sectors. Figure 10 and Figure 11 below show the growth share analysis diagram for Kogarah LGA compared to Sydney SD and St George-Sutherland region, respectively. The LQ (degree of specialisation) is shown on the horizontal axis, while the change (growth or decline) in employment from 2001 to 2006 is shown on the vertical axis. The size of the circle marker represents the relative size of the industry within the LGA. The north-eastern quadrant shows specialised industries experiencing growth in employment, while the north-western quadrant shows employment growth and low specialisation. The bottom half of the diagram shows industries experiencing a decline in employment with the south-eastern quadrant indicating high specialisation and the south-western quadrant indicating low specialisation. Whereas the Location Quotient in Section 2.4 uses 2006 ANZSIC codes, the growth share analysis has been conducted using the older 1993 ANZSIC codes. The 2006 classification was not available for this dataset. Due to the difference in the two codes, there are some discrepancies between the LQs in Section 2.4 and those in this section. Less than half of the ANZSIC industries in the Kogarah LGA achieved some level of specialisation compared to both benchmark areas: Sydney SD and the St George-Sutherland region. The Kogarah LGA (compared to both Sydney SD and St George-Sutherland region) is specialised in the ‘Health and Community Service’ sector as well as ‘Finance and Insurance Services’, with the ‘Health and Community Services’

Kogarah Employment Lands and Economic Development Strategy 11
sector experiencing growth of almost 17 percent over the period 2001 to 2006. Compared to the Sydney SD, the ‘Health and Community Services’ sector has a much higher LQ than when compared to the St George-Sutherland region. This suggests that the local health services sector is relatively strong within the St George-Sutherland region. Other fast growing industries in Kogarah include ‘Transport and Storage’ and ‘Education’, as well as ‘Cultural and Recreational Services’. However, in relative terms, the LGA is currently not specialised in these industries given their smaller industry shares. Considering their recent growth, it is conceivable that there may be room for further growth and improved specialisation in these industries. Appropriate policy settings could potentially increase specialisation in the context of continued employment growth. There are a large number of industries, both specialised and non-specialised, that contracted from 2001 to 2006. These included ‘Manufacturing’, ‘Retail Trade’, ‘Construction’ and ‘Agriculture, Forestry and Fishing’. As a caveat, it should be noted that a growth share analysis at an LGA-level can be prone to misrepresentations and skewing. This is because at a local level – and hence dealing with small numbers – the introduction or departure of single employers can have a marked influence on the apparent growth and decline of any industry.
FIG URE 10. G ROW TH SH AR E ANALY SI S FOR KOG AR AH LGA COMPARE D TO SY D NEY S D
Source: SGS, 2011; based on ABS (2001 & 2006) Census data. Note: ANZSIC 1993 industry classification.
Agriculture, Forestry and Fishing
Mining
Manufacturing
Electricity, Gas and Water Supply
Construction
Retail Trade
Accommodation, Cafes and Restaurants
Transport and Storage
Communication Services
Finance and Insurance
Government Administration and Defence
Education
Health and Community Services
Cultural and Recreational Services
Personal and Other Services
-70%
-60%
-50%
-40%
-30%
-20%
-10%
0%
10%
20%
30%
40%
0.00 0.50 1.00 1.50 2.00 2.50 3.00 3.50
Ch
ange
in e
mp
loym
en
t 2
00
1 t
o 2
00
6 (%
)
LQ
Agriculture, Forestry and Fishing
Mining
Manufacturing
Electricity, Gas and Water Supply
Construction
Wholesale Trade
Retail Trade
Accommodation, Cafes and Restaurants
Transport and Storage
Communication Services
Finance and Insurance
Property and Business Services
Government Administration and Defence
Education
Health and Community Services
Cultural and Recreational Services
Personal and Other Services
Kogarah Employment Lands and Economic Development Strategy 12
FIG URE 11. G ROW TH SH AR E ANALY SI S FOR KOG AR AH LGA COMPARE D TO ST GEORGE -SU THE RL AND REGIO N
Source: SGS, 2011; based on ABS (2001 & 2006) Census data. Note: ANZSIC 1993 industry classification.
2.6 Employment Self-Containment and Self-Sufficiency
Employment self-containment and self-sufficiency was assessed by examining BTS Journey to Work data for employment ‘origin’ and ‘destination’ pairs. Self-containment is defined as the percentage of employed residents who are employed within the boundaries of the LGA/s, while self-sufficiency refers to the proportion of local jobs that are filled by local residents.
Self-containment
Understanding where workers come from is vital information for Local Government as this assists in planning and advocacy for roads and public transport provision. It also clarifies the economic and employment drivers across areas and aids in understanding the degree of employment self-containment within an LGA.
Self-containment is typically lower in metropolitan areas and higher in regional areas. It generally increases with distance from major employment centres as it becomes difficult to commute for work. Factors that affect the self-containment rate include:
commuting times and employment accessibility
the physical size of a region
the nature of local employment opportunities compared to local skills and qualifications of residents.
The table below shows the top 10 LGAs of employment for Kogarah LGA residents. Kogarah has a self-containment rate of 16.6 percent. More than two-thirds (70.8 percent) of Kogarah’s residents are employed in the surrounding LGAs (Hurstville, Rockdale, Sutherland Shire and Botany Bay) and City of Sydney. The largest employment destination is the City of Sydney with more than a quarter (26.6 percent) of the residents employed in this LGA. The low self-containment rate of Kogarah LGA can be expected as a result of the limited number of employment centres within the Kogarah LGA and the close proximity to employment centres such as the Sydney CBD and Botany Bay. One important point to note about the Bureau of Transport Statistics is that the statistics for the total number of employed residents differs from the ABS numbers.
Agriculture, Forestry and Fishing
Mining
Manufacturing
Electricity, Gas and Water Supply
Construction
Retail Trade
Accommodation, Cafes and Restaurants
Transport and Storage
Finance and Insurance
Property and Business Services
Education Health and Community Services
Personal and Other Services
-70%
-60%
-50%
-40%
-30%
-20%
-10%
0%
10%
20%
30%
40%
0.00 1.00 2.00 3.00 4.00 5.00 6.00 7.00 8.00 9.00 10.00
Ch
ange
in e
mp
loym
en
t 2
00
1 t
o 2
00
6 (%
)
LQ
Agriculture, Forestry and Fishing
Mining
Manufacturing
Electricity, Gas and Water Supply
Construction
Wholesale Trade
Retail Trade
Accommodation, Cafes and Restaurants
Transport and Storage
Communication Services
Finance and Insurance
Property and Business Services
Government Administration and Defence
Education
Health and Community Services
Cultural and Recreational Services
Personal and Other Services
Kogarah Employment Lands and Economic Development Strategy 13
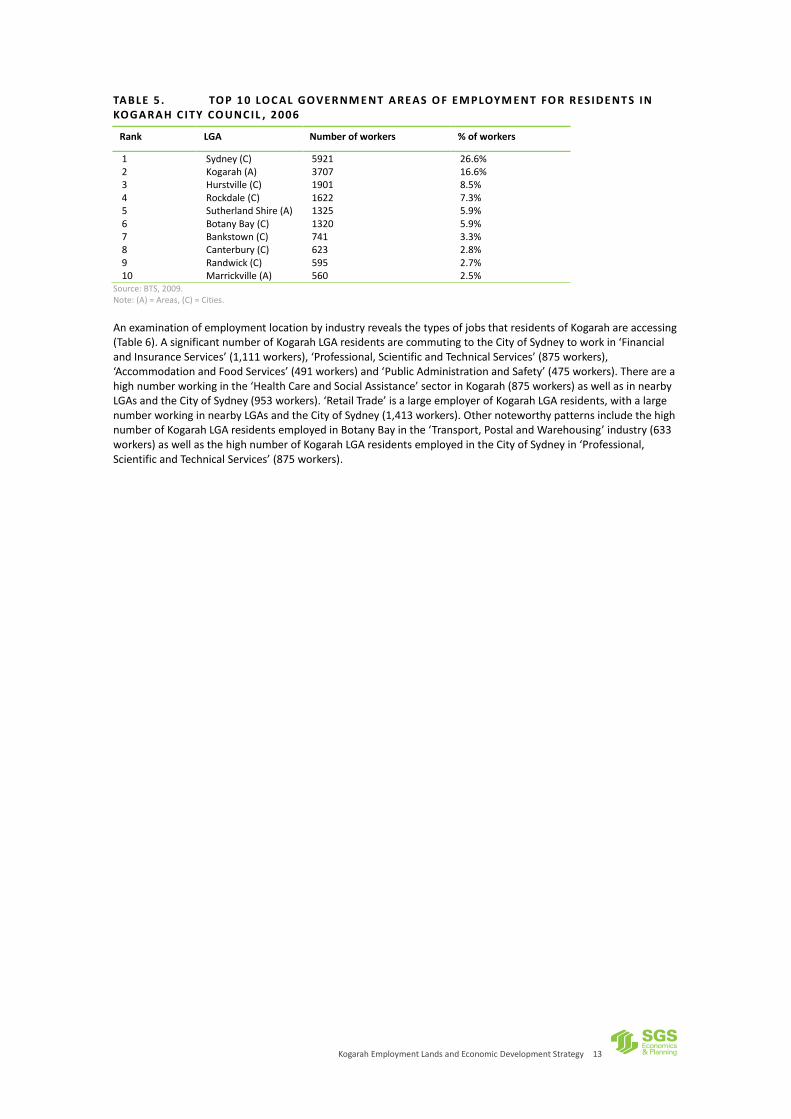
TABLE 5 . TOP 1 0 LOC AL GOVER NM E NT AREAS O F EMPLOYM ENT FO R R ES IDE NT S IN KOGARAH C ITY CO UNC IL , 2006
Rank LGA Number of workers % of workers
1 Sydney (C) 5921 26.6% 2 Kogarah (A) 3707 16.6% 3 Hurstville (C) 1901 8.5% 4 Rockdale (C) 1622 7.3% 5 Sutherland Shire (A) 1325 5.9% 6 Botany Bay (C) 1320 5.9% 7 Bankstown (C) 741 3.3% 8 Canterbury (C) 623 2.8% 9 Randwick (C) 595 2.7% 10 Marrickville (A) 560 2.5%
Source: BTS, 2009. Note: (A) = Areas, (C) = Cities.
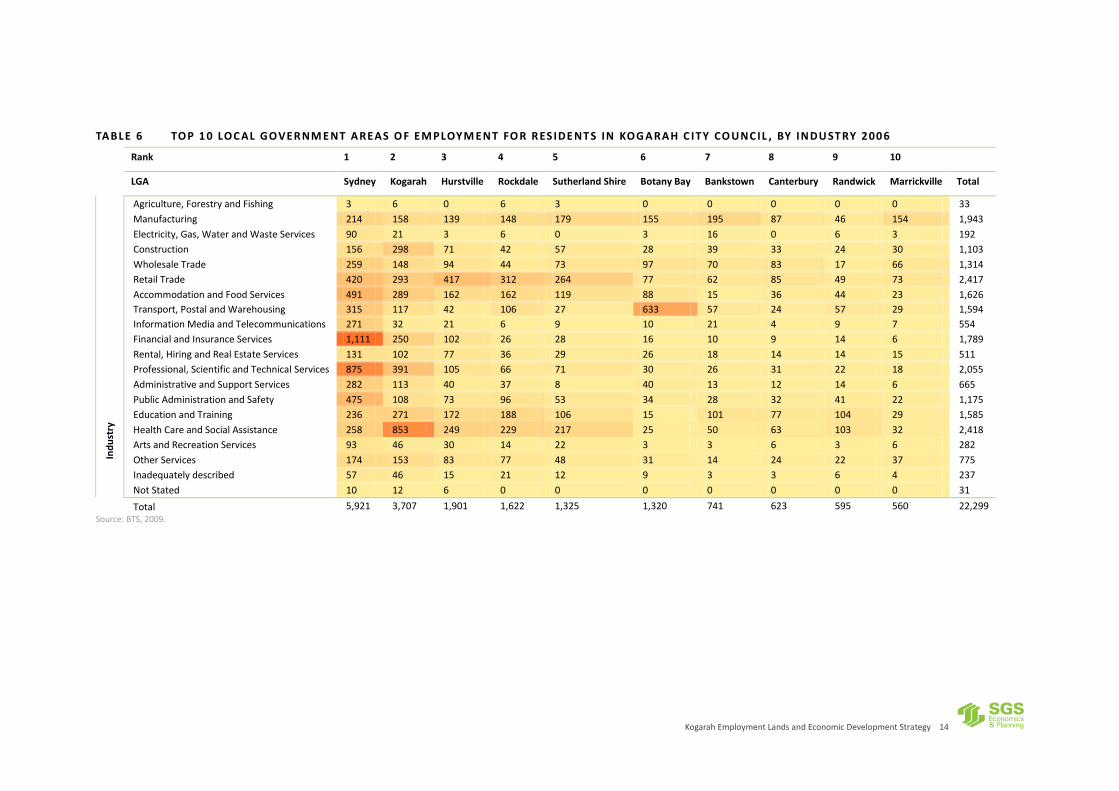
An examination of employment location by industry reveals the types of jobs that residents of Kogarah are accessing (Table 6). A significant number of Kogarah LGA residents are commuting to the City of Sydney to work in ‘Financial and Insurance Services’ (1,111 workers), ‘Professional, Scientific and Technical Services’ (875 workers), ‘Accommodation and Food Services’ (491 workers) and ‘Public Administration and Safety’ (475 workers). There are a high number working in the ‘Health Care and Social Assistance’ sector in Kogarah (875 workers) as well as in nearby LGAs and the City of Sydney (953 workers). ‘Retail Trade’ is a large employer of Kogarah LGA residents, with a large number working in nearby LGAs and the City of Sydney (1,413 workers). Other noteworthy patterns include the high number of Kogarah LGA residents employed in Botany Bay in the ‘Transport, Postal and Warehousing’ industry (633 workers) as well as the high number of Kogarah LGA residents employed in the City of Sydney in ‘Professional, Scientific and Technical Services’ (875 workers).
Kogarah Employment Lands and Economic Development Strategy 14
TABLE 6 TOP 1 0 LOC AL GOVER NM E NT AREAS O F EMPLOYM ENT FO R R ES IDE NT S IN KOG ARAH C ITY CO UNC IL , BY INDU ST RY 200 6
Rank 1 2 3 4 5 6 7 8 9 10
LGA Sydney Kogarah Hurstville Rockdale Sutherland Shire Botany Bay Bankstown Canterbury Randwick Marrickville Total
In
du
stry
Agriculture, Forestry and Fishing 3 6 0 6 3 0 0 0 0 0 33
Manufacturing 214 158 139 148 179 155 195 87 46 154 1,943
Electricity, Gas, Water and Waste Services 90 21 3 6 0 3 16 0 6 3 192
Construction 156 298 71 42 57 28 39 33 24 30 1,103
Wholesale Trade 259 148 94 44 73 97 70 83 17 66 1,314
Retail Trade 420 293 417 312 264 77 62 85 49 73 2,417
Accommodation and Food Services 491 289 162 162 119 88 15 36 44 23 1,626
Transport, Postal and Warehousing 315 117 42 106 27 633 57 24 57 29 1,594
Information Media and Telecommunications 271 32 21 6 9 10 21 4 9 7 554
Financial and Insurance Services 1,111 250 102 26 28 16 10 9 14 6 1,789
Rental, Hiring and Real Estate Services 131 102 77 36 29 26 18 14 14 15 511
Professional, Scientific and Technical Services 875 391 105 66 71 30 26 31 22 18 2,055
Administrative and Support Services 282 113 40 37 8 40 13 12 14 6 665
Public Administration and Safety 475 108 73 96 53 34 28 32 41 22 1,175
Education and Training 236 271 172 188 106 15 101 77 104 29 1,585
Health Care and Social Assistance 258 853 249 229 217 25 50 63 103 32 2,418
Arts and Recreation Services 93 46 30 14 22 3 3 6 3 6 282
Other Services 174 153 83 77 48 31 14 24 22 37 775
Inadequately described 57 46 15 21 12 9 3 3 6 4 237
Not Stated 10 12 6 0 0 0 0 0 0 0 31
Total 5,921 3,707 1,901 1,622 1,325 1,320 741 623 595 560 22,299
Source: BTS, 2009.

Kogarah Employment Lands and Economic Development Strategy 15
Overall, Kogarah LGA has a relatively low level of self-containment rate of 16.6 percent. Compared to other LGAs in the St George-Sutherland region it has the second lowest rate of employment self-containment; that is residents who live and work within the same LGA (Table 7). The high self-containment rate in the Sutherland Shire can be expected, given the trend of an increasing self-containment rate relative to distance from major employment centres. However, the higher self-containment rate of the neighbouring LGA Hurstville indicates that close physical distance to major employment destinations of the Sydney CBD and Port Botany aren’t the strongest determinants of the low self-containment rate in Kogarah. Instead, the disparity in the self-containment numbers appears to indicate that there are fewer opportunities for local employment in Kogarah or there is a mismatch between the type of local employment and local skills.
TABLE 7 . SEL F-CO NTAI NMENT R ATE OF ST GEO RGE - SU THE RL AND REGI ON LGAs
LGA Self-containment rate
Kogarah (A) 16.6%
Sutherland Shire (A) 42.1%
Rockdale (C) 15.0%
Hurstville (C) 19.7% Source: BTS, 2009.
Self-sufficiency
There is a 23.5 percent self-sufficiency rate in the Kogarah LGA (Table 8). That is, 23.5 percent of the local jobs are actually filled by those living in the area. There are a higher percentage of jobs filled by residents from the Sutherland Shire. To some extent this can be explained by the much larger population of the Sutherland Shire (around 220,000).
TABLE 8 . TOP 1 0 LOC AL GOVER NM E NT AREAS O F R ES IDE N CE FOR WO RKE RS I N KO GAR AH CITY COU NCI L , 20 06
Rank Local Government Area Number Percent (%)
1 Sutherland Shire (A) 3,942 24.9
2 Kogarah (A) 3,707 23.5
3 Rockdale (C) 1,769 11.2
4 Hurstville (C) 1,605 10.2
5 Bankstown (C) 659 4.2
6 Canterbury (C) 554 3.5
7 Wollongong (C) 422 2.7
8 Liverpool (C) 315 2.0
9 Randwick (C) 288 1.8
10 Sydney (C) 276 1.7
Source: BTS, 2009. Note: (A) = Areas, (C) = Cities.
Of those Kogarah LGA residents that are working within the Kogarah LGA, 23 percent are employed in ‘Health Care and Social Assistance’, 11 percent are employed in ‘Professional, Scientific and Technical Services’ while eight percent are employed in ‘Construction’, ‘Retail Trade’ and ‘Accommodation and Food Services’, respectively (Table 9). Interestingly, despite ‘Financial and Insurance Services’ being the second largest employer (with 13.2 percent of local jobs), only 6.7 percent of locals working in Kogarah are employed in this industry.

Kogarah Employment Lands and Economic Development Strategy 16
TABLE 9 . INDU STRY O F EMPLOYME NT, KOG AR AH LGA RESI DE NT S BY KOG AR AH JO BS
Industry of employment Number of employed residents
% of employed residents
Health Care and Social Assistance 853 23.0% Professional, Scientific and Technical Services 391 10.5% Construction 298 8.0% Retail Trade 293 7.9% Accommodation and Food Services 289 7.8% Education and Training 271 7.3% Financial and Insurance Services 250 6.7% Manufacturing 158 4.3% Other Services 153 4.1% Wholesale Trade 148 4.0% Transport, Postal and Warehousing 117 3.2% Administrative and Support Services 113 3.0% Public Administration and Safety 108 2.9% Rental, Hiring and Real Estate Services 102 2.8% Arts and Recreation Services 46 1.2% Inadequately described 46 1.2% Information Media and Telecommunications 32 0.9% Electricity, Gas, Water and Waste Services 21 0.6% Not Stated 12 0.3% Agriculture, Forestry and Fishing 6 0.2% Total 3,707 100%
Source: BTS, 2009.
Kogarah has the lowest self-sufficiency rate out of the entire St George-Sutherland region LGAs (Table 10). The low self-sufficiency rate probably indicates a mismatch between locally available jobs and the skills of the local labour force.
TABLE 1 0. SEL F- SU FF IC IE NCY R ATE O F ST GEO RGE - SU THE RL AND REG IO N LGAS
LGA Self-sufficiency rate
Kogarah (A) 23.5%
Sutherland Shire (A) 75.0%
Rockdale (C) 28.3%
Hurstville (C) 29.9% Source: BTS, 2009. Note: (A) = Areas, (C) = Cities.
Employment self-sufficiency and self-containment by industry The following table displays the self-sufficiency and self-containment at an industry level across the Kogarah LGA. It can be observed that different industries have different levels of employment self-sufficiency and self-containment. The local industries with the highest number of locally employed residents (self-sufficiency) are ‘Information Media and Telecommunications’ (55 percent) ‘Agriculture, Forestry and Fishing’ (50 percent). Although, the majority of those employed in these industries still worked outside of the LGA. Those industries that had a high number of workers employed locally as a percentage of workers in that industry (self-containment) included ‘Health Care and Social Assistance’ (35 percent) and ‘Construction’ (27 percent).

Kogarah Employment Lands and Economic Development Strategy 17
TABLE 1 1. EMPLOYMENT SEL F - SU FFIC IENCY AND SEL F -CO NTAI NMENT BY I ND U STRY
Industry
No. of employed residents
No. of local jobs
No. of locally employed
local residents
Self-sufficiency
Self-containment
Agriculture, Forestry and Fishing 33 12 6 50% 18% Manufacturing 1,943 441 158 36% 8% Electricity, Gas, Water and Waste Services 192 327 21 6% 11% Construction 1,103 621 298 48% 27% Wholesale Trade 1,314 306 148 48% 11% Retail Trade 2,417 864 293 34% 12% Accommodation and Food Services 1,626 905 289 32% 18% Transport, Postal and Warehousing 1,594 286 117 41% 7% Information Media and Telecommunications 554 58 32 55% 6% Financial and Insurance Services 1,789 2,082 250 12% 14% Rental, Hiring and Real Estate Services 511 268 102 38% 20% Professional, Scientific and Technical Services 2,055 874 391 45% 19% Administrative and Support Services 665 240 113 47% 17% Public Administration and Safety 1,175 1,252 108 9% 9% Education and Training 1,585 1,227 271 22% 17% Health Care and Social Assistance 2,418 5,332 853 16% 35% Arts and Recreation Services 282 142 46 32% 16% Other Services 775 469 153 33% 20% Inadequately described 237 73 46 63% 19% Not Stated 31 21 12 57% 39%
Total 22,299 15,800 3,707 23.5% 16.6%
Source: BTS, 2009.
2.7 Market data
Sales and median price for commercial and industrial uses
The median sales prices and number of sales in the Kogarah LGA have been assessed for the period 2001 to 2012. The sales data falls under four broad categories:
general commercial: includes Torrens title commercial and retail type buildings
commercial strata: includes strata title commercial and retail type buildings
general industrial: includes Torrens title industrial type buildings
industrial strata: includes strata title industrial type buildings Median sales prices for all of the recorded land use types have fluctuated over the last decade. However, it is important to note as a caveat that the number of sales for all categories is low and so the statistical sample is probably too small to be reliable to a high degree of confidence. According to consultation with agents, the number of sales are low as the properties are owned by ‘mum and dad’ investors with a long-term view, rather than speculative institutional investors with a short-term view. Nevertheless, the data does provide some interesting insights into the commercial and industrial sales markets in Kogarah. The general commercial category can be characterised as Torrens title street-front commercial and retail properties. General commercial prices have remained relatively stable (between $850,000 and $950,000) since a peak in 2009 (Figure 12). There appears to be variability in the median sales price and number of sales over the past decade. Again, the data must be qualified as the number of sales are so few that the trend can be easily skewed by the location and condition of the buildings on the market (i.e. a preponderance of new buildings in premium locations sold in one year could masquerade as an increasing price trend).

Kogarah Employment Lands and Economic Development Strategy 18
FIG URE 12. GENER AL COMME RCI AL
Source: RP Data, 2012. Note: 2012 data only records up to July.
Again the median price and number of sales for commercial strata units fluctuated over the study period. Median prices reached a peak of almost $700,000 in 2006 and have stayed between $500,000 and $600,000 over the past five years (Figure 13). The number of sales have fluctuated and reached a high in 2010.
FIG URE 13. COMMERC IAL ST R ATA UN I T
Source: RP Data, 2012. Note: 2012 data only records up to July.
2001 2002 2003 2004 2005 2006 2007 2008 2009 2010 2011 2012
Sales 16 19 15 6 8 14 25 10 14 15 24 8
Median price 370 650 1,167 1,385 768 595 680 715 1,880 865 948 926
0
5
10
15
20
25
30
-
200
400
600
800
1,000
1,200
1,400
1,600
1,800
2,000
Nu
mb
er
of
sale
s
Me
dia
n p
rice
($'0
00)
2001 2002 2003 2004 2005 2006 2007 2008 2009 2010 2011 2012
Number of Sales 37 31 10 13 24 28 26 24 35 57 31 8
Median price 357.05 660 546.5 400 299.99 698.5 512.5 496 616 544.5 425 491.15
0
10
20
30
40
50
60
0
100
200
300
400
500
600
700
800
Nu
mb
er
of
sale
s
Me
dia
n p
rice
($'0
00)

Kogarah Employment Lands and Economic Development Strategy 19
The number of sales for general industrial and industrial strata buildings over the past decade has been very low and so any statistical analysis is unreliable. This can be expected given that there is only one major industrial area in the LGA.
FIG URE 14. GENER AL INDU STR I AL
Source: RP Data, 2012. Note: 2012 data only records up to July.
FIG URE 15. INDU STRI AL ST R ATA U N IT
Source: RP Data, 2012. Note: 2012 data only records up to July.
2001 2002 2003 2004 2005 2006 2007 2008 2009 2010 2011 2012
Sales 5 2 6 5 2 5 5 4 1 2 3 3
Median price 567 2,938 1,490 850 2,580 1,029 775 950 846 904 1,095 1,420
0
1
2
3
4
5
6
7
-
500
1,000
1,500
2,000
2,500
3,000
3,500
Nu
mb
er
of
sale
s
Me
dia
n p
rice
($'0
00)
2005 2006 2007 2008 2009 2010 2011 2012
Sales 1 1 0 2 0 3 2 2
Median price 385 710 0 960 0 533.5 634.15 542.5
0
1
2
3
4
0
200
400
600
800
1000
1200
Me
dia
n p
rice
($'0
00)
Kogarah Employment Lands and Economic Development Strategy 20
2.8 Summary and emerging issues
Population
The Kogarah LGA experienced relatively strong population growth, with an average annual growth rate of 1.8 percent per annum over the past five years. Although the rate of growth is expected to decline to a moderate 0.4 percent up to 2036. The resident population of the Kogarah LGA at June 2011 was estimated to be 59,999 persons; an increase of 5,089 persons since 2006. Kogarah LGA residents are well educated with higher levels of all types of qualification, including bachelor degrees than Sydney or NSW.
Employment and industry profile
Employed residents The number of employed persons in the Kogarah LGA was estimated to be 30,451 in the December Quarter 2011. The number of unemployed persons totalled 1,592, representing an unemployment rate of five percent; which was slightly lower than the rate for the Sydney Region (5.1 percent) and New South Wales (5.2 percent). Amongst employed residents, ‘Retail Trade’ represented the largest share of employment, with it accounting for 10.5 percent of total resident employment, followed by ‘Health Care & Social Assistance’ (10.3 percent), ‘Professional, Scientific & Technical Services’ (8.7 percent) and ‘Manufacturing’ (8.4 percent). In the Kogarah LGA in 2006, ‘Professionals’ was the most represented occupation group, accounting for 24.5 percent of total employment, followed by Clerical & Administrative Workers (18.3 percent) and Managers (13.3 percent). Local jobs There were a total of 15,800 jobs located in Kogarah as of 2006. The majority of these were in the ‘Health Care and Social Assistance’ (33.7 percent), with the ‘Financial and Insurance Services’ industry also a significant local employer (13.2 percent). At a one digit ANZSIC level, the Kogarah LGA has particular specialisation in the ‘Financial and Insurance services’ as well as the ‘Health Care and Social Assistance’ sector. At a four digit ANZSIC level, the Kogarah LGA has particular strengths in ‘Banking’, ‘Electricity Distribution’ and the health sector including ‘Hospitals’, ’Specialist Medical Services’ and ‘Pathology and Diagnostic Imaging Services’. Home based work The number of home based workers in Kogarah in 2006 was 705, which represented 2.8 percent of the total employed residents in the LGA. This is slightly lower than the rate in St George-Sutherland SSD (3 percent) and also lower than the average share of 4.2 percent across the Sydney SD. The highest incidence of home based work occurs in the ‘Professionals’ occupation, with 35 percent of all home based workers being in this occupation. ‘Clerical and Administrative’ workers are the next highest at 29 percent and ‘Managers’ at 14 percent. In terms of industry, the highest level of home based work occurs in ‘Professional, Scientific and Technical Services’ at 23 percent followed by the ‘Construction’ industry at 10 percent. Employment self-containment Kogarah has a self-containment rate of 16.6 percent, which is quite low compared to other LGAs in the St George-Sutherland SSD. More than two-thirds (70.8 percent) of Kogarah’s residents are employed in the surrounding LGAs (Hurstville, Rockdale, Sutherland Shire and Botany Bay) and City of Sydney. This indicates that there are fewer opportunities for local employment in Kogarah or that there is a mismatch between the type of local employment and local skills. Employment self-sufficiency There is a 23.5 percent self-sufficiency rate in the Kogarah LGA. There are, in fact, more residents from the Sutherland Shire employed in Kogarah. Of those Kogarah LGA residents that are working within Kogarah LGA, 23

Kogarah Employment Lands and Economic Development Strategy 21
percent are employed in ‘Health Care and Social Assistance’, 11 percent are employed in ‘Professional, Scientific and Technical Services’ while eight percent are employed in ‘Construction’, ‘Retail Trade’ and ‘Accommodation and Food Services’, respectively.
Market data
Median sales prices for all of the recorded land use types have fluctuated over the last decade. General commercial prices have remained relatively stable (between $850,000 and $950,000) since a peak in 2009. Median prices for commercial strata reached a peak of almost $700,000 in 2006 and have stayed between $500,000 and $600,000 over the past five years. The number of sales for general industrial and industrial strata have been too low to provide any statistically reliable trend.

Kogarah Employment Lands and Economic Development Strategy 22
3 TRENDS AND DRIVERS
This task explores the range of trends and drivers influencing industry and changing employment land user profiles. An understanding of industry and land use trends as well as broader and local drivers of employment is essential in the development of an employment strategy and economic development actions. Industry trends and land use trends have been identified as well as a number of local drivers that might affect employment development in Kogarah. Lastly, the concept of economic development and local government’s role in facilitating economic development are explored.
3.1 Industry trends
Retail trends
Perhaps more than any other industry, the retail sector has been experiencing shifts over the past couple of decades including the expansion and predominance of regional and super-regional centres with entertainment functions, numerous full-line supermarkets and department and discount-department stores. Some of the more discerning trends have included:
the shift towards longer trading hours, especially weekend trading
increasing predominance of bulky goods centres located away from traditional centres
the changing character and function of centres – ethnic, ‘eat-streets’, cafe precincts, fresh food centres, etc. The rise in larger big-box shopping centres and the increase in retailing hours have fundamentally changed the ‘where’ and ‘when’ of consumer shopping habits with demand drifting towards the weekend and the diminishing importance of smaller neighbourhood, local and convenience centres around train stations and some main streets (Wood, 2012). This problem is accentuated when carparking in traditional centres is difficult to obtain relative to enclosed shopping centres. Online shopping in Australia is becoming more prominent. The increasing penetration of the internet into everyday lives, first via PCs and more recently via mobile phones and tablets, has propelled the growth of this industry. The Productivity Commission’s recent report Economic Structure and Performance of the Australian Retail Industry (Productivity Commission, 2011, p. 73) suggested that domestic and overseas online sales accounted for six per cent of total retail spending in Australia in 2010. Although this only represents a small portion of total retail sales, growth in retail spending has been exponential (Figure 16). Comparatively, online sales in the United Kingdom account for between five and eight percent share of retail sales, while in the United States they account for between nine and 11 percent.

Kogarah Employment Lands and Economic Development Strategy 23
FIG URE 16. VALUE O F INTER NET CO M MERCE I N AU STR ALI A , 2 00 3-04 TO 200 9 -1 0
Source: Productivity Commission, 2011.
The majority of online retail sales in Australia are in the categories such as books, music, DVDs, clothing, sporting goods, electrical and electronic goods and cosmetics. Hence, stores that sell these goods are most vulnerable to the increased market penetration of online retailing. It has been estimated that over half of the retail industry in Australia could be regarded as trade exposed, but smaller and non-perishable items are more likely to be purchased online from overseas (Productivity Commission, 2011, p. 73). Forrester Research estimates that annual growth in total online retail sales will be between 10 and 12 per cent in the three years to 2013 (Forrester Research, 2011). Macquarie Equities Research (Macquarie Equities Research, 2011) predict much stronger growth in 2013, up to 17 per cent. The extent to which retailing in Kogarah LGA will be affected depends on the number of retailers that are exposed to competition from online sales.
Issues affecting the manufacturing sector
There are significant issues currently affecting the Australian manufacturing sector which are likely to intensify over the coming years. The main sources of concern amongst manufacturers include:
high Australian dollar
competition from low cost countries
insufficient domestic market growth
inability to secure skilled staff
insufficient labour flexibility, and
inability to keep pace with regulations. The high Australian dollar has contributed to the ‘hollowing out’ of manufacturing. The Manufacturing industry struggles to remain competitive with imports and in export markets (BIS Shrapnel, 2012, p. 137). Consistent with previous trends, the NSW manufacturing sector is expected to experience a substantial reduction in overall employment. About 83,000 manufacturing jobs are projected to be shed over the next decade, an average annual decline of around 3.1 percent (Access Economics, August 2010, p. 21). While the Manufacturing industry as a whole has underperformed in recent years, there has been a sharp contrast in the fortunes of individual sub-sectors. ‘Metal Products and Non-Metallic Products’ manufacturing is expected to perform relatively strongly and will be boosted by a recovery in construction over the period and rising global demand for metals (BIS Shrapnel, 2012). Other sectors of manufacturing that will perform well are those that have a high value added component and those that require a relatively high level of skill. The carbon price will directly affect the largest 500 industries in Australia and have an indirect impact on industries that have high electricity requirements. The proposed carbon tax will have only a moderate impact on the Manufacturing industry initially, mainly because of significant assistance packages provided to industry to boost energy efficiency and lower emissions and because of the generous free permits (94.5 percent of emissions) for emissions-intensive trade-exposed sectors (e.g. steel, aluminium, cement, pulp and paper) and lower levels of free
Kogarah Employment Lands and Economic Development Strategy 24
permits for less trade-exposed sectors (Australian Government, 2012). Over the medium term, however, the carbon price would impact on manufacturing (particularly low value) and electricity generating industries.
Skills in the New Economy
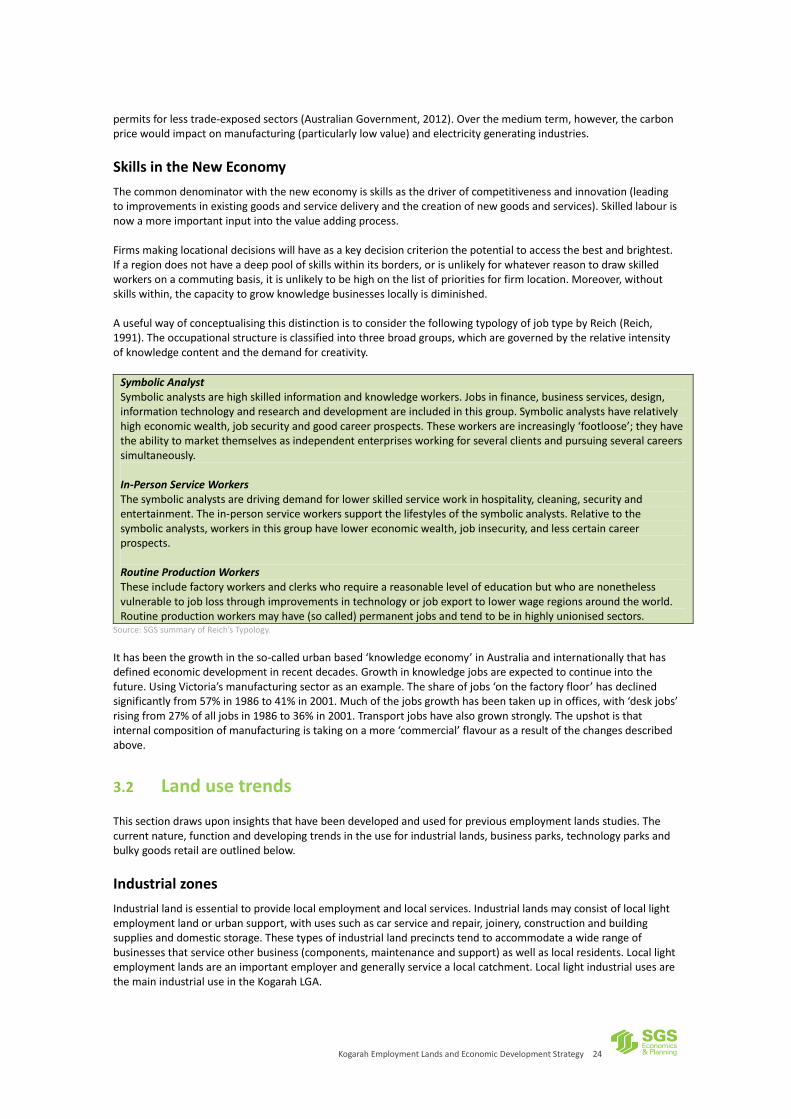
The common denominator with the new economy is skills as the driver of competitiveness and innovation (leading to improvements in existing goods and service delivery and the creation of new goods and services). Skilled labour is now a more important input into the value adding process. Firms making locational decisions will have as a key decision criterion the potential to access the best and brightest. If a region does not have a deep pool of skills within its borders, or is unlikely for whatever reason to draw skilled workers on a commuting basis, it is unlikely to be high on the list of priorities for firm location. Moreover, without skills within, the capacity to grow knowledge businesses locally is diminished. A useful way of conceptualising this distinction is to consider the following typology of job type by Reich (Reich, 1991). The occupational structure is classified into three broad groups, which are governed by the relative intensity of knowledge content and the demand for creativity.
Symbolic Analyst Symbolic analysts are high skilled information and knowledge workers. Jobs in finance, business services, design, information technology and research and development are included in this group. Symbolic analysts have relatively high economic wealth, job security and good career prospects. These workers are increasingly ‘footloose’; they have the ability to market themselves as independent enterprises working for several clients and pursuing several careers simultaneously. In-Person Service Workers The symbolic analysts are driving demand for lower skilled service work in hospitality, cleaning, security and entertainment. The in-person service workers support the lifestyles of the symbolic analysts. Relative to the symbolic analysts, workers in this group have lower economic wealth, job insecurity, and less certain career prospects. Routine Production Workers These include factory workers and clerks who require a reasonable level of education but who are nonetheless vulnerable to job loss through improvements in technology or job export to lower wage regions around the world. Routine production workers may have (so called) permanent jobs and tend to be in highly unionised sectors.
Source: SGS summary of Reich’s Typology.
It has been the growth in the so-called urban based ‘knowledge economy’ in Australia and internationally that has defined economic development in recent decades. Growth in knowledge jobs are expected to continue into the future. Using Victoria’s manufacturing sector as an example. The share of jobs ‘on the factory floor’ has declined significantly from 57% in 1986 to 41% in 2001. Much of the jobs growth has been taken up in offices, with ‘desk jobs’ rising from 27% of all jobs in 1986 to 36% in 2001. Transport jobs have also grown strongly. The upshot is that internal composition of manufacturing is taking on a more ‘commercial’ flavour as a result of the changes described above.
3.2 Land use trends
This section draws upon insights that have been developed and used for previous employment lands studies. The current nature, function and developing trends in the use for industrial lands, business parks, technology parks and bulky goods retail are outlined below.
Industrial zones
Industrial land is essential to provide local employment and local services. Industrial lands may consist of local light employment land or urban support, with uses such as car service and repair, joinery, construction and building supplies and domestic storage. These types of industrial land precincts tend to accommodate a wide range of businesses that service other business (components, maintenance and support) as well as local residents. Local light employment lands are an important employer and generally service a local catchment. Local light industrial uses are the main industrial use in the Kogarah LGA.

Kogarah Employment Lands and Economic Development Strategy 25
Alternatively industrial lands may accommodate heavy manufacturing or large scale production activity such as collieries or power stations. This is likely to be characterised by high noise emission, emission stacks, use of heavy machinery and frequency of large trucks. It is also necessary to recognise the importance of urban services. Concrete batching, waste recycling and transfer, construction and local and state government depots, sewerage, water supply and electricity construction yards constitute urban services. These typically have noise dust and traffic implications and need to be isolated or buffered from other land uses. However, urban service locations are required within each region, or locally (for example concrete batching must be located within a certain travel time of construction sites).
Bulky Goods
From a strategic land use perspective, Bulky Goods Retail should be located in or adjacent to centres to support the existing retail hierarchy and minimise trip generation. The NSW Government’s Right Place for Business and Service Policy document (Department of Urban Affairs and Planning, 2001)
clearly prescribes that when it is not realistic for
bulky goods outlets to be in centres, they should be located in one or two regional clusters and existing clusters should be reinforced. This reduces trip generation, adds to customer choice and can improve the ‘pulling power’ of these businesses. As such, having defined bulky goods precincts benefits both businesses and customers. The delivery of stock and the collection of bulky goods by customers requires sites with good road access. Main road locations provide both access and exposure. Sites with exposure to high traffic volumes are desired by bulky goods retailers because they enable business promotion. Locations on major arterial roads are preferred. In some locations across Sydney, bulky goods retailing is moving into industrial areas. This has significant implications. Bulky goods retailing within industrial precincts can place upwards pressure on rents, potentially forcing industrial land uses to relocate to cheaper areas. Additionally, industrial land users often prefer to be located in an area which has an ‘industrial image’, and for some it is important to maintain a sense of ‘address’ for existing businesses in industrial areas. Further, increased traffic volumes stemming from RBG customers might affect access to and from industrial operations in the same area. The location of retailers in out of centre locations has the potential to undermine nearby centres.
Business Parks
Across Sydney, several business parks have been developed over the last 10 to 20 years. Successful examples of businesses parks in Sydney are Norwest and Macquarie Park. The success of a business park location is reliant on numerous factors. The site needs to offer ‘good business park fundamentals’ including high quality external environment, high quality internal environment, motorway access, multi-modal access and services, proximity to skills and supply chains, high quality digital connectivity and other infrastructure serving the site and a variety of on-site support services and facilities. Important features and key lessons learnt from national and international case studies are outlined below. Many technology parks also offer co-location or proximity to university activities. However, a range of different business park forms are evolving. A successful peri-metropolitan example is the Wollongong Innovation Campus, which is being developed by the university with seed funding provided by state government. A range of factors have contributed to the success of Norwest as a prime business location. These can be summarised as:
Single ownership structure, allowing for targeted and restricted access for operators and industries that were allowed to locate on the site.
Location and labour force skills –offers access to a large, appropriately skilled labour force;
Access – the park is strategically located close to a network of major arterial roads, providing access to the greater metropolitan region of Sydney and the Sydney CBD.
Relatively low property prices – the result of low levels of speculative purchases due to a high proportion of owner-occupiers, as well as commercial only zoning.
3.3 Local drivers
Health and Education: Magnet Infrastructure
Magnet infrastructure is infrastructure that attracts activities to a location. In the South Subregional Strategy, it is said to be infrastructure enabling a centre to distinguish itself from other centres by becoming a Specialised Centre.

Kogarah Employment Lands and Economic Development Strategy 26
Magnet infrastructure is concerned with the transformation of centres to enable them to attain their economic and social potential. It attracts other industries that feed off benefits from clustering with magnet infrastructure. The importance of clustering industries is uncontested as it has many positives to those businesses clustering and provides convenience for those using the services. The St George Public Hospital in the Kogarah Town Centre functions as a magnet infrastructure, serving 250,000 residents of the St George area and also being the nearest provider of specialist medical services for around 200,000 residents of the Sutherland Shire. Each year the hospital admits more than 50,000 patients (including day only) and provides outpatient treatments for over 770,000 people. It employs more than 2500 staff (full-time equivalents) and is one of the largest hospitals in Sydney (SESIAHS, 2010).
Lifestyle and Desirability
Kogarah is located within the St George-Sutherland region of Sydney, with the Kogarah Town Centre being approximately 14 kilometres south of Sydney City. The LGA is a desirable region in terms of liveability that is well connected to the Sydney CBD via rail – being between a 20 to 30 minute train trip – and is located near the major employment areas surrounding Botany Bay and the airport. Kogarah contains local primary schools, high schools, St George TAFE and has a significant frontage to the Georges River and is close to Botany Bay. These local attributes, along with the close proximity to the Sydney CBD and other employment areas, make Kogarah an attractive place to live. Indeed, the ease of access to numerous job opportunities in the Sydney CBD and other areas contribute to the LGAs low employment self-containment rate. This presents a potential challenge for the Kogarah City Council, who have to balance keeping Kogarah a desirable place to live, while focusing on how best to use the existing land to generate employment. The main problems in terms of attracting and or generating employment appears to be the prima facie lack of capacity in existing employment areas, very few sites available for employment development and the strong push towards residential development from developers.
Home Based Work
Definition Home-based businesses are amongst the fastest growing industries annually, with an increasing number of people entering the marketplace. In Australia, approximately 50% of business owners are occupied in home-based businesses, with this trend continuing to increase. Defining home-based business can be difficult. A spectrum exists between those who work at home on occasion, through to those who operate a business full-time from home. Levels of home based work (HBW) can be found through census data, by examining mode of travel to work and ‘worked at home’ numbers. The Australian Bureau of Statistics (ABS) ‘Locations of Work’ indicated there were approximately 760,000 people in Australia who usually worked at home in their main or second job in November 2008. Demand for home based work There are both macro and micro drivers for home based work. Macro demand drivers include changing technology and consumer needs, while micro drivers centre on lifestyle attributes associated with home based work. The rise of HBW can be attributed to the affordability of computers, the internet and other communication technologies. Consumer spending should also be considered. Changes that are affecting home-based businesses are:
the rapid development of the internet and associated technologies
globalisation of the marketplace, and
changing purchasing habits of consumers.
These have an impact on the efficiency of goods and services being delivered to consumers. With competition for home-based businesses not just located locally but internationally, while trying to deal with ever-changing customers wants and demands. However, positives to emerge from these changes include cheaper and more extensive advertising, promotions and sales for a company.

Kogarah Employment Lands and Economic Development Strategy 27
The attraction of home based work and home based businesses is flexibility in work hours, the avoidance of a commute to work and paying rent for commercial space and opportunities to improve the balance between work and family life. Thus, incidence of home based work is usually highest in areas that are distant from employment centres, especially in ‘sea change’ or ‘tree change’ locations. This point is worth noting in relation to Kogarah’s proximate location to major employment areas, namely the Sydney CBD. Additionally, working from home or home-based work can be high in areas which offer high amenity, where home-based workers can grab a coffee or go for a swim at lunch. The motivation for full-time home-based business workers are likely to differ from those who are occasionally working from home. Home-based business owners may be starting a new business, and taking advantage of low initial overheads, transitioning from full-time work to retirement or scaling-back an existing business. Supplementing the household income is another driving factor of home-based businesses. This may be demonstrated by the relatively higher proportion of women working part-time from home. These ‘spare cash’ operators tend to rise and fall with general economic conditions. Home-based work is also attractive to those with young families, mature age and disabled workers. The ABS (2008) data indicated that the number of people who worked some hours at home as a proportion of all employed people generally increased with age. For example, 3% of those aged 15–19 worked some hours at home, 30% of those aged 35–44 worked some hours at home and 43% of those aged 65 and over worked some hours at home. Therefore the Australia’s ageing population, along with the traffic congestion, could benefit from the Metro Plan push to increase the numbers of those working from home. Policy imperative for home based work In terms of policy, the Metro Plan supports the development of the home based work as it reduces pressure on transport infrastructure and improves liveability (DP&I, 2010). One of the major aims for this study was to ‘identify, support and foster new enterprises and home based businesses to build local employment’ (Kogarah City Council, 2012). What type of work is involved? It is important to note that home-based work is more suited to some types of work than others. It is more suited to professional services and white collar work, which has traditionally made up a large percentage of this type of employment. Although it does range from domestic services such as ironing, dressmaking and child care services, through to professional services. This trend towards increasing home-based work is driven by more flexible modes of working, which characterise the ‘new economy’. In addition, labour market participation rates have increased over the past decades, as more women enter the workforce. Accompanying this trend has been the rapid increase in part-time employment. Part of this increase in part time work and hours worked by women is home-based work. Industries that home-based businesses are more likely to be successful in include the broader industry categories such as ‘Professional, Scientific and Technical Services’, ‘Rental, Hiring and Real Estate Services’ and ‘Arts and Recreation Services’. At a more detailed level the types of businesses include publishing, real estate services, specialised manufacturing, personal services, various professional and technical services, e-commerce, health, nutrition and cosmetics. Home-based work is increasing rapidly across most industry sectors, and across all sub-regions in Sydney, but especially for managers and professionals (ABS 2008). This trend is visible of more flexible modes of working, which characterise the ‘new economy’. In addition, labour market participation rates have increased over the past decades, as more women enter the workforce. Women are more likely to work from home, with the ABS stating that 8% of women in the workforce do this, compared to only 5% by men. The trends associated with home-based and part-time work will necessitate a review of the variety of office spaces in order to support business needs (for example incubator hubs).
3.4 Stakeholder consultation
In collaboration with the Kogarah City Council, the following key stakeholders in the region – including private enterprise, business organisations and major landowners – were contacted as part of this study. These included:
Kogarah Chamber of Commerce

Kogarah Employment Lands and Economic Development Strategy 28
Business Enterprise Centre - St George and Sutherland Shire
St George Public Hospital
St George Private Hospital
St George TAFE
Kogarah Town Centre owner
St George Leagues Club
St George Bank
Land owners - St George Bank Building
South Hurstville Market place
Oatley Pub
Kogarah RSL
South Hurstville RSL
Hurstville RSL Memorial Club
Oatley RSL Consultation with key stakeholders centred on the main themes:
major economic drivers
strengths and weaknesses
opportunities and threats
industries that should be targeted for future expansion
planning controls
Kogarah City Council’s role in supporting and attracting development Given the primacy of the Kogarah Town Centre as the largest centre in the LGA, most stakeholders focused their responses on this centre. Consultation with commercial real estate agents was also undertaken and focussed on the performance and nature of the commercial office, retail and industrial markets in Kogarah. The results from consultation have been used to confirm and explain the data and help inform and support the recommendations of this study. A detailed summary of the consultation findings can be found in Appendix 4. It should be noted that while all stakeholders were given sufficient time and prompting to participate in the study, only around 50 percent of those contacted did provide meaningful input. This could be construed as a positive sign that there are no serious problems facing the precincts. This is based on the assumption that stakeholders that have issues will typically voice them. Some of the key issues raised by the stakeholders included:
Car parking in and around the Centres, particularly Kogarah Town Centre
safety
fragmented ownership in centres
lack of regional population catchment for Kogarah Town Centre (the Georges River and Botany Bay limiting the southern and eastern catchments)
planning controls in South Hurstville are limiting expansion
3.5 Economic development
What is economic development?
‘Economic development’ can be described as the continuous process of growing an area’s level of income and capital (wealth) and distributing that wealth (through local expenditure and jobs) to the community (Lennon, 2011a). Typically measured in terms of income and employment, economic development is also measured by improvements in education, health, culture, community well-being and the environment. The notion of ‘sustainable’ economic development is a concept which looks beyond improvements in industry output, gross regional product and employment. As fundamental as these traditional growth measures are, ‘economic sustainability’ requires long-term economic growth without compromising an area’s community, cultural and environmental attributes which are inextricably linked with economic success.
Kogarah Employment Lands and Economic Development Strategy 29
While the objectives of economic development facilitation are essentially the same for any Local Government Area or region - encouraging high levels of investment and expenditure capture, a diverse, export-oriented and robust industry base, sustainable and meaningful employment for local residents and a high quality of life - no two locations are completely alike. Hence, economic development outcomes suited to one town or region will not necessarily reflect the aspirations of businesses, governments and communities in another. For this reason any plans and actions must be based on a set of economic development planning principles that should be particular to the area concerned. At the same time they should also be based on broader principles that acknowledge the various economic stakeholders, respond to wider economic trends and influences and which reflect an understanding of what really drives local economic development (SGS Ecomomics and Planning, 2007). A number of the broader principles are displayed in the following text box. Economic Development Planning Principles
Capitalise on existing strengths & capabilities
Development efforts need to focus on building on existing local strengths and capabilities – not aiming to attract or develop industries from scratch or by subsidising uncompetitive operations that do not provide a broader public benefit.
Continual innovation is essential
Innovation is the key determinant of long-term regional economic performance. Encouraging local businesses to innovate lies at the heart of the ability to add value in the long-term.
Collaborative focus on export markets can alleviate competitive tension
So that specific knowledge gaps can be straddled, focussing development efforts on export markets can alleviate local competitive tensions. Equally focussing efforts on common problems can yield this result.
Quality of life and ‘lifestyle’ is important, as it attracts the knowledge workers
As knowledge is embodied in individuals, it is vitally important for regions to be able to attract and retain skilled workers. Achieving this ultimately relies on more than just employment opportunities, business subsidies and so on. Quality of life and personal development opportunities need to be afforded to these sophisticated knowledge workers. A triple bottom line approach is essential.
Governments should intervene where market failure is evident
Where market failure is evident, intervention is often required. Effectively intervening not only revolves around understanding the root causes of market failure and their interdependencies, it sometimes means helping those that are prepared to act to help themselves.
Harnessing private sector leadership is crucial
Government, be it local, State or Federal cannot ‘drive’ economic development. Private enterprise is the principal driver of prosperity and for this reason it must be embraced as a partner in the determination of local priorities and action plans.
True collaboration is essential for success
To effectively engage the private sector in steering the local economy down the desired development path, institutional collaboration is required between the three tiers of government, as well as with research and education institutions. Otherwise the actions needed to encourage private sector development are uncoordinated and often unworkable.
Success often is only evident in the long-term
Finally, local economic development interventions are not always successful in the immediate term. Not surprisingly, given the multiplicity of factors affecting local area competitiveness, success requires a long-term commitment, ongoing monitoring and refinement of initiatives.
Source: SGS Economics and Planning, July 2007.
What role can local government play in economic development?
Local governments often assume the role of economic development. And while governments do not drive economic growth and development (industry does), they can influence the ‘pre-conditions for economic prosperity’ (Lennon, 2010). They directly influence the ‘enabling environment’ for economic development via local planning schemes as well as through the efficiency and effectiveness (or otherwise) of their development approvals process (Lennon, 2011a). As well as ensuring that adequate land is available for commercial growth and industrial development, the

Kogarah Employment Lands and Economic Development Strategy 30
local land use planning regime can reinforce existing or emerging industry clusters by providing appropriate signals relevant to the performance and locational requirements of the industries concerned (Lennon, 2011a). Creating and maintaining an attractive investment environment (and an appealing ‘people environment’), is a fundamental prerequisite for sustainable economic development. How this is achieved depends in large part on the land use planning framework that is place to encourage and accommodate the ‘right sort’ of development (Lennon, 2011a). Every Council is a key player in its local (and regional) economy in a number of ways in that:
It spends money on development infrastructure that facilitates business and community activity and sustains environmental quality (e.g. roads, drains, parks, and gardens).
It provides important community services that support economic activity and promote the health and well-being of the local population. These services assist in social cohesion and the development of local identity (e.g. child care, recreation services, cultural facilities, aged care, etc.).
It is an effective partner in the early stages of project development through its role in development approvals (e.g. planning, building and health).
It is often the first point of contact for local businesses and the community in relation to day-to-day concerns that affect the immediate environment for business production and quality of life (e.g. local land use conflicts and their resolution, lobbying other spheres of government for attention to problems outside the Council’s jurisdiction, providing information on changes to regulations, housing controls, and so on) (SGS Economics and Planning, 2008) .
Despite popular belief that only the regional, rural and remote parts of Australia want and need ‘economic development’, the same applies to capital cities and their suburbs. For metropolitan LGAs, such as Kogarah, economic development is typically focussed on how to capture a greater share of Sydney’s business investment and employment. A fundamental issue concerning many suburban locations is the lack of quality employment available locally for local residents. If this can be addressed, then a number of wider economic benefits result including more local expenditure, more active and vibrant centres, efficient use of existing infrastructure and facilities, reduced burden on transport infrastructure metropolitan-wide and lower greenhouse gas emissions. Economic development issues and challenges which resonate within metropolitan LGAs typically include local business development and growth, especially micro-business growth and the growth of SMEs; local retail and activity centre vibrancy; local tertiary education and training; lifestyle and amenity generally; land and floorspace to attract business investment, among others. A Council’s urban planning policies and activities (that is, those which extend beyond the regulatory functions of the local planning scheme) also influence a location’s investment appeal and, by extension, its economic development prospects. These activities include, for example:
The preparation of land use surveys to identify existing capacity and potential industry clusters (preferred development sites, including development requirements or standards, can then be marketed to potential investors).
The establishment and articulation of best practice guidelines for the use of local employment land.
Identification of gaps and spare capacity in strategic infrastructure and taking appropriate measures to address any gaps or to capitalise on spare capacity.
The establishment of a one-stop-shop where information on local building, planning and other regulatory requirements and procedures can be quickly and easily attained by development proponents (Lennon, 2011a).
There are four strategic theme areas in which Council usually facilitate economic development (Figure 17) including: 1. Managing a coordinated approach
Lobbying
Coordinating funding submissions
Intelligence gathering and dissemination
Engage with local Regional Development Agency or Council Chamber of Commerce
Integrating urban planning with economic development for sustainable growth 2. Supporting a conducive business/people environment
Strategic planning
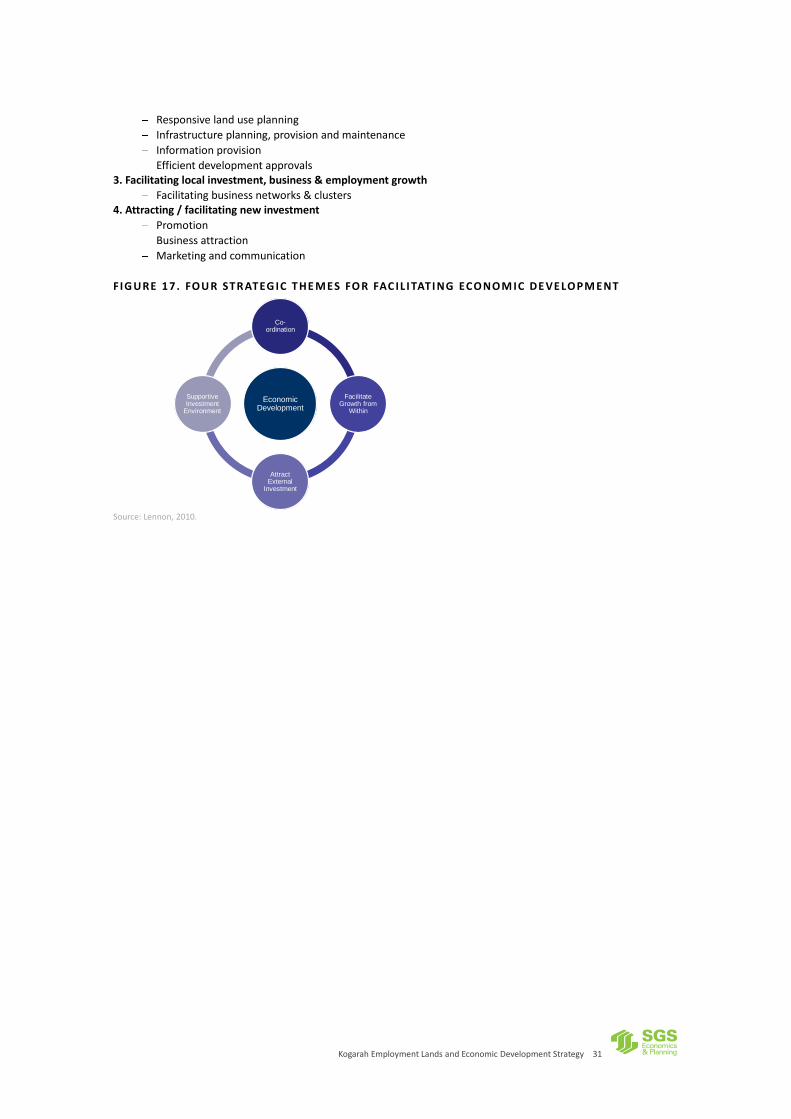
Kogarah Employment Lands and Economic Development Strategy 31
Responsive land use planning
Infrastructure planning, provision and maintenance
Information provision
Efficient development approvals 3. Facilitating local investment, business & employment growth
Facilitating business networks & clusters 4. Attracting / facilitating new investment
Promotion
Business attraction
Marketing and communication
FIG URE 17. FOU R STR ATEG IC T HE MES FO R FAC IL I TATI NG ECONOM IC DE VELOPM ENT
Source: Lennon, 2010.
Economic Development
Co-ordination
Facilitate Growth from
Within
Attract External
Investment
Supportive Investment
Environment

Kogarah Employment Lands and Economic Development Strategy 32
4 EMPLOYMENT LAND SUPPLY
4.1 Audit method
Data has been gathered at the finest grain (4 digit ANZSIC) and summarised at a higher level (1 digit ANZSIC). The following table shows the one digit ANZSIC industries.
TABLE 1 2. ONE DIGI T ANZ SIC C AT EG ORIES
1 Digit Code
ANZSIC 1 Digit Category
A Agriculture, Forestry and Fishing
B Mining
C Manufacturing
D Electricity, Gas, Water and Waste Services
E Construction
F Wholesale Trade
G Retail Trade
H Accommodation and Food Services
I Transport, Postal and Warehousing
J Information Media and Telecommunications
K Finance and insurance services
L Rental hiring and real estate services
M Professional, Scientific and Technical Services
N Administrative and Support Services
O Public Administration and Safety
P Education and Training
Q Health Care and Social Assistance
R Arts and Recreation Services
S Other Services
Source: ABS, 2006.
The ANZSIC industry categories are limited in their description of land use patterns as the categories cut across land use types and zones. For example, for the manufacturing industry category, parts of a manufacturing business may be in heavy industrial areas, other parts may be in light industrial areas and jobs in head office/ administrative functions in the same manufacturing firms may be in commercial areas (in offices). Different industries operate at different geographic scales and have different key drivers. Local service industries – automotive repairs, printing, domestic storage and so on – need to be relatively close to customers, and are responsive to (and change with) population growth. On the other hand, large transport and warehouse distribution centres are more sensitive to state and national population growth and shifts in freighting technologies and dependencies. They have different locational and access needs. These issues have significant implications for forecasting the demand for industrial or employment lands. For these reasons, Broad Land Use Categories have been used in conjunction with ANZSIC industry classifications to overcome the limitations of each employment descriptor. The BLC codes used in this employment assessment are shown below in Table 13.

Kogarah Employment Lands and Economic Development Strategy 33
TABLE 1 3. BROAD L AND USE C ATEG O RIES (BLC S)
Land Use Category Description
Freight and Logistics (FL) Warehousing and distribution activities. Includes buildings with a number of docking facilities; ‘hard stand’ areas with trucks or goods awaiting distribution; and large storage facilities. Warehousing and distribution is a metro level issue with activities preferably locating close to air, sea and inter-modal inland ports, or with access to the motorway system.
Local light industrial and urban support (LL) Car service and repair; joinery, construction and building supplies; and domestic storage.
Wide range of businesses that service other business (components, maintenance and support) and Subregional populations. Needed at local (LGA) to Subregional level.
Manufacturing – Heavy (MH) Large scale production activity. Likely to be characterised by high noise emission; emission stacks; use of heavy machinery; and frequency of large trucks.
Heavy manufacturing is in decline in Sydney, but will continue to cluster in some locations such as Wetherill Park, Campbelltown/ Ingleburn etc. There are strong arguments for collocation in terms of raw material delivery and to concentrate externalities (though impacts on surrounding uses are generally moderate).
Manufacturing – Light (ML) Clothing manufacturing, boat building and electrical equipment manufacturing
Small scale production\ with lower noise and emission levels than heavy manufacturing.
Urban Services (US) Concrete batching, waste recycling and transfer, construction and local and state government depots, sewerage, water supply, electricity construction yards.
These typically have noise dust and traffic implications and need to be isolated or buffered from other land uses. Needed in each sub-region.
Office (O) Administration, clerical, business services, research.
Office buildings that are independent (i.e., are not ancillary to another use on site) and likely to accommodate a significant number of administration staff (>10 people).
Business / Office Parks (BP) Integrated warehouse, storage, R&D, ‘back-room’ management and administration with typically a higher office component.
Retail - Main Street (RM) Retailing services traditionally found in main street locations (e.g. supermarkets) and small cluster or strips of stores located next to a street or road.
Retail – Big Box (RB) Large shopping complexes, including Westfield.
Retail Bulky Goods (RBG) Typically large, one-story buildings surrounded by car-parking, usually located out of centre and in high exposure (main road) locations. Typified by large merchandise (e.g. furniture and household electrical goods) that requires direct vehicle access for loading of goods.
Special Activities (S) Tertiary level education, health, and community services. Typically require strategic locations and needed in each sub-region.
Dispersed Activities (D) Primary and secondary education, lower level health, social and community services, trades construction, other ‘nomads’.
Residential (RES) Residential development.
Accommodation (Short Term) (AST) Hotels and Motels (not including pubs), backpacker establishments.
Car park (CP) Stand-alone car parking stations
Vacant sites/lots (VSI) Vacant sites
Vacant buildings (VBL) Vacant buildings
Source: SGS, 2012.
See Appendix 2 for more information regarding the land audit method.
4.2 Audited areas
Commercial and industrially zoned lands across the LGA were audited including the following precincts:
Allawah
Blakehurst
Carlton

Kogarah Employment Lands and Economic Development Strategy 34
Carlton Industrial Area
Carss Park
Hurstville Town Centre (Kogarah LGA portion)
Kogarah Town Centre
Oatley
Penshurst
Princes Highway Strip
Ramsgate
Sans Souci
South Hurstville Industrial
South Hurstville Village
4.3 Audit results
Overall a total of 496,777 square metres floorspace within the employment generating precincts was audited by SGS. There are a total of 699,796 square metres of gross land and 37,350 square metres of vacant floorspace. Table 14 below shows gross lot area, vacant floorspace and current employment generating floorspace by precinct.
TABLE 1 4. TOTAL AU DI TED FLOO RS PACE AND VAC ANCIES BY EM PLOYME NT PRECI NC T
Precincts Gross Lot Area Vacancy Floorspace
Allawah 6,584 0 3,593
Blakehurst 43,181 1,547 15,113
Carlton 11,010 175 7,037
Carlton IA 104,262 10,426 62,115
Carss Park 4,996 0 1,557
Hurstville TC (Kogarah LGA) 104,538 1,081 40,946
KTC 246,105 17,169 284,769
Oatley 25,537 369 13,923
Penshurst 7,381 471 3,539
Princes Hwy Strip 56,150 1,544 21,580
Ramsgate 17,685 670 8,202
Sans Souci 11,240 673 5,873
SHI 19,662 1,993 13,791
SHV 41,464 1,232 14,737
Total 699,796 37,350 496,777
Source: SGS, 2012.
4.4 Introduction
Current floorspace by precinct
Table 15 displays the current floorspace in each precinct by BLC. Across the LGA the highest amount of floorspace is within the Special uses category (140,000 sqm) followed by Retail Mainstreet (94,000 sqm) and Office uses (88,000 sqm). Kogarah Town Centre (285,000 sqm) has the highest amount of floorspace followed Hurstville Town Centre (Kogarah LGA portion) (41,000 sqm) and Carlton Industrial Area (62,000 sqm). Table 16 displays the floorspace in each precinct by ANZSIC code. The industry with the highest amount of floorspace is ‘Health Care and Social Assistance’ (167,000 sqm), followed by ‘Professional, Scientific and Technical Services’ (62,000 sqm) and ‘Accommodation and Food Services’ (40,000 sqm).

Kogarah Employment Lands and Economic Development Strategy 35
TABLE 1 5 FLOORSPACE ( SQM) BY B LC BY P RECINCT
BP D LL ML O RB RBG RM FL S US V Total
Allawah - - - - - - - 3,593 - - - - 3,593 Blakehurst - 363 5,505 605 - - 5,491 3,150 - - - - 15,113 Carlton - 446 - - 176 - - 6,414 - - - - 7,037 Carlton IA 2,297 - 38,751 16,224 231 - - 286 2,017 - 2,309 - 62,115 Carss Park - - 284 - - - - 1,273 - - - - 1,557 Hurstville Town Centre (Kogarah LGA)
- 13,853 - - 10,910 10,900 - 5,283 - - - - 40,946
KTC - 13,651 4,782 - 75,874 12,447 751 34,339 - 139,141 3,783 5,091 284,769 Oatley - 5,021 299 - - - - 8,603 - - - - 13,923 Penshurst - 592 - - 673 - - 2,274 - - - - 3,539 Princes Hwy Strip - 6,768 828 - - - 5,433 8,552 - - - - 21,580 Ramsgate - 120 483 - 298 - - 7,301 - - - - 8,202 Sans Souci - - - - - 998 - 4,875 - - - - 5,873 SHI 3,042 - 1,646 1,859 - - - - 7,245 - - - 13,791 SHV - 2,206 1,456 - - 2,405 - 8,671 - - - - 14,737 Other - - - - - - - - - - - - 0
Precinct Total 5,339 43,021 54,034 18,687 88,162 26,750 11,675 94,615 9,261 139,141 6,091 5,091 496,777 Source: SGS, 2012.
TABLE 1 6 FLOORSPACE BY ANZSIC BY EMPLOYMENT PREC IN CT ( SQM)
A B C D E F G H I J K L M N O P Q R S V Total
Allawah - - - - - 384 477 1,784 104 117 - 154 - - - - - 42 531 - 3,593 Blakehurst - - 272 - 1,293 - 7,732 614 749 - - 435 668 - - - 954 305 2,089 1,547 15,113 Carlton - - - - - 81 557 1,809 - - - 1,048 - 743 - - 1,106 1,096 596 175 7,037 Carlton IA - - 16,579 - 6,810 7,170 3,885 709 3,169 - - 740 2,787 2,505 - 129 - 712 16,921 10,426 62,115 Carss Park - - - - - - 1,183 152 - - - - - - - - - - 222 - 1,557 Hurstville Town Centre (Kogarah LGA)
- - - - - - 5,891 3,631 - 316 - 372 207 7,731 11,079 2,053 7,341 516 1,809 1,081 40,946
KTC - - 469 73 324 1,070 20,290 12,447 157 1,483 1,712 1,345 51,620 13,911 10,771 4,150 154,206 1,071 9,668 17,169 284,769 Oatley - - - - 886 - 2,887 4,646 88 250 493 493 388 - - - 2,117 379 1,296 369 13,923 Penshurst - - - - - - 241 169 - 74 - - 742 - - 193 779 31 1,311 471 3,539 Princes Hwy Strip - - 730 - - - 10,224 7,258 - - 213 - 1,165 - - 1,065 435 - 491 1,544 21,580 Ramsgate - - - - - - 1,780 1,295 124 - 297 1,118 1,603 - - 213 194 149 1,429 670 8,202 Sans Souci - - - - - - 2,015 1,364 163 - - 151 780 420 - - - 529 451 673 5,873 SHI - - - - 1,427 1,270 0 - 7,926 - - - 951 1,841 - - - - 376 1,993 13,791 SHV - - - - 48 - 4,001 4,102 230 472 321 1,508 607 82 - 205 305 1,171 1,686 1,232 14,737
Precinct Total - - 18,050 73 10,788 9,975 61,163 39,980 12,710 2,713 3,036 7,364 61,518 27,232 21,850 8,008 167,438 6,000 38,877 37,350 496,777
Source: SGS, 2012.
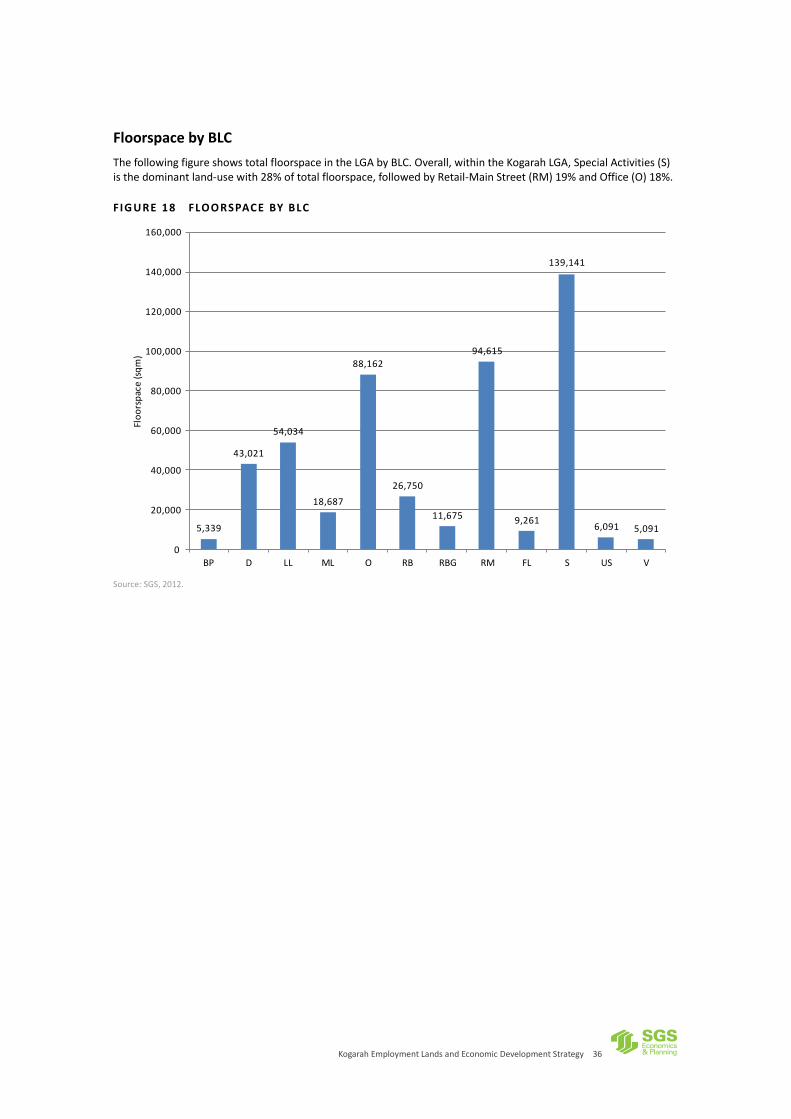
Kogarah Employment Lands and Economic Development Strategy 36
Floorspace by BLC
The following figure shows total floorspace in the LGA by BLC. Overall, within the Kogarah LGA, Special Activities (S) is the dominant land-use with 28% of total floorspace, followed by Retail-Main Street (RM) 19% and Office (O) 18%.
FIG URE 18 FLOORSPACE BY BLC
Source: SGS, 2012.
5,339
43,021
54,034
18,687
88,162
26,750
11,675
94,615
9,261
139,141
6,091 5,091
0
20,000
40,000
60,000
80,000
100,000
120,000
140,000
160,000
BP D LL ML O RB RBG RM FL S US V
Flo
ors
pac
e (s
qm
)

Kogarah Employment Lands and Economic Development Strategy 37
Floorspace by ANZSIC
The following figure shows total floorspace in the LGA by ANZSIC industry1. This shows that the Health Care and
Social Assistance utilises the most floorspace in the LGA (34%), followed by ‘Professional Scientific and Technical Services’ (12%) and ‘Accommodation and Food Services’ (8%). Moreover, the audit reveals that there is 37,350 square metres of vacant floorspace in the LGA.
FIG URE 19 FLOORSPACE BY ANZSIC
Source: ABS, 2006.
1 Digit Code
ANZSIC 1 Digit Category
A Agriculture, Forestry and Fishing
B Mining
C Manufacturing
D Electricity, Gas, Water and Waste Services
E Construction
F Wholesale Trade
G Retail Trade
H Accommodation and Food Services
I Transport, Postal and Warehousing
J Information Media and Telecommunications
K Finance and insurance services
L Rental hiring and real estate services
M Professional, Scientific and Technical Services
N Administrative and Support Services
O Public Administration and Safety
P Education and Training
Q Health Care and Social Assistance
R Arts and Recreation Services
S Other Services
Source: ABS, 2006.
1 The ANZSIC industries in the figure below have been truncated for readability.
18,050
73
10,788
9,975
61,164
39,980
12,711
2,713
3,036
7,364
61,517
27,232
21,850
8,008
167,438
6,000
38,877
37,350
0
20,000
40,000
60,000
80,000
100,000
120,000
140,000
160,000
180,000
A B C D E F G H I J K L M N O P Q R S V
Flo
ors
pac
e (s
qm
)

Kogarah Employment Lands and Economic Development Strategy 38
ANZSIC-BLC Matrix
The following table shows the distribution of ANZSIC industry floorspace by BLC across the LGA. Where relevant, the green-shaded cells indicate the top three ANZSIC industries operating in each BLC in Kogarah LGA. This analysis provides a useful indication of the types of industries operating within each land-use category (BLC) and their floorspace contributions. It is usually the case that more than one ANZSIC industry is located in any given BLC. For instance, 28% of Business Park (BP) land-use in the LGA is comprised of the Administrative and Support Services sector, while 18% of BP floorspace is due to Transport, Postal and Warehousing. It was noted earlier that Special (S) and Retail Mainstreet (RM) were the two main land-uses in the LGA. Of the total Special floorspace 94 percent is in Health Care and Social Assistance. Of the total RM floorspace, 42 percent is in Retail Trade (G) and Accommodation and Food Services (H).

Kogarah Employment Lands and Economic Development Strategy 39
TABLE 1 7 ANZSIC - BLC M AT RI X
BP D LL ML O RB RBG RM FL S US
A 0% 0% 0% 0% 0% 0% 0% 0% 0% 0% 0%
B 0% 0% 0% 0% 0% 0% 0% 0% 0% 0% 0%
C 9% 1% 9% 48% 0% 0% 6% 0% 0% 0% 6%
D 0% 0% 0% 0% 0% 0% 0% 0% 0% 0% 1%
E 0% 2% 6% 19% 0% 0% 0% 0% 15% 0% 2%
F 15% 0% 10% 6% 0% 0% 0% 1% 0% 0% 0%
G 6% 2% 14% 2% 0% 59% 82% 22% 5% 0% 8%
H 0% 28% 3% 0% 1% 17% 0% 20% 0% 0% 2%
I 18% 0% 2% 9% 0% 0% 4% 1% 46% 0% 32%
J 0% 2% 0% 0% 0% 0% 0% 0% 0% 0% 24%
K 0% 0% 0% 0% 1% 0% 0% 2% 0% 0% 0%
L 2% 0% 1% 0% 1% 0% 0% 5% 0% 0% 0%
M 0% 3% 5% 0% 49% 0% 0% 8% 11% 1% 0%
N 28% 0% 4% 0% 21% 0% 0% 2% 0% 0% 23%
O 0% 33% 0% 0% 5% 0% 0% 1% 0% 2% 0%
P 2% 0% 0% 0% 4% 0% 0% 2% 0% 1% 0%
Q 0% 20% 0% 0% 11% 13% 0% 11% 0% 94% 0%
R 0% 0% 1% 0% 0% 0% 0% 4% 2% 0% 0%
S 0% 8% 29% 9% 1% 9% 0% 10% 4% 0% 1%
V 20% 0% 15% 8% 5% 1% 8% 8% 17% 2% 0%
TOTAL 100% 100% 100% 100% 100% 100% 100% 100% 100% 100% 100%
Source: SGS, 2012.

Kogarah Employment Lands and Economic Development Strategy 40
4.5 Supply of supermarket floorspace in Kogarah LGA
The Kogarah City Council have asked SGS to examine whether there is an undersupply of supermarket floorspace in the Kogarah LGA, as stated in the St George Economic and Employment Strategy (SEES). The SEES indicates that there is 8,103 square metres of supermarket and grocery floorspace in the Kogarah LGA. It indicated that there was demand for 16,000 square metres of supermarket floorspace in Kogarah in 2004, 18,000 square metres in 2010 and 19,000 square metres in 2015. It suggested that Ramsgate or San Souci would make ideal locations for a new supermarket. The report also indicates that there is demand for ‘10 to 15 supermarkets across the region up to 2016’. It correctly notes that ‘the supply of floor space needs to be assessed on a regional basis so adverse economic impacts are not unduly placed on neighbouring LGAs’. The strategy notes that Hurstville captures considerable expenditure from Kogarah and Rockdale LGAs. Therefore, from a regional perspective, Kogarah’s ostensible supermarket and grocery undersupply is likely accommodated by the floorspace in Hurstville. The regional demand for supermarket and grocery floorspace indicated in the SEES was 63,000 square metres in 2004, 75,000 square metres in 2010 and 85,000 square metres in 2016. This compares to the 42,637 square metres of this floorspace located in the region. Therefore, at a regional level in 2004, there was an undersupply of supermarket and grocery floorspace. For Kogarah LGA the suggested demand for supermarket and grocery floorspace was 16,000 square metres in 2004, 18,000 square metres in 2010 and 19,000 square metres in 2016. The 2004 floorspace survey indicated that there was 8,100 square metres of this floorspace in the Kogarah LGA, revealing a growing floorspace supply shortage. It is likely that this demand is being absorbed by neighbouring LGAs to the region or that the supermarkets are trading at above average levels. SGS has tested the demand for supermarket floorspace in Kogarah LGA using two different benchmarks – per capita floorspace and per capita expenditure measurements. Firstly, for the per capita floorspace measurement a standard supermarket and grocery floorspace ratio of 0.35 square metres per person has been used. This results in a current demand for 21,000 square metres of supermarket and grocery floorspace based on a 2011 population of 60,000 (i.e. 0.35 multiplied by 60,000). Alternatively, using a supermarket and grocery per capita expenditure benchmark of $3,731 (i.e. each person spends $3,731 on supermarket and grocery retail each year), then the total available supermarket and grocery expenditure in the Kogarah LGA in 2012 is $224 million per annum (60,000 residents multiplied by $3,731). By dividing this $224 million in total expenditure by an average supermarket turnover per square metre figure of $10,500 (supermarket average turnover varies between $9000 to $12,000 per square metre) the total demand for supermarket and grocery floorspace is 21,320 square metres. Therefore, based on the per capita floorspace and per capita expenditure benchmarks there is demand for around 21,000 square metres of supermarket and grocery floorspace in the Kogarah LGA. Our land audit found that there is currently 12,701 square metres of supermarket floorspace and 771 square metres of grocery floorspace; totalling to 13,472 supermarket and grocery floorspace. This is around 5,400 square metres higher than the 2004 estimate of floorspace. Hence, there is an ostensible undersupply of supermarket and grocery floorspace in the Kogarah LGA of around 7,500 square metres. This indicates that either some supermarket and grocery expenditure is currently being captured by surrounding LGAs or that this demand is being met by the exiting floorspace within the Kogarah LGA; which would be trading at higher turnover levels as a result. At any rate two to three additional supermarkets, depending on their size, could be supported in the LGA.

Kogarah Employment Lands and Economic Development Strategy 41
5 DEMAND ANALYSIS
In order to examine whether there are sufficient employment lands to cater to future needs, we need to compare the demand for employment land to floorspace capacity under current controls. In other words, an assessment of the capacity of employment zoned land to accommodate the projected jobs and the associated floorspace. This section examines the demand for floorspace over the next 25 years. For the demand analysis, the BTS employment growth rates are applied to audited floorspace
2. This assumes that historical
trends in land-use persist into the future and there will be no major change to the current BLC profile (proportion of each BLC) within each precinct. Moreover, it is assumed that there is a proportional relationship between employment and floorspace growth (constant returns to scale). Between 2011 and 2036, it is projected that that there will be 5,208 additional jobs in the LGA
3.
The demand analysis is completed through the following two steps:
Step 1: Calculate the forecast employment growth rate by industry (ANZSIC) between 2011 and 2036 using BTS projections
Step 2: Convert employment projections to floorspace demand. This section also outlines a 20 percent higher employment scenario based on a higher population growth scenario. Since higher employment translates to higher demand for floorspace this scenario examines the demand-side implications of a 20 percent increase in employment across the LGA. Given that the base case employment projection of 5,208 jobs is relatively low, the higher employment scenario is used in the gap analysis.
5.1 Step 1: Calculating employment growth rates by industry
The employment forecasts (by ANZSIC industry) for Kogarah LGA are sourced from the BTS (2009). Given that the St. George Bank headquarters is the only major employer of persons in the financial and insurance services industry, and because the headquarters is unlikely to grow further, we adjust the BTS projection for this industry downwards by accounting only for population driven employment growth in this industry. The adjusted forecasts provide an indication of the magnitude and distribution of future employment and account for future trends by industry. It is important to note that these projections are trend based. The adjusted five-yearly employment forecast for Kogarah LGA from 2011 to 2036 is shown in Table 18. Change in employment and the Average Annual Growth Rates (AAGR) between 2011 and 2036 are also reported. Shaded cells show the top three demand levels and growth rates.
2 Given that the floorspace audit was conducted in 2012, to remain consistent with time frame of five-yearly BTS employment projections,
it is assumed that floorspace in 2011 is largely similar to floorspace in 2012. 3 The BTS employment projections are based on historical employment. Given that the St. George Bank headquarters is the only major
employer of persons in the financial and insurance services industry, and because the headquarters is unlikely to grow further, we adjust the BTS projection for this industry downwards by accounting only for population driven employment in this industry.

Kogarah Employment Lands and Economic Development Strategy 42
TABLE 1 8. PROJECTE D EMPLOYMENT IN THE LGA FROM 201 1 -2 0 31 (JOB S)
Industry 2011 2016 2021 2026 2031 2036
2011 –
2036 Change
2011 - 2036 AAGR
2011
profile
2036
profile
Agriculture, Forestry and Fishing
16 17 18 18 18 19 3 0.7% 0% 0%
Mining 0 0 0 0 0 0 0 0.0% 0% 0%
Manufacturing 533 513 506 488 475 471 -61 -0.5% 3% 2%
Electricity, Gas, Water and Waste Services
325 300 300 291 284 280 -45 -0.6% 2% 1%
Construction 787 754 768 750 743 747 -40 -0.2% 4% 3%
Wholesale Trade 333 345 357 350 341 333 1 0.0% 2% 1%
Retail Trade 1,137 1,180 1,248 1,248 1,263 1,298 160 0.5% 6% 5%
Accommodation and Food Services
1,187 1,275 1,362 1,388 1,415 1,456 269 0.8% 6% 6%
Transport, Postal and Warehousing
332 320 325 320 318 325 -7 -0.1% 2% 1%
Information Media and Telecommunications
49 40 35 27 20 15 -34 -4.6% 0% 0%
Financial and Insurance Services
2,848 2,891 2,994 3,046 3,101 3,167 319 0.4% 14% 12%
Rental, Hiring and Real Estate Services
398 435 481 509 537 570 172 1.4% 2% 2%
Professional, Scientific and Technical Services
1,122 1,159 1,155 1,162 1,166 1,180 58 0.2% 6% 5%
Administrative and Support Services
287 280 265 253 241 240 -48 -0.7% 1% 1%
Public Administration and Safety
1,636 1,737 1,950 2,099 2,256 2,439 803 1.6% 8% 10%
Education and Training 1,486 1,536 1,669 1,743 1,824 1,918 432 1.0% 7% 7%
Health Care and Social Assistance
6,881 7,570 8,479 9,016 9,535 10,086 3,205 1.5% 34% 39%
Arts and Recreation Services
215 219 229 230 232 239 24 0.4% 1% 1%
Other Services 555 560 590 591 593 599 44 0.3% 3% 2%
Unclassified 273 265 267 255 241 228 -45 -0.7% 1% 1%
Total Employment 20,400 21,396 22,997 23,785 24,604 25,608 5,208 0.91% 100% 100%
Source: BTS, 2009; financial and Insurance industry projection adjusted by SGS.
Health Care and Social Assistance is forecast to experience the highest employment growth with an additional 3,205 jobs in the period 2011 to 2036, followed by Public Administration and Safety with an additional 803 jobs, and Education and Training with additional 432 jobs. Accommodation and Food services is also projected to experience some employment growth. The greatest decline is forecast for employment in Manufacturing - a loss of 61 jobs. The Utilities sector, Construction and Administrative Services are projected to experience some reductions in employment. The profile of employment in 2036 is projected to be largely similar to that in 2011. Health Care is anticipated to contribute 39% of total employment (34% in 2011) and Financial and Insurance Services is projected to constitute 12% of total employment (14% in 2006).
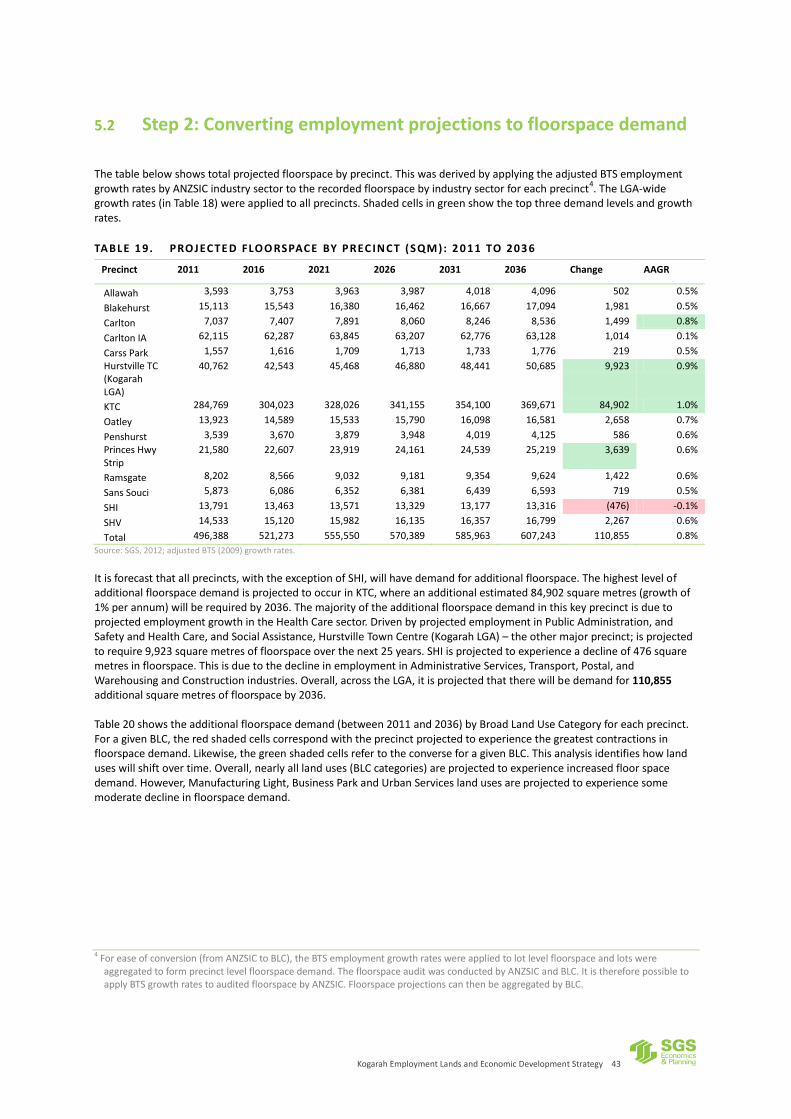
Kogarah Employment Lands and Economic Development Strategy 43
5.2 Step 2: Converting employment projections to floorspace demand
The table below shows total projected floorspace by precinct. This was derived by applying the adjusted BTS employment growth rates by ANZSIC industry sector to the recorded floorspace by industry sector for each precinct
4. The LGA-wide
growth rates (in Table 18) were applied to all precincts. Shaded cells in green show the top three demand levels and growth rates.
TABLE 1 9. PROJECTE D FLOO RSPACE BY PREC INCT ( SQM): 2 0 11 TO 203 6
Precinct 2011 2016 2021 2026 2031 2036 Change AAGR
Allawah 3,593 3,753 3,963 3,987 4,018 4,096 502 0.5%
Blakehurst 15,113 15,543 16,380 16,462 16,667 17,094 1,981 0.5%
Carlton 7,037 7,407 7,891 8,060 8,246 8,536 1,499 0.8%
Carlton IA 62,115 62,287 63,845 63,207 62,776 63,128 1,014 0.1%
Carss Park 1,557 1,616 1,709 1,713 1,733 1,776 219 0.5%
Hurstville TC (Kogarah LGA)
40,762 42,543 45,468 46,880 48,441 50,685 9,923 0.9%
KTC 284,769 304,023 328,026 341,155 354,100 369,671 84,902 1.0%
Oatley 13,923 14,589 15,533 15,790 16,098 16,581 2,658 0.7%
Penshurst 3,539 3,670 3,879 3,948 4,019 4,125 586 0.6%
Princes Hwy Strip
21,580 22,607 23,919 24,161 24,539 25,219 3,639 0.6%
Ramsgate 8,202 8,566 9,032 9,181 9,354 9,624 1,422 0.6%
Sans Souci 5,873 6,086 6,352 6,381 6,439 6,593 719 0.5%
SHI 13,791 13,463 13,571 13,329 13,177 13,316 (476) -0.1%
SHV 14,533 15,120 15,982 16,135 16,357 16,799 2,267 0.6%
Total 496,388 521,273 555,550 570,389 585,963 607,243 110,855 0.8%
Source: SGS, 2012; adjusted BTS (2009) growth rates.
It is forecast that all precincts, with the exception of SHI, will have demand for additional floorspace. The highest level of additional floorspace demand is projected to occur in KTC, where an additional estimated 84,902 square metres (growth of 1% per annum) will be required by 2036. The majority of the additional floorspace demand in this key precinct is due to projected employment growth in the Health Care sector. Driven by projected employment in Public Administration, and Safety and Health Care, and Social Assistance, Hurstville Town Centre (Kogarah LGA) – the other major precinct; is projected to require 9,923 square metres of floorspace over the next 25 years. SHI is projected to experience a decline of 476 square metres in floorspace. This is due to the decline in employment in Administrative Services, Transport, Postal, and Warehousing and Construction industries. Overall, across the LGA, it is projected that there will be demand for 110,855 additional square metres of floorspace by 2036. Table 20 shows the additional floorspace demand (between 2011 and 2036) by Broad Land Use Category for each precinct. For a given BLC, the red shaded cells correspond with the precinct projected to experience the greatest contractions in floorspace demand. Likewise, the green shaded cells refer to the converse for a given BLC. This analysis identifies how land uses will shift over time. Overall, nearly all land uses (BLC categories) are projected to experience increased floor space demand. However, Manufacturing Light, Business Park and Urban Services land uses are projected to experience some moderate decline in floorspace demand.
4 For ease of conversion (from ANZSIC to BLC), the BTS employment growth rates were applied to lot level floorspace and lots were
aggregated to form precinct level floorspace demand. The floorspace audit was conducted by ANZSIC and BLC. It is therefore possible to apply BTS growth rates to audited floorspace by ANZSIC. Floorspace projections can then be aggregated by BLC.

Kogarah Employment Lands and Economic Development Strategy 44
In line with the BTS projection, Special Uses (63,750 additional sqm), Retail Mainstreet (17,750 additional sqm), Dispersed Uses (13,568 additional sqm), and Office (8,300 additional sqm) land uses are projected to experience significant increases in floorspace demand across the LGA. Driven by the demand for employment in the Health Sector, the additional demand for Special Uses relates entirely to KTC. This is due to the specialised nature of the health precinct in KTC. The majority of the 17,750 additional square metres of floorspace for Retail Mainstreet is expected to locate in KTC as well. Additional demand for Dispersed land uses; driven mainly by projected employment growth in Accommodation, and Food Services and Public Administration and Safety industries, is expected to locate in Hurstville Town Centre (Kogarah LGA) (6,122 sqm) and KTC (4,841 sqm). Demand for additional Office space is also expected to mainly locate in KTC.

Kogarah Employment Lands and Economic Development Strategy 45
TABLE 2 0. GROW T H I N FLOO RSPACE DEMAND (SQM ) BE TWEE N 2011 AND 2 03 6
Precinct BLC Category
Total BP D LL FL ML O RB RBG RM S US
Allawah - - - - - - - - 502 - - 502
Blakehurst - 11 574 - (31) - - 684 743 - - 1,981
Carlton - 111 - - - 76 - - 1,312 - - 1,499
Carlton IA 296 - 1,026 133 (373) 3 - - 19 - (91) 1,014
Carss Park - - 40 - - - - - 179 - - 219
Hurstville TC (Kogarah LGA)
- 6,122 - - - (104) 2,904 - 1,002 - - 9,923
KTC - 4,841 615 - - 8,353 1,808 106 6,605 63,751 (1,178) 84,902
Oatley - 712 38 - - - - - 1,908 - - 2,658
Penshurst - 206 - - - (13) - - 393 - - 586
Princes Hwy Strip - 1,488 113 - - - - 580 1,459 - - 3,639
Ramsgate - 56 62 - - 15 - - 1,288 - - 1,422
Sans Souci - - - - - - 149 - 570 - - 719
SHI (333) - 32 (133) (42) - - - - - - (476)
SHV - 20 181 - - - 298 - 1,768 - - 2,267
Total (37) 13,568 2,681 (1) (445) 8,330 5,160 1,369 17,748 63,751 (1,269) 110,855
Source: SGS, 2012; adjusted BTS (2009) growth rates.

Kogarah Employment Lands and Economic Development Strategy 46
5.3 Higher employment scenario
To further test the ability of the LGA to accommodate future employment land demand, we constructed a scenario where employment is 20 percent higher than the base case based on a higher population growth rate. An additional iteration of the supply-demand gap analysis is also conducted in Section 6. This will lead naturally to consideration of the planning controls and their ability to support the proposed economic development strategy. Under the base case it is projected that there will be 5,208 additional jobs in the LGA. Under the higher scenario, it is projected that there will be 20 percent higher employment growth in the LGA. This implies 6,205 additional jobs over the next 25 years. That is, 1,042 more jobs than in the base case. As per the constant returns to scale assumption, 20 percent higher employment translates to 20 percent higher floorspace. Under the base case, floorspace demand was 110,855 square metres, under the higher scenario this becomes 133,026 square metres. The table below (Table 21) shows the total projected floorspace by precinct. Cells shaded in green show the top three demand levels and growth rates. Table 22 shows the additional floorspace demand (between 2011 and 2036) by Broad Land Use Category for each precinct. As before, the cells in green indicate the precinct absorbing the most floorspace demand for a given land use, and the cells in red the converse. Given that this scenario makes no adjustments to employment growth rates, or precinct land-use profiles, the results are largely similar to the base case. The only difference being that floorspace demand in every land use, in every precinct is 20 percent higher. The majority of floorspace demand is expected to locate in KTC and Hurstville Town Centre (Kogarah LGA portion).
TABLE 2 1. PROJECTE D FLOO RSPACE BY PREC INCT ( SQM) – H IGH ER SCENARIO
Precinct 2011 2016 2021 2026 2031 2036 Change AAGR
Allawah 3,593 3,785 4,038 4,065 4,103 4,196 603 0.6%
Blakehurst 15,113 15,629 16,634 16,732 16,978 17,490 2,377 0.6%
Carlton 7,037 7,482 8,062 8,265 8,487 8,836 1,799 0.9%
Carlton IA 62,115 62,321 64,191 63,426 62,908 63,331 1,216 0.1%
Carss Park 1,557 1,627 1,739 1,745 1,768 1,820 263 0.6%
Hurstville TC (Kogarah LGA)
40,762 42,899 46,409 48,103 49,977 52,670 11,908 1.0%
KTC 284,769 307,874 336,678 352,433 367,966 386,651 101,883 1.2%
Oatley 13,923 14,722 15,854 16,163 16,533 17,113 3,189 0.8%
Penshurst 3,539 3,696 3,947 4,030 4,115 4,242 703 0.7%
Princes Hwy Strip 21,580 22,813 24,387 24,677 25,131 25,947 4,367 0.7%
Ramsgate 8,202 8,639 9,198 9,377 9,584 9,908 1,706 0.8%
Sans Souci 5,873 6,129 6,448 6,482 6,553 6,736 863 0.5%
SHI 13,791 13,397 13,527 13,237 13,055 13,220 (571) -0.2%
SHV 14,533 15,238 16,272 16,455 16,721 17,253 2,720 0.7%
Total 496,388 526,250 567,383 585,190 603,879 629,414 133,026 1.0%
Source: SGS, 2012; adjusted BTS (2009) growth rates.

Kogarah Employment Lands and Economic Development Strategy 47
TABLE 2 2. GROW T H I N FLOO RSPACE DEMAND (SQM ) BE TWEE N 2011 AND 2 03 6 – H IG HER SCENARIO
Precinct BLC Category
Total BP D LL FL ML O RB RBG RM S US
Allawah - - - - - - - - 603 - - 603
Blakehurst - 13 689 - (37) - - 820 891 - - 2,377
Carlton - 133 - - - 91 - - 1,575 - - 1,799
Carlton IA 355 - 1,231 159 (447) 4 - - 23 - (109) 1,216
Carss Park - - 48 - - - - - 215 - - 263
Hurstville TC (Kogarah LGA) - 7,346 - - - (125) 3,485 - 1,202 - - 11,908
KTC - 5,809 738 - - 10,024 2,170 127 7,926 76,501 (1,413) 101,883
Oatley - 855 45 - - - - - 2,289 - - 3,189
Penshurst - 247 - - - (16) - - 472 - - 703
Princes Hwy Strip - 1,785 135 - - - - 696 1,750 - - 4,367
Ramsgate - 67 75 - - 18 - - 1,546 - - 1,706
Sans Souci - - - - - - 179 - 684 - - 863
SHI (399) - 39 (160) (50) - - - - - - (571)
SHV - 24 217 - - - 358 - 2,122 - - 2,720
Total (44) 16,281 3,217 (1) (534) 9,996 6,192 1,643 21,297 76,501 (1,522) 133,026
Source: SGS, 2012; adjusted BTS (2009) growth rates.

Kogarah Employment Lands and Economic Development Strategy 48
6 GAP ANALYSIS
6.1 Calculating floorspace capacity
The first step in the gap analysis is to calculate the amount of floorspace capacity in the LGA. Floorspace capacity is the maximum potential floorspace under current controls. This has been calculated by applying maximum possible FSRs to each lot in each precinct and subtracting current floorspace from the maximum possible floorspace. However, it is highly unlikely that the maximum theoretical floorspace under the current controls would be achieved due to physical constraints and feasibility issues. Hence, two more feasible scenarios have been tested that assume a lower take up of maximum capacity. The two feasible scenarios assume that each precinct across the LGA would (on average) achieve 50 percent of maximum theoretical floorspace and 25 percent of maximum theoretical floorspace. The 25 percent of maximum theoretical capacity assumes that 75 percent of additional floorspace in the centres would be residential and the remainder would be commercial space. In addition, current vacant floorspace is also considered as part of total floorspace capacity. The following table shows the FSR applied to lots in each precinct. For the sake of brevity, only the most common5, maximum and minimum FSR by precinct is shown.
TABLE 2 3. ASSUMED FSR BY P RECI NC T
Precinct Most common FSR applied Highest FSR applied Lowest FSR applied
Allawah 1.5 1.5 1.0 Blakehurst 1.0 1.5 1.0 Carlton 1.5 1.5 1.5 Carlton IA 1.0 1.0 1.0 Carss Park 1.5 1.5 1.5 Hurstville TC (Kogarah LGA) 5.0 5.0 2.0 KTC 1.6 4.0 1.3 Oatley 1.5 1.5 1.5 Penshurst 1.5 1.5 1.5 Princes Hwy Strip 1.5 1.5 1.5 Ramsgate 2.5 2.5 2.0 Sans Souci 1.5 1.5 1.5 SHI 1.0 1.0 1.0 SHV 1.0 1.0 1.0
Source: SGS, 2012.
The assumed FSRs6 are applied to the area of each lot to derive maximum possible floorspace. Lot level current floorspace (including vacant floorspace) is subtracted from the maximum possible floorspace to derive net capacity. Current vacant floorspace is added to net capacity to derive gross floorspace capacity. This can be summarised by the following equation: Gross floorspace capacity per lot = Lot area × FSR – current floorspace (includes vacant) + current vacant floorspace. This implies that total floorspace capacity is the sum of:
Maximum floorspace capacity under current controls on vacant sites
Existing vacant floorspace in buildings
Maximum floorspace capacity under current controls on occupied sites
5 The most common FSR was derived by two methods. In some precincts the most frequently occurring FSR was used whereas in
other precincts, such as those that didn't have clear FSRs, an assumption was used. 6 The assumed FSRs are for those precincts that did not have any applicable FSRs. Assumptions were made in collaboration with
Council regarding the FSRs for these areas.

Kogarah Employment Lands and Economic Development Strategy 49
In order to derive a realistic picture of employment lands capacity, the following assumptions apply:
All lots zoned residential are excluded.
Lots outside the defined precincts are not considered.
Lots with at-grade car parks are excluded.
Lots currently being used for religious and educational services are excluded.
Lots that are built to more than 80 percent of the lot area are excluded. This assumes that buildings on well-developed lots are unlikely to be knocked down and further expanded.
The table below shows net and gross floorspace capacity by precinct. The actual FSR is also reported for comparison.
TABLE 2 4. FLOORSPACE CAPAC IT Y BY PRECI NC T
Calculation A + B B A
Total Lot Area
Current Floorspace
Area
Actual
FSR Precinct Number of
lots in capacity
Gross capacity
(sqm)
Vacant floorspace
(sqm)
Net Capacity
(sqm)
Allawah 13 5,020 - 5,020 6,584 5,438 0.83
Blakehurst 30 23,858 1,547 22,311 43,181 19,261 0.45
Carlton 24 6,081 175 5,906 11,010 9,383 0.85
Carlton IA 69 39,097 10,426 28,670 104,262 75,143 0.72
Carss Park 8 1,978 - 1,978 4,996 2,500 0.50
Hurstville TC (Kogarah LGA)
6 7,106 1,081 6,025 104,538 131,485 1.26
KTC 64 124,331 17,169 107,161 246,105 439,741 1.79
Oatley 13 12,888 369 12,519 25,537 23,041 0.90
Penshurst 9 2,609 471 2,138 7,381 5,817 0.79
Princes Hwy Strip
24 15,389 1,544 13,845 56,150 26,906 0.48
Ramsgate 19 15,173 670 14,503 17,685 11,994 0.68
Sans Souci 7 4,534 673 3,861 11,240 7,961 0.71
SHI 2 4,614 1,993 2,621 19,662 15,784 0.80
SHV 25 11,568 1,232 10,336 41,464 20,785 0.50
Total 313 274,244 37,350 236,895 699,796 795,240 1.14
Source: SGS, 2012.
6.2 Gap analysis: comparing capacity and demand
The final step in the gap analysis is to compare floorspace capacity to projected floorspace demand. The gap is calculated by subtracting the projected floorspace demand from estimated floorspace capacity. Three floorspace capacity scenarios are considered in this analysis: 100 percent, 50 percent, and 25 percent of maximum developable floorspace. Projected demand growth between 2011 and 2036 (additional floorspace required) is compared to each capacity scenario. Both the base case and higher floorspace demand scenarios are tested.
Base case floorspace demand
Table 25 shows the results of the gap analysis using the base case floorspace demand of 110,885 square metres of additional floorspace. The red cells show precincts with the shortages in floorspace capacity, while the green cells refer to the top three precincts with capacity. The table below shows the gap under the three capacity scenarios. Given demand for 10,000 square metres of floorspace, Hurstville Town Centre (Kogarah LGA portion) is modelled to face capacity shortages in all three capacity scenarios. However, in Scenario 1, KTC, Carlton IA, and Blakehurst have sufficient capacity to accommodate spill over demand from the Hurstville Town Centre (Kogarah LGA portion). With only 50 percent of floorspace capacity under Scenario 2, KTC (22,700 sqm) and Hurstville Town Centre (Kogarah LGA portion) (6,300 sqm) are expected to face shortages. Given that the majority of floorspace demand in KTC is related to the Health Sector, it is unlikely that this demand can be absorbed into other precincts. In addition to agglomeration benefits generated from the health precinct, separation of the health sector would be an undesirable

Kogarah Employment Lands and Economic Development Strategy 50
planning outcome. Overall, there is sufficient capacity in other precincts to accommodate total floorspace demand and absorb non-health related floorspace demand. In Scenario 3, both Hurstville Town Centre (Kogarah LGA portion) and KTC are expected to face shortages. In contrast to Scenario 2, there is a shortage of 42,300 square metres of floorspace. This is mainly driven by the shortage in KTC. Given that the 25 percent capacity scenario applied is quite conservative when applied to the hospital sites (i.e. it is unexpected that 75% of floorspace on this land will be residential), the long run problems associated with shortages in KTC’s health precinct may not be realised.
TABLE 2 5. GAP ANALYSIS: BASE C ASE DEM AND
Precinct Additional floorspace
demand (sqm) –
Base case Scenario 1: 100 %
capacity Scenario 2: 50 %
capacity Scenario 3: 25 %
capacity
Capacity (sqm)
Gap (sqm) Capacity
(sqm)
Gap (sqm)
Capacity (sqm)
Gap (sqm)
Allawah 502 5,020 4,518 2,510 2,008 1,255 753
Blakehurst 1,981 23,858 21,877 11,929 9,948 5,964 3,983
Carlton 1,499 6,081 4,581 3,040 1,541 1,520 21
Carlton IA 1,014 39,097 38,083 19,548 18,535 9,774 8,761
Carss Park 219 1,978 1,759 989 770 494 275
Hurstville TC (Kogarah LGA)
9,923 7,106 -2,817 3,553 -6,370 1,777 -8,147
KTC 84,902 124,331 39,428 62,165 -22,737 31,083 -53,820
Oatley 2,658 12,888 10,230 6,444 3,786 3,222 564
Penshurst 586 2,609 2,023 1,304 719 652 66
Princes Hwy Strip 3,639 15,389 11,750 7,694 4,055 3,847 208
Ramsgate 1,422 15,173 13,752 7,587 6,165 3,793 2,372
Sans Souci 719 4,534 3,815 2,267 1,548 1,134 414
SHI -476 4,614 5,090 2,307 2,783 1,154 1,629
SHV 2,267 11,568 9,301 5,784 3,517 2,892 625
Total 110,855 274,244 163,390 137,122 26,267 68,561 -42,294
Source: SGS, 2012.
Higher floorspace demand
Table 26 shows the results of the gap analysis using the higher floorspace demand of 133,026 square metres of additional floorspace. As before, the red cells show precincts with the shortages, while the green cells refer to the top three precincts with capacity. The table below shows the gap under the three capacity scenarios. Given demand for nearly 12,000 square metres of floorspace, Hurstville Town Centre (Kogarah LGA portion) is expected to face a shortage of 4,800 square metres under this demand scenario. Similar to the base case demand scenario, KTC (22,400 sqm), Carlton IA (37,900 sqm), and Blakehurst (21,500 sqm) have sufficient capacity to accommodate spill over demand from Hurstville Town Centre (Kogarah LGA portion). Given that the majority of its floorspace demand originates from the Health Care, and Public Administration industries (in Dispersed uses), should the shortage in Hurstville Town Centre (Kogarah LGA portion) actualise, it is likely that the other precincts would be seen as relatively suitable substitutes. With only 50 percent of floorspace capacity under Scenario 2, in addition to Hurstville Town Centre (Kogarah LGA portion) (8,355 sqm), KTC (39,717 sqm) is also expected to face shortages. As was the observed in the base case demand scenario, KTC’s floorspace shortage in the Health Sector is unlikely to be readily absorbed into other precincts. Overall, there is sufficient capacity in other precincts to accommodate total floorspace demand and absorb non-health related floorspace demand (mainly from Hurstville Town Centre (Kogarah LGA portion)). In contrast to the base case demand gap analysis, in addition to Hurstville Town Centre (Kogarah LGA portion) (70,800 sqm) and KTC (10,131 sqm), Princes Highway Strip (520 sqm), Carlton (279 sqm), and Penshurst (51 sqm) are expected to face shortages under Scenario 3; albeit relatively minor ones. As a result it is expected that there will be a shortage of 64,465 square metres of floorspace across the LGA. Again, given that the 25 percent capacity scenario applied is quite conservative when applied to the hospital sites (i.e. it is unexpected that 75% of floorspace on this

Kogarah Employment Lands and Economic Development Strategy 51
land will be residential), and because 20 percent higher employment is relatively optimistic, the long run problems associated with shortages in KTC’s health precinct may not be realised.
TABLE 2 6. GAP ANALYSIS: H IGHE R FLOORSPACE DEMAND
Precinct Additional floorspace
demand (sqm) – Base
case Scenario 1: 100 %
capacity Scenario 2: 50 %
capacity Scenario 3: 25 %
capacity
Capacity (sqm)
Gap (sqm) Capacity
(sqm) Gap (sqm)
Capacity (sqm)
Gap (sqm)
Allawah 603 5,020 4,417 2,510 1,907 1,255 652
Blakehurst 2,377 23,858 21,480 11,929 9,552 5,964 3,587
Carlton 1,799 6,081 4,282 3,040 1,241 1,520 -279
Carlton IA 1,216 39,097 37,880 19,548 18,332 9,774 8,558
Carss Park 263 1,978 1,715 989 726 494 232
Hurstville TC (Kogarah LGA)
11,908 7,106 -4,802 3,553 -8,355 1,777 -10,131
KTC 101,883 124,331 22,448 62,165 -39,717 31,083 -70,800
Oatley 3,189 12,888 9,699 6,444 3,255 3,222 33
Penshurst 703 2,609 1,906 1,304 601 652 -51
Princes Hwy Strip 4,367 15,389 11,022 7,694 3,328 3,847 -520
Ramsgate 1,706 15,173 13,467 7,587 5,881 3,793 2,087
Sans Souci 863 4,534 3,671 2,267 1,404 1,134 271
SHI -571 4,614 5,185 2,307 2,878 1,154 1,724
SHV 2,720 11,568 8,848 5,784 3,064 2,892 172
Total 133,026 274,244 141,219 137,122 4,096 68,561 -64,465
Source: SGS, 2012.

Kogarah Employment Lands and Economic Development Strategy 52
7 COMPETITOR ASSESSMENT
An assessment of employment lands that potentially compete with those in Kogarah LGA has been undertaken. The main focus of this assessment has been on the Kogarah Town Centre and its potential competitors, as other employment areas in the Kogarah LGA are more likely serve a local role and not compete with centres outside of the LGA. Kogarah was designated a Major Centre by the 2005 Metropolitan Strategy: City of Cities and continues that designation in the most recent Metro Plan. Kogarah Town Centre hosts the head office of the St George Bank, St George Public and Private Hospitals, St George TAFE college and Kogarah Council as well as being home to 200 smaller businesses. A potential avenue for future economic development, as identified in the Council’s Community Strategic Plan, Bright Future, Better Lifestyle: Kogarah 2020 is the promotion of the role of the Major Centre as a medical and health services hub (Kogarah LGA 2010). Kogarah serves an important civic role with a number of government services and facilities located and immediately adjacent in the centre including the Kogarah City Council, the hospitals and allied health facilities, public primary and high schools, St George TAFE, St George police station and Kogarah Court House. The retail component of Kogarah is relatively small scale and focused on strip shopping on Railway Parade and Regent Street. Kogarah Town Centre is often used as an urban design exemplar of a liveable centre. The traditional main streets and public domain areas are considered successful, vibrant places for pedestrians, workers and local residents. The draft South Subregional Strategy indicates that this level of activity could extend into the evening and create a vibrant night-time economy (DP&I 2006). The Kogarah LGA’s economic vision for the Kogarah Town Centre is:
a vibrant mix of financial, education and medical based uses, mixed with residential and localised retail development, in a pedestrian orientated environment (Kogarah LGA 2010).
The Hurstville CBD and Rockdale Town Centre are the two centres that could be perceived as the strongest competition to the Kogarah Town Centre given their comparative size and relatively close proximity. The Hurstville centre is considered a Major Centre under the Metro Plan and is located 2.75 kilometres west of Kogarah Town Centre (based on train stations as centre points). Rockdale centre is considered a Town Centre under the Metro Plan and is located 1.2 kilometres north of Kogarah Town Centre. A high level assessment of these centres has been conducted to determine the extent to which they compete head-to-head with Kogarah or whether they serve an alternative or complementary function. From this perspective the comparable strengths and weaknesses of Kogarah have been assessed. The Hill PDA report ‘St George Economic Strategy 2006’ indicates that the Kogarah Town Centre is somewhat smaller than the Hurstville and Rockdale (including Rockdale Plaza) centres (based on the floorspace survey conducted by Ibecon in 2004 and CBRE research from September 2004). Hurstville was the largest centre with approximately 200,000 square metres of floorspace, followed by Rockdale at almost 73,000 square metres (including the Rockdale Plaza). Kogarah recorded around 55,000 square metres of floorspace. An important point to note is that vacant floorspace is based on shop front commercial floorspace and hence the vacancy rate would have been underestimated in this 2004 floorspace survey. The amount of employment floorspace in Kogarah was underestimated as the major employment land uses such as the hospital and St George TAFE weren’t included in this analysis.

Kogarah Employment Lands and Economic Development Strategy 53
TABLE 2 7. APP ROX IMATE FLOO RSPAC E BY CENTRE I N 2 004
Centre Retail (sqm) Commercial -shop front (sqm)
Commercial office space (sqm)
Vacant (sqm) Total (sqm)
Kogarah 18,000 4,500 30,168 1,900 54,568 Hurstville 87,000 22,000 83,400 7,000 199,400 Rockdale 20,000 5,000 13,408 3,000 41,408 Rockdale Plaza 21,000 500 n.a. 100 21,600
Source: Hill PDA, 2006. Note: vacancy only refers to street front vacant space.
Focussing on retail, at an LGA wide level there is a much greater retail offer available in the Hurstville and Rockdale LGAs. The limited retail available in Kogarah is demonstrated by the fact that the surrounding LGAs have up to twice as much retail offer in any given category. Kogarah LGA contains less than half of the ‘Specialty foods and meals out’, ‘Clothing & Footwear Stores’, ‘Bulky Goods Retailers’ retail categories than Rockdale and Hurstville LGAs. Therefore, both the Hurstville and Rockdale LGAs have a much stronger retail offer than Kogarah.
TABLE 2 8. ST GEO RGE FLOOR SPAC E SU RVE Y BY LG A - 20 04
Retail Store Type Rockdale Kogarah Hurstville Total
Supermarkets & Grocery Stores 13,902 8,103 20,632 42,637 Specialty Foods and Meals Out 28,245 14,051 32,054 74,350 Clothing & Footwear Stores 14,994 7,562 28,470 51,026 Bulky Goods Retailers 25,772 9,300 20,970 56,042 Other Goods Retailers 26,373 19,203 36,224 81,799 Vacant 11,129 5,327 14,564 31,020 Total 149,479 63,544 123,849 336,872
Source: Hill PDA, 2006.
Both Kogarah and Hurstville Major Centres have established office markets, as shown in Figure 20 on the next page, with 23 per cent of all workers in Kogarah Town Centre (over 1800 people) and over 1000 people in Hurstville CBD employed in ‘Financial and Insurance Services’. Almost 600 people in Hurstville CBD are employed in ‘Professional, Scientific and Technical Services’. In total, there are currently around 2600 jobs supported in Rockdale Town Centre, 8200 in Kogarah Town Centre, and 8500 in Hurstville Major Centre. The major employment drivers in Kogarah are the St George bank, St George Public and Private Hospitals and St George TAFE. The major employment drivers in Hurstville CBD include the Westfield shopping centre, smaller mainstreet retail uses and the ATO office. The major employment driver in Rockdale Town Centre is retail.

Kogarah Employment Lands and Economic Development Strategy 54
FIG URE 20. EMPLOYMENT BY INDU STRY I N KOG ARAH , ROC K DALE AND H URST VI LLE CENT RES
Source: BTS, 2009; SGS, 2011.
0
500
1,000
1,500
2,000
2,500
3,000
3,500
4,000
4,500
To
tal n
um
ber o
f work
ers
Rockdale
Kogarah
Hurstville

Kogarah Employment Lands and Economic Development Strategy 55
A more detailed description of Hurstville and Rockdale centres is provided below.
7.1 Hurstville
The Hurstville centre is considered a Major Centre under the Metro Plan and is located 2.75 kilometres west of Kogarah Town Centre (based on train stations as centre points). The Hurstville CBD straddles the Eastern Suburbs and Illawarra Rail Line with the southern part of the Major centre being located in the Kogarah LGA. The majority of the centre is located in the Hurstville LGA and is bordered by The Avenue and Queens Road. It is the highest order centre in the Hurstville LGA and includes Council Chambers, a public library, an enclosed sub-regional shopping centre (Westfield) and RSL (Kogarah side). Hurstville CBD also contains important civic uses including the Hurstville City Council and Hurstville police station. The centre has well defined precincts including a vibrant main street, civic precinct, and lower value use areas (FIGURE 21). The Hurstville centre is pedestrian friendly, with calmed internal streets and busy vehicular roads bordering the centre. The Hurstville centre has a vibrant night time economy based on the food retail offer in Forest Road.
FIG URE 21. H URST VILLE C BD
Source: Google Earth, 2012; SGS, 2012.
According to the Draft South Subregional Strategy, Hurstville is considered to be the retail centre for Southern Sydney and the heart of the St George-Sutherland region (Department of Planning, 2006, pp. 60-61). Hurstville centre is the most centrally located for many of Kogarah’s residents and so it may be hard to attract residents to Kogarah Town Centre instead of Hurstville for this reason. The draft subregional strategy indicates that there are currently 13,000 jobs located in the centre, with a target of an additional 4000 jobs by 2031. In terms of commercial office floorspace, there is currently an oversupply based on research conducted by SGS Economics and Planning in 2010. Lack of demand from tenants seeking office space was seen to be the major factor. Based on recent consultation with commercial real estate agents there is still a relatively high number of office
Civic precinct
Office
buildings
Lower value, low
intensity uses
Westfield shopping
centre
Main street spine –
food retail,
convenience retail,
banks, shop front
office,
Overall, the Hurstville centre is large and
dominated by Westfield. It contains substantial
high-rise residential and has several precincts
including a vibrant main street precinct, civic
precinct and lower value areas

Kogarah Employment Lands and Economic Development Strategy 56
vacancies in Hurstville centre. Consultation was also ambivalent as to whether Hurstville or Kogarah CBD was more attractive to tenants. The features of centres that are important to attract office development include: 1. accessible to workforce and consumer market 2. available retail services 3. available car parking 4. access to business services – banking, post office, legal and accounting services 5. high amenity locations 6. good public transport 7. integrated into the metropolitan urban structure Both Hurstville and Kogarah have similar catchments, although Hurstville would have a larger catchment as it is closer to western Sydney. Hurstville has more retail services and car parking, while both centres have access to business services. Both centres share similar levels of amenity, public transport connections and integration into the urban structure. On balance, based on the above theoretical attributes of office attractiveness, Hurstville is slightly more attractive due to its larger catchment, retail offering and carparking. According to research SGS Economics and Planning conducted in 2010 there was strong demand for retail premises, which are mainly occupied by gift shops, hairdressers, Asian grocers, and some local services such as pharmacies and banks. Retail premises that are most in demand are sized between 40 square metres to 200 square metres. Hurstville centre at the time had no retail vacancies, with the majority of tenants looking to locate along Forest Road due to the high exposure it offered. It was suggested that there is an opportunity for retailing to expand further into outer streets however the lack of amenity does not attract enough foot traffic. There will be little change in the near future in the types of retail and commercial premises on offer in Hurstville. This is because many of the retail tenants are locked into long term leases (five to ten years). There are two enclosed shopping centres in Hurstville Major Centre. Hurstville Central (7000 square metres) is a smaller centre with a Coles supermarket (2700 square metres) and 25 specialty stores (4300 square metres). A larger subregional Westfield centre (62,606 square metres) is located in the Hurstville Major Centre. Major tenants include Myer (15,899 square metres), Kmart (7,968 square metres), Target (3698 square metres), Coles (3395 square metres), Toys ‘R’ Us (2059 square metres), Dan Murphy’s (1720 square metres), Aldi Supermarket (1,480 square metres), 248 specialty stores totalling 22,019 square metres and an eight screen cinema. There is a substantial amount of high rise residential development in and around the Hurstville centre. Other general comments to note regarding the Hurstville CBD include:
there is a relatively high level of capacity in terms of underutilised and low density sites
there are some lower value land uses such as mechanics around the edges of the CBD
the centre has a very strong Asian feel, particularly in terms of food retail
7.2 Rockdale
Rockdale centre is considered a Town Centre under the Metro Plan and is located 1.2 kilometres north of Kogarah Town Centre. The Rockdale Town Centre is located along the Princes Highway and Eastern Suburbs and Illawarra Rail Line. In terms of the LGA’s hierarchy of centres, it is the highest order centre and includes Council Chambers, a public library, schools, sporting facilities, RSL, and fire and ambulance stations. The Rockdale centre has several, relatively separated precincts including main street style strip shopping, retail heart, peripheral and lower value retail uses (Figure 22). Given the primacy of the main vehicular thoroughfares of the Princes Highway and Bay Street, the Rockdale centre is not a very walkable and pedestrian friendly environment.

Kogarah Employment Lands and Economic Development Strategy 57
FIG URE 22. ROCK DALE TOWN CE NT RE
Source: Google Earth, 2012; SGS, 2012.
The Draft South Subregional Strategy notes that the Rockdale Town Centre plays an important retail support role to Kogarah. Much of the retail is situated along the main roads and quieter streets running parallel to the rail line. The retail core of the centre provides approximately 28,000 square metres of retail floorspace, excluding Rockdale Plaza. Rockdale Plaza is to the south-east of centre and is a total of 21,130 square metres with four major tenants totalling 14,652 square metres and 56 specialty outlets totalling 6,478 square metres. The major tenants include Big W (6,493 square metres), Woolworths Liquor (4,085 square metres), Franklins (2,583 square metres) and Rebel Sport (1,491 square metres). Retail uses extend past the town centre along the Princes Highway to the north and south. Further north along the Princes Highway there are lower value uses such as car yards and more marginal uses such as second hand book stores and mechanics. Similar to the Kogarah Town Centre, the Rockdale Town Centre lacks vibrancy in the evenings. The centre is not seen as a commercial office market destination due to its proximity to Sydney CBD, neighbouring established centres such as Kogarah and its lower quality building stock. Similar to Hurstville CBD there is a substantial amount of high rise residential development in and around the Rockdale Town Centre. Other general comments to note regarding the Rockdale Town Centre include:
there is a relatively high level of capacity in terms of underutilised and low density sites, particularly along Princes Highway to the north
largely a ribbon shaped centre based on the core strip shopping along the Princes Highway
there is a large industrial and bulky goods precinct to the south east of the centre

Kogarah Employment Lands and Economic Development Strategy 58
7.3 Other areas
Rockdale industrial area
The Rockdale industrial area has been defined as the large industrial precinct to the south of Bay Street and to the east of Rockdale Plaza. There are large floorplate industrial and bulky good uses in this precinct that would not compete with Carlton industrial area. There are however, some small and new business park style office and industrial uses in the Rockdale precinct that could compete with Carlton industrial area for the market catchment to the north-east of the Kogarah LGA and the southern part of the Rockdale LGA.
Kogarah industrial area (Production Avenue)
The Kogarah industrial area located to the east of Rocky Point Road could be considered a competitor to the Carlton Industrial Area in the Kogarah LGA. The Kogarah industrial area is located to the north of the Ramsgate centre and includes uses such as the Darrell Lea factory. It is within the Rockdale LGA and is dominated by Local Light industrial uses. Given the Local Light industrial uses in this precinct and its proximity to the Kogarah LGA, this precinct is likely to serve a similar market to the Carlton Industrial Area and hence could be considered a competitor. The Kogarah industrial area is more accessible than Carlton and is buffered from residential uses as it is bordered by the Rocky Point Road to the west and open space to the east.
7.4 Summary
The Hurstville centre is a major retail destination in the St George-Sutherland region with an enclosed subregional shopping centre, vibrant main street and night time economy based on food retail. There are some major office towers in the centre including the ATO building in the southern part of the centre in the Kogarah LGA. Although, a recent study completed by SGS Economics and Planning indicated that Hurstville is oversupplied in the office market. The Hurstville CBD has a number of high rise residential towers. The Rockdale Town Centre is an important retail destination. The Rockdale Town Centre is lower on the retail hierarchy than Hurstville, but still has a much stronger retail offering than Kogarah Town Centre. In terms of retail, Kogarah LGA contains less than half the retail floorspace in ‘Specialty foods and meals out’, ‘Clothing & Footwear Stores’, ‘Bulky Goods Retailers’ retail categories than Rockdale and Hurstville LGAs. Given the lack of retail floorspace for these categories compared to the Hurstville and Rockdale LGAs, the Kogarah LGA – and by implication the Kogarah Town Centre – has a more local role in the retail hierarchy of the St George-Sutherland region. Rather than being a major shopping destination, the Kogarah Town Centre gains its prominence as a health and education destination, as well as being a destination for office employment. Given the prominence of Hurstville CBD and Rockdale Town Centre as important retail centres it would be difficult to attract higher-order major clothing and fashion retailers or department stores, as these are more likely to gravitate to the larger centres in Hurstville or Rockdale where they would have a greater exposure to a larger catchment. Both Hurstville CBD and Kogarah Town Centre have a strong office presence. However, the office market in Kogarah is strongly dominated by the St George bank headquarters, which has a historical link to the region. Given the high amount of office floorspace and number of employees in the white collar sector, it is tempting to construe the Kogarah Town Centre as an attractive market for future office development. However, this conclusion should be treated with caution for the following reasons. Firstly, office based employment in the Kogarah Town Centre is dominated by the St George bank and secondly, the relatively small size of the Kogarah Town Centre and limited retail offering are not attractive to major office developments. However, the amenity of the Kogarah Town Centre is arguably better than the Rockdale Town Centre and hence it is likely to be a more attractive office market relative to Rockdale.

Kogarah Employment Lands and Economic Development Strategy 59
Measured in terms of underutilised and low density sites there is, prima facie, much more capacity in Rockdale Town Centre and Hurstville Major Centres than in Kogarah Town Centre. In summary, both the Hurstville and Rockdale LGAs have a much stronger retail offer than Kogarah and it would be difficult to compete with these centres in attracting higher order retail development. In terms of office development, Kogarah is better placed to attract development than Rockdale. However, based on fundamentals of office attractiveness, Hurstville is slightly more attractive than Kogarah CBD due to its larger catchment, retail offering and carparking.

Kogarah Employment Lands and Economic Development Strategy 60
8 VIABILITY OF CURRENT PLANNING FRAMEWORK
This chapter assesses the suitability and viability of the current planning controls in the Kogarah LGA. One of the study objectives was to review the existing zones along the Princes Highway, King Georges and Rocky Point Road and test their suitability and viability for enterprise corridor uses. Another was to measure whether the planning controls in the Kogarah LGA are generally viable in their current form. In the first instance, SGS assessed the suitability of the three main road corridors for enterprise corridor uses. Once their suitability was determined, the viability of enterprise corridor controls was tested. Viability was also tested in the South Hurstville Village, which was identified in the study as an area of concern.
8.1 Suitability of enterprise corridors
The suitability of enterprise corridors was tested for the Princes Highway, King Georges and Rocky Point Road. A B6 Enterprise Corridor in the Standard Instrument LEP is a zone that allows employment uses (usually low value), is suited to main road type areas, away from centres and can allow residential. The objectives of the zone are:
To promote businesses along main roads and to encourage a mix of compatible uses.
To provide a range of employment uses (including business, office, retail and light industrial uses).
To maintain the economic strength of centres by limiting retailing activity. The main road corridors have been assessed in turn for their suitability for this zone. King Georges Road King Georges Road runs through the Kogarah LGA starting to the east of Hurstville CBD until it meets the Princes Highway in the south of the LGA. There are currently employment land uses along this corridor, clustered around Blakehurst and South Hurstville Village. These clusters are already zoned for commercial uses; hence there is no requirement to rezone these to enterprise corridor. Outside of these centres there are several businesses to the south-west of South Hurstville Village interspersed with residential; including a pharmacy, mechanic, caravan sales, fruit market and service station. These businesses do not form a continual strip of development (they are separated by residential development) and there are too few to form a significant cluster. Therefore, the enterprise corridor zone is not considered suitable in this location. Rocky Point Road Rocky Point Road starts to the south-east of Kogarah Town Centre and runs to the south of the LGA where it meets Taren Point Road at Georges River. It also forms part of the boundary between Kogarah and Rockdale LGAs. There are several clusters of employment uses along this corridor including Ramsgate and Sans Souci centres and Kogarah Industrial Area (Production Avenue). The business and industrial zones applying to these centres and employment area are appropriate and do not warrant changing to a B6 zone. Outside of these employment clusters the only significant cluster is a strip of development between Barton Street to the north and Hillpine Avenue to the south. This cluster of development is a fine-grain, retail based strip that is more suitable to a B1 Neighbourhood Centre zone, than a B6 Enterprise Corridor zone. Hence, no uses on Rocky Point Road are recommended for the B6 zone. Princes Highway The Princes Highway starts to the south-east of Kogarah Town Centre and runs to the south of the LGA where it meets Georges River. There are several clusters of development along this corridor including the centres of Carss Park and Blakehurst. There is also a strip of employment uses that run between Jubilee Avenue in the north-east to Plant Street in the south-west, primarily on the northern side of Princes Highway. This strip is more or less continuous and provides a number of highway retail and employment functions. SGS believes that this location is a suitable for an enterprise corridor zone.

Kogarah Employment Lands and Economic Development Strategy 61
8.2 Assessment of planning framework and planning recommendations
An assessment of the existing planning framework has been conducted. The full documentation can be found in Appendix 3. The majority of the land use and built form planning instruments applying to commercial and industrial land are found in the following DCPs:
Kogarah Town Centre Development Control Plan No.5
Commercial and Industrial Lands Development Control Plan
Ramsgate Centre DCP The assessment of the provisions has been conducted with a focus on how the built form controls to meet forecast floorspace requirements by precinct, and land use type. The provisions have been incorporated into the capacity figures in the supply section. Any changes required to the controls have been suggested in Section 9.
8.3 Economic viability of controls
This section discusses the economic viability of the planning controls in the Princes Highway corridor and the South Hurstville Village. The Princes Highway was chosen as it was the only major road corridor suitable for an enterprise corridor zone and, while it may be suitable for this use, it might not necessarily be viable. South Hurstville was chosen as agent consultation indicated that the planning controls – namely the low FSR – were adversely affecting feasible development. A Return on Investment (RoI) development feasibility model was developed to test both of these scenarios. The first site, referred to in the draft South Subregional Strategy as a ‘potential enterprise corridor’, is an existing commercial strip on the Princes Highway between Jubilee Avenue and Plant Street in Carlton. Given that this strip does not have an existing FSR control, an FSR of 1.5:1 was applied as a development assumption. This FSR was derived from the existing controls in the planning framework and was created in consultation with Council. Three development scenarios have been modelled to see if they are financially feasible under the current planning controls in the Kogarah Local Environmental Plan 1998. The second site is South Hurstville local centre along King Georges Road. The planning controls for South Hurstville only allow a floor space ratio of 1:1. To analyse the sensitivity of profit on an increased FSR provision, a ratio of 1.5:1 was also tested. Three development scenarios have been modelled to see if they are financially feasible under the current planning controls (FSR 1:1) as well as under the controls for the enterprise corridor (1.5:1). Currently both precincts contain an ad-hoc mix of older residential dwellings and a variety of non-residential uses including strip retail shops, bulky goods outlets, local industrial services and a scattering of commercial spaces.
8.4 Method and assumptions
To test the feasibility of three development scenarios in each precinct under the current planning controls, a simple feasibility model was constructed to measure the profit – the total achievable revenue less total costs of development. The purpose of the model is more to establish comparative feasibility, rather than absolute feasibility. This is to test general development scenarios and sensitivity to planning controls such as parking and floor space ratio. The revenue assumptions were calculated based on the likely achievable sales price of each component of the development. The total costs incorporate construction, external services, contingency, parking and site preparation. The development scenarios were tested to fit into the existing allowable floor space ratio (FSR) under the current planning controls. Development Scenarios 1, 2 and 3 were modelled in both precincts under an assumed FSR of 1.5:1. Scenarios 4, 5 and 6 were modelled at the South Hurstville precinct under the current permissible FSR of 1:1. Scenario’s 4 to 6 had a lower total building footprint than scenarios 1-3 due to the lower FSR. At both precincts a site of 1350 square metres was chosen as an example (based on two average residential lot sizes in these areas), with a requirement that the site that it be located along the main thoroughfares (Princes Highway in the enterprise corridor and King Georges Road in South Hurstville).

Kogarah Employment Lands and Economic Development Strategy 62
Scenario1
The first scenario consists of a two storey commercial development with ground floor retail suites with an upper level of commercial suites. The development has at grade car parking for nine vehicles at the rear of the buildings as well as underground parking for 36 vehicles. The total building area is 1820 square metres. Attributes of the development are described in Table 29.
TABLE 2 9. SCENARIO 1 AT TR IBU TE S
FSR 1.5:1
Site Area 1350
Building footprint/floor 910
Total building footprint 1820
Commercial unit size (sqm) 150
Commercial sale price /sqm ($) $3000
No. Commercial units 10
Residential unit size N/A
Residential unit sale price ($) N/A
No. Residential units 0
Source: SGS, 2012.
Scenario 2
The second development scenario consists of a mixed use, two storey development with ground floor retail suites and an upper level of residential units. The development has at grade car parking for nine vehicles at the rear of the building with underground parking for 30 vehicles. The total building footprint is 1820 square metres. Attributes of the development are described in the following table.
TABLE 3 0. SCENARIO 2 AT TR IBU TES
FSR 1.5:1
Site Area 1350
Building footprint/floor 910
Total building footprint (inc. void) 1820
Commercial unit size (sqm) 150
Commercial sale price /sqm ($) $3000
No. Commercial units 5
Residential unit size (sqm) 120
Residential unit sale price ($) $490,000
No. Residential units 6
Source: SGS, 2012.

Kogarah Employment Lands and Economic Development Strategy 63
Scenario 3
The third scenario consists of a mixed use three storey development. The ground floor is comprised of retail suites which occupy 455 gross square metres, while the rear half of the ground floor is undercroft parking for 15 car spaces. The two upper floors consist of residential units. The development has at grade car parking at the rear of the buildings for nine vehicles with a further provision for eight vehicles underground parking. The total building footprint is 2275 square metres. Attributes of the development are detailed in the following table.
TABLE 3 1. SCENARIO 3 AT TR IBU TE S
Source: SGS, 2012
Scenario 4
Scenario 4 is a two storey commercial/retail development similar to Scenario 1. With a permissible FSR of 1:1 however, there is a smaller building footprint of 1,350 square metres (gross). The site has at grade parking for 25 vehicles and further underground parking for eight vehicles. Attributes of the development are detailed in the following table.
TABLE 3 2. SCENARIO 4 AT TR IBU TES
FSR 1:1
Site Area 1350
Building footprint/floor 675
Total building footprint (inc. void) 1350
Commercial unit size (sqm) 150
Commercial sale price /sqm ($) $3000
No. Commercial units 10
Residential unit size (sqm) N/A
Residential unit sale price ($) N/A
No. Residential units 0
Source: SGS, 2012
FSR 1.5:1
Site Area 1350
Building footprint/floor 910
Total building footprint (inc. void) 2275
Commercial unit size (sqm) 125
Commercial sale price /sqm ($) $3000
No. Commercial units 3
Residential unit size (sqm) 120
Residential unit sale price ($) $490,000
No. Residential units 12

Kogarah Employment Lands and Economic Development Strategy 64
Scenario 5
Scenario 5 is a two storey mixed use development with ground floor retail and an upper level of residential units, similar to Scenario 2, however with a smaller building footprint. The site has at grade parking for 25 vehicles and further underground parking for five vehicles. Attributes of the development are detailed in the following table.
TABLE 3 3. SCENARIO 5 AT TR IBU TE S
FSR 1:1
Site Area 1350
Building footprint/floor 675
Total building footprint (inc. void) 1350
Commercial unit size (sqm) 150
Commercial sale price /sqm ($) $3000
No. Commercial units 5
Residential unit size (sqm) 120
Residential unit sale price ($) $490,000
No. Residential units 4
Source: SGS, 2012
Scenario 6
Scenario 6 is a three storey development with ground floor retail and two upper levels of residential units. To fit into an FSR of 1:1 the three floors are only 450 square metres (gross) with a total net floor space of 420 square metres on each floor. Unlike Scenario 3, the bottom floor is all commercial and due to the small building footprint, at grade parking is able to be accommodated. The development has parking at grade for 25 vehicles with a total building footprint of 1350 square metres. Attributes of the development are detailed in Table 34.
TABLE 3 4. SCENARIO 6 AT TR IBU TE S
FSR 1:1
Site Area 1350
Building footprint/floor 450
Total building footprint (inc. void) 1350
Commercial unit size (sqm) 105
Commercial sale price /sqm ($) $3000
No. Commercial units 4
Residential unit size (sqm) 105
Residential unit sale price ($) $460,000
No. Residential units 8
Source: SGS, 2012
Cost and revenue assumptions
Cost and revenue assumptions have been built into the model from a number of sources. These are explained in greater detail in Table 35. Development costs are based on Rawlinsons Construction Guide 2012. These costs include the building costs as well as parking, external works and services, professional fees and sales expenses. The acquisition costs have been estimated based on evidence from extraction of sales data from RP data and Domain and sense-checked through consultation with local property market agents. Revenue cost assumptions have been based on recent sales of comparable products in the area. This data was collected through sales data analysis from RP Data and Domain. A qualitative sense-check has been undertaken with local property market agents as well as developers.

Kogarah Employment Lands and Economic Development Strategy 65
TABLE 3 5. ASSUMPTIO NS AND MODE L CO NST RUC TI O N
Grouping Input Rate Definition
Planning controls
FSR 1.5:1 and 1:1 Floor Space ratio that determined development footprint
Site details
Site Area Mixed Total site area
Number of commercial units
Total commercial units to be constructed
Number of residential units Total residential units to be constructed
Car spaces 1/50sqm commercial 1/25 sqm retail 1.25 spaces per residential unit 1 visitor space/5 units residential
Number of required car spaces
Building area Total building footprint
Costs
Acquisition costs ($) Cost of acquiring the land
Site preparation ($) Demolition and excavation
Professional Fees ($) 9.2% of building costs
Professional fees including, planning, project management, engineering and design.
Building costs ($/sqm) Building cost for each type of development. Residential includes basic standard finish. Commercial/retail is basic shell and core.
Balcony Cost $3600 per balcony (9sqm)
Cost per balcony for residential units
Car parking cost ($) $2,855 per at-grade space $50,000 per underground space
Car parking (at grade and underground) cost based on required ratio in planning controls
Total Building cost ($) Total of building costs, site preparation, balcony and car parking
External works ($) 3 % of building costs
External works including plumbing and surfaces
Contingency 10% of building costs
Contingency of construction cost counted as 10% of building costs, site preparation and external works
Total Costs Sum of total development costs
Revenue
Commercial/retail sale price/sqm
Mixed Sale price/sqm for retail and commercial
Total comm/retail revenue Mixed Total commercial and retail revenue
Residential sale price Mixed Residential sale price per dwelling
Total residential revenue Total revenue of residential sales
Total sale revenue Total expected revenue of commercial and residential sales
Sale Expenses 4% of sales revenue
Sale expenses including commission, legal fees and marketing
Expected profit ($) Total sales revenue minus total costs
Profit % (developer margin)
Profit ratio based on total expected profit over total costs
Source: SGS, 2012.
8.5 Results
Enterprise corridor
For the Enterprise corridor the three scenarios were tested on a parcel of land that is 1350 square metres on the Princes Highway between Jubilee Avenue and Plant Street in Carlton. Scenario 1 and 2 return a negative profit before development margin has been taken into account (i.e. less than 15%). A major factor in this is the high cost of parking underground, necessitated by the parking and FSR requirements in the planning controls. Scenario 3 returns a positive profit (not taking into account a standard developers margin of 15 percent). The major reason for this is the much reduced parking cost. As the ground floor in this scenario has only 375 square metres of commercial floor space, a significant number of car spaces can fit into the undercroft, thereby significantly reducing the number of required underground car spaces. Table 36 details the feasibility results of Scenarios 1 to 3 in the Enterprise Corridor.

Kogarah Employment Lands and Economic Development Strategy 66
TABLE 3 6. ENTE RPR I SE CO RR IDO R FEASIB IL IT Y RESULTS
Attribute Scenario 1 Scenario 2 Scenario 3
Floor Space Ratio 1.5:1 1.5:1 1.5:1
Site area 1,350 1,350 1,350
Commercial/retail units 10 5 5
Residential units - 6 12
Car spaces 45 39 32
Building area (sqm) 1,820 1,820 2,730
Acquisition costs ($) $1,000,000
$1,000,000
$1,000,000
Total building costs ($) $2,277,135
$2,682,776
$4,157,667
Total costs ($) $5,486,320
$5,771,096
$6,564,474
Potential achievable revenue ($)
$4,200,000
$5,040,000
$6,930,000
Expected profit ($) -$1,454,320 -$932,696 $88,326
Profit % (developer margin) -29.4% -17.8% 2.2%
Source: SGS, 2012.
SGS conducted sensitivity testing to determine what changes to the development configuration might facilitate viability. Firstly, additional residential apartment storeys were tested to see if these would improve the feasibility of development. However, as the marginal cost of underground carparking is more expensive than the marginal revenue from each additional unit, the profitability of a development actually decreases with additional levels of development ( Table 37).
TABLE 37. ENTE RPR I SE CO RR IDO R FEASIB IL IT Y RESULTS – AD DI TIO NAL RES IDE NT I AL STOREYS
4 storey development 5 storey development 6 storey development
Profit % (developer margin) -5.28% -11.49% -16.93% Source: SGS, 2012.
Given that underground carparking was proving a significant hindrance to the feasibility of development, SGS tested the same development but with reduced carparking rates (Table 38).
TABLE 3 8. REDUCE D C ARPAR KI NG R ATES
Current rate Reduced rate
Commercial (sqm per space) 50 75 Retail (sqm per space) 25 35 Residential (spaces per unit) 1.45 1.25
The reduced parking rates substantially decrease the number of carparks required (in this case the number of at grade and undercroft parks remained the same, while the underground parking was reduced). As a result, the financial performance of each scenario improves, with Scenario 3 almost achieving a feasible return on development with an 8.1 percent return. It is expected that further improvements in viability would arise from further reductions in carparking rates. However, it is important to note that from a transport planning perspective, reducing carparking rates does not necessarily produce the most efficient or desirable outcomes. Additionally, it is important to keep in mind that any changes to the achievable revenue would result in a more viable development equation.

Kogarah Employment Lands and Economic Development Strategy 67
TABLE 3 9. ENTE RPR I SE CO RR IDO R FEASIB IL IT Y RESULTS – RE DU CED C ARPARKI NG R ATES
Attribute Scenario 1 Scenario 2 Scenario 3
Floor Space Ratio 1.5:1 1.5:1 1.5:1 Site area 1,350 1,350 1,350 Commercial/retail units 10 5 5 Residential units - 6 12
Car spaces 31 29 26
Building area (sqm) 1,820 1,820 2,730
Acquisition costs ($) $1,000,000
$1,000,000
$1,000,000
Total building costs ($) $2,138,500
$2,555,950
$4,042,650
Total costs ($) $4,944,098 $5,313,849
$6,151,738
Potential achievable revenue ($)
$4,200,000
$5,040,000
$6,930,000
Expected profit ($) -$912,098 -$475,449 $501,062
Profit % (developer margin) -18.4% -8.9% 8.1%
Source: SGS, 2012.
South Hurstville
Scenarios 1 to 3 in South Hurstville all return a negative profit, with greater development costs than anticipated revenue. The result of each scenario is similar to the Enterprise Corridor, however the greater cost of property acquisition is not met by equally high revenue, and thus all three scenarios are slightly less profitable. This means that Scenario 3 in South Hurstville returns a negative profit as well.
TABLE 4 0. SOU TH H URST VILLE ( SC ENAR IO 1 , 2 AND 3)
Attribute Scenario 1 Scenario 2 Scenario 3
Floor Space Ratio 1.5:1 1.5:1 1.5:1
Site area 1,350
1,350
1,350
Commercial/retail units 10 5 5
Residential units 6 12
Car spaces 45 39 32
Building area 1,820 1,820 2,730
Acquisition costs ($) $1,200,000
$1,200,000
$1,200,000
Total building costs ($) $2,138,500
$2,555,950
$4,042,650
Total costs ($) $5,686,320
$5,971,096
$6,764,474
Potential achievable revenue ($)
$4,500,000
$5,190,000
$7,005,000
Expected profit ($) -$1,366,320 -$988,696 -$39,674
Profit % (developer margin) -24.0% -16.6% -0.6%
Source: SGS, 2012
Scenario 4, 5 and 6 have been calculated based on a permissible site FSR of 1:1. This has required a change to the building configuration and an overall net reduction in floor space in all three scenarios. An outcome of the reduced FSR is a greater provision of space for at-grade parking, which significantly reduces the overall development cost. However, the reduced floorspace also means a reduced revenue source. Overall, each scenario produces a loss. While Scenarios 4 and 5 do not produce a loss as significant as the similar Scenarios 1 and 2, Scenario 6 however produces a worse result than the similarly configured Scenario 3. Therefore, the FSR of 1:1 does not produce a feasible result. Unlike Scenario 3 with an FSR of 1.5:1, no scenario with an FSR of 1:1 produces a result that breaks-even.

Kogarah Employment Lands and Economic Development Strategy 68
TABLE 4 1. SOU TH H URST VILLE ( SC ENAR IO 4 , 5 AND 6)
Attribute Scenario 4 Scenario 5 Scenario 6
Floor Space Ratio 1:1
1:1
1:1
Site area 1,350
1,350
1,350
Commercial/retail units 107 3 3
Residential units - 3 4
Car spaces 29 23 21 Building area 1200 1200 1275
Acquisition costs ($) $1,200,000 $1,200,000 $1,200,000
Total building costs ($) $1,703,215 $1,776,505 $1,978,470 Total costs8 ($) $3,259,463 $3,262,500
$3,486,000
Potential achievable revenue ($)
$2,850,000 $3,262,500 $3,486,000
Expected profit ($) -$523,463 -$236,168 -$269,541
Profit % (developer margin) -16.1% -7.0% -7.5%
Source: SGS, 2012
Summary
Under our assumptions no development scenario was feasible. The mixed use scenario with two levels of residential apartments in both the Enterprise Corridor and South Hurstville Village practically broke-even. Under all scenarios the mixed use developments incorporating residential development are most feasible. This concords with agent suggestions that any commercial or retail development in these areas would probably have to be ‘subsidised’ by residential development to be feasible. Our feasibility testing indicated that the lower FSR of 1:1 is not feasible and is less feasible than the FSR of 1.5:1 to the extent that no 1:1 scenario comes close to breaking-even. Our modelling corresponds with advice from local agents that suggests the current FSR of 1:1 at South Hurstville Village is not feasible. At any rate, the most significant hurdle to development in our testing was carparking rates, rather than the FSR controls. The problem of underground carparking negatively affecting the feasibility of development is not one that is unique to Kogarah LGA. It is common to urban development in almost all suburban markets due to the low underlying land value compared to major CBDs. Providing underground car spaces is prohibitively expensive and given the impediment that the current carparking rates pose to feasibility, the issue of carparking is more closely examined below. The development equation in both the potential enterprise corridor and South Hurstville Village is currently unfeasible under the current FSR and carparking controls. While it is important to point out that if the achievable revenue for development increases, then development would become more viable. Nevertheless, assuming the market conditions for development remain the same, higher FSR controls should be considered for both these precincts. If higher FSRs are chosen, then the built form outcomes should be an important consideration.
7 This assumes smaller commercial floorplates than other scenarios. 8 Includes professional fees, contingency costs, external works

Kogarah Employment Lands and Economic Development Strategy 69
8.6 Carparking
Based on the feasibility issues arising from the current carparking rates in a number of centres across the LGA, this section examines in further detail the problems caused by conventional approaches to carparking.
Background
Parking is a critical issue in the redevelopment and renewal of established centres and urban areas. Retailers and businesses in commercial centres depend on the availability of parking to ensure customers can come and go conveniently, and most residents typically depend on cars for a range of travel needs, even if they use public transport for work and other trips. However, the conventional approach to car parking provision is outmoded and unnecessarily locks in costs and vehicle dependency. This is particularly problematic in areas where development feasibility is sensitive to costs and where public transport availability offers opportunities for different lifestyle choices that do not involve car ownership or use. A more flexible approach is required. The conventional approach is to apply minimum car parking rates to different uses and to require this to be provided on-site – which for residential and mixed-use development in particular typically means in basement parking. Numerous planning studies undertaken by SGS have identified strict and arguably onerous requirements for provision of on-site car parking as a significant barrier to the renewal and economic development of commercial centres. The costs and physical constraints associated with vehicle storage are both major issues for achieving urban renewal, particularly in locations where land parcels are relatively small and/or property values can not necessarily sustain multi-level developments with underground parking. Typically the assumptions that underlie fixed parking requirements include:
The notion that planning controls should mandate minimum levels of parking
The idea that parking should be provided on the same site and within the same structure as other land uses
In medium and high density situations, parking should be provided in basements, not at grade or above ground
Stacked parking structures are a failure of urban planning. These assumptions need to be challenged, in order to facilitate more opportunities for urban renewal.
Problems with the Conventional Approach to Parking
The problems with conventional approaches to parking provision include the following. Creating excess parking Minimum parking requirements are usually set arbitrarily by urban planners from standardised transportation planning manuals, which typically measure parking and trip generation rates in suburban areas at peak periods with ample free parking and no public transit. These parking standards can cause an oversupply of parking – taking up valuable land and lowering the price of parking below cost. They do not take into account other objectives which may be being pursued such as affordability, reduced car usage and quality design outcomes nor do they take into account the locally specific trip rates attaching to different uses. Promoting public transport use In centres on rail corridors a differential or flexible approach to parking can be contemplated, particularly for higher density residential development. In Sydney car usage and car ownership rates are lower where residents live near a rail station. Clearly the opportunity exists to consider applying lower requirements for parking or at least considering maximum rather than minimum rates and other alternative provision models (see following discussion) where public transport alternatives are available.

Kogarah Employment Lands and Economic Development Strategy 70
Increasing the cost of development Requiring developers to provide large amounts of off-street parking significantly adds to the cost of new development, especially in urban areas where land costs are high. These costs are typically passed to consumers, through higher housing prices and rents. With regards to housing, the inclusion of car parking spaces on the title for residential units increases the cost of housing overall, and while this might be recoverable and profitable it puts the housing out of reach of almost all people on moderate incomes who may wish to live in centres, and therefore is contrary to the objectives for a wider range of housing and improved affordability. It is important to recognise that the main reason that the development industry wants to include high rates of car parking for residential apartments is that it is very profitable. Although expensive to construct, the margin achieved on its resale can be higher than the rest of the building. The cost of underground car parking is very high, both in construction and in operation, particularly if the parking is mechanically ventilated. Therefore it makes sense to reduce the requirement for underground parking provision. This may be achieved through the application of maximum permissible standards for parking, as opposed to minimum requirements. Restricts development in some locations Because conventional approaches to car parking require provision of spaces on site – and to a minimum rate – it makes it very difficult for many sites to physically accommodate the required parking on-site. With circulation space and the need for access and egress points sites with small frontages are often physically incapable of providing the required car parking. And if they can configure the development to accommodate the parking the design outcomes can be poor, with frontages dominated by the entrance to the garage and street access (where allowed by the roads authority).
Alternative parking strategies
On-site parking provision is often a major cost and design constraint for redevelopment in established areas. A significant disadvantage of on-site basement parking is that this configuration ‘hard wires’ a fixed amount of parking into a building (determined at the time of construction). Once built this cannot be varied as demand for parking changes. There are a suite of alternatives to the traditional approaches.
The first alternative is lowered or at least maximum parking rates, particularly in those locations with very good access to public transport.
A second alternative is to ‘decouple’ the provision of parking from particular developments. That is, to split the ownership of the car spaces from dwellings or offices or shops, and thereby create a separate market for parking. This approach permits greater flexibility for owners and tenants: parking spaces can be bought, sold or rented as needed. A separate market for parking ensures parking costs are known and factored into households and business decisions about vehicle use, storage and ownership.
From a physical development perspective alternatives to on-site basement parking include:
More efficient utilisation of streets for street parking, where street widths allow.
‘Sleeving’ above ground parking structures with residential development.
Providing parking in separate centralised above ground structures. This provides greater flexibility to ‘the city’ as the total amount of parking provision can grow or contract according to demand. This has the potential to alleviate the need for basement car parking, which can be a significant cost and a critical determinant of the ‘buildability’ and feasibility of new housing developments (see Figure 23).

Kogarah Employment Lands and Economic Development Strategy 71
FIG URE 23. CENTR AL ISE D, DECOU PLED PARK ING
Source: SGS and S+W (2010) Review of Future Growth Potential and Planning Controls for Commercial and Industrial Land in Hurstville LGA - Final Report.
Centralised and/or decoupled parking arrangements would aid renewal in centres that typically feature smaller allotments which are difficult to develop under conventional models with basement parking (see text box below). Centres with council owned land (and specifically at-grade car parks) would be ideally suited to innovative parking schemes. Separating parking also provides diversity by making the packaging of housing and parking or office and parking optional, rather than compulsory. Shared parking Shared parking is an effective tool for reducing the number of parking spaces needed for a project or neighbourhood. Shared parking strategies can be implemented within a new mixed-use development, through simple agreements between adjacent owners or sites, or through a Local Parking Plan. Parking districts can also encourage pedestrian activity by encouraging people to park once and walk from destination to destination. In many areas it is possible for synergies to be achieved, for example daytime business visitors could use the on street spaces that have been allocated for resident visitors. It therefore makes sense to approach car parking on a precinct wide basis that allows for more efficient utilisation of fewer car spaces and the different demands over the duration of the week. Provide alternatives for commercial and retail uses Transport, local residential density and other factors (such as the type of use) will impact on the required parking rates for retail and commercial development. Many small shops are simply unable to configure developments to provide the required parking. The need for centralised parking options is even more pressing for these developments. Councils have often purchased sites to provide off street parking opportunities in small centres. They have not typically used contributions schemes to provide these collective parking facilities. The relevant proposition here is that retail and commercial developers should be offered discretion as to how they satisfy any parking requirement. The options that should be available are:
Provide on-site the full parking requirement (possibly net of ‘parking credits’);
Provide all or part of the parking off-site to the council’s satisfaction;
Pay ‘cash-in-lieu’ or contributions at a rate set down in a development contributions plan for any shortfall in car spaces.

Kogarah Employment Lands and Economic Development Strategy 72
Figure 24 displays the possible options for retail and commercial parking.
FIG URE 24. PO SSIBLE RE TAIL AN D COMME RC IAL PARKI NG AP P ROAC H
Local Parking Plans – to reflect local circumstances and objectives Parking demand is the demand generated by a particular use under particular aggregate parking supply conditions. The demand will typically vary throughout the day, by day of week, and by time of year. Parking supply is the amount of parking available with a reasonable proximity of the use, and may include on-site, on-street, and off-street parking – including ‘free’ parking and ‘paid’ parking. Available supply may also vary across the day/night, and by day of week – this applies particularly to publicly available off-street parking. A ‘parking requirement’ is the amount of parking required to be provided for a particular development (conventionally based on standard guidelines). For a number of important land use categories, this requirement may not align particularly well with the parking demand generated by the use (though this should be subject to analysis), nor does it serve wider objectives. The ‘minimum’ requirement does not consider:
the efficiencies that may be gained through shared parking
the actual demand likely to be generated by a particular use given the local conditions
the extent to which parking provision can be modified to achieve other objectives (e.g. fewer cars and affordability).
In some places the minimum requirement should be dispensed with or modified. A Local Parking Plan approach enables a ‘parking requirement’ to be set for a particular area or sub-area. Such a requirement is able to reflect:
The parking demand for a particular use
The mix of land uses currently in the area, and the predicted changes in land use types into the mid-term future
The availability of publicly-available parking in the area
The likely effects of a particular use-type on aggregate parking demand within the area
Council policy initiatives with respect to parking policy such as:
lowering of parking requirement rates to promote development or redevelopment
having differential parking rates for separate areas to reflect policy
having differential parking rates for separate areas to reflect different levels of public transport use or accessibility
having differential parking rates for separate areas to reflect different levels of publicly available off-street parking.
Assess requirementRetail
/commercial component
On site (conventionally)
$ contribution to Council car
park
Elsewhere off site
Council builds central facility for town centre
Provide requirement in combination with discretion to
Council satisfaction...

Kogarah Employment Lands and Economic Development Strategy 73
A parking plan can require a lower supply requirement rate in, say, a core area, while maintaining a higher rate for the non-core area, which may in turn be lower than the general or standard rate. The policy basis of such an arrangement could be the efficiencies gained through shared parking related to uses with different temporal profiles, or the impact or availability of publicly available off-street parking.

Kogarah Employment Lands and Economic Development Strategy 74
9 KEY ISSUES AND RECOMMENDATIONS
9.1 Review of findings and key issues
The following findings are based on the balance of evidence from the previous sections including the supply-demand gap analysis, consultation, policy review and local profile.
Economic profile
Population growth is expected to slow in the Kogarah LGA The resident population of the Kogarah LGA at June 2011 was estimated to be 59,999 persons; an increase of 5,089 persons since 2006, at an average annual growth rate of 1.8 percent. As a comparison, this was higher than the average annual population growth for both the Sydney Region (1.6 percent) and New South Wales (1.4 percent) over the same period. However, the growth rate is expected to decline resulting in a moderate increase of 6,116 persons and average annual growth rate of 0.4 percent by 2036. This rate is less than half of the predicted growth rate for the Sydney Region (1.0 percent) and New South Wales (0.9 percent). Kogarah LGA is specialised in the health and finance sectors There were a total of 15,800 jobs located in Kogarah as of 2006. The majority of these were in the one digit ANZSIC categories of ‘Health Care and Social Assistance’ (33.7 percent), with the ‘Financial and Insurance Services’ industry also a significant local employer (13.2 percent). The St George bank, St George Private and Public Hospitals and allied health are the drivers of these specialisations. At a four digit ANZSIC level, the Kogarah LGA has particular strengths in ‘Banking’, ‘Electricity Distribution’ and the health sector including ‘Hospitals’, ’Specialist Medical Services’ and ‘Pathology and Diagnostic Imaging Services’. Kogarah LGA is forecast to meet its Subregional employment capacity target According to the BTS Employment Forecasts, Kogarah LGA’s employment will increase by a total of 5,747 jobs from 2006 to 2031 and 5,588 jobs from 2011 to 2036. The projected employment level by 2031 is above the additional employment capacity target of 4,000 jobs to 2031 indicated for the LGA in the draft South Subregional Strategy.
Employment in Kogarah is driven heavily by several big players There are several big players in Kogarah that drive employment in these sectors including the St George bank, The St George Public and Private Hospitals, St George TAFE, the ATO office in Hurstville and police stations in Hurstville and Kogarah centres. Together these employers comprise approximately 63 percent of total employment in Kogarah LGA. This suggests there is a lack of employment diversity in the LGA. Lack of employment diversity is not bad per se, but it does mean that Kogarah is more exposed to changes from single employers. Consultation indicated that the St George bank has signed up to another ten year lease and is not planning to change its operations in the short to medium term. There was also indication that the St George Public Hospital was planning expansion and that it would continue to grow in future years. The police stations in Hurstville and Kogarah should be expected to grow in line with population growth. The same could be surmised for the St George TAFE; although there is the very real possibility that online delivery of material will diminish the importance of bricks and mortar. The ATO building in Hurstville is a strategic employer (i.e. not providing services to the local population) and its future is unknown.

Kogarah Employment Lands and Economic Development Strategy 75
Self-containment and self-sufficiency rates are low Kogarah LGA has a low self-containment rate of 16.6 percent compared to other LGAs in the St George-Sutherland SSD. More than two-thirds (70.8 percent) of Kogarah’s residents are employed in the surrounding LGAs (Hurstville, Rockdale, Sutherland Shire and Botany Bay) and City of Sydney. To some extent this may reflect the trend of LGAs closer to the city experiencing lower self-containment rates, but it may also indicate that there are fewer opportunities for local employment in Kogarah or that there is a mismatch between the type of local employment and local skills. However, it is unlikely that the low self-containment is due to a mismatch between employment and skills as those working in ‘Finance and Insurance Services’ in the City of Sydney are the largest group exiting the LGA to work. On the other hand, despite the ‘Financial and Insurance Services’ being the second largest employer within Kogarah LGA (with 2,082 or 13.2 percent of local jobs), only 6.7 percent (250 jobs) of locals working in Kogarah are employed in this industry. This also indicates that approximately 88 percent of workers in this industry in Kogarah are coming from outside the LGA. The self-sufficiency rate of 23.5 percent in the Kogarah LGA is also lower than the other St George-Sutherland region LGAs. There are, in fact, more residents from the Sutherland Shire employed in Kogarah. Of those Kogarah LGA residents that are working within Kogarah 23 percent are employed in ‘Health Care and Social Assistance’, 11 percent are employed in ‘Professional, Scientific and Technical Services’ while eight percent are employed in ‘Construction’, ‘Retail Trade’ and ‘Accommodation and Food Services’, respectively. The Kogarah LGA has a relatively low share of home based workers and businesses Compared to other subregions, Kogarah has a lower level of home based work. The number of home based workers in Kogarah in 2006 represented 2.8 percent of the total employed residents in the LGA. This is slightly lower than the rate in St George-Sutherland SSD (3 percent) and also lower than the average share of 4.2 percent across the Sydney SD. The incidence of home based work is usually highest in areas that are distant from employment centres. This point is worth noting in relation to Kogarah’s proximate location to major employment areas, namely the Sydney CBD. The highest incidence of home based work occurs in the ‘Professionals’ occupation, with 35 percent of all home based workers being in this occupation. ‘Clerical and Administrative’ workers are the next highest percentage of at 29 percent and ‘Managers’ at 14 percent. In terms of industry, the highest level of home based work occurs in ‘Professional, Scientific and Technical Services’ at 23 percent followed by the ‘Construction’ industry at 10 percent. There is a strategic planning imperative from the local, regional and metropolitan documents to encourage home based businesses. Specifically Action E4.1 of the Metro Plan indicates that Councils should ‘rezone to allow work from home to reduce traffic congestion pressures’ (NSW Department of Planning and Infrastructure, 2010, p. 146).
Kogarah’s sectoral findings
Kogarah LGA serves a local convenience retail role Kogarah LGA serves a relatively limited retail role compared to neighbouring LGAs of Rockdale, Hurstville and Sutherland. In terms of retail, Kogarah LGA contains less than half the retail floorspace in ‘Specialty foods and meals out’, ‘Clothing & Footwear Stores’, ‘Bulky Goods Retailers’ retail categories than Rockdale and Hurstville LGAs. Kogarah also lacks a prominent food retailing precinct, such as an ‘eat street’ or night-time restaurant strip, particularly compared to the Hurstville LGA. Given the lack of retail floorspace for these categories compared to the Hurstville and Rockdale LGAs, the Kogarah LGA – and by implication the Kogarah Town Centre – has a more local role in the retail hierarchy of the St George-Sutherland region. Viewed in isolation, there appears to be an undersupply of higher order retail and supermarket retail in Kogarah. Considering the Kogarah LGA in a regional context, there is sufficient higher order retail floorspace in surrounding LGAs. Two to three additional supermarkets, depending on their size, could be supported in the LGA. The centres in neighbouring LGAs are accessible for most residents of the Kogarah LGA. For retail bulky goods, there is supply of retail bulky goods in Rockdale, Hurstville and the Sutherland LGAs that capture spend from the Kogarah LGA. In terms of restaurant strips and cluster, the part of Hurstville CBD in the Hurstville LGA contains a significant amount of food retail in the Westfield and along Forest Road.

Kogarah Employment Lands and Economic Development Strategy 76
Kogarah commercial office market is dominated by several big players and smaller suburban type tenants The St George Bank Headquarters in Kogarah Town Centre and the ATO office in Hurstville centre are major office employers in each centre. The location of the ATO office in Hurstville was a strategic decision (i.e. no strong link to the local population) not due to any favourable office market features, while the bank has a historical link to the region. Given the high amount of office floorspace and number of employees in the white collar sector, it is tempting to construe the Kogarah Town Centre as an attractive market for future office development. However, this conclusion should probably be resisted. Apart, from the St George bank there is relatively limited large office floorplates. ...but there are vacancies and weak demand Agent consultation indicated that despite there being a small number of A-grade spaces in Kogarah, a large portion of these are vacant with a very slow take-up rate for new space. Additionally, agents suggested that the relatively small size of the Kogarah Town Centre, lack of large regional catchment and limited retail offering are not attractive to major office developments. However, the amenity of the Kogarah Town Centre was suggested to be more favourable than the Rockdale Town Centre. Growth in employment in LGA is likely to be driven by the health, public administration and education The top three industries of forecast growth are expected to be ‘Health Care and Social Assistance’ (3,205 jobs), ‘Public Administration and Safety’ (803 jobs) and ‘Education and Training’ (432 jobs). These industries are local population servicing industries, with the exception of the ATO. The top three BLCs of forecast growth are expected to be Special uses (76,501 sqm - underpinned by health), Retail Mainstreet (21,297 sqm) and Dispersed uses (16,281sqm). There will be negative growth in urban services, light manufacturing and business park type uses The three BLCs expected to experience negative growth include Urban Services (-1,522 sqm), Manufacturing Light (-534 sqm) and Business Park (-37 sqm). Although the financial industry is currently a large employer, this is due to the location of the St George bank headquarters in Kogarah Town Centre. Consultation indicated that this use is self-contained and that there are no synergies flowing to other finance sector jobs in Kogarah from the presence of the headquarters. This is represented in the moderate forecast for this industry.
Kogarah’s employment precincts
Kogarah’s employment precincts have capacity to cater for the forecast future growth... Even under the low capacity (25 percent of maximum theoretical) and high growth (20 percent above base case) scenario there is capacity in the following precincts:
Allawah
Blakehurst
Carlton IA
Carss Park
Oatley
Ramsgate
Sans Souci
South Hurstville Industrial
South Hurstville Village This indicates that there are no strong pressures to expand these centres.
There are minor theoretical shortages in Carlton and Penshurst, but not sufficient to warrant any intensification or expansion of these precincts.

Kogarah Employment Lands and Economic Development Strategy 77
...but there are some precincts that might need to be considered for expansion Under the high growth, low capacity scenario the Kogarah Town Centre is facing the greatest shortage which is being driven by growth in medical industries. Hurstville is also facing a shortage driven by Dispersed uses. Should the shortage in Hurstville actualise and given that Dispersed uses are driving demand, it is likely that other precincts would be seen as relatively suitable substitutes. The Princes Highway Strip is also facing a shortage (albeit a minor one). Kogarah LGA could cater an additional two to three supermarkets There is demand for around 21,000 square metres of supermarket and grocery floorspace in the Kogarah LGA. Our land audit found that there is currently 13,472 supermarket and grocery floorspace. Hence, there is an ostensible undersupply of supermarket and grocery floorspace in the Kogarah LGA of around 7,500 square metres. This indicates that either some supermarket and grocery expenditure is currently being captured by surrounding LGAs or that this demand is being met by the exiting floorspace within the Kogarah LGA; which would be trading at higher turnover levels as a result. At any rate two to three additional supermarkets, depending on their size, could be supported in the LGA. Kogarah Town Centre is not an important higher-order retail destination, but serves important civic functions The Kogarah Town Centre is not a retail based centre like Hurstville CBD and Rockdale Town Centre. Both the Hurstville and Rockdale LGAs have a much stronger retail offer than Kogarah and it would be difficult to compete with these centres in attracting higher order retail development. Rather than being a major shopping destination, the Kogarah Town Centre is important as a health and education destination, as well as being a destination for office employment. However, there is the potential to attract more restaurants to stimulate the night-time economy in the Kogarah Town Centre. The amenity of the Kogarah Town Centre and presence of the hospitals and St George TAFE, as well as the local population indicate that the fundamentals are there for a night-time economy. In terms of office development, most demand is for medical suites and smaller locally-oriented professional tenants, such as accountants and legal firms. There is not a strong market for new office development and Kogarah is not as prominent in the office market as Hurstville centre (Hurstville LGA section). Nevertheless, Kogarah Town Centre is a more attractive proposition for office development than Rockdale centre. Growth in Kogarah Town Centre is likely to be driven by future hospital expansions and other medical uses. Smaller centres serve a local convenience role The smaller centres in Kogarah including Allawah, Carlton, Carss Park, Oatley, Penshurst, Ramsgate, Sans Souci and South Hurstville Village all provide convenience retail and serve relatively small local catchments. Carss Park, Sans Souci, Ramsgate and South Hurstville Village are car-based and centred on major traffic thoroughfares, whereas Allawah, Carlton, Penshurst and, to a lesser extent, Oatley are served by train stations and their surrounding neighbourhoods. The smaller centres are characterised by a number of smaller fragmented landowners, which may create issues for future development. Carlton industrial area is the primary industrial precinct in Kogarah LGA Carlton industrial area is the primary industrial precinct in the LGA, with smaller industrial areas in South Hurstville and Blakehurst as well as isolated light industrial uses scattered around the LGA. The Carlton industrial area comprises automotive services, warehousing and some light manufacturing. The subregional strategy indicates that Carlton, Blakehurst and South Hurstville are ‘Category 1’ industrial areas and should be retained for industrial purposes (NSW Department of Planning, 2007, p. 30)

Kogarah Employment Lands and Economic Development Strategy 78
The Princes Highway has potential to be an enterprise corridor... The Princes Highway contains clusters of retail uses interspersed along the corridor, mainly on the northern side, between Jubilee Oval to the North and Carss Park in the south. Some of these are in residentially zoned land. From a strategic planning perspective there is an imperative to consolidate and expand existing retail along major transport corridors to create enterprise corridors. The legitimacy of enterprise corridors as employment lands is based on their function to cater to retail type uses that are not suited to centres, such as those requiring a very large floorplate and access for large trucks. The King Georges Road and Rocky Point Road were considered unsuitable for enterprise corridor uses as most existing commercial clusters already had relevant commercial zones and those uses that were zoned residential were too few and isolated to form a corridor. ...but retail floorspace would only be feasible is provided in a mixed-use development However, feasibility testing and agent consultation indicates for retail space in enterprise corridors to be feasible it would need to be provided as mixed-use development; where the residential component effectively subsidises the retail floorspace.
Other issues
Lack of carparking in centres was seen as an important issue The availability of carparking in Kogarah Town Centre and Hurstville CBD (Kogarah LGA portion) was identified as an issue. There is a perception that the lack of available car parking in Kogarah’s centres (especially the Kogarah Town Centre) has inhibited their growth. It was also argued that the St George TAFE and the hospitals might be inhibiting the development of retail and other uses in Kogarah, given that they absorb much of the available carparking. However, as mentioned in the Sectoral findings above, centres in Kogarah LGA serve a local convenience role and, regardless of parking availability, they will unlikely compete with the higher order retail in centres such as Hurstville and Rockdale. The Kogarah Town Centre Parking Study was commissioned by Council and completed in 2008. Council has implemented a number of the recommendations from the report, and is working closely with both the Public and Private Hospitals in an attempt to alleviate some of the issues related to parking. The FSR or carparking controls in South Hurstville Village and the potential Princes Highway corridor are currently inhibiting viable development The development controls applying to built-form in commercial and industrial areas in Kogarah are very comprehensive. The heights and setbacks are often applied at a lot level, indicating that a substantial amount of research has contributed to the development of these plans. Our feasibility testing indicated that feasible development cannot be achieved under the current FSR and carparking controls. Consultation indicated that the low FSR limits in the planning controls (Interim DCP No. 2) for South Hurstville Village were discouraging development in this centre. Our feasibility testing indicated that the carparking controls were the most prohibitive control on development; a problem which is not unique to the Kogarah LGA. The perception that the Hurstville CBD and Kogarah Town Centre are not safe, particularly in the evenings There was a perception raised during consultation that Kogarah and Hurstville Centres are not safe in the evenings. Addressing the perceptions of the Kogarah Town Centre as being unsafe will be important to reinforcing the centre as a pedestrian friendly environment. However, the Council indicated that surveys and crime statistics prove that this perception does not reflect the actual safety levels and that there are a number of strategies in place that successfully address any issues as they arise.

Kogarah Employment Lands and Economic Development Strategy 79
9.2 Strategies and actions
This section involves the distillation of study findings into priorities and initiatives for planning and economic development. The principal economic development and planning themes have been framed into broad strategies and detailed actions. In developing the strategies and actions, key considerations have included:
competitive strengths
locational and infrastructure issues
optimising the economic potential of key sectors
compatibility with local/regional planning objectives
ways to support, attract and grow business investment
potential relationships between key stakeholders
social and environmental sustainability of the economy
protection and enhancement of unique lifestyle attributes, and
promotion of appropriate home-based business activity. A key assessment criterion in developing the actions has also been the extent to which Council can realistically ‘make a difference’. The following timeframes have been used:
Immediate: 0 to 6 months
Short term: 6 months to 2 years
Medium term: 2 to 5 years As a monitoring mechanism, the Council could use the audit data as a platform on which ‘real time’ data from DAs and occupancy certificates could allow for constant updating on Council employment lands and for tracking of any changes to supply and precinct character.
Strategy 1: Translate zones into Standard Instrument zones
The current zones for the employment precincts need to be translated into the Standard Instrument LEP (SILEP) zones. The recommendations are made based on the quantitative evidence from the market assessment, and the qualitative information gleaned from consultation and the planning policy review. A summary of the recommendations for each precinct are below. For a more detailed rationale outlining the changes to the zones see Appendix 1. The Kogarah City Council has already made changes to the zones based on a translation of the current zone to the relevant SILEP zone. For the most part, SGS’ recommendations are in line with those made by the Council. Where our recommendations vary from the Council’s, they have been highlighted in red below. Allawah
Current zone: Business 3 (a)
Proposed zone: B2 Local Centre Blakehurst
Current zones: Industrial 4 (a) & Business 3 (a)
Proposed zone: IN2 Light Industrial, B1 Neighbourhood Centre and B5 Business Development
Carlton
Current zone: Business 3 (a)
Proposed zone: B2 Local Centre Carlton IA
Current zone: Industrial 4 (a)
Proposed zone: IN2 Light Industrial Carss Park
Current zone: Business 3 (a)
Proposed zone: B1 Neighbourhood Centre
Hurstville Town Centre (Kogarah LGA portion)
Current zone: Business 3 (b)
Proposed zone: B4 Mixed Use Kogarah Town Centre
Current zones: Business 3 (b) & Special Uses 5 (a)
Proposed zones: B4 Mixed Use
Oatley
Current zone: Business 3 (a)
Proposed zone: B2 Local Centre Penshurst
Current zone: Business 3 (a)
Proposed zone: B2 Local Centre Princes Highway corridor
Current zones: Business 3 (a) & Residential 2 (a)
Proposed zone: B6 Enterprise Corridor

Kogarah Employment Lands and Economic Development Strategy 80
Ramsgate
Current zone: Business 3 (a)
Proposed zone: B2 Local Centre Sans Souci
Current zone: Business 3 (a)
Proposed zone: B2 Local Centre
South Hurstville Industrial
Current zone: Industrial 4 (a)
Proposed zone: IN2 Light Industrial South Hurstville Village
Current zone: Business 3 (a)
Proposed zone: B2 Local Centre
Strategy 2: Consider changes to the FSR and carparking controls
Our feasibility testing indicated that the lower FSR of 1:1 is not currently feasible. The FSR of 1.5:1 did provide scenarios that were closer to breaking-even, yet did still not produce a feasible outcome. Our modelling corresponds with advice from local agents that suggests the current FSR of 1:1 at South Hurstville Village is not feasible. The most significant hurdle to development in our testing was carparking rates, rather than the FSR controls. The problem of underground carparking negatively affecting the feasibility of development is not one that is unique to Kogarah LGA, but is common to urban development across metropolitan Sydney. The development equation in centres across the LGA is currently unfeasible under the current FSR and carparking controls. Therefore, higher FSR controls should be considered for both these precincts. Action 2.1: Consider higher FSR controls for the potential enterprise corridor and South Hurstville Village
For both the Princes Highway corridor and South Hurstville Village an FSR of 2:1 should be feasible
While SGS has not tested other employment areas for the feasibility of FSR controls, assuming similar market conditions, the above FSR suggestions could also be contemplated for these precincts
To attract investment it is important to provide certainty of outcomes, sending clear signals to the market in the form of guidelines or benchmarks. It may however be a more pragmatic outcome for the Council to work with the community and developers in identifying optimal building envelopes, which may have varied heights, depending on individual site's capabilities. In any case, changes to the FSR controls should be conducted with one eye on feasibility and another on urban amenity and overshadowing impacts. Action 2.2: Council should give consideration to reviewing the current car parking controls The current carparking rates in a number of centres across the LGA are inhibiting feasible development. Although SGS hasn’t tested other precincts or centres, it is likely that the carparking rates in these centres are making it difficult for development to ‘stack-up’. There are a number of options that the Council could take, with some more complex than others. SGS has outlined some of these approaches below.
Lowered or maximum parking rates, particularly in those locations with very good access to public transport.
‘Decouple’ the provision of parking from particular developments.
Centralised and/or decoupled parking arrangements would aid renewal in centres that typically feature smaller allotments which are difficult to develop under conventional models with basement parking. Centres with council owned land (and specifically at-grade car parks) would be ideally suited to innovative parking schemes. Separating parking also provides diversity by making the packaging of housing and parking or office and parking optional, rather than compulsory.
Shared parking
Provide alternative options to developers of commercial and retail including:
Provide on-site the full parking requirement (possibly net of ‘parking credits’);
Provide all or part of the parking off-site to the council’s satisfaction;
Pay ‘cash-in-lieu’ or contributions at a rate set down in a development contributions plan for any shortfall in car spaces.
Local Parking Plan A Local Parking Plan could be developed that enables a ‘parking requirement’ to be set for a particular area or sub-area. Such a requirement is able to reflect:

Kogarah Employment Lands and Economic Development Strategy 81
The parking demand for a particular use
The mix of land uses currently in the area, and the predicted changes in land use types into the mid-term future
The availability of publicly-available parking in the area
The likely effects of a particular use-type on aggregate parking demand within the area
Council policy initiatives with respect to parking policy such as:
lowering of parking requirement rates to promote development or redevelopment
having differential parking rates for separate areas to reflect policy
having differential parking rates for separate areas to reflect different levels of public transport use or accessibility
having differential parking rates for separate areas to reflect different levels of publicly available off-street parking.
A parking plan can require a lower supply requirement rate in, say, a core area, while maintaining a higher rate for the non-core area, which may in turn be lower than the general or standard rate. The policy basis of such an arrangement could be the efficiencies gained through shared parking related to uses with different temporal profiles, or the impact or availability of publicly available off-street parking.
Strategy 3: Support and expand the medical cluster in the Kogarah Town Centre
This strategy is based by the forecast shortage of medical based employment lands in the Kogarah Town Centre and is also supported by the Subregional Strategy – Action E2.5 to ‘strengthen clusters of activity in specialised centres’. The specialised health facilities in the Kogarah Town Centre, including the St George Private and Public Hospitals and other allied health suites, attract visitors from within and outside of the Kogarah LGA. These visitors contribute to the local economy. Developing the existing medical cluster in the Kogarah Town Centre can ensure that the agglomeration benefits associated with cluster development are maximised, and that flow-on effects to the local economy occur through local retail and business services. Providing additional lands for this use will accommodate anticipated growth in this industry over the next 25 years. Action 3.1: Facilitate expansion of medical related activities in the block surrounded by Short and Chapel Street to the south of the hospital SGS is aware that the hospital currently owns much of this land and that its masterplan has earmarked this area for future intensification. The Kogarah City Council should continue to work proactively with the hospitals to facilitate high density development of this area. While standard residential development is not encouraged in this area, residential accommodation that supports the hospital should be permissible. DCP controls should be developed to identify preferred uses on the site. Timeframe: Short to medium term Action 3.2: Facilitate expansion of medical related activities by encouraging these uses to the north of the hospitals in the block surrounded by South, Hogben and Montgomery Streets The area identified by red outline in Figure 25 represents some of the last lots near the hospitals that have capacity for future expansion. SGS has been made aware that the hospital, as a part of their masterplan, intends to expand to the north of South Street. Again, the Kogarah City Council should continue to work proactively with the hospitals to facilitate high density development of this area. While standard residential development is not encouraged in this area, residential accommodation that supports the hospital should be permissible. While standard residential development is not encouraged in this area, residential accommodation that supports the hospital should be permissible. DCP controls should be developed to identify preferred uses on the site.

Kogarah Employment Lands and Economic Development Strategy 82
FIG URE 25. POTENTI AL AR EAS FO R MED IC AL FAC IL I T Y EXPANSIO N
Source: Google Earth, 2013; SGS, 2013.
Timeframe: Short to medium term Action 3.3: Earmark other sites for future medical uses Investigate opportunities for further medical activity hubs nearby the hospital sites. A key candidate would be the Uniting Church site bordered by Kensington and Gray Street and Kensington and Post Office Lane. Timeframe: Medium term
Strategy 4: Consolidate the role of Kogarah Town Centre as a vibrant, pedestrian friendly retail precinct
The Subregional Strategy emphasises the importance of supporting increased commercial and retail activity in the Kogarah Town Centre as well as the significance of supporting a vibrant night-time economy. Kogarah Town Centre won’t be able to compete with Rockdale or Hurstville centres for higher order retail shopping, but there is potential to consolidate the current retail function of the centre. There are limited opportunities for the expansion of the centre boundaries, with physical barriers such as the rail line and Princes Highway to the western and eastern boundaries and residential interface issues to the north and south. An important factor here will be to identify renewal opportunities for further intensification of commercial uses. Continuing to address perceptions of safety is also another important element in reinforcing the pedestrian friendly aspect of the centre. Action 4.1: Council to encourage transition of sites for major redevelopment There is a lack of undeveloped and under-developed sites in the Kogarah Town Centre. Redevelopment of the available sites would:
build critical mass
help to enhance the local amenity
promote the sense of place of Kogarah Town Centre as a retail destination, The candidate sites here are the triangle site on Gray Avenue and the lower value retail strip along the south-eastern side of Railway Parade between Gray and English Streets. The Council already allows for retail uses in these old industrial areas.

Kogarah Employment Lands and Economic Development Strategy 83
Triangle site Although just to the south-east of the Kogarah Town Centre, the triangle site is an important site for future development due to its size and exposure. Given its large size, it is a good candidate for large floorplate retail uses such as bulky goods retail, supermarket or other specialty retail uses. Retail-only uses would be ideal for this site, but some ancillary residential could be allowed to improve the viability of development. Residential should not, however, be allowed to dominate the site. Medical uses could also be encouraged on this site to fulfil Strategy 3. Southern retail strip The strip along the south-eastern side of Railway Parade, between Gray and English Streets, is another area that could be transitioned to a higher retail use. It currently contains light industrial type uses. There are already existing prominent restaurant uses along this strip, including the RSL and Chelseas restaurant, and there appears to be adequate parking on the northern side of Railway Parade to facilitate access. Higher density mixed-use development could be allowed to achieve feasible commercial development in this strip. Bonus FSRs could be considered for consolidation of lots. Both the triangle and Railway Parade strip precincts are strategically located to provide a retail support role to the KTC and are ripe for redevelopment. Indeed, the triangle site is important within the LGA and across the region as one of the few large under-developed sites remaining. While the market dynamics may not be currently supporting commercial development on the triangle site or the southern retail strip, this development equation will likely change over time. Therefore, it is important that the Council ‘hold the line’ and ensure that commercial uses are the predominate ones given the sites potential for a centre support role. Timeframe: Short term Action 4.2: Continue to improve safety in Kogarah Town Centre It is important for the Council to continue to address safety concerns and ensure the pedestrian friendly role of the centre is reinforced. Continued implementation of Council’s Safety Plan in the Kogarah Town Centre will be an important element in addressing this concern. Timeframe: Short to medium term Action 4.3: Improve legibility in the KTC by providing clear and direct connections through the CBD. It is recommended that this encompass development of a signage strategy. Signage throughout the whole CBD could be improved to ensure better/clearer pedestrian pathways and linkages between major destinations and origins in the CBD such as the train station, bus stops, Kogarah Town Square Library and Cultural Centre and the Public and Private Hospitals. Signage could also be used to highlight the shopping and dining areas of the centre. Locating signs at ‘decision points’, such as major trip origins, destinations as well as areas that there are no clear landmarks, may help to capture passing trade or escape expenditure in the Kogarah Town Centre. The following ‘decision points’ could be considered:
major trip origins – car parks, train station, bus stops
major destinations – the hospitals, TAFE, St George bank, Kogarah Town Centre shopping centre, etc.
areas where there are no clear wayfinding points – in between origins and destinations, where there are no obvious landmarks
Signage at major carparks or at the hospital sites themselves may be useful in highlighting the retailing possibilities in the KTC and hence promote incidental trips and assist in capturing higher levels of trade from visitors to the hospitals. An analysis of pedestrian flows in the town centre would be useful to provide the empirical evidence for possible signage locations.

Kogarah Employment Lands and Economic Development Strategy 84
FIG URE 26. S IG NAGE ST R ATEGY E X AMPL ES
Source: Visual Voice, 2010.
Successful signage / wayfinding strategies have been implemented in:
Parramatta
Maribyrnong
Whitehorse
Bunbury
Ballarat Timeframe: Short to medium term
Strategy 5: Create an Enterprise Corridor zone along the Princes Highway
This strategy focuses on creating Enterprise Corridor on the part of the Princes Highway on the north-western side between Jubilee Avenue and Plant Street. The B6 zone should allow bulky goods and mixed-use development as permissible uses. Action 5.1: Create a B6 Enterprise Corridor zone on part of the Princes Highway
Create a B6 Enterprise Corridor zone on Princes Highway between Jubilee Avenue and Plant Street on the north-western side of Princes Highway (excluding those excising clusters of residential). This will ensure that bulky goods retail is clustered at a highly accessible location within close proximity to the Major Centre. It will also reinforce the existing bulky goods and mixed business cluster along this strip. Residential uses may be permissible with consent in this zone, but ideally should be setback from the road corridor.
Timeframe: Immediate to short term
Strategy 6: Protect existing industrial land
Kogarah’s industrial areas area characterised as being ‘local service’ industrial areas. In this regard they have a role both in providing industrial services for other businesses and the local population. It is important that these lands are zoned appropriately and are accessible to a large population. Action 6.1: Ensure there are complying uses in the industrial zones, but also allow for flexibility
Retail and office uses should only be permitted as ancillary to industrial development.
Industrial zones should be kept relatively flexible to allow for a range of uses. This will allow the transition from light manufacturing and automotive uses to warehousing and other logistics uses.
Kogarah Employment Lands and Economic Development Strategy 85
Timeframe: Immediate
Strategy 7: Encourage home based businesses
This strategy is aimed at encouraging an environment conducive to home based businesses and those working from home. Home based work does not appear to be a temporary state of business operation. The attraction of home based work is flexibility in work hours and the avoidance of a commute to work. Home-based work is also attractive to mature age and disabled workers, and can therefore promote benefits linked to increased workforce participation, and enhanced social capital, among these groups. In terms of facilitating home-based work, provided that ‘home occupation’ and/ or ‘home business’ are permissible in the appropriate residential areas, there is little else that can be done to facilitate home-based work in residential zones. In the Standard Instrument ‘home occupation’ involves only residents of the dwelling, whereas ‘home business’ can involve up to two non-residents. The commercial design section of the Kogarah Commercial and Industrial Lands DCP includes performance criteria for home office uses focused on designing apartments to facilitate and encourage opportunities for occupants to work from home. They include:
clearly identify the home office area, ideally by designing it so that it can be closed off from the rest of the apartment. The design should be sufficiently flexible to allow later or alternate use as part of the residence
ensure that home office needs including storage, additional telephone and electrical capacity, and task lighting can be met
windows may not be used for the display of goods or merchandise (Kogarah LGA, 2010). However, these controls only focus on home offices. Action 7.1: Ensure planning controls allow for Home Based Work and Home Based Business
Ensure that residential zones in the LEP do not prohibit potential home businesses in designated residential areas. ‘Home occupation’ and/ or ‘home businesses’ should be permissible in appropriate residential areas.
Ensure that local centre zones in local/village centres permit the development of business supporting services for home based businesses.
Timeframe: Short to medium term Action 7.2: Facilitate the establishment of a network of Home Based Businesses Business incubation is one means through which the growth and development of small businesses can be supported. St George and Sutherland Shire Business Enterprise Centre currently operate business training services. The Council should engage with this organisation to determine if there are any synergies that can be created using Council’s resources. This could include encouraging the provision of local meeting rooms, having information sessions from Council explaining how local controls create opportunities for home based businesses and the type of activities that are permissible and prohibited. Timeframe: Short to medium term
Strategy 8: Build relationships and partnerships between key stakeholders and Council
Although consultation revealed that the Council had a good working relationship with various business stakeholders there may be the possibility to engage more proactively with stakeholders. Action 8.1: Consult with relevant business stakeholders when developing plans Council should consult with relevant business stakeholders when plan making to ensure greater stakeholder ownership of planning processes occurring in the LGA.

Kogarah Employment Lands and Economic Development Strategy 86
Timeframe: Ongoing
Action 8.2: Actively engage with the business community
Consider holding meetings with business stakeholders, as required to allow them to be a part of the urban conversation and raise any planning or economic development issues as they arise.
Consider collecting and disseminating planning and economic information to key business stakeholders. Timeframe: Ongoing

Kogarah Employment Lands and Economic Development Strategy 87
10 REFERENCES
Access Economics. (August 2010). The NSW economy in 2020: A foresighting study. AEC Group. (2010). Southern Sydney Regional Profile. NSW, Australia: NSW Industry & Investment. Australian Government. (2012). Assistance for industry. Retrieved July 30, 2012, from Clean Energy Future: http://www.cleanenergyfuture.gov.au/ BIS Shrapnel. (2012, July). Long term Forecasts 2012-2027, 38th Ed. Department of Planning. (2006). draft South subregional Strategy. Department of Urban Affairs and Planning. (2001). Integrating Land Use and Transport – The Right Place for Business and Services Planning Policy. DP&I. (2010). Metropolitan Plan for Sydney 2036. NSW Department of Planning and Infrastructure. Forrester Research. (2011). Australian Online Retail Forecast, 2010 to 2015. Hill PDA. (2006, August). St George Economic and Employment Strategy. Sydney, NSW, Australia: Hill PDA. Kogarah City Council. (2012). Expression of Interest for the Preparation of an Economic Development & Employment Lands Strategy. Kogarah City Council. Lawrence Consulting. (2012, May). City of Kogarah Economic & Demographic Profile 2012: Draft. Macquarie Equities Research. (2011, July 5). Consumer Sector: Internet Hype. NSW Department of Planning and Infrastructure. (2010). Metropolitan Plan for Sydney 2036. NSW, Australia: NSW Department of Planning and Infrastructure. NSW Department of Planning. (2007, November). South Subregion Draft Subregional Strategy. NSW, Australia: NSW Department of Planning. Productivity Commission. (2011). Economic Structure and Performance of the Australian Retail Industry, Report no. 56. Canberra. Reich, R. (1991). The Work of Nations. London: Vintage. SESIAHS. (2010, June 16). About St George. Retrieved August 15, 2012, from South Eastern Sydney Illawarra Area Health Service: http://www.sesiahs.health.nsw.gov.au/sgh/about_sgh/index.asp SGS Ecomomics and Planning. (2007, July). Promoting Sound Principles in Planning for Economic Development. Urbecon . SGS Economics and Planning. SGS Economics and Planning. (2008). How councils can make a difference in economic development by nurturing the pre-condictions for a prosperous community. Australian Planner , pp. Vol. 45, No. 1. Wood, S. S. (2012, June). Maintaining town centre vitality in competitive environments: pedestrian movements, land-use and built-form in Armidale and Tamworth, NSW. Australian Planner, Vol. 49, No. 2 , 172-187.

Kogarah Employment Lands and Economic Development Strategy 88
APPENDIX 1: PRECINCT BY PRECINCT ANALYSIS
Introduction
This section of the report describes the role and function, current land use, current and recommended zone/s of the study precincts9. A brief summary of noteworthy physical characteristics and land uses is provided for each of the centres. The demand available capacity up to 2036 for each centre is indicated. Any niche roles are identified and suggestions are made regarding the future focus of each centre. The study centres are:
Allawah
Blakehurst
Carlton
Carlton Industrial Area
Carss Park
Hurstville CBD (Kogarah LGA portion)
Kogarah Town Centre
Oatley
Penshurst
Princes Highway Strip
Ramsgate
Sans Souci
South Hurstville Industrial
South Hurstville Village
9 In some locations, commercial uses on residential zoned land have been identified where those uses are deemed to form part of
a centre or are large enough to be a centre by themselves. Commercial uses on residential land that have not been identified as a part of a centre were omitted due to their lack of connection or isolation from a centre.

Kogarah Employment Lands and Economic Development Strategy 89
Precincts
Allawah
Current Zone – Business 3 (a) Recommended Zone – B2 Local Centre
Description Allawah is a local centre located on the southern side of Railway Parade between Carlton and Hurstville centres. It's only recorded land use is Retail Mainstreet, with around 3600 square metres of floorspace. It serves a local convenience retail niche which includes convenience food and grocery, retail services and hospitality options including takeaway and a hotel. Under a higher growth scenario it is expected to cater to an additional 600 square metres of retail floorspace. Using conservative supply assumptions, which assume only 25 percent of the maximum development potential will be used for employment purposes, Allawah is likely to have capacity up to 2036. Therefore, this precinct is will continue its local service role without any significant changes to the existing planning controls.
The centre is currently zoned Business 3 (a). It is recommended to zone this area to B2 Local Centre to continue to serve the local population's retail needs. Shop top housing should be a permissible use.
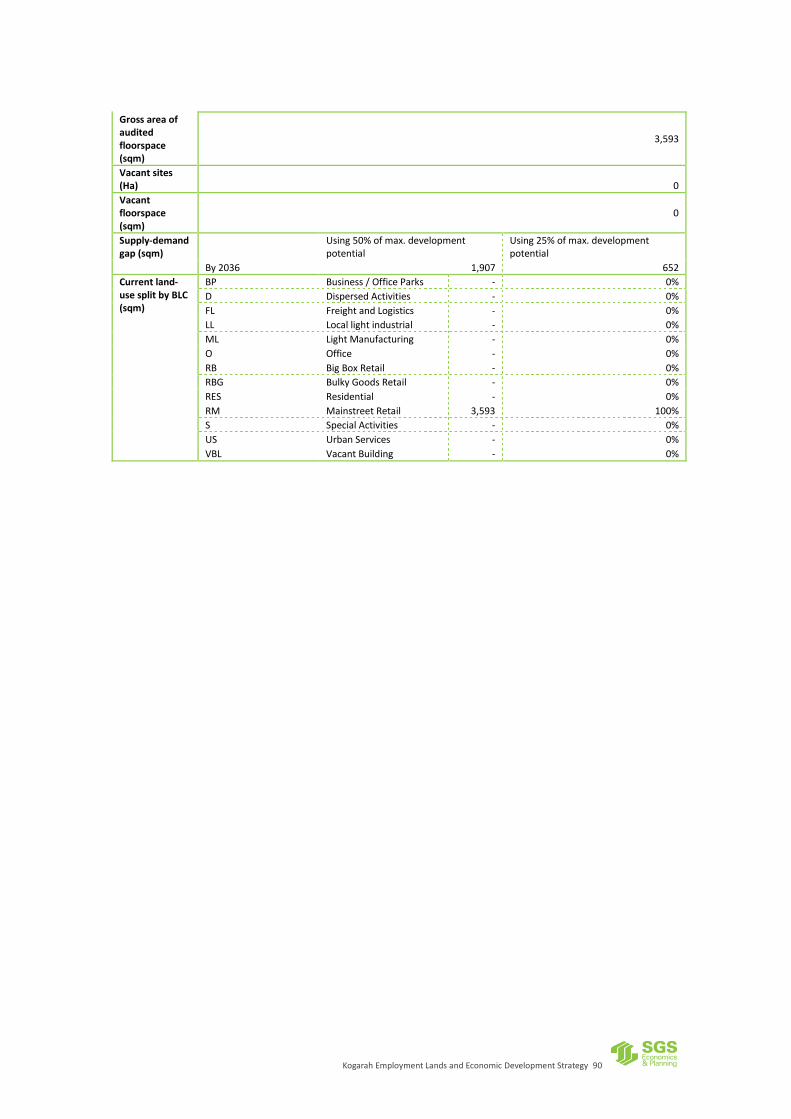
Kogarah Employment Lands and Economic Development Strategy 90
Gross area of audited floorspace (sqm)
3,593
Vacant sites (Ha) 0
Vacant floorspace (sqm)
0
Supply-demand gap (sqm)
Using 50% of max. development potential
Using 25% of max. development potential
By 2036 1,907 652
Current land-use split by BLC (sqm)
BP Business / Office Parks - 0%
D Dispersed Activities - 0%
FL Freight and Logistics - 0%
LL Local light industrial - 0%
ML Light Manufacturing - 0%
O Office - 0%
RB Big Box Retail - 0%
RBG Bulky Goods Retail - 0%
RES Residential - 0%
RM Mainstreet Retail 3,593 100%
S Special Activities - 0%
US Urban Services - 0%
VBL Vacant Building - 0%

Kogarah Employment Lands and Economic Development Strategy 91
Blakehurst
Current Zone –Industrial 4 (a) & Business 3 (a)
Recommended Zone – IN2 Light Industrial, B1 Neighbourhood Centre and B5 Business Development
Description Blakehurst is fragmented into three separate areas on King Georges Road and the Princes Highway that surround Mater Dei Church and Primary School. It is a mixed-business centre with light industrial (5505 sqm) and bulky goods (5491 sqm) uses on the north-eastern side of King Georges Road (as well as some minor industrial fronting Heath Road), as well as a retail strip (3,150 sqm) along the south-western side of Princes Highway. It is strategically located in the centre of the Kogarah LGA with accessibility to high volumes of traffic on both King Georges Road and the Princes Highway. Under a higher growth scenario there is expected to be demand for an additional 891 square metres of mainstreet retail floorspace, 820 square metres retail bulky goods floorspace and 689 square metres light industrial floorspace. Based on conservative supply assumptions this precinct will have capacity up to 2036.
Blakehurst currently serves a range of functions including convenience retail, bulky goods, light industrial, suburban offices and some medical uses as well as a school. The centre could continue to focus on providing retail and industrial services. However, there is an opportunity for the centre to transition to higher intensity retail uses given its strategic location. A change of character in the precinct would likely see the existing industrial uses on King Georges Road shift to the Carlton Industrial Area. Potential interface and traffic issues could arise with the transitioning of this centre and so these should be circumvented by detailed planning controls in a DCP.
If a continuation of current uses is preferred by Council, then it is recommended to zone the existing 4 (a) portion of this centre to IN2 Light Industrial, the 3 (a) portion to B1 Neighbourhood Centre and the non-conforming commercial uses on the eastern side of the Princes Highway (currently in a residential zone) to B5 Business Development. Alternatively, given there isn’t a significant undersupply of floorspace, the Council could allow the non-conforming uses to turnover to residential development. If the Council wants to transition the precinct to a higher order retail centre then the above recommendations still stand, with the exception that the existing 4 (a) portion on King Georges Road and Princes Highway be converted into B5 Business Development or a Mixed Use B4 zone. Specific uses that should be encouraged in the B5 zone include: Bulky goods premises; Child care centres; Garden centres; Hardware and building supplies; Landscaping material supplies; Passenger transport facilities; Respite day care centres; Warehouse or distribution centres
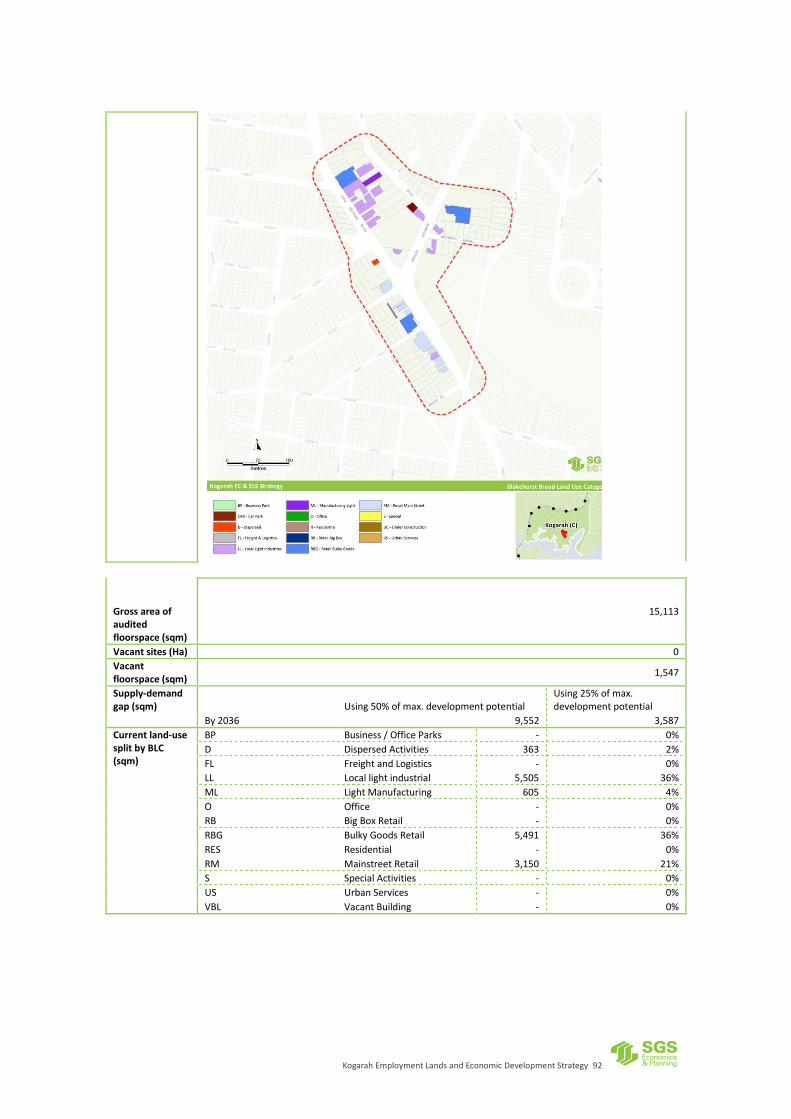
Kogarah Employment Lands and Economic Development Strategy 92
Gross area of audited floorspace (sqm)
15,113
Vacant sites (Ha) 0
Vacant floorspace (sqm)
1,547
Supply-demand gap (sqm) Using 50% of max. development potential
Using 25% of max. development potential
By 2036 9,552 3,587
Current land-use split by BLC (sqm)
BP Business / Office Parks - 0%
D Dispersed Activities 363 2%
FL Freight and Logistics - 0%
LL Local light industrial 5,505 36%
ML Light Manufacturing 605 4%
O Office - 0%
RB Big Box Retail - 0%
RBG Bulky Goods Retail 5,491 36%
RES Residential - 0%
RM Mainstreet Retail 3,150 21%
S Special Activities - 0%
US Urban Services - 0%
VBL Vacant Building - 0%

Kogarah Employment Lands and Economic Development Strategy 93
Carlton
Current Zone – Business 3 (a) Recommended Zone – B2 Local Centre
Description Carlton is a small local centre located on the southern side of Railway Parade between Allawah and Kogarah centres. It is a local convenience centre dominated by mainstreet retail uses (6,414 sqm) with some dispersed uses (446 sqm. Carlton currently provides a range of functions including convenience retail, takeaway, suburban offices, medical uses as well as a large gym. Under a higher growth scenario there is expected to be demand for an additional 1575 square metres of mainstreet retail floorspace. Based on conservative supply assumptions this precinct is likely to reach capacity around 2036. Carlton should continue to accommodate additional retail uses in the future to consolidate its local centre retail function.
The centre is currently zoned Business 3 (a). It is recommended to zone this area to B2 Local Centre to continue to serve the local population's retail needs. The forecast shortage up to 2036 is only a minor one and does warrant any major changes to the controls at this stage. Shop top housing should be a permissible use.

Kogarah Employment Lands and Economic Development Strategy 94
Gross area of audited floorspace (sqm)
7,037
Vacant sites (Ha) 0
Vacant floorspace (sqm)
175
Supply-demand gap (sqm)
Using 50% of max. development potential
Using 25% of max. development potential
By 2036 1,241 -279
Current land-use split by BLC (sqm)
BP Business / Office Parks - 0%
D Dispersed Activities 446 6%
FL Freight and Logistics - 0%
LL Local light industrial - 0%
ML Light Manufacturing - 0%
O Office 176 3%
RB Big Box Retail - 0%
RBG Bulky Goods Retail - 0%
RES Residential - 0%
RM Mainstreet Retail 6,414 91%
S Special Activities - 0%
US Urban Services - 0%
VBL Vacant Building - 0%

Kogarah Employment Lands and Economic Development Strategy 95
Carlton Industrial Area
Current Zone – Industrial 4 (a) Recommended Zone – IN2 - Light Industrial
Description Carlton industrial area is the largest industrial precinct in the Kogarah LGA. Its primary function is Local Light industry (38,751 sqm), with Light Manufacturing (16,224 sqm) and Business Park (2,297 sqm) uses. There is a heavy concentration of car repair and servicing businesses. Consultation indicated that there is an increasing presence of warehousing uses replacing older industrial uses such automotive uses. The area is located between the Princes Highway and King Georges Road, although does not have frontage to either. Under a high growth scenario there is expected to be demand for an additional 1231 square metres of Local Light Industrial and Business Park (355 sqm) floorspace. Using conservative supply assumptions this precinct will likely have considerable capacity up to 2036. It is likely that this precinct will continue its local automotive repair and parts manufacturing function, with an increasing role of warehousing. Currently, Carlton Industrial Area has a high vacancy rate of 16.8 percent.
It is recommended to zone this area to IN2 Light Industrial, as the precinct is envisaged to continue its local servicing role for established residential community. No other substantial changes are required.
z
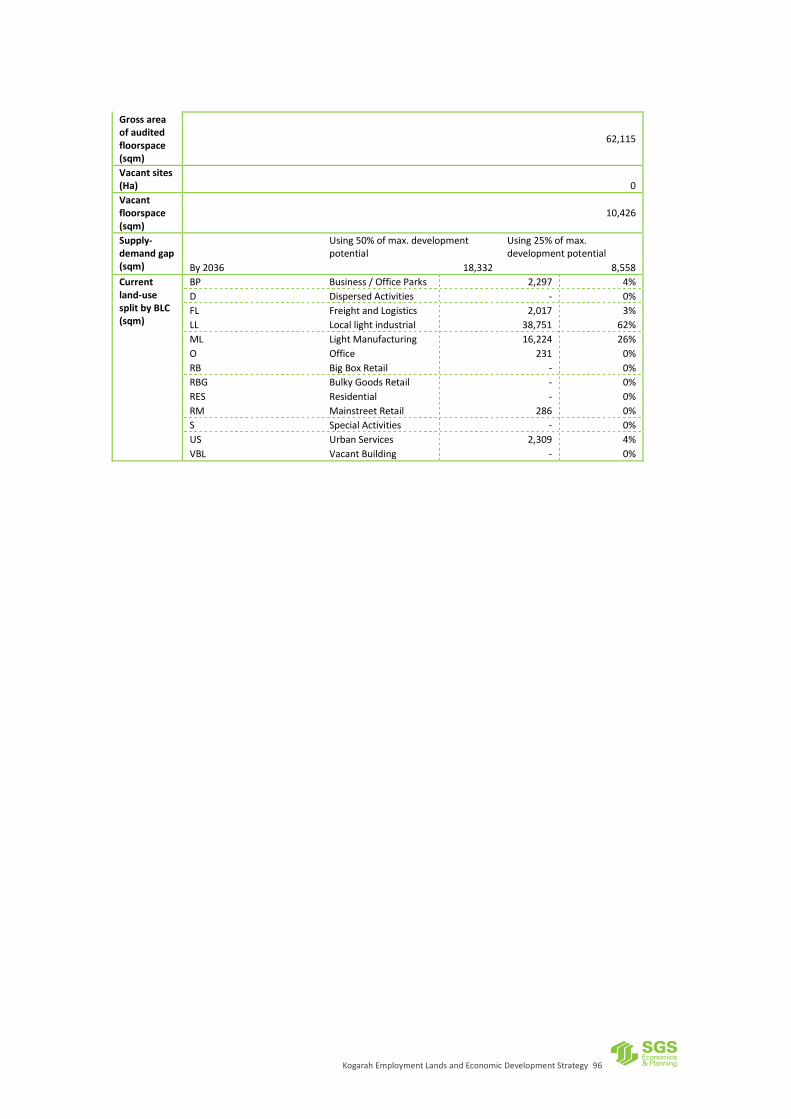
Kogarah Employment Lands and Economic Development Strategy 96
Gross area of audited floorspace (sqm)
62,115
Vacant sites (Ha) 0
Vacant floorspace (sqm)
10,426
Supply-demand gap (sqm)
Using 50% of max. development potential
Using 25% of max. development potential
By 2036 18,332 8,558
Current land-use split by BLC (sqm)
BP Business / Office Parks 2,297 4%
D Dispersed Activities - 0%
FL Freight and Logistics 2,017 3%
LL Local light industrial 38,751 62%
ML Light Manufacturing 16,224 26%
O Office 231 0%
RB Big Box Retail - 0%
RBG Bulky Goods Retail - 0%
RES Residential - 0%
RM Mainstreet Retail 286 0%
S Special Activities - 0%
US Urban Services 2,309 4%
VBL Vacant Building - 0%

Kogarah Employment Lands and Economic Development Strategy 97
Carss Park
Current Zone –Business 3 (a) Recommended Zone – B1 Neighbourhood Centre
Description Carss Park is a small neighbourhood centre located just off the eastern side of the Princes Highway, north of Blakehurst centre. Retail Mainstreet (1273 sqm) is the most common land use in the area. It serves the surrounding local neighbourhood and passing highway traffic.
Under a higher growth scenario there is expected to be demand for an additional 215 square metres of mainstreet retail floorspace. Using conservative supply assumptions this precinct will likely have capacity up to 2036. Therefore, this precinct is will continue its local service role without any significant changes to the existing planning controls.
It is recommended to zone this area to B1 Neighbourhood centre as it is expected to continue its role servicing convenience trips from the neighbourhood. Shop top housing should be a permissible use.

Kogarah Employment Lands and Economic Development Strategy 98
Gross area of audited floorspace (sqm)
1,557
Vacant sites (Ha) 0
Vacant floorspace (sqm)
0
Supply-demand gap (sqm)
Using 50% of max. development potential
Using 25% of max. development potential
By 2036 726 232
Current land-use split by BLC (sqm)
BP Business / Office Parks - 0%
D Dispersed Activities - 0%
FL Freight and Logistics - 0%
LL Local light industrial 284 18%
ML Light Manufacturing - 0%
O Office - 0%
RB Big Box Retail - 0%
RBG Bulky Goods Retail - 0%
RES Residential - 0%
RM Mainstreet Retail 1,273 82%
S Special Activities - 0%
US Urban Services - 0%
VBL Vacant Building - 0%

Kogarah Employment Lands and Economic Development Strategy 99
Hurstville CBD (Kogarah LGA portion)
Current Zone –Business 3 (b) Recommended Zone – B4 Mixed Use
Description Hurstville CBD (Kogarah LGA portion) is the second largest centre in the LGA. The majority of Hurstville centre is located in the Hurstville LGA. The Kogarah portion of Hurstville CBD includes convenience retail and serves as an important employer in civic and government services. In terms of BLCs Dispersed activities (13,853 sqm) are the most common uses in the centre, followed by Office (10,910 sqm) and Big Box (10,900 sqm) retail. High-rise residential development is also a prominent use in the centre. The Hurstville CBD as a whole (including the area in Hurstville LGA) serves a regional catchment. The majority of the retail function is within the Hurstville LGA. Hurstville CBD also contains important civic uses including the Hurstville City Council (Hurstville LGA) and Hurstville police station. Under a higher growth scenario there is expected to be demand for an additional dispersed uses (7346 sqm), big box retail (3485 sqm) and retail mainstreet (1202 sqm) floorspace. Using conservative supply assumptions this precinct will likely reach capacity prior to 2036. Although there is expected to be a shortage of commercial land in the future, there is little capacity to accommodate demand. Surrounding land uses are largely residential strata and so zoning these land uses for commercial expansion is not a likely solution. Therefore, this precinct should continue its convenience retail and employment role with any additional demand likely to be absorbed by Hurstville LGA.
It is recommended to translate the current Business 3 (b) zoned area to B4 Mixed Use, to continue its role in accommodating commercial and residential uses.

Kogarah Employment Lands and Economic Development Strategy 100
Gross area of audited floorspace (sqm)
40,946
Vacant sites (Ha) 0
Vacant floorspace (sqm)
1,081
Supply-demand gap (sqm)
Using 50% of max. development potential
Using 25% of max. development potential
By 2036 -8,355 -10,131
Current land-use split by BLC (sqm)
BP Business / Office Parks - 0%
D Dispersed Activities 13,853 34%
FL Freight and Logistics - 0%
LL Local light industrial - 0%
ML Light Manufacturing - 0%
O Office 10,910 27%
RB Big Box Retail 10,900 27%
RBG Bulky Goods Retail - 0%
RES Residential - 0%
RM Mainstreet Retail 5,283 13%
S Special Activities - 0%
US Urban Services - 0%
VBL Vacant Building - 0%

Kogarah Employment Lands and Economic Development Strategy 101
Kogarah Town Centre
Current Zone – Business 3 (b) & Special Uses 5 (a)
Recommended Zone – B4 Mixed Use & SP2 Infrastructure
Description Kogarah Town Centre is the largest centre in the LGA. Kogarah Town Centre provides convenience retail with grocery and food catering options. The retail component of Kogarah is relatively small scale and focused on strip shopping on Railway Parade and Regent Street, with limited higher-order retail. It is dominated by its civic uses with a number of government services and facilities located in and immediately adjacent to the centre including the Kogarah City Council, the hospitals and allied health facilities, public primary and high schools, St George TAFE, St George police station and Kogarah Court House. It also contains the St George Bank headquarters. Special activities are the largest use in the centre (driven by the hospitals and medical facilities) with 139,141 square metres of floorspace. Office is the next largest land use with 75,874 square metres of floorspace. The St George bank headquarters dominates this category. Under a high growth scenario there is expected to be demand for an additional 76,000 square metres of Special activities floorspace (coming mostly from medical uses and the expansion of the hospital). There is also expected to be demand for Office (10,000 square metres) and retail mainstreet (8000 square metres) uses. Under a maximum achievable floorspace scenario, KTC would have approximately 22,448 square metre of capacity by 2036. However, under more conservative (and more realistic) scenarios of 50 percent and 25 percent maximum achievable floorspace there is a shortage of -39,717 and -70,800 square metres of floorspace, respectively. There are some office vacancies in KTC with a total vacancy rate (including non-office) of 17,169 square metres or around 6 percent. Kogarah Town Centre is often described as an urban design exemplar of a liveable centre, with calm pedestrian friendly streets and high-rise residential development. Residential development is currently attracting a greater return on investment than commercial uses in Kogarah Town Centre, as well as in other centres across the LGA. This is why developers are currently favouring this form of development. However, one of the incidental consequences of residential development in the Kogarah Town Centre is that it can ‘crowd out’ commercial uses – due to its higher level of desirability – and change the commercial character of a centre. The Council has to be mindful of this factor when planning for additional commercial development in and around Kogarah Town Centre and the LGA. The Kogarah Town Centre clearly has a niche in the health sector with both the public and private St George hospitals as well as numerous allied health professionals located in the centre. The centre also a niche in civic uses, as aforementioned. The growth in demand (or otherwise) for these sectors is outside of the Council’s control. The Council can foster the growth of these niches by providing the appropriate planning controls that facilitate development in these sectors.
It is recommended to zone the current zoned 3 (b) area to B4 Mixed Use, to continue its role in accommodating commercial and residential uses. Other recommendations are indicated in the Chapter 9.

Kogarah Employment Lands and Economic Development Strategy 102
Gross area of audited floorspace (sqm)
284,769
Vacant sites (Ha) 5091
Vacant floorspace (sqm)
17,169
Supply-demand gap (sqm)
Using 50% of max. development potential
Using 25% of max. development potential
By 2036 -39,717 -70,800
Current land-use split by BLC (sqm)
BP Business / Office Parks - 0%
D Dispersed Activities 13,651 5%
FL Freight and Logistics - 0%
LL Local light industrial 4,782 2%
ML Light Manufacturing - 0%
O Office 75,874 26%
RB Big Box Retail 12,447 4%
RBG Bulky Goods Retail 751 0%
RES Residential - 0%
RM Mainstreet Retail 34,339 12%
S Special Activities 139,141 48%
US Urban Services 3,783 1%
VBL Vacant Building 5,091 2%

Kogarah Employment Lands and Economic Development Strategy 103
Oatley
Current Zone – Business 3 (a) Recommended Zone – B2 Local Centre
Description Oatley is a local centre located to the east of Oatley station on Frederick Street and Oatley Avenue. The bulk of retail uses in Oatley centre are located within Frederick Street, between Letitia Street and Oatley Avenue. Oatley’s main land use is Retail Mainstreet (8,603 sqm) with some Dispersed uses (5,021 sqm). It plays a local convenience and entertainment role for the surrounding area with a hotel and an RSL. Under a high growth scenario there is expected to be demand for an additional 2300 square metres of Retail Mainstreet floorspace. Using conservative supply assumptions there is still available capacity in the precinct by 2036. Given the available capacity at this centre there is no strong need to change the planning controls.
The centre is currently zoned Business 3 (a). It is recommended to zone this area to B2 Local Centre to continue to serve the local population's retail needs. Shop top housing should be a permissible use.

Kogarah Employment Lands and Economic Development Strategy 104
Gross area of audited floorspace (sqm)
13,923
Vacant sites (Ha) 0
Vacant floorspace (sqm)
369
Supply-demand gap (sqm)
Using 50% of max. development potential
Using 25% of max. development potential
By 2036 3,255 33
Current land-use split by BLC (sqm)
BP Business / Office Parks - 0%
D Dispersed Activities 5,021 36%
FL Freight and Logistics - 0%
LL Local light industrial 299 2%
ML Light Manufacturing - 0%
O Office - 0%
RB Big Box Retail - 0%
RBG Bulky Goods Retail - 0%
RES Residential - 0%
RM Mainstreet Retail 8,603 62%
S Special Activities - 0%
US Urban Services - 0%
VBL Vacant Building - 0%

Kogarah Employment Lands and Economic Development Strategy 105
Penshurst
Current Zone – Business 3 (a) Recommended Zone – B2 Local Centre
Description Penshurst is a small local centre to the south of Penshurst station, between Mortdale and Hurstville stations. The centre is characterised by a strip of shops, stretching for one block along the western side of The Strand. Mainstreet retail (2,274 sqm) is the primary use, with some Office (673 sqm) and Dispersed uses (592 sqm) as well. Penshurst serves trips to and from the surrounding area. Under a high growth scenario there is expected to be demand for an additional 472 square metres of Retail Mainstreet floorspace. Using conservative supply assumptions the precinct may just reach capacity by 2036. Given that the precinct could only just reach capacity using conservative supply assumptions, there is no strong need to change the planning controls.
The centre is currently zoned Business 3 (a). It is recommended to zone this area to B2 Local Centre to continue to serve the local population's retail needs. Shop top housing should be a permissible use.

Kogarah Employment Lands and Economic Development Strategy 106
Gross area of audited floorspace (sqm)
3,539
Vacant sites (Ha) 0
Vacant floorspace (sqm)
471
Supply-demand gap (sqm)
Using 50% of max. development potential
Using 25% of max. development potential
By 2036 601 -51
Current land-use split by BLC (sqm)
BP Business / Office Parks - 0%
D Dispersed Activities 592 17%
FL Freight and Logistics - 0%
LL Local light industrial - 0%
ML Light Manufacturing - 0%
O Office 673 19%
RB Big Box Retail - 0%
RBG Bulky Goods Retail - 0%
RES Residential - 0%
RM Mainstreet Retail 2,274 64%
S Special Activities - 0%
US Urban Services - 0%
VBL Vacant Building - 0%

Kogarah Employment Lands and Economic Development Strategy 107
Princes Highway Strip
Current Zone – Business 3 (a) & Residential 2 (a)
Recommended Zone – B6 Enterprise Corridor
Description The Princes Highway strip of shops includes a number of mixed retail businesses, mostly on the northern side of the Princes Highway. The strip is not consolidated like a centre. Instead it is formed by several clusters, mostly to the north-west of the Princes Highway between O’Meara Street and Jubilee Avenue, Westbourne and Francis Streets as well as Edward and Paris Streets. Mainstreet retail (8552 sqm) is the most prominent use, followed by Dispersed activities (6768 sqm) and Bulky Goods (5433 sqm) retail. This strip serves an important centre-support function by catering to some uses that would not locate in a traditional centre due to large floorplates or low turnover Under a high growth scenario there is expected to be demand for an additional 1785 square metres of Dispersed uses and 1750 square metres of Retail Mainstreet floorspace. Using conservative supply assumptions the precinct will likely reach capacity by 2036.
The strip is currently zoned Business 3 (a) and Residential 2 (a). It should continue to serve its important centre-support function and cater to retail and commercial uses. It is recommended to zone those uses between Jubilee Avenue and Plant Street on the north-western side of the highway to B6 Enterprise Corridor. This would cater to the excess demand and create a unified strip of retail that will also reinforce the existing bulky goods and mixed business cluster. Specific uses that should be encouraged in the B6 zone include: Bulky goods premises; Business premises; Child care centres; Community facilities; Garden centres; Hardware and building supplies; Hotel or motel accommodation; Landscaping material supplies; Light industries; Passenger transport facilities; Plant nurseries; Respite day care centres; Warehouse or distribution centres; Shop top housing.

Kogarah Employment Lands and Economic Development Strategy 108
Gross area of audited floorspace (sqm)
21,580
Vacant sites (Ha) 0
Vacant floorspace (sqm)
1,544
Supply-demand gap (sqm)
Using 50% of max. development potential
Using 25% of max. development potential
By 2036 3,328 -520
Current land-use split by BLC (sqm)
BP Business / Office Parks - 0%
D Dispersed Activities 6,768 31%
FL Freight and Logistics - 0%
LL Local light industrial 828 4%
ML Light Manufacturing - 0%
O Office - 0%
RB Big Box Retail - 0%
RBG Bulky Goods Retail 5,433 25%
RES Residential - 0%
RM Mainstreet Retail 8,552 40%
S Special Activities - 0%
US Urban Services - 0%
VBL Vacant Building - 0%

Kogarah Employment Lands and Economic Development Strategy 109
Ramsgate
Current Zone – Business 3 (a) Recommended Zone – B2 Local Centre
Description Ramsgate is a local centre based on Rocky Point Road, north of Sans Souci. The western side of Rocky Point Road is within the Kogarah LGA, while the eastern side is in the Rockdale LGA. It is a healthy centre with a mix of food catering, convenience retail and suburban commercial office uses. Retail Mainstreet (7301 sqm) uses dominate this centre, with some minor Local Light industrial uses (483 sqm) on the Kogarah side of the centre. It plays a local convenience and entertainment role for the surrounding area. Under a high growth scenario there is expected to be demand for an additional 1546 square metres of Retail Mainstreet floorspace. Based on conservative supply assumptions the precinct will have available capacity up to 2036. Given the available capacity in the centre, there is no strong imperative to change the planning controls. The centre should continue and consolidate its current local centre role.
Any future planning for this centre should reinforce its local centre retail role and also consider the planning controls and future intentions of the Rockdale LGA. The centre is currently zoned Business 3 (a). It is recommended to zone this area to B2 Local Centre to continue to serve the local population's retail needs. Shop top housing should be a permissible use.

Kogarah Employment Lands and Economic Development Strategy 110
Gross area of audited floorspace (sqm)
8,202
Vacant sites (Ha) 0
Vacant floorspace (sqm)
670
Supply-demand gap (sqm)
Using 50% of max. development potential
Using 25% of max. development potential
By 2036 5,881 2,087
Current land-use split by BLC (sqm)
BP Business / Office Parks - 0%
D Dispersed Activities 120 1%
FL Freight and Logistics - 0%
LL Local light industrial 483 6%
ML Light Manufacturing - 0%
O Office 298 4%
RB Big Box Retail - 0%
RBG Bulky Goods Retail - 0%
RES Residential - 0%
RM Mainstreet Retail 7,301 89%
S Special Activities - 0%
US Urban Services - 0%
VBL Vacant Building - 0%

Kogarah Employment Lands and Economic Development Strategy 111
Sans Souci
Current Zone – Business 3 (a) Recommended Zone – B2 Local Centre
Description Sans Souci is a local centre based on Rocky Point Road, south of Ramsgate. The western side of Rocky Point Road is in the Kogarah LGA, while the eastern side is in the Rockdale LGA. Retail Mainstreet (4875 sqm) is the most prominent use, with a small shopping village (998 sqm) in the Kogarah part of the LGA. It plays a local convenience role for the surrounding area. Under a high growth scenario there is expected to be demand for an additional 684 square metres of Retail Mainstreet floorspace. Based on conservative supply assumptions the precinct will have available capacity up to 2036. Given the available capacity in the centre, there is no strong imperative to change the planning controls. The centre should continue and consolidate its current local centre role.
Similar to Ramsgate centre, any future planning for this centre should reinforce its local centre retail role and also consider the planning controls and future intentions of the Rockdale LGA. The centre is currently zoned Business 3 (a). It is recommended to zone this area to B2 Local Centre to continue to serve the local population's retail needs. Shop top housing should be a permissible use.

Kogarah Employment Lands and Economic Development Strategy 112
Gross area of audited floorspace (sqm)
5,873
Vacant sites (Ha) 0
Vacant floorspace (sqm)
673
Supply-demand gap (sqm)
Using 50% of max. development potential
Using 25% of max. development potential
By 2036 1,404 271
Current land-use split by BLC (sqm)
BP Business / Office Parks - 0%
D Dispersed Activities - 0%
FL Freight and Logistics - 0%
LL Local light industrial - 0%
ML Light Manufacturing - 0%
O Office - 0%
RB Big Box Retail 998 17%
RBG Bulky Goods Retail - 0%
RES Residential - 0%
RM Mainstreet Retail 4,875 83%
S Special Activities - 0%
US Urban Services - 0%
VBL Vacant Building - 0%

Kogarah Employment Lands and Economic Development Strategy 113
South Hurstville Industrial
Current Zone – Industrial 4 (a) Recommended Zone – IN2 Light Industrial
Description South Hurstville industrial area is located to the west of the South Hurstville centre. It contains a recently completed industrial complex that has Freight and Logistics (7245 sqm) uses and Business Park (3042 sqm) type uses. There is also some Local Light industrial and Light Manufacturing in the precinct. Based on the forecasts there is no strong demand for this precinct. The industrial precinct currently has a relatively high vacancy rate of 14.5 percent; most of which is within the newly constructed industrial centre. Based on conservative supply assumptions the precinct will have available capacity up to 2036. Given the available capacity in the centre, there is no strong imperative to change the planning controls.
This precinct is likely to continue its population servicing industrial role and it is recommended to zone this area to IN2 Light Industrial.

Kogarah Employment Lands and Economic Development Strategy 114
Gross area of audited floorspace (sqm)
13,791
Vacant sites (Ha) 0
Vacant floorspace (sqm)
1,993
Supply-demand gap (sqm)
Using 50% of max. development potential
Using 25% of max. development potential
By 2036 2,878 1,724
Current land-use split by BLC (sqm)
BP Business / Office Parks 3,042 22%
D Dispersed Activities - 0%
FL Freight and Logistics 7,245 53%
LL Local light industrial 1,646 12%
ML Light Manufacturing 1,859 13%
O Office - 0%
RB Big Box Retail - 0%
RBG Bulky Goods Retail - 0%
RES Residential - 0%
RM Mainstreet Retail - 0%
S Special Activities - 0%
US Urban Services - 0%
VBL Vacant Building - 0%

Kogarah Employment Lands and Economic Development Strategy 115
South Hurstville Village
Current Zone – Business 3 (a) Recommended Zone –B2 Local Centre
Description South Hurstville Village is a local centre on King Georges Road, between Hurstville and Blakehurst. Retail Mainstreet (8671 sqm) is the most common use in the centre, with a small supermarket centre another prominent use (2405 sqm). It plays a local convenience and entertainment role for the surrounding area with a hotel and RSL. Most retail uses are clustered on King Georges Road, with the supermarket and RSL accessible off Connells Point Road. The vehicular dominated King Georges Road (it is seven lanes wide as it runs through South Hurstville Village) detracts from the pedestrian amenity of the centre. Under a high growth scenario there is expected to be demand for an additional 2122 square metres of Retail Mainstreet floorspace. Based on conservative supply assumptions the precinct will have available capacity up to 2036. The current FSR control of 1:1 is not viable in the centre. Feasibility testing revealed that the current FSR controls are problematic, but the high carparking rates are the most significant sticking point for feasibility.
Future controls for this centre should focus on reinforcing its use as a local centre. The centre is currently zoned Business 3 (a). It is recommended to zone this area to B2 Local Centre to continue to serve the local population's retail needs. Shop top housing should be a permissible use.

Kogarah Employment Lands and Economic Development Strategy 116
Gross area of audited floorspace (sqm)
14,737
Vacant sites (Ha) 0
Vacant floorspace (sqm)
1,232
Supply-demand gap (sqm)
Using 50% of max. development potential
Using 25% of max. development potential
By 2036 3,064 172
Current land-use split by BLC (sqm)
BP Business / Office Parks - 0%
D Dispersed Activities 2,206 15%
FL Freight and Logistics - 0%
LL Local light industrial 1,456 10%
ML Light Manufacturing - 0%
O Office - 0%
RB Big Box Retail 2,405 16%
RBG Bulky Goods Retail - 0%
RES Residential - 0%
RM Mainstreet Retail 8,671 59%
S Special Activities - 0%
US Urban Services - 0%
VBL Vacant Building - 0%

Kogarah Employment Lands and Economic Development Strategy 117
APPENDIX 2: AUDIT METHOD
An audit of all employment generating precincts within Kogarah was completed using a method developed by SGS in association with the Department of Planning. Three levels of information are collected about each lot within the employment generating precincts:
Data Collected Source of Data
Level 1 Zoning, size of lot Cadastre with LEP overlay
Level 2 Building envelope GIS base for on-ground verification (digitised building outlines using aerial photographs)
Level 3 Building height, business type by ANZSIC category, building type by Broad Land Use category
Online business directory and on-ground field survey
The field work builds on the Level 1 and Level 2 data inputted via GIS. The field survey includes direct data entry through the use of hand-held Palm Pilots.
Level 1 is used to identify the land parcels that will be audited. Zoning information is added to the cadastre and land by zone is calculated.
Level 2: From geo-referenced aerial images provided, building footprints and key permanent structures (including above ground car parks) are digitised. The respective zoning information from the cadastre layer addressed in Level 1 is added to these building records.
Level 3 involves compiling business and land use categories via an online business directory in the first instance. Each business will be recorded by ANZSIC categories and each building will be recorded by BLC. This information is then verified via physical site visit and land auditing. In this fieldwork all ANZSIC activities being conducted on each storey of the building are recorded and BLCs for each building are confirmed.
The final stage of the land audit involves ensuring the data is clean and error free before all levels are combined and assessed. The aim is to describe each of Kogarah’s employment precincts by:
area (ha)
current uses
vacant floorspace
vacant sites
current actual FSRs
capacity under existing controls
range of lot sizes
activities (including vacancies)
broad land use category (office, light manufacturing, etc). In combination with Level 1 and Level 2, the categorical data collected in Level 3 allows for a multitude of analyses to be conducted. To identify existing employment in the areas, the recording of ANZSIC categories provides a concise snapshot of current employment and industries in operation within the employment areas. As BLCs categorise the possible function of the land and existing built form, as well as the actual employment activity, assessing land use in terms of BLCs allows the consideration of the future character of an area. Converting the forecast employment numbers from ANZSIC categories to BLC floorspace figures allows the gap analysis to be expressed in BLCs. Ideally, the audit data could become a platform on which ‘real time’ data from DAs and occupancy certificates could build in more accuracy, allow for constant updating on Council employment lands and for tracking of any potential economic development KPIs.

Kogarah Employment Lands and Economic Development Strategy 118
Internal building inspections have not been completed and as such internal voids, circulation space and storage space within each building has not been determined. The reported figures are therefore gross floorspace figures and do not take into account building efficiency.

Kogarah Employment Lands and Economic Development Strategy 119
APPENDIX 3: STRATEGY AND POLICY REVIEW
This appendix outlines the planning strategies and policies applying to the Kogarah LGA. The strategic metropolitan and regional plans applying to Kogarah LGA have been assessed for their pertinence to local industries and particular areas in Kogarah. The following strategies were assessed:
Metropolitan Plan for Sydney 2036
Draft South Subregional Strategy
Kogarah Economic Development Strategy Southern Sydney Regional Profile
St George Economic and Employment Strategy, and
Development near Rail Corridors and Busy Roads – Interim Guideline. The following Development Control Plans (DCPs) applying to built-form in commercial and industrial areas in Kogarah have also been analysed:
Kogarah Town Centre Development Control Plan No.5
Commercial and Industrial Lands Development Control Plan, and
Ramsgate Centre DCP. The DCPs have been assessed with a focus on their economic viability.
Metropolitan Plan for Sydney 2036 (2010)
The released Metropolitan Plan for Sydney 2036 (Metro Plan) is the overarching planning guidance for the Sydney Greater Metropolitan Region (GMR). It was produced by the former Department of Planning (now the Department of Planning and Infrastructure) to succeed the 2005 Metropolitan Strategy: A City of Cities. It guides urban growth and development to 2036 and establishes criteria for the amount, location and type of development that is required across the GMR at a subregional level. The Metro Plan included updated targets in line with the original plan to review targets every five years. It is currently only enabling residential and employment growth in areas where there is available or planned public transport capacity (NSW Department of Planning and Infrastructure, 2010, pp. 13-14). The Metro Plan provides a series of key policy objectives and accompanying actions to achieve these objectives. The main objectives and actions that are of importance to Kogarah are outlined below:
Objective E1: To ensure adequate land supply for economic activity, investment and jobs in the right locations
The overarching principles for guiding Sydney’s economic growth are to provide jobs closer to home by setting new employment capacity targets for each subregion; and ensuring employment lands continue to meet Sydney’s freight and industry needs by establishing an Employment Lands Task Force.
Action E1.1 - Reflect new subregional employment capacity targets in Subregional Strategies and Local Environmental Plans. The South subregion’s (including Kogarah, Rockdale, Canterbury, Hurstville, Marrickville and Sutherland LGAs) 2036 employment capacity target is 245,000. From 2006 to 2036 this means a growth of 52,000 jobs or 27 percent (NSW Department of Planning and Infrastructure, 2010, p. 133).
Objective E2: Focus Sydney’s economic growth and renewal, employment and education in centres
Action E2.1 - Plan for more commercial and retail jobs in highly accessible strategic centres. The Kogarah Centre 2036 employment capacity target is 12,000. From 2006 to 2036 this equates to an additional 2,000 jobs (NSW Department of Planning and Infrastructure, 2010, p. 135).

Kogarah Employment Lands and Economic Development Strategy 120
Action B4 - Encourage public transport usage. Kogarah is a strategic centre, so promoting retail jobs (Action E2.1) comes with a need to promote active transport (NSW Department of Planning and Infrastructure, 2010, p. 136).
Action E2.2 - Ensure an adequate supply of retail, office space and business parks. DP&I’s Employment Lands Development Program (ELDP) provides estimates in relation to supply, vacancy levels and demand. High grade office, retail and commercial space in strategic centres aims to meet employment targets and enhancing Sydney’s Global competitiveness (NSW Department of Planning and Infrastructure, 2010, p. 136).
Action E2.5 - Strengthen clusters of activity in Specialised Centres, particularly those for high growth and high value sectors, and support emergence of new clusters (NSW Department of Planning and Infrastructure, 2010, p. 138).
Action E2.7 - DP&I work with local government to support commercial space, low cost creative industry, business start-ups and innovation related activities (NSW Department of Planning and Infrastructure, 2010, p. 139).
Objective E3: To provide employment lands to support the economy’s freight and industry needs
Action E3.1 - Monitor supply and demand for employment lands, and plan for new employment lands. The ELDP is the NSW Government’s key program for managing the supply of Employment Lands in the Sydney Region and assisting associated infrastructure coordination (NSW Department of Planning and Infrastructure, 2010, p. 140).
Action E3.2 - Identify and retain strategically important employment lands. Only areas that are not strategically important will be considered for rezoning. Employment needs to be specialised and sustainable (NSW Department of Planning and Infrastructure, 2010, p. 141).
Objective E4: To provide for a broad range of local employment types in dispersed locations. Subregional strategies need to ensure employment in industries.
Action E4.1 – Allow a broad range of employment and rezone to allow work from home to reduce traffic congestion pressures (NSW Department of Planning and Infrastructure, 2010, p. 146).
Centres Policy The Centres Policy in the Metro Plan reaffirms the multi-centred geography of Sydney identified and promoted in the 2005 Metropolitan Strategy which seeks to improve land use and transport integration. The Centres Policy aims to concentrate commercial and retail activities in identified Major Centres, typically on transport routes to achieve agglomeration and productivity benefits. The Strategy focuses on enhancing the quality of the city’s centres by getting the best mix of homes, jobs, services – including retail, recreation and other activities in centres. This will increase the use of public transport, maximise the use of existing infrastructure and help generate local jobs. The Centres Policy identifies the following key objectives:
Objective B1: To focus activity in accessible centres
Objective B2: To strengthen major and specialised centres to support sustainable growth of the city
Objective B3: To plan for new centres and instigate a program for high quality urban renewal in existing centres serviced by public transport
It should be recognised that the structure plans in this policy do not directly mention the Kogarah LGA. The policy however is noteworthy and does play an integral part in the implementation of the Metro Plan.
Draft South Subregional Strategy (2007)
Subregional Strategies are the next step in translating the objectives for the whole city, as found in the Metro Plan, into strategies for each grouping of Local Government Areas and the many communities of Sydney. The draft Subregional Strategies provide clarity on the future roles of centres, a framework for potential agreements and local government area housing and employment capacity targets to 2031. The Subregional Strategies provide a framework for the local councils in their preparation of new Principal LEPs. There are nine key outcomes for the draft South Subregional Strategy: 1. Retain strategic employment lands

Kogarah Employment Lands and Economic Development Strategy 121
2. Plan for employment growth at Sydney airport and environs 3. Strengthen Hurstville’s commercial centre 4. Promote Kogarah as a Major Centre 5. Identify and investigate renewal areas for the south 6. Explore options for future development of Rockdale Town Centre and Botany Bay foreshore 7. Investigate and resolve the roles of Caringbah, Miranda and Sutherland 8. Recognise diversity across the subregion 9. Protect scenic, heritage and environmental assets of the subregion As described in the draft South Subregional Strategy, the South Subregion plays an important economic role forming part of the Global Economic Corridor. The region is projected to accommodate an additional of 35,000 new dwellings and an additional of 29,000 jobs to a total of 214,500 jobs by 2031 (NSW Department of Planning, 2007, p. 5). Two-thirds of residents working in the subregion live in the South Subregion (NSW Department of Planning, 2007, p. 6). Kogarah Town Centre has grown from its origin as a railway suburb to a vibrant centre. Identified as a Major Centre in the Metropolitan Strategy, further retail growth is suggested to strengthen the City’s role. In recent years, building densities in Kogarah have increased significantly while shopping and service precincts have undergone revitalisation (NSW Department of Planning, 2007, p. 7). The Subregional strategy suggests that the Kogarah LGA has capacity to cater for an additional of 4,000 jobs, reaching 22,000 jobs by 2031 (NSW Department of Planning, 2007, p. 24). The strategy suggests that, given Kogarah City’s servicing by existing education and hospital facilities, it is essential for it to be able to attract knowledge and high skill industries (NSW Department of Planning, 2007, p. 26). The South Subregion has relatively small supply of Employment Lands in comparison to other subregions in the Sydney Metropolitan area. The South Subregion has approximately 782 hectares of employment zoned land which includes Sutherland (376 Ha), Canterbury (171.5 Ha) and Marrickville (187.5 Ha), Hurstville (82 ha), Rockdale (66.5 Ha) and Kogarah (15 Ha) (NSW Department of Planning, 2007, p. 32). Future roles for Employment Lands in the South Subregion are broken into three categories:
1. land to be retained for industrial purposes 2. land with potential to allow for a wider range of employment uses, and 3. land that could be investigated for alternative uses (NSW Department of Planning, 2007, p. 28).
Future role of identified Employment Lands in Kogarah were: Category 1 Land to be retained for industrial purposes (NSW Department of Planning, 2007, p. 30)
Carlton (utilities/urban services, local industry)
Blakehurst (utilities/urban services)
South Hurstville (local industry, manufacturing-light)
Category 2 Land with potential to allow for a wider range of employment uses (NSW Department of Planning, 2007, p. 31)
Railway Parade (retail)
Gray Avenue (utilities/urban services)
Kogarah Economic Development Strategy (2001)
The Kogarah Economic Development Strategy was adopted by Kogarah Council in 2001. The strategy presents an analysis of Kogarah’s business and retail sectors and has identified actions and resources that impact on economic development. The strategy highlights that Kogarah has a potential advantage in medical, legal, education and training, property and financial, leisure and cultural and alternate retailing. Kogarah Town Centre is described as the main commercial area, located at the northern most extremity of the Local Government Area (LGA), while Hurstville centre is described as the most centrally located area for many of Kogarah’s residents. The Kogarah Economic Development Strategy highlights a number of important matters that need to be considered when developing a new strategy. These include:

Kogarah Employment Lands and Economic Development Strategy 122
TABLE 4 2. MAT TERS I NFLUENCI NG ST RATEGY DEVELOP MENT
Matters Details
Labour force To provide increasing options for long term unemployed people, young people and people with limited English.
Public transport The CityRail services, more pointedly the Illawarra line has been heavily patronised, operating at or near capacity during the peak period. The challenge will be for Council and the government to continue providing a high quality integrated transport system, both within the area and between areas.
Tourism With an estimated $34 million spent in tourism in 1998 – an estimated 490,000 visitor nights. Kogarah has limited number of accommodation providers which can be a potential avenue for future employment and promotion.
Working in partnership
There is a need to further integrate Council’s activities with future GROW initiatives to help encourage partnerships and work towards a common vision for the business community. GROW is an organisation whose aim is to “grow employment in Sydney”.
Source: Kogarah City Council, 2001
The strategy also identifies a number of government policies affecting planning decisions in the Kogarah LGA. The overall aims and key planning principles that oversee these policies are:
To create an overall compact urban structure with greater housing choice
To create opportunities for employment and business growth in areas of good public transport accessibility
To increase opportunities for public transport use to contain growth to travel demand
To improve the design and quality of the built environment through urban design
To protect and improve the natural and cultural environments, and
To manage the planning system to maximise consultation and encourage investment, job creation and business confidence.
To better understand the strengths and limitations facing Kogarah, the report presents a SWOT analysis: Strengths
Positioned conveniently between Sydney CBD and the southern suburbs and in close proximity to Sydney airport.
Hosts a range of major facilities including banking, medical and educational.
Weaknesses
Has a limited variety of food and retail outlets and leisure activities.
Experiences a high demand for parking facilities due to the medical facilities.
Opportunities
Has a high number and range of people coming to Kogarah for work, study and other visiting with varying amounts of disposable income.
Increasing number of residents which will generate demand for a better range of leisure and recreational facilities and services.
Increasing options for tourism through marketing and promotion of events and development of Bed & Breakfast style accommodation.
Threats
Competition from the surrounding large shopping complexes such as Hurstville Westfield, Rockdale Plaza, Southgate, Miranda Westfield and Roselands Shopping Centre.
Minimal amount of free parking available compared to the surrounding shopping facilities. The Kogarah Economic Development Strategy details potential advantages and issues facing Kogarah’s nine business areas including Kogarah Town Centre, Carlton, Allawah, Hurstville, Oatley, Ramsgate, Sans Souci, South Hurstville and Carlton Industrial Estate. Given that these advantages and issues were documented over a decade ago, it is likely that the types of issues may have changed with changing consumer needs, improved technology and changes in the economy. However, their pertinence will be considered in formulating the economic development actions.

Kogarah Employment Lands and Economic Development Strategy 123
TABLE 4 3. BUSINESS AREAS I N KO G AR AH
Business areas Potential Advantage Issues
Kogarah Town Centre
Traditional local centre based around railway line which has expanded significantly with the introduction of health, education and financial institutions
Improve street cleaning services in the Kogarah Town Centre, highlighting the problem of retail waste facilities on Railway Parade
Improve signage to assist the large number of visitors to the Kogarah Town Centre Cater high demand of car parking by the working community of Kogarah Promote greater diversity in businesses operating in the Kogarah Town Centre as well as attracting new businesses Organise more local events in Kogarah Town Centre to generate and attract more activity in the area
Carlton Local/neighbourhood centre developed in association with railway corridor
Improve streetscape facilities and extend footpath to the northern end of Railway Parade
Address parking issues through implementing short term parking facilities and 15 minutes loading zones on Railway Parade, Carlton Promote greater mix of goods and services in Carlton shopping area
Allawah Local/neighbourhood centre developed in association with railway corridor
Develop more streetscaping in Allawah to demarcate the area and improve amenity
Cater high demand of car parking by the Allawah businesses Promote greater mix of goods and services in Allawah
Hurstville Major regional shopping precinct Better utilise the Hurstville SupaCentre
Improve safety in the area through greater Police patrols and better lighting Ensure Council exercise greater control to improve urban design of the multi-unit residential developments in the area Cater high demand for car parking by local businesses The Westfield shopping centre has lured business/commercial activity away from the Ormonde Parade shopping precinct of Hurstville Promote greater diversity in businesses operating in Hurstville The absence of banks was raised as an issue, especially since the closure of Commonwealth Bank
Oatley Local/neighbourhood village Improve streetscaping and increase more benches to cater to the elderly population of Oatley and the local workers
Improve safety in the area through greater Police patrols Maintain Oatley’s village atmosphere Cater high demand of car parking and install traffic calming devices to address existing road safety issues Maintenance of banking facilities Promote greater diversity in businesses operating in Oatley
Ramsgate Suburban strip with car oriented retail Promote residential development in the area of Rocky Point Road to generate more business activity in the area
Foster distinctive streetscape character in conjunction with Rockdale Council Appropriately address traffic issues in the area such as pedestrian safety, speed limits and parking regulations Promote greater diversity in businesses operating in Ramsgate particularly banking facilities
Sans Souci Suburban strip with car oriented retail Beautify Sans Souci Cater high demand of car parking in the area

Kogarah Employment Lands and Economic Development Strategy 124
Encourage appropriate banking facilities in the area
South Hurstville Traditional local centre at the junction of two arterial roads
Promote greater diversity of goods and services available in the South Hurstville shopping area
Provide adequate seating and greenery/open space in the South Hurstville shopping area Cater high demand of car parking in the South Hurstville Shopping area and implement better traffic management Revitalise activity in the area
Carlton Industrial Estate
Carlton Industrial Estate which hosts a mix of industry including mechanics, metal fabricators, concreters, printers, plumbers and various wholesale companies
Investigate and identify solutions to overcome vacancy issue due to changing transportation and delivery requirements for light industry
Source: Kogarah City Council, 2001.
Southern Sydney Regional Profile (2010)
The Southern Sydney Regional Profile (2010) was prepared by the AEC Group. The Southern Sydney region refers to six Local Government Areas (LGAs) located south of the Sydney CBD: Bankstown, Canterbury, Hurstville, Kogarah, Rockdale and Sutherland Shire. The profile identified that Kogarah is a specialised commercial centre in the Southern Sydney region with 43,000 square metres of office space and home to the head office of St George Bank, St George Public and Private Hospitals, St George TAFE college and Kogarah City Council. The report identified that Kogarah is specialised in finance and banking, generating an estimated Gross Regional Product (GRP) of $766.7 million in the 2008-09 financial year (AEC Group, 2010, p. 4).
TABLE 4 4. KOG AR AH GRO SS REGIO N AL PROD UCT ( GRP) BY I ND U STRY, 2 00 8 -0 9, $ M
Industry GRP in millions of dollars
Agriculture, forestry and fishing $0.5
Mining $0.0
Manufacturing $57.9
Electricity, gas, water & waste services $75.4
Construction $62.5
Wholesale trade $49.9
Retail trade $42.4
Accommodation & food services $42.9
Transport, postal & warehousing $35.1
Information media & telecommunications $12.7
Financial & insurance services $766.7
Rental, hiring & real estate services $61.9
Professional, scientific & technical services $94.9
Administrative & support services $29.0
Public administration & safety $118.8
Education & training $87.7
Health care & social assistance $381.6
Arts & recreation services $10.2
Other services $26.7
Non-classifiable $10.0
Total (Excl .Ownership of Dwellings & General Govt)
$1967.0
Ownership of Dwellings & General Government $346.6
GRP/GSP at Chain Volume Measures $2,313.6
Source: AEC Group, 2010

Kogarah Employment Lands and Economic Development Strategy 125
St George Economic and Employment Strategy (2006)
The St George Economic and Employment Strategy (SEES) prepared by Hill PDA aims to assist in the development of a long term strategy for economic development and employment generating lands in the St George-Sutherland region Study Area. Employment lands according to this strategy include business land (commercial and retail centres), special use land and industrial land. The strategy highlighted that the economic vision for Kogarah Centre is to promote a vibrant mix of banking, education and medical uses with residential, retail and restaurants in a pedestrian oriented environment. The key to integrate these three elements will be to develop safe 24/7 pedestrian linkages and vistas from the educational and medical precincts to the retail area and railway station:
‘Kogarah will consolidate as the educational and medical Village of the Region and encourage related facilities to cluster in a pedestrian friendly environment. The Village concept will be branded throughout Kogarah as a consistent approach to village and neighbourhood development’ (Hill PDA 2006, p. 22).
The SEES proposes a framework to support economic growth and employment in the St George-Sutherland region over the next ten to twenty years. The framework covers four areas including guiding land use principles, strategies and actions, a summary timetable and recommendations for the treatment of specific sites. TABLE 45 summarises key findings which are relevant to the economic development and employment lands study.

Kogarah Employment Lands and Economic Development Strategy 126
TABLE 4 5. PLANNI NG FR AMEWOR K
Guiding Land Use Principles
Commercial office
Guard against leakage of office space to industrial lands and emerging business parks through the restriction of permitted office space uses (20% of GFA in light industrial and 60% in business parks) as an objective of the Regional Vision and corresponding LEP policies. Recognise that the economics of the suburban office market are quite fragile and incentives like reduced parking or bonus FSR may be required to stimulate development. Competition with residential can also limit its development potential. Office only precincts may need consideration.
Bulky goods retail
There may be special circumstances where the location of Bulky Goods may be considered outside town centres such as an existing large bulky goods cluster with good highway/main road frontage. Such development areas would be restricted within a newly defined enterprise area and any expansion of floor space must be supported by the performance of an Economic Impact Assessment (EIA) study that looks at the impact on a regional basis with the centre hierarchy to be protected.
Industrial Preserve zoned land that can accommodate relatively large floor plates (larger sized lots) and that are well serviced or connected to main road networks/port. Develop buffer zones of low impact industrial uses (e.g. storage, parking, and landscaped areas) around land zoned industrial to minimise its impact with residential uses. Do not permit bulky goods retailing in industrial zones. Allowing retailing in industrial areas only where it is ancillary to industrial uses.
Home based business
Home based business should be permitted in residential zones however they should be conditioned and monitored to ensure they are ancillary to the main function of the property and that:
the use is located within a defined area of the property the use does not create disruptive levels of noise, smells or fumes to surrounding uses there are a defined number of employees that work on the premises i.e. no more than 3 the use does not result in a significant level of traffic or pedestrian movement that may disrupt the function of surround uses there are adequate servicing and parking facilities.
Strategies and Action Plans
Strategy 19 Strategy/action: Reinforce Kogarah’s regional medical and educational role by incorporating it into the Village Masterplan for the whole Kogarah Town Centre. Timeframe: Medium Stakeholders: Kogarah City Council, TAFE, public/private hospitals
Strategy 20 Strategy/action: Consider the use of fragmented industrial areas close to the Kogarah centre to support the medical/education precinct. Timeframe: Medium Stakeholders: Kogarah City Council
Strategy 21 Strategy/action: Address the undersupply of supermarkets in Kogarah by working with the industry to secure larger parcels of land adjacent to the existing smaller centres. Due to the size required, suitable sites are limited; however supermarkets provide a key community service and a significant number of jobs, particularly for young people and part time workers. Timeframe: Short Stakeholder: All Councils, supermarket representatives – Coles/IGA/Woolworths/Aldi, local Chambers of Commerce, Progress/Precinct Associations.
Strategy 22 Strategy/action: Maintain and strengthen linkages with higher education facilities and the proposed direction for The Bay Area, particularly focussing on the Airport/Port related activities, or through the development of niche areas resulting from Airport/Port activities. Timeframe: Long Stakeholders: Kogarah City Council, TAFE, NSW Health
Source: Hill PDA, 2006
Retail floorspace
The SEES reviewed current retail demand and supply and provided forecasts. The SEES included a retail floor space survey of the St George-Sutherland region. Kogarah recorded:
8,103 square metres of supermarket and grocery store floorspace
14,051 square metres of food retailing and takeaway floorspace
7,562 square metres of clothing and footwear floorspace;
9,300 square metres of bulky goods, and
19,203 square metres for other services. There was approximately 5,327 square metres of vacant space; representing 8.4 percent of the grand total retail floorspace. By adding up all the identified floor space, this made up a grand total of 63,544 square metres of retail floor space within the Kogarah LGA.

Kogarah Employment Lands and Economic Development Strategy 127
The strategy identified and analysed the supply and demand for retail floor space. According to the results, Kogarah experienced an undersupply of retail floor space since 2004 ranging from 39,700 square metres to 58,700 square metres by 2015. However, the strategy notes that Hurstville captures considerable expenditure from Kogarah and Rockdale LGAs. And so when viewed at a regional perspective, Kogarah’s ostensible retail undersupply is catered by the floorspace in Hurstville.
Office floorspace
The commercial floorspace in Kogarah is estimated to be around 43,543 square metres, with 30,168 square metres of office space and 13,375 square metres of shopfront commercial. The strategy highlights that commercial office space growth is likely to remain strong with demand for medical related uses and government services. The SEES raises the concern that the St George Bank may move its headquarters out of Kogarah Town Centre. It suggests that the adoption of a master plan that incorporates the St George Public and Private Hospitals Medical Precinct into Kogarah Town Centre will stimulate the growth of office space in the centre. Hill PDA suggests that Kogarah City Council should restrict residential development in various locations where existing commercial development is predominant. The SEES highlighted that a trend in business parks has been the declining percentage of warehousing and traditional manufacturing space and growth in office space. The increasing leakage of office space from established suburban centres is suggested as a real and serious threat to the economic balance of the established centres of Kogarah. The SEES indicated that companies seek to relocate their businesses to business parks due to a number of factors. These include lower rental costs and business parks provide purpose-built buildings with a range of amenities and plenty of on-site car parking. The strategy also noted that there is a trend for large corporations to move into custom-built headquarters. This combination of factors has been so successful that some business parks are emerging as ‘centres’ in their own right. Kogarah, being an established Major Centre is experiencing high land prices, which is making office style development less feasible compared to office development in business parks. However, the SEES indicated that caution should be used to ensure that the City’s limited industrial land is simply not used for office based activities that can be accommodated in the established town centres. Strong planning strategies are suggested to avoid this mismatch of use and the erosion of the vitality of the town centre as a commercial business zone. The strategy identified Carlton as part of the six large industrial areas in the St George-Sutherland region. These industrial lands are recognised by the NSW Department of Planning as an important resource. The Metropolitan Strategy seeks to concentrate employment, ensure good management of existing land resources, ensure there is sufficient supply of suitable commercial sites and employment lands and efficiently utilise existing infrastructure. The SEES indicates that the existing industrial/showroom construction in Kogarah is typically low-rise in scale with car yards, including display parking, located along the Princes Highway and the Motor Registry offices and commercial premises at the corner of Princes Highway and Rocky Point Road. Industrial uses found along Railway Parade between Gray Street and English Street are being used variedly between traditional industrial uses and retail accommodation. This strip of industrial lots has been rezoned to General Business 3(a). The SEES recommended that any retail in this location should only allow uses that do not detract from Kogarah Town Centre. The more traditional industrial uses are mostly clustered in the Carlton Industrial Area. The SEES suggests that Kogarah would benefit from the clustering of high quality structures, with future developments along the Princes Highway and Rocky Point Road built closer to the street, with a minimum setback for landscaping, to create a strong, unifying visual element. Hill PDA informs that the importance of the St George TAFE College as a business in the Region should not be underestimated. The College currently proposes to reinforce its link to the Hospital and the airport/port with new areas being small business, technology and knowledge learning. The regional medical facilities located in Kogarah not only supplies medical services to the St George and Sutherland areas but specialist services as far afield as the NSW South Coast. At the time of the SEES the hospitals employed approximately 2,750 staff. The strategy suggests that the role of Kogarah as a major medical centre should be supported and, where possible, reinforced by encouraging other related activities to locate nearby.

Kogarah Employment Lands and Economic Development Strategy 128
Stakeholder consultations were conducted as a part of the SEES and key findings related to retail, commercial and industrial of Kogarah are summarised as below.
Retail: Retail at Kogarah especially Kogarah Town Centre was considered to perform well. The location of supermarket sites in Kogarah was seen as a concern. Sites along Rocky Point Road were thought to be attractive to capture passing trade to/from Sutherland.
Commercial: The strategy recognised that St George Bank, St George Private and Public Hospitals, St George TAFE College and the Australian Taxation Office in Hurstville are major commercial offices which will provide opportunities to encourage related commercial activity.
Industrial: Industrial land in Kogarah meanwhile was said to be in short supply and under pressure to be rezoned to residential. The existing Carlton industrial estate was said to be in need of redevelopment to revitalise the area.
Hill PDA suggested that there is a potential for short stay accommodation related to the hospital and that the Wellbeing Centre including natural therapy will encourage increased day visitors.
The SEES made a number of comments and recommendation for industrial lands, business lands and special use lands. A select number of recommendations that have relevance to Kogarah have been outlined below. Industrial lands
IN1: General Industrial zone to provide a diverse range of industrial and warehouse land uses and permit light industries, neighbourhood shops, warehouse or distribution centres (and other selected uses such as for example depots, freight transport facilities and standard industries).
IN2: Light Industrial zone to prohibit most retailing (except for neighbourhood retailing) and permit for example showrooms if attached to manufacturing
Showroom floor area not to exceed 10 percent of total floor area.
FSR limit of 1:1 to be retained.
Commercial office space not to exceed 20 percent of any one tenancy.
Prohibit retail (except for neighbourhood retail), residential. Business lands
Apply consistent land use zones recommended in the Standard Instrument (Local Environmental Plans)Order 2006 including:
Consider higher FSR limits of 3:1 to 4:1 in Kogarah CBD. Extended uses to include medical and education. Look to have commercial only zones.
Enterprise Corridor to replace highway business zone. Apply to Princes Highway. Consider higher FSR limit 2:1 to 2.5:1.
Bright Future, Better Lifestyle: Kogarah 2020
The Bright Future, Better Lifestyle: Kogarah 2020 provides an economic vision for Kogarah to achieve a ‘thriving and prosperous city’. The vision aims to promote and encourage local economic activity and local employment opportunities so that local residents have the option for shorter trips, and the ability to have an enhanced work/life balance. It provides a number of key goals to achieve the objective of a ‘thriving and prosperous city’. These include:
Goal 3.1: Kogarah Town Centre is recognised as the major medical, financial and educational precinct in the St George-Sutherland region
Goal 3.2: Local centres within the Kogarah LGA are distinctive and vibrant, providing opportunities for small businesses to flourish throughout the city
Goal 3.3: Kogarah City has a dynamic and resilient business community that provides employment and training opportunities that meet the needs of local residents (Kogarah LGA 2010).
Development near Rail Corridors and Busy Roads – Interim Guideline (2008)
The Interim Guideline for Development near Rail Corridors and Busy Roads, prepared by the Department of Planning, aims to assist in reducing the health impacts of rail and road noise and adverse air quality on sensitive adjacent
Kogarah Employment Lands and Economic Development Strategy 129
development. The key objectives of these guidelines are to protect the safety and integrity of key transport infrastructure from adjacent development, and ensure that adjacent development achieves an appropriate acoustic amenity by meeting the internal noise criteria specified in the Infrastructure SEPP. The Guideline is primarily for consent/approval authorities and proponents (both private and public) and for their designers, architects, project managers, engineers and contractors involved with new residential and other developments alongside rail corridors and busy roads as it provides useful guide for all development that may be impacted by, or may impact on rail corridors or busy roads. The Guideline suggests a number of site selections for different developments. These are summarised as below:
New housing ideally should be located near a centre, within walking distance of frequent public transport and away from direct traffic and adverse noise levels.
Strategic site selection for educational establishments and child care centres should be designed to have sufficient separation from busy roads and rail corridors to avoid noise and air quality impacts.
Similarly, other sensitive uses such as hospitals, seniors housing or place of worship should be located so as to minimise the effects of adverse noise and air quality on occupants.
The Guideline took a comprehensive study on development impacted by rail corridors and busy roads. The study shows that although rail operation and busy roads generate noise and vibration, these rarely cause damage to hearing. On the other hand however, psychological and physiological effects such as fatigue due to sleep deprivation can occur. To the extent that the Guideline supports residential development away from busy road corridors, it can be construed as being supportive of Enterprise Corridor zonings in these areas. The Guideline highlights that good design requires careful consideration of a whole range of factors – noise and vibration. This allows more opportunity to address noise and vibration through setbacks, building orientation, layout, building height controls or noise barriers.
Kogarah Town Centre Development Control Plan No.5
The Kogarah Town Centre Development Control Plan (DCP) No. 5 provides a framework to guide private investment and development of the town centre. The most important role the DCP will have is guiding the type of development and helping to reinforce a distinct Kogarah identity. The document specifies built form controls, outlines desired future character and sets in place a suite of urban and environmental design guidelines to help achieve the vision of Kogarah as a vibrant urban village. A broad aim for the policy is for the Kogarah Town Centre to be a vibrant village providing learning, leisure, living and working opportunities and services (especially medical and healthcare) for residents of the municipality, the St George District and the wider Southern Sydney Region. It sets out a number of objectives to preserve and enhance Kogarah’s distinctive identity and character. These include:
The village atmosphere is maintained and strengthened
The human scale and people friendly environment is enhanced
New buildings and streetscapes display a distinctive character
New development respects and enhances existing items of heritage
Streets and open spaces are safe and attractive for all pedestrians, including people with disabilities
Emphasis is placed on encouraging opportunities for social activities and community celebrations. Also, the DCP aims to build on Kogarah’s strengths as a:
Significant public transport interchange
Regional employment centre
Regional centre for medical services
Centre for education and learning
Centre for civic and social services
Banking centre.
Kogarah Employment Lands and Economic Development Strategy 130
Strategic Goals from the DCP relating to this study include:
2.2.3 Support the location of new higher density development close to our Centres, where there are appropriate services, amenities and public transport.
3.1 Kogarah Town Centre is recognised as the major medical, financial and educational precinct in the St George-Sutherland region.
3.1.1 Monitor existing planning controls to ensure quality outcomes are achieved for the long term benefit of the Centre.
3.3 Kogarah City has a dynamic and resilient business community that provides employment and training opportunities that meet the needs of local residents.
3.3.1 Create opportunities for sustainable local employment.
3.3.4 Support and facilitate opportunities for Home Based Businesses to grow and prosper.
Precincts
The Kogarah Town Centre DCP has identified nine precincts within the town centre and outlined their desired future character for each precinct. These include:
Railway Parade precinct – maintain the role of the main street in the Kogarah town centre, with predominantly retail uses, and associated residential or commercial development above or behind shops.
Premier Street Precinct – encourage commercial uses such as small offices, retail and home offices in the ground level of residential buildings.
Built form – Create a transition in scale between the St George Bank building on the south-western side of the street and the 9m high buildings on Gladstone Street, with new 15m and 12m high buildings on the north-eastern side of the street.
Montgomery Street Precinct – reinforce Montgomery Street as a major mixed use, active street, encompassing retail, commercial and medical/civic uses with retail shop fronts along much of its length; provide an active retail street frontage in any re-development of the existing St George TAFE building; and provide predominantly commercial and medical uses associated with the two hospitals at the hospital end of Montgomery Street between Kensington Street and South Street.
Built form – Redevelop the southern side of Montgomery Street between Kensington and South Street, with buildings having the lower three or four-storeys built to the proposed building alignment. Set back the upper storeys 3m from the alignment or mark storeys 3 or 4 with a strong cornice line.
Belgrave Street Precinct – encourage civic, medical, retail and residential activities in the precinct, with a new Town Square, new Hospital Entry, medical suites and medium density residential development.
Built form – relate to the height of the Greek Orthodox Church and allow sunlight access to the Town Square opposite, with 12m high buildings adjacent to the church and facing the square.
Princes Highway Precinct – encourage the development of offices, showrooms, medical uses and residential development fronting the Princes Highway.
Kensington Street Precinct – encourage a range of overlapping uses along Kensington Street, including commercial offices, residential, medical and public buildings.
The Hospital Precinct – maintain its current uses by St George Public Hospital, St George Private Hospital, Bethany College and St Patrick’s Church.
Chapel Street Precinct – encourage complementary overlapping uses comprised mainly of medical and residential uses and allow for improved accommodation of medical uses through the development of purpose built facilities, since detached houses are generally not the most appropriate building type for medical uses.
Built form – provide perimeter block, four-storey residential and medical buildings, around landscaped courtyards.
Railway Parade South Precinct – increase the diversity of uses to include residential uses, provide for commercial uses such as small offices and specialist retail on the ground floor fronting Railway Parade, and encourage the continuation of the RSL use and the provision of community related uses within the block between Blake Street and English Street.
Built form – reinforce the two-storey street wall height by setting back upper levels of the buildings; introduce breaks in the building massing at upper levels to reduce the buildings’ apparent scale; and establish a consistent ‘build to’ line along a 2 metre front setback on Railway Parade to create a consistent edge to the street.

Kogarah Employment Lands and Economic Development Strategy 131
Building Heights
The DCP has two separate maximum building heights for commercial only development and for mixed use development. Where building is fully commercial (no residential component), the maximum building height may be increased as follows to facilitate higher floor to ceiling heights. The precincts A to K have varying height limits and conditions applying to these sites.
TABLE 4 6. MAX IMUM B UIL DI NG HEI G HT S
Mixed residential commercial development
Maximum Height
Fully commercial development
Maximum Height
9m 10.2m 12m 13.8m 15m 17.4m 18m 21.6m
Source: Kogarah City Council, 2010.
In protecting the built form, maximum building heights have been set. This is shown in FIGURE 27. For maximum height, this may vary according to land use.
FIG URE 27. BUIL DI NG HEIG HT S PL A N
Source: Kogarah City Council, 2010
Another important built form control is the ‘Twin Peak Form of the Town Centre’, which states that the roof of any other buildings must not be higher than the roof of the St George Bank and St George Public Hospital.

Kogarah Employment Lands and Economic Development Strategy 132
Building Density
The maximum floor space ratios for the Kogarah Town Centre are specified in Figure 28.
FIG URE 28. FLOOR SPACE RAT IO PL A N
Source: Kogarah City Council, 2010
The Kogarah Town Centre DCP also has detailed built form, urban design, environmental design and specific requirements for the Kogarah Town Square.
Commercial and Industrial Lands Development Control Plan
The Commercial and Industrial Lands Development Control Plan was prepared by Kogarah City Council to guide commercial and industrial developments within the Kogarah LGA. It has been developed to provide specific objectives and design controls for each of the smaller commercial localities within the LGA, as well as providing generic controls for industrial zoned land.
The strategic goals from the DCP that are relevant to this study include:

Kogarah Employment Lands and Economic Development Strategy 133
2.2.3 Support the location of new higher density development close to our Centres, where there are appropriate services, amenities and public transport.
2.3.5 Provide appropriate levels of public parking in our centres.
3.3.1 Create opportunities for sustainable local employment.
This DCP consists of four key sections: commercial design controls, controls for industrial development, environmentally sustainable development and waste minimisation and subdivision. Currently, there are 20 commercial centres in the Kogarah Municipality zoned as Business 3(a) – Business (Local Centre). The DCP is set out in two parts: the first part provides performance criteria and design solutions and controls while the second part details specific Locality Controls for each of the identified localities. Where the controls contained in the general section of this chapter are inconsistent with the specific controls for a Locality, the Locality Controls take precedence.
General commercial design controls
The objectives for commercial design controls place an emphasis on mixed-use development and design guidelines that are economically viable. The commercial design section includes objectives and performance criteria for home office uses. The objectives for home offices are to:
provide opportunities for people to work from home, reducing their need to use a motor vehicle for work trips
contribute to the economic growth of the town centre and achieve a diverse local workforce, and
improve personal and property safety by maximising casual surveillance of the street.
The performance criteria outlined to achieve the above objectives are focused on designing apartments to facilitate and encourage opportunities for occupants to work from home. They include:
clearly identify the home office area, ideally by designing it so that it can be closed off from the rest of the apartment. The design should be sufficiently flexible to allow later or alternate use as part of the residence
ensure that home office needs including storage, additional telephone and electrical capacity, and task lighting can be met
windows may not be used for the display of goods or merchandise.
General industrial development controls
Within the Kogarah LGA there are three localities zoned for general industrial 4(a) including Carlton Industrial Area, Halstead Street Industrial Area and Blakehurst Industrial Area. An objective of the industrial zones relevant to this study is to ensure that industrial development in close proximity to residential areas does not have a detrimental effect on such areas. In terms of key controls, the following maximum’s apply:
FSR of 1:1
25 percent for office or showroom (except for bulky goods establishments)
10 metre height limit
Subdivision
Most properties within the business zone and in some of the industrial zones are characterised by small narrow allotments and fragmented ownership. This impacts on the redevelopment of some sites and severely restricts the provision of adequate and efficiently designed off-street parking areas. To prevent further subdivision of this type and also to ensure that sites are not isolated a number of minimum lot size and dimensions apply to commercial and industrial areas:
General Business 3(a) zone
Minimum width: 18m

Kogarah Employment Lands and Economic Development Strategy 134
Minimum Area: 500 square metres
Industrial 4(a) zone
Minimum width: 18m
Minimum Area: 750 square metres
Ramsgate Centre DCP
Ramsgate Centre Development Control Plan was prepared by Kogarah City Council using the principles of the adopted Ramsgate Centre Master Plan and provides specific detail as to the overall built form of the future Ramsgate Centre. This DCP aims to provide a framework to guide development within the Kogarah side of the Ramsgate Centre to create opportunities for sustainable local employment. Site amalgamations are encouraged to facilitate appropriate development within the Ramsgate Centre. The DCP defines ideal site amalgamation requirements for the Ramsgate centre (FIGURE 29). To encourage site amalgamation a higher FSR is allowable on amalgamated lands.
FIG URE 29. S I TE AMALG AM ATIO N RE QUIREME NT S
Source: Kogarah City Council, 2010
A general objective of the zone is to enable and encourage land uses, which allow for mixed-use development for employment opportunities and a growing residential population. In terms of buildings heights, a three storey height along Rocky Point Road frontage is allowed, with a fourth storey setback from the Rocky Point Road frontage. Greater heights are allowed at the junction of Rocky Point Road and Ramsgate Road and on gateway or special sites to delineate the entrance and exit to the Ramsgate Centre. Floorspace bonuses are also provided where there are deemed to be community benefits accruing from development, such as the creation of a rear lane access and arcades within developments.
Interim Commercial and Industrial DCP No. 2
The Interim Commercial and Industrial DCP came into effect in 1998. While the 2007 Commercial and Industrial DCP has largely replaced this DCP, it still applies to South Hurstville village and several other small clusters of development. The main controls that apply to the South Hurstville Village are FSR and height controls. For the South Hurstville Village an FSR of 0.5:1 applies, while a maximum FSR of 1:1 applies if residential development is included as a part of a mixed use development. A height limit of nine metres to the ridge or peak of roof applies.

Kogarah Employment Lands and Economic Development Strategy 135
APPENDIX 4: CONSULTATION REPORT
For this study a range of stakeholders were consulted including:
St George Public Hospital
South Hurstville RSL
Kogarah RSL
Hurstville RSL
St George Bank Building owners
Kogarah Chamber of Commerce
Business Enterprise Centre - St George and Sutherland Shire
Commercial property group
Laing and Simmons
St George Private Hospital
TAFE
Kogarah Town Centre Owner
St George Police
Hurstville Police
St George Leagues Club
St George Bank
South Hurstville Market place
Oatley Shopping Village
Oatley Pub
Oatley RSL
Consultation with key stakeholders centred on the main themes:
major economic drivers
strengths and weaknesses
opportunities and threats
industries that should be targeted for future expansion
planning controls
Kogarah City Council’s role in supporting and attracting development Given the primacy of the Kogarah Town Centre as the largest centre in the LGA, most stakeholders focused their responses on this centre. Consultation with commercial real estate agents focussed on the performance and nature of the commercial office, retail and industrial markets in Kogarah. Major economic drivers
There was agreement that the St George Public and Private Hospitals and health and allied services as well as the St George Bank headquarters were the major economic drivers for the Kogarah Town Centre. It was advised that the Kogarah Town Centre lacked a viable non-discretionary spend retail market.
Strengths and weaknesses of Kogarah Again the focus here was on the Kogarah Town Centre, with the major strengths seen to be:
refurbishment of the Kogarah Town Centre shopping centre

Kogarah Employment Lands and Economic Development Strategy 136
good transport – buses, trains and taxi
location of police station
amenity of the town square
mix of good uses There was no mention of the large employers such as the hospitals as a strength and there was even a suggestion that the hospitals ‘on the surface a strength as it brings with it potential clients of the retail and professional businesses in Kogarah.’ There was even some suggestion that the high level of visitation associated with the hospitals may be to the detriment of local retail as it absorbs much of the available parking in the centre. Carparking and congestion was raised most frequently as one of the biggest weaknesses associated with the Kogarah Town Centre. Other weaknesses focussed on safety and location. In terms of carparking and congestion the main issues raised were:
there is a lack of parking in Kogarah Town Centre and other centres such as South Hurstville and Hurstville
traffic congestion is an issue the Kogarah Town Centre
restricted parking creates anxiety for hospital patients
hospital is a strength from a medical perspective, but could be construed as a weakness to other uses that require carparks
school zones along Gray, Short and Chapel Street slow traffic down There were concerns that retail patrons ‘avoid Kogarah [Town Centre] because they cannot be guaranteed somewhere to stop’ and that the situation was going to decline as ‘increasing employment is not mirrored by increased facilities.’ The issue of safety was raised regarding the Kogarah Town Centre. There was the perception that Kogarah Town Centre was unsafe in the evenings. The most prominent issue was the methadone clinic and the patients it attracts, with one stakeholder indicating that the patients ‘cause significant disruption to pedestrian access along Railway Parade and near Kogarah station’ and another suggesting that Kogarah Town Centre did ‘not need any more junkies/drug addicts roaming the streets of the Kogarah CBD and surrounding areas’. SGS spoke to the Council regarding these comments and they advised that issues do arise on occasions from clients attending the methadone clinic. However, the Council indicated that these are not permanent issues and that there are a number of strategies currently in place that successfully address these when they do arise. Council indicated that they have an ongoing Safety Plan, which has seen a number of projects implemented in the Kogarah CBD to improve safety. They annually conduct safety audits in the area in conjunction with local police and address all recommendations arising from them. Surveys done on a regular basis regarding perceptions of safety in the CBD both during the day and night also show this is not as large a problem as stated. Additionally, the crime statistics also do not suggest safety is as an important issue as raised in consultation. Several physical features of the Kogarah Town Centre were also mentioned as weaknesses. The Kogarah LGA, in particular the Major Centre, was viewed as having a strong north-south integration, but little market to the east to west. This was seen as an important factor in limiting the development and influence of Kogarah as a regional centre. The Kogarah Town Centre’s close location to the Rockdale and Hurstville centres was also seen as a limiting factor. The fragmented ownership in the Kogarah Town Centre and other centres in the LGA was viewed as a major weakness. Fragmented ownership makes it exceedingly difficult to increase floorspace as the costs – both time and money – of acquiring sites to redevelop is prohibitively expensive. There was some discussion regarding the weaknesses of Hurstville. The Hurstville Town Centre is split by the rail line, with the majority to the north of the line in the Hurstville LGA. It was suggested from consultation that the Hurstville centre (Kogarah section) services commuter traffic and local convenience shopping, but at night it is isolated and quiet. Whereas the northern part of Hurstville centre has a healthy restaurant based night-time economy. Similar to Kogarah Town Centre, there was a perception that Hurstville was unsafe at night. Key opportunities and threats for different industries in the LGA The key opportunities suggested by the stakeholders include:
the medical sector increasing over time due to an increase of patients associated with the ageing population

Kogarah Employment Lands and Economic Development Strategy 137
potential opportunities for redevelopment of the strip between RSL and Kogarah Town Centre
strengthening of the food retail offering in the Kogarah Town Centre to include more night-time restaurants Some of the potential threats indicated were:
further congestion limiting the development of the Major Centre
more residential in the Kogarah Town Centre is an opportunity
lack of demand for office space
vulnerability from having several large employers Most appropriately targeted industries for future expansion
From consultation the medical sector was frequently mentioned as one that should be targeted for the centre.
While a majority suggested that a stronger food retail offer should be targeted, especially for evenings, some
suggested that the constant turnover of food premises in the centre indicated there was an oversupply.
Although some suggested that additional businesses in the finance sector should be targeted, others were more practical about the synergies between the St George Bank headquarters and other finance based businesses. It was indicated that the bank is self-contained and does not provide positive spinoffs to other financial businesses.
Planning controls There were no suggestions that the planning controls in the Kogarah LGA were overly restrictive, with the exception of the current FSR in the South Hurstville village. It was suggested that the FSR control here was hindering feasible development. Kogarah City Council’s role in supporting and attracting development Consultation suggested that a realistic role for Council in attracting and or supporting development is that of a ‘gatekeeper’. It was suggested by some that Council has a good relationship with stakeholders and has been quite receptive of stakeholders need, but that they also need to ensure open and transparent processes that involve key stakeholders in plan-making. There was a suggestion from several stakeholders that a Masterplan should be developed for the Kogarah Town Centre to provide more certainty and a plan of action for the centre. It was also suggested that Council have a more proactive approach with engaging stakeholders in plan-making.
Property market consultation
Property market consultation was also undertaken to gain a greater understanding of the drivers in the Kogarah property market. The following questions and answers reveal the commercial office, retail and industrial property market dynamics. How is the commercial and retail property market performing in the Kogarah area? Retail
Retail is going quite well
There isn’t much retail vacancy, especially in the prime market.
There are some vacancies in the edge sites. But this is due to unrealistic asking prices from landlords
There aren’t many discount-variety ($2 dollar shops) stores, which indicates the strength of retail in the Kogarah centre
Office is all upstairs, with the exception of real estate agents downstairs, again indicating the strength of main street retail
Commercial
There isn’t a very strong commercial office market in Kogarah
Most demand is for B and C-grade office
There are some large A-grade vacancies in the centre. Tenants cannot afford the cost of A-grade space due to the high fit-out costs and lack of demand

Kogarah Employment Lands and Economic Development Strategy 138
All typical smaller and suburban type office spaces will turnover but the large space is hard to move Kogarah doesn’t really have a strong office market – outside of the St George bank, several medical suites and government uses there isn’t much depth
There are many long-term owners, so there isn’t a strong imperative for the higher rates of return
There are some long-term vacancies of A-grade space Industrial
Carlton is performing very strongly with recent demand for warehousing space coming from Hurstville Town Centre and even the airport. The car based industries are being pushed out by higher value warehousing uses
What are the main issues currently affecting the commercial office and retail market of the in Kogarah?
There is an overall lack of demand
Price is an issue – it is cheaper to work from home
The relatively small size of the Kogarah Town Centre, small catchment and limited retail offering are not attractive to major office developments. However, the amenity of the Kogarah Town Centre is arguably better than the Rockdale Town Centre.
What type of commercial offices and retail are most in demand in these centres in terms of:
The following size, rent and sale price were indicated:
AC HIE VABLE LEASE AND SALE P RICE FOR COMME RCI AL SPACE
Commercial
Size (sqm) 50- 200 Rent price (sqm) A-grade: $380-400
B and C-grade: $180-260 Sale price (sqm) A-grade: $4,500
B and C-grade: $3-3,500 Most demanded B-grade to C-grade
Achievable rents and sales prices also vary based on floorplates, with larger floorplates generally offering a lower per square metre rate:
AC HIE VABLE LEASE AND SALE P RICE FOR NE W C OM MERCI AL DE VELOPMEN T – DI FFERE NT FLOORPL ATES
Size (sqm) Lease price per (sqm) Sale price (sqm)
100-200 400-450 5-5,500 300 350-450 4-4,500
What types of industries or businesses are attracted to Kogarah centre? And why is this?
Medical – due to presence of hospitals
Government – clients due to role of centre
Accountants – servicing local area
Legal – servicing local area
Various professionals – servicing local area
How could the Kogarah Town Centre better compete with Hurstville and Rockdale centres?
In terms of retail, Kogarah Town Centre doesn’t really compete. They are fairly self-contained markets, with higher level shopping going to Hurstville and to a lesser extent Rockdale. The commercial office market is not as large as Hurstville’s, but there is more parking and less congestion than Hurstville centre and a higher number of vacancies in the Hurstville office market.

Kogarah Employment Lands and Economic Development Strategy 139
Do think that there is opportunity or demand to expand existing centres in Kogarah?
South Hurstville village needs to be expanded. The current FSR or 1.3:1 is currently not feasible. Do think that there is opportunity or demand to expand existing enterprise corridor along Rocky Point Road and Princes Highway? Could it be expected that residential development would ‘turnover’ to commercial uses along this corridor?
Rocky Point Road is not vibrant, but there are food places and some smaller offices
The only way they would turnover is for mixed-use development
Could be an opportunity for bulky goods retail
There is a lack of demand for retail space in those corridors outside of the centres. The Princes highway and Rocky Point Road function as main traffic thoroughfares funnelling people into and out of Kogarah and Sutherland LGAs to the elsewhere in Sydney.
An enterprise corridor might suffer the same fate that large sections Parramatta Road face, with vacancies or low value uses. It would only work in a mixed-use scenario, where the residential development subsidises the bottom floor retail or commercial.

www.sgsep.com.au
Contact us BRISBANE
PO Box 117 Level 1, 76 McLachlan Street Fortitude Valley QLD 4006
+61 7 3124 9026 [email protected]
CANBERRA
Level 1, 55 Woolley Street Dickson ACT 2602
+61 2 6262 7603 [email protected]
HOBART
Unit 2, 5 King Street Bellerive TAS 7018
+61 (0)439 941 934 [email protected]
MELBOURNE
Level 5, 171 La Trobe Street Melbourne VIC 3000
+61 3 8616 0331 [email protected]
SYDNEY
Suite 12, 50 Reservoir Street Surry Hills NSW 2010
+61 2 8307 0121 [email protected]