korea energy demand outlook - keei · issn 1599-9009 march 2011 7pmvnf /p keei korea energy demand...
TRANSCRIPT

KEEI
KEEI
KE
EI
Korea Energy Demand Outlook
ISSN 1599-9009
KoreaEnergy
Dem
andO
utlook March 2011
March
2011
Volume 13, No. 1QUARTERLY ENERGY OUTLOOK
Korea Energy Economic Institute132 Naesonsunhwan-ro, Uiwang-si, Gyeonggi-do
Phone: (031)420-2114
Fax: (031)422-4958
E-mail : [email protected]
Hompage : http://www.keei.re.kr
Korea
Energy
Econom
icInstitute
에너지수요전망 문13-1 2011.5.20 3:27 PM 페이지1 매일3 MAC2PDF_IN 300DPI 175LPI T

ISSN 1599-9009
March 2011
Volume 13, No. 1
KEEIKorea Energy Demand Outlook
수요전망 내지13-1 문 2011.5.20 3:26 PM 페이지1 매일3 MAC2PDF_IN 300DPI 125LPI T

·In charge of overall research Choi, Do-young ([email protected])
·Petroleum Kim, Soo-il ([email protected])
·Electricity/Transformation Choi, Do-young ([email protected])
·Town gas/Coal Lee, Sang-youl ([email protected])
·Research support Lee, Bo-hye ([email protected])
·Research support Hwang, In-wook ([email protected])
·Statistical support Chung, Chang-bong ([email protected])
Phone: +82-31-420-2148, +82-31-420-2234
Fax: +82-31-420-2164
KEEI Korea Energy Demand Outlook
The 「KEEI Korea Energy Demand Outlook」is a report that analyzes trends in theinternational energy market and energy supply/demand trends in Korea, and makesshort-term forecasts on energy demand.
This report quickly identifies recent changes in energy supply and demand, thusproviding various energy supply/demand forecast indexes and information forgovernment policies. It is intended to contribute to government efforts in setting andadjusting an overall policy direction regarding energy supply and demand.
This report was written and edited by the Energy Demand and Supply ForecastTeam under the Center for Energy Information and Statistics of KEEI.
수요전망 내지13-1 문 2011.5.20 3:26 PM 페이지2 매일3 MAC2PDF_IN 300DPI 125LPI T
Summary ………………………………………………………………………………………… 7
Ⅰ. International Energy Market Trends…………………………………………………… 33
1. Trends in the international oil market and oil exports/imports ……………………… 35
2. Trends in international natural gas and coal prices ………………………………… 37
Ⅱ. Economic and Energy Consumption Trends in Korea …………………………… 39
1. Economic trends in Korea ……………………………………………………………… 41
2. Trends in primary energy consumption ……………………………………………… 45
3. Trends in final energy consumption …………………………………………………… 56
4. Trends in petroleum product consumption…………………………………………… 65
5. Trends in electricity consumption ……………………………………………………… 72
6. Trends in LNG and town gas consumption ………………………………………… 79
7. Trends in coal and other energy consumption ……………………………………… 84
Ⅲ. Energy Demand Outlook for 2011 …………………………………………………… 89
1. Outlook on the international oil market………………………………………………… 91
2. Domestic economic outlook and outlook assumptions …………………………… 93
3. Outlook on primary energy demand…………………………………………………… 96
4. Outlook on final energy demand……………………………………………………… 103
5. Outlook on petroleum product demand …………………………………………… 109
6. Outlook on electricity demand………………………………………………………… 111
7. Outlook on LNG and town gas demand …………………………………………… 116
8. Outlook on coal and other energy demand ………………………………………… 119
9. Demand forecast characteristics and implications ………………………………… 125
Contents
3http://www.keei.re.kr
Summary
Table of Contents for Titles
수요전망 내지13-1 문 2011.5.20 3:26 PM 페이지3 매일3 MAC2PDF_IN 300DPI 125LPI T

KEEI Korea Energy Demand Outlook
4 KOREA ENERGY ECONOMICS INSTITUTE
<TableⅠ-1> Changes in international crude oil prices ……………………………………………… 35<TableⅠ-2> Changes in consumer prices of petroleum products in Korea ……………………… 36
<TableⅡ-1> Recent economic trends ………………………………………………………………… 42<TableⅡ-2> Composite index…………………………………………………………………………… 44<TableⅡ-3> Primary energy consumption trends …………………………………………………… 47<TableⅡ-4> Level of contribution of each factor that led to a rise in primary energy consumption … 52<TableⅡ-5> Temperature effect regarding an increase in primary energy consumption………… 54<TableⅡ-6> Trends in final energy consumption……………………………………………………… 57<TableⅡ-7> Expansion of facilities that consume a great amount of electric power in 2010…… 62<TableⅡ-8> Trends in petroleum product consumption by sector ………………………………… 66<TableⅡ-9> Trends in key petroleum product consumption ……………………………………… 68<TableⅡ-10> Trends in electricity consumption ……………………………………………………… 72<TableⅡ-11> Expansion of plant capacity for each source in 2010 ……………………………… 76<TableⅡ-12> Changes in peak demand in the winter ……………………………………………… 78<TableⅡ-13> Heating load in the winter ……………………………………………………………… 78<TableⅡ-14> Trends in LNG consumption …………………………………………………………… 80<TableⅡ-15> Trends in town gas consumption ……………………………………………………… 82<TableⅡ-16> Pig iron production, shipment, and inventory,
and bituminous coal consumption for steel making ………………………………… 85<TableⅡ-17> Trends in coal consumption …………………………………………………………… 86<TableⅡ-18> Trends in consumption of thermal energy, new & renewable energy, and other energy … 88
<TableⅢ-1> IEA’s global oil consumption figures and forecasts …………………………………… 91<TableⅢ-2> Oil price outlook for 2010 and 2011 (Dubai oil)………………………………………… 92<TableⅢ-3> Oil price outlook of key overseas organizations in March …………………………… 92<TableⅢ-4> Economic outlook for 2011 ……………………………………………………………… 94<TableⅢ-5> Assumptions on temperature variables ………………………………………………… 95<TableⅢ-6> Outlook on primary energy demand …………………………………………………… 96<TableⅢ-7> Key indices related to energy consumption …………………………………………… 98<TableⅢ-8> Outlook on final energy demand ……………………………………………………… 104<TableⅢ-9> Outlook on petroleum product demand by sector…………………………………… 109<TableⅢ-10> Outlook on demand of key petroleum products …………………………………… 110<TableⅢ-11> Outlook on electricity demand………………………………………………………… 111
Table of Contents for Tables
수요전망 내지13-1 문 2011.5.20 3:26 PM 페이지4 매일3 MAC2PDF_IN 300DPI 125LPI T

SummaryContents
5http://www.keei.re.kr
<TableⅢ-12> Trends in GDP elasticity of electricity demand ……………………………………… 112<TableⅢ-13> Outlook on electricity supply/demand in the summer of 2011 …………………… 116<TableⅢ-14> Outlook on LNG demand……………………………………………………………… 117<TableⅢ-15> Outlook on town gas demand………………………………………………………… 118<TableⅢ-16> Outlook on steel production…………………………………………………………… 120<TableⅢ-17> Outlook on coal demand ……………………………………………………………… 121<TableⅢ-18> Outlook on thermal energy, new & renewable energy, and other energy demand… 123<TableⅢ-19> Outlook on energy intensity …………………………………………………………… 125<TableⅢ-20> Outlook on energy transformation loss in transformation sector ………………… 128<TableⅢ-21> Trends in winter peak demand and heating load…………………………………… 131<TableⅢ-22> Forecasts on electricity supply/demand for the summer of 2011………………… 135<TableⅢ-23> Temperature effect on primary energy consumption increase …………………… 136<TableⅢ-24> Energy consumption and import and outlook ……………………………………… 138
[DiagramⅠ-1] Changes in petroleum product import prices and consumer prices ……………… 36[DiagramⅠ-2] Changes in international coal and LNG prices ……………………………………… 38
[DiagramⅡ-1] Business Cycle Clock (BCC) …………………………………………………………… 44[DiagramⅡ-2] Recent economic and primary energy consumption trends ……………………… 46[DiagramⅡ-3] Trends in primary energy consumption increase rate ……………………………… 49[DiagramⅡ-4] Level of contribution to the primary energy increase rate by each factor in 2010 ………… 52[DiagramⅡ-5] Level of contribution of each factor towards the annual primary energy increase rate …… 53[DiagramⅡ-6] Assumed changes in primary energy consumption caused by the temperature effect …… 54[DiagramⅡ-7] Changes in HDD ………………………………………………………………………… 55[DiagramⅡ-8] Changes in CDD ………………………………………………………………………… 55[DiagramⅡ-9] Level of contribution of each energy source to primary energy increase in 2010 ………… 56[DiagramⅡ-10] Final energy consumption by energy source and use……………………………… 58[DiagramⅡ-11] Business trends in the manufacturing industry and changes in electricity
consumption for industrial use ……………………………………………………… 59[DiagramⅡ-12] Trends in the rate of final energy consumption increase by sector ……………… 60[DiagramⅡ-13] Changes in the petroleum product consumption increase rate by sector ……… 67[DiagramⅡ-14] Changes in gasoline consumption and increase rate ……………………………… 69[DiagramⅡ-15] Changes in consumption of diesel for transport and increase rate ……………… 69
Table of Contents for Diagrams
수요전망 내지13-1 문 2011.5.20 3:26 PM 페이지5 매일3 MAC2PDF_IN 300DPI 125LPI T

KEEI Korea Energy Demand Outlook
6 KOREA ENERGY ECONOMICS INSTITUTE
[DiagramⅡ-16] Changes in consumption of kerosene and diesel, and increase rate …………… 70[DiagramⅡ-17] Changes in consumption of heavy oil and increase rate ………………………… 70[DiagramⅡ-18] Changes in consumption of naphtha and increase rate…………………………… 71[DiagramⅡ-19] Changes in LPG consumption and increase rate ………………………………… 71[DiagramⅡ-20] Recent manufacturing business trends and electricity consumption for industrial use…… 74[DiagramⅡ-21] Rate of increase in industrial activity indexes and electricity consumption
for industrial use (First quarter of 2009 - Fourth quarter of 2010)………………… 75[DiagramⅡ-22] Changes in the electricity consumption increase rate……………………………… 76[DiagramⅡ-23] Changes in peak demand and supplied reserve margin ………………………… 77[DiagramⅡ-24] Changes in heating load by use ……………………………………………………… 79[DiagramⅡ-25] Trends in LNG consumption increase rate per use………………………………… 81[DiagramⅡ-26] Trends in town gas consumption increase rate per use…………………………… 83[DiagramⅡ-27] Changes in the rate of increase in pig iron and bituminous coal for steel making ……… 84
[DiagramⅢ-1] Changes in CDD and HDD and assumptions for 2011 …………………………… 95[DiagramⅢ-2] Forecasts on the economic growth rate and primary energy increase rate ……… 97[DiagramⅢ-3] Trends in primary energy consumption and assumptions on
consumption changes triggered by temperature effects …………………………… 97[DiagramⅢ-4] Forecasts on energy intensity and per capita consumption………………………… 99[DiagramⅢ-5] Share of primary energy demand taken up by each energy source …………… 102[DiagramⅢ-6] Forecasts on level of contribution of each energy source to increase in primary energy … 103[DiagramⅢ-7] Share of final energy demand occupied by each energy sector ………………… 107[DiagramⅢ-8] Share of final energy demand taken up by each energy source ………………… 108[DiagramⅢ-9] Outlook on economic growth rate and electricity demand increase rate ……… 113[DiagramⅢ-10] Outlook on electricity demand by sector…………………………………………… 113[DiagramⅢ-11] Trends in electricity consumption share of each sector and forecasts ………… 114[DiagramⅢ-12] Town gas trends and outlook by use ……………………………………………… 119[DiagramⅢ-13] Coal trends and forecasts …………………………………………………………… 122[DiagramⅢ-14] Thermal energy trends and outlook ………………………………………………… 123[DiagramⅢ-15] Trends and outlook on new & renewable energy and other energy …………… 124[DiagramⅢ-16] Level of contribution of electricity to primary energy increase …………………… 127[DiagramⅢ-17] Trends in electricity consumption increase and energy loss factor increase … 129[DiagramⅢ-18] Changes in peak demand and supplied reserve margin ………………………… 130[DiagramⅢ-19] Changes in share of winter peak demand taken up by heating load…………… 131[DiagramⅢ-20] Trends in oil dependence and forecasts…………………………………………… 132[DiagramⅢ-21] Comparison between economic growth rate and summer peak demand increase rate …… 133[DiagramⅢ-22] Trends in monthly peak demand and forecasts ………………………………… 134
수요전망 내지13-1 문 2011.5.20 3:26 PM 페이지6 매일3 MAC2PDF_IN 300DPI 125LPI T

Summary
7http://www.keei.re.kr
Primary energy consumption for 2010 has been tentatively tallied at 261.2 million TOE,
a year-on-year rise of 7.3%.
Primary energy consumption went up by 10.5% in the first quarter and 7.5% in the
second quarter according to changes in the economic growth rate by quarter. The
rate of increase stood at 5.3% in the third quarter and 6.1% in the fourth quarter,
indicating a slight slowdown in the level of increase in the second half of the year.
* Economic growth rate: (First quarter) 8.1% → (Second quarter) 7.2% → (Third
quarter) 4.4% → (Fourth quarter) 4.8%
The rise in primary energy consumption in 2010 is attributable to the economic
recover(including base effects from the economic downturn of the previous year) and
the climate (abnormally low temperatures in the winter and high temperatures and
high humidity in the summer).
In 2010, primary energy consumption, excluding energy for raw materials (naphtha
and coking coal), reached 200.9 million TOE, year-on-year growth of 7.2%.
- Energy for raw materials accounted for 23.1% of primary energy consumption (as of 2010).
Trends in energy consumption
Summary▶
[Recent economic and primary energy consumption trends]
수요전망 내지13-1 문 2011.5.20 3:26 PM 페이지7 매일3 MAC2PDF_IN 300DPI 125LPI T

Notes: 1) Values in parentheses refer to the rate of increase from the same period the previous year; p refers to tentativefigures
2) LNG consumption includes the estimated directly-adopted and consumed volume of POSCO and K-POWER
Trends in consumption of each energy source in 2010
In 2010, coal consumption witnessed a year-on-year rise of 10.3%. The level of
8 KOREA ENERGY ECONOMICS INSTITUTE
KEEI Korea Energy Demand Outlook
Category2009 2010p 2011p
1/4 2/4 3/4 4/4 Annual 1/4 2/4 3/4 4/4 Annual January
Coal 25.0 25.1 29.2 29.2 108.4 30.7 27.7 30.1 31.0 119.5 10.6
(Million ton) (-0.3) (-0.1) (7.3) (8.6) (4.0) (22.9) (10.6) (3.3) (6.3) (10.3) (-8.5)
-Excluding 20.4 20.3 23.6 23.3 87.6 23.3 21.6 24.3 24.9 94.1 8.5
coking coal (6.2) (5.6) (10.9) (11.6) (8.7) (14.2) (6.2) (3.0) (6.8) (7.4) (5.7)
Oil 199.1 192.5 183.6 203.2 778.5 198.8 193.5 192.1 210.1 794.5 73.3
(Million bbl) (-2.8) (5.3) (0.4) (6.9) (2.3) (-0.1) (0.5) (4.6) (3.4) (2.1) (5.7)
-Excluding 117.7 122.4 104.7 121.0 455.9 117.7 111.3 109.1 124.7 462.8 42.7
naphtha (-3.6) (4.9) (1.1) (3.9) (1.5) (0.0) (-1.0) (4.2) (3.1) (1.5) (4.1)
LNG 8.5 4.6 4.6 8.4 26.1 10.7 6.5 5.5 9.4 32.0 4.9
(Million ton) (-14.7) (-11.8) (-2.0) (11.0) (-4.9) (25.0) (39.8) (20.2) (11.8) (22.6) (20.2)
Hydro 0.8 1.4 2.5 0.9 5.6 1.2 1.6 2.1 1.5 6.3 0.3
(TWh) (-12.3) (9.1) (4.8) (-4.2) (1.4) (48.0) (10.5) (-18.6) (66.5) (11.6) (-35.0)
Nuclear power 36.6 37.3 37.2 36.6 147.8 36.0 36.5 37.2 37.8 147.5 12.4
(TWh) (-8.2) (3.1) (-0.8) (-1.9) (-2.1) (-1.6) (-2.3) (0.0) (3.2) (-0.2) (-6.3)
Other 1.3 1.3 1.3 1.6 5.5 1.5 1.5 1.4 1.8 6.2 0.5
(Million TOE) (8.5) (6.6) (5.6) (1.9) (5.4) (12.1) (13.2) (14.2) (14.0) (13.4) (10.8)
Primary energy 62.5 56.9 58.2 65.7 243.3 69.1 61.2 61.3 69.7 261.2 25.9
(Million TOE) (-5.1) (1.3) (2.0) (6.5) (1.1) (10.5) (7.5) (5.3) (6.1) (7.3) (2.6)
Primary energy 48.9 43.3 44.2 51.1 187.5 53.5 46.3 46.6 54.5 200.9 20.6
-Excluding for raw (-4.5) (2.2) (3.4) (6.2) (1.7) (9.4) (7.0) (5.4) (6.6) (7.2) (7.2)materials
<Primary energy consumption trends>
수요전망 내지13-1 문 2011.5.20 3:26 PM 페이지8 매일3 MAC2PDF_IN 300DPI 125LPI T

increase was high in the first half of the year and low in the second half of the year.
- In the first half of the year, coal consumption recorded 16.7%, the highest figure in
the 2000s, resulting from a rise in coking coal consumption in the steel making
industry as well as base effects. The rate of increase in consumption slowed down
in the second half of the year to record a year-on-year comparison of 4.8%, owing
to decreased base effects.
In 2010, oil consumption recorded sound growth of 2.1%.
- Oil consumption remained weak in the first half of the year. However, there was a
substantial increase in consumption of transport fuel and oil for industrial raw
materials in the second half of the year, in addition to a sharp rise in consumption in
the transformation (power generation) sector.
In 2010, natural gas (LNG) consumption witnessed a year-on-year rise of 22.6%.
- Owing to influence from the economic recovery and climate, consumption for
production of town gas and consumption for power generation both indicated high
growth of 12.6% and 38.3%, respectively.
The level of nuclear power generation went down 0.2% in 2010, maintaining a level
similar to that recorded in the previous year.
- There was a year-on-year decrease in nuclear power generation of 1.3% from the
first through the third quarter, resulting from no additional installation of power
generation facilities and concentration of planned facility inspections. There was a
3.2% increase in the fourth quarter, when a substantial number of planned facility
inspections was completed, owing to pilot operation of Singori Nuclear Power Plant
Unit 1.
Level of contribution of each factor that led to an increase in primary energy
consumption in 2010 compared to the previous year
The economic growth factor and climate conditions explain for 84.6% (15.1 million
TOE) and 27.4% (4.9 million TOE) of the increase in primary energy consumption.
On the other hand, improvements in energy efficiency have resulted in energy
consumption reduction effects of 12.0% (17.9 million TOE).
9http://www.keei.re.kr
Summary
수요전망 내지13-1 문 2011.5.20 3:26 PM 페이지9 매일3 MAC2PDF_IN 300DPI 125LPI T

Notes: The energy efficiency effect includes all factors excluding the temperature effect and economic growth such aschanges in the industrial structure.
Level of contribution of each final energy source towards a rise in primary energy
consumption in 2010
The level of contribution of electric power (triggering energy consumption for power
generation) and energy for industrial raw materials (naphtha and coking coal) stood at
43.4% and 25.3%, respectively, accounting for 68.7% of the primary energy increase.
The level of contribution of town gas, oil, anthracite, and new & renewable energy in
the final sector stood at 15.3%, 5.4%, 3.3%, and 5.5%, respectively.
10 KOREA ENERGY ECONOMICS INSTITUTE
KEEI Korea Energy Demand Outlook
Category
Level of contribution tothe primary energy
consumption increaserate (%)
Contribution to a rise in consumption byeach factor in 2010
Contribution to change inconsumption (1,000 TOE)
Level of contribution (%)
Energy efficiency effect -2,147 -12.0 -0.9
Growth effect 15,123 84.6 6.2
Temperature effect 4,902 27.4 2.0
Change in primary energy 17,879 100.0 7.3
<Level of contribution of each factor that led to a rise in primary energy consumption>
[Level of contribution of each energy source to primary energy increase in 2010]
수요전망 내지13-1 문 2011.5.20 3:26 PM 페이지10 매일3 MAC2PDF_IN 300DPI 125LPI T

In 2010, final energy consumption rose by 7.0% from the previous year to stand at
194.9 million TOE.
Consumption in the industrial sector and residential/commercial sector indicated a
year-on-year rise of 8.8% and 7.1%, respectively, thus leading a rise in final energy
consumption.
- Consumption in the industrial sector increased by 14.6% in the first quarter and
9.4% in the second quarter, but the rate of increase slowed down to 5.8% in the
second half of the year, owing to reduced base effects and a slowdown in the level
of increase in coking coal consumption.
- Consumption in the transport sector rose by 2.0% from the previous year owing to
an upswing in consumption of gasoline and jet fuel.
- Consumption in the residential/commercial sector recorded high growth of 7.1%
due to influence from the economic recovery, and abnormally low temperatures in
the winter and high temperatures and high humidity in the summer.
- Consumption in the public/other sector marked a year-on-year rise of 6.8%.
Final energy consumption in 2010 marked year-on-year growth of 6.6% to post
134.6 million TOE, excluding energy for raw materials.
11http://www.keei.re.kr
Summary
수요전망 내지13-1 문 2011.5.20 3:26 PM 페이지11 매일3 MAC2PDF_IN 300DPI 125LPI T

Notes: Values in parentheses are the year-on-year growth rate (%); p refers to tentative figures
12 KOREA ENERGY ECONOMICS INSTITUTE
KEEI Korea Energy Demand Outlook
Category2009 2010p 2011p
1/4 2/4 3/4 4/4 Annual 1/4 2/4 3/4 4/4 Annual January
Industry 25.4 26.1 26.6 28.0 106.1 29.1 28.5 27.8 29.9 115.4 10.2(Million TOE) (-6.1) (-1.3) (0.2) (6.1) (-0.3) (14.6) (9.4) (4.7) (6.8) (8.8) (-4.9)
-Excluding for 11.8 12.5 12.6 13.4 50.3 13.6 13.7 13.2 14.7 55.2 4.8raw materials (-4.9) (-1.1) (2.8) (4.8) (0.4) (15.0) (9.7) (4.4) (9.9) (9.7) (4.1)
Transport 8.5 9.1 9.1 9.3 35.9 8.5 9.2 9.4 9.5 36.6 2.9(Million TOE) (-2.9) (0.8) (2.3) (1.3) (0.4) (0.3) (1.4) (3.7) (2.4) (2.0) (4.7)
Residential12.7 7.0 5.8 10.3 35.7 13.6 7.8 6.2 10.6 38.3 5.6/commercial
(Million TOE) (-8.2) (0.9) (1.2) (5.1) (-1.4) (7.7) (12.3) (6.0) (3.4) (7.1) (5.2)
Public/other 1.1 1.0 1.0 1.2 4.3 1.2 1.0 1.1 1.2 4.6 0.4(Million TOE) (-0.5) (11.9) (5.9) (3.6) (4.8) (6.7) (3.5) (12.6) (4.9) (6.8) (-1.5)
Total 47.7 43.1 42.5 48.7 182.1 52.5 46.6 44.5 51.3 194.9 19.1(Million TOE) (-6.0) (-0.3) (0.9) (4.9) (-0.3) (10.0) (8.0) (4.8) (5.2) (7.0) (-0.7)
Total 34.1 29.5 28.5 34.1 126.3 37.0 31.7 29.8 36.1 134.6 13.7-Excluding for
(-5.5) (0.3) (2.4) (3.8) (0.0) (8.4) (7.5) (4.8) (5.7) (6.6) (4.5)raw materials
Town gas 6.9 3.6 2.7 5.3 18.4 7.9 4.3 2.8 5.7 20.8 3.2(Billion m3) (-6.1) (-1.1) (-2.5) (5.4) (-1.5) (14.5) (20.9) (6.1) (7.8) (12.6) (2.9)
Oil 187.2 186.1 181.0 197.9 752.2 189.0 187.8 187.0 204.2 768.0 68.5(Million bbl) (-4.9) (3.6) (1.0) (6.8) (1.5) (1.0) (0.9) (3.3) (3.2) (2.1) (4.3)
-Excluding 105.8 106.0 102.1 115.7 429.6 107.9 105.7 104.0 118.7 436.3 38.0naphtha (-7.2) (2.1) (2.2) (3.5) (0.0) (1.9) (-0.3) (1.9) (2.6) (1.6) (1.5)
Electricity 100.3 94.0 99.0 101.2 394.5 112.5 103.6 109.1 109.0 434.2 43.1(TWh) (-2.3) (2.0) (2.7) (7.7) (2.4) (12.2) (10.3) (10.2) (7.7) (10.1) (8.6)
Coal 8.2 8.2 9.5 10.0 35.9 11.3 10.2 9.4 10.4 41.2 3.4(Million ton) (-15.4) (-16.4) (-0.5) (-3.3) (-8.9) (37.0) (24.1) (-1.2) (3.9) (14.7) (-27.7)
-Excluding 3.7 3.4 3.9 4.2 15.2 3.9 4.0 3.5 4.3 15.8 1.3coking coal (-7.5) (-11.5) (8.6) (-5.6) (-4.3) (6.5) (17.1) (-9.1) (3.3) (4.0) (11.8)
Thermal and1,870 1,391 1,223 1,933 6,418 2,180 1,683 1,455 2,234 7,553 879other
(Thousand TOE) (1.5) (1.7) (1.9) (4.6) (2.5) (16.6) (21.0) (19.0) (15.5) (17.7) (9.8)
<Trends in final energy consumption>
수요전망 내지13-1 문 2011.5.20 3:26 PM 페이지12 매일3 MAC2PDF_IN 300DPI 125LPI T

With regards to trends in final energy consumption by energy source in 2010, town
gas, electricity, and coal consumption recorded a year-on-year rise of 12.6%, 10.1%,
and 14.7%, respectively, thus indicating noticeable growth.
Final petroleum product consumption rose 2.1% in 2010 which is a relatively high
figure, attributable to the economic recovery and the climate.
Electricity power consumption posted a rise of 10.1%, owing to base effects from the
sluggish consumption in 2009 and an increase in consumption for heating purposes
owing to abnormally low temperatures as well as a rise in industrial activities.
Consumption of town gas recorded the highest increase - 12.6% - since 2001, amid
high consumption (24.4%) in the industrial sector.
Coal consumption went up 30.5% in the first half of the year as a result of a soar in
coking coal consumption for steel making. However, consumption by key demand
industries slowed down in the second half of the year, resulting in a rise of merely
1.4%.
Thermal energy posted a high increase rate of 10.8% owing to the dissemination of
district heating and temperature effects.
New & renewable energy consumption in the final consumption sector rose 19.9%
from the previous year, gaining strength from the government’s active implementation
of propagation policies.
In January 2011, final energy consumption recorded a year-on-year drop of 0.7% to
stand at 19.1 million TOE.
Energy consumption in the industrial sector, which takes up a high share of final
energy consumption, dropped 4.9%, thus contributing to a decrease in overall final
energy consumption.
With regard to consumption trends by energy source, there was a sharp rise in
electricity consumption, attributable to a favorable turn in industrial activities and the
cold wave.
13http://www.keei.re.kr
Summary
수요전망 내지13-1 문 2011.5.20 3:26 PM 페이지13 매일3 MAC2PDF_IN 300DPI 125LPI T
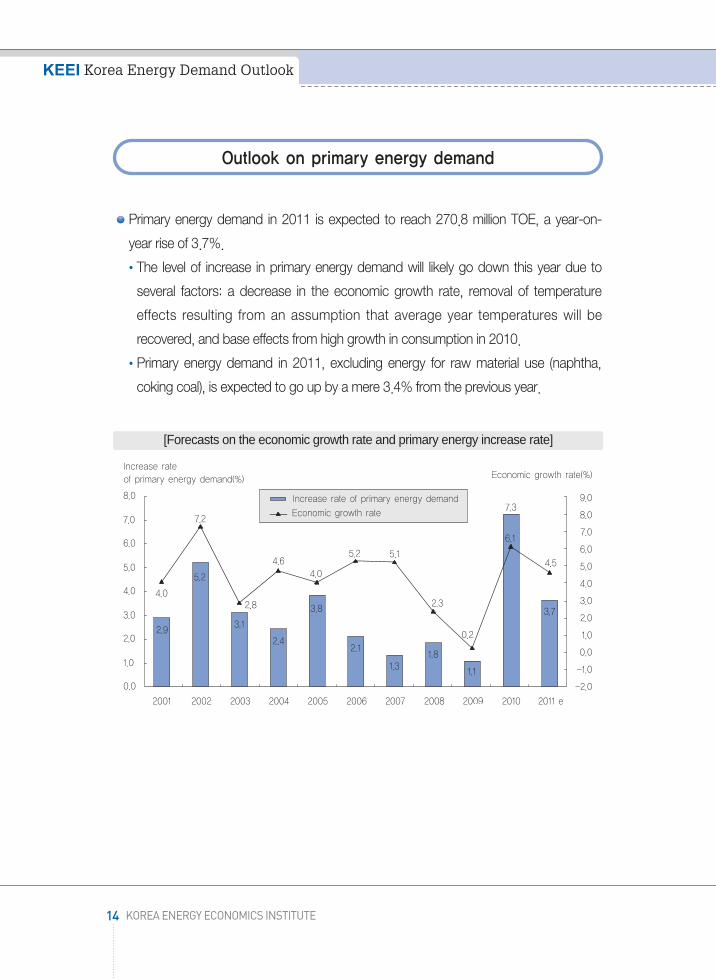
Primary energy demand in 2011 is expected to reach 270.8 million TOE, a year-on-
year rise of 3.7%.
The level of increase in primary energy demand will likely go down this year due to
several factors: a decrease in the economic growth rate, removal of temperature
effects resulting from an assumption that average year temperatures will be
recovered, and base effects from high growth in consumption in 2010.
Primary energy demand in 2011, excluding energy for raw material use (naphtha,
coking coal), is expected to go up by a mere 3.4% from the previous year.
14 KOREA ENERGY ECONOMICS INSTITUTE
KEEI Korea Energy Demand Outlook
Outlook on primary energy demand
[Forecasts on the economic growth rate and primary energy increase rate]
수요전망 내지13-1 문 2011.5.20 3:26 PM 페이지14 매일3 MAC2PDF_IN 300DPI 125LPI T

Notes: 1) Values in parentheses refer to the rate of increase from the same period the previous year; p refers to tentativefigures; e refers to estimates
2) LNG consumption includes the estimated directly-adopted volume of POSCO and K-POWER
Forecast on key energy indicators
The energy intensity (TOE/million won) deteriorated to 0.251 in 2010, continuing the
trend witnessed in 2009. However, it will likely improve to 0.249 in 2011.
Per-capita energy consumption rose from 4.99TOE in 2009 to 5.34TOE in 2010, and
is expected to reach 5.53TOE in 2011.
15http://www.keei.re.kr
Summary
Category2010p 2011e
1/4 2/4 3/4 4/4 Annual 1/4 2/4 3/4 4/4 Annual
Coal 30.7 27.7 30.1 31.0 119.5 31.3 28.4 30.7 32.0 122.4(Million ton) (22.9) (10.6) (3.3) (6.3) (10.3) (2.1) (2.3) (2.0) (3.2) (2.4)
-Excluding 23.3 21.6 24.3 24.9 94.1 23.5 21.9 24.2 25.2 94.8coking coal (14.2) (6.2) (3.0) (6.8) (7.4) (1.0) (1.4) (-0.7) (1.3) (0.8)
Oil 198.8 193.5 192.1 210.1 794.5 204.8 193.6 193.4 209.8 801.6(Million bbl) (-0.1) (0.5) (4.6) (3.4) (2.1) (3.0) (0.0) (0.7) (-0.1) (0.9)
-Excluding 117.7 111.3 109.1 124.7 462.8 119.0 109.7 108.7 123.5 460.9naphtha (0.0) (-1.0) (4.2) (3.1) (1.5) (1.1) (-1.5) (-0.4) (-1.0) (-0.4)
LNG 10.7 6.5 5.5 9.4 32.0 11.5 7.1 6.4 10.4 35.4(Million ton) (25.0) (39.8) (20.2) (11.8) (22.6) (7.6) (9.3) (16.5) (11.6) (10.6)
Hydro 1.2 1.6 2.1 1.5 6.3 1.2 1.5 2.2 1.6 6.5(TWh) (48.0) (10.5) (-18.6) (66.5) (11.6) (-2.7) (-1.9) (6.2) (11.8) (3.7)
Nuclear power 36.0 36.5 37.2 37.8 147.5 37.9 38.4 39.1 39.6 155.1(TWh) (-1.6) (-2.3) (0.0) (3.2) (-0.2) (5.3) (5.3) (5.2) (4.9) (5.2)
Other 1.5 1.5 1.4 1.8 6.2 1.6 1.7 1.5 2.0 6.8(Million TOE) (12.1) (13.2) (14.2) (14.0) (13.4) (11.2) (11.9) (6.0) (11.3) (10.2)
Primary energy 69.1 61.2 61.3 69.7 261.2 71.8 63.0 63.6 72.3 270.8(Million TOE) (10.5) (7.5) (5.3) (6.1) (7.3) (4.0) (3.0) (3.7) (3.8) (3.7)
Primary energy 53.5 46.3 46.6 54.5 200.9 55.4 47.7 48.1 56.6 207.8-Excluding for raw (9.4) (7.0) (5.4) (6.6) (7.2) (3.6) (2.9) (3.3) (3.8) (3.4)materials
<Outlook on primary energy demand>
수요전망 내지13-1 문 2011.5.20 3:26 PM 페이지15 매일3 MAC2PDF_IN 300DPI 125LPI T

Notes: p refers to tentative figures; e refers to forecasts
Forecasts on primary energy demand by energy source
In 2011, coal demand is expected to show gradual growth of 2.4%, attributable to
increased demand in the steel industry, despite a slowdown in coal consumption for
power generation (no new facilities), sluggishness in the cement industry, and base
effects from a high increase in consumption in the previous year.
- Coal demand, excluding coking coal, is expected to record a year-on-year rise of
merely 0.8%, attributable to sluggish consumption (0.4%) of bituminous coal for
power generation.
16 KOREA ENERGY ECONOMICS INSTITUTE
KEEI Korea Energy Demand Outlook
Category 2005 2006 2007 2008 2009 2010p 2011e
Economic growth rate (%) 4.0 5.2 5.1 2.3 0.2 6.1 4.5
Per capita consumption (TOE) 4.75 4.83 4.88 4.95 4.99 5.34 5.53
Primary energy consumption 3.8 2.1 1.3 1.8 1.1 7.3 3.7increase rate (%)
Energy intensity (TOE/Million won) 0.264 0.256 0.247 0.246 0.248 0.251 0.249
<Key indices related to energy consumption>
[Forecasts on energy intensity and per capita consumption]
수요전망 내지13-1 문 2011.5.20 3:26 PM 페이지16 매일3 MAC2PDF_IN 300DPI 125LPI T

In 2011, oil demand is expected to record a year-on-year rise of 0.9% to reach 801.6
million bbl.
- Oil demand for industrial use is expected to indicate relatively high growth (1.8%) as
a result of increased consumption for raw material use, but the level of increase is
expected to decrease in comparison to 2010 owing to a decrease in oil demand for
heating purposes (-1.4%) based on the assumption that average year temperatures
will be recovered.
- Petroleum product demand, excluding naphtha, will likely post a year-on-year drop
of 0.4%.
- A rise in naphtha demand (2.7%), attributable to favorable conditions in the
petrochemical industry, is expected to lead an increase in total oil consumption in 2011.
* Naphtha accounts for 41.7% of total oil consumption (as of 2010).
In 2011, LNG demand will likely record high growth of 10.6% compared to the
previous year. LNG demand for power generation, which accounted for 44% of
overall consumption in 2010, is expected to lead a rise in demand.
- Demand for LNG for power generation, which is used to handle peak load, is
forecast to record relatively high growth as it is expected that there will be
restrictions on the expansion of base power generation facilities such as those for
nuclear energy and bituminous coal and a high rise in electricity demand.
The amount of nuclear power generation will record a year-on-year rise of 5.2% as
new facilities are planned for operation in 2011, the first after 2005.
- There will likely be a rate of increase in the low 5% range as a result of effects of
facility expansion (approximately 5.5% increase)1) from the operation of Singori Units
1 and 2.
17http://www.keei.re.kr
Summary
1) The total facility capacity of Singori Units 1 and 2 is 2,000MW. This accounts for 11.3% of the nuclear powerplant capacity (17,716MW) recorded at the end of 2010. However, completion of construction of Singori Unit 2is scheduled for the end of December. Production of electricity through actual pilot operations will likely bepossible in the second half of the year. Singori Units 1 and 2 are Korea’s 21st and 22nd nuclear power plants.Singori Unit 1 commenced commercial operation on February 28, 2011. Singori Unit 2 is now in a pilotoperation test phase before fuel loading.
수요전망 내지13-1 문 2011.5.20 3:26 PM 페이지17 매일3 MAC2PDF_IN 300DPI 125LPI T

Regarding the level of contribution of each final energy source to the increase in
primary energy consumption, the level of contribution made by demand for use as
electricity and industrial raw material is expected to rise from 68.7% in 2010 to 80.6%
in 2011.
Final energy demand is forecast to record a year-on-year increase of 3.4% in 2011 to
reach 201.4 million TOE.
Consumption soared in the industrial sector and residential/commercial/public sector
in 2010, but the level of consumption increase is expected to slow down in 2011.
The transport sector will likely indicate a low increase rate of 0.6%.
In 2011, consumption in the industrial sector is expected to record sound growth of
4.4% despite base effects from a substantial rise in consumption in 2010.
In 2011, energy demand in the transport sector is expected to go up by a mere
0.6%, attributable to a rise in international oil prices, despite a rise in new car sales
and overseas traveling, a result of continued economic recovery, and an increase in
demand for international freight transport.
18 KOREA ENERGY ECONOMICS INSTITUTE
KEEI Korea Energy Demand Outlook
[Forecasts on level of contribution of each energy source to increase in primary energy]
Outlook on final energy demand
수요전망 내지13-1 문 2011.5.20 3:26 PM 페이지18 매일3 MAC2PDF_IN 300DPI 125LPI T

The residential/commercial/public sector will likely indicate a substantial slowdown in
the demand increase rate at 2.8% in 2011. This is mainly attributable to base effects
from 2010 as it is assumed that average year temperatures will be recovered.
Notes: Values in parentheses are the year-on-year growth rate (%); p refers to tentative figures; e refers to forecasts
19http://www.keei.re.kr
Summary
Category2010p 2011e
1/4 2/4 3/4 4/4 Annual 1/4 2/4 3/4 4/4 Annual
Industry 29.1 28.5 27.8 29.9 115.4 30.6 29.6 29.1 31.2 120.5(Million TOE) (14.6) (9.4) (4.7) (6.8) (8.8) (5.0) (3.8) (4.4) (4.4) (4.4)
-Excluding for 13.6 13.7 13.2 14.7 55.2 14.2 14.4 13.6 15.4 57.6raw materials (15.0) (9.7) (4.4) (9.9) (9.7) (4.3) (4.7) (3.5) (4.9) (4.3)
Transport 8.5 9.2 9.4 9.5 36.6 8.6 9.2 9.5 9.5 36.9(Million TOE) (0.3) (1.4) (3.7) (2.4) (2.0) (1.1) (0.6) (1.4) (-0.4) (0.6)
Residential/commercial 14.9 8.8 7.3 11.9 42.8 15.6 8.9 7.6 12.0 44.1/public
(Million TOE) (7.6) (11.2) (7.0) (3.6) (7.1) (4.6) (0.6) (4.0) (1.6) (2.8)
Total 52.5 46.6 44.5 51.3 194.9 54.7 47.8 46.2 52.7 201.4Million TOE (10.0) (8.0) (4.8) (5.2) (7.0) (4.3) (2.6) (3.7) (2.8) (3.4)
Total 37.0 31.7 29.8 36.1 134.6 38.3 32.5 30.7 37.0 138.5-Excluding forraw materials
(8.4) (7.5) (4.8) (5.7) (6.6) (3.7) (2.4) (2.9) (2.4) (2.9)
Town gas 7.9 4.3 2.8 5.7 20.8 8.3 4.6 3.1 5.9 21.9(Billion m3) (14.5) (20.9) (6.1) (7.8) (12.6) (5.3) (6.2) (9.9) (3.0) (5.5)
Oil 189.0 187.8 187.0 204.2 768.0 195.4 188.0 188.3 204.1 775.9(Million bbl) (1.0) (0.9) (3.3) (3.2) (2.1) (3.4) (0.1) (0.7) (0.0) (1.0)
-Excluding 107.9 105.7 104.0 118.7 436.3 109.7 104.1 103.6 117.8 435.2naphtha (1.9) (-0.3) (1.9) (2.6) (1.6) (1.7) (-1.5) (-0.4) (-0.8) (-0.2)
Electricity 112.5 103.6 109.1 109.0 434.2 117.9 109.3 114.9 115.1 457.2(TWh) (12.2) (10.3) (10.2) (7.7) (10.1) (4.8) (5.5) (5.4) (5.7) (5.3)
Coal 11.3 10.2 9.4 10.4 41.2 11.8 10.5 10.2 11.2 43.7(Million ton) (37.0) (24.1) (-1.2) (3.9) (14.7) (4.4) (3.2) (9.0) (8.1) (6.1)
-Excluding 3.9 4.0 3.5 4.3 15.8 4.0 4.0 3.6 4.5 16.1coking coal (6.5) (17.1) (-9.1) (3.3) (4.0) (2.5) (-0.4) (2.2) (3.9) (2.1)
Thermal and2,180 1,683 1,455 2,234 7,553 2,350 1,854 1,538 2,425 8,167other
(Thousand TOE) (16.6) (21.0) (19.0) (15.5) (17.7) (7.8) (10.1) (5.7) (8.6) (8.1)
<Outlook on final energy demand>
수요전망 내지13-1 문 2011.5.20 3:26 PM 페이지19 매일3 MAC2PDF_IN 300DPI 125LPI T

Outlook on final energy demand by energy source
Most energy sources will post a relatively low level of consumption increase in 2011
compared to the previous year due to a slowdown in economic growth and base
effects from the assumption that average year climate conditions will be recovered.
Town gas consumption went up 12.6% in 2010, owing to a surge in demand for
industrial use resulting from economic recovery and abnormally low temperatures.
However, the level of increase is expected to slow down to 5.5% in 2011.
Oil consumption for raw material use in the industrial sector is estimated to lead a rise
in oil demand.
- Oil demand for raw material use, including naphtha, solvent, and asphalt, is
expected to indicate a year-on-year rise of 3.0% owing to an upswing in the
economy.
Electricity will likely indicate relatively high growth in demand of 5.3% in 2011 resulting
from several factors: continued, sound economic growth, relatively low charge,
continued dissemination of equipment that use electricity, and convenience in use.
- In 2011, peak demand in the summer is expected to be 73,601MW (August), a
5.3% rise from the 69,886MW recorded in (August) 2010, assuming that average
year temperatures will be recovered.
- Installed reserve margin in the event of peak demand in the summer is estimated at
7.4%.
Coal consumption is forecast to see an increase of 6.1% owing to a rise in
bituminous coal demand for steel making, despite forecasts of decreased demand
for cement production.
- When excluding coking coal, final consumption of coal will likely post a year-on-year
increase of a mere 2.1%.
New & renewable energy is expected to record a demand increase rate of around
10%, thanks to the government’s active implementation of propagation policies.
20 KOREA ENERGY ECONOMICS INSTITUTE
KEEI Korea Energy Demand Outlook
수요전망 내지13-1 문 2011.5.20 3:26 PM 페이지20 매일3 MAC2PDF_IN 300DPI 125LPI T
Forecasts on energy intensity improvements in 2011
Energy intensity (TOE/million won) deteriorated in 2009 and 2010, but is expected to
slightly improve to 0.248 in 2011.
- The worsened energy intensity of 2009 resulted from a 1.1% rise in primary energy
consumption, triggered by favorable conditions in industrial activities of industries
that consume great amounts of energy, against the backdrop of a substantial
slowdown in the economic growth rate (0.2%) due to the financial crisis.
- The worsened energy intensity of 2010 resulted from a soar in energy demand for
heating and cooling purposes, a result of abnormal climate conditions (abnormally
low temperatures in the winter and high temperature and humidity levels in the
summer), an increase in the number of steel facilities (Hyundai Steel and Dongkuk
Steel), and an increase in industrial activities owing to the economic recovery.
The worsened energy intensity in 2009 and 2010 seems to be temporary, caused by
unusual factors, amid improvements in energy efficiency in the mid- to long-term.
Continued rapid increase in electricity consumption
Electricity consumption went up 10.1% in 2010, indicating two-digit growth for the
first time after 2000 (11.8%). It is expected to post a 5.3% increase rate, which is
higher than the final energy increase rate (3.4%), in 2011 as well.
Consumption of electricity, a high-quality energy source2), continues to mark relatively
high growth even in the 2000s because of several factors.
- The fabricated metal industry (machinery and equipment, electricity and electronics,
semiconductor, automobile, etc.), an industry that consumes great amounts of
electricity, recorded the highest degree of growth among manufacturing industries.
21http://www.keei.re.kr
Summary
Outlook characteristics
2) 2.74 TOE of primary energy is needed to produce 1 TOE of electricity (as of 2010).
수요전망 내지13-1 문 2011.5.20 3:26 PM 페이지21 매일3 MAC2PDF_IN 300DPI 125LPI T

- From 2009 to 2010, operation of new facilities that consume great amounts of
electricity was launched in the steel making industry (Hyundai Steel, POSCO,
Dongkuk Steel, etc.).
- Petroleum product prices continue to remain high. Against this backdrop, an
electricity charge that fails to reflect production costs is maintained. For this reason,
electricity is replacing oil and town gas, main energy sources for heating.
Electricity is expected to continue to perform leading roles in Korea’s energy
consumption activities due to several factors: increased added value of key
manufacturing industry products, which consume great amounts of electricity,
convenience in use, and changes in lifestyles resulting from a rise in income levels
and technological development.
LNG demand soaring as a result of a rapid increase in electricity consumption
LNG consumption rose 22.6% (tentative) in 2010 owing to a rise in demand for
power generation. It is expected to mark high growth of 10.6% in 2011 as well.
* Rate of increase in consumption for power generation: (’09) -13.2% → (’10)
38.3% → (’11) 17.5%
* Rate of increase in consumption for town gas: (’09) 0.9% → (’10) 12.6% → (’11)
5.1%
- The increase in LNG demand for power generation, which is used to handle peak
load, is a result of a rise in electricity demand and restricted expansion of base-load
power facilities (nuclear energy, bituminous coal).
* Base-load power facilities increase rate (as of the end of the year)3): (’09) 1.2% →
(’10) 2.5% → (’11) 2.4%
* Electricity demand increase rate: (’09) 2.4% → (’10) 10.1% → (’11) 5.3%
22 KOREA ENERGY ECONOMICS INSTITUTE
KEEI Korea Energy Demand Outlook
3) Construction of Hadong bituminous coal-based thermal power plant (500MW) in 2009, Singori Power PlantUnit 1 (1,000MW) in 2010, and Singori Power Plant Unit 2 (1,000MW) in 2011
수요전망 내지13-1 문 2011.5.20 3:26 PM 페이지22 매일3 MAC2PDF_IN 300DPI 125LPI T
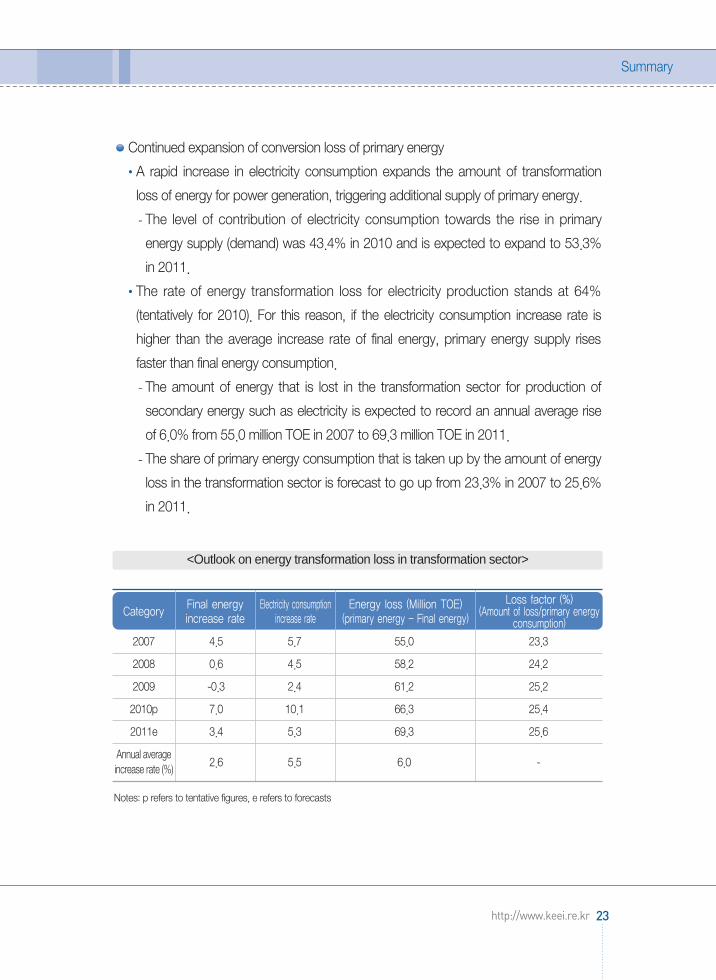
Continued expansion of conversion loss of primary energy
A rapid increase in electricity consumption expands the amount of transformation
loss of energy for power generation, triggering additional supply of primary energy.
- The level of contribution of electricity consumption towards the rise in primary
energy supply (demand) was 43.4% in 2010 and is expected to expand to 53.3%
in 2011.
The rate of energy transformation loss for electricity production stands at 64%
(tentatively for 2010). For this reason, if the electricity consumption increase rate is
higher than the average increase rate of final energy, primary energy supply rises
faster than final energy consumption.
- The amount of energy that is lost in the transformation sector for production of
secondary energy such as electricity is expected to record an annual average rise
of 6.0% from 55.0 million TOE in 2007 to 69.3 million TOE in 2011.
- The share of primary energy consumption that is taken up by the amount of energy
loss in the transformation sector is forecast to go up from 23.3% in 2007 to 25.6%
in 2011.
Notes: p refers to tentative figures, e refers to forecasts
23http://www.keei.re.kr
Summary
Category Final energyincrease rate
Electricity consumptionincrease rate
Energy loss (Million TOE)(primary energy - Final energy)
Loss factor (%)(Amount of loss/primary energy
consumption)2007 4.5 5.7 55.0 23.3
2008 0.6 4.5 58.2 24.2
2009 -0.3 2.4 61.2 25.2
2010p 7.0 10.1 66.3 25.4
2011e 3.4 5.3 69.3 25.6
Annual average2.6 5.5 6.0 -increase rate (%)
<Outlook on energy transformation loss in transformation sector>
수요전망 내지13-1 문 2011.5.20 3:26 PM 페이지23 매일3 MAC2PDF_IN 300DPI 125LPI T

Supplied reserve margin continues a downward trend due to a rapid increase in peak
demand.
Peak demand indicated an annual average rise of 5.7% from 2000 through 2010,
while power generation capacity and supply capability recorded annual average
growth of merely 4.7% and 5.1%, respectively. The installed and supplied reserve
margins are continually dropping.
- Supplied reserve margin in 2010 was 6.2%, the lowest level in the 2000s.
A recent important characteristic to note is that Peak demand was reached in winter
(December) for two consecutive years in 2009 and 2010.
- The main cause is the abnormal cold wave in the winter for two consecutive years,
but another reason is a noticeable, recent rise in electric power consumption for
heating purposes in the winter.
Share of winter peak demand taken up by heating load is on the rise
Last winter (December 2010 - February 2011), peak demand indicated a year-on-
year rise of 6.1% to reach 73,137MW, attributable to economy recover, continued
cold wave, and relatively affordable charge.
24 KOREA ENERGY ECONOMICS INSTITUTE
KEEI Korea Energy Demand Outlook
[Trends in Peak demand and supplied reserve margin]
수요전망 내지13-1 문 2011.5.20 3:26 PM 페이지24 매일3 MAC2PDF_IN 300DPI 125LPI T

The amount of electricity used for heating presumably accounted for at least 25% of
peak load at the point of time of peak demand in the winter of 2010 to 2011 (Korea
Power Exchange data).
- It is presumed that the heating load for commercial use indicated noticeable
growth. Heating load for commercial use accounted for 37.8% of total heating load
(18,576MW) on the day of peak demand in the winter of 2010 to 2011.
Notes: Values in parentheses refer to the share of each useSource: Press release of the Korea Power Exchange (Results of analyzing peak demand in the winter of 2010 to 2011),
March 7, 2011
25http://www.keei.re.kr
Summary
Category 2008~2009 2009~2010 2010~2011
peak demand (MW) 62,645 68,963 73,137- Year-on-year increase (%) 2.8 10.1 6.1
Heating load (MW) 14,150 16,640 18,576
- Residential3,931 4,252 4,754(27.8%) (25.6%) (25.6%)
- Commercial4,468 6,178 7,021(31.6%) (37.1%) (37.8%)
- Industrial5,751 6,210 6,801(40.6%) (37.3%) (36.6%)
<Trends in winter peak demand and heating load>
[Changes in share of winter peak demand taken up by heating load]
수요전망 내지13-1 문 2011.5.20 3:26 PM 페이지25 매일3 MAC2PDF_IN 300DPI 125LPI T

It is forecast that oil dependence regarding primary energy consumption will decrease
to between 30 and 40%.
The share of oil reached its peak at 63% in 1994 and continued to decrease
afterwards. It stood at 39.9% in 2010 and is expected to further drop to 38.9% in
2011.
- The primary energy share taken up by naphtha, which is mainly used for industrial
raw materials, reached 16.3% in 2010, higher than LNG (15.9%) and nuclear
energy (12.9%).
- The primary energy share of naphtha was greatly influenced by fluctuations in the
petrochemical industry. It has been indicating a steady downward trend since 2009
and is expected to record 16.1% in 2011.
- When excluding naphtha, the share of primary energy taken up by oil is expected to
be a mere 22.7% in 2011.
26 KOREA ENERGY ECONOMICS INSTITUTE
KEEI Korea Energy Demand Outlook
[Trends in oil dependence and forecasts]
수요전망 내지13-1 문 2011.5.20 3:26 PM 페이지26 매일3 MAC2PDF_IN 300DPI 125LPI T

Installed reserve margin is expected to be 7.4% in the summer of 2011.
Peak demand in the summer of 2011 is expected to be 73,601MW, a 5.3% rise from
the 69,886MW recorded in 2010. Monthly average temperature information for 20
years was used to come up with this estimate.
- Maximum Forecast No. 1, which uses monthly average temperature information of
the last five years, estimates that summer peak demand will reach 73,886MW, a
year-on-year rise of 5.7%.
- Maximum Forecast No. 2, which assumes that summer climate conditions in 2011
will be the same as they were in 2010, estimates that summer peak demand will
reach 74,846MW, a year-on-year increase of 7.1%.
If an assumption is made that average year climate conditions will be recovered in the
summer of 2011, installed reserve margin should have more room than the previous
year’s level (6.5%).
- Installed reserve margin in the event of peak demand in the summer of 2011 is
estimated at 7.4% in case of the base forecast, 7.0% in case of Maximum Forecast
No. 1, and 5.6% in case of Maximum Forecast No. 2.
- Because installed reserve level is expected to be 5,469MW for the base forecast and
5,184MW for Maximum Forecast No. 1, stable electricity supply/demand is expected.
Notes: 1) Installed reserve margin (%) = [(total capacity - peak demand)/peak demand]×1002) Total capacity excludes small hydro power facilities and isolated facilities that are not connected to systems
27http://www.keei.re.kr
Summary
Policy implications
Category 2008 2009 20102011
Base forecast Maximum ForecastNo. 1
Maximum ForecastNo. 2
Peak demand (MW) 62,794 63,212 69,886 73,601 73,886 74,846- Increase rate (%) 0.8 0.7 10.6 5.3 5.7 7.1
Total capacity (MW) 70,353 73,373 74,407 79,070 79,070 79,070- installed reserve margin (%) 12.0 16.1 6.5 7.4 7.0 5.6
<Forecasts on electricity supply/demand for the summer of 2011>
수요전망 내지13-1 문 2011.5.20 3:26 PM 페이지27 매일3 MAC2PDF_IN 300DPI 125LPI T

There is a need to overhaul measures on stabilizing electricity supply/demand in
preparation for abnormal climate conditions in the summer.
- If the weather in the summer is similar to that witnessed in the summer of 2010,
there is a possibility of installed reserve margin going down from the previous year
(6.5%). In this case, installed reserve level is estimated at 4,200MW.
- In preparation for a rise in peak demand in the summer as a result of abnormal
climate conditions, there is a need to revisit relevant measures, such as adjusting
the regular repair period of base-load power plants and raising the output of power
plants.
Measures for abnormal climate conditions in the winter of 2011 will become more
significant.
- During the last two years (2009-2010), peak load was reached for the first time in
winter. Heating load is taking up a higher proportion of peak demand in the winter.
- In this case, there will be a sharp rise in consumption of LNG for power generation,
which is used to handle peak load, as well as town gas for heating. For this reason,
there is a possibility that ensuring stability in the supply and demand for LNG in the
winter will become more important.
28 KOREA ENERGY ECONOMICS INSTITUTE
KEEI Korea Energy Demand Outlook
[Comparison between economic growth rate and summer peak demand increase rate]
수요전망 내지13-1 문 2011.5.20 3:26 PM 페이지28 매일3 MAC2PDF_IN 300DPI 125LPI T

There is a need to strengthen electricity demand side management and enhance
efficiency in electricity use.
Consumption of electricity continues to increase rapidly due to its low charge;
diversification, increased size, and propagation of electrical equipments; a rise in the
number of facilities that consume a great amount of electricity due to increased
industrial activities; increased demand for heating in the winter; and convenience in use.
- A two-digit (10.1%) consumption increase rate was recorded in 2010, attributable
to the economic recovery and temperature effects. It is expected that sound
growth of 5.3% will be witnessed in 2011.
There is a need to promote the stable supply/demand of electricity by strengthening
demand side management in consideration of the continuous downward trend of the
supplied reserve margin at the point of time of peak demand.
- There are various constraints in building enough power generation facilities to cover
electricity demand. For this reason, there is a need for the government to place
more focus on electricity demand side management policies.
- There is a need to actively move forward with the adoption of EERS (Energy
Efficiency Resource Standard) as soon as possible to strengthen electricity demand
side management.
- There is also a need to encourage an appropriate level of use of cooling and
heating devices in large buildings, where there is much potential to bring down
electricity demand. There is also a need to improve efficiency of lighting fixtures by
promoting the ESCO (Energy Service Company) program, and facilitate the
adoption of electricity-saving building management systems.
There is a need to adjust the electricity charge to a realistic level so as to reduce
excessive consumption (especially for heating purposes) of electricity in order to
boost efficiency in electricity consumption.
- Large shopping malls, financial institutes, and other organizations in the service
industry tend to provide excessive heating and cooling in Korea.
- To remove such practices that lead to the waste of resources, there is an urgent
need to strengthen the market functions of energy prices.
29http://www.keei.re.kr
Summary
수요전망 내지13-1 문 2011.5.20 3:26 PM 페이지29 매일3 MAC2PDF_IN 300DPI 125LPI T

In 2011, the value of energy imports is expected to go up by 20.2%.
The value of imported energy (oil, natural gas, coal, uranium) reached 121.7 billion
dollars in 2010, a year-on-year rise of 33.4%.
- The amount of energy imports (oil, natural gas, coal) indicated a year-on-year
increase of merely 8.8%, but the value of imports rose substantially owing to a
surge in energy prices such as international oil prices.
The value of energy imports in 2011 is estimated at 146.2 billion dollars.
- The level of increase in energy demand (imports) is expected to slow down this
year, but the value of energy imports is expected to indicate a year-on-year rise of
20.2%, owing to forecasted increase in international energy prices.
* Oil: (’09) $66.6 billion → (’10) $90.9 billion → (’11) $111.2 billion
* Natural gas: (’09) $13.9 billion → (’10) $17 billion → (’11) $20 billion
* Bituminous coal: (’09) $9 billion → (’10) $11.4 billion → (’11) $13.4 billion
Notes: 1. The values in parentheses are the year-on-year growth rate (%), p refers to tentative figures, e refers to forecasts2. The import price of each energy source is based on the unit price of import
30 KOREA ENERGY ECONOMICS INSTITUTE
KEEI Korea Energy Demand Outlook
Category 2006 2007 2008 2009 2010p 2011e
Primary energy 233.4 236.5 240.8 243.3 261.2 270.8
consumption(Million TOE) (2.1) (1.3) (1.8) (1.1) (7.3) (3.7)
Amount of imports 238.7 246.8 255.5 257.1 279.6 285.2(Million TOE) (4.5) (3.4) (3.5) (0.6) (8.8) (2.0)
Value of imports 856 950 1,415 912 1,217 1,462(100 million dollars) (28.3) (11.0) (49.0) (-35.6) (33.4) (20.2)
<Energy consumption and import and outlook>
수요전망 내지13-1 문 2011.5.20 3:26 PM 페이지30 매일3 MAC2PDF_IN 300DPI 125LPI T
Energy Demand Outlook for 2011
수요전망 내지13-1 문 2011.5.20 3:26 PM 페이지31 매일3 MAC2PDF_IN 300DPI 125LPI T

수요전망 내지13-1 문 2011.5.20 3:26 PM 페이지32 매일3 MAC2PDF_IN 300DPI 125LPI T
ChapterⅠInternational Energy
Market Trends
1. Trends in the international oil market and oil exports/imports
2. Trends in international natural gas and coal prices
수요전망 내지13-1 문 2011.5.20 3:26 PM 페이지33 매일3 MAC2PDF_IN 300DPI 125LPI T

수요전망 내지13-1 문 2011.5.20 3:26 PM 페이지34 매일3 MAC2PDF_IN 300DPI 125LPI T

A. Trends in international oil prices and domestic petroleum product prices
International oil prices continued an upward trend, triggered by a rise in demand for
heating oil as a result of a cold wave that hit the northern hemisphere and unstable
conditions in the Middle East including Egypt and Libya. International oil prices recorded
a year-on-year rise of 36.2% in February 2011 to reach $100.2/barrel (Dubai oil).
International petroleum product prices rapidly rose in tandem with the increase in
international crude oil prices. The price of gasoline stood at (92RON) $109.6/barrel,
while that of diesel recorded $117.5/barrel and naphtha $97.9/barrel.
Notes: The values in parentheses indicate the rate of increase from the same period (month) the previous year (%)
B. Trends in domestic prices of petroleum products
In February 2011, retail prices of gasoline and diesel in Korea recorded a year-on-year increase
of 11.2% and 14.5%, respectively. Retail price of butane for vehicles went up 12.3%.
ChapterⅠ International Energy Market Trends
35http://www.keei.re.kr
Trends in the international oil market and oil exports/imports1
(Unit: $/Bbl, %)
Category WTI Brent Dubai
Year 2008 99.92 (27.21) 97.47 (24.85) 94.29 (25.86)
Year 2009 61.94 (-37.98) 61.73 (-35.74) 61.92 (-32.37)
Year 2010 79.49 (17.55) 79.66 (17.93) 78.13 (16.21)
January 2010 78.34 (87.33) 76.39 (75.09) 76.75 (73.96)
February 2010 76.45 (95.03) 73.82 (71.04) 73.60 (70.81)
January 2011 89.54 (14.30) 96.78 (26.69) 92.55 (20.59)
February 2011 89.66 (17.28) 103.90 (40.75) 100.24 (36.20)
<TableⅠ-1> Changes in international crude oil prices
수요전망 내지13-1 문 2011.5.20 3:26 PM 페이지35 매일3 MAC2PDF_IN 300DPI 125LPI T
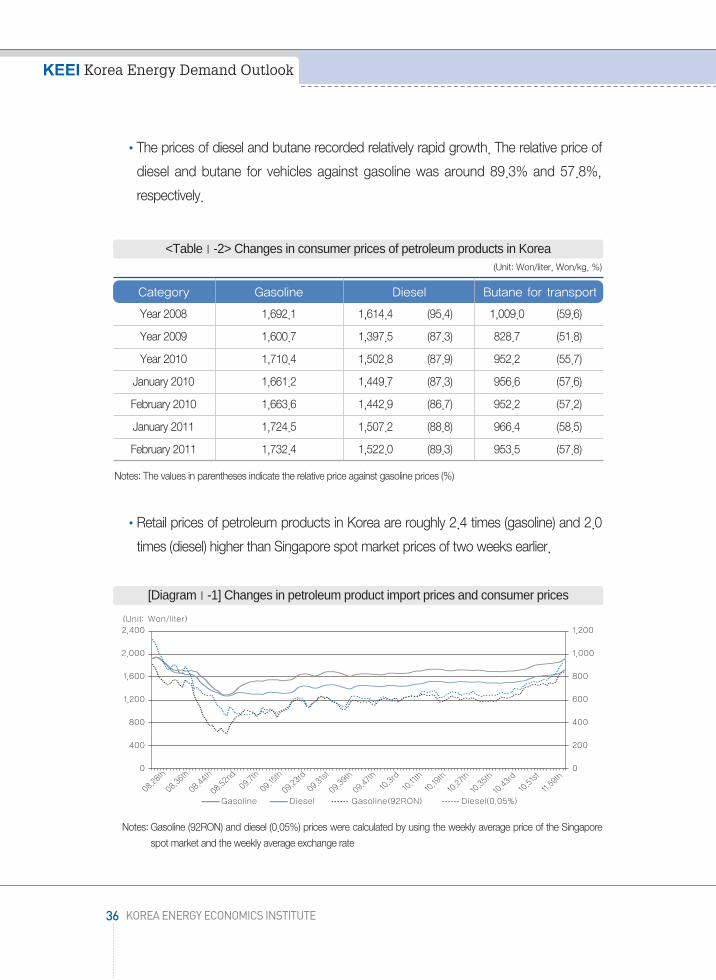
The prices of diesel and butane recorded relatively rapid growth. The relative price of
diesel and butane for vehicles against gasoline was around 89.3% and 57.8%,
respectively.
Notes: The values in parentheses indicate the relative price against gasoline prices (%)
Retail prices of petroleum products in Korea are roughly 2.4 times (gasoline) and 2.0
times (diesel) higher than Singapore spot market prices of two weeks earlier.
Notes: Gasoline (92RON) and diesel (0.05%) prices were calculated by using the weekly average price of the Singaporespot market and the weekly average exchange rate
36 KOREA ENERGY ECONOMICS INSTITUTE
KEEI Korea Energy Demand Outlook
(Unit: Won/liter, Won/kg, %)
Category Gasoline Diesel Butane for transport
Year 2008 1,692.1 1,614.4 (95.4) 1,009.0 (59.6)
Year 2009 1,600.7 1,397.5 (87.3) 828.7 (51.8)
Year 2010 1,710.4 1,502.8 (87.9) 952.2 (55.7)
January 2010 1,661.2 1,449.7 (87.3) 956.6 (57.6)
February 2010 1,663.6 1,442.9 (86.7) 952.2 (57.2)
January 2011 1,724.5 1,507.2 (88.8) 966.4 (58.5)
February 2011 1,732.4 1,522.0 (89.3) 953.5 (57.8)
<TableⅠ-2> Changes in consumer prices of petroleum products in Korea
[DiagramⅠ-1] Changes in petroleum product import prices and consumer prices
수요전망 내지13-1 문 2011.5.20 3:26 PM 페이지36 매일3 MAC2PDF_IN 300DPI 125LPI T

C. Trends in crude oil and petroleum product exports/imports
In December 2010, the crude oil import volume stood at 77.7 million barrels, recording
a year-on-year rise of 10.1%. The import amount (based on CIF) rose 22.2% to reach
6.7 billion dollars.
The cumulative import volume for 2010 posted 872.4 million barrels, a year-on-year
rise of 4.4%, while the amount posted a rise of 35.4% to stand at 68.7 billion dollars.
Crude oil imports maintained high growth after March, attributable to a rise in
demand for petroleum products, resulting from the extremely cold winter, a rise in fuel
consumption of vehicles, and favorable conditions in the petrochemical industry.
In 2010, petroleum product imports recorded a year-on-year increase of 2.5% to
reach 276.8 million barrels. Petroleum product exports witnessed a year-on-year rise
of 1.7% to post 341.8 million barrels.
Both exports and imports of naphtha substantially rose. Together with naphtha, LPG
led a rise in product imports. Gasoline exports decreased, while diesel exports
considerably rose.
International LNG and coal prices plummeted after the global economic downturn at
the end of 2008, but steadily rose afterwards. They are going up, together with
international oil prices, owing to unstable conditions in the Middle East that began at
the end of 2010.
The movement for democracy in the Middle East that began in Tunisia at the end of
2010 is influencing not only international oil prices but is also contributing to the rise in
LNG and coal prices. In March 2011, international LNG prices recorded a year-on-
ChapterⅠ International Energy Market Trends
37http://www.keei.re.kr
Trends in international natural gas and coal prices2
수요전망 내지13-1 문 2011.5.20 3:26 PM 페이지37 매일3 MAC2PDF_IN 300DPI 125LPI T
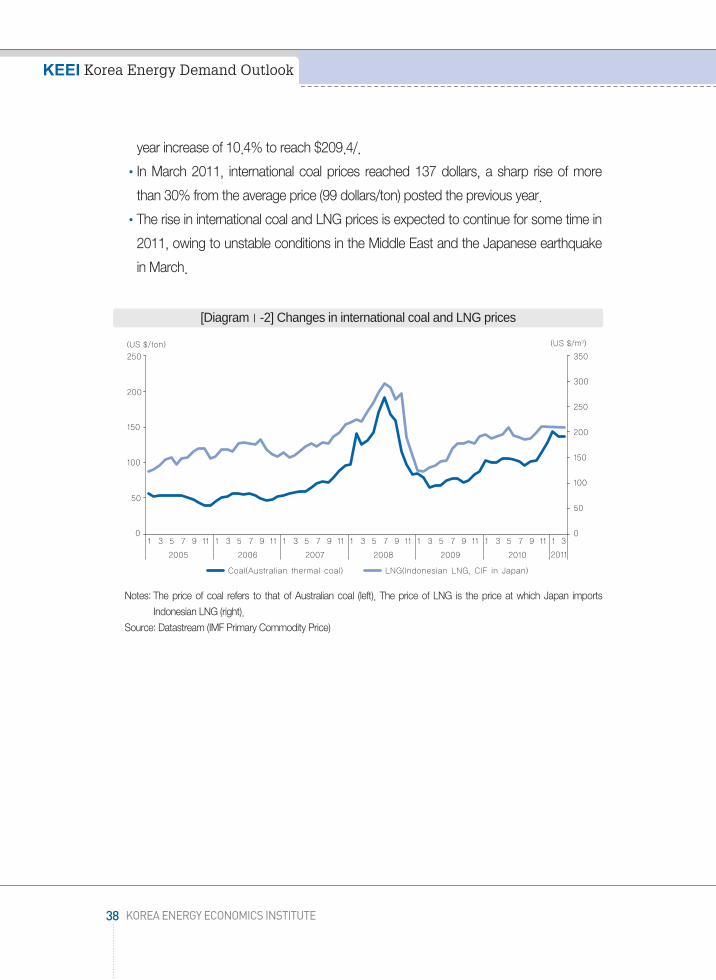
year increase of 10.4% to reach $209.4/.
In March 2011, international coal prices reached 137 dollars, a sharp rise of more
than 30% from the average price (99 dollars/ton) posted the previous year.
The rise in international coal and LNG prices is expected to continue for some time in
2011, owing to unstable conditions in the Middle East and the Japanese earthquake
in March.
Notes: The price of coal refers to that of Australian coal (left). The price of LNG is the price at which Japan importsIndonesian LNG (right).
Source: Datastream (IMF Primary Commodity Price)
38 KOREA ENERGY ECONOMICS INSTITUTE
KEEI Korea Energy Demand Outlook
[DiagramⅠ-2] Changes in international coal and LNG prices
수요전망 내지13-1 문 2011.5.20 3:26 PM 페이지38 매일3 MAC2PDF_IN 300DPI 125LPI T

ChapterⅡEconomic and Energy
Consumption Trends in Korea
1. Economic trends in Korea
2. Trends in primary energy consumption
3. Trends in final energy consumption
4. Trends in petroleum product consumption
5. Trends in electricity consumption
6. Trends in LNG and town gas consumption
7. Trends in coal and other energy consumption
수요전망 내지13-1 문 2011.5.20 3:26 PM 페이지39 매일3 MAC2PDF_IN 300DPI 125LPI T

수요전망 내지13-1 문 2011.5.20 3:26 PM 페이지40 매일3 MAC2PDF_IN 300DPI 125LPI T

Outline
According to Industrial Activity Trends announced by Statistics Korea in January
2011, the mining/manufacturing industry, service production, retail sales, and facility
investments went up from the previous month in January. On the other hand,
completed construction went down from the previous month. The cyclical
component of coincident index and composite leading index went up from the
previous month in terms of a comparison to the same month the previous year.
Production trends
Mining/manufacturing industry production went up 13.7% from the same month the
previous year, thanks to favorable conditions in semiconductors and parts (24.4%)
and in the automobile industry (23.1%), gaining strength from the release of new
vehicles. This is despite a slump in image/sound/communication equipment (4.9%)
and computers (-11.4%).
The average operating rate in the manufacturing sector rose 2.7%p from the previous
month. It reached 84.8%, which is the highest level since statistics were first collected
in 1980.
In terms of the service industry, there was a decrease in real estate/lease (-19.0%)
and lodging/restaurants (-0.7%), but a rise in transportation (9.4%), wholesale/retail
(8.0%), and business facilities management/business support (8.0%) led to an overall
increase of 4.6% from the same month the previous year.
ChapterⅡ Economic and Energy Consumption Trends in Korea
41http://www.keei.re.kr
Economic trends in Korea4)1
4) Summary of Industrial Activity Trends (January 2011) of Statistics Korea
수요전망 내지13-1 문 2011.5.20 3:26 PM 페이지41 매일3 MAC2PDF_IN 300DPI 125LPI T

Source: Statistics Korea, Industrial Activity Trends (January 2011), March 2011 The Bank of Korea, Economic StatisticsSystem
42 KOREA ENERGY ECONOMICS INSTITUTE
KEEI Korea Energy Demand Outlook
(Unit: Year-on-year comparison (month-on-month comparison), %)
CategoryYear 2009 Year 2010 Year 2011Annual Annual (p) 3/4 4/4 (p) Jan Nov Dec (p) Jan (p)
Production
Consumption
Investment
Prices
Sales of consumer goods
Consumer prices
Producer prices
Mining/manu
facturingindustry
Production
(Automobiles)
Shipment
·Exports
Inventory
Average operating rate
Productioncapacity
Facility investmentindex
Domestic ordersfor machinery
Constructioncompleted in Korea
Construction orders in Korea
·Domesticdemand
·Manufacturingsector( I C T )
Manufacturingindustry
Facility
Construction
-0.1
-0.2
9.3
-6.4
-1.4
-1.6
-0.9
-7.8
74.4
3.5
2.7
-9.4
-10.3
1.6
5.0
2.8
-0.2
16.2
16.7
25.2
23.1
14.4
11.5
18.2
17.4
81.2
7.2
6.6
25.1
11.2
-3.3
-18.7
2.9
3.8
10.9
11.2
19.1
11.3
9.9
6.6
14.5
19.1
81.2
7.8
7.5
29.3
-0.2
-6.8
-3.6
2.9
3.6
11.7
11.9
15.2
10.1
11.9
8.3
16.9
17.4
80.8
7.4
5.1
13.5
11.3
-4.4
-40.2
3.6
5.0
37.0
38.7
63.5
81.5
31.4
29.0
34.6
-3.3
79.3
5.7
6.7
26.3
11.8
4.5
20.2
3.1
2.8
11.2
11.4
13.3
6.9
11.7
9.7
14.5
16.9
80.5
7.5
6.9
13.1
-9.2
-7.7
-48.7
3.3
4.9
10.6
10.8
19.0
8.3
10.5
4.4
19.3
17.4
82.1
7.3
4.3
7.3
34.9
-0.2
-22.5
3.5
5.3
13.7
14.1
17.3
23.1
14.4
9.5
21.3
12.9
84.8
7.0
10.8
22.3
20.2
-8.0
-33.9
4.1
6.2
<TableⅡ-1> Recent economic trends
수요전망 내지13-1 문 2011.5.20 3:26 PM 페이지42 매일3 MAC2PDF_IN 300DPI 125LPI T

Consumption trends
Retail sales witnessed a year-on-year rise of 10.8% owing to a rise in sales of
durables (14.1%) including computers, telecommunication equipment, and home
appliances, quasi-durables (11.9%) such as clothes, and nondurables (9.1%) such as
food and beverage.
- In terms of different retail business types, there was a rise in department stores
(20.6%), large discount stores (20.4%), and nonstore retailing (20.0%).
Investment trends
Facility investments saw a 4.5% rise from the previous month due to a rise in
investments in machinery such as machinery for special industries. They indicated a
year-on-year rise of 22.3%, attributable to an increase in investments in machinery,
despite decreased investments in transportation equipment.
The number of domestic orders for machinery went down in the public sector.
However, favorable conditions in orders made by the private sector led to an overall
year-on-year rise of 20.2%.
- There was a decrease in the public sector due to base effects, but demand rose in
the private sector for electronics and image/sound/communication equipment.
Completed construction witnessed a month-on-month drop of 5.6% and a year-on-
year decrease of 8.0% owing to sluggish performance in construction and public
works.
Construction orders (at current prices) posted a year-on-year decrease of 33.9%,
owing to decreased orders in the private sector as well as a drop in orders for flood
control afforestation as well as roads and bridges in the public sector.
Business indices
The cyclical component of coincident index went up 1.1%p from the previous month,
attributable to a rise in all indices including the index of mining and manufacturing
industrial product, service industry activity, and wholesale and retail sales index.
The leading index’s year-on-year comparison recorded a 0.2%p rise from the
ChapterⅡ Economic and Energy Consumption Trends in Korea
43http://www.keei.re.kr
수요전망 내지13-1 문 2011.5.20 3:26 PM 페이지43 매일3 MAC2PDF_IN 300DPI 125LPI T
previous month, owing to a rise in the inventory cycle index, value of construction
orders, the ratio of those seeking to hire to those seeking jobs, and value of
machinery orders.
Source: Statistics Korea, Industrial Activity Trends (January 2011), March 2011
Notes: Statics Korea, Korean Statistical Information Service (http://kosis.kr). As of January 2011.
44 KOREA ENERGY ECONOMICS INSTITUTE
KEEI Korea Energy Demand Outlook
CategorySeptember
2010 October (p) November (p) December (p)January2011 (p)
-0.3 -0.3 0.2 0.8 1.5
100.4 99.6 99.5 99.8 100.9
-0.7 -0.8 -0.1 0.3 1.1
0.0 -0.3 0.2 0.5 0.7
4.5 3.3 2.8 2.8 3.0
-0.9 -1.2 -0.5 0.0 0.2
<TableⅡ-2> Composite index
Composite coincident index (Compared to the previous month, %)
·Cyclical component
·Month-to-month difference in cyclical component (p)
Composite leading index (Compared to the previous month, %)
·Compared to the same month the previous year (%)
·Month-to-month difference (%p)
[DiagramⅡ-1] Business Cycle Clock (BCC)
수요전망 내지13-1 문 2011.5.20 3:26 PM 페이지44 매일3 MAC2PDF_IN 300DPI 125LPI T
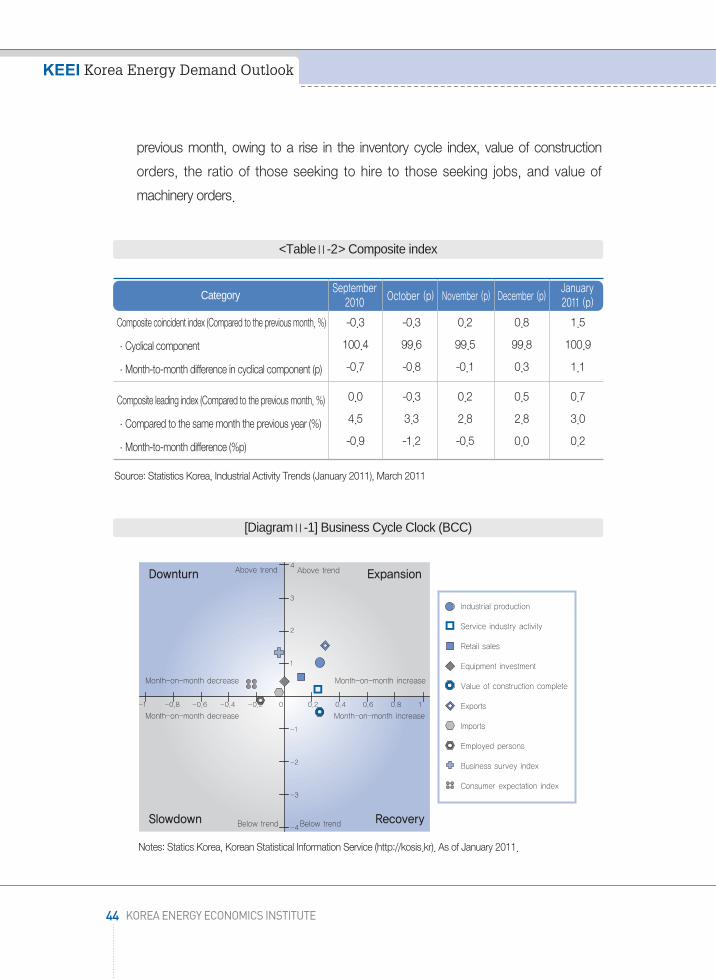
Business cycle
According to the Business Cycle Clock (BCC) in January 2011, the value of
construction completed is recovering. The value of exports, industrial production, and
retail sales, which slowed down in November 2010, have entered an upward trend.
Service industry activity, which was also on a downward trend, has made a shift into
an upward trend.
In contrast, the consumer expectation index, business survey index, and value of
imports are slowing down. The number of employed persons has increased
compared to November, but is still on a downward trend.
Primary energy consumption for 2010 has been tentatively tallied at 261.2 million TOE,
a year-on-year rise of 7.3%.
Primary energy consumption went up by 10.5% in the first quarter and 7.5% in the
second quarter according to changes in the economic growth rate by quarter. The
rate of increase stood at 5.3% in the third quarter and 6.1% in the fourth quarter,
indicating a slight slowdown in the level of increase in the second half of the year.
* Economic growth rate: (First quarter) 8.1% → (Second quarter) 7.2% → (Third
quarter) 4.4% → (Fourth quarter) 4.8%
- The rate of increase in energy consumption continued to remain higher than the
economic growth rate from the second quarter of 2009 through the third quarter of
2010, but was lower than the economic growth rate in the fourth quarter.
ChapterⅡ Economic and Energy Consumption Trends in Korea
45http://www.keei.re.kr
Trends in primary energy consumption2
수요전망 내지13-1 문 2011.5.20 3:26 PM 페이지45 매일3 MAC2PDF_IN 300DPI 125LPI T

The rise in primary energy consumption in 2010 is attributable to the economic
recover (including base effects from the economic downturn of the previous year) and
the climate (abnormally low temperatures in the winter and high temperatures and
high humidity in the summer).
- An upswing in production in industries that consume a great amount of electricity
such as fabricated metal as well as an expansion of steel making facilities that
consume a great amount of electricity had a considerable influence on increased
energy consumption in 2010.
- A sharp rise in energy consumption for cooling and heating purposes, triggered by
abnormal weather throughout 2010, also contributed to the increase in primary
energy consumption.
46 KOREA ENERGY ECONOMICS INSTITUTE
KEEI Korea Energy Demand Outlook
[DiagramⅡ-2] Recent economic and primary energy consumption trends
수요전망 내지13-1 문 2011.5.20 3:26 PM 페이지46 매일3 MAC2PDF_IN 300DPI 125LPI T
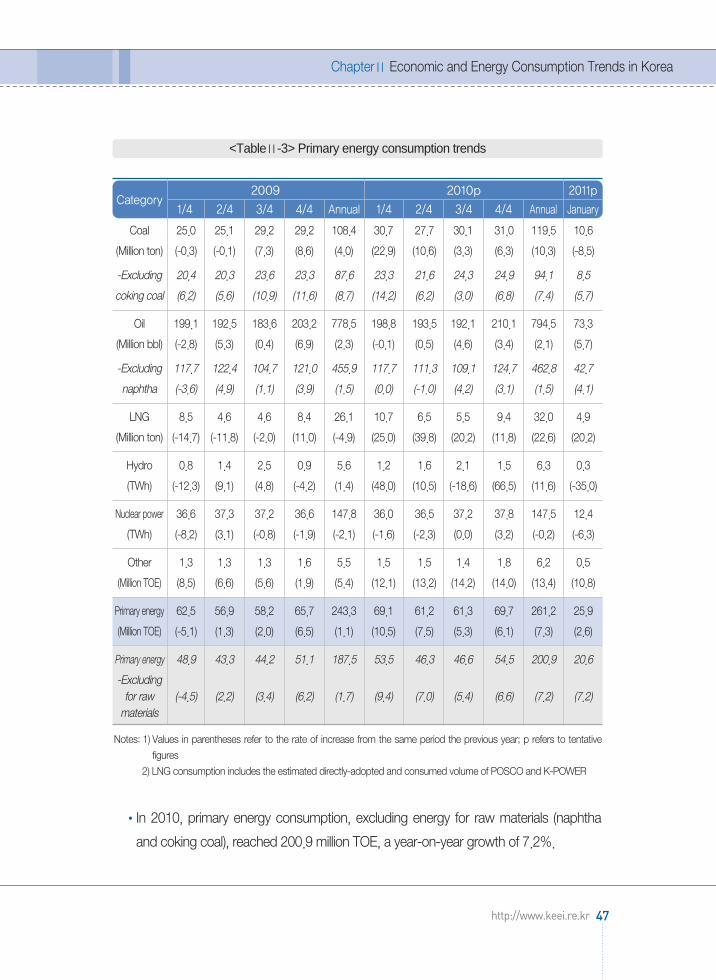
Notes: 1) Values in parentheses refer to the rate of increase from the same period the previous year; p refers to tentativefigures
2) LNG consumption includes the estimated directly-adopted and consumed volume of POSCO and K-POWER
In 2010, primary energy consumption, excluding energy for raw materials (naphtha
and coking coal), reached 200.9 million TOE, a year-on-year growth of 7.2%.
ChapterⅡ Economic and Energy Consumption Trends in Korea
47http://www.keei.re.kr
Category2009 2010p 2011p
1/4 2/4 3/4 4/4 Annual 1/4 2/4 3/4 4/4 Annual January
Coal 25.0 25.1 29.2 29.2 108.4 30.7 27.7 30.1 31.0 119.5 10.6
(Million ton) (-0.3) (-0.1) (7.3) (8.6) (4.0) (22.9) (10.6) (3.3) (6.3) (10.3) (-8.5)
-Excluding 20.4 20.3 23.6 23.3 87.6 23.3 21.6 24.3 24.9 94.1 8.5
coking coal (6.2) (5.6) (10.9) (11.6) (8.7) (14.2) (6.2) (3.0) (6.8) (7.4) (5.7)
Oil 199.1 192.5 183.6 203.2 778.5 198.8 193.5 192.1 210.1 794.5 73.3
(Million bbl) (-2.8) (5.3) (0.4) (6.9) (2.3) (-0.1) (0.5) (4.6) (3.4) (2.1) (5.7)
-Excluding 117.7 122.4 104.7 121.0 455.9 117.7 111.3 109.1 124.7 462.8 42.7
naphtha (-3.6) (4.9) (1.1) (3.9) (1.5) (0.0) (-1.0) (4.2) (3.1) (1.5) (4.1)
LNG 8.5 4.6 4.6 8.4 26.1 10.7 6.5 5.5 9.4 32.0 4.9
(Million ton) (-14.7) (-11.8) (-2.0) (11.0) (-4.9) (25.0) (39.8) (20.2) (11.8) (22.6) (20.2)
Hydro 0.8 1.4 2.5 0.9 5.6 1.2 1.6 2.1 1.5 6.3 0.3
(TWh) (-12.3) (9.1) (4.8) (-4.2) (1.4) (48.0) (10.5) (-18.6) (66.5) (11.6) (-35.0)
Nuclear power 36.6 37.3 37.2 36.6 147.8 36.0 36.5 37.2 37.8 147.5 12.4
(TWh) (-8.2) (3.1) (-0.8) (-1.9) (-2.1) (-1.6) (-2.3) (0.0) (3.2) (-0.2) (-6.3)
Other 1.3 1.3 1.3 1.6 5.5 1.5 1.5 1.4 1.8 6.2 0.5
(Million TOE) (8.5) (6.6) (5.6) (1.9) (5.4) (12.1) (13.2) (14.2) (14.0) (13.4) (10.8)
Primary energy 62.5 56.9 58.2 65.7 243.3 69.1 61.2 61.3 69.7 261.2 25.9
(Million TOE) (-5.1) (1.3) (2.0) (6.5) (1.1) (10.5) (7.5) (5.3) (6.1) (7.3) (2.6)
Primary energy 48.9 43.3 44.2 51.1 187.5 53.5 46.3 46.6 54.5 200.9 20.6
-Excluding for raw (-4.5) (2.2) (3.4) (6.2) (1.7) (9.4) (7.0) (5.4) (6.6) (7.2) (7.2)materials
<TableⅡ-3> Primary energy consumption trends
수요전망 내지13-1 문 2011.5.20 3:26 PM 페이지47 매일3 MAC2PDF_IN 300DPI 125LPI T

- As of 2010, energy for raw materials accounted for 23.1% of primary energy
consumption.
- The percentage taken up by energy for raw materials is steadily rising from 21.7%
in 2000, gaining strength from growth of the oil/chemical and steel making
industries.
Trends in consumption of each energy source in 2010
In 2010, coal consumption witnessed a year-on-year rise of 10.3%.
- Coal consumption led a rise in primary energy consumption in the first half of the
year. However, the rate of increase in coal consumption slowed down in the
second half of the year.
·In the first half of the year, coal consumption recorded 16.7%, the highest figure in
the 2000s, resulting from a rise in coking coal consumption in the steel making
industry, triggered by economic recovery, as well as base effects.
·The rate of increase in consumption slowed down in the second half of the year to
record a year-on-year comparison of 4.8%, owing to decreased base effects. As
such, the level of increase was high in the first half of the year and low in the
second half of the year.
- Coal consumption for power generation went up 8.1%, attributable to a rise in use
by bituminous coal-firing thermal power plants (8.9% rise in bituminous coal
consumption for power generation).
In 2010, oil consumption recorded sound growth of 2.1%.
- Oil consumption remained weak in the first half of the year. However, annual oil
consumption indicated relatively high growth, owing to a substantial increase in
consumption of transport fuel and oil for industrial raw materials in the second half
of the year, in addition to a sharp rise in consumption in the transformation (power
generation) sector.
- With regards to consumption by sector, petroleum product consumption evenly
went up in all sectors, with the exception of reduced consumption for fuel in the
industrial sector.
48 KOREA ENERGY ECONOMICS INSTITUTE
KEEI Korea Energy Demand Outlook
수요전망 내지13-1 문 2011.5.20 3:26 PM 페이지48 매일3 MAC2PDF_IN 300DPI 125LPI T

·Consumption for transport fuel, industrial raw material use, and in the
transformation sector went up 2.1%, 2.9%, and 1.0%, respectively. Consumption
in the residential/commercial and public/other sector recorded high growth of
5.7% due to the cold weather in the winter.
In 2010, natural gas (LNG) consumption witnessed a year-on-year rise of 22.6%.
- Natural gas consumption for production of town gas and natural gas consumption
for power generation both indicated high growth owing to influence from the
economic recovery and climate.
- Consumption of natural gas for power generation, which is used to handle peak
load, recorded a year-on-year rise of 38.3%, attributable to a substantial rise in
electricity demand in addition to zero expansion of base-load power facilities such
as nuclear power plants.
- LNG consumption for production of town gas went up 12.6% in tandem with a
sharp rise (24.4%) in town gas consumption for industrial use, attributable to
increased industrial activities.
ChapterⅡ Economic and Energy Consumption Trends in Korea
49http://www.keei.re.kr
[DiagramⅡ-3] Trends in primary energy consumption increase rate
수요전망 내지13-1 문 2011.5.20 3:26 PM 페이지49 매일3 MAC2PDF_IN 300DPI 125LPI T

The level of nuclear power generation went down 0.2% in 2010, maintaining a level
similar to that recorded in the previous year.
- This is attributable to a year-on-year decrease in nuclear power generation of 1.3%
from the first through the third quarter, resulting from no additional installation of
power generation facilities and concentration of planned facility inspections (Uljin
Nuclear Power Plant Units 1, 2, 4, and 5, Yeonggwang Nuclear Power Plant Units
1, 2, 3, and 6, Wolseong Nuclear Power Plant Unit 4, Gori Nuclear Power Plant
Units 1 and 2, etc.).
- There was a 3.2% increase in the fourth quarter, owing to the completion of a
substantial number of planned facility inspections and pilot operation of Singori
Nuclear Power Plant Unit 1 (21st nuclear power plant in Korea, commercial
operation on February 28, 2011).
Primary energy consumption trends in January 2011
In January 2011, primary energy consumption reached 25.9 million TOE, a year-on-
year rise of 2.6%.
Primary energy consumption increased, with LNG and oil taking the lead, as a result
of a favorable turn in the economy and continued abnormal cold wave in January.
- LNG consumption witnessed a year-on-year increase of 20.2%, owing to a rise in
consumption for town gas production and consumption for power generation,
resulting from a favorable turn in industries that consume a great amount of
electricity and abnormally low temperatures.
* A 13.7% rise in the mining/manufacturing industry production index: (January
2010) 129.3 → (January 2011) 147.0
* A 11.9% rise in HDD (Heating Degree Day): (January 2010) 697.4 → (January
2011) 780.7
- Oil consumption in January witnessed a year-on-year rise of 5.7%, owing to
increased consumption of naphtha in the petrochemical industry, as well as
kerosene and diesel for heating purposes, and oil for transport.
* Rate of increase of key petroleum products in January: Naphtha 8.0%, kerosene
50 KOREA ENERGY ECONOMICS INSTITUTE
KEEI Korea Energy Demand Outlook
수요전망 내지13-1 문 2011.5.20 3:26 PM 페이지50 매일3 MAC2PDF_IN 300DPI 125LPI T

14.1%, gasoline 5.6%, and diesel for transport 3.6%
- Coal recorded a 8.5% decrease in tandem with a year-on-year drop of 40.5% in
consumption of coking coal in the steel making industry, which previously led a rise
in overall coal consumption.
·Consumption for power generation posted a year-on-year rise of 4.6% due to an
increase in electricity consumption (8.6%).
- Nuclear energy recorded a year-on-year drop of 6.3% owing to planned
inspections of key nuclear power generation facilities (Wolseong Nuclear Power
Plant Unit 3, Gori Nuclear Power Plant Unit 1, Yeonggwang Nuclear Power Plant
Unit 5, Singori Nuclear Power Plant Unit 1).
Level of contribution of each factor that led to an increase in primary energy
consumption in 2010 compared to the previous year
The economic growth factor explains for 84.6% (15.1 million TOE) of the increase in
primary energy consumption (17.9 million TOE).
Weather conditions in 2010 also contributed 27.4% (4.9 million TOE) towards the
increase in primary energy consumption.
* Tentative economic growth rate for 2010: 6.1% (The Bank of Korea)
* Average temperature fluctuations: (First quarter) 1.9℃↓ (April·May) 2.6℃↓
(Third quarter) 0.8℃↑ (Fourth quarter) 0.7℃↓
Improvements in energy usage efficiency have resulted in energy consumption
reduction effects of 12.0% (2.1 million TOE).
ChapterⅡ Economic and Energy Consumption Trends in Korea
51http://www.keei.re.kr
수요전망 내지13-1 문 2011.5.20 3:26 PM 페이지51 매일3 MAC2PDF_IN 300DPI 125LPI T

Notes: The energy efficiency effect includes all factors that trigger a change in energy consumption excluding thetemperature effect and economic growth effect such as changes in the industrial structure and technical energyefficiency improvements.
Notes: Values in parentheses refer to the level of contribution of each factor to energy consumption changes
Level of contribution of each factor that led to a rise in primary energy consumption
from 2000 through 2010
In the 2000s, the economic growth effect had the biggest influence on the rise in
primary energy consumption.
52 KOREA ENERGY ECONOMICS INSTITUTE
KEEI Korea Energy Demand Outlook
Category
Level of contribution tothe primary energy
consumption increaserate (%)
Contribution to a rise in consumption byeach factor in 2010
Contribution to change inconsumption (1,000 TOE)
Level of contribution (%)
Energy efficiency effect -2,147 -12.0 -0.9
Growth effect 15,123 84.6 6.2
Temperature effect 4,902 27.4 2.0
Change in primary energy 17,879 100.0 7.3
<TableⅡ-4> Level of contribution of each factor that led to a rise in primary energy consumption
[DiagramⅡ-4] Level of contribution to the primary energy increase rate by each factor in 2010
수요전망 내지13-1 문 2011.5.20 3:26 PM 페이지52 매일3 MAC2PDF_IN 300DPI 125LPI T
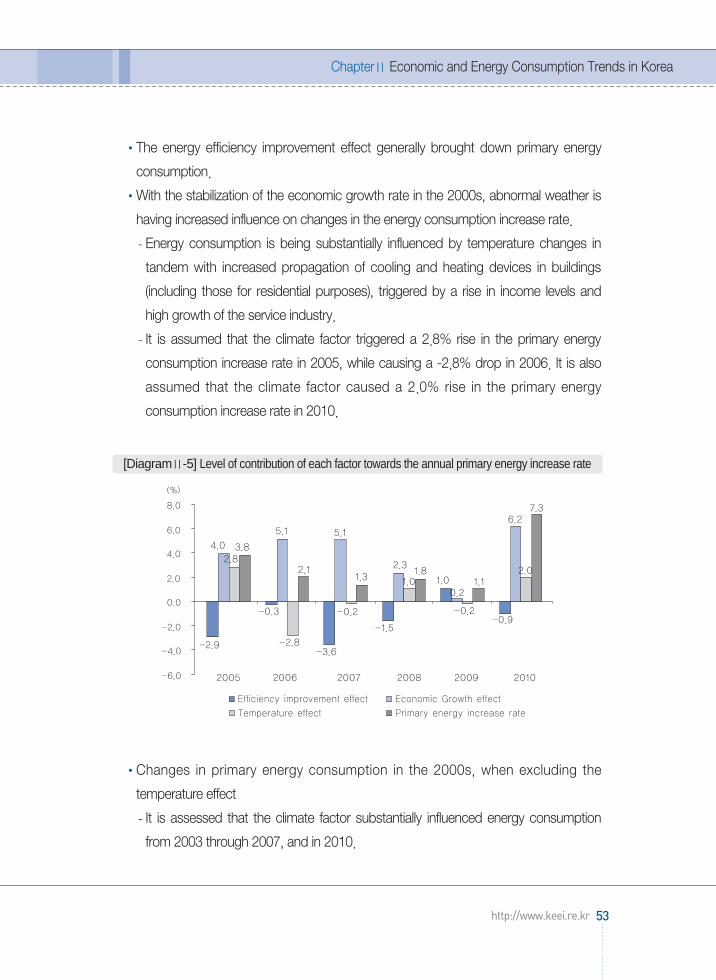
The energy efficiency improvement effect generally brought down primary energy
consumption.
With the stabilization of the economic growth rate in the 2000s, abnormal weather is
having increased influence on changes in the energy consumption increase rate.
- Energy consumption is being substantially influenced by temperature changes in
tandem with increased propagation of cooling and heating devices in buildings
(including those for residential purposes), triggered by a rise in income levels and
high growth of the service industry.
- It is assumed that the climate factor triggered a 2.8% rise in the primary energy
consumption increase rate in 2005, while causing a -2.8% drop in 2006. It is also
assumed that the climate factor caused a 2.0% rise in the primary energy
consumption increase rate in 2010.
Changes in primary energy consumption in the 2000s, when excluding the
temperature effect
- It is assessed that the climate factor substantially influenced energy consumption
from 2003 through 2007, and in 2010.
ChapterⅡ Economic and Energy Consumption Trends in Korea
53http://www.keei.re.kr
[DiagramⅡ-5] Level of contribution of each factor towards the annual primary energy increase rate
수요전망 내지13-1 문 2011.5.20 3:26 PM 페이지53 매일3 MAC2PDF_IN 300DPI 125LPI T

- It is assumed that the climate factor served to substantially raise primary energy
consumption in 2005 and 2010 (3.1 million TOE and 3.2 million TOE, respectively).
- In contrast, it is assumed that the temperature effect led to a decrease in energy
consumption from 2003 to 2004 and 2006 to 2007.
54 KOREA ENERGY ECONOMICS INSTITUTE
KEEI Korea Energy Demand Outlook
Category 2001 2002 2003 2004 2005 2006 2007 2008 2009 2010p
198.4 208.6 215.1 220.2 228.6 233.4 236.5 240.8 243.3 261.2
1.4 -2.0 -3.1 -3.1 3.1 -3.3 -3.7 -1.2 -1.7 3.2
0.7 -1.0 -1.4 -1.4 1.3 -1.4 -1.6 -0.5 -0.7 1.2
<TableⅡ-5> Temperature effect regarding an increase in primary energy consumption
primary energy(1 million TOE)
Temperatureeffect
Amount ofincrease/decrease(1 million TOE)
Increase/decreaserate (%)
[DiagramⅡ-6] Assumed changes in primary energy consumption caused by the temperature effect
수요전망 내지13-1 문 2011.5.20 3:26 PM 페이지54 매일3 MAC2PDF_IN 300DPI 125LPI T

Notes: Total HDD from January through March, November through December
Notes: Total CDD from June through September
Level of contribution of each energy source to an increase in primary energy
consumption in 2010
The level of contribution of electricity (triggering energy consumption for power
generation) and energy for industrial raw materials (naphtha and coking coal) stood at
43.4% and 25.3%, respectively, accounting for 68.7% of the primary energy
increase.
ChapterⅡ Economic and Energy Consumption Trends in Korea
55http://www.keei.re.kr
[DiagramⅡ-7] Changes in HDD
[DiagramⅡ-8] Changes in CDD
수요전망 내지13-1 문 2011.5.20 3:26 PM 페이지55 매일3 MAC2PDF_IN 300DPI 125LPI T

- Energy consumption for power generation in 2010 reached 127.3 million TOE, a
year-on-year rise of 9.5%.
- Energy consumption for industrial raw materials in 2010 posted a year-on-year rise
of 8.0% to reach 60.2 million TOE.
The level of contribution of town gas, oil, anthracite (for industrial and
residential/commercial use), and new & renewable energy in the final sector stood at
15.3%, 5.4%, 3.3%, and 5.5%, respectively.
In 2010, final energy consumption rose by 7.0% from the previous year to stand at
194.9 million TOE.
56 KOREA ENERGY ECONOMICS INSTITUTE
KEEI Korea Energy Demand Outlook
[DiagramⅡ-9] Level of contribution of each energy source to primary energy increase in 2010
Trends in final energy consumption3
수요전망 내지13-1 문 2011.5.20 3:26 PM 페이지56 매일3 MAC2PDF_IN 300DPI 125LPI T

Notes: Values in parentheses are the year-on-year growth rate (%); p refers to tentative figures
ChapterⅡ Economic and Energy Consumption Trends in Korea
57http://www.keei.re.kr
Category2009 2010p 2011p
1/4 2/4 3/4 4/4 Annual 1/4 2/4 3/4 4/4 Annual January
Industry 25.4 26.1 26.6 28.0 106.1 29.1 28.5 27.8 29.9 115.4 10.2(Million TOE) (-6.1) (-1.3) (0.2) (6.1) (-0.3) (14.6) (9.4) (4.7) (6.8) (8.8) (-4.9)
-Excluding for 11.8 12.5 12.6 13.4 50.3 13.6 13.7 13.2 14.7 55.2 4.8raw materials (-4.9) (-1.1) (2.8) (4.8) (0.4) (15.0) (9.7) (4.4) (9.9) (9.7) (4.1)
Transport 8.5 9.1 9.1 9.3 35.9 8.5 9.2 9.4 9.5 36.6 2.9(Million TOE) (-2.9) (0.8) (2.3) (1.3) (0.4) (0.3) (1.4) (3.7) (2.4) (2.0) (4.7)
Residential12.7 7.0 5.8 10.3 35.7 13.6 7.8 6.2 10.6 38.3 5.6/commercial
(Million TOE) (-8.2) (0.9) (1.2) (5.1) (-1.4) (7.7) (12.3) (6.0) (3.4) (7.1) (5.2)
Public/other 1.1 1.0 1.0 1.2 4.3 1.2 1.0 1.1 1.2 4.6 0.4(Million TOE) (-0.5) (11.9) (5.9) (3.6) (4.8) (6.7) (3.5) (12.6) (4.9) (6.8) (-1.5)
Total 47.7 43.1 42.5 48.7 182.1 52.5 46.6 44.5 51.3 194.9 19.1(Million TOE) (-6.0) (-0.3) (0.9) (4.9) (-0.3) (10.0) (8.0) (4.8) (5.2) (7.0) (-0.7)
Total 34.1 29.5 28.5 34.1 126.3 37.0 31.7 29.8 36.1 134.6 13.7-Excluding for
(-5.5) (0.3) (2.4) (3.8) (0.0) (8.4) (7.5) (4.8) (5.7) (6.6) (4.5)raw materials
Town gas 6.9 3.6 2.7 5.3 18.4 7.9 4.3 2.8 5.7 20.8 3.2(Billion m3) (-6.1) (-1.1) (-2.5) (5.4) (-1.5) (14.5) (20.9) (6.1) (7.8) (12.6) (2.9)
Oil 187.2 186.1 181.0 197.9 752.2 189.0 187.8 187.0 204.2 768.0 68.5(Million bbl) (-4.9) (3.6) (1.0) (6.8) (1.5) (1.0) (0.9) (3.3) (3.2) (2.1) (4.3)
-Excluding 105.8 106.0 102.1 115.7 429.6 107.9 105.7 104.0 118.7 436.3 38.0naphtha (-7.2) (2.1) (2.2) (3.5) (0.0) (1.9) (-0.3) (1.9) (2.6) (1.6) (1.5)
Electricity 100.3 94.0 99.0 101.2 394.5 112.5 103.6 109.1 109.0 434.2 43.1(TWh) (-2.3) (2.0) (2.7) (7.7) (2.4) (12.2) (10.3) (10.2) (7.7) (10.1) (8.6)
Coal 8.2 8.2 9.5 10.0 35.9 11.3 10.2 9.4 10.4 41.2 3.4(Million ton) (-15.4) (-16.4) (-0.5) (-3.3) (-8.9) (37.0) (24.1) (-1.2) (3.9) (14.7) (-27.7)
-Excluding 3.7 3.4 3.9 4.2 15.2 3.9 4.0 3.5 4.3 15.8 1.3coking coal (-7.5) (-11.5) (8.6) (-5.6) (-4.3) (6.5) (17.1) (-9.1) (3.3) (4.0) (11.8)
Thermal and1,870 1,391 1,223 1,933 6,418 2,180 1,683 1,455 2,234 7,553 879other
(Thousand TOE) (1.5) (1.7) (1.9) (4.6) (2.5) (16.6) (21.0) (19.0) (15.5) (17.7) (9.8)
<TableⅡ-6> Trends in final energy consumption
수요전망 내지13-1 문 2011.5.20 3:26 PM 페이지57 매일3 MAC2PDF_IN 300DPI 125LPI T

Final energy consumption in 2010 marked a year-on-year growth of 6.6% to post
134.6 million TOE, excluding energy for raw materials (naphtha, coking coal).
- In 2010, energy for raw materials accounted for 30.9% of final energy consumption.
- With regards to the share of final energy consumption taken up by each energy
source and use in 2010, energy for industrial raw materials took up the highest
share, followed by oil for fuel (29.8%), electricity (19.2%), and town gas (11.2%).
Final energy consumption trends by sector in 2010
The industrial sector and residential/commercial sector indicated a year-on-year rise
of 8.8% and 7.1%, respectively, thus leading a rise in final energy consumption (2.0%
in the transport sector and 6.8% in the public/other sector).
Consumption in the industrial sector increased by 14.6% in the first quarter and 9.4%
in the second quarter, but the rate of increase slowed down to 5.8% in the second
half of the year, owing to reduced base effects and a slowdown in the level of
increase in coking coal consumption.
- Coking coal consumption indicated a year-on-year rise of 45.0% in the first half of
the year, but the rate of increase substantially slowed down in the second half of
the year to stand at 4.3%. Annually, coking coal consumption rose 22.6%.
- In contrast, naphtha consumption only went up 1.1% in the first half of the year, but
rose 4.5% in the second half of the year, attributable to a rise in demand for raw
58 KOREA ENERGY ECONOMICS INSTITUTE
KEEI Korea Energy Demand Outlook
[DiagramⅡ-10] Final energy consumption by energy source and use
수요전망 내지13-1 문 2011.5.20 3:26 PM 페이지58 매일3 MAC2PDF_IN 300DPI 125LPI T
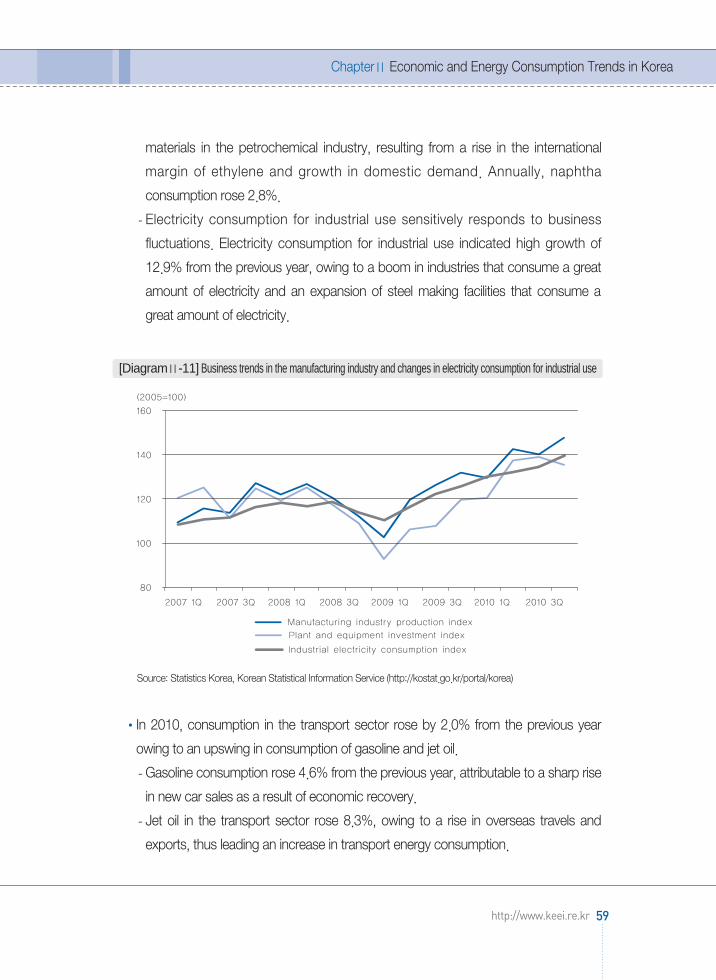
materials in the petrochemical industry, resulting from a rise in the international
margin of ethylene and growth in domestic demand. Annually, naphtha
consumption rose 2.8%.
- Electricity consumption for industrial use sensitively responds to business
fluctuations. Electricity consumption for industrial use indicated high growth of
12.9% from the previous year, owing to a boom in industries that consume a great
amount of electricity and an expansion of steel making facilities that consume a
great amount of electricity.
Source: Statistics Korea, Korean Statistical Information Service (http://kostat.go.kr/portal/korea)
In 2010, consumption in the transport sector rose by 2.0% from the previous year
owing to an upswing in consumption of gasoline and jet oil.
- Gasoline consumption rose 4.6% from the previous year, attributable to a sharp rise
in new car sales as a result of economic recovery.
- Jet oil in the transport sector rose 8.3%, owing to a rise in overseas travels and
exports, thus leading an increase in transport energy consumption.
ChapterⅡ Economic and Energy Consumption Trends in Korea
59http://www.keei.re.kr
[DiagramⅡ-11] Business trends in the manufacturing industry and changes in electricity consumption for industrial use
수요전망 내지13-1 문 2011.5.20 3:26 PM 페이지59 매일3 MAC2PDF_IN 300DPI 125LPI T

- In contrast, diesel for transport indicated an increase of merely 0.7%, owing to a
relatively rapid rise in diesel prices and sluggish sales of vans and trucks that mainly
use diesel, despite the economic recovery.
In 2010, consumption in the residential/commercial sector recorded high growth of
7.1% due to influence from the economic recovery, and abnormally low temperatures
in the winter and high temperatures and high humidity in the summer.
- Petroleum product consumption in this sector rose 5.7% due to the weather, thus
recording unprecedented high growth.
- Electricity consumption indicated growth of 7.7% for commercial use and 6.2% for
residential use. Town gas consumption recorded sound growth in both residential
use (8.1%) and commercial use (5.4%).
In 2010, consumption in the public/other sector marked a year-on-year rise of 6.8%.
- Consumption in this sector includes energy consumption by government offices, for
military purposes, and by public service providers such as those in charge of water
supply.
60 KOREA ENERGY ECONOMICS INSTITUTE
KEEI Korea Energy Demand Outlook
[DiagramⅡ-12] Trends in the rate of final energy consumption increase by sector
수요전망 내지13-1 문 2011.5.20 3:26 PM 페이지60 매일3 MAC2PDF_IN 300DPI 125LPI T

Trends in final energy consumption by energy source in 2010
In 2010, town gas, electricity, and coal consumption recorded a year-on-year rise of
12.6%, 10.1%, and 14.7%, respectively, thus indicating noticeable growth.
Final petroleum product consumption rose 2.1% in 2010 which is a relatively high
figure, attributable to the economic recovery and the climate.
- The level of increase in final petroleum product consumption has slowed down,
posting an annual average increase rate of 0.8% from 2000 through 2009.
- The relatively high growth in consumption in 2010 is attributable to a rise in naphtha
consumption for raw materials (2.8%) in the petrochemical industry as well as a rise
in consumption of oil for heating purposes as a result of continued cold weather.
Electricity consumption posted a rise of 10.1%, owing to base effects from the
sluggish consumption in 2009 and an increase in consumption for heating purposes
owing to the climate as well as a rise in industrial activities.
- The rate of increase in electricity consumption remained high, posting two-digit
figures, from the first through the third quarter. However, it somewhat slowed down
to 7.7% in the fourth quarter.
- Consumption of electricity for industrial use went up 12.9% owing to a considerable
rise in industrial activities and facility investments in the manufacturing sector,
especially industries that consume a great amount of electricity.
* Rate of increase in electricity consumption by type of business: Basic metal
(19.0%), fabricated metal (17.1%), petrochemical sector (7.9%).
ChapterⅡ Economic and Energy Consumption Trends in Korea
61http://www.keei.re.kr
수요전망 내지13-1 문 2011.5.20 3:26 PM 페이지61 매일3 MAC2PDF_IN 300DPI 125LPI T

Notes: Data was extracted from various publications issued by relevant organizations such as the Korea Iron & SteelAssociation
- Electricity consumption for commercial and residential use also indicated relatively
high growth owing to a considerable rise in the use of electric equipment for cooling
and heating purposes, influenced from the economic recovery and abnormal
weather (abnormally low temperatures in the winter, and high temperatures and
high humidity in the summer).
In 2010, peak demand was reached on December 15 at 71,308MW. The power
supply capability was 75,747MW. peak demand recorded a year-on-year increase of
a whopping 6.8% due to the cold wave, resulting in a supplied reserve margin of
6.2%, the lowest figure in the 2000s.
- A recent important characteristic to note is that peak demand was reached in
winter (December) for two consecutive years in 2009 and 2010.
- The main cause is the abnormal cold wave in the winter for two consecutive years,
but another reason is a noticeable, recent rise in electricity consumption for heating
62 KOREA ENERGY ECONOMICS INSTITUTE
KEEI Korea Energy Demand Outlook
Company Facility Capacity (1,000 tons)
Launch of operation Notes
Dangjin Blast Furnace 1 4,200 AprilConstruction completed (Blowing-in in January)
Hyundai Steel Dangjin Hot Rolling Plant 3,500 April Expanded
Dangjin Blast Furnace 2 4,200 NovemberConstruction completed (Blowing-in in November)
Dongkuk Steel Plate Plant 1,500 May New
Gwangyang New 2,800 July New
POSCO Steelmaking Plant
Gwangyang Plate Plant 2,500 August New
SeAH BesteelExpansion of Bar Steel
300 March ExpandedLine in Gunsan
Total 19,000 - -
<TableⅡ-7> Expansion of facilities that consume a great amount of electric power in 2010
수요전망 내지13-1 문 2011.5.20 3:26 PM 페이지62 매일3 MAC2PDF_IN 300DPI 125LPI T

purposes in the winter.
- peak demand in the winter of 2010 to 2011 reached 73,137MW, a 6.1% rise from
the previous year, attributable to an upswing in the economy, continued cold wave,
and relatively affordable electricity charge.
In 2010, consumption of town gas recorded the highest increase - 12.6% - since
2001, amid high consumption (24.4%) in the industrial sector.
- Consumption of town gas for residential/commercial use increased by a great
extent, influenced by abnormally low temperatures in the winter, spring, and
autumn.
- Consumption for transport indicated a year-on-year rise of 13.8%, attributable to
the expansion of CNG buses by local governments.
Coal consumption went up 30.5% in the first half of the year as a result of a soar in
coking coal consumption for steel making. However, consumption by key demand
industries slowed down in the second half of the year, resulting in a rise of merely
1.4%. Annually, coal consumption rose 14.7%.
- Consumption of bituminous coal for steelmaking, which accounts for most (at least
70%) of the consumption of coal in the final consumption sector, went up 22.6%,
thus leading the rise in overall consumption.
- Consumption of bituminous coal for cement production continued a downward
trend in 2009 and 2010 (-14.8% in 2009 → -9.1% in 2010) due to an increase in
inventory of cement, triggered by the stagnant construction business, despite an
upswing in the overall economy.
Thermal energy posted a high increase rate of 10.8% owing to the dissemination of
district heating and temperature effects.
New & renewable energy consumption in the final consumption sector rose 19.9%
from the previous year, gaining strength from the government’s active implementation
of propagation policies.
Trends in final energy consumption in January 2011
In January 2011, final energy consumption recorded a year-on-year drop of 0.7% to
ChapterⅡ Economic and Energy Consumption Trends in Korea
63http://www.keei.re.kr
수요전망 내지13-1 문 2011.5.20 3:26 PM 페이지63 매일3 MAC2PDF_IN 300DPI 125LPI T
stand at 19.1 million TOE.
With regard to final energy consumption trends by sector, the transport sector and
residential/commercial sector recorded a year-on-year growth of 4.7% and 5.2%,
respectively.
- The transport sector posted a year-on-year rise of 4.7%, attributable to a rise in oil
(4.5%), electricity (11.8%), and CNG (2.6%).
- The residential/commercial sector recorded a year-on-year rise of merely 5.2%
owing to the implementation of energy-saving policies such as the ‘measure on
restricting heating temperatures in buildings’despite a soar in energy demand for
heating due to the cold wave in January.
* HDD rise of 11.9% in January: (January 2010) 697.4 → (January 2011) 780.7
- Consumption in the public/other sector recorded a year-on-year decrease of 1.5%,
influenced by the government’s energy-saving policies.
Energy consumption in the industrial sector, which takes up a high share of final
energy consumption, dropped 4.9%, thus leading a decrease in overall final energy
consumption.
- From among energy sources for industrial use, electricity (12.4%), town gas (7.9%),
and oil (2.8%) recorded a rise in consumption owing to continued overall favorable
conditions in the economy.
- Bituminous coal consumption, which soared in the same month the previous year,
plummeted (-33.4%) due to base effects, recording a decrease rate of 4.9%.
With regard to final energy consumption trends by energy source, there was a sharp
rise in electricity consumption, attributable to a favorable turn in industrial activities
and the cold wave.
- Electricity power, town gas, and oil consumption went up 8.6% 2.9%, and 4.3%,
respectively, but coal consumption posted a year-on-year decrease of 27.7%.
- Oil recorded a year-on-year rise of 4.3%, owing to a rise in the consumption of
most petroleum products including gasoline (5.6%), kerosene (14.1%), diesel
(2.4%), naphtha (8.0%), and LPG (4.8%).
- Town gas consumption for industrial use and residential/commercial use indicated
64 KOREA ENERGY ECONOMICS INSTITUTE
KEEI Korea Energy Demand Outlook
수요전망 내지13-1 문 2011.5.20 3:26 PM 페이지64 매일3 MAC2PDF_IN 300DPI 125LPI T
a year-on-year increase of 7.9% and 2.4%, respectively.
- Coal consumption went down 27.7% owing to a 40.5% reduction in coking coal
demand in the steel industry, notwithstanding a 30.0% year-on-year rise in
consumption in the cement industry, which previously recorded a continuous
downward trend.
- Electricity consumption recorded a year-on-year growth of 8.6%. Consumption for
industrial use went up 12.0%, leading a rise in electric power demand.
·Consumption for industrial use maintained two-digit growth for four consecutive
months starting in last October, gaining strength from favorable conditions in
industries that consume a great amount of electricity such as machinery and
equipment (24.9%), steel (18.5%), automobile (18.1%), and semiconductor
(15.1%).
·Consumption for residential use and general use indicated year-on-year growth of
3.7% and 8.2%, respectively, attributable to a rise in electricity demand for heating
purposes resulting from a temperature drop compared to the same month the
previous year.
A. Trends in petroleum product consumption by sector
Petroleum product consumption for 2010 was tentatively tallied at 794.5 million
barrels, a year-on-year rise of 2.1%.
Consumption for transport and industrial raw material use indicated a sharp rise in
the second half of the year. The difference in the price with LNG resulted in a soar in
consumption in the transformation sector, leading to a rise in overall oil consumption.
ChapterⅡ Economic and Energy Consumption Trends in Korea
65http://www.keei.re.kr
Trends in petroleum product consumption4
수요전망 내지13-1 문 2011.5.20 3:26 PM 페이지65 매일3 MAC2PDF_IN 300DPI 125LPI T

With regards to petroleum product consumption by sector in 2010, consumption went
up in all sectors, except the fuel consumption in the industrial sector.
Notes: Values in parentheses are the year-on-year growth rate (%); p refers to tentative figures
The transport sector indicated a year-on-year rise of 2.1% due to a rapid rise in
consumption after the second quarter, as a result of an increase in domestic sales of
automobiles, overseas traveling, and exports.
- As of December 2010, the number of registered vehicles saw an increase of 3.6%
from the end of last year to reach 17.9 million, of which the number of registered
passenger cars went up 4.7% while that of vans went down 2.9%.
The industrial sector recorded a year-on-year rise of 1.6%, despite a reduction in fuel
consumption, attributable to a rise in naphtha demand resulting from favorable
conditions in business and the completion of regular maintenance work in the
petrochemical industry.
66 KOREA ENERGY ECONOMICS INSTITUTE
KEEI Korea Energy Demand Outlook
(Unit: Million bbl)
Category2009 2010p
1/4 2/4 3/4 4/4 Annual 1/4 2/4 3/4 4/4 Annual
Transport 61.0 65.1 65.4 66.9 258.4 61.2 66.2 67.9 68.4 263.7(-3.2) (0.2) (1.7) (1.2) (0.0) (0.4) (1.6) (3.9) (2.2) (2.1)
Industry 107.2 109.9 106.3 111.6 434.9 107.8 109.1 109.3 115.8 442.1(-3.0) (6.3) (0.2) (10.1) (3.3) (0.6) (-0.7) (2.9) (3.8) (1.6)
- Fuel 20.2 21.5 20.2 22.0 83.9 20.2 18.9 19.2 22.4 80.7(-8.5) (2.6) (-1.0) (5.9) (-0.4) (0.1) (-12.2) (-4.7) (1.9) (-3.7)
- feedstockl 87.0 88.3 86.1 89.6 351.1 87.6 90.2 90.1 93.4 361.3(-1.6) (7.3) (0.5) (11.1) (4.2) (0.7) (2.1) (4.6) (4.3) (2.9)
Residential/co 19.0 11.1 9.4 19.5 58.9 20.0 12.6 9.7 20.0 62.3mmercial/public (-18.5) (-1.5) (5.0) (8.4) (-4.1) (5.1) (13.3) (4.0) (2.6) (5.7)
Transformation 11.9 6.4 2.6 5.3 26.2 9.8 5.6 5.1 6.0 26.5(48.3) (93.1) (-29.2) (14.3) (33.2) (-17.3) (-12.3) (92.2) (12.5) (1.0)
Total Oil 199.1 192.5 183.6 203.2 778.5 198.8 193.5 192.1 210.1 794.5(-2.8) (5.3) (0.4) (6.9) (2.3) (-0.1) (0.5) (4.6) (3.4) (2.1)
<TableⅡ-8> Trends in petroleum product consumption by sector
수요전망 내지13-1 문 2011.5.20 3:26 PM 페이지66 매일3 MAC2PDF_IN 300DPI 125LPI T

The residential/commercial/public sector posted a year-on-year rise of 5.7% due to a
surge in energy consumption, a result of abnormal temperatures, and base effects
from decreased consumption in the previous year.
The transformation sector witnessed a year-on-year rise of 1.0%, owing to a surge in
heavy oil consumption for power generation since the second half of the year as well
as a rise in propane demand for production of town gas.
ChapterⅡ Economic and Energy Consumption Trends in Korea
67http://www.keei.re.kr
[DiagramⅡ-13] Changes in the petroleum product consumption increase rate by sector
수요전망 내지13-1 문 2011.5.20 3:26 PM 페이지67 매일3 MAC2PDF_IN 300DPI 125LPI T
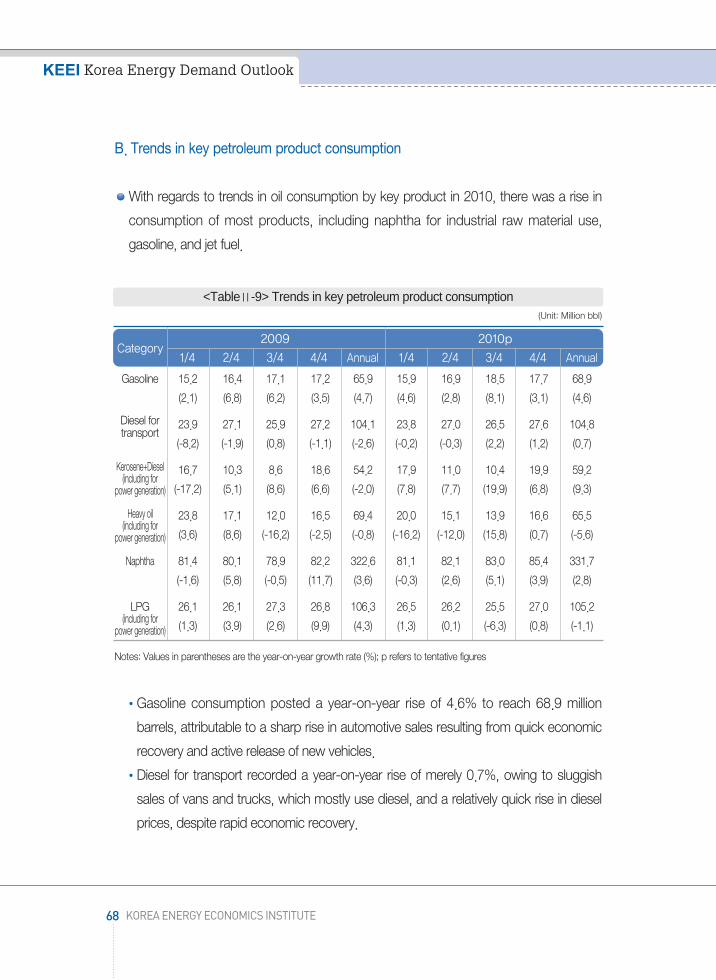
B. Trends in key petroleum product consumption
With regards to trends in oil consumption by key product in 2010, there was a rise in
consumption of most products, including naphtha for industrial raw material use,
gasoline, and jet fuel.
Notes: Values in parentheses are the year-on-year growth rate (%); p refers to tentative figures
Gasoline consumption posted a year-on-year rise of 4.6% to reach 68.9 million
barrels, attributable to a sharp rise in automotive sales resulting from quick economic
recovery and active release of new vehicles.
Diesel for transport recorded a year-on-year rise of merely 0.7%, owing to sluggish
sales of vans and trucks, which mostly use diesel, and a relatively quick rise in diesel
prices, despite rapid economic recovery.
68 KOREA ENERGY ECONOMICS INSTITUTE
KEEI Korea Energy Demand Outlook
(Unit: Million bbl)
Category2009 2010p
1/4 2/4 3/4 4/4 Annual 1/4 2/4 3/4 4/4 Annual
Gasoline 15.2 16.4 17.1 17.2 65.9 15.9 16.9 18.5 17.7 68.9
(2.1) (6.8) (6.2) (3.5) (4.7) (4.6) (2.8) (8.1) (3.1) (4.6)
Diesel for 23.9 27.1 25.9 27.2 104.1 23.8 27.0 26.5 27.6 104.8transport
(-8.2) (-1.9) (0.8) (-1.1) (-2.6) (-0.2) (-0.3) (2.2) (1.2) (0.7)
16.7 10.3 8.6 18.6 54.2 17.9 11.0 10.4 19.9 59.2
(-17.2) (5.1) (8.6) (6.6) (-2.0) (7.8) (7.7) (19.9) (6.8) (9.3)
23.8 17.1 12.0 16.5 69.4 20.0 15.1 13.9 16.6 65.5
(3.6) (8.6) (-16.2) (-2.5) (-0.8) (-16.2) (-12.0) (15.8) (0.7) (-5.6)
Naphtha 81.4 80.1 78.9 82.2 322.6 81.1 82.1 83.0 85.4 331.7
(-1.6) (5.8) (-0.5) (11.7) (3.6) (-0.3) (2.6) (5.1) (3.9) (2.8)
LPG 26.1 26.1 27.3 26.8 106.3 26.5 26.2 25.5 27.0 105.2
(1.3) (3.9) (2.6) (9.9) (4.3) (1.3) (0.1) (-6.3) (0.8) (-1.1)
<TableⅡ-9> Trends in key petroleum product consumption
Heavy oil(including for
power generation)
(including for power generation)
Kerosene+Diesel(including for
power generation)
수요전망 내지13-1 문 2011.5.20 3:26 PM 페이지68 매일3 MAC2PDF_IN 300DPI 125LPI T

Consumption of kerosene and diesel, excluding diesel for transport, witnessed a
year-on-year rise of 9.3% owing to a considerable rise in consumption for heating
purposes in the residential/commercial sector due to abnormal temperatures.
ChapterⅡ Economic and Energy Consumption Trends in Korea
69http://www.keei.re.kr
[DiagramⅡ-15] Changes in consumption of diesel for transport and increase rate
[DiagramⅡ-14] Changes in gasoline consumption and increase rate
수요전망 내지13-1 문 2011.5.20 3:26 PM 페이지69 매일3 MAC2PDF_IN 300DPI 125LPI T
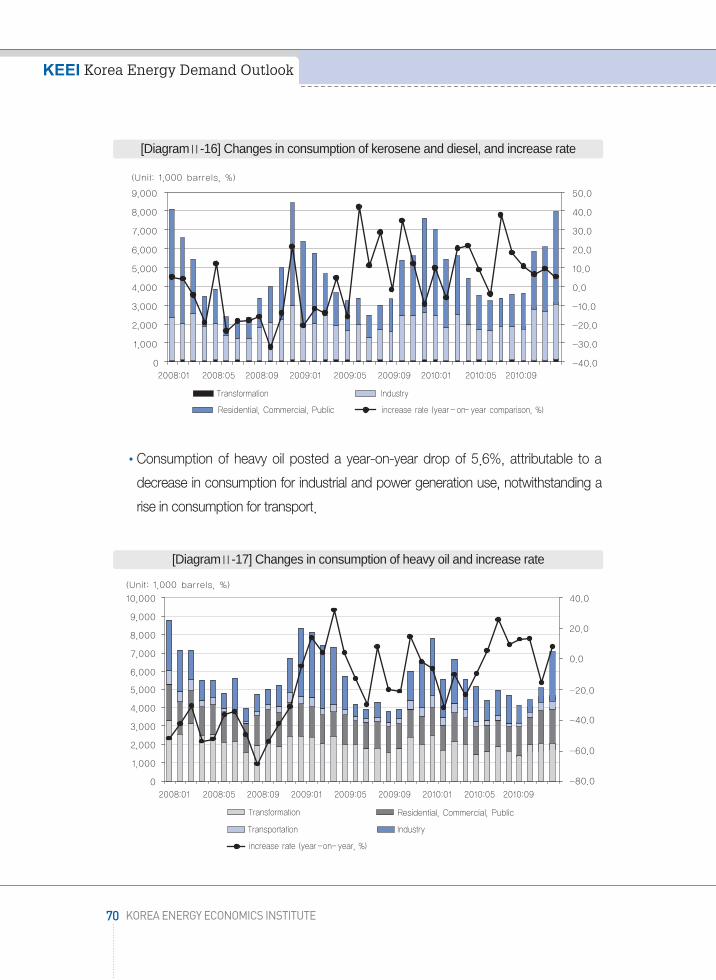
Consumption of heavy oil posted a year-on-year drop of 5.6%, attributable to a
decrease in consumption for industrial and power generation use, notwithstanding a
rise in consumption for transport.
70 KOREA ENERGY ECONOMICS INSTITUTE
KEEI Korea Energy Demand Outlook
[DiagramⅡ-17] Changes in consumption of heavy oil and increase rate
[DiagramⅡ-16] Changes in consumption of kerosene and diesel, and increase rate
수요전망 내지13-1 문 2011.5.20 3:26 PM 페이지70 매일3 MAC2PDF_IN 300DPI 125LPI T

Naphtha recorded a year-on-year rise of 2.8%, despite concerns of excessive supply
in the global market, attributable to a rapid increase in consumption as raw material in
the petrochemical sector, resulting from a rise in the international margin of ethylene
as well as growth in domestic demand.
LPG consumption recorded a year-on-year decrease of 1.1%, owing to a decrease
in consumption for naphtha replacement and for transport, despite a substantial rise
in propane demand in the gas production sector.
ChapterⅡ Economic and Energy Consumption Trends in Korea
71http://www.keei.re.kr
[DiagramⅡ-19] Changes in LPG consumption and increase rate
[DiagramⅡ-18] Changes in consumption of naphtha and increase rate
수요전망 내지13-1 문 2011.5.20 3:26 PM 페이지71 매일3 MAC2PDF_IN 300DPI 125LPI T

In 2010, total electricity consumption witnessed a year-on-year rise of 10.1% to record
434.2 TWh.
Consumption for industrial use and for residential/commercial use considerably
increased due to several factors: increased industrial production from the economic
recovery as well as abnormally low temperatures in the winter and high temperatures
and humidity in the summer.
- In 2010, the climate factor further increased electricity demand for heating and
cooling purposes in each season.
* Changes in climate compared to the same period the previous year: (First half of
the year) 18.3% increase in HDD, (July-August) 16.1% increase in CDD, (Fourth
quarter) 6.3% increase in HDD
- The high electricity consumption increase recorded in 2010 partially results from
base effects from sluggish consumption (2.4% increase) of the previous year.
Notes: Values in parentheses are the year-on-year growth rate (%); p refers to tentative figures
72 KOREA ENERGY ECONOMICS INSTITUTE
KEEI Korea Energy Demand Outlook
Trends in electricity consumption5
(Unit: TWh)
Category2009 2010p
1/4 2/4 3/4 4/4 Annual 1/4 2/4 3/4 4/4 Annual
Residential14.9 13.8 14.5 14.4 57.6 15.7 14.5 16.2 14.9 61.2 (1.9) (3.2) (0.2) (4.5) (2.4) (5.3) (5.0) (11.3) (3.3) (6.2)
Commercial39.4 31.7 33.6 34.3 139.1 42.7 34.2 37.0 36.0 149.8 (1.7) (5.2) (3.5) (4.8) (3.7) (8.2) (7.7) (9.9) (4.7) (7.7)
Industrial45.9 48.5 50.9 52.5 197.7 54.1 55.0 56.0 58.1 223.2 (-6.6) (-0.4) (3.0) (10.7) (1.6) (17.8) (13.4) (10.0) (10.8) (12.9)
Total100.3 94.0 99.0 101.2 394.5 112.5 103.6 109.1 109.0 434.2 (-2.3) (2.0) (2.7) (7.7) (2.4) (12.2) (10.3) (10.2) (7.7) (10.1)
<TableⅡ-10> Trends in electricity consumption
수요전망 내지13-1 문 2011.5.20 3:26 PM 페이지72 매일3 MAC2PDF_IN 300DPI 125LPI T

With regards to the electricity consumption increase rate by quarter in 2010, high
two-digit growth year-on-year was recorded from the first through the third quarter.
The level of growth decreased and remained at a single digit level in the fourth
quarter.
- Changes in the increase rate by quarter in 2010 indicated an opposite pattern from
the increase rate by quarter recorded in 2009 due to base effects.
In January 2011, electricity consumption posted a year-on-year rise of 8.6%,
continuing an upward trend for 22 months straight since April 2009.
Electricity consumption for industrial use went up 12% to stand at 21.767 billion
kWh.
- Two-digit growth continued for four consecutive months since October 2010,
gaining strength from favorable conditions in industries that consume a great
amount of electricity such as machinery and equipment (24.9%), steel (18.5%),
automobile (18.1%), and semiconductor (15.1%).
Consumption for residential use and commercial use marked a year-on-year rise of
3.7% and 8.2%, respectively, attributable to a rise in demand resulting from a drop in
temperatures.
Electricity demand by sector
In 2010, electricity demand for industrial use witnessed a year-on-year rise of 12.9%
to reach 223.2TWh.
- The sharp rise in electricity consumption for industrial use is attributable to a
substantial rise in facility investments and industrial activities in the manufacturing
sector, especially industries that consume a great amount of electricity.
ChapterⅡ Economic and Energy Consumption Trends in Korea
73http://www.keei.re.kr
수요전망 내지13-1 문 2011.5.20 3:26 PM 페이지73 매일3 MAC2PDF_IN 300DPI 125LPI T
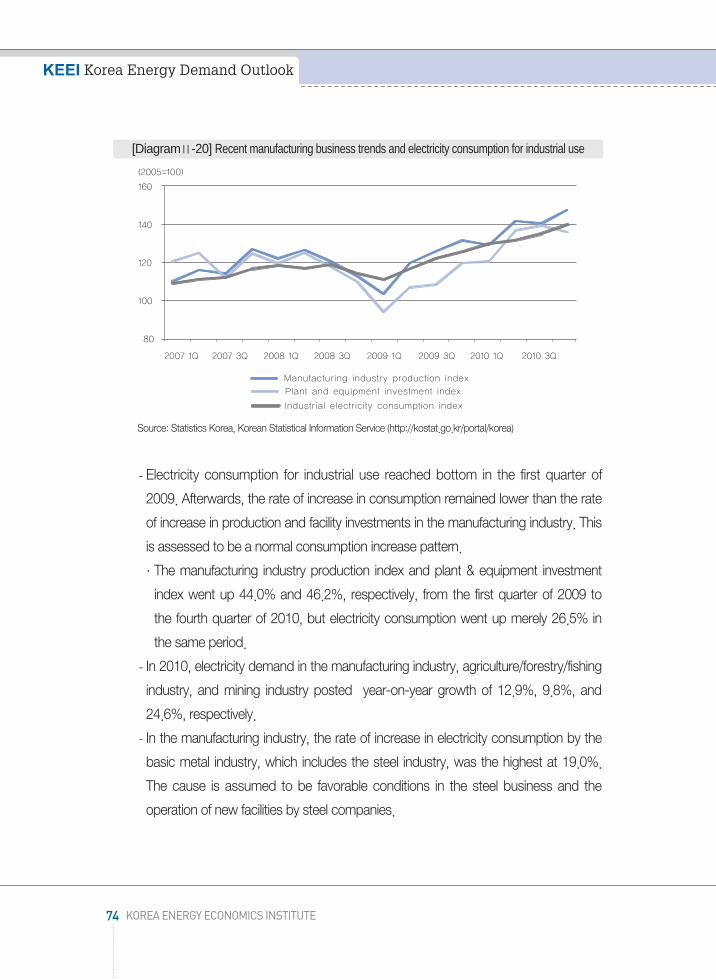
Source: Statistics Korea, Korean Statistical Information Service (http://kostat.go.kr/portal/korea)
- Electricity consumption for industrial use reached bottom in the first quarter of
2009. Afterwards, the rate of increase in consumption remained lower than the rate
of increase in production and facility investments in the manufacturing industry. This
is assessed to be a normal consumption increase pattern.
·The manufacturing industry production index and plant & equipment investment
index went up 44.0% and 46.2%, respectively, from the first quarter of 2009 to
the fourth quarter of 2010, but electricity consumption went up merely 26.5% in
the same period.
- In 2010, electricity demand in the manufacturing industry, agriculture/forestry/fishing
industry, and mining industry posted year-on-year growth of 12.9%, 9.8%, and
24.6%, respectively.
- In the manufacturing industry, the rate of increase in electricity consumption by the
basic metal industry, which includes the steel industry, was the highest at 19.0%.
The cause is assumed to be favorable conditions in the steel business and the
operation of new facilities by steel companies.
74 KOREA ENERGY ECONOMICS INSTITUTE
KEEI Korea Energy Demand Outlook
[DiagramⅡ-20] Recent manufacturing business trends and electricity consumption for industrial use
수요전망 내지13-1 문 2011.5.20 3:26 PM 페이지74 매일3 MAC2PDF_IN 300DPI 125LPI T

- In 2010, consumption in the fabricated metal sector posted a year-on-year rise of
17.1%, thanks to continued favorable conditions in production in the automobile
manufacturing industry and ICT industry.
- During the same period, the petrochemical industry and lumber industry also
recorded a sound electricity consumption increase rate of 7.9% and 10.4%,
respectively.
In 2010, electricity demand for commercial and residential use rose 7.7% and 6.2%,
respectively, from the previous year to reach 149.8TWh and 61.2TWh.
- Electricity consumption for commercial and residential use indicated a
comparatively high increase in tandem with a substantial rise in the use of electric
equipments used for heating and cooling, attributable to the economic recovery
and abnormal weather (low temperatures in the winter and high temperatures and
humidity in the summer).
ChapterⅡ Economic and Energy Consumption Trends in Korea
75http://www.keei.re.kr
[DiagramⅡ-21] Rate of increase in industrial activity indexes and electricity consumption forindustrial use (First quarter of 2009 - Fourth quarter of 2010)
수요전망 내지13-1 문 2011.5.20 3:26 PM 페이지75 매일3 MAC2PDF_IN 300DPI 125LPI T

Expansion of power plants in 2010
Power plants indicated a year-on-year rise of 3.5%(2608MW) to reach 76,078MW.
- Coal and gas power plants increased 123MW and 1,900MW, respectively. Oil
power plants went down 37MW.
- New & renewable energy posted a year-on-year growth of 22.5% with an
expansion of 622MW.
Source: Korea Power Exchange, Electric power system operation performance for 2010, March 2011
76 KOREA ENERGY ECONOMICS INSTITUTE
KEEI Korea Energy Demand Outlook
[DiagramⅡ-22] Changes in the electricity consumption increase rate
Category Nuclear Coal Oil Gas PumpingNew &
renewableenergy
Total
Capacity (MW) 17,716 24,800 5,805 20,471 3,900 3,386 76,078
Increase (MW) - 123 37 1,900 - 622 2,608
<TableⅡ-11> Expansion of plant capacity for each source in 2010
수요전망 내지13-1 문 2011.5.20 3:26 PM 페이지76 매일3 MAC2PDF_IN 300DPI 125LPI T

peak demand and supplied reserve margin5) in the 2000s
peak demand recorded annual average growth of 5.7% in the 2000s, but total
capacity and supply capability indicated annual average growth of 4.7% and 5.1%,
respectively, translating into a steady decrease in the supplied reserve margin.
- In 2010, peak demand was reached on December 15 at 71,308MW. The supply
capability level was 75,747MW. peak demand went up a whopping 6.8% year-on-
year due to the cold wave, but total capacity and supply capability went up a mere
3.8% and 5.1%, respectively, year-on-year.
- The supplied reserve margin in 2010 was 6.2%, the lowest in the 2000s.
A recent important characteristic to note is that peak demand was reached in winter
(December) for two consecutive years in 2009 and 2010.
- The main cause is the abnormal cold wave in the winter for two consecutive years,
but another reason is a noticeable, recent rise in electric power consumption for
heating purposes in the winter.
Source: Korea Electric Power Corporation, Each month’s issue of the Electricity Statistics News
ChapterⅡ Economic and Energy Consumption Trends in Korea
77http://www.keei.re.kr
5) Supplied reserve margin = 100*(Supply capability-peak demand)/peak demand
[DiagramⅡ-23] Changes in peak demand and supplied reserve margin
수요전망 내지13-1 문 2011.5.20 3:26 PM 페이지77 매일3 MAC2PDF_IN 300DPI 125LPI T

peak demand in the winter from 2010 to 2011
peak demand last winter (December 2010-February 2011) indicated year-on-year
growth of 6.1% to reach 73,137MW, attributable to favorable conditions in the
economy, continued cold wave, and relatively affordable charge.
Source: Press release of the Korea Power Exchange (http://www.kpx.or.kr)
According to an analysis carried out by the Korea Power Exchange, the amount of
electricity used for heating as a result of low temperatures and the abnormal cold
wave presumably accounted for at least 25% of peak demand in the winter.
- It is presumed that the rate of increase in heating load for commercial use was
most prominent. Thus electricity for heating in the commercial sector led the recent
rise in heating load.
- On the day of peak demand in the winter from 2010 to 2011, heating load for
commercial use accounted for 37.8% of total heating load (18,576MW).
Notes: Values in parentheses refer to the share taken up by each use (%)Source: Press release of the Korea Power Exchange (http://www.kpx.or.kr)
78 KOREA ENERGY ECONOMICS INSTITUTE
KEEI Korea Energy Demand Outlook
Category 2008~2009 2009~2010 2010~2011
peak demand (MW) 62,645 68,963 73,137
Year-on-year growth rate (%) 2.8 10.1 6.1
<TableⅡ-12> Changes in peak demand in the winter
(Unit: MW)
Category 2008~2009 2009~2010 2010~2011
Total heating load 14,150 16,640 18,576
For residential3,931 4,252 4,754(27.8) (25.6) (25.6)
For commercial4,468 6,178 7,021(31.6) (37.1) (37.8)
For industrial5,751 6,210 6,801(40.6) (37.3) (36.6)
<TableⅡ-13> Heating load in the winter
수요전망 내지13-1 문 2011.5.20 3:26 PM 페이지78 매일3 MAC2PDF_IN 300DPI 125LPI T

A. Trends in LNG consumption
In 2010, LNG consumption saw a year-on-year rise of 22.6% to record 31,971,000
tons. LNG consumption for town gas production and for power generation recorded
high growth, attributable to the economic recovery and abnormal climate.
LNG consumption for town gas production marked year-on-year growth of 12.6% to
reach 17,611,000 tons, resulting from a sharp rise (24.4%) in town gas demand for
industrial use.
LNG consumption for power generation in 2010, when there was no expansion of
base power generation facilities, recorded a year-on-year increase of 38.3%, owing
to a soar in electricity demand. This was the highest rate of increase since 2004.
ChapterⅡ Economic and Energy Consumption Trends in Korea
79http://www.keei.re.kr
[DiagramⅡ-24] Changes in heating load by use
Trends in LNG and town gas consumption6
수요전망 내지13-1 문 2011.5.20 3:26 PM 페이지79 매일3 MAC2PDF_IN 300DPI 125LPI T

- In 2004, LNG consumption for power generation recorded a year-on-year rise of
40.8% owing to high oil prices and failure at nuclear power plants (Yeonggwang
Nuclear Power Plant Units 5 and 6).
Notes: 1. Values in parentheses are the year-on-year growth rate (%); p refers to tentative figures. Figures for powergeneration include the estimated directly-adopted volume of POSCO and K-POWER.
2. LNG for power generation includes LNG used for district heating.3. LNG refers to the total amount of primary energy including internal consumption and gas production losses.
With regards to recent trends in LNG consumption by use, LNG consumption for
power generation sharply rose together with the economic recovery in 2010, thus
leading an increase in overall LNG consumption.
LNG demand for power generation, which is used to handle peak load, substantially
rose owing to a soar in electricity demand, a result of the economic recovery after the
second half of 2009 as well as the cold wave in the winter of 2010 and abnormally
high temperatures in the summer.
- Electricity, whose share of consumption for industrial use is higher than town gas
(mainly used for cooking and heating), more flexibly responds to business cycles.
In 2010, the share of consumption for industrial use was 51.4% and 33.5%,
respectively, for electricity and town gas.
80 KOREA ENERGY ECONOMICS INSTITUTE
KEEI Korea Energy Demand Outlook
(Unit: 1,000 tons)
CategoryYear 2009 Year 2010(p)
1/4 2/4 3/4 4/4 Annual 1/4 2/4 3/4 4/4 Annual
Town gas5,784 2,692 2,202 4,955 15,634 6,659 3,303 2,369 5,280 17,611(-4.7) (0.9) (1.4) (8.2) (0.1) (15.1) (22.7) (7.6) (6.6) (12.6)
Power 2,696 1,869 2,311 3,354 10,229 3,918 3,123 3,071 4,038 14,150generation (-30.1) (-26.7) (-5.9) (14.9) (-13.2) (45.3) (67.2) (32.9) (20.4) (38.3)
LNG8,538 4,625 4,556 8,364 26,083 10,674 6,467 5,475 9,355 31,971(-14.7) (-11.8) (-2.1) (11.0) (-4.9) (25.0) (39.8) (20.2) (11.8) (22.6)
<TableⅡ-14> Trends in LNG consumption
수요전망 내지13-1 문 2011.5.20 3:26 PM 페이지80 매일3 MAC2PDF_IN 300DPI 125LPI T

B. Trends in town gas consumption
In 2010, town gas recorded the highest annual consumption increase rate of 12.6%
since 2001, when town gas supply settled down.
The record increase rate of 2010 is attributable to a rise in heating demand, owing to
abnormally low temperatures in the winter and spring, and a rise in consumption for
industrial use, a result of the economic recovery. In the second quarter, HDD
indicated a year-on-year increase of 64.5% (181.5 in the second quarter of 2009 →
298.5 in the second quarter of 2010).
- Town gas consumption for residential and commercial use both indicated year-on-
year growth of 7.8% due to the cold wave in the first quarter. In the second quarter,
they indicated a year-on-year increase of 18.6% and 10.1%, respectively, owing to
abnormally low temperatures in the spring. They both recorded a high increase rate
in the first half of the year. The level of increase slowed down in the second half of
the year, attributable to reduced base effects, but annually, town gas consumption
for residential and commercial use recorded high growth of 8.1% and 5.4%,
respectively.
ChapterⅡ Economic and Energy Consumption Trends in Korea
81http://www.keei.re.kr
[DiagramⅡ-25] Trends in LNG consumption increase rate per use
수요전망 내지13-1 문 2011.5.20 3:26 PM 페이지81 매일3 MAC2PDF_IN 300DPI 125LPI T

- Town gas consumption for industrial use6) includes town gas consumed for heating
of industrial facilities and town gas directly used for industrial processes. Town gas
consumption for industrial use marked a high year-on-year increase of 33.7% in the
first half of the year, thus leading overall town gas consumption.
The level of increase slightly slowed down in the second half of the year, triggered by
a slowdown in the economic recovery and removal of base effects. However, there
was a high increase rate annually at 24.4% in 2010.
Notes: 1) Values in parentheses are the year-on-year growth rate (%); p refers to tentative figures2) Town gas includes the amount used for transport and co-generation
82 KOREA ENERGY ECONOMICS INSTITUTE
KEEI Korea Energy Demand Outlook
6) Use of town gas for industrial purposes (http://www.samchully.co.kr/): ① Heating furnace (forging furnace,rolling furnace, soaking furnace, preheating furnace, welding and cutting) ② Melting furnace (reverberatoryfurnace, crucible furnace, holding furnace, water-soaking type melting furnace, bottom-heating type meltingfurnace, electric furnace for steelmaking) ③ Heat treatment furnace (quenching furnace, annealing furnace,carburizing furnace, homogenization furnace, aging furnace, annealing furnace, shielding gas generationfurnace) ④ Drying furnace (dry off oven, solvent drying furnace, adhesive drying furnace, shell mould drying,baking oven, etc.)
(Unit: Million m3)
Category2009 2010p
1/4 2/4 3/4 4/4 Annual 1/4 2/4 3/4 4/4 Annual
Residential4,150 1,568 585 2,574 8,877 4,481 1,860 548 2,708 9,597(-4.5) (0.8) (5.7) (7.4) (0.3) (7.8) (18.6) (-6.3) (5.2) (8.1)
Commercial1,227 623 640 914 3,404 1,323 686 674 905 3,588(-5.3) (3.5) (-0.4) (5.8) (0.01) (7.8) (10.1) (5.3) (-1.0) (5.4)
Industrial1,447 1,238 1,271 1,626 5,585 1,962 1,629 1,437 1,920 6,947(-6.4) (-2.5) (-4.3) (10.1) (-0.7) (35.5) (31.5) (13.0) (18.0) (24.4)
Town gas6,917 3,591 2,664 5,274 18,445 7,916 4,342 2,826 5,684 20,768(-6.1) (-1.1) (-2.5) (5.4) (-1.5) (14.5) (20.9) (6.1) (7.8) (12.6)
<TableⅡ-15> Trends in town gas consumption
수요전망 내지13-1 문 2011.5.20 3:26 PM 페이지82 매일3 MAC2PDF_IN 300DPI 125LPI T

A review of recent trends in town gas consumption for industrial use and the increase
rate of the index of industrial production indicates that consumption for industrial use
sensitively responds to production activities in the economy.
Changes in graphs indicate that town gas consumption for industrial use more
flexibly increased in tandem with a rise in the index of industrial production in the
manufacturing sector since the end of 2009, a period of economic recovery, thus
leading overall town gas consumption.
- Consumption for industrial use recorded the highest growth in the first quarter of
2010, when economic recovery was in full swing. Consumption for residential and
commercial use indicated the highest growth in the second quarter of 2010, when
there were abnormally low temperatures.
Source: Korea City Gas Association, The Bank of KoreaNotes: 1. The data labels on the graph refer to the monthly total town gas consumption increase rate
2. The industrial production index refers to the rate of increase from the original index
ChapterⅡ Economic and Energy Consumption Trends in Korea
83http://www.keei.re.kr
[DiagramⅡ-26] Trends in town gas consumption increase rate per use
수요전망 내지13-1 문 2011.5.20 3:26 PM 페이지83 매일3 MAC2PDF_IN 300DPI 125LPI T

A. Trends in coal consumption
In 2010, coal consumption marked a year-on-year rise of 10.3% to reach an annual
119,517,000 tons, despite a slowdown in the increase rate in the second half of the
year, attributable to a substantial rise in consumption for raw material use in the
industrial sector and consumption for power generation in the first half of the year.
In the first half of the year, coal consumption recorded year-on-year growth of 16.7%,
the highest in the 2000s, attributable to a rise in coking coal consumption in the steel
making industry triggered by the economic recovery. In the second half of the year,
when the economic growth rate slowed down and base effects decreased, coal
consumption indicated year-on-year growth of a mere 4.8%. The level of increase
was high in the first half of the year and low in the second half.
Notes: Pig iron sales are based on domestic sales.Source: Korea Iron & Steel Association (steeldata DB), Monthly Report on Energy Statistics
84 KOREA ENERGY ECONOMICS INSTITUTE
KEEI Korea Energy Demand Outlook
Trends in coal and other energy consumption7
[DiagramⅡ-27] Changes in the rate of increase in pig iron and bituminous coal for steel making
수요전망 내지13-1 문 2011.5.20 3:26 PM 페이지84 매일3 MAC2PDF_IN 300DPI 125LPI T

- Bituminous coal consumption in the steel making industry soared in the first half of
the year, owing to favorable conditions in the steel making business and the
operation of new facilities (Hyundai Steel, POSCO). The level of growth sharply
slowed down in the second half of the year. Notwithstanding, consumption
witnessed a year-on-year rise of 22.6% to reach 25,424,000 tons in 2010.
Level of increase in bituminous coal consumption for steel making in the first and
second half of the year: First half of the year (45.0%), second half of the year (4.3%)
Notes: Values in parentheses are the year-on-year growth rate (%)Source: Korea Iron & Steel Association (steeldata DB), Monthly Report on Energy Statistics
In 2010, bituminous coal consumption for cement production temporarily rose owing
to anticipations of economic recovery in the first quarter. However, the construction
industry continued to remain stagnant, resulting in a year-on-year decrease of 9.1%
to post 4,059,000 tons.
- Cement inventory went up, attributable to restructuring of construction companies
and a slump in the regional real estate business, leading to imbalance between
cement supply and demand.
ChapterⅡ Economic and Energy Consumption Trends in Korea
85http://www.keei.re.kr
(Unit: 1,000 tons, %)
Category2009 2010
1/4 2/4 3/4 4/4 Annual 1/4 2/4 3/4 4/4 Annual
Pig iron 5,785 6,468 7,300 7,732 27,284 8,266 8,788 8,411 9,600 35,065 production (-25.4) (-17.0) (-7.7) (2.0) (-12.1) (42.9) (35.9) (15.2) (24.2) (28.5)
Pig iron 71 71 71 76 290 84 99 67 73 324 shipment (-35.0) (-37.1) (-30.9) (-23.4) (-31.9) (17.7) (39.8) (-5.4) (-4.3) (11.7)
Pig iron 164 113 110 72 72 82 203 155 195 195 inventory (24.7) (8.8) (9.3) (-38.3) (-84.1) (-50.1) (80.2) (40.4) (172.1) (172.1)
Consumption of bituminous 4,551 4,783 5,565 5,835 20,734 7,354 6,176 5,810 6,084 25,424
coal for steel (-21.6) (-18.8) (-5.8) (-2.2) (-12.0) (61.6) (29.1) (4.4) (4.3) (22.6)making
<TableⅡ-16> Pig iron production, shipment, and inventory, and bituminous coal consumption for steel making
수요전망 내지13-1 문 2011.5.20 3:26 PM 페이지85 매일3 MAC2PDF_IN 300DPI 125LPI T

Notes: Values in parentheses are the year-on-year growth rate (%); p refers to tentative figures
Bituminous coal consumption for power generation indicated year-on-year growth of
8.9% to reach 77,452,000 tons. It showed sound growth throughout the year,
triggered by a rise in use of bituminous coal-based power generation facilities.
- The rate of use of bituminous coal-based power generation facilities reached 96%
in 2010.
Anthracite consumption marked a year-on-year drop in the residential/commercial
and power generation sectors, but went up in the industrial sector to record
10,105,000 tons, a year-on-year rise of 3.4%.
86 KOREA ENERGY ECONOMICS INSTITUTE
KEEI Korea Energy Demand Outlook
(Unit: 1,000 tons)
Category2009p 2010p
1/4 2/4 3/4 4/4 Annual 1/4 2/4 3/4 4/4 Annual
Anthracite2,572 1,870 2,590 2,744 9,777 2,540 2,463 2,265 2,836 10,105(-6.5) (-22.4) (18.2) (-4.2) (-4.3) (-1.3) (31.7) (-12.6) (3.4) (3.4)
Residential, 618 206 229 888 1,941 563 236 219 842 1,860commercial (-40.0) (66.1) (3.6) (-2.8) (-15.2) (-8.9) (14.6) (-4.4) (-5.2) (-4.2)
Industrial1,620 1,348 2,008 1,499 6,476 1,758 2,045 1,834 1,768 7,406(36.4) (-24.1) (33.7) (-0.1) (8.5) (8.5) (51.7) (-8.7) (18.0) (14.4)
Power 334 316 353 357 1,360 219 182 212 226 839generation (-37.3) (-38.2) (-24.6) (-20.3) (-30.6) (-34.4) (-42.4) (-39.9) (-36.7) (-38.3)
Bituminous 22,378 23,210 26,592 26,422 98,602 28,118 25,256 27,870 28,159 109,413coal (0.5) (2.2) (6.3) (10.0) (4.9) (25.6) (8.8) (4.8) (6.6) (11.0)
Steel 4,551 4,783 5,565 5,835 20,734 7,354 6,176 5,180 6,084 25,424manufacturing (-21.6) (-18.8) (-5.8) (-2.2) (-12.0) (61.6) (29.1) (4.4) (4.3) (22.6)
Cement828 1,354 1,109 1,172 4,463 928 1,139 932 1,051 4,059(-24.8) (-4.2) (-15.0) (-17.3) (-14.8) (12.1) (-15.9) (-16.0) (-10.3) (-9.1)
Other 610 527 552 625 2,314 665 592 559 661 2,478industries (-7.1) (-7.5) (-1.9) (4.2) (-3.1) (9.0) (12.4) (1.3) (5.8) (7.1)
Power 16,389 16,546 19,366 18,790 71,091 19,171 17,349 20,569 20,363 77,452generation (11.5) (11.5) (12.4) (17.3) (13.2) (17.0) (4.9) (6.2) (8.4) (8.9)
Coal24,950 25,080 29,182 29,166 108,378 30,659 27,720 30,135 30,996 119,517(-0.3) (-0.1) (7.3) (8.6) (4.0) (22.9) (10.6) (3.3) (6.3) (10.3)
<TableⅡ-17> Trends in coal consumption
수요전망 내지13-1 문 2011.5.20 3:26 PM 페이지86 매일3 MAC2PDF_IN 300DPI 125LPI T

- Anthracite consumption in the residential/commercial and power generation sector,
which continues a downward trend, recorded a year-on-year decrease of 4.2%
and 38.3%, respectively. In contrast, anthracite consumption for industrial use,
which is mainly used as fuel for co-generation at industrial complexes, marked a
year-on-year rise of 14.4%.
B. Trends in consumption of thermal energy, new & renewable energy, and other energy
In 2010, tentative figures indicate that thermal energy supply reached 1,718 TOE, an
annual rise of 10.8%, owing to abnormally low temperatures, despite a slowdown in
the level of increase of customers in tandem with a slowdown in the dissemination of
district heating.
Thermal energy supply indicated year-on-year growth of 12.3% and 25.2%,
respectively, in the first and second quarter, attributable to abnormally low
temperatures in the first half of the year.
In 2010, consumption of new & renewable energy and other energy indicated a year-
on-year rise of 19.9% to reach 5,835,000 TOE, as a result of government efforts to
promote their dissemination.
Consumption of new & renewable energy is indicating a high rise every year, owing to
a measure that made it mandatory for the public sector to use new & renewable
energy and the implementation of measures by the industrial sector in response to
climate change policies such as those on recycling waste gas.
ChapterⅡ Economic and Energy Consumption Trends in Korea
87http://www.keei.re.kr
수요전망 내지13-1 문 2011.5.20 3:26 PM 페이지87 매일3 MAC2PDF_IN 300DPI 125LPI T
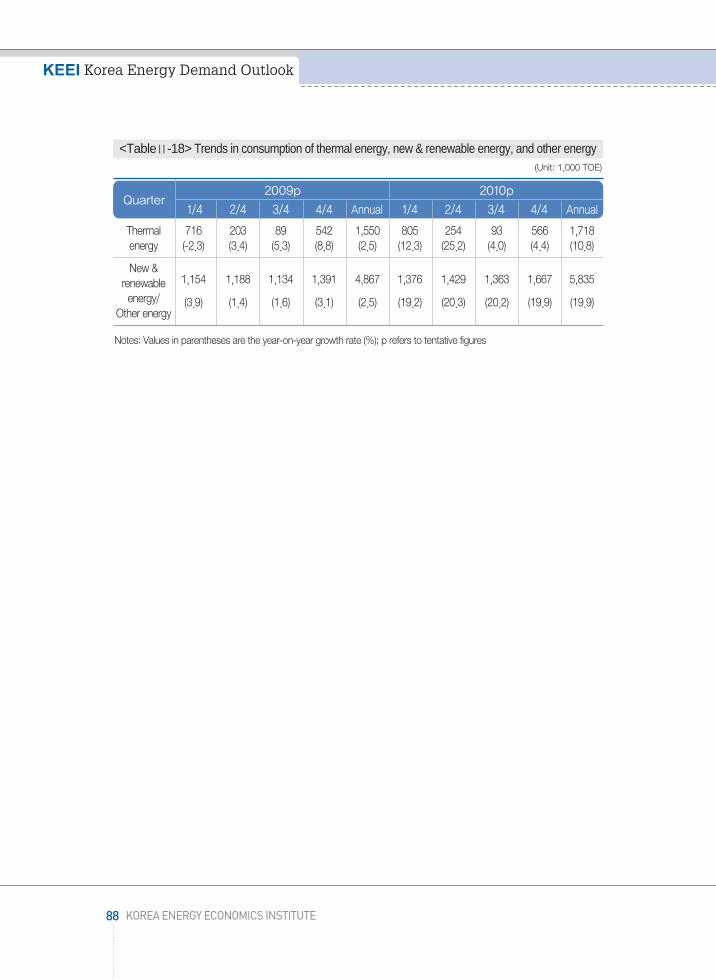
Notes: Values in parentheses are the year-on-year growth rate (%); p refers to tentative figures
88 KOREA ENERGY ECONOMICS INSTITUTE
KEEI Korea Energy Demand Outlook
(Unit: 1,000 TOE)
Quarter2009p 2010p
1/4 2/4 3/4 4/4 Annual 1/4 2/4 3/4 4/4 Annual
Thermal 716 203 89 542 1,550 805 254 93 566 1,718energy (-2.3) (3.4) (5.3) (8.8) (2.5) (12.3) (25.2) (4.0) (4.4) (10.8)
New & renewable 1,154 1,188 1,134 1,391 4,867 1,376 1,429 1,363 1,667 5,835
energy/ (3.9) (1.4) (1.6) (3.1) (2.5) (19.2) (20.3) (20.2) (19.9) (19.9)Other energy
<TableⅡ-18> Trends in consumption of thermal energy, new & renewable energy, and other energy
수요전망 내지13-1 문 2011.5.20 3:26 PM 페이지88 매일3 MAC2PDF_IN 300DPI 125LPI T
ChapterⅢ
Energy Demand Outlook for 2011
1. Outlook on the international oil market
2. Domestic economic outlook and outlook assumptions
3. Outlook on primary energy demand
4. Outlook on final energy demand
5. Outlook on petroleum product demand
6. Outlook on electricity demand
7. Outlook on LNG and town gas demand
8. Outlook on coal and other energy demand
9. Demand forecast characteristics and implications
수요전망 내지13-1 문 2011.5.20 3:26 PM 페이지89 매일3 MAC2PDF_IN 300DPI 125LPI T

수요전망 내지13-1 문 2011.5.20 3:26 PM 페이지90 매일3 MAC2PDF_IN 300DPI 125LPI T
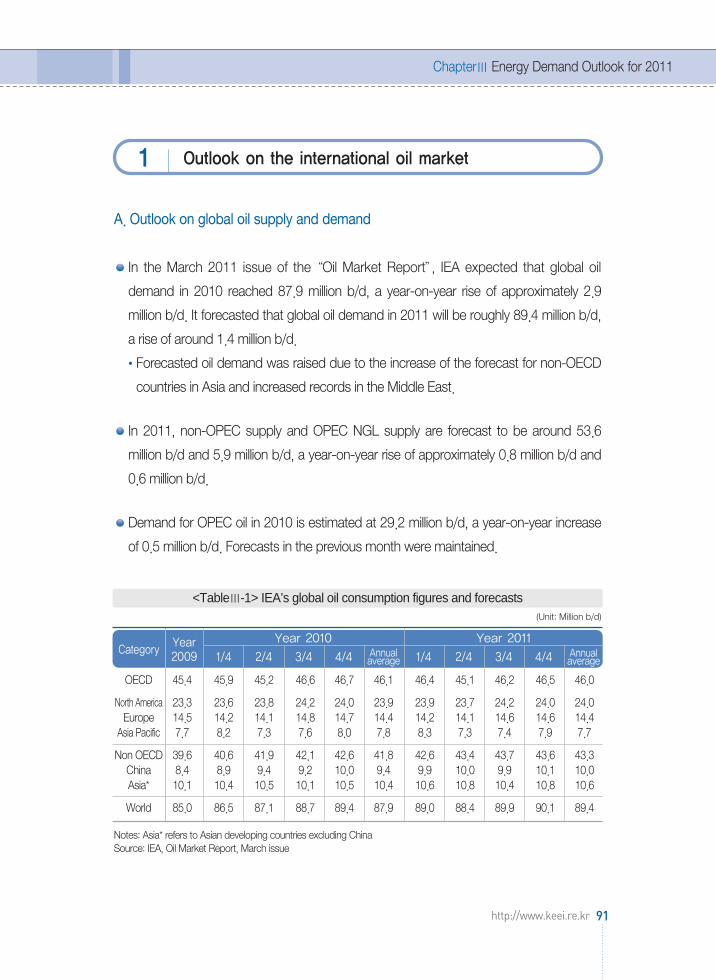
A. Outlook on global oil supply and demand
In the March 2011 issue of the “Oil Market Report”, IEA expected that global oil
demand in 2010 reached 87.9 million b/d, a year-on-year rise of approximately 2.9
million b/d. It forecasted that global oil demand in 2011 will be roughly 89.4 million b/d,
a rise of around 1.4 million b/d.
Forecasted oil demand was raised due to the increase of the forecast for non-OECD
countries in Asia and increased records in the Middle East.
In 2011, non-OPEC supply and OPEC NGL supply are forecast to be around 53.6
million b/d and 5.9 million b/d, a year-on-year rise of approximately 0.8 million b/d and
0.6 million b/d.
Demand for OPEC oil in 2010 is estimated at 29.2 million b/d, a year-on-year increase
of 0.5 million b/d. Forecasts in the previous month were maintained.
Notes: Asia* refers to Asian developing countries excluding ChinaSource: IEA, Oil Market Report, March issue
ChapterⅢ Energy Demand Outlook for 2011
91http://www.keei.re.kr
Outlook on the international oil market1
(Unit: Million b/d)
CategoryYear 2010Year
2009Year 2011
1/4 2/4 3/4 4/4 Annual average 1/4 2/4 3/4 4/4 Annual
average
OECD 45.4 45.9 45.2 46.6 46.7 46.1 46.4 45.1 46.2 46.5 46.0
North America 23.3 23.6 23.8 24.2 24.0 23.9 23.9 23.7 24.2 24.0 24.0Europe 14.5 14.2 14.1 14.8 14.7 14.4 14.2 14.1 14.6 14.6 14.4
Asia Pacific 7.7 8.2 7.3 7.6 8.0 7.8 8.3 7.3 7.4 7.9 7.7
Non OECD 39.6 40.6 41.9 42.1 42.6 41.8 42.6 43.4 43.7 43.6 43.3China 8.4 8.9 9.4 9.2 10.0 9.4 9.9 10.0 9.9 10.1 10.0Asia* 10.1 10.4 10.5 10.1 10.5 10.4 10.6 10.8 10.4 10.8 10.6
World 85.0 86.5 87.1 88.7 89.4 87.9 89.0 88.4 89.9 90.1 89.4
<TableⅢ-1> IEA’s global oil consumption figures and forecasts
수요전망 내지13-1 문 2011.5.20 3:26 PM 페이지91 매일3 MAC2PDF_IN 300DPI 125LPI T

B. International oil price outlook
International oil prices (Dubai) are expected to record an annual average $89.17/barrel
in 2011, a year-on-year rise of 14%, in tandem with continued global economic
recovery and the resulting steady rise in oil demand.
Source: Korea Energy Economics Institute, International Crude Oil Market Conditions in 2011 and Oil Price Outlook,January 2011
CERA forecasts that Dubai oil prices will reach $96.77/barrel in 2011, a year-on-year
rise of 24%, and $96.09/barrel in 2012, a year-on-year drop of 0.7%.
Notes: CGES: Center for Global Energy Studies (London)CERA: Cambridge Energy Research AssociatesEIA: US Energy Information AdministrationPIRA: PIRA Energy Group
92 KOREA ENERGY ECONOMICS INSTITUTE
KEEI Korea Energy Demand Outlook
(Unit: $/Bbl)
Scenario 20102011
1/4 2/4 3/4 4/4 AnnualBase oil price 91.49 89.38 88.36 87.44 89.17
High oil price 78.13 93.76 98.54 100.89 102.07 98.81
Low oil price 87.46 79.88 73.83 70.21 77.85
<TableⅢ-2> Oil price outlook for 2010 and 2011 (Dubai oil)
(Unit: $/Bbl)
CategoryYear 2011Year
2010Year 2012
1/4 2/4 3/4 4/4 Annual average 1/4 2/4 3/4 4/4 Annual
average
CGES Brent(D) 79.9 97.5 103.2 103.2 98.9 100.7 - - - - -
Dubai 78.07 97.64 98.87 94.84 95.72 96.77 92.02 95.01 96.06 98.29 96.09CERA Brent(D) 79.47 100.97 102.33 98.33 98.00 99.91 97.67 98.66 99.66 100.66 99.16
WTI 79.45 90.19 94.00 91.67 93.67 92.38 93.67 94.66 95.66 96.66 95.16
EIA WTI 79.40 93.25 103.83 105.00 105.00 101.77 105.83 105.00 104.17 104.00 104.75
PIRABrent 79.45 106.90 118.35 112.00 114.50 112.95 - - - - -WTI 79.40 94.30 108.50 106.85 107.50 104.30 - - - - -
<TableⅢ-3> Oil price outlook of key overseas organizations in March
수요전망 내지13-1 문 2011.5.20 3:26 PM 페이지92 매일3 MAC2PDF_IN 300DPI 125LPI T
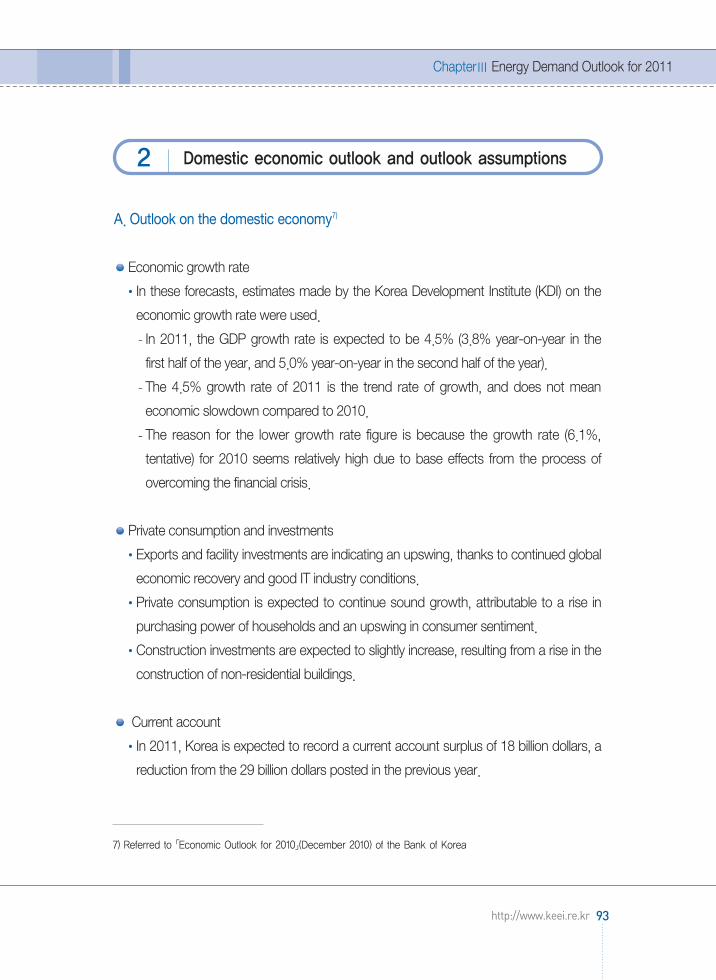
A. Outlook on the domestic economy7)
Economic growth rate
In these forecasts, estimates made by the Korea Development Institute (KDI) on the
economic growth rate were used.
- In 2011, the GDP growth rate is expected to be 4.5% (3.8% year-on-year in the
first half of the year, and 5.0% year-on-year in the second half of the year).
- The 4.5% growth rate of 2011 is the trend rate of growth, and does not mean
economic slowdown compared to 2010.
- The reason for the lower growth rate figure is because the growth rate (6.1%,
tentative) for 2010 seems relatively high due to base effects from the process of
overcoming the financial crisis.
Private consumption and investments
Exports and facility investments are indicating an upswing, thanks to continued global
economic recovery and good IT industry conditions.
Private consumption is expected to continue sound growth, attributable to a rise in
purchasing power of households and an upswing in consumer sentiment.
Construction investments are expected to slightly increase, resulting from a rise in the
construction of non-residential buildings.
Current account
In 2011, Korea is expected to record a current account surplus of 18 billion dollars, a
reduction from the 29 billion dollars posted in the previous year.
ChapterⅢ Energy Demand Outlook for 2011
93http://www.keei.re.kr
Domestic economic outlook and outlook assumptions2
7) Referred to 「Economic Outlook for 2010」(December 2010) of the Bank of Korea
수요전망 내지13-1 문 2011.5.20 3:26 PM 페이지93 매일3 MAC2PDF_IN 300DPI 125LPI T
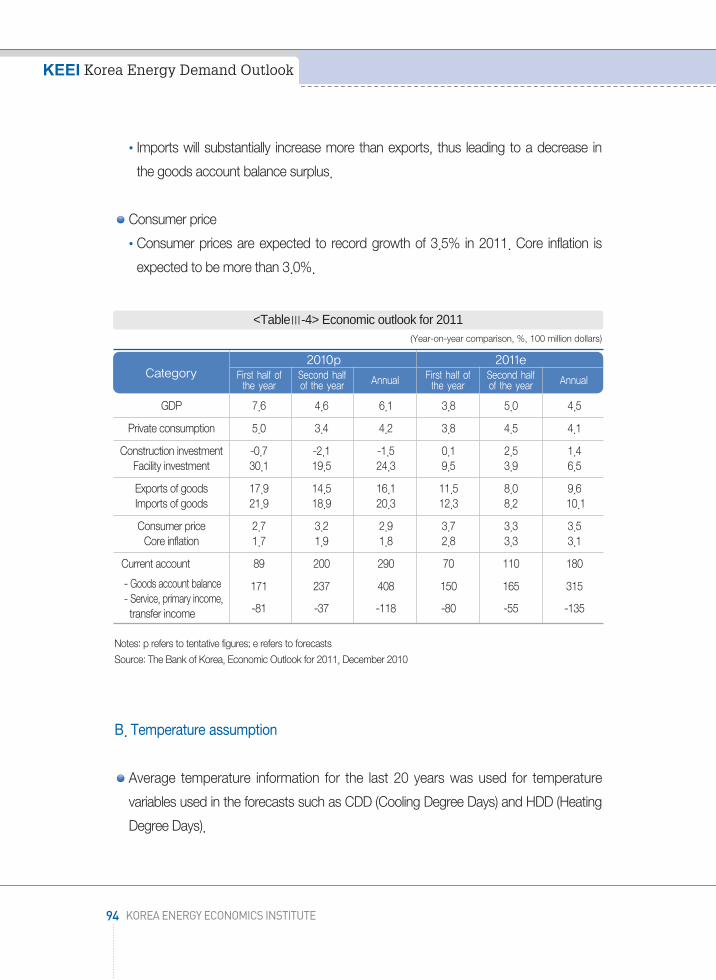
Imports will substantially increase more than exports, thus leading to a decrease in
the goods account balance surplus.
Consumer price
Consumer prices are expected to record growth of 3.5% in 2011. Core inflation is
expected to be more than 3.0%.
Notes: p refers to tentative figures; e refers to forecastsSource: The Bank of Korea, Economic Outlook for 2011, December 2010
B. Temperature assumption
Average temperature information for the last 20 years was used for temperature
variables used in the forecasts such as CDD (Cooling Degree Days) and HDD (Heating
Degree Days).
94 KOREA ENERGY ECONOMICS INSTITUTE
KEEI Korea Energy Demand Outlook
(Year-on-year comparison, %, 100 million dollars)
Category2010p 2011e
First half of the year
Second half of the year Annual First half of
the yearSecond half of the year Annual
GDP 7.6 4.6 6.1 3.8 5.0 4.5
Private consumption 5.0 3.4 4.2 3.8 4.5 4.1
Construction investment -0.7 -2.1 -1.5 0.1 2.5 1.4Facility investment 30.1 19.5 24.3 9.5 3.9 6.5
Exports of goods 17.9 14.5 16.1 11.5 8.0 9.6Imports of goods 21.9 18.9 20.3 12.3 8.2 10.1
Consumer price 2.7 3.2 2.9 3.7 3.3 3.5Core inflation 1.7 1.9 1.8 2.8 3.3 3.1
Current account 89 200 290 70 110 180
- Goods account balance 171 237 408 150 165 315- Service, primary income,transfer income -81 -37 -118 -80 -55 -135
<TableⅢ-4> Economic outlook for 2011
수요전망 내지13-1 문 2011.5.20 3:26 PM 페이지94 매일3 MAC2PDF_IN 300DPI 125LPI T

In 2010, there was abnormal weather such as abnormally low temperatures in the
winter and high temperatures and humidity in the summer. It is assumed, however,
that average year temperatures will be recovered in 2011.
Notes: CDD (HDD) refers to the difference between the daily average temperature and standard temperature if the dailyaverage temperature is higher (lower) than the standard temperature (18℃). Monthly CDD/HDD is the sum of dailydegree days in the month.
ChapterⅢ Energy Demand Outlook for 2011
95http://www.keei.re.kr
CategoryYear 2011
Jan Feb Mar Apr May Jun Jul Aug Sept Oct Nov Dec
Average -1.8 0.9 6.0 12.7 18.0 22.4 25.1 25.7 21.5 14.9 7.5 -1.3temperature
CDD 0 0 0 3.8 33.7 134.6 220.5 240.0 110.3 7.9 0 0
HDD 612.6 483.5 372.6 163.3 33.2 1.2 0 0 4.6 104.1 317.8 597.6
<TableⅢ-5> Assumptions on temperature variables
[DiagramⅢ-1] Changes in CDD and HDD and assumptions for 2011
수요전망 내지13-1 문 2011.5.20 3:26 PM 페이지95 매일3 MAC2PDF_IN 300DPI 125LPI T

Primary energy demand in 2011 is expected to reach 270.8 million TOE, a year-on-
year rise of 3.7%.
Notes: 1) Values in parentheses refer to the rate of increase from the same period the previous year; p refers to tentativefigures; e refers to estimates
2) LNG consumption includes the estimated directly-adopted volume of POSCO and K-POWER
96 KOREA ENERGY ECONOMICS INSTITUTE
KEEI Korea Energy Demand Outlook
Outlook on primary energy demand3
Category2010p 2011e
1/4 2/4 3/4 4/4 Annual 1/4 2/4 3/4 4/4 Annual
Coal 30.7 27.7 30.1 31.0 119.5 31.3 28.4 30.7 32.0 122.4(Million ton) (22.9) (10.6) (3.3) (6.3) (10.3) (2.1) (2.3) (2.0) (3.2) (2.4)
-Excluding 23.3 21.6 24.3 24.9 94.1 23.5 21.9 24.2 25.2 94.8coking coal (14.2) (6.2) (3.0) (6.8) (7.4) (1.0) (1.4) (-0.7) (1.3) (0.8)
Oil 198.8 193.5 192.1 210.1 794.5 204.8 193.6 193.4 209.8 801.6(Million bbl) (-0.1) (0.5) (4.6) (3.4) (2.1) (3.0) (0.0) (0.7) (-0.1) (0.9)
-Excluding 117.7 111.3 109.1 124.7 462.8 119.0 109.7 108.7 123.5 460.9naphtha (0.0) (-1.0) (4.2) (3.1) (1.5) (1.1) (-1.5) (-0.4) (-1.0) (-0.4)
LNG 10.7 6.5 5.5 9.4 32.0 11.5 7.1 6.4 10.4 35.4(Million ton) (25.0) (39.8) (20.2) (11.8) (22.6) (7.6) (9.3) (16.5) (11.6) (10.6)
Hydro 1.2 1.6 2.1 1.5 6.3 1.2 1.5 2.2 1.6 6.5(TWh) (48.0) (10.5) (-18.6) (66.5) (11.6) (-2.7) (-1.9) (6.2) (11.8) (3.7)
Nuclear power 36.0 36.5 37.2 37.8 147.5 37.9 38.4 39.1 39.6 155.1(TWh) (-1.6) (-2.3) (0.0) (3.2) (-0.2) (5.3) (5.3) (5.2) (4.9) (5.2)
Other 1.5 1.5 1.4 1.8 6.2 1.6 1.7 1.5 2.0 6.8(Million TOE) (12.1) (13.2) (14.2) (14.0) (13.4) (11.2) (11.9) (6.0) (11.3) (10.2)
Primary energy 69.1 61.2 61.3 69.7 261.2 71.8 63.0 63.6 72.3 270.8(Million TOE) (10.5) (7.5) (5.3) (6.1) (7.3) (4.0) (3.0) (3.7) (3.8) (3.7)
Primary energy 53.5 46.3 46.6 54.5 200.9 55.4 47.7 48.1 56.6 207.8-Excluding for raw (9.4) (7.0) (5.4) (6.6) (7.2) (3.6) (2.9) (3.3) (3.8) (3.4)materials
<TableⅢ-6> Outlook on primary energy demand
수요전망 내지13-1 문 2011.5.20 3:26 PM 페이지96 매일3 MAC2PDF_IN 300DPI 125LPI T

The level of increase in primary energy demand will likely go down this year due to
several factors: a decrease in the economic growth rate (6.1% in 2010 → 4.5% in
2011), removal of temperature effects resulting from an assumption that average year
temperatures will be recovered, and base effects from high growth in consumption in 2010.
ChapterⅢ Energy Demand Outlook for 2011
97http://www.keei.re.kr
[DiagramⅢ-2] Forecasts on the economic growth rate and primary energy increase rate
[DiagramⅢ-3] Trends in primary energy consumption and assumptions on consumption changes triggered by temperature effects
수요전망 내지13-1 문 2011.5.20 3:26 PM 페이지97 매일3 MAC2PDF_IN 300DPI 125LPI T
Primary energy demand in 2011, excluding energy for raw material use (naphtha,
coking coal), is expected to go up by a mere 3.4% from the previous year.
- In 2011, energy demand for raw material use will likely go up 4.4%, indicating
relatively quick growth.
- Favorable conditions in the economy will likely continue in 2011, leading to
forecasts of a year-on-year increase of 8.5% for coking coal and 2.7% for naphtha.
Forecasts on key energy indicators
The energy intensity (TOE/million won) deteriorated to 0.251 in 2010, continuing the
trend witnessed in 2009. However, it will likely improve to 0.249 in 2011.
- The deterioration of the energy intensity in 2009 is a result of a 1.1% rise in primary
energy consumption, a result of the operation of new facilities in industries that
consume large amounts of energy, against the backdrop of a considerable
slowdown (0.2%) in the growth rate owing to the financial crisis.
- The worsened intensity in 2010 mainly resulted from a soar in energy consumption
for industrial use, owing to a favorable turn in the economy and base effects, as well
as a rise in energy consumption for cooling and heating purposes resulting from
abnormal weather in the winter and summer.
- It is assessed that the worsening of the energy intensity in 2009 and 2010 is
temporary, and that improvements will take place in 2011 and onwards.
Notes: p refers to tentative figures; e refers to forecasts
98 KOREA ENERGY ECONOMICS INSTITUTE
KEEI Korea Energy Demand Outlook
Category 2005 2006 2007 2008 2009 2010p 2011e
Economic growth rate (%) 4.0 5.2 5.1 2.3 0.2 6.1 4.5
Per capita consumption (TOE) 4.75 4.83 4.88 4.95 4.99 5.34 5.53
Primary energy consumption 3.8 2.1 1.3 1.8 1.1 7.3 3.7
increase rate (%)
Energy intensity(TOE/Million won) 0.264 0.256 0.247 0.246 0.248 0.251 0.249
<TableⅢ-7> Key indices related to energy consumption
수요전망 내지13-1 문 2011.5.20 3:26 PM 페이지98 매일3 MAC2PDF_IN 300DPI 125LPI T

Per-capita energy consumption rose from 4.99TOE in 2009 to 5.34TOE in 2010, and
is expected to post 5.53TOE in 2011.
Forecasts on primary energy demand by energy source
In 2011, coal demand is expected to show gradual growth of 2.4%, attributable to
increased demand in the steel industry, despite a slowdown in coal consumption for
power generation (no new facilities), sluggishness in the cement industry, and base
effects from a high increase in consumption in the previous year.
* Operation of a new blast furnace (blast furnace No. 2) at Hyundai Steel (November
2010; annual production of 4 million tons), etc.
- Coal demand, excluding coking coal, is expected to record a year-on-year rise of
merely 0.8%, attributable to sluggish consumption (0.4%) of bituminous coal for
power generation.
In 2011, oil demand is expected to record a year-on-year rise of 0.9% to reach 801.6
million bbl.
- Oil demand for industrial use is expected to indicate relatively high growth (1.8%) as
a result of increased consumption for raw material use, but the level of increase is
ChapterⅢ Energy Demand Outlook for 2011
99http://www.keei.re.kr
[DiagramⅢ-4] Forecasts on energy intensity and per capita consumption
수요전망 내지13-1 문 2011.5.20 3:26 PM 페이지99 매일3 MAC2PDF_IN 300DPI 125LPI T
expected to decrease in comparison to 2010 owing to a relative decrease (-1.4%)
in the level of growth in oil demand for heating purposes based on the assumption
that average year temperatures will be recovered.
- Petroleum product demand, excluding naphtha, will likely post a year-on-year drop
of 0.4%.
- Naphtha, a single petroleum product, takes up an extremely high share of total oil
consumption (41.7% as of 2010). A rise in naphtha demand (2.7%) is expected to
lead an increase in total oil consumption in 2011.
In 2011, LNG demand will likely record high growth of 10.6% compared to the
previous year. LNG demand for power generation (17.5%), which accounted for 44%
of overall consumption in 2010, is expected to lead a rise in demand.
- Demand for LNG for power generation, which is used to handle peak load, is
forecast to record relatively high growth as it is expected that there will be
restrictions on the expansion of capacity of base-load power generation facilities
such as those for nuclear energy and bituminous coal and a high rise in electricity
demand.
- There may be a shortage in LNG supply in the event of abnormal weather that was
witnessed in the previous year such as abnormally low temperatures in the winter
and abnormally high temperatures in the summer. There is therefore a need to take
continuous interest in electricity demand management policies to ensure stability in
energy supply and demand.
The amount of nuclear power generation will record a year-on-year rise of 5.2% as
new facilities are planned for operation in 2011, the first after 2005.
- There will likely be a rate of increase in the low 5% range as a result of effects of
facility expansion (approximately 5.5% increase)8) from the operation of Singori Units
1 and 2.
100 KOREA ENERGY ECONOMICS INSTITUTE
KEEI Korea Energy Demand Outlook
8) The total facility capacity of Singori Units 1 and 2 is 2,000MW. This accounts for 11.3% of the nuclear powerplant capacity (17,716MW) recorded at the end of 2010. However, completion of construction of Singori Unit 2is scheduled for the end of December. Production of electricity through actual pilot operations will likely bepossible in the second half of the year.
수요전망 내지13-1 문 2011.5.20 3:26 PM 페이지100 매일3 MAC2PDF_IN 300DPI 125LPI T

- Singori Units 1 and 2 are Korea’s 21st and 22nd nuclear power plants. Singori Unit
1 commenced commercial operation on February 28, 2011. Singori Unit 2 is now in
a pilot operation test phase before fuel loading. Completion of construction is
planned for December.
Forecasts on percentage of total consumption taken up by each energy source
The percentage of total consumption taken up by oil decreased to less than 50% in
2002, and continued to go down to stand at 39.9% in 2010 (tentative figure). The
percentage occupied by oil is expected to further go down in 2011 to indicate
38.9%.
The percentage of total consumption occupied by coal continually increased from
23.0% in 2001 to 29.1% in 2010, gaining strength from a steady rise in coking coal
consumption for industrial use and consumption for power generation.
- The percentage will likely indicate a downward trend in 2011 (28.8%) for the first
time in the 2000s, owing to no additional bituminous coal-based power generation
facilities and a slowdown in the level of increase in demand for use as industrial fuel.
The share occupied by LNG is steadily on the rise owing to a continuous rise in
demand for power generation, resulting from restrictions on the expansion of base
power generation facilities.
- The share occupied by LNG is expected to rise to 17.0% in 2011 because not
enough base facilities will be built to address the increase in electricity demand.
The share of demand taken up by the amount of nuclear power generation went up
to 16.1% in 2005, and then continued a downward trend as no facility expansions
took place through 2010. The share occupied by nuclear power is expected to
remain at the mid-12% range in 2011, despite the construction of Singori Units 1 and
2 (2,000 MW).
ChapterⅢ Energy Demand Outlook for 2011
101http://www.keei.re.kr
수요전망 내지13-1 문 2011.5.20 3:26 PM 페이지101 매일3 MAC2PDF_IN 300DPI 125LPI T

Forecasts on level of contribution made by each energy source to primary energy
demand
Regarding the level of contribution of each final energy source to the increase in
primary energy consumption, the level of contribution made by demand for use as
electricity and industrial raw material is expected to rise from 68.7% in 2010 to 80.6%
in 2011.
- Electricity (triggering energy demand for power generation): (’10) 43.4% → (’11)
53.3%
- Energy for industrial raw materials (naphtha?coking coal: (’10) 25.3% → (’11)
27.3%
Based on the assumption that there will be a slowdown in economic growth and
average year temperatures will be recovered in 2011, town gas demand for industrial
use and heating purposes is expected to substantially drop. The level of contribution
of town gas to primary energy demand is forecast to decrease from 15.3% in 2010
to 12.3% in 2011.
102 KOREA ENERGY ECONOMICS INSTITUTE
KEEI Korea Energy Demand Outlook
[DiagramⅢ-5] Share of primary energy demand taken up by each energy source
수요전망 내지13-1 문 2011.5.20 3:26 PM 페이지102 매일3 MAC2PDF_IN 300DPI 125LPI T
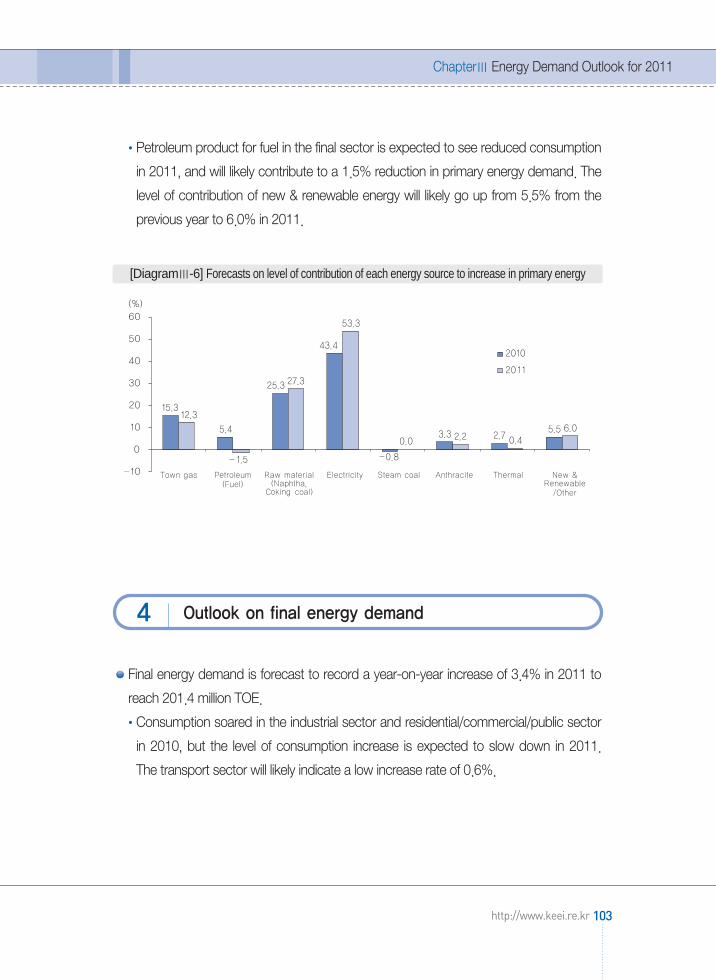
Petroleum product for fuel in the final sector is expected to see reduced consumption
in 2011, and will likely contribute to a 1.5% reduction in primary energy demand. The
level of contribution of new & renewable energy will likely go up from 5.5% from the
previous year to 6.0% in 2011.
Final energy demand is forecast to record a year-on-year increase of 3.4% in 2011 to
reach 201.4 million TOE.
Consumption soared in the industrial sector and residential/commercial/public sector
in 2010, but the level of consumption increase is expected to slow down in 2011.
The transport sector will likely indicate a low increase rate of 0.6%.
ChapterⅢ Energy Demand Outlook for 2011
103http://www.keei.re.kr
[DiagramⅢ-6] Forecasts on level of contribution of each energy source to increase in primary energy
Outlook on final energy demand4
수요전망 내지13-1 문 2011.5.20 3:26 PM 페이지103 매일3 MAC2PDF_IN 300DPI 125LPI T

Notes: Values in parentheses are the year-on-year growth rate (%); p refers to tentative figures; e refers to forecasts
In 2011, consumption in the industrial sector is expected to record sound growth of
4.4% despite base effects from a substantial rise in consumption in 2010.
104 KOREA ENERGY ECONOMICS INSTITUTE
KEEI Korea Energy Demand Outlook
Category2010p 2011e
1/4 2/4 3/4 4/4 Annual 1/4 2/4 3/4 4/4 Annual
Industry 29.1 28.5 27.8 29.9 115.4 30.6 29.6 29.1 31.2 120.5(Million TOE) (14.6) (9.4) (4.7) (6.8) (8.8) (5.0) (3.8) (4.4) (4.4) (4.4)
-Excluding for 13.6 13.7 13.2 14.7 55.2 14.2 14.4 13.6 15.4 57.6raw materials (15.0) (9.7) (4.4) (9.9) (9.7) (4.3) (4.7) (3.5) (4.9) (4.3)
Transport 8.5 9.2 9.4 9.5 36.6 8.6 9.2 9.5 9.5 36.9(Million TOE) (0.3) (1.4) (3.7) (2.4) (2.0) (1.1) (0.6) (1.4) (-0.4) (0.6)
Residential/commercial 14.9 8.8 7.3 11.9 42.8 15.6 8.9 7.6 12.0 44.1/public
(Million TOE) (7.6) (11.2) (7.0) (3.6) (7.1) (4.6) (0.6) (4.0) (1.6) (2.8)
Total 52.5 46.6 44.5 51.3 194.9 54.7 47.8 46.2 52.7 201.4Million TOE (10.0) (8.0) (4.8) (5.2) (7.0) (4.3) (2.6) (3.7) (2.8) (3.4)
Total 37.0 31.7 29.8 36.1 134.6 38.3 32.5 30.7 37.0 138.5-Excluding forraw materials
(8.4) (7.5) (4.8) (5.7) (6.6) (3.7) (2.4) (2.9) (2.4) (2.9)
Town gas 7.9 4.3 2.8 5.7 20.8 8.3 4.6 3.1 5.9 21.9(Billion m3) (14.5) (20.9) (6.1) (7.8) (12.6) (5.3) (6.2) (9.9) (3.0) (5.5)
Oil 189.0 187.8 187.0 204.2 768.0 195.4 188.0 188.3 204.1 775.9(Million bbl) (1.0) (0.9) (3.3) (3.2) (2.1) (3.4) (0.1) (0.7) (0.0) (1.0)
-Excluding 107.9 105.7 104.0 118.7 436.3 109.7 104.1 103.6 117.8 435.2naphtha (1.9) (-0.3) (1.9) (2.6) (1.6) (1.7) (-1.5) (-0.4) (-0.8) (-0.2)
Electricity 112.5 103.6 109.1 109.0 434.2 117.9 109.3 114.9 115.1 457.2(TWh) (12.2) (10.3) (10.2) (7.7) (10.1) (4.8) (5.5) (5.4) (5.7) (5.3)
Coal 11.3 10.2 9.4 10.4 41.2 11.8 10.5 10.2 11.2 43.7(Million ton) (37.0) (24.1) (-1.2) (3.9) (14.7) (4.4) (3.2) (9.0) (8.1) (6.1)
-Excluding 3.9 4.0 3.5 4.3 15.8 4.0 4.0 3.6 4.5 16.1coking coal (6.5) (17.1) (-9.1) (3.3) (4.0) (2.5) (-0.4) (2.2) (3.9) (2.1)
Thermal and2,180 1,683 1,455 2,234 7,553 2,350 1,854 1,538 2,425 8,167other
(Thousand TOE) (16.6) (21.0) (19.0) (15.5) (17.7) (7.8) (10.1) (5.7) (8.6) (8.1)
<TableⅢ-8> Outlook on final energy demand
수요전망 내지13-1 문 2011.5.20 3:26 PM 페이지104 매일3 MAC2PDF_IN 300DPI 125LPI T

- Even after excluding energy (naphtha?coking coal) demand for raw material use,
the level of increase in demand in this sector will likely be 4.3%, thus maintaining a
similar level. This results from forecasts that electricity for industrial use (6.5%) and
town gas (7.3%) will maintain relatively high growth in 2011.
In 2011, energy demand in the transport sector is expected to go up by a mere
0.6%, attributable to a rise in international oil prices, despite a rise in new car sales
and overseas traveling, a result of continued economic recovery, and an increase in
demand for international freight transport.
The residential/commercial/public sector will likely indicate a substantial slowdown in
the demand increase rate at 2.8%. This is mainly attributable to base effects from
2010 as it is assumed that average year temperatures will be recovered.
In terms of each energy source, most energy sources will post a relatively low level of
consumption increase in 2011 due to a slowdown in economic growth and base
effects from the assumption that average year climate conditions will be recovered.
Town gas consumption went up 12.6% in 2010, owing to a surge in demand for
industrial use resulting from economic recovery and abnormally low temperatures.
However, the level of increase is expected to slow down to 5.5% in 2011.
- Town gas demand will likely rise, led by town gas demand for industrial use, as it is
expected that favorable conditions in the economy will continue in 2011.
- In terms of residential use, consumption is expected to slightly go down (-1.4%) as
a result of the reflection of base effects resulting from a difference in climate
conditions with 2010, as the number of customers reaches a state of saturation,
mainly in large cities.
In 2011, oil consumption for raw material use in the industrial sector is estimated to
lead a rise in oil demand.
- Oil demand for raw material use, including naphtha, solvent, and asphalt, is
expected to indicate a year-on-year rise of 3.0% owing to an upswing in the
economy.
- Oil consumption in the residential/commercial/public sector sharply went up due to
ChapterⅢ Energy Demand Outlook for 2011
105http://www.keei.re.kr
수요전망 내지13-1 문 2011.5.20 3:26 PM 페이지105 매일3 MAC2PDF_IN 300DPI 125LPI T

abnormally low temperatures in 2010. It is forecast to post a year-on-year drop of
1.4% if average year climate conditions are recovered in 2011.
- When excluding naphtha, oil demand is expected to slightly drop (-0.2%).
Electricity will likely indicate relatively high growth of 5.3% in 2011 resulting from
several factors: continued, sound economic growth, relatively low charge, continued
dissemination of equipment that use electricity, and convenience in use.
- In 2011, peak demand in the summer is expected to be 73,601MW (August), a
5.3% rise from the 69,886MW recorded in (August) 2010, assuming that average
year temperatures will be recovered.
- Installed reserve margin and supplied reserve margin at the point of time of peak
demand in the summer is expected to be 9.3% and 7.7%, respectively.
In 2011, coal consumption in the final sector is forecast to see an increase of 6.1%
owing to a rise in bituminous coal demand for steel making, despite forecasts of
decreased demand for cement production.
- When excluding coking coal, final consumption of coal will likely post a year-on-year
increase of a mere 2.1%.
Thermal energy is forecast to witness a substantial slowdown in the consumption
increase rate at 1.8% in 2011. New & renewable energy is expected to post a
consumption increase rate of approximately 10%, thanks to the government’s active
implementation of propagation policies.
Final energy consumption structure by sector
The share of final energy consumption taken up by the industrial sector remained at
around 55% up until 2005, but continued to rise afterwards and will likely reach
59.8% in 2011.
- The increase in the share taken up by the industrial sector is a result of steady
growth of industries that consume large amounts of energy such as the steel and
petrochemical industries, as well as sharp growth in the fabricated metal industry,
which consumes a great amount of electricity.
Consumption in the transport sector maintained relatively high growth up until the
106 KOREA ENERGY ECONOMICS INSTITUTE
KEEI Korea Energy Demand Outlook
수요전망 내지13-1 문 2011.5.20 3:26 PM 페이지106 매일3 MAC2PDF_IN 300DPI 125LPI T
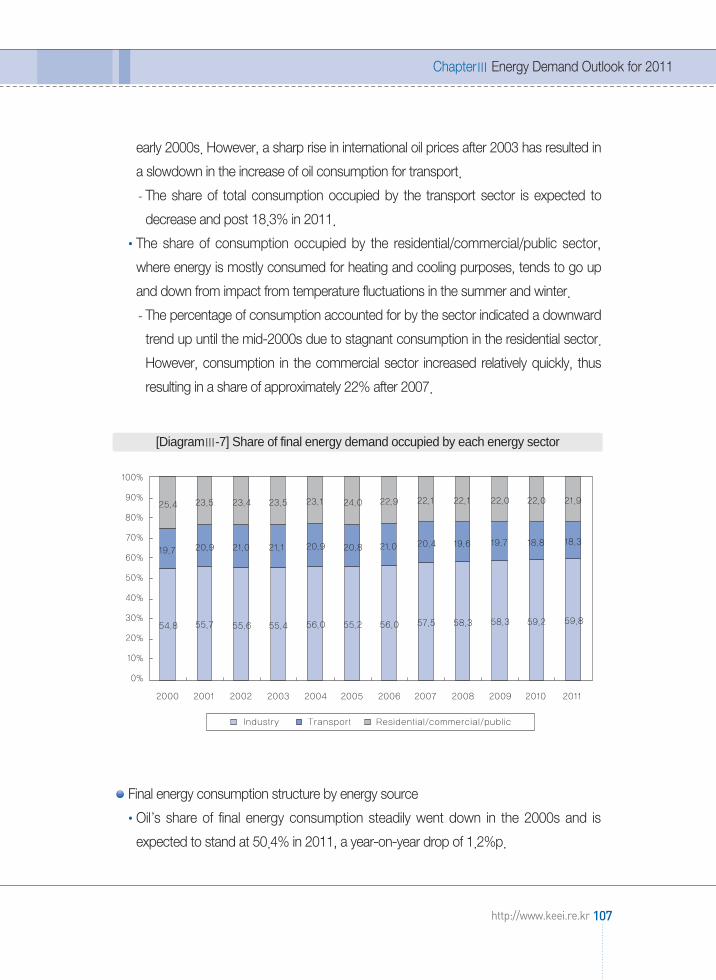
early 2000s. However, a sharp rise in international oil prices after 2003 has resulted in
a slowdown in the increase of oil consumption for transport.
- The share of total consumption occupied by the transport sector is expected to
decrease and post 18.3% in 2011.
The share of consumption occupied by the residential/commercial/public sector,
where energy is mostly consumed for heating and cooling purposes, tends to go up
and down from impact from temperature fluctuations in the summer and winter.
- The percentage of consumption accounted for by the sector indicated a downward
trend up until the mid-2000s due to stagnant consumption in the residential sector.
However, consumption in the commercial sector increased relatively quickly, thus
resulting in a share of approximately 22% after 2007.
Final energy consumption structure by energy source
Oil’s share of final energy consumption steadily went down in the 2000s and is
expected to stand at 50.4% in 2011, a year-on-year drop of 1.2%p.
ChapterⅢ Energy Demand Outlook for 2011
107http://www.keei.re.kr
[DiagramⅢ-7] Share of final energy demand occupied by each energy sector
수요전망 내지13-1 문 2011.5.20 3:26 PM 페이지107 매일3 MAC2PDF_IN 300DPI 125LPI T
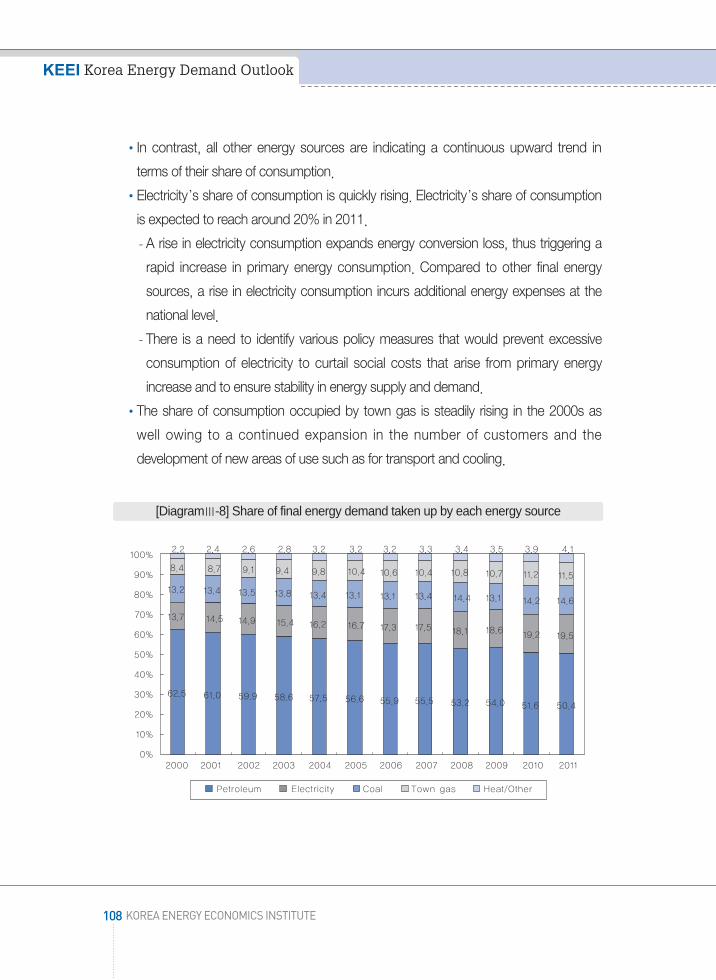
In contrast, all other energy sources are indicating a continuous upward trend in
terms of their share of consumption.
Electricity’s share of consumption is quickly rising. Electricity’s share of consumption
is expected to reach around 20% in 2011.
- A rise in electricity consumption expands energy conversion loss, thus triggering a
rapid increase in primary energy consumption. Compared to other final energy
sources, a rise in electricity consumption incurs additional energy expenses at the
national level.
- There is a need to identify various policy measures that would prevent excessive
consumption of electricity to curtail social costs that arise from primary energy
increase and to ensure stability in energy supply and demand.
The share of consumption occupied by town gas is steadily rising in the 2000s as
well owing to a continued expansion in the number of customers and the
development of new areas of use such as for transport and cooling.
108 KOREA ENERGY ECONOMICS INSTITUTE
KEEI Korea Energy Demand Outlook
[DiagramⅢ-8] Share of final energy demand taken up by each energy source
수요전망 내지13-1 문 2011.5.20 3:26 PM 페이지108 매일3 MAC2PDF_IN 300DPI 125LPI T
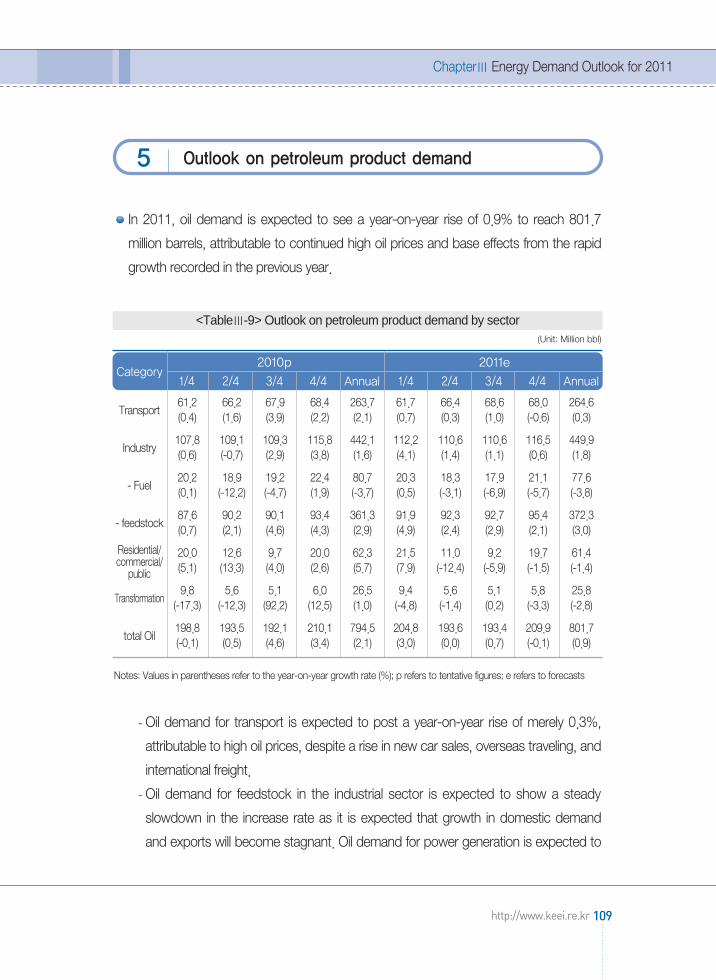
In 2011, oil demand is expected to see a year-on-year rise of 0.9% to reach 801.7
million barrels, attributable to continued high oil prices and base effects from the rapid
growth recorded in the previous year.
Notes: Values in parentheses refer to the year-on-year growth rate (%); p refers to tentative figures; e refers to forecasts
- Oil demand for transport is expected to post a year-on-year rise of merely 0.3%,
attributable to high oil prices, despite a rise in new car sales, overseas traveling, and
international freight.
- Oil demand for feedstock in the industrial sector is expected to show a steady
slowdown in the increase rate as it is expected that growth in domestic demand
and exports will become stagnant. Oil demand for power generation is expected to
ChapterⅢ Energy Demand Outlook for 2011
109http://www.keei.re.kr
Outlook on petroleum product demand5
(Unit: Million bbl)
Category2010p 2011e
1/4 2/4 3/4 4/4 Annual 1/4 2/4 3/4 4/4 Annual
Transport61.2 66.2 67.9 68.4 263.7 61.7 66.4 68.6 68.0 264.6(0.4) (1.6) (3.9) (2.2) (2.1) (0.7) (0.3) (1.0) (-0.6) (0.3)
Industry107.8 109.1 109.3 115.8 442.1 112.2 110.6 110.6 116.5 449.9(0.6) (-0.7) (2.9) (3.8) (1.6) (4.1) (1.4) (1.1) (0.6) (1.8)
- Fuel20.2 18.9 19.2 22.4 80.7 20.3 18.3 17.9 21.1 77.6(0.1) (-12.2) (-4.7) (1.9) (-3.7) (0.5) (-3.1) (-6.9) (-5.7) (-3.8)
- feedstock87.6 90.2 90.1 93.4 361.3 91.9 92.3 92.7 95.4 372.3(0.7) (2.1) (4.6) (4.3) (2.9) (4.9) (2.4) (2.9) (2.1) (3.0)
20.0 12.6 9.7 20.0 62.3 21.5 11.0 9.2 19.7 61.4(5.1) (13.3) (4.0) (2.6) (5.7) (7.9) (-12.4) (-5.9) (-1.5) (-1.4)
Transformation9.8 5.6 5.1 6.0 26.5 9.4 5.6 5.1 5.8 25.8
(-17.3) (-12.3) (92.2) (12.5) (1.0) (-4.8) (-1.4) (0.2) (-3.3) (-2.8)
total Oil198.8 193.5 192.1 210.1 794.5 204.8 193.6 193.4 209.9 801.7(-0.1) (0.5) (4.6) (3.4) (2.1) (3.0) (0.0) (0.7) (-0.1) (0.9)
Residential/commercial/
public
<TableⅢ-9> Outlook on petroleum product demand by sector
수요전망 내지13-1 문 2011.5.20 3:26 PM 페이지109 매일3 MAC2PDF_IN 300DPI 125LPI T

slightly decrease due to influence from high oil prices.
- By product, the increase rate of demand for key products will record a substantial
drop, excluding naphtha, owing to influence from high oil prices.
- In particular, kerosene and diesel demand will make a shift from a short-term rise to
a downward trend, and is expected to record a relatively substantial decrease.
Products for transport, such as gasoline and transport diesel, will likely see stagnant
consumption at the previous year’s level.
Notes: Kerosene+Diesel: Sum of diesel (excluding for transport), indoor kerosene, and boiler kerosene consumption.Values in parentheses refer to the year-on-year growth rate (%); p refers to tentative figures; e refers to forecasts
110 KOREA ENERGY ECONOMICS INSTITUTE
KEEI Korea Energy Demand Outlook
(Unit: Million bbl)
Category2010p 2011e
1/4 2/4 3/4 4/4 Annual 1/4 2/4 3/4 4/4 Annual
Gasoline 15.9 16.9 18.5 17.7 68.9 16.4 16.9 18.3 17.2 68.8(4.6) (2.8) (8.1) (3.1) (4.6) (3.3) (0.2) (-0.9) (-3.0) (-0.2)
Diesel for 23.8 27.0 26.5 27.6 104.8 23.9 27.2 26.6 27.8 105.4transport (-0.2) (-0.3) (2.2) (1.2) (0.7) (0.4) (0.5) (0.4) (0.7) (0.5)
Kerosene+Diesel 17.9 11.0 10.4 19.9 59.2 19.1 9.9 8.9 18.6 56.6(7.8) (7.7) (19.9) (6.8) (9.3) (6.6) (-10.1) (-13.8) (-6.3) (-4.4)
Heavy oil 20.0 15.1 13.9 16.6 65.5 19.0 14.5 13.5 15.4 62.4(-16.2) (-12.0) (15.8) (0.7) (-5.6) (-4.9) (-3.6) (-3.0) (-7.1) (-4.8)
Naphtha 81.1 82.1 83.0 85.4 331.7 85.8 83.9 84.7 86.3 340.7(-0.3) (2.6) (5.1) (3.9) (2.8) (5.7) (2.1) (2.1) (1.0) (2.7)
LPG 26.5 26.2 25.5 27.0 105.2 26.7 25.0 25.3 27.4 104.4(1.3) (0.1) (-6.3) (0.8) (-1.1) (0.8) (-4.4) (-0.9) (1.6) (-0.7)
<TableⅢ-10> Outlook on demand of key petroleum products
(including for power generation)
(including for power generation)
(including for power generation)
수요전망 내지13-1 문 2011.5.20 3:26 PM 페이지110 매일3 MAC2PDF_IN 300DPI 125LPI T
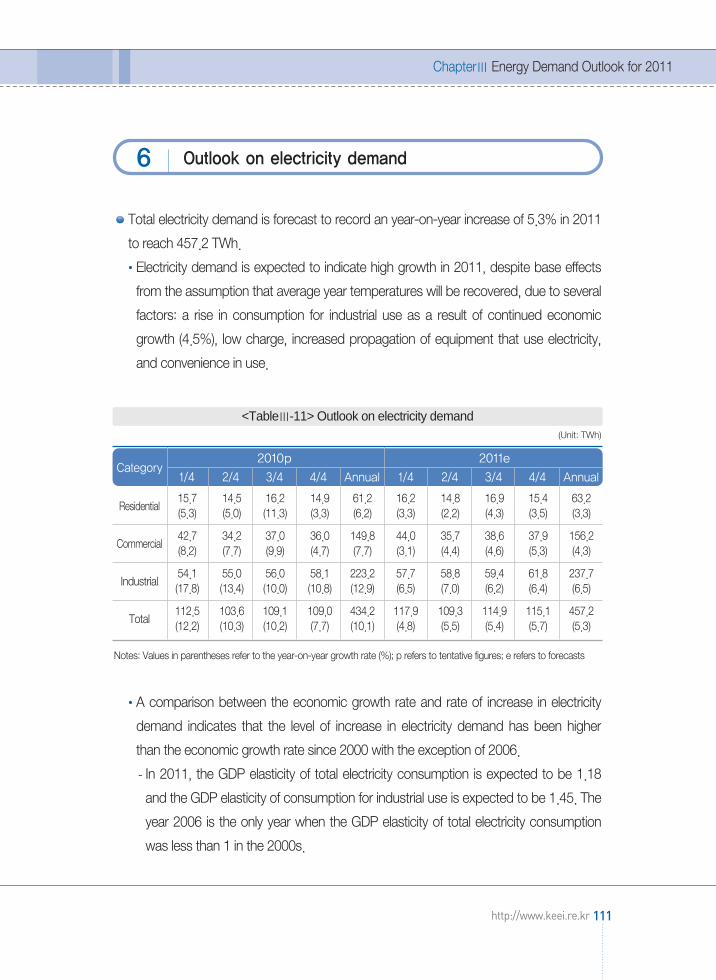
Total electricity demand is forecast to record an year-on-year increase of 5.3% in 2011
to reach 457.2 TWh.
Electricity demand is expected to indicate high growth in 2011, despite base effects
from the assumption that average year temperatures will be recovered, due to several
factors: a rise in consumption for industrial use as a result of continued economic
growth (4.5%), low charge, increased propagation of equipment that use electricity,
and convenience in use.
Notes: Values in parentheses refer to the year-on-year growth rate (%); p refers to tentative figures; e refers to forecasts
A comparison between the economic growth rate and rate of increase in electricity
demand indicates that the level of increase in electricity demand has been higher
than the economic growth rate since 2000 with the exception of 2006.
- In 2011, the GDP elasticity of total electricity consumption is expected to be 1.18
and the GDP elasticity of consumption for industrial use is expected to be 1.45. The
year 2006 is the only year when the GDP elasticity of total electricity consumption
was less than 1 in the 2000s.
ChapterⅢ Energy Demand Outlook for 2011
111http://www.keei.re.kr
Outlook on electricity demand6
(Unit: TWh)
Category2010p 2011e
1/4 2/4 3/4 4/4 Annual 1/4 2/4 3/4 4/4 Annual
Residential15.7 14.5 16.2 14.9 61.2 16.2 14.8 16.9 15.4 63.2 (5.3) (5.0) (11.3) (3.3) (6.2) (3.3) (2.2) (4.3) (3.5) (3.3)
Commercial42.7 34.2 37.0 36.0 149.8 44.0 35.7 38.6 37.9 156.2 (8.2) (7.7) (9.9) (4.7) (7.7) (3.1) (4.4) (4.6) (5.3) (4.3)
Industrial54.1 55.0 56.0 58.1 223.2 57.7 58.8 59.4 61.8 237.7 (17.8) (13.4) (10.0) (10.8) (12.9) (6.5) (7.0) (6.2) (6.4) (6.5)
Total112.5 103.6 109.1 109.0 434.2 117.9 109.3 114.9 115.1 457.2 (12.2) (10.3) (10.2) (7.7) (10.1) (4.8) (5.5) (5.4) (5.7) (5.3)
<TableⅢ-11> Outlook on electricity demand
수요전망 내지13-1 문 2011.5.20 3:26 PM 페이지111 매일3 MAC2PDF_IN 300DPI 125LPI T
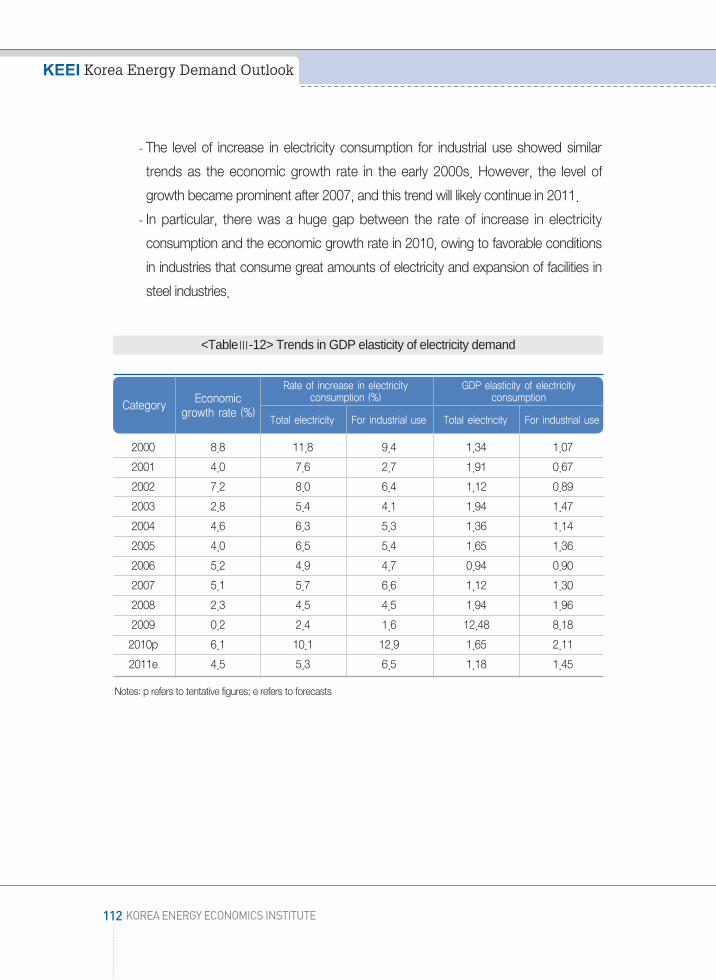
- The level of increase in electricity consumption for industrial use showed similar
trends as the economic growth rate in the early 2000s. However, the level of
growth became prominent after 2007, and this trend will likely continue in 2011.
- In particular, there was a huge gap between the rate of increase in electricity
consumption and the economic growth rate in 2010, owing to favorable conditions
in industries that consume great amounts of electricity and expansion of facilities in
steel industries.
Notes: p refers to tentative figures; e refers to forecasts
112 KOREA ENERGY ECONOMICS INSTITUTE
KEEI Korea Energy Demand Outlook
Category Economic growth rate (%)
Rate of increase in electricityconsumption (%)
GDP elasticity of electricityconsumption
Total electricity For industrial use Total electricity For industrial use
2000 8.8 11.8 9.4 1.34 1.07
2001 4.0 7.6 2.7 1.91 0.67
2002 7.2 8.0 6.4 1.12 0.89
2003 2.8 5.4 4.1 1.94 1.47
2004 4.6 6.3 5.3 1.36 1.14
2005 4.0 6.5 5.4 1.65 1.36
2006 5.2 4.9 4.7 0.94 0.90
2007 5.1 5.7 6.6 1.12 1.30
2008 2.3 4.5 4.5 1.94 1.96
2009 0.2 2.4 1.6 12.48 8.18
2010p 6.1 10.1 12.9 1.65 2.11
2011e 4.5 5.3 6.5 1.18 1.45
<TableⅢ-12> Trends in GDP elasticity of electricity demand
수요전망 내지13-1 문 2011.5.20 3:26 PM 페이지112 매일3 MAC2PDF_IN 300DPI 125LPI T
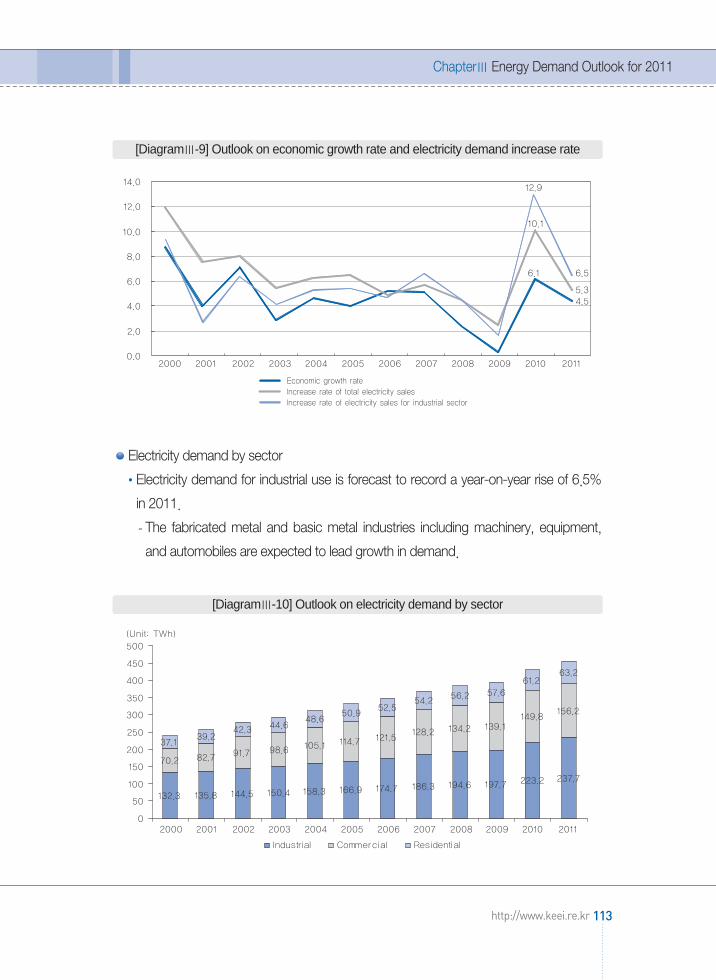
Electricity demand by sector
Electricity demand for industrial use is forecast to record a year-on-year rise of 6.5%
in 2011.
- The fabricated metal and basic metal industries including machinery, equipment,
and automobiles are expected to lead growth in demand.
ChapterⅢ Energy Demand Outlook for 2011
113http://www.keei.re.kr
[DiagramⅢ-9] Outlook on economic growth rate and electricity demand increase rate
[DiagramⅢ-10] Outlook on electricity demand by sector
수요전망 내지13-1 문 2011.5.20 3:26 PM 페이지113 매일3 MAC2PDF_IN 300DPI 125LPI T

The rate of increase in electricity demand for commercial use is forecast to slow
down to 4.3% in 2011 as it is expected that the economic growth rate will be lower
(4.5%) than the previous year.
Electricity demand for residential use went up 6.2% in 2010 due to great influence
from climate conditions. The rate of increase is expected to go down to the low 3%
range in 2011 owing to base effects based on the assumption that average year
temperatures will be recovered.
Electricity demand structure by sector
The share of electricity demand for industrial use is expected to slightly rise from
51.4% in 2010 to 52.0%in 2011, due to a rise in industrial activities, a result of
continued favorable conditions in the economy in 2011.
The share of electricity demand for residential use is forecast to drop from 14.1% in
2010 to 13.8% in 2011.
The share of demand for commercial use continually increased owing to growth of
the service industry after 2000 and up to 2009. However, the share decreased to
34.5% as a result of strong demand for industrial use in 2010. The share is expected
to slightly go down in 2011 as well.
114 KOREA ENERGY ECONOMICS INSTITUTE
KEEI Korea Energy Demand Outlook
[DiagramⅢ-11] Trends in electricity consumption share of each sector and forecasts
수요전망 내지13-1 문 2011.5.20 3:26 PM 페이지114 매일3 MAC2PDF_IN 300DPI 125LPI T

Outlook on electricity supply/demand in the summer of 2011
Peak demand in the summer of 2011 (base forecast) is expected to be 73,601MW
(August), a 5.3% rise from the 69,886MW witnessed in (August) 2010.
- The monthly electricity supply/demand information for January 1990 through
February 2011 was used, along with the econometric model (ARDL).
- An assumption was made that the economic growth rate for 2011 would be 4.5%
and monthly average temperature information (HDD, CDD) for 20 years was used.
- Real electric charge (unit cost of electricity sales) did not change.
Peak demand forecasting by scenario
- Maximum Forecast No. 1, which uses monthly average temperature information of
the last five years (2005-2010), estimates that summer peak demand will reach
73,886MW, a year-on-year rise of 5.7%.
- Maximum Forecast No. 2, which assumes that summer climate conditions in 2011
will be the same as they were in 2010, estimates that summer peak demand will
reach 74,846MW, a year-on-year increase of 7.1%.
Installed reserve margin in the event of peak demand in the summer of 2011 is
estimated at 7.4% in case of the base forecast, 7.0% in case of Maximum Forecast
No. 1, and 5.6% in case of Maximum Forecast No. 2.
- Total capacity is calculated by applying the monthly capacity increase/decrease
plan for 2011 of the 5th Electricity Supply/Demand Plan to the facility capacity
recorded at the end of 2010.
- Because installed reserve level(total capacity - peak demand) is expected to be
5,469MW for the base forecast and 5,184MW for Maximum Forecast No. 1, stable
electricity supply/demand is expected.
- However, if climate conditions in the summer are the same as last year’s, installed
reserve level may drop to approximately 4,200MW, which is lower than what was
recorded (4,521MW) in the summer of the previous year.
ChapterⅢ Energy Demand Outlook for 2011
115http://www.keei.re.kr
수요전망 내지13-1 문 2011.5.20 3:26 PM 페이지115 매일3 MAC2PDF_IN 300DPI 125LPI T

Notes: 1) Installed reserve margin (%) = [(Total capacity - peak demand)/peak demand]×1002) Total capacity excludes small hydro power facilities and isolated facilities that are not connected to systems
A. Outlook on LNG demand
In 2011, LNG demand is expected to reach 35,375,000 tons, a year-on-year rise of
10.6%, gaining strength from a sound increase in demand for town gas production
and high growth in demand for power generation.
In 2011, LNG demand for town gas production is expected to post a year-on-year
increase of 5.1% to reach 18,055,000 tons, when base effects from 2010 disappear
and an assumption is made that average year temperatures will be recovered.
- Demand will likely be led by demand for industrial use rather than for
residential/commercial use, where the number of customers has reached a state of
saturation.
116 KOREA ENERGY ECONOMICS INSTITUTE
KEEI Korea Energy Demand Outlook
Category 2008 2009 20102011
Base forecast MaximumForecast No. 1
MaximumForecast No. 2
Peak demand (MW) 62,794 63,212 69,886 73,601 73,886 74,846- Increase rate (%) 0.8 0.7 10.6 5.3 5.7 7.1
Total capacity (MW) 70,353 73,373 74,407 79,070 79,070 79,070- Installed reserve margin (%) 12.0 16.1 6.5 7.4 7.0 5.6
<TableⅢ-13> Outlook on electricity supply/demand in the summer of 2011
Outlook on LNG and town gas demand7
수요전망 내지13-1 문 2011.5.20 3:26 PM 페이지116 매일3 MAC2PDF_IN 300DPI 125LPI T

Notes: 1. Values in parentheses refer to the year-on-year growth rate (%); p refers to tentative figures; e refers to forecasts.The figures for power generation include the estimated directly-adopted volume of POSCO and K-POWER
2. LNG for power generation includes LNG input for district heating3. LNG refers to the total amount of primary energy that includes gas production loss and internal consumption
In 2011, LNG demand for power generation is expected to reach 16,624,000 tons, a
year-on-year rise of 17.5%, following high growth in the previous year. LNG demand
for power generation will likely lead a rise in overall LNG demand.
- The capacity of base-load power facilities was somewhat expanded with the
operation of Singori Nuclear Power Plant Unit 1 (capacity of 1,000MW), which
launched commercial operation at the end of February, but LNG demand for power
generation will continue to indicate strong growth in 2011 in consideration of
forecasts on electricity demand based on economic growth.
B. Outlook on town gas demand
In 2011, town gas consumption is expected to record a year-on-year rise of 5.5% to
reach 21,908 million m3, gaining strength from a sound increase in demand for
industrial use.
Town gas demand for residential and commercial use, which has reached saturation9)
in terms of the number of customers, mainly in large cities, is expected to record a
ChapterⅢ Energy Demand Outlook for 2011
117http://www.keei.re.kr
(Unit: 1,000 tons)
Category2010p 2011e
1/4 2/4 3/4 4/4 Annual 1/4 2/4 3/4 4/4 Annual
Town gas6,659 3,303 2,369 5,280 17,611 7,003 3,479 2,601 5,422 18,505(15.1) (22.7) (7.6) (6.6) (12.6) (5.2) (5.3) (9.8) (2.7) (5.1)
Power 3,918 3,123 3,071 4,038 14,150 4,403 3,541 3,733 4,947 16,624generation (45.3) (67.2) (32.9) (20.4) (38.3) (12.4) (13.4) (21.6) (22.5) (17.5)
LNG 10,674 6,467 5,475 9,355 31,971 11,485 7,070 6,378 10,442 35,375(25.0) (39.8) (20.2) (11.8) (22.6) (7.6) (9.3) (16.5) (11.6) (10.6)
<TableⅢ-14> Outlook on LNG demand
수요전망 내지13-1 문 2011.5.20 3:26 PM 페이지117 매일3 MAC2PDF_IN 300DPI 125LPI T
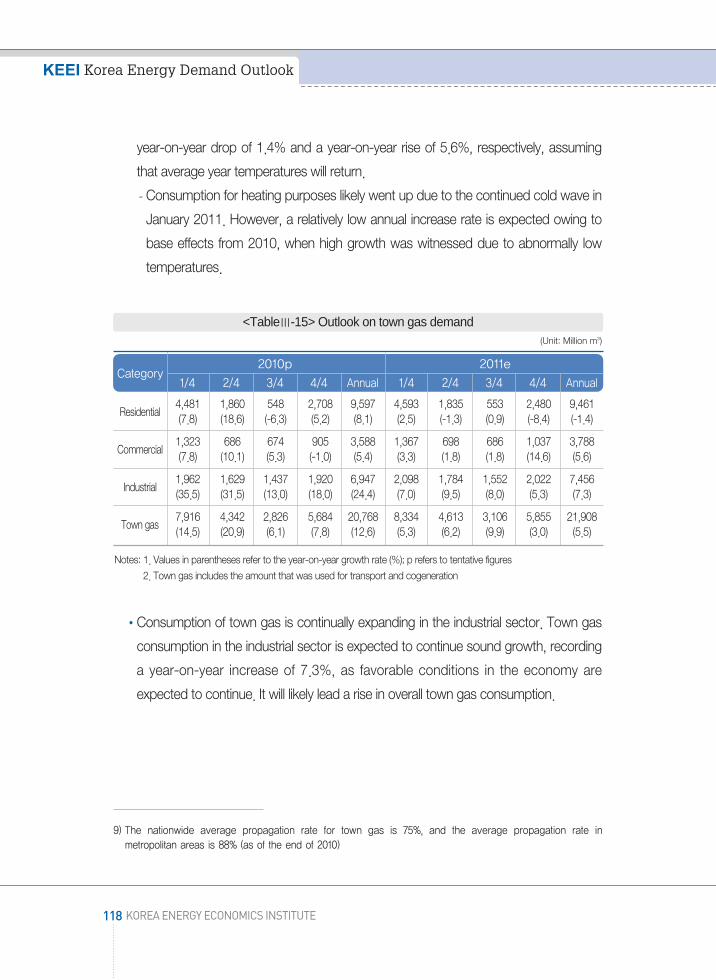
year-on-year drop of 1.4% and a year-on-year rise of 5.6%, respectively, assuming
that average year temperatures will return.
- Consumption for heating purposes likely went up due to the continued cold wave in
January 2011. However, a relatively low annual increase rate is expected owing to
base effects from 2010, when high growth was witnessed due to abnormally low
temperatures.
Notes: 1. Values in parentheses refer to the year-on-year growth rate (%); p refers to tentative figures2. Town gas includes the amount that was used for transport and cogeneration
Consumption of town gas is continually expanding in the industrial sector. Town gas
consumption in the industrial sector is expected to continue sound growth, recording
a year-on-year increase of 7.3%, as favorable conditions in the economy are
expected to continue. It will likely lead a rise in overall town gas consumption.
118 KOREA ENERGY ECONOMICS INSTITUTE
KEEI Korea Energy Demand Outlook
9) The nationwide average propagation rate for town gas is 75%, and the average propagation rate inmetropolitan areas is 88% (as of the end of 2010)
(Unit: Million m3)
Category2010p 2011e
1/4 2/4 3/4 4/4 Annual 1/4 2/4 3/4 4/4 Annual
Residential4,481 1,860 548 2,708 9,597 4,593 1,835 553 2,480 9,461(7.8) (18.6) (-6.3) (5.2) (8.1) (2.5) (-1.3) (0.9) (-8.4) (-1.4)
Commercial1,323 686 674 905 3,588 1,367 698 686 1,037 3,788(7.8) (10.1) (5.3) (-1.0) (5.4) (3.3) (1.8) (1.8) (14.6) (5.6)
Industrial1,962 1,629 1,437 1,920 6,947 2,098 1,784 1,552 2,022 7,456(35.5) (31.5) (13.0) (18.0) (24.4) (7.0) (9.5) (8.0) (5.3) (7.3)
Town gas7,916 4,342 2,826 5,684 20,768 8,334 4,613 3,106 5,855 21,908(14.5) (20.9) (6.1) (7.8) (12.6) (5.3) (6.2) (9.9) (3.0) (5.5)
<TableⅢ-15> Outlook on town gas demand
수요전망 내지13-1 문 2011.5.20 3:26 PM 페이지118 매일3 MAC2PDF_IN 300DPI 125LPI T

A. Outlook on coal demand
In 2011, coal demand is expected to indicate steady growth of 2.2% as a result of
base effects from the high increase in consumption witnessed in the previous year.
In 2011, coal consumption is expected to indicate steady growth as a result of an
expansion in new facilities in the steel industry, despite continuous reduction in
demand in the cement industry and stagnant consumption for power generation, a
result of zero expansion of power generation facilities.
ChapterⅢ Energy Demand Outlook for 2011
119http://www.keei.re.kr
[DiagramⅢ-12] Town gas trends and outlook by use
Outlook on coal and other energy demand8
수요전망 내지13-1 문 2011.5.20 3:26 PM 페이지119 매일3 MAC2PDF_IN 300DPI 125LPI T

- The level of increase of bituminous coal consumption for steel making began to
show indications of slowdown in the second half of 2010. It is expected that
structural steel production will record a year-on-year rise of 7.8% in 2011.
Accordingly, bituminous coal consumption for steel making will likely continue
sound growth to record a year-on-year rise of 8.5%.
Notes: 1. Values in parentheses refer to the year-on-year growth rate (%); p refers to tentative figures; e refers to forecasts2. Source: POSCO Research Institute, POSRI Steel Supply/Demand Outlook (January 2011)
- Bituminous coal demand in the cement industry continues to go down. It is
expected to post a year-on-year decrease of 3.7% to stand at 3,909,000 tons.
Construction orders, which are an early indicator of cement demand, are extremely
sluggish. Completed construction is forecast to decrease in 2011, attributable to a
slump in the housing market and restructuring of construction companies.
- Since there are no new facility expansions, bituminous coal demand for power
generation will likely maintain the level witnessed in the previous year, when the
maximum rate of use was recorded, in 2011.
120 KOREA ENERGY ECONOMICS INSTITUTE
KEEI Korea Energy Demand Outlook
(Unit: 1,000 tons)
Category2010e 2011e
First half of theyear
Second half ofthe year Annual
First half of theyear
Second half ofthe year Annual
Structural steel32,483
(27.5)
32.386
(2.9)
64,869
(14.0)
35,050
(7.9)
34,861
(7.6)
69,911
(7.8)
<TableⅢ-16> Outlook on steel production
수요전망 내지13-1 문 2011.5.20 3:26 PM 페이지120 매일3 MAC2PDF_IN 300DPI 125LPI T

Notes: Values in parentheses refer to the year-on-year growth rate (%); p refers to tentative figures; e refers to forecasts
With regards to coal consumption trends and forecasts per use after 2001, coal
consumption in the power generation and industrial sectors, which accounts for most
of total coal consumption, is continually increasing.
- Coal demand for power generation indicated a year-on-year rise of 8.9% in 2010,
owing to the completion of Units 7 and 8 of the Hadong Thermal Power Plant in
2009. The current level of consumption is expected to continue until additional
facility expansions take place.
- Coal consumption for industrial use temporarily went down in 2009, a period of
ChapterⅢ Energy Demand Outlook for 2011
121http://www.keei.re.kr
(Unit: 1,000 tons)
Category2010e 2011e
1/4 2/4 3/4 4/4 Annual 1/4 2/4 3/4 4/4 Annual
Anthracite2,540 2,463 2,265 2,836 10,105 2,632 2,462 2,332 3,037 10,464(-1.3) (31.7) (-12.6) (3.4) (3.4) (3.6) (-0.1) (3.0) (7.1) (3.6)
Residential/ 563 236 219 842 1,860 603 220 215 871 1,909commercial (-8.9) (14.6) (-4.4) (-5.2) (-4.2) (7.1) (-6.8) (-1.8) (3.4) (2.6)
Industrial1,758 2,045 1,834 1,768 7,406 1,803 2,056 1,898 1,921 7,678(8.5) (51.7) (-8.7) (18.0) (14.4) (2.6) (0.5) (3.5) (8.6) (3.7)
Power 219 182 212 226 839 226 186 219 245 877generation (-34.4) (-42.4) (-39.9) (-36.7) (-38.3) (3.2) (2.2) (3.4) (8.5) (4.5)
Bituminous 28,118 25,256 27,870 28,159 109,413 28,661 25,917 28,188 28,962 111,728coal (25.6) (8.8) (4.8) (6.6) (11.0) (1.9) (2.6) (1.1) (2.9) (2.1)
Steel7,354 6,176 5,180 6,084 25,424 7,750 6,516 6,574 6,755 27,595(61.6) (29.1) (4.4) (4.3) (22.6) (5.4) (5.5) (13.1) (11.0) (8.5)
Cement928 1,139 932 1,051 4,059 923 1,107 929 950 3,909(12.1) (-15.9) (-16.0) (-10.3) (-9.1) (-0.5) (-3.6) (-0.3) (-9.6) (-3.7)
Other 665 592 559 661 2,478 681 621 582 750 2,634industries (9.0) (12.4) (1.3) (5.8) (7.1) (2.4) (4.9) (4.1) (13.4) (6.3)
Power 19,171 17,349 20,569 20,363 77,452 19,307 17,673 20,103 20,507 77,590generation (17.0) (4.9) (6.2) (8.4) (8.9) (0.7) (1.9) (-2.3) (0.7) (0.2)
Coal30,659 27,720 30,135 30,996 119,517 31,293 28,379 30,521 32,000 122,192(22.9) (10.6) (3.3) (6.3) (10.3) (2.1) (2.3) (1.3) (3.2) (2.2)
<TableⅢ-17> Outlook on coal demand
수요전망 내지13-1 문 2011.5.20 3:26 PM 페이지121 매일3 MAC2PDF_IN 300DPI 125LPI T

global economic downturn. However, it is on a continuous upward trend, mainly led
by coking coal demand in the steel industry.
B. Outlook on thermal energy, new & renewable energy, and other energy demand
In 2010, thermal energy demand posted a year-on-year rise of 10.8% due to
abnormally low temperatures. In 2011, thermal energy demand is expected to post
steady growth of 1.8%, owing to base effects from the high growth witnessed in the
previous year if average year temperatures are recovered.
Thermal energy demand is forecast to post steady growth for the time being since
the speed at which new district heating facilities are propagated is slowing down, a
result of the sluggish construction business.
122 KOREA ENERGY ECONOMICS INSTITUTE
KEEI Korea Energy Demand Outlook
[DiagramⅢ-13] Coal trends and forecasts
수요전망 내지13-1 문 2011.5.20 3:26 PM 페이지122 매일3 MAC2PDF_IN 300DPI 125LPI T

Notes: 1) Values in parentheses refer to the year-on-year growth rate (%); p refers to tentative figures; e refers to forecasts2) New & renewable energy/Other energy includes the amount consumed for transport
New & renewable energy and other energy demand is expected to record a year-on-
year rise of 10.0% in 2011 to reach 6,419,000 TOE, following a 19.9% increase in
2010.
ChapterⅢ Energy Demand Outlook for 2011
123http://www.keei.re.kr
(Unit: 1,000 TOE)
Quarter2010p 2011e
1/4 2/4 3/4 4/4 Annual 1/4 2/4 3/4 4/4 Annual
Thermal 805 254 93 566 1,718 821 256 99 572 1,748energy (12.3) (25.2) (4.0) (4.4) (10.8) (2.0) (0.7) (6.9) (1.0) (1.8)
1,376 1,429 1,363 1,667 5,835 1.529 1,598 1,439 1,853 6,419(19.2) (20.3) (20.2) (19.9) (19.9) (11.1) (11.8) (5.6) (11.1) (10.0)
<TableⅢ-18> Outlook on thermal energy, new & renewable energy, and other energy demand
[DiagramⅢ-14] Thermal energy trends and outlook
New &renewable
energy/Otherenergy
수요전망 내지13-1 문 2011.5.20 3:26 PM 페이지123 매일3 MAC2PDF_IN 300DPI 125LPI T

An increase in new & renewable energy consumption is expected to be prominent
mainly in the public sector, gaining strength from the government’s propagation
policies.
The industrial sector is forecast to actively move forward with increasing use of new &
renewable energy based on use of waste gas, in response to the Renewable
Portfolio Standard (RPS) planned for enforcement in 2012.
124 KOREA ENERGY ECONOMICS INSTITUTE
KEEI Korea Energy Demand Outlook
[DiagramⅢ-15] Trends and outlook on new & renewable energy and other energy
수요전망 내지13-1 문 2011.5.20 3:26 PM 페이지124 매일3 MAC2PDF_IN 300DPI 125LPI T

A. Key characteristics
Forecasts on energy intensity improvements in 2011
Energy intensity (TOE/million won) deteriorated in 2009 and 2010, but is expected to
slightly improve to 0.248 in 2011.
- The worsened energy intensity of 2009 resulted from a 1.1% rise in primary energy
consumption, triggered by favorable conditions in industrial activities of industries
that consume great amounts of energy, against the backdrop of a substantial
slowdown in the economic growth rate (0.2%) due to the financial crisis.
- The worsened energy intensity of 2010 resulted from a soar in energy demand for
heating and cooling purposes, a result of abnormal climate conditions (abnormally
low temperatures in the winter and high temperature and humidity levels in the
summer), an increase in the number of steel facilities (Hyundai Steel and Dongkuk
Steel), and an increase in industrial activities owing to the economic recovery.
The worsened energy intensity in 2009 and 2010 seems to be temporary, caused by
unusual factors, amid improvements in energy efficiency in the mid- to long-term.
Notes: p refers to tentative figures, e refers to forecasts
Continued rapid increase in electricity consumption
Electricity consumption went up 10.1% in 2010, indicating two-digit growth for the
ChapterⅢ Energy Demand Outlook for 2011
125http://www.keei.re.kr
Demand forecast characteristics and implications9
Category 2005 2006 2007 2008 2009 2010p 2011e
3.8 2.1 1.3 1.8 1.1 7.3 3.7
0.264 0.256 0.247 0.246 0.248 0.251 0.249
<TableⅢ-19> Outlook on energy intensity
Primary energy consumptionincrease rate (%)
Energy intensity(TOE/Million won)
수요전망 내지13-1 문 2011.5.20 3:26 PM 페이지125 매일3 MAC2PDF_IN 300DPI 125LPI T

first time after 2000 (11.8%). It is expected to post a 5.3% increase rate, which is
higher than the final energy demand increase rate (3.4%), in 2011 as well.
- Electricity consumption indicated annual average growth of 9.8% in the 1990s, and
continued an annual average increase of 6.1% in the 2000s, the highest growth
among key final energy sources.
Consumption of electricity, a high-quality energy source10), continues to mark relatively
high growth in the 2000s as well because of several factors.
- The fabricated metal industry (machinery and equipment, electricity and electronics,
semiconductor, automobile, etc.), an industry that consumes great amounts of
electricity, recorded the highest degree of growth among manufacturing industries.
* Average rate of increase in added value from 2000 through 2010: (Manufacturing)
2.8%, (Fabricated metal) 5.6%
- From 2009 to 2010, operation of new facilities that consume great amounts of
electricity was launched in the steel making industry (Hyundai Steel, POSCO,
Dongkuk Steel, etc.).
- Petroleum product prices continue to remain high due to high oil prices. Against
this backdrop, an electricity charge that fails to reflect production costs is
maintained. For this reason, electricity is quickly replacing oil and town gas, energy
sources for heating.
Electricity is expected to continue to perform leading roles in Korea’s energy
consumption activities due to several factors: increased added value of key
manufacturing industry products, which consume great amounts of electricity,
convenience in use, and changes in lifestyles resulting from a rise in income levels
and technological development.
126 KOREA ENERGY ECONOMICS INSTITUTE
KEEI Korea Energy Demand Outlook
10) 2.74 TOE of primary energy is needed to produce 1 TOE of electricity. In other words, there is energy lossof 63.6% in the power generation sector (as of 2010).
수요전망 내지13-1 문 2011.5.20 3:26 PM 페이지126 매일3 MAC2PDF_IN 300DPI 125LPI T

LNG demand soaring as a result of a rapid increase in electricity consumption
LNG consumption rose 22.6% (tentative) in 2010 owing to a rise in demand for
power generation. It is expected to mark high growth of 10.6% in 2011 as well.
* Rate of increase in consumption for power generation: (’09) -13.2% → (’10)
38.3% → (’11) 17.5%
* Rate of increase in consumption for town gas: (’09) 0.9% → (’10) 12.6% → (’11) 5.1%
- The increase in LNG demand for power generation, which is used to handle peak
load, is a result of a rise in electricity demand and restricted expansion of base
power generation facilities (nuclear energy, bituminous coal).
* Based-load power facility increase rate (as of the end of the year)11): (’09) 1.2% →
(’10) 2.5% → (’11) 2.4%
* Electricity demand increase rate: (’09) 2.4% → (’10) 10.1% → (’11) 5.3%
Continued expansion of transformation loss of primary energy
A rapid increase in electricity consumption expands the amount of transformation
loss of energy for power generation, triggering additional supply of primary energy.
- The level of contribution of electricity consumption towards the rise in primary energy
supply (demand) was 43.4% in 2010 and is expected to expand to 53.3% in 2011.
ChapterⅢ Energy Demand Outlook for 2011
127http://www.keei.re.kr
11) Construction of Hadong bituminous coal-based thermal power plant (500MW) in 2009, Singori Power PlantUnit 1 (1,000MW) in 2010, and Singori Power Plant Unit 2 (1,000MW) in 2011
[DiagramⅢ-16] Level of contribution of electricity to primary energy increase
수요전망 내지13-1 문 2011.5.20 3:26 PM 페이지127 매일3 MAC2PDF_IN 300DPI 125LPI T

The rate of energy transformation loss for electricity production stands at 64%
(tentatively for 2010). For this reason, if the electricity consumption increase rate is
higher than the average increase rate of final energy, primary energy supply rises
faster than final energy consumption.
- The amount of energy that is lost in the transformation sector for production of
secondary energy such as electricity is expected to record an annual average rise
of 6.0% from 55.0 million TOE in 2007 to 69.3 million TOE in 2011.
- The share of primary energy consumption that is taken up by the amount of energy
loss in the transformation sector is forecast to go up from 23.3% in 2007 to 25.6%
in 2011.
Notes: p refers to tentative figures, e refers to forecasts
128 KOREA ENERGY ECONOMICS INSTITUTE
KEEI Korea Energy Demand Outlook
Category Final energyincrease rate
Electricityconsumptionincrease rate
Energy loss (Million TOE)(primary energy - Final
energy)
Loss factor (%)(Amount of loss/primaryenergy consumption)
2007 4.5 5.7 55.0 23.3
2008 0.6 4.5 58.2 24.2
2009 -0.3 2.4 61.2 25.2
2010p 7.0 10.1 66.3 25.4
2011e 3.4 5.3 69.3 25.6
Annual average 2.6 5.5 6.0 -increase rate (%)
<TableⅢ-20> Outlook on energy transformation loss in transformation sector
수요전망 내지13-1 문 2011.5.20 3:26 PM 페이지128 매일3 MAC2PDF_IN 300DPI 125LPI T

Supplied reserve margin continues a downward trend due to a rapid increase in peak
demand.
peak demand indicated an annual average rise of 5.7% from 2000 through 2010,
while power generation capacity and supply capability recorded annual average
growth of merely 4.7% and 5.1%, respectively. The installed and supplied reserve
margins are continually dropping.
- The supplied reserve margin in 2010 was 6.2%, the lowest level in the 2000s.
* peak demand in 2010 was 71,308MW (December 15), and supply capability was
75,747MW.
ChapterⅢ Energy Demand Outlook for 2011
129http://www.keei.re.kr
[DiagramⅢ-17] Trends in electricity consumption increase and energy loss factor increase
수요전망 내지13-1 문 2011.5.20 3:26 PM 페이지129 매일3 MAC2PDF_IN 300DPI 125LPI T
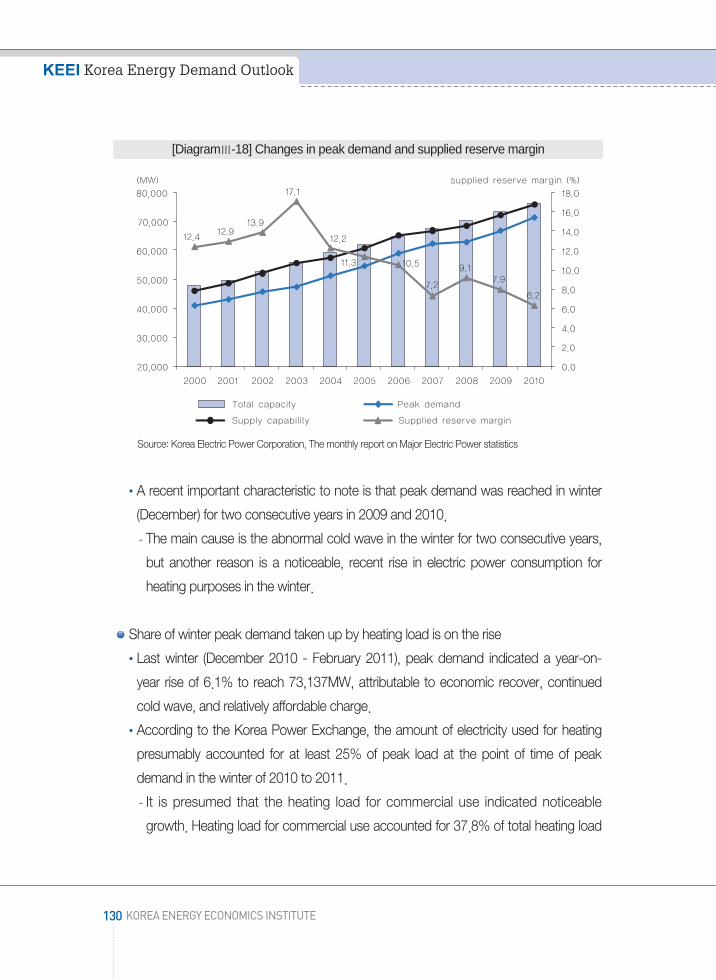
Source: Korea Electric Power Corporation, The monthly report on Major Electric Power statistics
A recent important characteristic to note is that peak demand was reached in winter
(December) for two consecutive years in 2009 and 2010.
- The main cause is the abnormal cold wave in the winter for two consecutive years,
but another reason is a noticeable, recent rise in electric power consumption for
heating purposes in the winter.
Share of winter peak demand taken up by heating load is on the rise
Last winter (December 2010 - February 2011), peak demand indicated a year-on-
year rise of 6.1% to reach 73,137MW, attributable to economic recover, continued
cold wave, and relatively affordable charge.
According to the Korea Power Exchange, the amount of electricity used for heating
presumably accounted for at least 25% of peak load at the point of time of peak
demand in the winter of 2010 to 2011.
- It is presumed that the heating load for commercial use indicated noticeable
growth. Heating load for commercial use accounted for 37.8% of total heating load
130 KOREA ENERGY ECONOMICS INSTITUTE
KEEI Korea Energy Demand Outlook
[DiagramⅢ-18] Changes in peak demand and supplied reserve margin
수요전망 내지13-1 문 2011.5.20 3:26 PM 페이지130 매일3 MAC2PDF_IN 300DPI 125LPI T

(18,576MW) on the day of peak demand in the winter of 2010 to 2011.
- The rise in heating load for the last few years mainly results from heating for
commercial purposes rather than industrial purposes.
Notes: Values in parentheses refer to the share of each useSource: Press release of the Korea Power Exchange (Results of analyzing peak demand in the winter of 2010 to 2011),
March 7, 2011
ChapterⅢ Energy Demand Outlook for 2011
131http://www.keei.re.kr
Category 2008~2009 2009~2010 2010~2011
peak demand (MW) 62,645 68,963 73,137
- Year-on-year increase (%) 2.8 10.1 6.1
Heating load (MW) 14,150 16,640 18,576
- Residential3,931 4,252 4,754(27.8%) (25.6%) (25.6%)
- Commercial4,468 6,178 7,021(31.6%) (37.1%) (37.8%)
- Industrial5,751 6,210 6,801(40.6%) (37.3%) (36.6%)
<TableⅢ-21> Trends in winter peak demand and heating load
[DiagramⅢ-19] Changes in share of winter peak demand taken up by heating load
수요전망 내지13-1 문 2011.5.20 3:26 PM 페이지131 매일3 MAC2PDF_IN 300DPI 125LPI T

It is forecast that oil dependence regarding primary energy consumption will decrease
to between 30 and 40%.
The share of oil reached its peak at 63% in 1994 and continued to decrease
afterwards. It stood at 39.9% in 2010 and is expected to further drop to 38.9% in
2011.
- The primary energy share taken up by naphtha, which is mainly used for industrial
raw materials, reached 16.3% in 2010, higher than LNG (15.9%) and nuclear
energy (12.9%).
- The primary energy share of naphtha continued to fluctuate according to
fluctuations in the petrochemical industry. It has been indicating a steady downward
trend since 2009 and is expected to record 16.1% in 2011.
- When excluding naphtha, the share of primary energy taken up by oil is expected to
be a mere 22.7% in 2011.
132 KOREA ENERGY ECONOMICS INSTITUTE
KEEI Korea Energy Demand Outlook
[DiagramⅢ-20] Trends in oil dependence and forecasts
수요전망 내지13-1 문 2011.5.20 3:26 PM 페이지132 매일3 MAC2PDF_IN 300DPI 125LPI T

B. Policy implications
Installed reserve margin is expected to be 7.4% in the summer of 2011.
Peak demand in the summer of 2011 is expected to be 73,601MW (expected to be
in August), a 5.3% rise from the 69,886MW recorded in 2010 (in August).
* The monthly electricity supply/demand information from January 1990 through
February 2011 was used.
- Maximum Forecast No. 1, which uses monthly average temperature information of
the last five years, estimates that summer peak demand will reach 73,886MW, a
year-on-year rise of 5.7%.
- Maximum Forecast No. 2, which assumes that summer climate conditions in 2011
will be the same as they were in 2010, estimates that summer peak demand will
reach 74,846MW, a year-on-year increase of 7.1%.
ChapterⅢ Energy Demand Outlook for 2011
133http://www.keei.re.kr
[DiagramⅢ-21] Comparison between economic growth rate and summer peak demand increase rate
수요전망 내지13-1 문 2011.5.20 3:26 PM 페이지133 매일3 MAC2PDF_IN 300DPI 125LPI T

If an assumption is made that average year climate conditions will be recovered in the
summer of 2011, installed reserve margin should have more room than the previous
year’s level (6.5%).
- Installed reserve margin in the event of peak demand in the summer of 2011 is
estimated at 7.4% in case of the base forecast, 7.0% in case of Maximum Forecast
No. 1, and 5.6% in case of Maximum Forecast No. 2.
- Because installed reserve margin(facility capacity - peak demand) is expected to be
5,469MW for the base forecast and 5,184MW for Maximum Forecast No. 1, stable
electricity supply/demand is expected.
* Calculation of the summer total capacity: Applied the monthly facility capacity
increase/decrease plan for 2011 of the 5th Electricity Supply/Demand Plan
(December 2010) to the capacity recorded at the end of 2010.
134 KOREA ENERGY ECONOMICS INSTITUTE
KEEI Korea Energy Demand Outlook
[DiagramⅢ-22] Trends in monthly peak demand and forecasts
수요전망 내지13-1 문 2011.5.20 3:26 PM 페이지134 매일3 MAC2PDF_IN 300DPI 125LPI T

Notes: 1) Installed reserve margin (%) = [(Total capacity - peak demand)/peak demand]×1002) Total capacity excludes small hydro power facilities and isolated facilities that are not connected to systems
There is a need to overhaul measures on stabilizing electricity supply/demand in
preparation for abnormal climate conditions in the summer.
- If the weather in the summer is similar to that witnessed in the summer of 2010,
there is a possibility of installed reserve margin going down from the previous year
(6.5%). In this case, installed reserve level is estimated at 4,200MW.
- There is a need to revisit relevant plans in preparation for a rise in peak demand in
the summer (expected to be August) as a result of abnormal climate conditions.
Examples are adjusting the regular repair period of base-load power facilities and
raising the output of power plants.
Measures for abnormal climate conditions in the winter of 2011 will become more
significant.
- During the last two years (2009-2010), peak load was reached for the first time in
winter12). Heating load is taking up a higher proportion of peak demand in the
winter.
- In this case, there will be a sharp rise in consumption of LNG for power generation,
which is used to handle peak load, as well as town gas for heating. For this reason,
there is a possibility that ensuring stability in the supply and demand for LNG in the
winter will become more important.
ChapterⅢ Energy Demand Outlook for 2011
135http://www.keei.re.kr
Category 2008 2009 20102011
Base forecast Maximum ForecastNo. 1
Maximum ForecastNo. 2
Peak demand (MW) 62,794 63,212 69,886 73,601 73,886 74,846- Increase rate (%) 0.8 0.7 10.6 5.3 5.7 7.1
Total capacity (MW) 70,353 73,373 74,407 79,070 79,070 79,070- installed reserve margin (%) 12.0 16.1 6.5 7.4 7.0 5.6
<TableⅢ-22> Forecasts on electricity supply/demand for the summer of 2011
12) In 2009 and 2010, peak demand occurred in the winter (December 18, 2009, December 15, 2010)
수요전망 내지13-1 문 2011.5.20 3:26 PM 페이지135 매일3 MAC2PDF_IN 300DPI 125LPI T

- Considering that the scope of energy consumption fluctuation caused by
temperature effects has recently been approximately ±1.3%, there is a possibility
of primary energy demand in 2011 reaching 274.3 million TOE, a 3.5 million TOE
increase from the forecasted 270.8 million TOE.
Notes: p refers to tentative figures
There is a need to strengthen electricity demand side management and enhance
efficiency in electricity use.
Consumption of electricity continues to increase rapidly due to its low charge;
diversification, increased size, and propagation of electrical equipments; a rise in the
number of facilities that consume a great amount of electricity; increased demand for
heating in the winter; and convenience in use.
- Even in 2008 and 2009, when the rate of increase in final energy consumption
remained low at 0.6% and -0.3%, respectively, electricity consumption recorded
comparatively high growth of 4.5% and 2.4%.
- A two-digit (10.1%) consumption increase rate was recorded in 2010, attributable
to the economic recovery and temperature effects. It is expected that sound
growth of 5.3% will be witnessed in 2011.
There is a need to promote the stable supply/demand of electricity by strengthening
demand side management in consideration of the continuous downward trend of the
136 KOREA ENERGY ECONOMICS INSTITUTE
KEEI Korea Energy Demand Outlook
Category 2003 2004 2005 2006 2007 2008 2009 2010p
215.1 220.2 228.6 233.4 236.5 240.8 243.3 261.2
-3.1 -3.1 3.1 -3.3 -3.7 -1.2 -1.7 3.2
-1.4 -1.4 1.3 -1.4 -1.6 -0.5 -0.7 1.2
<TableⅢ-23> Temperature effect on primary energy consumption increase
Temperatureeffect
Primary energy(Million TOE)
Amount ofincrease/decrease
(Million TOE)
Rate of increase/decrease (%)
수요전망 내지13-1 문 2011.5.20 3:26 PM 페이지136 매일3 MAC2PDF_IN 300DPI 125LPI T

supplied reserve margin at the point of time of peak demand.
- There are various constraints in building enough capacity to cover increasing
electricity demand. For this reason, there is a need for the government to place
more focus on electricity demand side management policies.
- There is a need to actively review the adoption of EERS (Energy Efficiency Resource
Standard) as soon as possible to strengthen electricity demand side management.
- There is also a need to encourage an appropriate level of use of cooling and
heating devices in large buildings (buildings used for industrial purposes, large
buildings used by the service industry and by the public sector, etc.), where there is
much potential to bring down electricity demand. There is also a need to improve
efficiency of lighting fixtures by promoting the ESCO (Energy Service Company)
program, and facilitate the adoption of electricity-saving building management
systems.
There is a need to adjust the electricity charge to a realistic level so as to reduce
excessive consumption (especially for heating purposes) of electricity in order to
boost efficiency in electricity consumption.
- Large shopping malls, financial institutes, and other organizations in the service
industry tend to provide excessive heating and cooling in Korea.
- To remove such practices that lead to the waste of resources, there is an urgent
need to strengthen the market functions of energy prices.
In 2011, the value of energy imports is expected to go up by 20.2%.
The value of imported energy (oil, natural gas, coal, uranium) reached 121.7 billion
dollars in 2010, a year-on-year rise of 33.4%.
- The amount of energy imports (oil, natural gas, coal) indicated a year-on-year
increase of merely 8.8%, but the value of imports rose substantially owing to a
surge in energy prices such as international oil prices.
The value of energy imports in 2011 is estimated at 146.2 billion dollars.
- The level of increase in energy demand (imports) is expected to slow down this
year, but the value of energy imports is expected to indicate a year-on-year rise of
ChapterⅢ Energy Demand Outlook for 2011
137http://www.keei.re.kr
수요전망 내지13-1 문 2011.5.20 3:26 PM 페이지137 매일3 MAC2PDF_IN 300DPI 125LPI T

20.2%, owing to forecasted increase in international energy prices.
* Oil: (’09) $66.6 billion → (’10) $90.9 billion → (’11) $111.2 billion
* Natural gas: (’09) $13.9 billion → (’10) $17 billion → (’11) $20 billion
* Bituminous coal: (’09) $9 billion → (’10) $11.4 billion → (’11) $13.4 billion
Notes: 1. The values in parentheses are the year-on-year growth rate (%), p refers to tentative figures, e refers to forecasts2. The import price of each energy source is based on the unit price of import
138 KOREA ENERGY ECONOMICS INSTITUTE
KEEI Korea Energy Demand Outlook
Category 2006 2007 2008 2009 2010p 2011e
233.4 236.5 240.8 243.3 261.2 270.8(2.1) (1.3) (1.8) (1.1) (7.3) (3.7)
238.7 246.8 255.5 257.1 279.6 285.2(4.5) (3.4) (3.5) (0.6) (8.8) (2.0)
856 950 1,415 912 1,217 1,462(28.3) (11.0) (49.0) (-35.6) (33.4) (20.2)
<TableⅢ-24> Energy consumption and import and outlook
Primary energyconsumption(Million TOE)
Amount of imports(Million TOE)
Value of imports (100 million dollars)
수요전망 내지13-1 문 2011.5.20 3:26 PM 페이지138 매일3 MAC2PDF_IN 300DPI 125LPI T

KKEEEEII Korea Energy Demand Outlook(Volume 13 No. 1)
Printed on April 18, 2011
Issued on April 20, 2011
CEO of publisher: Kim Jin-woo
Registration: No. 7 on December 7, 1992
Printed by: Beomshinsa (02)503-8737
ⓒ Korea Energy Economic Institute 2010
132 Naesonsunhwan-ro, Uiwang-si, Gyeonggi-do
Phone: (031)420-2114, Fax: (031)422-4958
Publisher: Korea Energy Economics Institute
수요전망 내지13-1 문 2011.5.20 3:26 PM 페이지139 매일3 MAC2PDF_IN 300DPI 125LPI T

수요전망 내지13-1 문 2011.5.20 3:26 PM 페이지140 매일3 MAC2PDF_IN 300DPI 125LPI T