kras+ and braf-/kras- but not colorectal cancer494476/uq494476_oa.pdf · 3 abstract ethanol in...
TRANSCRIPT

Lifetime alcohol intake is associated with an increased risk of
KRAS+ and BRAF-/KRAS- but not BRAF+ colorectal cancer
Running title: Alcohol intake and molecular subtypes of colorectal cancer
Harindra Jayasekara1,2, Robert J. MacInnis
1,2, Elizabeth J. Williamson
3,4, Allison M.
Hodge1, Mark Clendenning
5, Christophe Rosty
5,6,7, Rhiannon Walters
8, Robin
Room9,10,11
, Melissa C. Southey
12, Mark A. Jenkins
2, Roger L. Milne
1,2, John L.
Hopper1,2, Graham G. Giles
1,2, Daniel D. Buchanan
2,5 and Dallas R. English
1,2
1Cancer Epidemiology Centre, Cancer Council Victoria, 615 St Kilda Road, Melbourne,
Victoria 3004, Australia 2Centre for Epidemiology and Biostatistics, Melbourne School of Population and Global
Health, The University of Melbourne, 207 Bouverie Street, Melbourne, Victoria 3010,
Australia 3Farr Institute of Health Informatics Research, London, NW1 2DA, United Kingdom
4Department of Medical Statistics, London School of Hygiene & Tropical Medicine, London,
WC1E 7HT, United Kingdom 5Colorectal Oncogenomics Group, Genetic Epidemiology Laboratory, Department of
Pathology, The University of Melbourne, Parkville, Victoria, Australia 6Envoi Specialist Pathologists, Brisbane, Queensland, Australia
7School of Medicine, The University of Queensland, Brisbane, Queensland, Australia
8Cancer and Population Studies Group, Queensland Institute of Medical Research, Herston,
Queensland, Australia 9Centre for Alcohol Policy Research, La Trobe University, 215 Franklin Street, Melbourne,
Victoria 3000, Australia
10Centre for Health Equity, Melbourne School of Population and Global Health, The
University of Melbourne, 207 Bouverie Street, Carlton, Victoria 3010, Australia 11
Centre for Social Research on Alcohol and Drugs, Stockholm University, SE - 106 91,
Stockholm, Sweden 12
Genetic Epidemiology Laboratory, Department of Pathology, The University of Melbourne,
Melbourne, Australia.
Correspondence to: Harindra Jayasekara, Cancer Epidemiology Centre, Cancer Council
Victoria, 615 St Kilda Road, Melbourne, Victoria 3004, Australia; Phone: +61 4 33469782;
Fax: +61 3 93495815; E-mail: [email protected]
This article has been accepted for publication and undergone full peer review but has not beenthrough the copyediting, typesetting, pagination and proofreading process which may lead todifferences between this version and the Version of Record. Please cite this article as an‘Accepted Article’, doi: 10.1002/ijc.30568
This article is protected by copyright. All rights reserved.
2
Keywords: Alcohol intake; BRAF; colorectal cancer; KRAS
Abbreviations: CI, confidence interval; CIMP, CpG island methylator phenotype; HR,
hazard ratio; ICD-O-3, International Classification of Diseases for Oncology; MCCS,
Melbourne Collaborative Cohort Study; MSI, microsatellite instability; MSS, microsatellite
stable; VCR, Victorian Cancer Registry
Article category: Cancer Epidemiology
Abstract: 247 words Text: 3,316 words
Figures: 1 Tables: 3 References: 54
Novelty and Impact
Ethanol in alcoholic beverages has a causal association with colorectal cancer. Differences in
associations of alcohol intake with colorectal cancer subtypes defined by the presence of
somatic mutations in oncogenes BRAF and KRAS are not yet established. In the present study,
lifetime alcohol intake was associated with increased risks of KRAS+ and BRAF-/KRAS-
tumors (originating via specific molecular pathways including the traditional adenoma-
carcinoma pathway) but not with BRAF+ tumors, a hallmark of tumor development via the
‘serrated’ pathway.
Page 3 of 27
John Wiley & Sons, Inc.
International Journal of Cancer
This article is protected by copyright. All rights reserved.

3
Abstract
Ethanol in alcoholic beverages is a causative agent for colorectal cancer. Colorectal cancer is
a biologically heterogeneous disease, and molecular subtypes defined by the presence of
somatic mutations in BRAF and KRAS are known to exist. We examined associations
between lifetime alcohol intake and molecular and anatomic subtypes of colorectal cancer.
We calculated usual alcohol intake for 10-year periods from age 20 using recalled frequency
and quantity of beverage-specific consumption for 38,149 participants aged 40-69 years from
the Melbourne Collaborative Cohort Study. Cox regression was performed to derive hazard
ratios (HRs) and 95% confidence intervals (CIs) for the association between lifetime alcohol
intake and colorectal cancer risk. Heterogeneity in the HRs across subtypes of colorectal
cancer was assessed. A positive dose-dependent association between lifetime alcohol intake
and overall colorectal cancer risk (mean follow-up=14.6 years; n=596 colon and n=326 rectal
cancer) was observed (HR = 1.08, 95% CI: 1.04-1.12 per 10 g/day increment). The risk was
greater for rectal than colon cancer (phomogeneity=0.02). Alcohol intake was associated with
increased risks of KRAS+ (HR = 1.07, 95% CI: 1.00-1.15) and BRAF-/KRAS- (HR = 1.05,
95% CI: 1.00-1.11) but not BRAF+ tumors (HR = 0.89, 95% CI: 0.78-1.01; phomogeneity=0.01).
Alcohol intake is associated with an increased risk of KRAS+ and BRAF-/KRAS- tumors
originating via specific molecular pathways including the traditional adenoma-carcinoma
pathway but not with BRAF+ tumors originating via the serrated pathway. Therefore,
limiting alcohol intake from a young age might reduce colorectal cancer originating via the
traditional adenoma-carcinoma pathway.
Page 4 of 27
John Wiley & Sons, Inc.
International Journal of Cancer
This article is protected by copyright. All rights reserved.
4
Introduction
Ethanol in alcoholic beverages is a carcinogen1 that increases the risk of colorectal cancer.
2
Although colorectal cancer is generally referred to as a single, broad disease entity, it is a
heterogeneous group of diseases in terms of molecular pathology and prognosis.3, 4
A number
of molecularly defined subtypes of colorectal cancer have been described related to the
presence of key somatic events including microsatellite instability (MSI), the CpG island
methylator phenotype (CIMP), chromosomal instability, and somatic mutations in the
oncogenes BRAF, KRAS and PIK3CA.5 For instance, colorectal cancers with BRAF mutation
are considered a distinct group3, 6
while a combination of features sets KRAS-mutated
colorectal cancers apart from tumors harboring neither BRAF nor KRAS mutation.7
Smoking has been consistently shown to have differences in associations with the risk of
specific molecular subtypes of colorectal cancer.8-10
Findings for alcohol thus far have been
inconsistent: increased risks of MSI-low8 and MSI-high
11, 12 colorectal cancer as well as an
absence of a difference in association with MSI13, 14
or BRAF and CIMP15, 16
subtypes have
been reported; associations for KRAS or combined BRAF/KRAS subtypes are not available.
Similarly, uncertainty remains whether alcohol consumption poses a greater risk for rectal
cancer over colon cancer: mechanistically, this is plausible considering that the rectal mucosa
is exposed to a greater carcinogenic effect of acetaldehyde due to its higher concentration.17
In the present study, we examined the associations between lifetime alcohol intake and
colorectal cancer risk, overall and by subtypes defined by BRAF V600E and KRAS codons 12
and 13 somatic mutation status, and anatomic location (colon versus rectal), using data from
the Melbourne Collaborative Cohort Study (MCCS).
Page 5 of 27
John Wiley & Sons, Inc.
International Journal of Cancer
This article is protected by copyright. All rights reserved.

5
Materials and Methods
Study population
The MCCS is a prospective cohort study of 41,514 people (99.2% aged 40-69 years; 58.9%
women) recruited during 1990-94 from Melbourne.18
Participants were recruited through the
electoral rolls (registration to vote is compulsory for adults in Australia), advertisements and
community announcements in local media (such as television, radio, newspapers).
Participants attended clinics where demographic, anthropometric, lifestyle and dietary
information were collected and anthropometric measurements were performed. Participants
aged <40 (n=194) and 70+ years (n=131) at baseline, with a confirmed cancer diagnosis
before baseline (n=1,467), missing alcohol consumption data for any age period (n=22),
reporting implausibly high alcohol intake (n=616) or extreme values of total energy intake
(<1st percentile and >99
th percentile) (n=779), and missing data on any of the covariates
modelled (n=156) were excluded, leaving 38,149 (91.9% of all participants) eligible for this
analysis (Fig. 1). The study protocol was approved by the Cancer Council Victoria’s Human
Research Ethics Committee. Participants gave written informed consent to participate and for
investigators to obtain access to their medical records.
Baseline data collection
A structured interview schedule was used at baseline to obtain information on potential risk
factors including age, sex, country of birth, education, smoking habits, physical activity, and
previous medical conditions. A 121-item food frequency questionnaire was used to collect
dietary information.19
Waist circumference was measured using a standard protocol. Baseline
residential addresses were used to classify participants into quintiles of an area-based
measure of socioeconomic status.20
Page 6 of 27
John Wiley & Sons, Inc.
International Journal of Cancer
This article is protected by copyright. All rights reserved.
6
Assessment of alcohol consumption
Participants were asked at baseline if they had ever drunk at least 12 alcoholic drinks in a
year. Those who had (‘non-lifetime abstainers’) were then asked about their usual frequency
of consumption and usual quantity consumed per drinking occasion for beer, wine and spirits
separately during 10-year age periods commencing at age 20, up to the decade of their age at
baseline attendance. Usual intake within each age period in grams per day for each beverage
type was calculated by multiplying intake frequency by quantity and standard amount of
alcohol per container using Australian food composition tables.21
The alcohol intake for each
age period in grams per day was calculated as the sum of intake from the three beverage
types. The baseline (current) alcohol intake in grams per day was obtained from intake for the
age period encompassing baseline. Beverage-specific total intakes within age periods were
summed to obtain total lifetime intakes in grams. The average lifetime alcohol intake in
grams per day was derived by dividing the total lifetime intake by the total number of days
within the age intervals up to baseline attendance.
Cohort follow-up and ascertainment of cases and deaths
Cases and vital status were ascertained through the Victorian Cancer Registry (VCR), the
Victorian Registry of Births, Deaths and Marriages, the National Death Index and the
Australian Cancer Database. Incident cases were men and women with a first
histopathological diagnosis of adenocarcinoma of the colon or rectum during follow-up to 31
December 2008. Cancer incidence data was coded following the 3rd
Revision of the
International Classification of Diseases for Oncology (ICD-O-3): colon (C18.0, C18.2-18.9)
and rectum (C19.9, C20.9). Carcinomas of the appendix, and anus and anal canal including
overlapping lesions of rectum, anus and anal canal, were not included but censored at
diagnosis. In-situ lesions diagnosed during follow-up were ignored.
Page 7 of 27
John Wiley & Sons, Inc.
International Journal of Cancer
This article is protected by copyright. All rights reserved.

7
Tumor molecular characterization and subtype classification
Archival tumor tissue was sought for all tumors diagnosed in Victoria. Diagnosis was verified
and pathology was reviewed by a gastrointestinal histopathologist (CR). Tumor DNA was
tested for the V600E BRAF mutation, which accounts for approximately 90% of BRAF
mutations in colorectal cancer,22
using a fluorescent allele-specific PCR discrimination
method as previously described.23
Exon 1 of KRAS was analyzed by direct Sanger
sequencing.24
Three tumor molecular subtypes were defined as follows: BRAF+, KRAS+ and
BRAF-/KRAS- (BRAF+/KRAS+ does not occur frequently).
Statistical analysis
Follow-up began at baseline attendance and continued until diagnosis of first colorectal
cancer, censoring, death, date of leaving Victoria or 31 December 2008, whichever came
first. Cox regression25
with age as the time axis was performed to calculate HRs and 95% CIs
for colorectal cancer overall, by molecular subtypes and by anatomic site (colon versus
rectum), comparing lifetime alcohol intake with lifetime abstention. The following intake
categories were used: abstainers (reference category), >0-19 g/day, 20-29 g/day, 30-39 g/day
and ≥40 g/day. Wald tests from Cox regression models were used to assess linear trends for a
10 g/day increment in alcohol intake and for intake categories as a continuous measure. To
test for heterogeneity in the HRs across molecular and anatomic subtypes of colorectal
cancer, Cox regression models were fitted using a competing risks method.26
Dose-response
relationships between lifetime alcohol intake (as a continuous variable) and colorectal cancer
incidence were examined by comparing models that included alcohol as a linear term only
and as restricted cubic splines (four knots).27
We fitted interaction terms to test for
differences in associations by attained age (by splitting the data by median age at diagnosis).
Sub-group analyses by gender were performed.
Page 8 of 27
John Wiley & Sons, Inc.
International Journal of Cancer
This article is protected by copyright. All rights reserved.
8
A causal diagram (directed acyclic graph) and existing evidence were used to determine
confounding variables to be included in the multivariable-adjusted models. These were sex,
education (primary school, some high/technical school, completed high/technical school,
completed tertiary degree/diploma), socioeconomic status (quintiles ranging from most to
least disadvantaged), smoking (never, former, current), physical activity (none, low,
moderate, high), total red meat intake (quartiles), energy from food not including alcoholic
beverages (continuous), dietary fiber intake (continuous) and dietary folate intake
(continuous), and all models were stratified by country of birth (Australia/New Zealand,
United Kingdom, Italy, Greece). Because waist circumference might be a consequence rather
than a cause of alcohol consumption, we fitted models with (continuous) and without
adjustment for this variable. We considered the model without adjustment for waist
circumference to be the primary analysis.
In the subtype analysis, cases missing tumor molecular data were censored at diagnosis.
In a sensitivity analysis, all participants diagnosed with any cancer other than colorectal
cancer were censored at diagnosis. In addition, associations for baseline (‘current’) alcohol
intake were also assessed. Each model was examined for outliers and influential points.28
Nested models were compared using the likelihood ratio test.29
Tests based on Schoenfeld
residuals showed no evidence that proportional hazard assumptions were violated.30
All
statistical tests were two-sided, and P-values less than 0.05 were considered statistically
significant. All statistical analyses were performed using Stata 14.1 (StataCorp, College
Station, TX).
Page 9 of 27
John Wiley & Sons, Inc.
International Journal of Cancer
This article is protected by copyright. All rights reserved.

9
Results
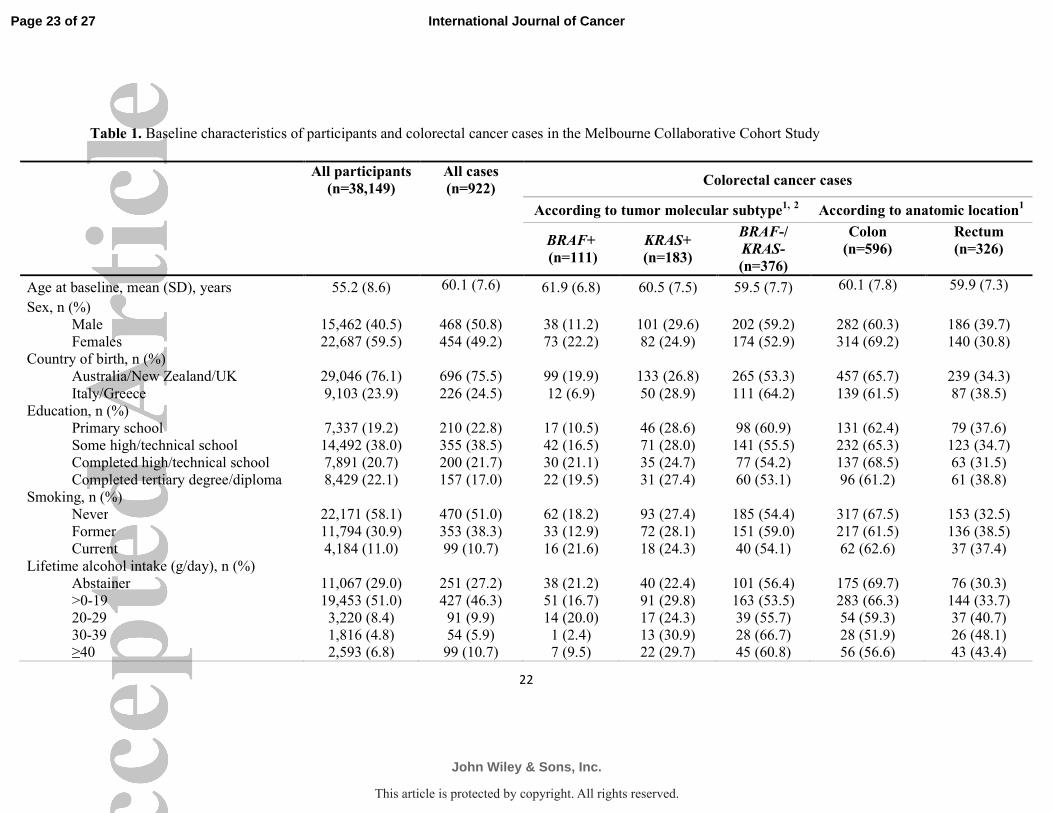
Characteristics of all 38,149 participants and cases by molecular and anatomic subtype are
given in Table 1. The study had more females (59.5%) than males, and the majority were
born in Australia, New Zealand or the UK (76.1%) (Table 1). More than half had never
smoked and only 11% were current smokers. Almost a third of the participants did not
consume alcohol and about half the participants consumed less than 20 g/day (Table1). Of
those who consumed alcohol, men reported median intakes of 17.6 g/day, 6.4 g/day and 4.5
g/day for total alcohol, beer and wine respectively (very few drank spirits), while women
reported a median alcohol intake of 6.3 g/day.
By the end of follow-up (average 14.6 years/person), 922 incident cases of colorectal
cancer were diagnosed (596, 64.6% colon; 326, 35.4% rectum), 1,428 participants had left
Victoria and 4,153 had died. Molecular pathology data were obtained for 670 (73%) of the
tumors; Figure 1 shows the reasons why data on BRAF/KRAS status were not obtained. The
participants missing BRAF/KRAS status were not different in terms of their baseline
characteristics from those with this information (Supplementary Table 1).
There were 111 colorectal cancers (16.6%) that had BRAF mutations, 183 (27.3%)
that had KRAS mutations and 376 (56.1%) that were BRAF-/KRAS-. Of all tumors with
molecular data, 423 (63.1%) were located in the colon, including 85.6% of the BRAF+
tumors, 63.4% of the KRAS+ tumors and 56.4% of the BRAF-/KRAS- tumors. Nearly two-
thirds of the patients with BRAF+ tumors were female while there were more males than
females that had the other two subtypes (Table 1). BRAF+ tumors were rare for participants
born in Italy or Greece (Table 1). Compared with patients whose tumors were KRAS+ or
BRAF-/KRAS-, a higher proportion of patients with BRAF+ tumors were lifetime abstainers
from alcohol and fewer consumed ≥30 g/day (Table 1).
Page 10 of 27
John Wiley & Sons, Inc.
International Journal of Cancer
This article is protected by copyright. All rights reserved.
10
Lifetime alcohol intake and colorectal cancer risk
These analyses included all 922 cases of colorectal cancer. Lifetime alcohol consumption was
associated with an increased incidence of colorectal cancer (HR = 1.08, 95% CI: 1.04-1.12
for a 10 g/day increment, p for trend=<0.001; HR = 1.50, 95% CI: 1.15-1.95 for a lifetime
intake of ≥40 g/day compared with lifetime abstention; p for trend=0.001) (Table 2). The
model with the cubic splines fitted no better than a model with a single linear term for
lifetime intake (p=0.5). This association was significant for males (HR = 1.06, 95% CI: 1.02-
1.11 for a 10 g/day increment, p for trend=0.003) and females (HR = 1.10, 95% CI: 1.00-1.21
for a 10 g/day increment, p for trend=0.05) (Table 2). For males, a HR of 1.08 (95% CI: 1.03-
1.14, p for trend=0.004) for colorectal cancer was observed for a 10 g/day increment in beer
intake while the evidence for an association for wine was weaker (HR = 1.07, 95% CI: 0.99-
1.17 for a 10 g/day increment, p for trend=0.09); too few women drank beer to undertake a
similar comparison. Associations did not change materially when waist circumference was
included in the models (Supplementary Table 2).
Associations with molecular subtypes of colorectal cancer
Lifetime alcohol intake was associated with increased incidence of KRAS+ and BRAF-
/KRAS- tumors (HR = 1.07, 95% CI: 1.00-1.15 and HR = 1.05, 95% CI: 1.00-1.11
respectively, for a 10 g/day increment) but not BRAF+ tumors (HR = 0.89, 95% CI: 0.78-1.01
for a 10 g/day increment) (phomogeneity=0.01) (Table 3). Using BRAF status alone, a higher
incidence of BRAF- (HR = 1.06, 95% CI: 1.01-1.11 for a 10 g/day increment) and a lower
incidence of BRAF+ tumors (HR = 0.89, 95% CI: 0.78-1.01 for a 10 g/day increment)
associated with lifetime alcohol intake was observed (phomogeneity=0.003) (Table 3). The
associations between lifetime alcohol intake and the two KRAS molecular subtypes did not
differ (phomogeneity=0.3) (Table 3).
Page 11 of 27
John Wiley & Sons, Inc.
International Journal of Cancer
This article is protected by copyright. All rights reserved.
11
Site-specific associations (colon versus rectum)
An increment in lifetime alcohol intake by 10 g/day was associated with a greater incidence
of rectal cancer (HR = 1.08, 95% CI: 1.03-1.14) but not colon cancer (HR = 1.00, 95% CI:
0.96-1.05) (phomogeneity=0.02) (Table 3). For males, this pattern was observed for beer (HR =
1.11, 95% CI: 1.03-1.20 for rectal cancer and HR = 1.06, 95% CI: 0.98-1.13 for colon cancer,
for a 10 g/day increment) and for wine (HR = 1.12, 95% CI: 0.99-1.27 for rectal cancer and
HR = 1.05, 95% CI: 0.94-1.16 for colon cancer, for a 10 g/day increment) although the HR
for rectal cancer for wine was not statistically significant (results not shown). However, there
was no persuasive evidence for a difference in incidence between colon and rectal cancer for
BRAF- tumors alone (phomogeneity=0.4) (Table 3). There was no evidence of interactions with
attained age for colon (p = 0.6) or rectal cancer (p = 0.09) when the data were split according
to median age at diagnosis (≤70 and >70 years).
Sensitivity analysis
HRs for overall colorectal cancer or molecular and anatomic subtypes did not change when
individuals diagnosed with any cancer (apart from colorectal cancer) were censored at
diagnosis (results not shown). In addition, current alcohol intake at baseline was also
associated with an increased incidence of colorectal cancer (HR = 1.05, 95% CI: 1.01-1.09
for a 10 g/day increment, p for trend=0.02) but a difference in association between BRAF+,
KRAS+ and BRAF-/KRAS- subtypes was not observed (phomogeneity=0.2).
Page 12 of 27
John Wiley & Sons, Inc.
International Journal of Cancer
This article is protected by copyright. All rights reserved.

12
Discussion
Our results confirm an association between lifetime alcohol intake and risk of colorectal
cancer. A greater risk was observed for rectal than for colon cancer in the present analysis.
Alcohol intake was positively related to risk of BRAF- tumors irrespective of their KRAS
status but not to risk of BRAF+ tumors. For BRAF- tumors, alcohol intake was positively
associated with both colon and rectal tumors, but the association was weaker and not
significant for colon cancer.
One of the main strengths of the present study is the availability of alcohol consumption
data from age 20 especially considering that carcinogenesis is a chronic process. Also,
abstainers for current intake might be contaminated by quitters. Other strengths include the
relatively large number of colorectal cancers for which tumor BRAF and KRAS status were
assessed according to standardized protocols, the prospective nature of the study, the near
complete follow-up of cases through the population cancer registry, the low rates of attrition,
and the availability of a range of demographic, clinical and lifestyle data. Nevertheless,
several limitations exist: measurement error due to respondents having to summarize their
frequency and quantity of alcoholic beverage intake for 10-year age intervals into single
‘usual’ values, potential for present intake to influence recall of past intake and under-
reporting of past intake, residual confounding by unmeasured factors, and the fact that
alcohol intake could have changed after the baseline assessment. We were unable to obtain
archival tissue from the primary lesion to establish BRAF/KRAS status for about one quarter
of the cases. However, this is unlikely to have biased the observed associations because the
proportions of cases with and without BRAF/KRAS status varied little by ethnicity or sex,
which were both strongly associated with molecular subtype.31
Also, the possible lower
Page 13 of 27
John Wiley & Sons, Inc.
International Journal of Cancer
This article is protected by copyright. All rights reserved.
13
sensitivity of the technique employed to detect KRAS mutation may have contributed to an
absence of a difference in association between KRAS+ and BRAF-/KRAS- tumors.
In a recent meta-analysis, we found a relative risk of 1.49 for colorectal cancer associated
with long term alcohol intake comparing the highest with the lowest intake category.2 The
excess risk associated with heavy drinking in the present study for all colorectal cancer is
similar. Biological mechanisms proposed for alcohol-associated colorectal carcinogenesis
include effects on carcinogen metabolism and hormone levels,32
direct cellular injury and
gene mutations in the large intestine caused by acetaldehyde,33
decreased glutathione levels
and the elimination of free radicals,34
increased cell proliferation in the rectal mucosa17
and
aldehyde dehydrogenase and alcohol dehydrogenase genetic status which is thought to
modify the association between alcohol and colorectal cancer.35
The plausible relationship
between alcohol intake and altered one-carbon metabolism that could result in aberrations in
DNA methylation with or without epigenetic modifications has been the focus of recent
investigations.36, 37
BRAF and KRAS are oncogenes that affect intracellular signaling pathways and are
associated with global molecular characteristics which cause alterations of gene function on a
genome-wide scale. For example, BRAF+ is associated with high degree of CIMP38-40
and
KRAS+ with CIMP-low.39, 41, 42
CIMP is characterized by a propensity for widespread CpG
island hypermethylation43
and is important for defining a specific etiologic pathway of
tumorigenesis among colorectal cancers under certain conditions.44
BRAF and KRAS, on the
other hand, are now part of routine clinical assessments for screening for Lynch syndrome
and for assessing response to anti-EGFR therapy, respectively, rather than assessment of
CIMP.45, 46
Colorectal cancers can be divided into two broad subgroups: CIMP-
high/BRAF+/KRAS- and CIMP-low or CIMP-/BRAF-/ KRAS+ or – tumors.3, 4
Substantial
evidence exists to suggest that CIMP-high (hence BRAF+) colorectal tumors arise through
Page 14 of 27
John Wiley & Sons, Inc.
International Journal of Cancer
This article is protected by copyright. All rights reserved.

14
the ‘serrated’ pathway rather than the ‘traditional’ adenoma-carcinoma pathway.44, 47-51
A
previous analysis using MCCS data had confirmed an association between BRAF+ and
CIMP+ tumors, and an underlying genetic basis for differential etiologies of colorectal
cancer.31
The association of lifetime alcohol intake with an increased risk of BRAF- tumors in
the present study suggests that the effects of alcohol on colorectal cancer development are
restricted to tumors that arise through the traditional adenoma-carcinoma pathway of
tumorigenesis. This pathway results in the development of tumors that are predominantly
microsatellite stable (MSS), CIMP- and frequently harbor KRAS mutations, although the
Lynch syndrome subtype of tumors demonstrating high levels of MSI are also thought to
develop via adenoma-carcinoma pathway.4 Our evidence does not suggest that the risk differs
for the adenoma-carcinoma pathway according to the presence or otherwise of a KRAS
mutation. In contrast, we observed no positive association between lifetime alcohol intake
and colorectal cancers that harbored the BRAF V600E somatic mutation, a hallmark of tumor
development through the ‘serrated’ pathway. Previously, the Nurses’ Health Study has
reported HRs of 1.36 (95% CI: 0.67-2.74) for BRAF- and 1.05 (95% CI: 0.71-1.56) for
BRAF+ colon cancer associated with an alcohol intake of ≥15 g/day for women.15
Similar
findings were reported for participants in the Iowa Women’s Health Study: HRs of 1.19 (95%
CI: 0.91-1.57) for BRAF- and 0.95 (95% CI: 0.61-1.46) for BRAF+ colorectal cancer
associated with an intake of >3.4 g/day.16
Neither study observed a dose-dependent
association between alcohol intake and overall colon15
or colorectal cancer risk.16
Further, a
recent case-control study reported odds ratios of 1.30 (95% CI: 0.91-1.85) for adenomas and
0.99 (95% CI: 0.68-1.47) for serrated polyps associated with an alcohol intake of ≥14
drinks/week.52
While published studies which predominantly used current intake have not established a
clear difference in risk for the associations of colon and rectal cancer with alcohol,53
the
Page 15 of 27
John Wiley & Sons, Inc.
International Journal of Cancer
This article is protected by copyright. All rights reserved.

15
European Prospective Investigation into Cancer and Nutrition reported HRs of 1.12 (95% CI:
1.06-1.18) for rectal and 1.05 (95% CI: 1.00-1.11) for colon cancer for a 15 g/day increment
in lifetime alcohol intake but did not report a formal test result comparing HRs.54
We have
shown a greater risk of rectal than colon cancer associated with alcohol in line with the
explanation for greater exposure of distal colorectal mucosa to the carcinogenic effects of
acetaldehyde than the proximal part.17
We are unable to confirm whether there is a definitive
site-specific difference in risks and found little evidence suggestive of a site-specific
difference in risks for BRAF- tumors. Further epidemiologic evidence is needed to confirm a
gradient of increasing associations from proximal to the distal colorectum for alcohol intake
along with further mechanistic explanations for this putative relationship.
In summary, we have confirmed that the association between alcohol intake and the risk
of colorectal cancer might be limited to specific molecular pathways including the
‘traditional’ adenoma-carcinoma pathway, the etiologic pathway for the majority of
colorectal cancer.44
Therefore, limiting alcohol intake from a young age might help prevent
occurrence of a sizeable proportion of colorectal cancer.
Page 16 of 27
John Wiley & Sons, Inc.
International Journal of Cancer
This article is protected by copyright. All rights reserved.

16
Acknowledgements
We thank the original investigators and the diligent team, who recruited the participants and
who continue working on follow-up, for their contribution. We also express our gratitude to
the many thousands of Melbourne residents who continue to participate in the study.
Financial support
MCCS cohort recruitment was funded by VicHealth and Cancer Council Victoria. The
MCCS was further supported by Australian National Health and Medical Research Council
grants 209057, 251553 and 504711 and by infrastructure provided by Cancer Council
Victoria. MAJ is an NHMRC Senior Research Fellow. JLH is a NHMRC Senior Principal
Research Fellow. DDB is a University of Melbourne Research at Melbourne Accelerator
Program (R@MAP) Senior Research Fellow. RR’s position was funded by the Victorian
Department of Health and the Foundation for Alcohol Research and Education. The funding
sources played no role in the study design, in the collection, analysis and interpretation of
data, in the writing of the report, and in the decision to submit the article for publication.
Conflicts of interest
The authors declare that they have no conflicts of interest.
Page 17 of 27
John Wiley & Sons, Inc.
International Journal of Cancer
This article is protected by copyright. All rights reserved.

17
References
1. Baan R, Straif K, Grosse Y, Secretan B, El Ghissassi F, Bouvard V, Altieri A,
Cogliano V. Carcinogenicity of alcoholic beverages. Lancet Oncol 2007; 8: 292-3.
2. Jayasekara H, MacInnis RJ, Room R, English DR. Long-term alcohol consumption
and breast, upper aero-digestive tract and colorectal cancer risk: a systematic review and
meta-analysis. Alcohol Alcohol 2015; 51(3): 315-30.
3. Jass JR. Classification of colorectal cancer based on correlation of clinical,
morphological and molecular features. Histopathology 2007; 50(1): 113-30.
4. Phipps AI, Limburg PJ, Baron JA, Burnett-Hartman AN, Weisenberger DJ, Laird
PW, Sinicrope FA, Rosty C, Buchanan DD, Potter JD, Newcomb PA. Association between
molecular subtypes of colorectal cancer and patient survival. Gastroenterology 2015; 148:
77-87. e2.
5. Ogino S, Chan AT, Fuchs CS, Giovannucci E. Molecular pathological
epidemiology of colorectal neoplasia: an emerging transdisciplinary and interdisciplinary
field. Gut 2011; 60(3): 397-411.
6. Pai RK, Jayachandran P, Koong AC, Chang DT, Kwok S, Ma L, Arber DA, Balise
RR, Tubbs RR, Shadrach B, Pai RK. BRAF-mutated, microsatellite-stable adenocarcinoma of
the proximal colon. Am J Surg Pathol 2012; 36: 744-52.
7. Rosty C, Young JP, Walsh MD, Clendenning M, Walters RJ, Pearson S, Pavluk E,
Nagler B, Pakenas D, Jass JR, Jenkins MA, Win AK, et al. Colorectal carcinomas with KRAS
mutation are associated with distinctive morphological and molecular features. Mod Pathol
2013; 26: 825-34.
8. Poynter JN, Haile RW, Siegmund KD, Campbell PT, Figueiredo JC, Limburg P,
Young J, Le Marchand L, Potter JD, Cotterchio M, Casey G, Hopper JL, et al. Associations
between smoking, alcohol consumption, and colorectal cancer, overall and by tumor
microsatellite instability status. Cancer Epidemiol Biomarkers Prev 2009; 18(10): 2745-50.
9. Samowitz WS, Albertsen H, Sweeney C, Herrick J, Caan BJ, Anderson KE, Wolff
RK, Slattery ML. Association of smoking, CpG island methylator phenotype, and V600E
BRAF mutations in colon cancer. J Natl Cancer Inst 2006; 98(23): 1731-8.
10. Limsui D, Vierkant RA, Tillmans LS, Wang AH, Weisenberger DJ, Laird PW,
Lynch CF, Anderson KE, French AJ, Haile RW, Harnack LJ, Potter JD, et al. Cigarette
smoking and colorectal cancer risk by molecularly defined subtypes: J Natl Cancer Inst
2010; 102(14): 1012-22.
11. Slattery ML, Anderson K, Curtin K, Ma KN, Schaffer D, Samowitz W. Dietary
intake and microsatellite instability in colon tumors. Int J Cancer 2001; 93: 601-7.
12. Diergaarde B, Braam H, Muijen GNPv, Ligtenberg MJL, Kok FJ, Kampman E.
Dietary factors and microsatellite instability in sporadic colon carcinomas. Cancer Epidemiol
Biomarkers Prev 2003; 12: 1130-6.
13. Eaton AM, Sandler R, Carethers JM, Millikan RC, Galanko J, Keku TO. 5,10-
methylenetetrahydrofolate reductase 677 and 1298 polymorphisms, folate intake, and
microsatellite instability in colon cancer. Cancer Epidemiol Biomarkers Prev 2005; 14(8):
2023-9.
14. Satia JA, Keku T, Galanko JA, Martin C, Doctolero RT, Tajima A, Sandler RS,
Carethers JM. Diet, lifestyle, and genomic instability in the North Carolina Colon Cancer
Study. Cancer Epidemiol Biomarkers Prev 2005; 14(2): 429-36.
Page 18 of 27
John Wiley & Sons, Inc.
International Journal of Cancer
This article is protected by copyright. All rights reserved.

18
15. Schernhammer ES, Giovannucci E, Baba Y, Fuchs CS, Ogino S. B vitamins,
methionine and alcohol intake and risk of colon cancer in relation to BRAF mutation and
CpG island methylator phenotype (CIMP). Plos One 2011; 6(6): e21102.
16. Razzak AA, Oxentenko AS, Vierkant RA, Tillmans LS, Wang AH, Weisenberger
DJ, Laird PW, Lynch CF, Anderson KE, French AJ, Haile RW, Harnack LJ, et al. Alcohol
intake and colorectal cancer risk by molecularly defined subtypes in a prospective study of
older women. Cancer Prev Res 2011; 4(12): 2035-43.
17. Seitz HK, Simanowski UA. Alcohol and carcinogenesis. Annu Rev Nutr 1988; 8:
99-119.
18. Giles GG, English DR. The Melbourne Collaborative Cohort Study. In: IARC Sci
Publ 156:69-70. Lyon, France: IARC, 2002.
19. Ireland P, Jolley D, Giles G, O'Dea K, Powles J, Rutishauser I, Wahlqvist ML,
Williams J. Development of the Melbourne FFQ: a food frequency questionnaire for use in
an Australian prospective study involving an ethnically diverse cohort. Asia Pac J Clin Nutr
1994; 3: 19-31.
20. McLennan B. Socio-economic indexes for areas 96 [electronic resource].
Canberra: Australian Bureau of Statistics, 1998.
21. Lewis J, Milligan G, Hunt A. Nuttab95: nutrient data table for use in Australia.
Canberra: Australian Government Publishing Service, 1995.
22. Davies H, Bignell GR, Cox C, Stephens P, Edkins S, Clegg S, Teague J,
Woffendin H, Garnett MJ, Bottomley W, Davis N, Dicks E, et al. Mutations of the BRAF
gene in human cancer. Nature 2002; 417(6892): 949-54.
23. Buchanan DD, Sweet K, Drini M, Jenkins MA, Win AK, English DR, Walsh MD,
Clendenning M, McKeone DM, Walters RJ, Roberts A, Pearson S-A, et al. Risk factors for
colorectal cancer in patients with multiple serrated polyps: a cross-sectional case series from
genetics clinics. Plos One 2010; 5: e11636-e.
24. Rosty C, Buchanan DD, Walsh MD, Pearson S-A, Pavluk E, Walters RJ,
Clendenning M, Spring KJ, Jenkins MA, Win AK, Hopper JL, Sweet K, et al. Phenotype and
polyp landscape in serrated polyposis syndrome: a series of 100 patients from genetics
clinics. Am J Surg Pathol 2012; 36: 876-82.
25. Korn EL, Graubard BI, Midthune D. Time-to-event analysis of longitudinal
follow-up of a survey: Choice of the time-scale. Am J Epidemiol 1997; 145: 72-80.
26. Lunn M, McNeil D. Applying cox regression to competing risks: Biometrics
1995; 51(2): 524-32.
27. Harrell FE, Jr., Lee KL, Pollock BG. Regression models in clinical studies:
determining relationships between predictors and response. J Natl Cancer Inst 1988; 80:
1198-202.
28. Cleves MA, Gould WW, Gutierrez RG. An introduction to survival analysis using
Stata, rev. ed. College Station, Texas: Stata Press, 2004.
29. Kirkwood BR, Sterne JAC. Essential medical statistics, 2nd ed. Blackwell
Science, 2010.
30. Collett D. Modelling survival data in medical research, 2nd ed. Boca Raton, FL:
Chapman & Hall/CRC, 2003.
31. English DR, Young JP, Simpson JA, Jenkins MA, Southey MC, Walsh MD,
Buchanan DD, Barker MA, Haydon AM, Royce SG, Roberts A, Parry S, et al. Ethnicity and
risk for colorectal cancers showing somatic BRAF V600E mutation or CpG island methylator
phenotype. Cancer Epidemiol Biomarkers Prev 2008; 17: 1774-80.
Page 19 of 27
John Wiley & Sons, Inc.
International Journal of Cancer
This article is protected by copyright. All rights reserved.

19
32. Marshall JR, Freudenheim JO. Alcohol. In: Schottenfeld D, Fraumeni, JF. Cancer
Epidemiology and Prevention, 3rd
ed. Oxford University Press, 2006.
33. Seitz HK, Pöschl G, Simanowski UA. Alcohol and cancer. Recent Dev Alcohol
1998; 14: 67-95.
34. Lieber CS. Mechanisms of ethanol-drug-nutrition interactions. J Toxicol Clin
Toxicol 1994; 32(6): 631-81.
35. Ferrari P, McKay JD, Jenab M, Brennan P, Canzian F, Vogel U, Tjonneland A,
Overvad K, Tolstrup JS, Boutron-Ruault MC, Clavel-Chapelon F, Morois S, et al. Alcohol
dehydrogenase and aldehyde dehydrogenase gene polymorphisms, alcohol intake and the risk
of colorectal cancer in the European Prospective Investigation into Cancer and Nutrition
study. Eu J Clin Nutr 2012; 66: 1303-8.
36. Arasaradnam RP, Commane DM, Bradburn D, Mathers JC. A review of dietary
factors and its influence on DNA methylation in colorectal carcinogenesis. Epigenetics 2008;
3: 193-8.
37. Mathers JC, Strathdee G, Relton CL. Induction of epigenetic alterations by dietary
and other environmental factors. Adv Genet 2010; 71: 3-39.
38. Samowitz WS, Albertsen H, Herrick J, Levin TR, Sweeney C, Murtaugh MA,
Wolff RK, Slattery ML. Evaluation of a large, population-based sample supports a CpG
island methylator phenotype in colon cancer. Gastroenterology 2005; 129: 837-45.
39. Nosho K, Irahara N, Shima K, Kure S, Kirkner GJ, Schernhammer ES, Hazra A,
Hunter DJ, Quackenbush J, Spiegelman D, Giovannucci EL, Fuchs CS, et al. Comprehensive
biostatistical analysis of CpG island methylator phenotype in colorectal cancer using a large
population-based sample. Plos One 2008; 3: 1-12.
40. Sanchez JA, Krumroy L, Plummer S, Aung P, Merkulova A, Skacel M, DeJulius
KL, Manilich E, Church JM, Casey G, Kalady MF. Genetic and epigenetic classifications
define clinical phenotypes and determine patient outcomes in colorectal cancer. B J Surg
2009; 96: 1196-204.
41. Ogino S, Goel A. Molecular classification and correlates in colorectal cancer. J
Mol Diagn 2008; 10(1): 13-27.
42. Ogino S, Kawasaki T, Kirkner GJ, Suemoto Y, Meyerhardt JA, Fuchs CS.
Molecular correlates with MGMT promoter methylation and silencing support CpG island
methylator phenotype-low (CIMP-low) in colorectal cancer. Gut 2007; 56(11): 1564-71.
43. Toyota M, Ahuja N, Ohe-Toyota M, Herman JG, Baylin SB, Issa J-PJ. CpG island
methylator phenotype in colorectal cancer. Proc Natl Acad Sci U S A 1999; 96(15): 8681-6.
44. Jass JR. Serrated adenoma of the colorectum and the DNA-methylator phenotype.
Nat Clin Pract Oncol 2005; 2(8): 398-405.
45. Toon CW, Walsh MD, Chou A, Capper D, Clarkson A, Sioson L, Clarke S, Mead
S, Walters RJ, Clendenning M, Rosty C, Young JP, et al. BRAFV600E
immunohistochemistry facilitates universal screening of colorectal cancers for Lynch
syndrome. Am J Surg Pathol 2013; 37: 1592-602.
46. Lièvre A, Bachet J-B, Le Corre D, Boige V, Landi B, Emile J-F, Côté J-F,
Tomasic G, Penna C, Ducreux M, Rougier P, Penault-Llorca F, et al. KRAS mutation status is
predictive of response to cetuximab therapy in colorectal cancer. Cancer Res 2006; 66: 3992-
5.
47. O'Brien MJ. Hyperplastic and serrated polyps of the colorectum. Gastroenterol
Clin North Am 2007; 36(4): 947-68, viii.
48. O'Brien MJ, Yang S, Mack C, Xu H, Huang CS, Mulcahy E, Amorosino M,
Farraye FA. Comparison of microsatellite instability, CpG island methylation phenotype,
Page 20 of 27
John Wiley & Sons, Inc.
International Journal of Cancer
This article is protected by copyright. All rights reserved.

20
BRAF and KRAS status in serrated polyps and traditional adenomas indicates separate
pathways to distinct colorectal carcinoma end points. Am J Surg Pathol 2006; 30: 1491-501.
49. East JE, Saunders BP, Jass JR. Sporadic and syndromic hyperplastic polyps and
serrated adenomas of the colon: classification, molecular genetics, natural history, and
clinical management. Gastroenterol Clin North Am 2008; 37: 25-46.
50. Goldstein NS. Serrated pathway and APC (conventional)-type colorectal polyps:
molecular-morphologic correlations, genetic pathways, and implications for classification.
Am J Clin Pathol 2006; 125: 146-53.
51. Kambara T, Simms LA, Whitehall V, Spring KJ, Wynter C, Walsh MD, Barker
MA, Arnold S, McGivern A, Matsubara N, Tanaka N, Higuchi T, et al. BRAF mutation is
associated with DNA methylation in serrated polyps and cancers of the colorectum. Gut
2004; 53(8): 1137-44.
52. Burnett-Hartman AN, Passarelli MN, Adams SV, Upton MP, Zhu L-C, Potter JD,
Newcomb PA. Differences in epidemiologic risk factors for colorectal adenomas and serrated
polyps by lesion severity and anatomical site. Am J Epidemiol 2013;177: 625-37.
53. Moskal A, Norat T, Ferrari P, Riboli E. Alcohol intake and colorectal cancer risk:
A dose-response meta-analysis of published cohort studies. Int J Cancer 2007; 120: 664-71.
54. Ferrari P, Jenab M, Norat T, Moskal A, Slimani N, Olsen A, Tjonneland A,
Overvad K, Jensen MK, Boutron-Ruault MC, Clavel-Chapelon F, Morois S, et al. Lifetime
and baseline alcohol intake and risk of colon and rectal cancers in the European Prospective
Investigation into Cancer and Nutrition (EPIC). Int J Cancer 2007; 121: 2065-72.
Page 21 of 27
John Wiley & Sons, Inc.
International Journal of Cancer
This article is protected by copyright. All rights reserved.
21
Figure legend
Figure 1. Flow diagram showing selection of participants
Page 22 of 27
John Wiley & Sons, Inc.
International Journal of Cancer
This article is protected by copyright. All rights reserved.
22
Table 1. Baseline characteristics of participants and colorectal cancer cases in the Melbourne Collaborative Cohort Study
All participants
(n=38,149)
All cases
(n=922) Colorectal cancer cases
According to tumor molecular subtype1, 2 According to anatomic location
1
BRAF+
(n=111)
KRAS+
(n=183)
BRAF-/
KRAS-
(n=376)
Colon
(n=596)
Rectum
(n=326)
Age at baseline, mean (SD), years 55.2 (8.6) 60.1 (7.6) 61.9 (6.8) 60.5 (7.5) 59.5 (7.7) 60.1 (7.8) 59.9 (7.3)
Sex, n (%)
Male 15,462 (40.5) 468 (50.8) 38 (11.2) 101 (29.6) 202 (59.2) 282 (60.3) 186 (39.7)
Females 22,687 (59.5) 454 (49.2) 73 (22.2) 82 (24.9) 174 (52.9) 314 (69.2) 140 (30.8)
Country of birth, n (%)
Australia/New Zealand/UK 29,046 (76.1) 696 (75.5) 99 (19.9) 133 (26.8) 265 (53.3) 457 (65.7) 239 (34.3)
Italy/Greece 9,103 (23.9) 226 (24.5) 12 (6.9) 50 (28.9) 111 (64.2) 139 (61.5) 87 (38.5)
Education, n (%)
Primary school 7,337 (19.2) 210 (22.8) 17 (10.5) 46 (28.6) 98 (60.9) 131 (62.4) 79 (37.6)
Some high/technical school 14,492 (38.0) 355 (38.5) 42 (16.5) 71 (28.0) 141 (55.5) 232 (65.3) 123 (34.7)
Completed high/technical school 7,891 (20.7) 200 (21.7) 30 (21.1) 35 (24.7) 77 (54.2) 137 (68.5) 63 (31.5)
Completed tertiary degree/diploma 8,429 (22.1) 157 (17.0) 22 (19.5) 31 (27.4) 60 (53.1) 96 (61.2) 61 (38.8)
Smoking, n (%)
Never 22,171 (58.1) 470 (51.0) 62 (18.2) 93 (27.4) 185 (54.4) 317 (67.5) 153 (32.5)
Former 11,794 (30.9) 353 (38.3) 33 (12.9) 72 (28.1) 151 (59.0) 217 (61.5) 136 (38.5)
Current 4,184 (11.0) 99 (10.7) 16 (21.6) 18 (24.3) 40 (54.1) 62 (62.6) 37 (37.4)
Lifetime alcohol intake (g/day), n (%)
Abstainer 11,067 (29.0) 251 (27.2) 38 (21.2) 40 (22.4) 101 (56.4) 175 (69.7) 76 (30.3)
>0-19 19,453 (51.0) 427 (46.3) 51 (16.7) 91 (29.8) 163 (53.5) 283 (66.3) 144 (33.7)
20-29 3,220 (8.4) 91 (9.9) 14 (20.0) 17 (24.3) 39 (55.7) 54 (59.3) 37 (40.7)
30-39 1,816 (4.8) 54 (5.9) 1 (2.4) 13 (30.9) 28 (66.7) 28 (51.9) 26 (48.1)
≥40 2,593 (6.8) 99 (10.7) 7 (9.5) 22 (29.7) 45 (60.8) 56 (56.6) 43 (43.4)
Page 23 of 27
John Wiley & Sons, Inc.
International Journal of Cancer
This article is protected by copyright. All rights reserved.

23
1Row percentages given.
2For individuals with data on tumor molecular subtype.
SD, standard deviation.
Physical activity, n (%)
None 8,431 (22.1) 218 (23.6) 27 (16.2) 39 (23.3) 101 (60.5) 129 (59.2) 89 (40.8)
Low 7,721 (20.2) 175 (19.0) 20 (16.9) 37 (31.4) 61 (51.7) 111 (63.4) 64 (36.6)
Moderate 13,464 (35.3) 347 (37.7) 40 (15.9) 76 (30.3) 135 (53.8) 241 (69.5) 106 (30.5)
High 8,533 (22.4) 182 (19.7) 24 (17.9) 31 (23.1) 79 (59.0) 115 (63.2) 67 (36.8)
Energy intake from food, mean (SD), kJ/day 8,777 (3,041) 9,003 (3,125) 8,588 (2,869) 9,450 (3,293) 8,935 (3,046) 9,116 (3,184) 8,797 (3,008)
Waist circumference, mean (SD), cm 85.4 (12.9) 89.4 (13.1) 86.8 (12.8) 90.3 (11.8) 90.0 (13.1) 88.9 (13.6) 90.3 (12.0)
Tumor molecular subtype
BRAF+ - 111 (12.0) - - - 95 (85.6) 16 (14.4)
KRAS+ - 183 (19.9) - - - 116 (63.4) 67 (36.6)
BRAF-/KRAS- - 376 (40.8) - - - 212 (56.4) 164 (43.6)
Missing - 252 (27.3) - - - 173 (68.6) 79 (31.4)
Page 24 of 27
John Wiley & Sons, Inc.
International Journal of Cancer
This article is protected by copyright. All rights reserved.

24
Table 2. Hazard ratios (HR) and 95% confidence intervals (CI) for colorectal cancer according to lifetime alcohol intake for participants in the
Melbourne Collaborative Cohort Study
Cases (%) Person
years
Multivariable-adjusted1 p for trend
2
HR (95% CI)
All
For a 10 g/day increment in alcohol intake 922 (100) 558,871 1.08 (1.04-1.12) <0.001
Alcohol intake categories (g/day) 0.001
Lifetime abstainer 251 (27.2) 166,390 1
>0–19 427 (46.3) 283,526 1.03 (0.87-1.22)
20-29 91 (9.9) 46,384 1.24 (0.95-1.60)
30-39 54 (5.9) 26,167 1.24 (0.90-1.70)
≥40 99 (10.7) 36,404 1.50 (1.15-1.95)
Men
For a 10 g/day increment in alcohol intake 468 (100) 221,107 1.06 (1.02-1.11) 0.003
Alcohol intake categories (g/day) 0.02
Lifetime abstainer 67 (14.3) 32,048 1
>0–19 196 (41.9) 104,316 1.01 (0.76-1.34)
20-29 70 (15.0) 31,598 1.20 (0.85-1.69)
30-39 45 (9.6) 20,776 1.15 (0.78-1.69)
≥40 90 (19.2) 32,369 1.38 (0.99-1.92)
For a 10 g/day increment in beer intake 468 (100) 221,107 1.08 (1.03-1.14) 0.004
For a 10 g/day increment in wine intake 468 (100) 221,107 1.07 (0.99-1.17) 0.09
Women
For a 10 g/day increment in alcohol intake 454 (100) 337,764 1.10 (1.00-1.21) 0.05
Alcohol intake categories (g/day) 0.1
Page 25 of 27
John Wiley & Sons, Inc.
International Journal of Cancer
This article is protected by copyright. All rights reserved.

25
1Adjusted for sex (for men and women combined), education, socioeconomic status, smoking, physical activity, energy intake from food, dietary
fiber, dietary folate and total red meat, and stratified by country of birth. 2Wald test from Cox regression models assessing linear trends for a 10 g/day increment in alcohol intake and for intake categories as a
continuous measure.
Lifetime abstainer 184 (40.5) 134,342 1
>0–19 231 (50.9) 179,211 1.00 (0.81-1.23)
20-29 21 (4.6) 14,786 1.14 (0.72-1.83)
30-39 9 (2.0) 5,390 1.46 (0.74-2.90)
≥40 9 (2.0) 4,035 2.00 (1.01-3.96 )
For a 10 g/day increment in wine intake 454 (100) 337,750 1.12 (0.99-1.26) 0.07
Page 26 of 27
John Wiley & Sons, Inc.
International Journal of Cancer
This article is protected by copyright. All rights reserved.

26
Table 3. Hazard ratios (HR) and 95% confidence intervals (CI) for colorectal cancer for a 10 g/day increment in lifetime alcohol intake by tumor
molecular subtype and anatomic location for participants in the Melbourne Collaborative Cohort Study
1Adjusted for sex, education, socioeconomic status, smoking, physical activity, energy intake from food, dietary fiber, dietary folate and total red
meat, and stratified by country of birth. 2Test of homogeneity.
Cases (%) For a 10 g/day increment in alcohol intake
HR (95% CI)1 p value
2
Tumor molecular subtype
BRAF/KRAS subtype 670 (100.0) 0.01
BRAF+ 111 (16.6) 0.89 (0.78-1.01)
KRAS+ 183 (27.3) 1.07 (1.00-1.15)
BRAF-/KRAS- 376 (56.1) 1.05 (1.00-1.11)
BRAF subtype 676 (100.0) 0.003
BRAF+ 113 (16.7) 0.89 (0.78-1.01)
BRAF- 563 (83.3) 1.06 (1.01-1.11)
KRAS subtype 683 (100.0) 0.3
KRAS+ 189 (27.7) 1.07 (1.00-1.15)
KRAS- 494 (72.3) 1.03 (0.98-1.08)
Anatomic location 922 (100.0) 0.02
For all colorectal cancer
Colon 596 (64.6) 1.00 (0.96-1.05)
Rectum 326 (35.4) 1.08 (1.03-1.14)
For BRAF- colorectal cancer
Colon 330 (58.6) 1.03 (0.98-1.10) 0.4
Rectum 233 (41.4) 1.07 (1.00-1.14)
Page 27 of 27
John Wiley & Sons, Inc.
International Journal of Cancer
This article is protected by copyright. All rights reserved.
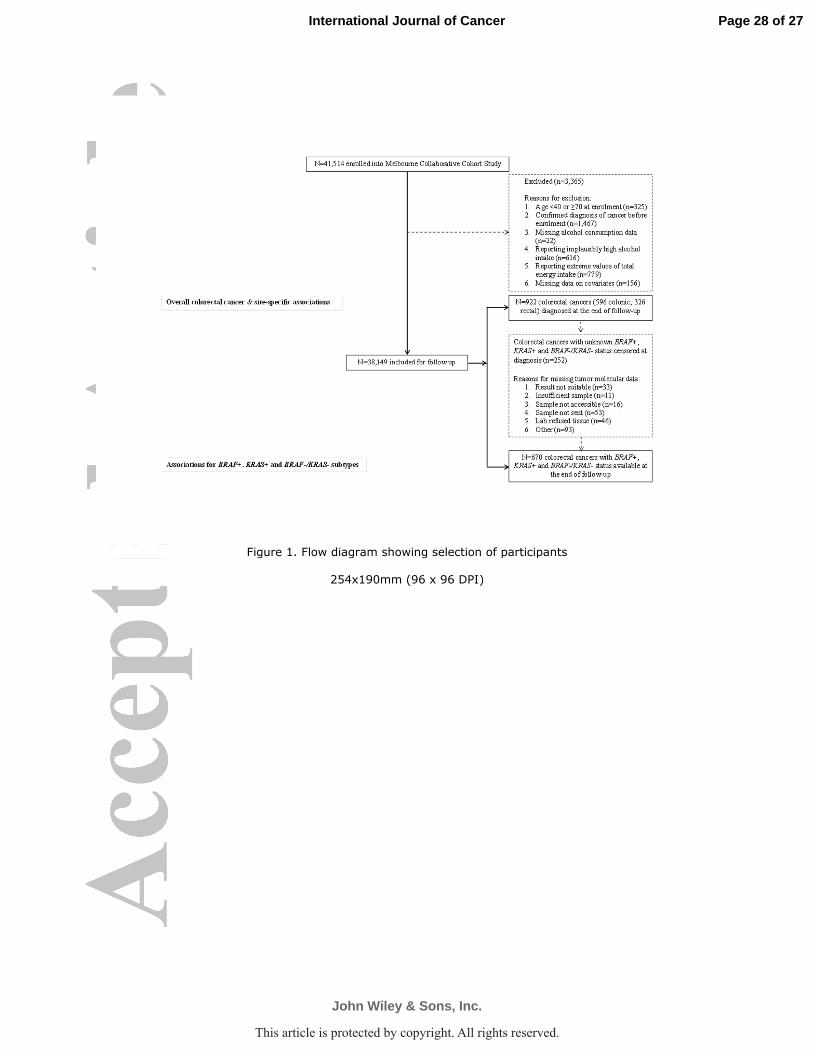
Figure 1. Flow diagram showing selection of participants
254x190mm (96 x 96 DPI)
Page 28 of 27
John Wiley & Sons, Inc.
International Journal of Cancer
This article is protected by copyright. All rights reserved.