l 71147a lead fss engineer
TRANSCRIPT

Rancho Seco
Final Status Survey Summary Report
June 10, 2008
AB -20' Corridor room 10 upper walls and ceiling
Survey Unit F8130102
Prepared By: Dan A. Tallman z-ý." Date: June 10, 2008
FSS Engineer
Reviewed By:IŽ•Ž L" ate: 71147a
Lead FSS Engineer
Approved By: Date: 7,••3Dismantlement Superintendent, Radiological

FINAL STATUS SURVEY SUMMARY REPORT
Survey Unit:F8130102, AB -20' Corridor room 10 upper walls and ceiling
Survey Unit Description:Operating History: The Auxiliary Building is a reinforced concrete structure thatcontained the RadWaste processing and supporting systems. The building contained sixmain elevations. Residual radioactive material was known to be present on all levels ofthe interior of the building. Operating records and the HSA document several eventswith the potential for a release of radioactivity inside this structure.
Site Characterization: Direct measurements were made of each of the interior elevationsurfaces as well as the exterior surfaces of the structure. These measurements confirmedthe presence of plant-derived radionuclides. Direct measurements on the -20' elevationshowed a mean gross activity level of 247,831 dpm/100 cm2 and a maximum value of10,080,000 dpm/100 cm 2, Based on the classification procedure (DSIP-0020) and levelsof gross activity reported, the upper walls and ceiling of room 10 in the interior of theauxiliary building was determined to be a Class 2 area.
HSA Events: HSA Report pg. 63.
Survey Unit Design Information:The Survey Unit Design Parameters are presented in Table 1 below.
The survey unit and measurement locations are depicted on the maps in Attachment 1.Direct measurement locations were determined using a random-start, fixed grid patternand 167 m2 were scanned for approximately 70% coverage. Samples of removablecontamination were collected at each direct measurement location. The instrumentationused for the survey along with the MDC values are listed in Tables 2-1 and 2-2 inAttachment 2.
Page 2 of 8 FSS Summary Report F8130102

Table 1. Survey Unit Design Parameters
Survey ,Design Value CommentParameter
Survey Area: F8 f3
Survey Unit:Class:
SU Area (m2):Evaluator:
DCGL (dpm/100 cm2):
Area Factor:Design DCGLemc
(dpm/100 cm 2):
LBGR (dpm/100 cm2):
Design Sigma (dpm/100 cm2):
Type I Error:Type II Error:
Predominant Nuclide:Sample Area (m2):
Scan Area (M2 ):
Scan Coverage (%):Zj." :ZI-0 :
Sign P:Calculated Relative Shift:
Relative Shift Used:
N-Value:Design N-Value + 20%:Design Min Samples N:
Grid Spacine L:
01022
239.4D.A.Tallman
43000N/AN/A
2150012035
0.050.05
Cs-13714
16770%
1.6451.645
0.9554351.71.7
1417173.7
AB -20' Corridor room 10upper walls and ceiling
Structure SurfaceLTP Table 5-4
Gross Activity DCGLClass 2Class 2
Default = 50% DCGL
Class 2
Class 2
Uses 3.0 if Relative Shift is>3
NUREG-1575 Table 5-5Class 2Class 2
Page 3 of 8 FSS Summary Report F8130102

Survey Results:A total of 17 direct measurements were made in F8130102. The results including mean,median, standard deviation and range are shown in Table 2. All direct measurementswere less than the DCGL. None of the scan measurements indicated areas of elevatedactivity. Scan activity ranged from 2067 to 31442 dpm/100 cm2 , based on a surveyorefficiency of 0.5 and no background subtracted. ISOCS scan activity on the ceiling allless than MDA for both Cs-137 and Co-60. Samples for removable surface activity wereall less than 10% of the DCGL as shown in Table 3. Removable surface activity sampleswere counted for alpha activity and none was detected at the MDC shown in Table 2-1 ofAttachment 2.
Table 2. Direct Measurement Results
Measurement ID Gross Activity(dpm/100 cm
F8130102-CO001BD 1696F8130102-CO002BD 1717F8130102-CO003BD 1644F8130102-CO004BD 1764F8130102-CO005BD 1810F8130102-CO006BD 2080F8130102-CO007BD 1421F8130102-CO008BD 1567F8130102-CO009BD 1748F8130102-CO01OBD 1426F8130102-CO011BD 1572F8130102-CO01 2BD 1758F8130102-CO013BD 1624F8130102-CO014BD 1411F8130102-CO015BD 1556F8130102-CO016BD 1655F8130102-CO017BD 1152
Mean: 1624Median: 1644
Standard Deviation: 205Rannge: 1152-2080
Page 4 of 8 FSS Summary Report F8130102

Table 3. Removable Surface Activity Results
Measurement ID Surface Beta Activity(dpm/1 0O, cm 2 )
F8130102CO010SMF8130102C0001SMF8130102C0002SMF8130102C0003SMF8130102CO004SMF8130102C0005SMF8130102C0006SMF8130102C0007SMF8130102CO008SMF8130102CO009SMF8130102C0010SMF8130102CO011SMF8130102C0012SMF8130102C0013SMF8130102CO014SMF8130102COOI5SMF8130102C0016SMF8130102C0017SM
Mean:Median:
Standard Deviation:Range:
1.64-2.244.22
-3.53-3.53-2.241.64
-2.24-2.242.93
-2.242.93
26.1727.46
0.34-2.249.380.343.140.349.22
-3.53 to 27.46
Page 5 of 8 FSS Summary Report F8130102

Survey Unit Data Assessment:The survey design required 17 direct measurements for the Sign Test. The critical valueand the results of the Sign Test are presented in Table 4. The sample mean and medianvalues were less than the DCGL. The sample standard deviation was less than the designstandard deviation so no additional samples were required.
Page 6 of 8 FSS Summary Report F8130102

Table 4. Data Assessment Results
Survey Results Parameter Value Comment
Material Background Used (dpmIO00 cm2): N/A
Ambient Background Used (dpm/100 cm2): N/A Average Ambient BKG = 0Actual Direct Measurements (N): .17
Median (dpm/100 cm2): 1644Mean (dpm/100 cm
2): 1624
Direct Measurement Standard Deviation 205(dpm/100 cm2):
Total Standard Deviation (dpm/100 cm 2): 205 Based on samples andbackgrounds.
Maximum (dpm/100 cm2): 2080
Material Type: N/A Background Subtract NotApplied
Sign Test Final N Value: 17S+ Value: 17
Critical Value: 12Sufficient Samples Collected: Yes
Maximum Value < DCGL: YesMedian Value < DCGL: Yes
Mean Value < DCGL: YesMaximum Value < DCGLemc: N/A Class 2
Total Standard Deviation <= Sigma: YesPass the Sign Test? Yes
Reject the Null Hypothesis? YesDoes the Survey Unit Pass All Criteria? Yes
Page 7 of 8 FSS Summary Report F8130102

Survey Unit Investigations and Results:No investigations were required for either direct or scan measurements and noinvestigation results are reported.
ALARA Statement:As stated in Chapter 4 of the LTP, as long as the residual activity within the survey unit isless than the DCGL (i.e. the survey unit average activity is less than the DCGL), theALARA criterion has been met.
Changes in Initial Survey Unit Assumptions:The survey unit was designed as a Class 2 structure survey and the sample results areconsistent with that classification. The variability of the survey results was less than thecharacterization data used for survey design.
Conclusion:The FSS of this survey unit was properly designed as a Class 2 survey based on Table 5-4of the LTP not withstanding the design sigma value usage described on page two. Therequired number of direct measurements was made and the scan coverage met therequirement of Table 5-6 of the LTP. No direct measurements exceeded the DCGL of43000 dpm!100 cm2 and none of the removable surface activity measurements exceeded10% of the DCGL. No investigations were required.
The direct measurement data support rejection of the null hypothesis, providing highconfidence that the survey unit satisfied the release criteria and that the data qualityobjectives were met.
It is concluded that survey unit F8130102 meets the release criteria of 1 OCFR20.1402.
Page 8 of 8 FSS Summary Report F8130102

Attachment I
Maps
June 10, 2008
Survey Unit F8130102

CrD
NHom Wanl Eam Wam
rF ' do oilStalm
Und&~do oilStaim-
SoothWafl Wea Wanl
ii Ii
{-10' Floow N
General Surface Area Estimates
- -I I
.1Ceiling-Walls-StairsFloor-
53.8 n 2
172.7 m2
12.9 m2
0.0 m2
Total - 239.4 m 2
ýrI00 Ref•l•d Cerg
Scale Feet
3" = 1'AUXILIARY BUILDING EL. -20 ROOM 10
AND STAIRWELL 56SURFACE AREA ESTIMATE
F8130102-MiScale Meters
0 1 2 3

C-
0
C/I
H • ',:',•:~..... ', '.• • "... .........
: - eIocoted12' IWest T ~j: .TT
+
.I __ ... q .... .1
.4-
... . . . . .... . ',. ... . ....... " H + .. . . . . . + H I l l . . - IH
! ! •-,-- I
I~~ w--:T""-IH H H ........ ...... . H H H ..... !i " .. .. I .i,! - ..... IH I I ....... H .H T : "_ T • X
rLy Z , ...
+' .- f.1+ . .. 11-. H I -H -H +Hi .. ...... .-- +111.+1-; ""-+1 !H ill.!!!. 11 -" -H-;"
.... if, 'IlilHHl fill -I- ýH H 1 .. H H H Hil lt_-' H l!H:H +:+
•:! {• !: • • '!•: !. !! :• !! •• ! ! :! ! ' • ': ::! ' :} , ' ' ; T -'::1" :
I 4 ___ ____E I___ 7- I___ .1 41 II .-- -I -1 3 - -- &- -4- j X -4--I X 41-4-4I T I
T T Xmw
.i _ 1 4-I 1 1 4- 1 I-
I I 11111 I~ 111111 liii IIII....... .._ ..... ........ .. . . .... .. . . .. . . .. . . . .. . .. . . .. . .
p RXl T 4- .. . 1 - . ..'L 1 ___ ___ ___ __ __I ___I 41 I X
00
uJ hzcarei....1111111 H 4 F H - IH+ I I II s FH-
1 i•2•
*mnSACRAMENTO MUNICIPALUTILITY DISTRICT
A
L
UXILIARY BUILDING EL. -20 ROOM 10AND STAIRWELL 56 BETA DIRECT/
00SE SURFACE RANDOM START POINTF81,301 02-M2
FILI 81300.02. SHT 1 OF 3 T C HILL
0 1 2 3 4 9 0 I B 9 0 II I? 3 IC 5 lB 41 102 3 4 5 a 1 8 9 10 11 U (3 14 1ý A6 $? 1

........................................
C0
GoJ
Noiih Wall East Wall
West Wall
Scale Feet
Scale Meters
0 1 2 3
O SMUDSACRAMENTO MUNICIPALUTILITY DISTRICT •
AUXILIARY BUILDING EL. -20 ROOM 10AND STAIRWELL 56 BETA DIRECT/
LOOSE SURFACE MEASUREMENT POINTSF81 30102-M2
FMF 9130002A SHT 2 OF 3 T C HILL

>. UP-3ýi--
cJQ
0
Troaw
Edge of Stairs
Scale Feet3.
Scale Meters
0 1 2 345Underside of Stairs
I.T100
w
Reflected Ceiring
Scale Feet8"= 1"-0"
Scale Meters
0 1 2 3
*SmunSACRAMENTO MUNICIPALUTILITY DISTRICT
AUXILIARY BUILDING EL. -20 ROOM 10AND STAIRWELL 56 BETA DIRECT/
LOOSE SURFACE MEASUREMENT POINTSF81 30102-M2
FIF n1300.02n RI-fr ~l CW ~ T C HILL-S 3OF3

(D
0r
ELEV.a,--20"W.a
East WallNorth Wall
20025
West Wall
F
0 Scale Feet
Scale Meters
0 1 2 3SACRAMENTO MUNICIPALUTILITY D ISTRICT
AUXILIARY BUILDING EL. -20 ROOM 10AND STAIRWELL 56 BETA SCAN
MEASUREMENT LOCATIONSF81 30102-M3
FLE 8130002. SHT 1 OF 3 T C HILL

0
I ----- ý p -t r") It/
Rise **~~~****~** 4... U U - C ...A.....LL L .JC..J~.
Stairs -20' to -10'Tread;
Edge of Stairs
Scale Feet
I2= 1--0-
Scale Meters
-0-12345
U i oUP-S-
Underside of Stairs
@ /" // / /)•l/'Down- "/ /x,'l ft
-10'. Floor
-10'~ Floor
D GE
Reflected CeirligI'100
w)Scale FeetI"= 1'-0"
Scale Meters
0 1 2 3
*SmuSACRAMENTO MUNICIPALUTILITY DISTRICT
AUXILIARY BUILDING EL; -20 ROOM 10AND STAIRWELL 56 BETA SCAN
MEASUREMENT LOCATIONSF81 301 02-M3
FILE 81300.0"2a SHT 2 OF 3. T C HILLFEE 81300.02e SHT2OF3. TCHILL

000
Scale Feet3,i- =
Scale Meters
0 1 2 345
~-do
00w4
( oN-
Scale FeetI" = 1,-0"
Scale Meters
0 1 2 3
* osiunSACRAMENTO MUNICIPALUTILITY DISTRICT
AUXILIARY BUILDING EL. -20 ROOM 10AND STAIRWELL 56 GAMMA SCAN
MEASUREMENT LOCATIONSF81 301 02-M3
FILE 81300.02e SHT 3 OF 3ý T C HILL

0D0o
North Wall East Wall
WestWay
0o
0w.
Scale Feet8" 1'-0
Scale Meters
1 2 3
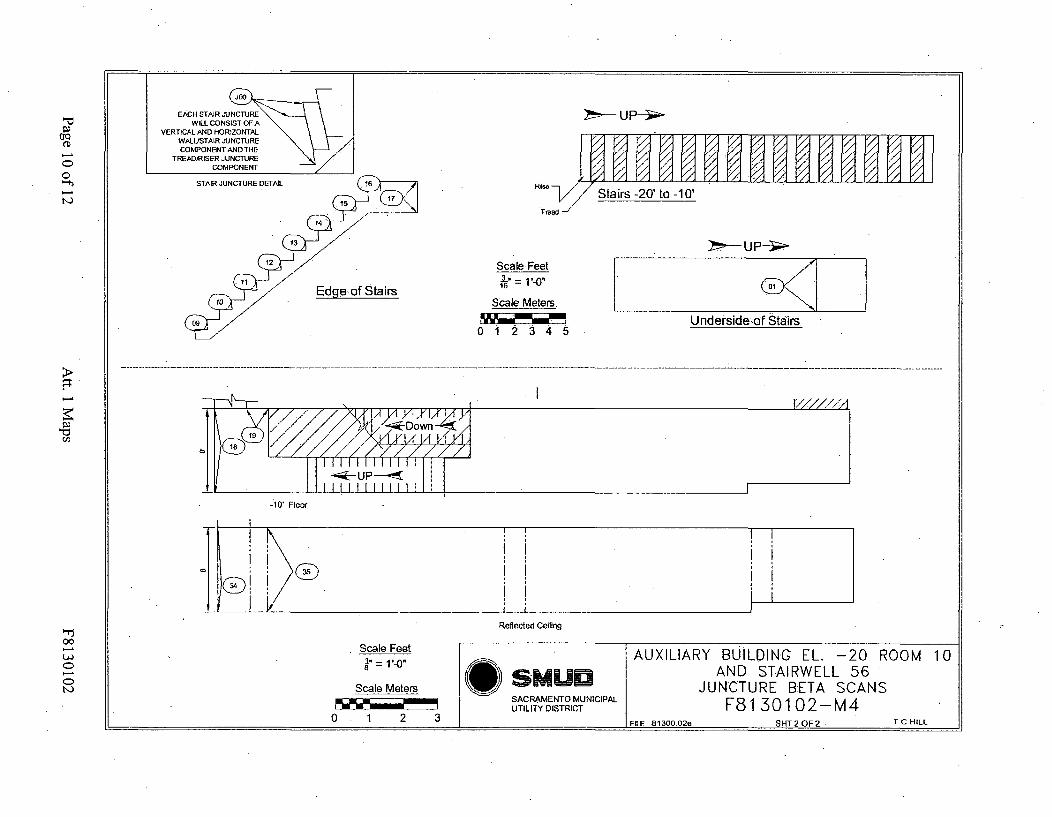
col)muSACRAMENTO MUNICIPALUTILITY DISTRICT
AUXILIARY BUILDING EL. -20 RAND STAIRWELL 56
JUNCTURE BETA SCANSF81 30102-M4
00M 10
T C HILLra • Rl•nn n• c<al- n 1, "lz 1OF2FILE 81300 02a
)h- UP-e-•
t'Q I Vý ýIA VA V11 VA im 11 VA VA VA VA N ri VABINH H HUNNINNRise -X
Tread
Stairs -20' to -10'
>-- up-3-Scale Feet3o1-6
"01 -Edge of Stairs
Scale Meters
0 1 2 345Underside~of Stairs
----------------------------
,:11!'c-/r I[A!IVi!1t Il/ I I-1/ Floor
-'10' Floor
-,- I .. .
I®
*1 I
T
Reflected Ceiling
0
wt'
Scale Feet81"= 1,-0" AUXILIAI
Scale Meters
0 1 2 3
*smunSACRAMENTO MUNICIPALUTILITY DISTRICT
RY BUILDING EL. -20 R(AND STAIRWELL 56
JUNCTURE BETA SCANSF81 30102-M4
00M 10

0
East W•ll
West Wall
eTI00
w
~~~*1Top
SI. esSide
Penctralln'0OrDetal
Scale Feet8I"= 1'-0"
Scale Meters
0 1 2 3
O*SMUDSACRAMENTO MUNICIPALUTILITY DISTRICT
AUXILIARY BUILDING EL.. -20 ROOM 10-AND STAIRWELL 56 PENETRATION
BETA SCAN MEASUREMENT LOCATIONSF8130102-M5
FILE 81300.028 SHT1 OF2 T C HILL

>-uP-F-.
V)
Cj2
Trewa -v
Scale Feet
1I, = 1'-0"
Scale Meters
012345
U r UP-o-
Underside of Stairs
Edge of Stairs
IR C__ __ __Reflected Ceiling
00
ujScale Feet81" = 1,-0"
Scale Meters
0 1 2 3
*SMUDSACRAMENTO MUNICIPALUTILITY DISTRICT
AUXILIARY BUILDING EL. -20 ROOM 10AND STAIRWELL 56
PENETRATION BETA SCANSF81 301 02-M51
T(C- HII I_______________________________________________ ______________________T C HILLu.U

Attachment 2
Instrumentation
June 10, 2008
Survey Unit F8130102

Table 2-1. Survey Unit Instrumentation
Instrument Detector MDC Static MDC ScanModel; Serial No. Model; Serial No. (dpmll00 cm 2 ) (dpm/100 cm 2 )
M2350; 193700 43-68B; 190294 433 1033
M2350; 203481 43-68B; 148629 433 1033
M2350; 193700 43-116-IB; 216072 491' 739'
Tennelec; 0401171 N/A 6 dpm a, 12 dpm3 N/A
A Juncture - concrete
Instrument Detector MDC ScanModel; Serial No. Model; Serial No. (dpm/100 cm 2 )
ISOCS 19839201 1160 - Cs137882 - Co60
3920_2mconcrete geometry 12 m2 FOV
Table 2-2. Investigation Criteria and DCGL
ValueParameter (dpm/100 cm 2)
Investigation Criteria - Direct 43000
Investigation Criteria - Scan 43000
DCGLW 43000
DCGLEMC N/A
Page 2 of 2 Ant. 2 Instrumentation F8130102

Attachment 3
Investigation
June 10, 2008
Survey Unit F8130102
. (none required)

Attachment 4
Data Assessment
June 10, 2008
Survey Unit F8130102

00
C#2
Il
•F8130102 Gross Activity Sample Results Quantile PlotDCGL = 43000 dpm/1 00cm2
2,500
2,000
4-
1,500
1,000
1644
ntll
500
0
0 20 40 60 80 104
Percentile-Direct Measurements (dpm/1l00cm2) - median - - -75th Percentile . - 50th Perce

0 F8130102 Gross Activity Sample Results Scatter PlotDCGL = 43000 dpm/100cm"
2500
E 2000•1500-
500
0
0
0. 0 0 0 0 0
0 0
0
2238
1 1024
- t-- - - a -- - -. a 1 1010
i i i i i i i i i i i i i i i i
M to Im 8m Ca in w w cc w to 8m MM L0o
Measurement Locations00
0
I0 o Gross Activity - Average - - "+3StDev" - - "-3SIDev

(D
CD
En
00
w
F81 30102 Gross Activity Frequency PlotDCGL = 43000 dprn/ 00cm2
L.LLCj-
8
7
6
5
4
3
1-
0 -
Bins - Upper End Value (dpm/1 00cm2)