l ife t ime f itness, i nc equity investment presentation 1 richie hartz ha da jang diana yang april...
TRANSCRIPT
LIFE TIME FITNESS, INCEquity Investment Presentation
1
Richie HartzHa Da Jang Diana Yang
April 30, 2013
Kaushik AndraHeziyou XuDiana YangIris Yijin Zhang

AGENDA
2
INTRODUCTIONINTRODUCTION COMPANYCOMPANY INDUSTRYINDUSTRY VALUATIONVALUATION
Introduction
Company Overview
Stock Performance
Industry Overview
Financial Analysis
Valuation
Recommendation
COMPANY PROFILE
• The Healthy Way of Life Company
• Designs, develops and operates sports and athletic,
professional fitness, family recreation and spa centers
• Helps clients achieve total health objective, athletic
aspirations by doing what they love
• Types of memberships: individual, couple, family
• First center opened in 1992
• Headquarters: Chanhassen, Minnesota
• Ticker: LTM
• Market Cap: $1.89 Billion
• Employees: 20,000
• Number of centers: 105 (as of Feb 28, 2013)
3
INTRODUCTIONINTRODUCTION COMPANYCOMPANY INDUSTRYINDUSTRY VALUATIONVALUATION
Source: LTM 2012 Annual Report Item 1 P1-2
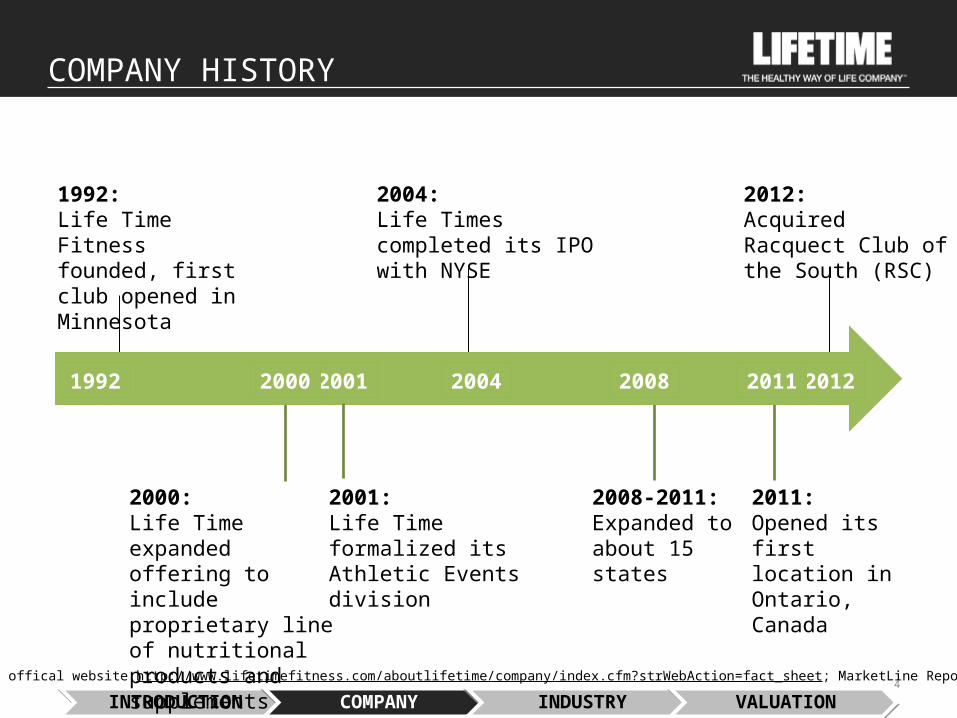
COMPANY HISTORY
4
INTRODUCTIONINTRODUCTION COMPANYCOMPANY INDUSTRYINDUSTRY VALUATIONVALUATION
1992: Life Time Fitness founded, first club opened in Minnesota
2001:Life Time formalized its Athletic Events division
2012: Acquired Racquect Club of the South (RSC)
2008-2011:Expanded to about 15 states
2000:Life Time expanded offering to include proprietary line of nutritional products and supplements
2004: Life Times completed its IPO with NYSE
1992 2001 2008 20122000 2004 2011
2011:Opened its first location in Ontario, Canada
Source: LTM offical website http://www.lifetimefitness.com/aboutlifetime/company/index.cfm?strWebAction=fact_sheet; MarketLine Report

5 AREAS OF PROGRAM SERVICES
5
Source: LTM offical website http://www.lifetimefitness.com/aboutlifetime/company/index.cfm?strWebAction=fact_sheet
INTRODUCTIONINTRODUCTION COMPANYCOMPANY INDUSTRYINDUSTRY VALUATIONVALUATION
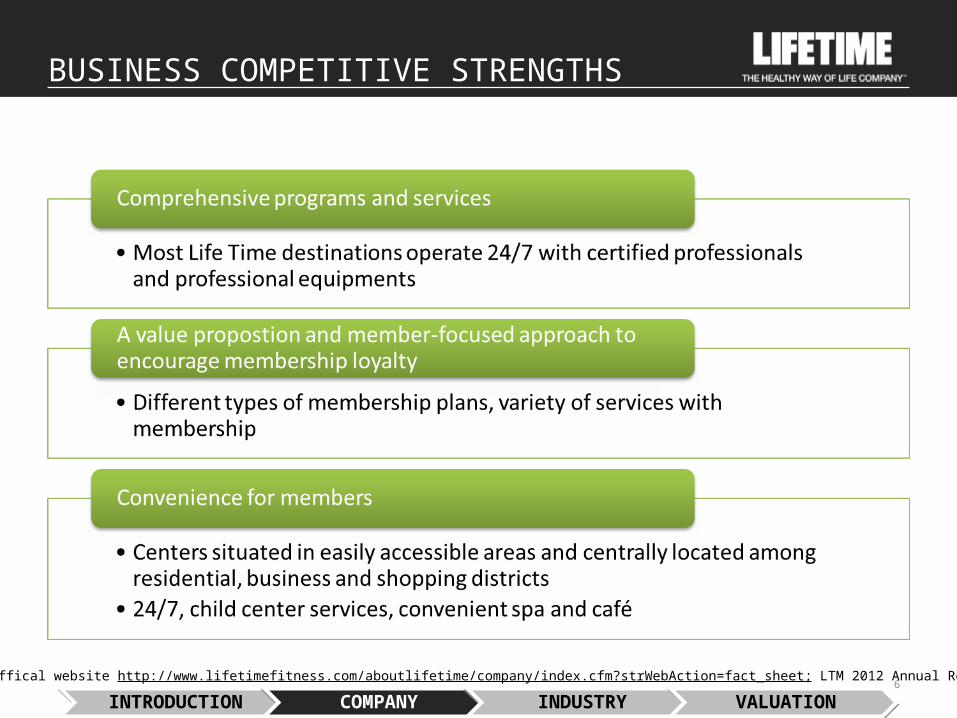
BUSINESS COMPETITIVE STRENGTHS
6Source: LTM offical website http://www.lifetimefitness.com/aboutlifetime/company/index.cfm?strWebAction=fact_sheet; LTM 2012 Annual Report Item I P2-3
INTRODUCTIONINTRODUCTION COMPANYCOMPANY INDUSTRYINDUSTRY VALUATIONVALUATION
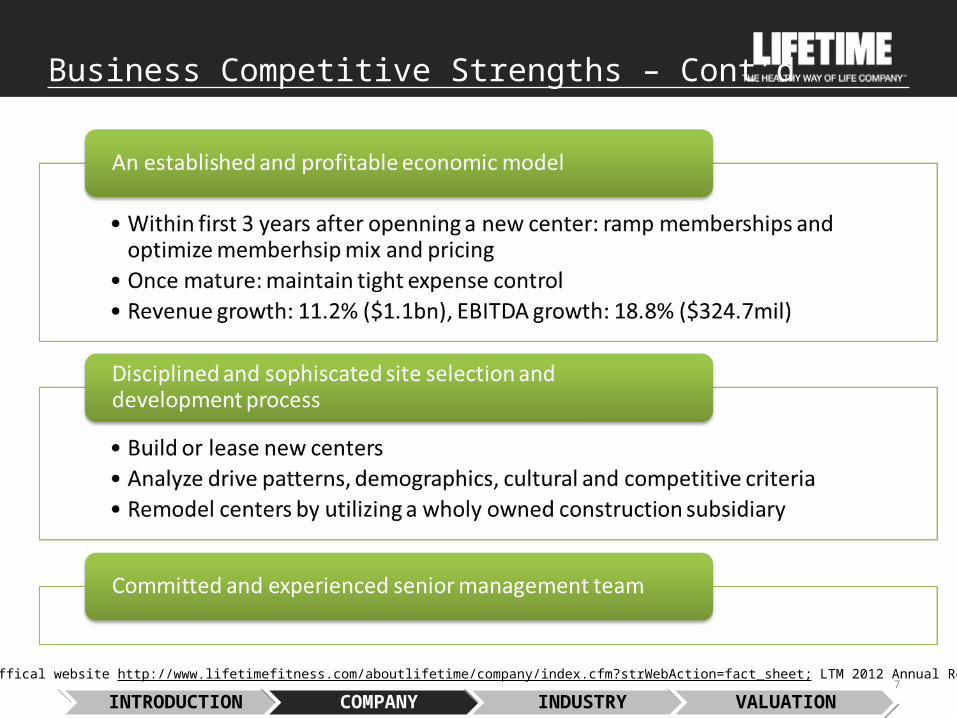
Business Competitive Strengths – Cont’d
7Source: LTM offical website http://www.lifetimefitness.com/aboutlifetime/company/index.cfm?strWebAction=fact_sheet; LTM 2012 Annual Report Item I P2-3
INTRODUCTIONINTRODUCTION COMPANYCOMPANY INDUSTRYINDUSTRY VALUATIONVALUATION

REVENUE DECOMPOSITION
8Source: LTM 2012 Annual Report
INTRODUCTIONINTRODUCTION COMPANYCOMPANY INDUSTRYINDUSTRY VALUATIONVALUATION
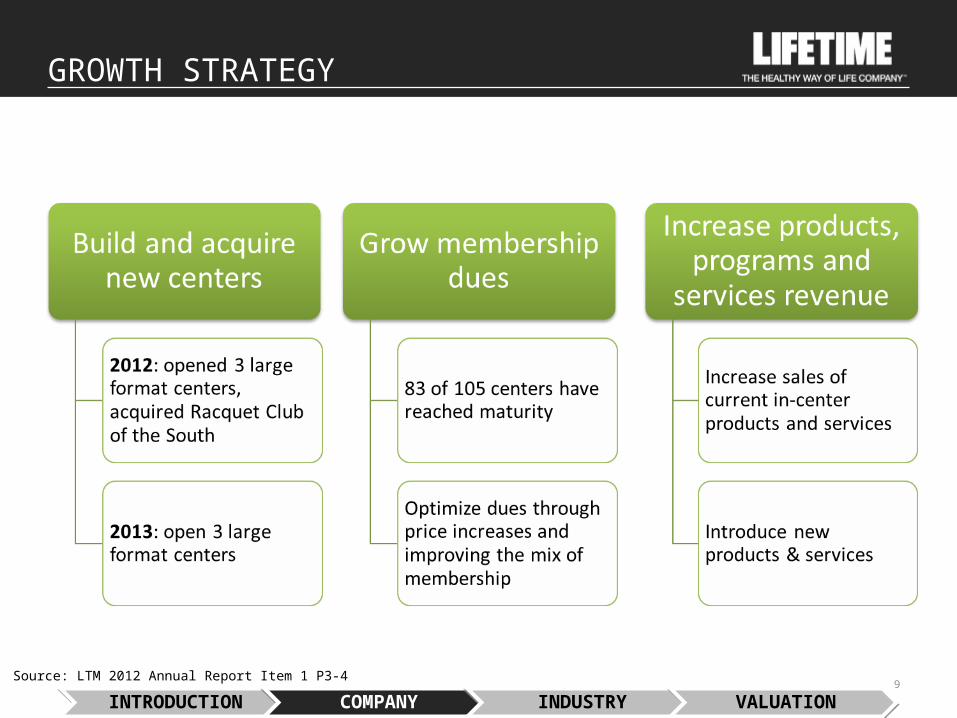
GROWTH STRATEGY
9Source: LTM 2012 Annual Report Item 1 P3-4
INTRODUCTIONINTRODUCTION COMPANYCOMPANY INDUSTRYINDUSTRY VALUATIONVALUATION
SWOT ANALYSIS
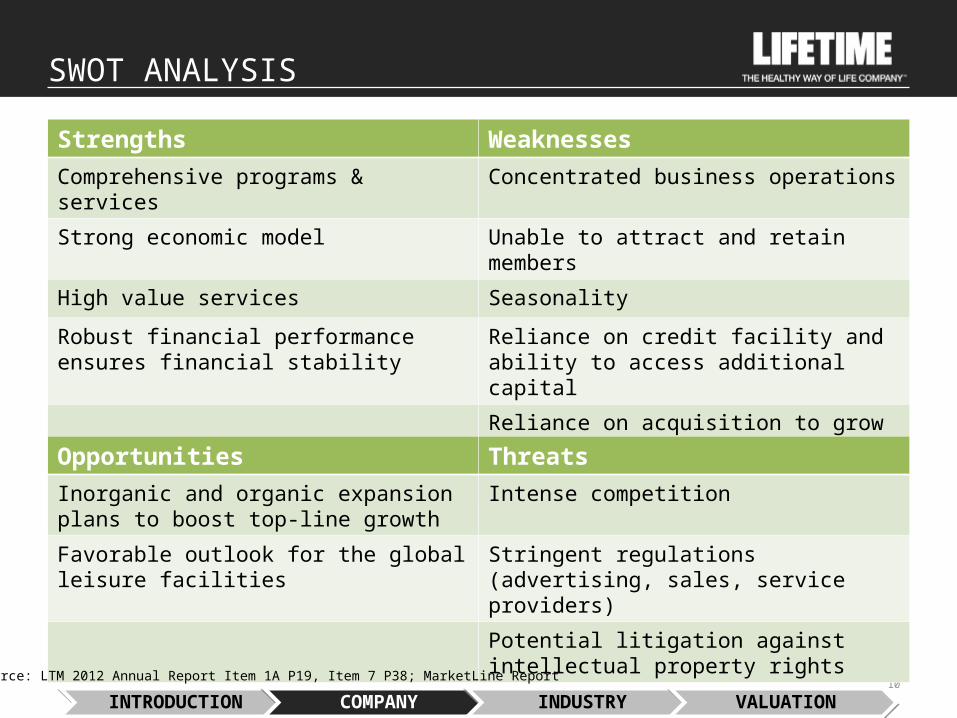
Strengths WeaknessesComprehensive programs & services Concentrated business operations
Strong economic model Unable to attract and retain members
High value services Seasonality
Robust financial performance ensures financial stability
Reliance on credit facility and ability to access additional capital
Reliance on acquisition to grow
Subject to claims (construction, fitness-related)
10
Opportunities ThreatsInorganic and organic expansion plans to boost top-line growth
Intense competition
Favorable outlook for the global leisure facilities
Stringent regulations (advertising, sales, service providers)
Potential litigation against intellectual property rights
Source: LTM 2012 Annual Report Item 1A P19, Item 7 P38; MarketLine Report
INTRODUCTIONINTRODUCTION COMPANYCOMPANY INDUSTRYINDUSTRY VALUATIONVALUATION
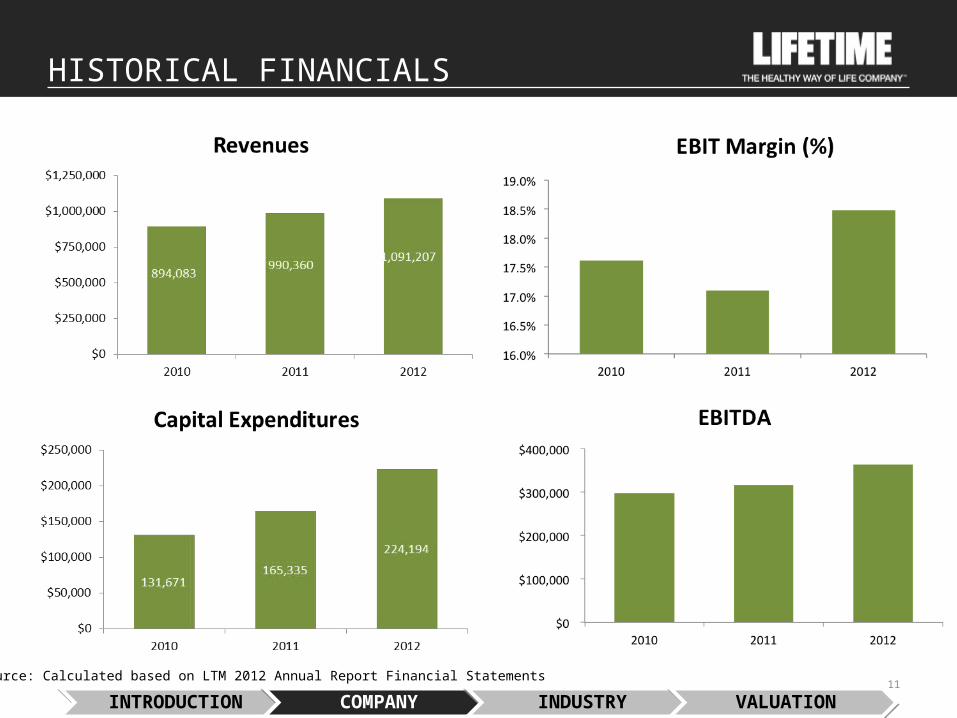
HISTORICAL FINANCIALS
11Source: Calculated based on LTM 2012 Annual Report Financial Statements
INTRODUCTIONINTRODUCTION COMPANYCOMPANY INDUSTRYINDUSTRY VALUATIONVALUATION
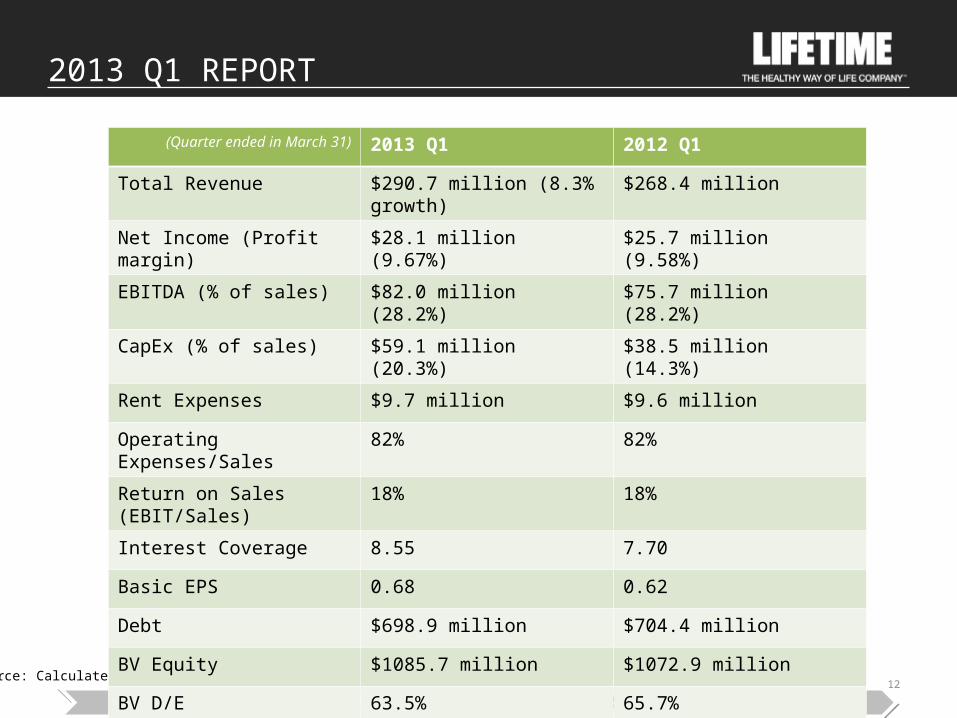
2013 Q1 REPORT
12Source: Calculated based on LTM 2013 Quarterly Report Financial Statements
INTRODUCTIONINTRODUCTION COMPANYCOMPANY INDUSTRYINDUSTRY VALUATIONVALUATION
(Quarter ended in March 31) 2013 Q1 2012 Q1
Total Revenue $290.7 million (8.3% growth) $268.4 million
Net Income (Profit margin) $28.1 million (9.67%) $25.7 million (9.58%)
EBITDA (% of sales) $82.0 million (28.2%) $75.7 million (28.2%)
CapEx (% of sales) $59.1 million (20.3%) $38.5 million (14.3%)
Rent Expenses $9.7 million $9.6 million
Operating Expenses/Sales 82% 82%
Return on Sales (EBIT/Sales) 18% 18%
Interest Coverage 8.55 7.70
Basic EPS 0.68 0.62
Debt $698.9 million $704.4 million
BV Equity $1085.7 million $1072.9 million
BV D/E 63.5% 65.7%

KEY FINANCIAL RATIOS
13Source: Calculated based on LTM 2012 Annual Report Financial Statements
INTRODUCTIONINTRODUCTION COMPANYCOMPANY INDUSTRYINDUSTRY VALUATIONVALUATION
2010A 2011A 2012A
10% 10% 10%5% 5% 5%9% 9% 10%
0.58 0.61 0.60 0.45 0.45 0.43
73% 72% 66%24 37 32
157 165 12232 28 2430 28 20
2 2 311 13 1512 13 18
1 2 0
Profitablility RatiosReturn on Equity (ROE)Return on Asset (ROA)Profit Margin
Liquidity RatiosCurrent RatioQuick Ratio
Leverage RatiosDebt to EquityInterest Coverage
Operating Efficiency RatiosReceivables TurnoverInventory TurnoverPayables Turnover
Receivable Conversion PeriodInventory Conversion Period Payment Deferral Period Cash Conversion Cycle
2013E 2014E 2015E 2016E 2017E 2018E
10% 10% 10% 10% 10% 10%5% 5% 5% 5% 5% 5%9% 9% 9% 9% 9% 9%
0.59 0.59 0.59 0.59 0.59 0.59 0.44 0.44 0.44 0.44 0.44 0.44
70% 70% 70% 70% 70% 70%30 30 30 30 30 30
145 145 145 145 145 14528 28 28 28 28 2825 25 25 25 25 25
2 2 2 2 2 213 13 13 13 13 1314 14 14 14 14 14
1 1 1 1 1 1
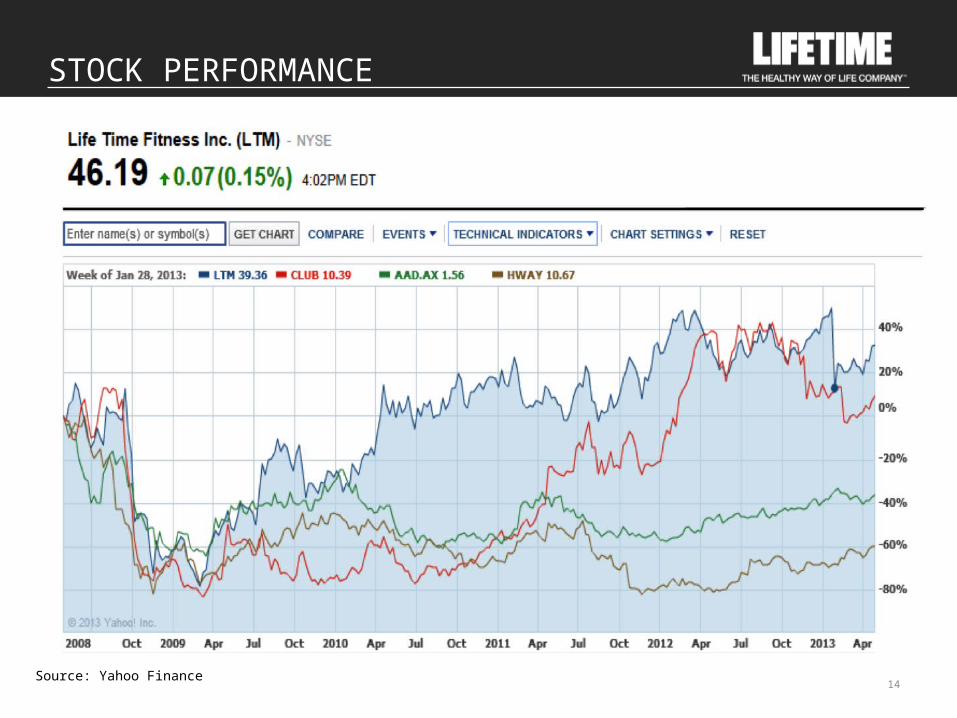
STOCK PERFORMANCE
14Source: Yahoo Finance

INDUSTRY OVERVIEW
• Primary Industry: Fitness– Secondary industry: Leisure Facilities, Health
and Fitness clubs
• Major products and services offered by industry
– Tennis centers, gyms and fitness centers, ice and roller rinks, dance centers, swimming pools, weight-loss supplements
• No major players in this Industry– No players hold a market share larger than
5.0%
• Industry Structure Highlights– Capital Structure- medium– Revenue volatility- low– Regulation level- light
15
INTRODUCTIONINTRODUCTION COMPANYCOMPANY INDUSTRYINDUSTRY VALUATIONVALUATION
Source: IBISWorld
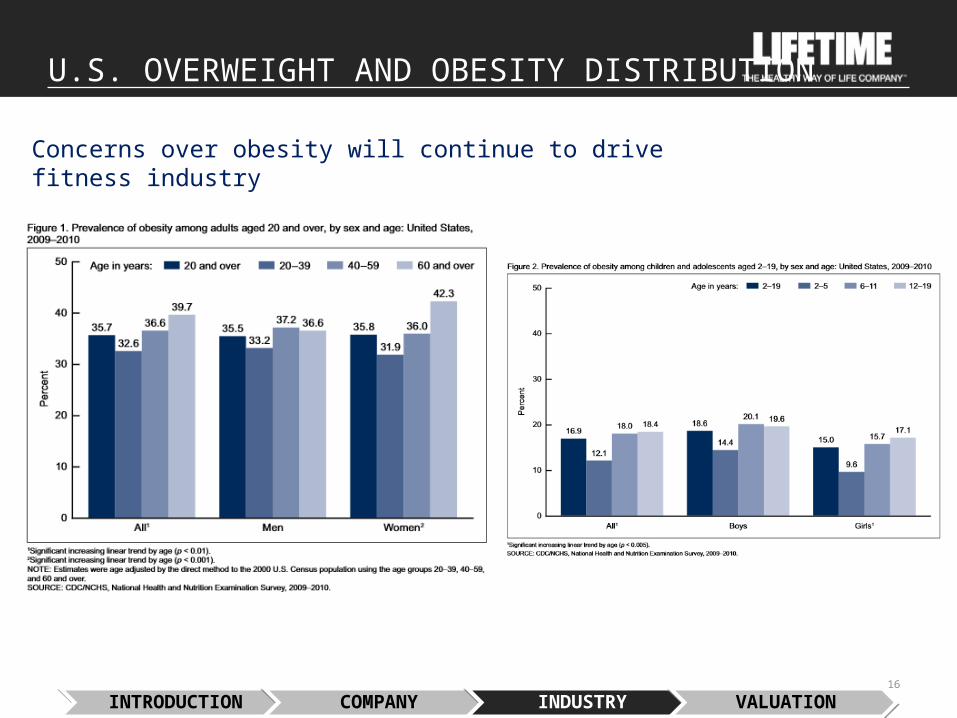
U.S. OVERWEIGHT AND OBESITY DISTRIBUTION
16
INTRODUCTIONINTRODUCTION COMPANYCOMPANY INDUSTRYINDUSTRY VALUATIONVALUATION
Concerns over obesity will continue to drive fitness industry

PREVALENCE OF OBESITY IN U.S.
17
INTRODUCTIONINTRODUCTION COMPANYCOMPANY INDUSTRYINDUSTRY VALUATIONVALUATION
Source: CDC

INDUSTRY OUTLOOK
• Increasing awareness of healthy lifestyle and stabilization of U.S economy will keep industry in a growth phase
– Revenue for the industry expected to rise at an average annual rate of 2.9% to $29.9 billion in 2018
• Large and growing health and wellness industry– Retiring baby boomer generation will create strong opportunities for gyms and fitness clubs– Younger than 17-market presents opportunity as childhood obesity concerns continue
• Slow expansion of existing establishments– Most major markets already heavily saturated– Establishments only expected to increase at an average rate of 1.1%, primarily coming from expansions
of large-scale gyms
• Continued support from government– Reduction of Healthcare costs
18
INTRODUCTIONINTRODUCTION COMPANYCOMPANY INDUSTRYINDUSTRY VALUATIONVALUATION
Source: IBISWorld

PORTER’S FIVE FORCES
19
INTRODUCTIONINTRODUCTION COMPANYCOMPANY INDUSTRYINDUSTRY VALUATIONVALUATION
Threat of New Entrants: Low Large capital investment on property, equipment, and acquisitions
Threat of Substitute Products: HighTraditional methods of exercise and self-instruction through online
materials and alternative weight loss programs
Bargaining Power of Buyers: Moderate Variety of membership packages to choose from;Attractive price and program mix to grow membership dues
Bargaining Power of Sellers: ModerateProperty and professional equipment
Intensity of Competition: HighConcentrated business operations;Other centers, clubs, profit/non-profit organizations
Source: LTM 2012 Annual Report Item 1 P12, Item 1A P16
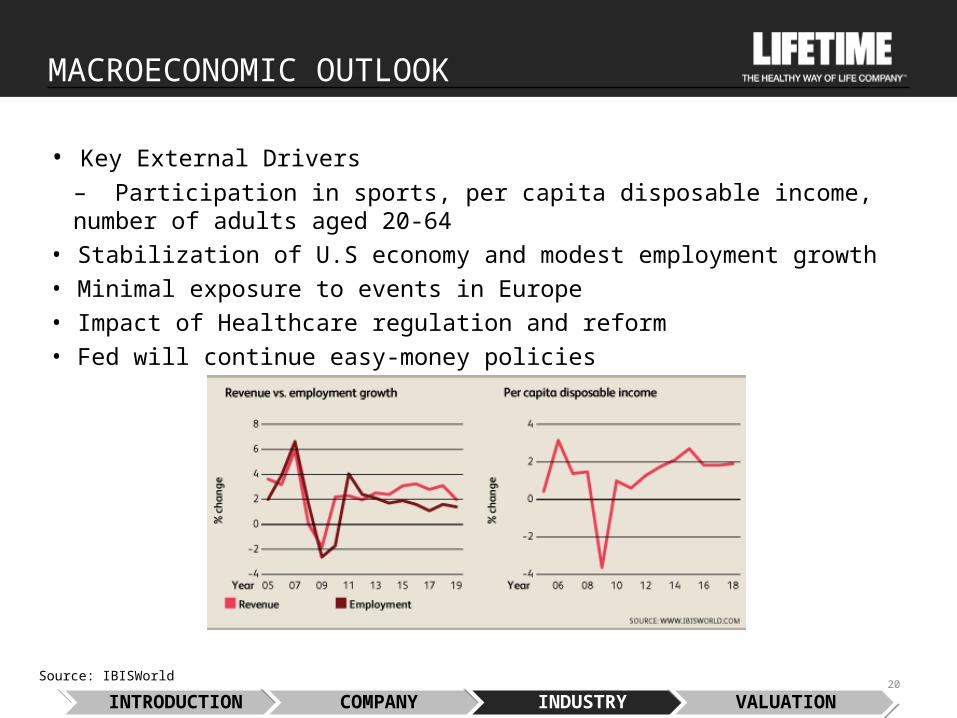
MACROECONOMIC OUTLOOK
• Key External Drivers– Participation in sports, per capita disposable income, number of adults aged 20-64
• Stabilization of U.S economy and modest employment growth• Minimal exposure to events in Europe• Impact of Healthcare regulation and reform• Fed will continue easy-money policies
20
INTRODUCTIONINTRODUCTION COMPANYCOMPANY INDUSTRYINDUSTRY VALUATIONVALUATION
Source: IBISWorld
Valuation — Trading Comparables
21
INTRODUCTIONINTRODUCTION COMPANYCOMPANY INDUSTRYINDUSTRY VALUATIONVALUATION
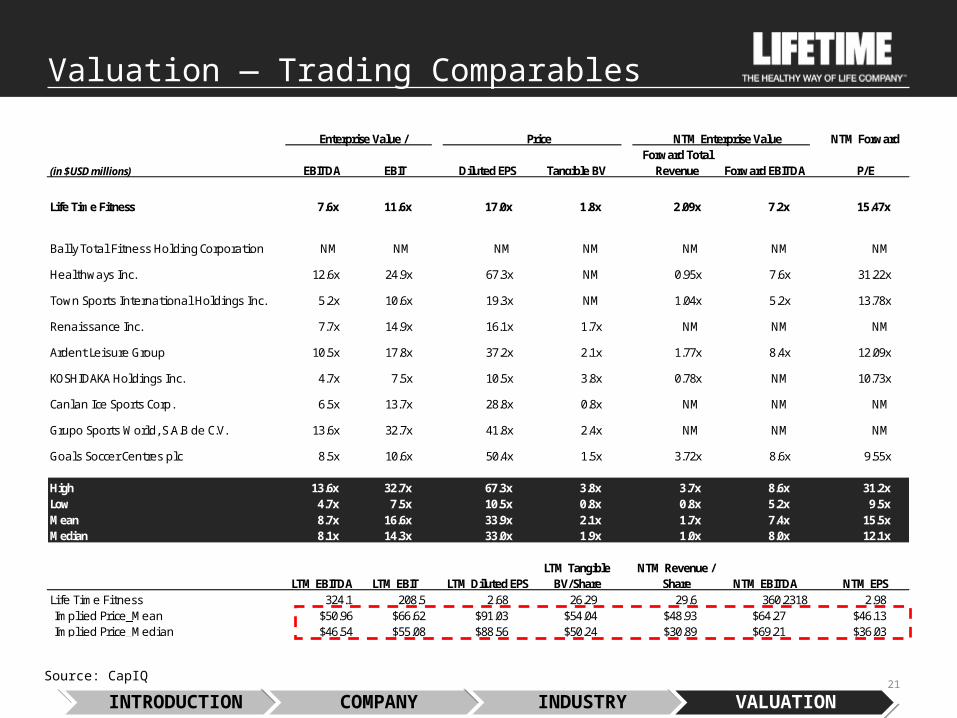
Enterprise Value / Price NTM Enterprise Value NTM Forward
(in $USD millions) EBITDA EBIT Diluted EPS Tangible BVForward Total
Revenue Forward EBITDA P/E
Life Time Fitness 7.6x 11.6x 17.0x 1.8x 2.09x 7.2x 15.47x
Bal ly Tota l Fi tness Holding Corporation NM NM NM NM NM NM NM
Healthways Inc. 12.6x 24.9x 67.3x NM 0.95x 7.6x 31.22x
Town Sports International Holdings Inc. 5.2x 10.6x 19.3x NM 1.04x 5.2x 13.78x
Renaissance Inc. 7.7x 14.9x 16.1x 1.7x NM NM NM
Ardent Leisure Group 10.5x 17.8x 37.2x 2.1x 1.77x 8.4x 12.09x
KOSHIDAKA Holdings Inc. 4.7x 7.5x 10.5x 3.8x 0.78x NM 10.73x
Canlan Ice Sports Corp. 6.5x 13.7x 28.8x 0.8x NM NMNM NM
Grupo Sports World, S.A.B de C.V. 13.6x 32.7x 41.8x 2.4x NM NMNM NM
Goals Soccer Centres plc 8.5x 10.6x 50.4x 1.5x 3.72x 8.6x 9.55x
High 13.6x 32.7x 67.3x 3.8x 3.7x 8.6x 31.2xLow 4.7x 7.5x 10.5x 0.8x 0.8x 5.2x 9.5xMean 8.7x 16.6x 33.9x 2.1x 1.7x 7.4x 15.5xMedian 8.1x 14.3x 33.0x 1.9x 1.0x 8.0x 12.1x
LTM EBITDA LTM EBIT LTM Diluted EPS LTM Tangible
BV/Share NTM Revenue /
Share NTM EBITDA NTM EPS Li fe Time Fi tness 324.1 208.5 2.68 26.29 29.6 360.2318 2.98Impl ied Price_Mean $50.96 $66.62 $91.03 $54.04 $48.93 $64.27 $46.13Impl ied Price_Median $46.54 $55.08 $88.56 $50.24 $30.89 $69.21 $36.03
Source: CapIQ
Valuation — WACC Analysis
22
INTRODUCTIONINTRODUCTION COMPANYCOMPANY INDUSTRYINDUSTRY VALUATIONVALUATION
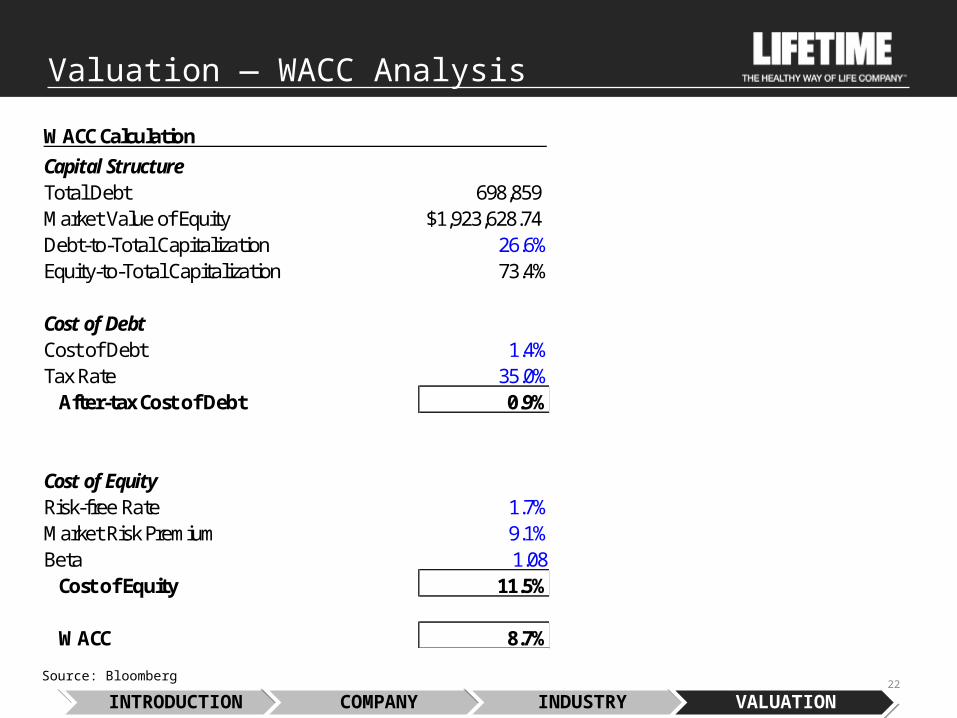
Capital StructureTotal Debt 698,859Market Value of Equity $1,923,628.74Debt-to-Total Capitalization 26.6%Equity-to-Total Capitalization 73.4%
Cost of DebtCost of Debt 1.4%Tax Rate 35.0% After-tax Cost of Debt 0.9%
Cost of EquityRisk-free Rate 1.7%Market Risk Premium 9.1%Beta 1.08 Cost of Equity 11.5%
WACC 8.7%
WACC Calculation
Source: Bloomberg

Discounted Cash Flow Analysis— Fair Value
23
Enterprise Value 2,487,374 Less: Debt (698,859) Add: Cash 13,694
Implied Equity Value 1,802,209
Shares Outstanding 41,646.000
Fair Value of LTM $43.27
Current Stock Price $46.19
DCF implies that stock is trading around its fair value
Implied Share Price SensitivityPerpetuity Growth Rate Terminal Multiple
43 2.0% 2.5% 3.0% 3.5% 4.0%
7.7% $45.55 $50.62 $56.78 $64.42 $74.14
8.2% $40.23 $44.40 $49.37 $55.41 $62.90
8.7% $35.72 $39.19 $43.27 $48.15 $54.07
9.2% $31.84 $34.77 $38.17 $42.18 $46.96
9.7% $28.46 $30.96 $33.84 $37.17 $41.10
WA
CC
Fair Value Calculation
Implied Share Price SensitivityTerminal Multiple
43 5.5x 6.0x 6.5x 7.0x 7.5x
7.7% 38.49 42.36 46.23 50.10 53.97
8.2% 37.17 40.94 44.71 48.48 52.25
8.7% 35.90 39.57 43.24 46.90 50.57
9.2% 34.66 38.23 41.81 45.38 48.95
9.7% 33.46 36.94 40.42 43.90 47.38
WA
CC
INTRODUCTIONINTRODUCTION COMPANYCOMPANY INDUSTRYINDUSTRY VALUATIONVALUATION

VALUATION SUMMARY
• 52-Week High: $52.43• 52-Week Low: $39.10
24
$10 $30 $50 $70
52-Week Range
DCF
TradingLTM EBITDA
$52.43$39.10
$62.90$28.46
$57.47$41.91
• 2.0%-4.0% Perpetuity growth rate
• 8.2%-9.7% WACC• Mid-Year Convention
• 7.0x – 9.5x LTM EBITDA of $324mm
Lifetime is currently trading at its fair value
Current Price $46.19
INTRODUCTIONINTRODUCTION COMPANYCOMPANY INDUSTRYINDUSTRY VALUATIONVALUATION

RISKS & DECISION DRIVERS
(1) GICS Diversification
(2) Sharp drop in stock price
(3) Leader in U.S. Market
Final Thoughts
Why We Chose Lifetime
INTRODUCTIONINTRODUCTION COMPANYCOMPANY INDUSTRYINDUSTRY VALUATIONVALUATION
(1) Low intrinsic Value
(2) Fragmented Industry
(3) Reliance on discretionary income of consumers
(4) Limited growth opportunities in domestic market

RECOMMENDATION
Watch List
INTRODUCTIONINTRODUCTION COMPANYCOMPANY INDUSTRYINDUSTRY VALUATIONVALUATION

Questions?
Life Time Fitness
27
Valuation — DCF ANALYSIS
28
INTRODUCTIONINTRODUCTION COMPANYCOMPANY INDUSTRYINDUSTRY VALUATIONVALUATION
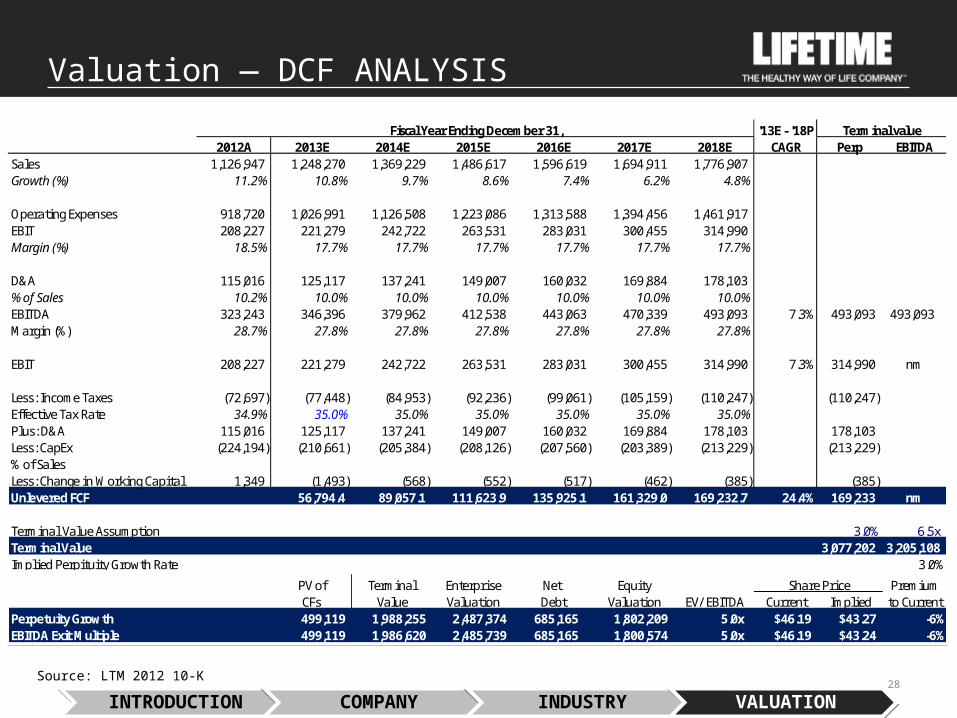
Fiscal Year Ending December 31, '13E - '18P Terminal value2012A 2013E 2014E 2015E 2016E 2017E 2018E CAGR Perp EBITDA
Sales 1,126,947 1,248,270 1,369,229 1,486,617 1,596,619 1,694,911 1,776,907Growth (%) 11.2% 10.8% 9.7% 8.6% 7.4% 6.2% 4.8%
Operating Expenses 918,720 1,026,991 1,126,508 1,223,086 1,313,588 1,394,456 1,461,917EBIT 208,227 221,279 242,722 263,531 283,031 300,455 314,990Margin (%) 18.5% 17.7% 17.7% 17.7% 17.7% 17.7% 17.7%
D&A 115,016 125,117 137,241 149,007 160,032 169,884 178,103% of Sales 10.2% 10.0% 10.0% 10.0% 10.0% 10.0% 10.0%EBITDA 323,243 346,396 379,962 412,538 443,063 470,339 493,093 7.3% 493,093 493,093Margin (%) 28.7% 27.8% 27.8% 27.8% 27.8% 27.8% 27.8%
EBIT 208,227 221,279 242,722 263,531 283,031 300,455 314,990 7.3% 314,990 nm
Less: Income Taxes (72,697) (77,448) (84,953) (92,236) (99,061) (105,159) (110,247) (110,247)Effective Tax Rate 34.9% 35.0% 35.0% 35.0% 35.0% 35.0% 35.0%Plus: D&A 115,016 125,117 137,241 149,007 160,032 169,884 178,103 178,103Less: CapEx (224,194) (210,661) (205,384) (208,126) (207,560) (203,389) (213,229) (213,229)% of SalesLess: Change in Working Capital 1,349 (1,493) (568) (552) (517) (462) (385) (385)Unlevered FCF 56,794.4 89,057.1 111,623.9 135,925.1 161,329.0 169,232.7 24.4% 169,233 nm
Terminal Value Assumption 3.0% 6.5xTerminal Value 3,077,202 3,205,108Implied Perpituity Growth Rate 3.0%
PV of Terminal Enterprise Net Equity Share Price PremiumCFs Value Valuation Debt Valuation EV/ EBITDA Current Implied to Current
Perpetuity Growth 499,119 1,988,255 2,487,374 685,165 1,802,209 5.0x $46.19 $43.27 -6%EBITDA Exit Multiple 499,119 1,986,620 2,485,739 685,165 1,800,574 5.0x $46.19 $43.24 -6%
Source: LTM 2012 10-K