l1 version2 th
DESCRIPTION
l2TRANSCRIPT

Level I Version 2_v10 2012 Sample ExamClick here to to go to MyCFA.
1
“Guidance for Standards I-VII,” CFA Institute 2012 Modular Level I, Vol. 1, pp. 71-72 Study Session 1-2-c Recommend practices and procedures designed to prevent violations of the Code of Ethics and Standards of Professional Conduct. B is correct because, according to Standard III (B) Fair Dealing, members and candidates may provide more personal, specialized, or in-depth service to clients willing to pay for premium services through higher management fees or higher levels of brokerage. Members and candidates can differentiate their services to clients, but different levels of service must not disadvantage or negatively affect clients. In addition, the different service levels should be disclosed to clients and prospective clients and be available to everyone (i.e., different service levels should not be offered selectively). The newsletter recipients are not even clients, because the newsletter is free, and the manager does not even know if the recipients of the newsletter have acted on her recommendations, nor does she know whom these recipients are, so the manager’s obligation is to first serve clients who are paying her a management fee.
2
“Guidance for Standards I-VII,” CFA Institute 2012 Modular Level I, Vol. 1, pp. 85-87, 88-89 Study Session 1-2-b Distinguish between conduct that conforms to the Code and Standards and conduct that violates the Code and Standards. B is correct because Standard III (D) Performance Presentation does not prohibit showing past performance of funds managed at a prior firm as part of a performance track record as long as showing that record is accompanied by appropriate disclosures about where the performance took place and the person’s specific role in achieving that performance, which has been done in this case.

3
“Guidance for Standards I-VII,” CFA Institute 2012 Modular Level I, Vol. 1, pp. 99-100, 123-125 Study Session 1-2-c Recommend practices and procedures designed to prevent violations of the Code of Ethics and Standards of Professional Conduct. A is correct because golf is a business independent of the financial industry and the board obligation would not be a conflict of interest requiring disclosure according to Standard IV (B) Additional Compensation Arrangements, which requires members and candidates to obtain permission from their employer before accepting compensation or other benefits from third parties for the services rendered to the employer or for any services that might create a conflict with their employer’s interest.
4
“Guidance for Standards I-VII,” CFA Institute 2012 Modular Level I, Vol. 1, p. 101 Study Session 1-2-b Distinguish between conduct that conforms to the Code and Standards and conduct that violates the Code and Standards. B is correct because a supervisor’s responsibilities under Standard IV (C) Responsibilities of Supervisors include instructing those subordinates to whom supervision is delegated about methods to prevent and detect violations of laws, rules, regulations, and the Code and Standards. Laws would also include legal restrictions.
5
“Guidance for Standards I-VII,” CFA Institute 2012 Modular Level I, Vol. 1, pp. 63-64, 71-72, 107-110, 131-132 Study Session 1-2-b Distinguish between conduct that conforms to the Code and Standards and conduct that violates the Code and Standards. A is correct as the analyst violated Standard III (B) Fair Dealing by selectively distributing the recommendation internally at the investment bank prior to communicating her recommendation to clients. This might also be a violation of Standard III (A) Loyalty, Prudence, and Care, which requires that members must act for the benefit of their clients and place their clients’ interests before their employer’s or their own interests.
6
“Guidance for Standards I-VII,” CFA Institute 2012 Modular Level I, Vol. 1, p. 110 Study Session 1-2-b Distinguish between conduct that conforms to the Code and Standards and conduct that violates the Code and Standards. A is correct because Standard V (A) Diligence and Reasonable Basis applies to the level of review necessary in selecting an external adviser or subadviser and would include reviewing the adviser’s adherence to its stated strategy.

7
“Guidance for Standards I-VII,” CFA Institute 2012 Modular Level I, Vol. 1, p. 136 Study Session 1-2-c Recommend practices and procedures designed to prevent violations of the Code of Ethics and Standards of Professional Conduct. C is correct because the referral arrangements should be disclosed to clients “before entry into any formal agreement for services” and not after the fact.
8
“Guidance for Standards I-VII,” CFA Institute 2012 Modular Level I, Vol. 1, p. 140 Study Session 1-2-b Distinguish between conduct that conforms to the Code and Standards and conduct that violates the Code and Standards. C is correct because discussing the level of difficulty of the examination did not violate Standard VII (A) Conduct as Members and Candidates in the CFA Program. Standard VII (A) and the Candidate Pledge was violated by candidates revealing broad topical areas and formulas tested or not tested on the exam.
9
“Guidance for Standards I-VII,” CFA Institute 2011 Modular Level I, Vol. 1, pp. 145-146 Study Session 1-2-b Distinguish between conduct that conforms to the Code and Standards and conduct that violates the Code and Standards. C is correct because according to Standard VII (B) Reference to CFA Institute, the CFA Designation, and the CFA Program, this is an accurate statement concerning the CFA designation.

10
“The Time Value of Money,” Richard A. Defusco, CFA, Dennis W. McLeavey, CFA, Jerald E. Pinto, CFA, and David E. Runkle, CFA 2012 Modular Level I, Vol. 1, pp. 286-290 Study Session 2-5-d, e, f Solve time value of money problems for different frequencies of compounding. Calculate and interpret the future value (FV) and present value (PV) of a single sum of money, an ordinary annuity, an annuity due, a perpetuity (PV only), and a series of unequal cash flows. Demonstrate the use of a timeline in modeling and solving time value of money problems.
After year 3 the 30-year fixed-rate loan has the lowest payment. The loan payments, summarized in the table, are calculated using a financial calculator following the table.
Loan Initial Payment ($)
Payment after 3 years ($)
30-year fixed 536.82 536.8215-year fixed 759.82 759.82ARM 463.12 559.15
Payment on the 30-year fixed is: N = 12 × 30 = 360; I / Y = (5 / 12) = 0.41667; PV = 100,000; FV = 0; calculate PMT = 536.82
Payment on the 15-year fixed is: N = 12 × 15 = 180; I / Y = (4.385 / 12) = 0.36542; PV = 100,000; FV = 0; calculate PMT = 759.13
Calculations for the ARM Initial payment: N = 12 × 30 = 360; I / Y = (3.75 / 12) = 0.31250; PV = 100,000; FV = 0; calculate PMT = 463.12
Balance at end of year 3: N = 12 × 27 = 324; I / Y = (3.75 / 12) = 0.31250; FV = 0; PMT = 463.12; calculate PV = 94,270.54
Payment after the end of year 3: N = 324; I / Y = (5.5 / 12) = 0.45833; PV = 94,270.54; FV = 0; calculate PMT = 559.15
11
“Statistical Concepts and Market Returns,” Richard A. Defusco, CFA, Dennis W. McLeavey, CFA, Jerald E. Pinto, CFA, and David E. Runkle, CFA 2012 Modular Level I, Vol. 1, pp. 404-406 Study Session 2-7-l Explain measures of sample skewness and kurtosis. Most equity return series have been found to be leptokurtotic.

12
“Probability Concepts,” Richard A. Defusco, CFA, Dennis W. McLeavey, CFA, Jerald E. Pinto, CFA, and David E. Runkle, CFA 2012 Modular Level I, Vol. 1, p. 437 Study Session 2-8-b Explain the two defining properties of probability and distinguish among empirical, subjective, and a priori probabilities. The two defining properties of a probability are as follows: 1. The probability of any event E is a number between 0 and 1. 2. The sum of the probabilities of any set of mutually exclusive and exhaustive events equals 1.
13
“Probability Concepts,” Richard A. Defusco, CFA, Dennis W. McLeavey, CFA, Jerald E. Pinto, CFA, and David E. Runkle, CFA 2012 Modular Level I, Vol. 1, pp. 466-467 Study Session 2-8-f Calculate and interpret (1) the joint probability of two events, (2) the probability that at least one of two events will occur, given the probability of each and the joint probability of the two events, and (3) a joint probability of any number of independent events. Given that X and Y are independent, their joint probability is equal to the product of their individual probabilities. In this problem, we calculate 0.2 × 0.5 = 0.1.
14
“Common Probability Distributions,” Richard A. Defusco, CFA, Dennis W. McLeavey, CFA, Jerald E. Pinto, CFA, and David E. Runkle, CFA 2012 Modular Level I, Vol. 1, pp. 516-519 Study Session 3-9-c, l Interpret a cumulative distribution function. Determine the probability that a normally distributed random variable lies inside a given interval. First standardize the value of interest, –0.40, for the given normal distribution: Z = (X – μ) / σ = (–0.40 – 5.00) / 2 = –2.70. Then use the given table of values to find the probability of a Z value being 2.70 standard deviations below the mean (i.e., when z ≤ 0). The value is 1 – P(Z ≤ +2.70). In this problem, the solution is: 1 – 0.9965 = 0.0035 = 0.35%
15
“Discounted Cash Flow Applications,” Richard A. Defusco, CFA, Dennis W. McLeavey, CFA, Jerald E. Pinto, CFA, and David E. Runkle, CFA 2012 Modular Level I, Vol. 1, p. 592 Study Session 3-11-a Define a hypothesis, describe the steps of hypothesis testing, describe and interpret the choice of the null and alternative hypotheses, and distinguish between one-tailed and two-tailed tests of hypotheses. When the null and alternative hypotheses are of the form: H0: θ = θ0 versus Ha: θ ≠ θ0, the correct approach is to use a two-tailed test.
16
“Hypothesis Testing,” Richard A. Defusco, CFA, Dennis W. McLeavey, CFA, Jerald E. Pinto, CFA, and David E. Runkle, CFA 2012 Modular Level I, Vol. 1, pp. 619-620 Study Session 3-11-i Identify the appropriate test statistic and interpret the results for a hypothesis test concerning (1) the variance of a normally distributed population, and (2) the equality of the variances of two normally distributed populations based on two independent random samples. The test statistic is the ratio of the variances, with the larger variance in the numerator. Here the test statistic is 28 ÷ 4 = 7. The degrees of freedom are 4 by 4. As it is a two-tailed test, the correct critical value at α = 5% is 9.60. As the test statistic is less than the critical value, we cannot reject the null hypothesis. We therefore accept the null hypothesis.
17
“Demand and Supply Analysis: Introduction,” Richard V. Eastin and Gary L. Arbogast, CFA 2012 Modular Level I, Vol. 2, pp. 44-53 Study Session 4-13-m Calculate and interpret price, income, and cross elasticities of demand, including factors that affect each measure. The cross-price elasticity is positive, indicating that as the price of Y increases, more of X is demanded, making X and Y substitutes.
18
“Demand and Supply Analysis: Introduction,” Richard V. Eastin and Gary L. Arbogast, CFA 2012 Modular Level I, Vol. 2, pp. 31-33 “Demand and Supply Analysis: Consumer Demand,” Richard V. Eastin and Gary L. Arbogast, CFA 2012 Modular Level I, Vol. 2, pp. 87-88 Study Sessions 4-13-l; 4-14-e Calculate and interpret consumer surplus, producer surplus, and total surplus. Compare substitution and income effects.
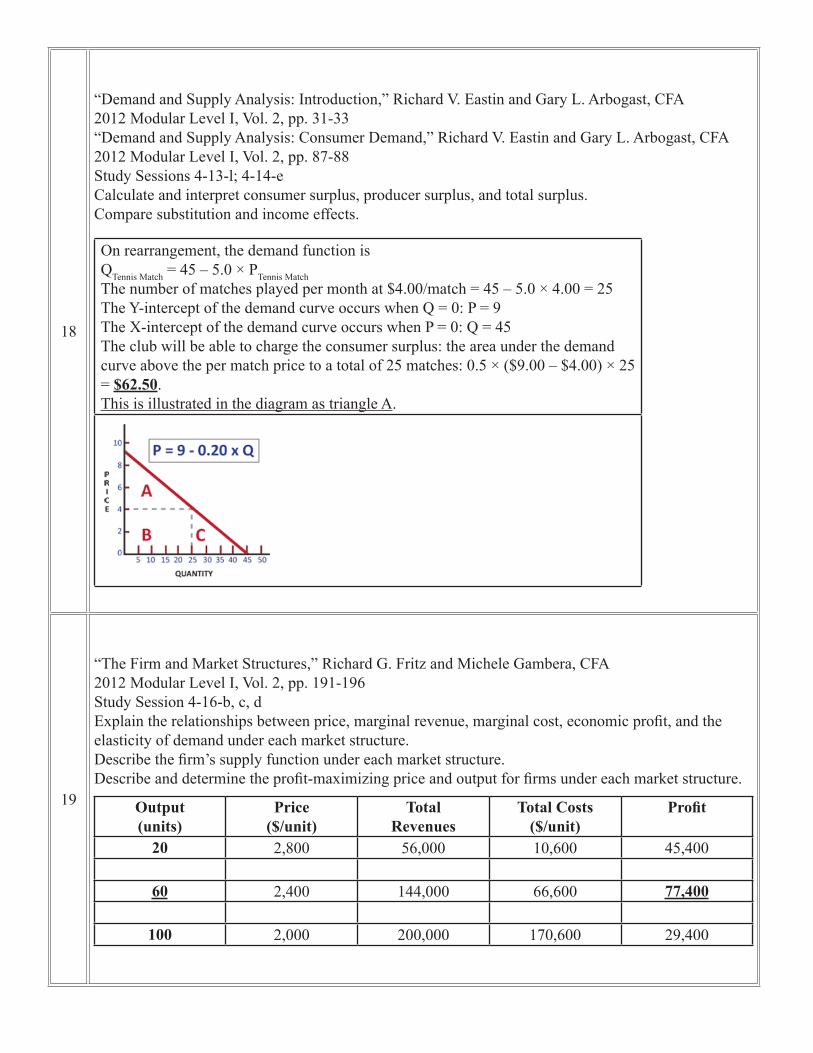
On rearrangement, the demand function is QTennis Match = 45 – 5.0 × PTennis Match The number of matches played per month at $4.00/match = 45 – 5.0 × 4.00 = 25 The Y-intercept of the demand curve occurs when Q = 0: P = 9 The X-intercept of the demand curve occurs when P = 0: Q = 45 The club will be able to charge the consumer surplus: the area under the demand curve above the per match price to a total of 25 matches: 0.5 × ($9.00 – $4.00) × 25 = $62.50. This is illustrated in the diagram as triangle A.
19
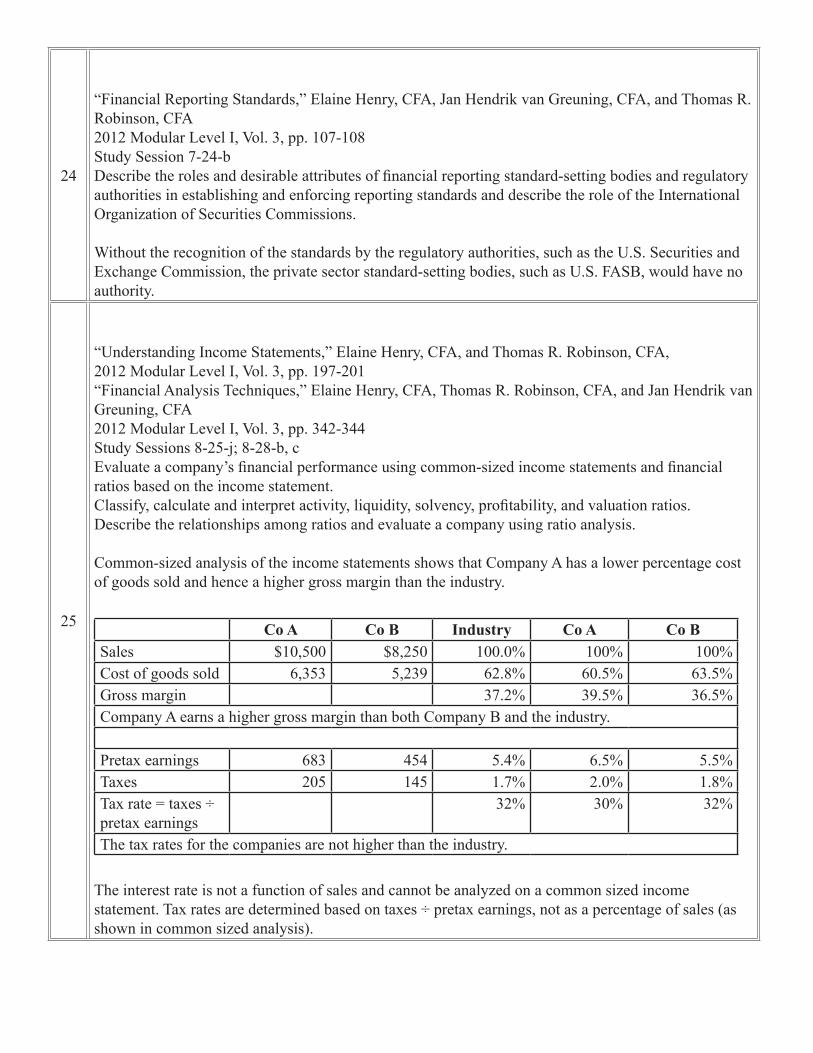
“The Firm and Market Structures,” Richard G. Fritz and Michele Gambera, CFA 2012 Modular Level I, Vol. 2, pp. 191-196 Study Session 4-16-b, c, d Explain the relationships between price, marginal revenue, marginal cost, economic profit, and the elasticity of demand under each market structure. Describe the firm’s supply function under each market structure. Describe and determine the profit-maximizing price and output for firms under each market structure.
Output (units)
Price ($/unit)
Total Revenues
Total Costs ($/unit)
Profit
20 2,800 56,000 10,600 45,400 60 2,400 144,000 66,600 77,400
100 2,000 200,000 170,600 29,400

20
“Understanding Business Cycles,” Michele Gambera, CFA, Milton Ezrati, and Bolong Cao, CFA 2012 Modular Level I, Vol. 2, pp. 323-325 Study Session 5-18-d Explain the types of unemployment and describe measures of unemployment. Unemployment rate = Unemployed / Labor force × 100 = 95 / 750 × 100 = 12.6%.
21
“Understanding Business Cycles,” Michele Gambera, CFA, Milton Ezrati, and Bolong Cao, CFA 2012 Modular Level I, Vol. 2, pp. 339-343 Study Session 5-18-i, j Describe economic indicators, including their uses and limitations. Identify the past, current, or expected future business cycle phase of an economy based on economic indicators. Average weekly initial claims for unemployment insurance are a leading indicator of economic activity and a decline is an indicator of rehiring at the start of a recovery.
22
“Currency Exchange Rates,” William A. Barker, CFA, Paul D. McNelis, and Jerry Nickelsburg 2012 Modular Level I, Vol. 2, pp. 525-533 Study Session 5-21-f, g, h Convert forward quotations expressed on a points basis or in percentage terms into an outright forward quotation. Calculate and interpret a forward discount or premium. Calculate and interpret the forward rate consistent with the spot rate and the interest rate in each currency. Covered interest arbitrage will ensure identical terminal values by investing the same initial amounts at the respective country’s domestic interest rates: GBP investment: £2.0979 × (1 + 0.016025 × 180 / 360) = £2.1147 NZD investment: NZ$1 × (1 + 0.032875 × 180 / 360) = NZ$1.0164 The forward rate is determined by equating these two terminal amounts: GBP / NZD Forward Rate = £2.1147 / NZ$1.0164 = £2.0806 / NZ$ Forward points = (Forward – Spot) × 10,000 = (2.0806 – 2.0979) × 10,000 = –173.0
23
“Financial Reporting Mechanics,” Thomas R. Robinson, CFA, Jan Hendrik van Greuning, CFA, Karen O’Connor Rubsam, CFA, Elaine Henry, CFA, and Michael A. Broihahn, CFA 2012 Modular Level I, Vol. 3, p. 75 Study Session 7-23-f Describe the flow of information in an accounting system. The general journal records transactions in the order in which they occur (chronological order) and is therefore sorted by date.
24
“Financial Reporting Standards,” Elaine Henry, CFA, Jan Hendrik van Greuning, CFA, and Thomas R. Robinson, CFA 2012 Modular Level I, Vol. 3, pp. 107-108 Study Session 7-24-b Describe the roles and desirable attributes of financial reporting standard-setting bodies and regulatory authorities in establishing and enforcing reporting standards and describe the role of the International Organization of Securities Commissions. Without the recognition of the standards by the regulatory authorities, such as the U.S. Securities and Exchange Commission, the private sector standard-setting bodies, such as U.S. FASB, would have no authority.
25
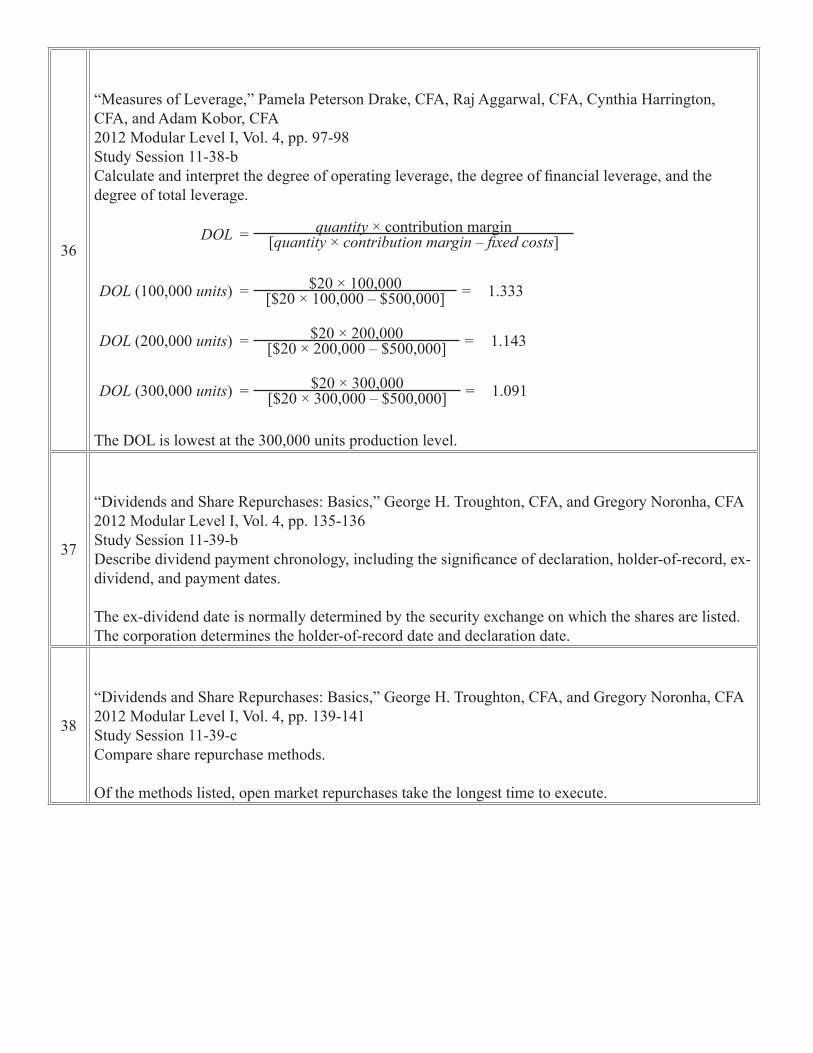
“Understanding Income Statements,” Elaine Henry, CFA, and Thomas R. Robinson, CFA, 2012 Modular Level I, Vol. 3, pp. 197-201 “Financial Analysis Techniques,” Elaine Henry, CFA, Thomas R. Robinson, CFA, and Jan Hendrik van Greuning, CFA 2012 Modular Level I, Vol. 3, pp. 342-344 Study Sessions 8-25-j; 8-28-b, c Evaluate a company’s financial performance using common-sized income statements and financial ratios based on the income statement. Classify, calculate and interpret activity, liquidity, solvency, profitability, and valuation ratios. Describe the relationships among ratios and evaluate a company using ratio analysis. Common-sized analysis of the income statements shows that Company A has a lower percentage cost of goods sold and hence a higher gross margin than the industry.
Co A Co B Industry Co A Co BSales $10,500 $8,250 100.0% 100% 100%Cost of goods sold 6,353 5,239 62.8% 60.5% 63.5%Gross margin 37.2% 39.5% 36.5%Company A earns a higher gross margin than both Company B and the industry.
Pretax earnings 683 454 5.4% 6.5% 5.5%Taxes 205 145 1.7% 2.0% 1.8%Tax rate = taxes ÷ pretax earnings
32% 30% 32%
The tax rates for the companies are not higher than the industry.
The interest rate is not a function of sales and cannot be analyzed on a common sized income statement. Tax rates are determined based on taxes ÷ pretax earnings, not as a percentage of sales (as shown in common sized analysis).

26
“Understanding Balance Sheets,” Elaine Henry, CFA, and Thomas R. Robinson, CFA 2012 Modular Level I, Vol. 3, pp. 219-221, 236 Study Session 8-26-c, e Describe alternative formats of balance sheet presentation. Describe different types of assets and liabilities and the measurement bases of each. Under U.S. GAAP, intangibles must be valued at historical cost, whereas under IFRS, they can be valued at cost or revaluation.
27
“Understanding Cash Flow Statements,” Elaine Henry, CFA, Thomas R. Robinson, CFA, Jan Hendrik van Greuning, CFA, and Michael A. Broihahn, CFA 2012 Modular Level I, Vol. 3, pp. 273-274 Study Session 8-27-a Compare cash flows from operating, investing, and financing activities and classify cash flow items as relating to one of those three categories given a description of the items. Only the cash flows for the purchase of the shares in an affiliated company are cash from investing activities; therefore the net amount is –$275,000. Cash flows from trading securities are operating activities.
28
“Financial Analysis Techniques,” Elaine Henry, CFA, Thomas R. Robinson, CFA, and Jan Hendrik van Greuning, CFA 2012 Modular Level I, Vol. 3, pp. 351-354, 359-361 “Working Capital Management,” Edgar A. Norton, Jr., CFA, Kenneth L. Parkinson, and Pamela Peterson Drake, CFA 2012 Modular Level I, Vol. 4, pp. 163-167 Study Sessions 8-28-b; 11-40-c Classify, calculate and interpret activity, liquidity, solvency, profitability, and valuation ratios. Evaluate working capital effectiveness of a company based on its operating and cash conversion cycles, and compare the company’s effectiveness with that of peer companies. Cash conversion cycle = Days sales outstanding + Days of inventory on hand – Days of payables
Accounts receivable Days in sales (DSO)
Inventory Days on hand (DHO)
Accounts payables Days in payables
Turnover Sales A/R
Cost of Goods Sold Inventory
Purchases Payables
4,800 ÷ 625 2,880 ÷ 710 2,940 ÷ 145 = 7.68 times = 4.06 times = 20.3 timesIn days 365 ÷ 7.68 365 ÷ 4.06 365 ÷ 20.3
= 48 days = 90 days = 18 daysCash conversion cycle = DSO + DOH – Days in Payables = 48 + 90 – 18 = 120 days

29
“Inventories,” Michael A. Broihahn, CFA 2012 Modular Level I, Vol. 3, pp. 414-416 Study Session 9-29-d, e Calculate and compare the cost of sales, gross profit, and ending inventory using perpetual and periodic inventory systems. Compare cost of sales, ending inventory, and gross profit using different inventory valuation methods. When using the FIFO inventory method the ending inventory, the cost of goods sold and the gross margin are the same under either the perpetual or periodic methods.
30
“Long-Lived Assets,” Elaine Henry, CFA, and Elizabeth A. Gordon 2012 Modular Level I, Vol. 3, pp. 476-478 Study Session 9-30-g, k Describe the revaluation model. Compare the financial reporting of investment property with that of property, plant, and equipment. For investment properties, when using the fair value model of revaluing assets, all increases and decreases affect the net income. Here, it is 54.5 – 48.0 = 6.5.
31
“Income Taxes,” Elbie Antonites, CFA, and Michael A. Broihahn, CFA 2012 Modular Level I, Vol. 3, pp. 501-502 Study Session 9-31-d, e Calculate income tax expense, income taxes payable, deferred tax assets, and deferred tax liabilities, and calculate and interpret the adjustment to the financial statements related to a change in the income tax rate. Evaluate the impact of tax rate changes on a company’s financial statements and ratios.
Deferred tax liability = taxable temporary difference × tax rate.In 2010 if the rates had not changed, the deferred tax liability would be:
0.30 × 4,000 = £1,200
But with the lower tax rate, the deferred tax liability will be: 0.25 × 4,000 = £1,000Effect of the change in rate therefore is a decrease in the liability:
£ (200)
Alternative calculation = change in rate × taxable difference: –5% × 4,000 £ (200)

32
“Financial Reporting Quality: Red Flags and Accounting Warning Signs,” Thomas R. Robinson, CFA, and Paul Munter 2012 Modular Level I, Vol. 3, p. 595 Study Session 10-33-d Describe common accounting warning signs and methods for detecting each. The most appropriate way to identify a LIFO liquidation is by reviewing the inventory footnotes for a decrease in the LIFO reserve. Although a LIFO liquidation may result in an increase in gross margin or changes in inventory out of line with changes in sales, there are other factors that could explain those changes.
33
“Financial Statement Analysis: Applications,” Thomas R. Robinson, CFA, Jan Hendrik van Greuning, CFA, Elaine Henry, CFA, and Michael A. Broihahn, CFA 2012 Modular Level I, Vol. 3, pp. 634-635 “Financial Statement Analysis,” Pamela Peterson Drake, CFA 2012 Modular Level I, Vol. 4, pp. 221-223 Study Sessions 10-35-b; 11-41 Forecast a company’s future net income and cash flow. The candidate should be able to demonstrate the use of pro forma income and balance sheet statements.
Net income is calculated as follows:Sales $2,500 GivenVariable costs (750) 30% of SalesFixed costs (1,400) GivenInterest expense (25) 0.05 × 500 average debtEarnings before taxes 325 Taxes (81.25) 25% of EBTNet income $243.75 Rounded to $244

34
“Long-Lived Assets,” Elaine Henry, CFA, and Elizabeth A. Gordon 2012 Modular Level I, Vol. 3, pp. 452-453 “Financial Statement Analysis: Applications,” Thomas R. Robinson, CFA, Jan Hendrik van Greuning, CFA, Elaine Henry, CFA, and Michael A. Broihahn, CFA 2012 Modular Level I, Vol. 3, pp. 648-650 Study Sessions 9-30-d; 10-35-e Calculate depreciation expense. Explain appropriate analyst adjustments to a company’s financial statements to facilitate comparison with another company.
The expected remaining useful life of a company’s overall asset base
= net PPE ÷ depreciation expense.
Depreciation expense equals the change in accumulated depreciation A
375 – 250 = 125
The expected remaining useful life 2,125 ÷ 125 = 17 years A When there are no asset dispositions or acquisitions, as appears to be the case here, because the gross PPE does not change.
35
“Cost of Capital,” Yves Courtois, CFA, Gene C. Lai, and Pamela Peterson Drake, CFA 2012 Modular Level I, Vol. 4, pp. 41-45 Study Session 11-37-a, b Calculate and interpret the weighted average cost of capital (WACC) of a company. Describe how taxes affect the cost of capital from different capital sources. Convert D/E to the weight for debt:
The weight for equity is one minus the weight of debt:
WACC = weight of debt × cost of debt × (1 – tax rate) + weight of equity × cost of equity
36
“Measures of Leverage,” Pamela Peterson Drake, CFA, Raj Aggarwal, CFA, Cynthia Harrington, CFA, and Adam Kobor, CFA 2012 Modular Level I, Vol. 4, pp. 97-98 Study Session 11-38-b Calculate and interpret the degree of operating leverage, the degree of financial leverage, and the degree of total leverage.
DOL = quantity × contribution margin[quantity × contribution margin – fixed costs]
DOL (100,000 units) = $20 × 100,000 = 1.333[$20 × 100,000 – $500,000]
DOL (200,000 units) = $20 × 200,000 = 1.143[$20 × 200,000 – $500,000]
DOL (300,000 units) = $20 × 300,000 = 1.091[$20 × 300,000 – $500,000]
The DOL is lowest at the 300,000 units production level.
37
“Dividends and Share Repurchases: Basics,” George H. Troughton, CFA, and Gregory Noronha, CFA 2012 Modular Level I, Vol. 4, pp. 135-136 Study Session 11-39-b Describe dividend payment chronology, including the significance of declaration, holder-of-record, ex-dividend, and payment dates. The ex-dividend date is normally determined by the security exchange on which the shares are listed. The corporation determines the holder-of-record date and declaration date.
38
“Dividends and Share Repurchases: Basics,” George H. Troughton, CFA, and Gregory Noronha, CFA 2012 Modular Level I, Vol. 4, pp. 139-141 Study Session 11-39-c Compare share repurchase methods. Of the methods listed, open market repurchases take the longest time to execute.

39
“Working Capital Management,” Edgar A. Norton, Jr., CFA, Kenneth L. Parkinson, and Pamela Peterson Drake, CFA 2012 Modular Level I, Vol. 4, p. 164 Study Session 11-40-c, f Evaluate working capital effectiveness of a company based on its operating and cash conversion cycles, and compare the company’s effectiveness with that of peer companies. Evaluate a company’s management of accounts receivable, inventory, and accounts payable over time and compared to peer companies. The days in payables =
Accounts payable
=Accounts payable
(Purchases ÷ 365) ((Change in inventory + Cost of goods sold) ÷ 365)
= $600 = 35.3(($1,200 – $1,000 + $6,000) ÷ 365)
40
“Market Organization and Structure,” Larry E. Harris 2012 Modular Level I, Vol. 5, pp. 41-44 “Market Efficiency,” W. Sean Cleary, CFA, Howard J. Atkinson, CFA, and Pamela Peterson Drake, CFA 2012 Modular Level I, Vol. 5, pp. 129, 133 Study Sessions 13-47-e; 13-49-b Compare the positions an investor can take in an asset. Distinguish between market value and intrinsic value. A stock whose intrinsic value is less than its current market price is overvalued. Therefore, the most appropriate strategy is to sell the stock short. Short sellers profit by selling at high prices and repurchasing at lower prices.
41
“Financial Analysis Techniques,” Elaine Henry, CFA, Thomas R. Robinson, CFA, and Jan Hendrik van Greuning, CFA 2012 Modular Level I, Vol. 3, pp. 368-370, 374-376, 380-381 “Introduction to Industry and Company Analysis,” Patrick W. Dorsey, CFA, Anthony M. Fiore, CFA, and Ian Rossa O’Reilly, CFA 2012 Modular Level I, Vol. 5, pp. 250-254 Study Sessions 8-28-c, d, e; 14-51-k Describe the relationships among ratios and evaluate a company using ratio analysis. Demonstrate the application of the DuPont analysis of return on equity, and calculate and interpret the effects of changes in its components. Calculate and interpret ratios used in equity analysis, credit analysis, and segment analysis. Describe the elements that should be covered in a thorough company analysis. Selling unproductive land and using the proceeds from the sale to buy back shares reduces the total assets. Holding sales constant, the decrease in assets would improve the asset turnover. Buying back shares increases the firm’s financial leverage. Both the increase in asset turnover and financial leverage will lead to a higher return on equity.
42
“Equity Valuation: Concepts and Basic Tools,” John J. Nagorniak, CFA, and Stephen E. Wilcox, CFA 2012 Modular Level I, Vol. 5, pp. 272-275 Study Session 14-52-c Explain the rationale for using present-value of cash flow models to value equity and describe the dividend discount and free-cash-flow-to-equity models. FCFE is a measure of the firm’s dividend paying capacity.
43
“Introduction to Industry and Company Analysis,” Patrick W. Dorsey, CFA, Anthony M. Fiore, CFA, and Ian Rossa O’Reilly, CFA 2012 Modular Level I, Vol. 5, p. 254 “Equity Valuation: Concepts and Basic Tools,” John J. Nagorniak, CFA, and Stephen E. Wilcox, CFA 2012 Modular Level I, Vol. 5, pp. 284-286 Study Sessions 14-51-k; 14-52-e Describe the elements that should be covered in a thorough company analysis. Calculate and interpret the intrinsic value of an equity security based on the Gordon (constant) growth dividend discount model or a two-stage dividend discount model, as appropriate. Net profit margin = Net earnings / Sales; Net earnings = Net profit margin × Sales; DPS = (Net earnings × Payout ratio) / # of outstanding shares; Therefore, Next year’s DPS = ($180 million × 0.15 × 0.60) / 8 million = $2 V = 2 / 1.12 + 2(1.25)1 / 1.122 + 2(1.25)2 / 1.123 + [2(1.25)2 (1.05) / (0.12 – 0.05)] / 1.123 = $1.79 + $1.99 + $2.22 + $33.36 = $39.36

44
“Market Organization and Structure,” Larry E. Harris 2012 Modular Level I, Vol. 5, pp. 44-46 Study Session 13-47-f Calculate and interpret the leverage ratio, the rate of return on a margin transaction, and the security price at which the investor would receive a margin call. Initial equity (%) in the margin transaction = 1 / Leverage ratio = 1 / 1.66 = 0.60; Initial equity per share at the time of purchase = $36 × 0.60 = $21.60; Price at which margin call occurs: Equity per share / Price per share = Maintenance margin % = ($21.60 + P – $36) / P = 0.30; 0.7P = $14.40; P = $20.57.
45
“Market Efficiency,” W. Sean Cleary, CFA, Howard J. Atkinson, CFA, and Pamela Peterson Drake, CFA 2012 Modular Level I, Vol. 5, pp. 139-140, 147-148 Study Session 13-49-d, e, f, g Contrast the weak-form, semi-strong form, and strong-form market efficiency. Explain the implications of each form of market efficiency for fundamental analysis, technical analysis, and the choice between active and passive portfolio management. Describe identified market pricing anomalies and explain possible inconsistencies with market efficiency. Contrast the behavioral finance view of investor behavior to that of traditional finance. If securities markets are semi-strong form efficient, active trading to exploit price patterns or public information is not likely to generate abnormal returns. Thus, both technical and fundamental analyses become futile exercises.
46
“Option Markets and Contracts,” Don M. Chance, CFA 2012 Modular Level I, Vol. 6, p. 116 Study Session 17-63-n Explain how cash flows on the underlying asset affect put-call parity and the lower bounds on option prices. C is correct because a cash flow such as a dividend payment is required for an early exercise. A dividend payment doesn’t guarantee early exercise, as the dividend also needs to be large enough to justify the early exercise.
47
“Swap Markets and Contracts,” Don M. Chance, CFA 2012 Modular Level I, Vol. 6, pp. 136-140 Study Session 17-64-b Describe, calculate, and interpret the payments of currency swaps, plain vanilla interest rate swaps, and equity swaps. B is correct because the bank’s payments are based upon a notional principal of EUR 50,000,000 and an interest rate of 4.5%. The payment is: EUR 50,000,000 × (0.045) × (180 / 360) = EUR 1,125,000.

48
“Risk Management Applications of Option Strategies,” Don M. Chance, CFA 2012 Modular Level I, Vol. 6, pp. 159-164 Study Session 17-65-a Determine the value at expiration, profit, maximum profit, maximum loss, breakeven underlying price at expiration, and payoff graph of the strategies of buying and selling calls and puts, and determine the potential outcomes for investors using these strategies. B is correct because buying a call gives the owner the right to buy the stock at the exercise price. The investor predicts that the stock will increase to $95 at the end of two months. He will be able to exercise the call, buy the stock at $88, and sell it at $95, thereby making a profit.
49
“Alternative Investments,” Bruno Solnik and Dennis McLeavey 2012 Modular Level I, Vol. 6, pp. 190-192 Study Session 18-66-a Distinguish between an open-end and a closed-end fund, and explain how net asset value of a fund is calculated and the nature of fees charged by investment companies. B is correct because it results in the lowest cost over 3 years, as the table below shows:
Year 1 Year 2 Year 3 TotalClass A 1.00 + 2.75 1.00 1.00 5.75Class B 1.25 1.25 1.25 + 1.00 4.75Class C 1.25 1.25 1.25 + 1.50 5.25
50
“Alternative Investments,” Bruno Solnik and Dennis McLeavey 2012 Modular Level I, Vol. 6, pp. 231-233 Study Session 18-66-o Describe alternative valuation methods for closely held companies, and distinguish among the bases for the discounts and premiums for these companies. B is correct because the cost approach attempts to determine what it would cost to replace the company’s assets in their present form, not original cost.

51
“Alternative Investments,” Bruno Solnik and Dennis McLeavey 2012 Modular Level I, Vol. 6, pp. 227-229 Study Session 18-66-m Describe the performance of hedge funds, the biases present in hedge fund performance measurement, and explain the effect of survivorship bias on the reported return and risk measures for a hedge fund database. B is correct because hedge fund managers themselves decide whether they want to be included in a database. Managers who have funds with an unimpressive track record will not wish to have that information exposed.
52
“Introduction to the Valuation of Debt Securities,” Frank J. Fabozzi, CFA 2012 Modular Level I, Vol. 5, p. 498 Study Session 16-57-c Calculate the value of a bond (coupon and zero coupon).A is correct because the value of a zero-coupon bond is
= Maturity value(1 + i)no. of years x 2
where i is the semi-annual discount rate or$1,000 = $122.74.(1.06)18x2
53
“Yield Measures, Spot Rates, and Forward Rates,” Frank J. Fabozzi, CFA 2012 Modular Level I, Vol. 5, pp. 537-548 Study Session 16-58-b Calculate and interpret the traditional yield measures for fixed-rate bonds and explain their limitations and assumptions. C is correct because the yield to worst for a callable bond is the lowest of the yields to call for each possible call date and the yield to maturity. The yield to call or yield to maturity solves the following equation:
where i is the yield to call or yield to maturity, CFt is the cash flow at date t, and T is the maturity or call date.
The yield to call if the bond is called in one year is 8.57%, because
105 = 10 + 1041.08571
The yield to call if the bond is called in two years is 8.15%, because
105 = 10 + 10 + 1021.08151 1.08152
The yield to maturity of the bond is 8.06%, because
105 = 10 + 10 + 10 + 1001.08061 1.08062 1.08063
The yield to worst is the lowest of these and occurs when the bond is held until maturity (i.e., it is the yield to maturity).
54
“Yield Measures, Spot Rates, and Forward Rates,” Frank J. Fabozzi, CFA 2012 Modular Level I, Vol. 5, pp. 563-564 Study Session 16-58-f Distinguish the relations among the nominal spread, the zero-volatility spread, the option-adjusted spread, and option cost. B is correct because for short-term securities, the difference between the nominal spread (which does not account for the shape of the yield curve) and the zero-volatility spread or Z-spread (the spread over the entire theoretical spot rate curve) is small. This difference grows with the maturity of the security and as the slope of the yield curve increases.
55
“Yield Measures, Spot Rates, and Forward Rates,” Frank J. Fabozzi, CFA 2012 Modular Level I, Vol. 5, pp. 570-572 Study Session 16-58-h Explain a forward rate and calculate spot rates from forward rates, forward rates from spot rates, and the value of a bond using forward rates. B is correct because z6 = [(1+z1) × (1+1f1) × (1+1f2) × (1+1f3) × (1+1f4) × (1+1f5)]1/6 – 1,which is then multiplied by 2 to convert to a bond-equivalent basis, where the forward rates are adjusted to a semi-annual basis and z1 = 1f0. Therefore, z6 = [1.0025 × 1.0035 × 1.0050 × 1.0075 × 1.0110 × 1.0150]0.166 – 1 = 0.0074 × 2 = 1.48%
56
“Introduction to the Measurement of Interest Rate Risk,” Frank J. Fabozzi, CFA 2012 Modular Level I, Vol. 5, pp. 608-612 Study Session 16-59-a Distinguish between the full valuation approach (the scenario analysis approach) and the duration/convexity approach for measuring interest rate risk, and explain the advantage of using the full valuation approach. A is correct because the full valuation approach allows modeling of the response to both parallel and non-parallel yield curve changes and will reflect cash flows that change when interest rates change, whereas the duration/convexity approach assumes parallel yield curve changes and fixed cash flows.
57
“Introduction to the Measurement of Interest Rate Risk,” Frank J. Fabozzi, CFA 2012 Modular Level I, Vol. 5, pp. 620-621 Study Session 16-59-d Calculate and interpret the effective duration of a bond, given information about how the bond’s price will increase and decrease for given changes in interest rates.B is correct because the effective duration of a bond is
D = V– – V+2 × V0 × Δywhere V–, V0, and V+ are the values of the bond when the yield falls, under the current yield, and when the yield rises, respectively, and ∆y is size of the yield change.
Therefore,
D = 94.474 – 91.041 = 3.092 × 92.733 × 0.0060
58
“Portfolio Risk and Return – Part II,” Vijay Singal 2012 Modular Level I, Vol. 4, p. 418 Study Session 12-45-g Calculate and interpret the expected return of an asset using the CAPM. B is correct. E(RGBK) = 0.03 + 0.65 × (0.09 – 0.03) = 0.069
59
“Portfolio Risk and Return – Part II,” Vijay Singal 2012 Modular Level I, Vol. 4, pp. 412-415 Study Session 12-45-d Explain return generating models (including the market model) and their uses. B is correct. A return generating model based on factors such as earnings growth and cash flow generation is a fundamental factor model.
60
“Portfolio Risk and Return – Part II,” Vijay Singal 2012 Modular Level I, Vol. 4, pp. 429-431 Study Session 12-45-h Describe and demonstrate applications of the CAPM and the SML. A is correct. Jensen’s alpha = Rp – [Rf + βp(Rm – Rf)] = 0.155 – [0.025 + 1.2 × (0.118 – 0.025)] = 0.0184