lab 1: network devices and technologies - capturing...
TRANSCRIPT

CompTIA Security+®
Lab Series
Lab 1: Network Devices and Technologies - Capturing Network Traffic
CompTIA Security+® Domain 1 - Network Security
Objective 1.1: Explain the security function and purpose of
network devices and technologies
Document Version: 2013-08-02
Organization: Moraine Valley Community College Author: Jesse Varsalone
Copyright © Center for Systems Security and Information Assurance (CSSIA), National Information Security, Geospatial Technologies Consortium (NISGTC) The original works of this document were funded by the National Science Foundation’s (NSF) Advanced Technological Education (ATE) program Department of Undergraduate Education (DUE) Award No. 0702872 and 1002746; Center for Systems Security and Information Assurance (CSSIA) at Moraine Valley Community College (MVCC).
This work has been adapted by The Department of Labor (DOL) Trade Adjustment Assistance Community College and Career Training (TAACCCT) Grant No. TC-22525-11-60-A-48. The National Information Security, Geospatial Technologies Consortium (NISGTC) is authorized to create derivatives of identified elements modified from the original works. These elements are licensed under the Creative Commons Attributions 3.0 Unported License. To view a copy
of this license, visit http://creativecommons.org/licenses/by/3.0/ or send a letter to Creative Commons, 444 Castro Street, Suite 900, Mountain View, California, 94041, USA. The Network Development Group (NDG) is given a perpetual worldwide waiver to distribute per US Law this lab and future derivatives of these works.

Lab 1: Network Devices and Technologies - Capturing Network Traffic
8/2/2013 Copyright © 2013 CSSIA, NISGTC Page 2 of 38
Contents
Introduction ........................................................................................................................ 3
Objective: Explain the security function and purpose of network devices and technologies ........................................................................................................................ 3
Pod Topology ...................................................................................................................... 5
Lab Settings ......................................................................................................................... 6
1 Using tcpdump to Capture Network Traffic .............................................................. 10
1.1 Using tcpdump ................................................................................................... 10
1.2 Conclusion .......................................................................................................... 22
1.3 Discussion Questions .......................................................................................... 22
2 Capturing and Analyzing Traffic with Wireshark ....................................................... 23
2.1 Using Wireshark ................................................................................................. 23
2.2 Conclusion .......................................................................................................... 31
2.3 Discussion Questions .......................................................................................... 31
3 Capturing and Analyzing Traffic with Network Miner ............................................... 32
3.1 Using Network Miner ......................................................................................... 32
3.2 Conclusion .......................................................................................................... 37
3.3 Discussion Questions .......................................................................................... 37
References ........................................................................................................................ 38
Lab 1: Network Devices and Technologies - Capturing Network Traffic
8/2/2013 Copyright © 2013 CSSIA, NISGTC Page 3 of 38
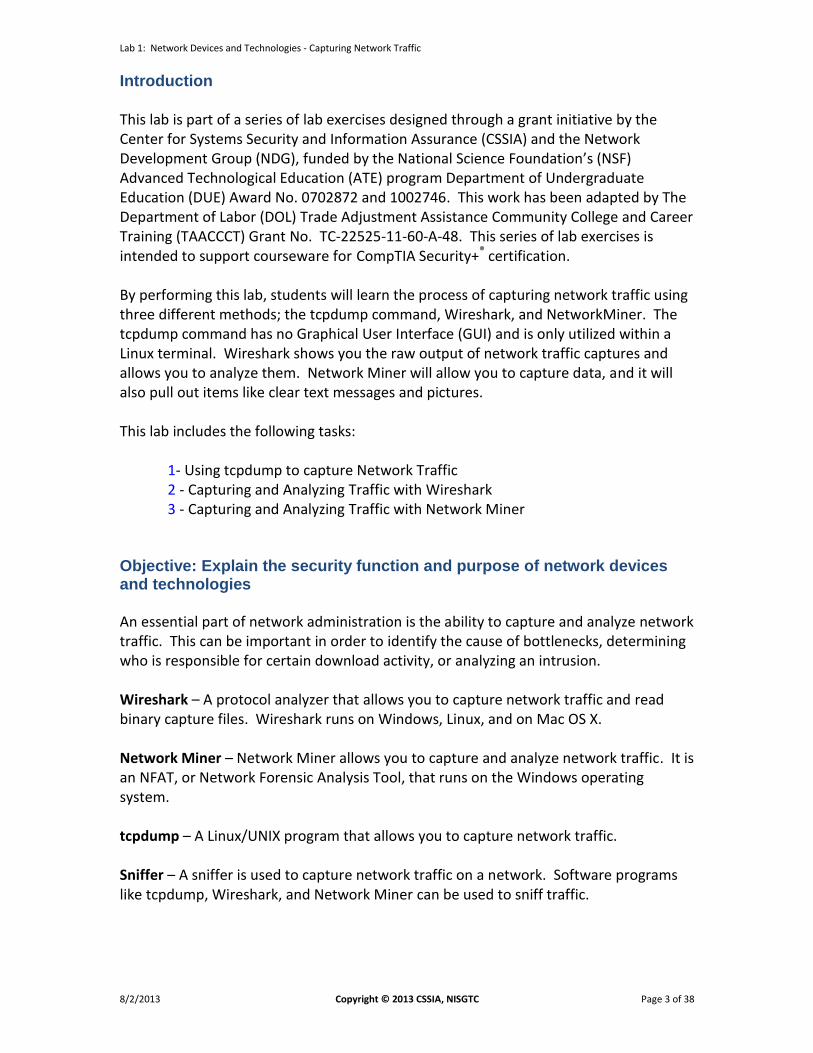
Introduction
This lab is part of a series of lab exercises designed through a grant initiative by the Center for Systems Security and Information Assurance (CSSIA) and the Network Development Group (NDG), funded by the National Science Foundation’s (NSF) Advanced Technological Education (ATE) program Department of Undergraduate Education (DUE) Award No. 0702872 and 1002746. This work has been adapted by The Department of Labor (DOL) Trade Adjustment Assistance Community College and Career Training (TAACCCT) Grant No. TC-22525-11-60-A-48. This series of lab exercises is intended to support courseware for CompTIA Security+® certification. By performing this lab, students will learn the process of capturing network traffic using three different methods; the tcpdump command, Wireshark, and NetworkMiner. The tcpdump command has no Graphical User Interface (GUI) and is only utilized within a Linux terminal. Wireshark shows you the raw output of network traffic captures and allows you to analyze them. Network Miner will allow you to capture data, and it will also pull out items like clear text messages and pictures. This lab includes the following tasks:
1- Using tcpdump to capture Network Traffic 2 - Capturing and Analyzing Traffic with Wireshark 3 - Capturing and Analyzing Traffic with Network Miner
Objective: Explain the security function and purpose of network devices and technologies
An essential part of network administration is the ability to capture and analyze network traffic. This can be important in order to identify the cause of bottlenecks, determining who is responsible for certain download activity, or analyzing an intrusion. Wireshark – A protocol analyzer that allows you to capture network traffic and read binary capture files. Wireshark runs on Windows, Linux, and on Mac OS X. Network Miner – Network Miner allows you to capture and analyze network traffic. It is an NFAT, or Network Forensic Analysis Tool, that runs on the Windows operating system. tcpdump – A Linux/UNIX program that allows you to capture network traffic. Sniffer – A sniffer is used to capture network traffic on a network. Software programs like tcpdump, Wireshark, and Network Miner can be used to sniff traffic.

Lab 1: Network Devices and Technologies - Capturing Network Traffic
8/2/2013 Copyright © 2013 CSSIA, NISGTC Page 4 of 38
PCAP File – Programs that can sniff network traffic such as tcpdump, Wireshark, and Network Miner allow you to save the network capture to a PCAP file format. In order to read the PCAP format, you need a tool like Wireshark or Network Miner.
Lab 1: Network Devices and Technologies - Capturing Network Traffic
8/2/2013 Copyright © 2013 CSSIA, NISGTC Page 5 of 38
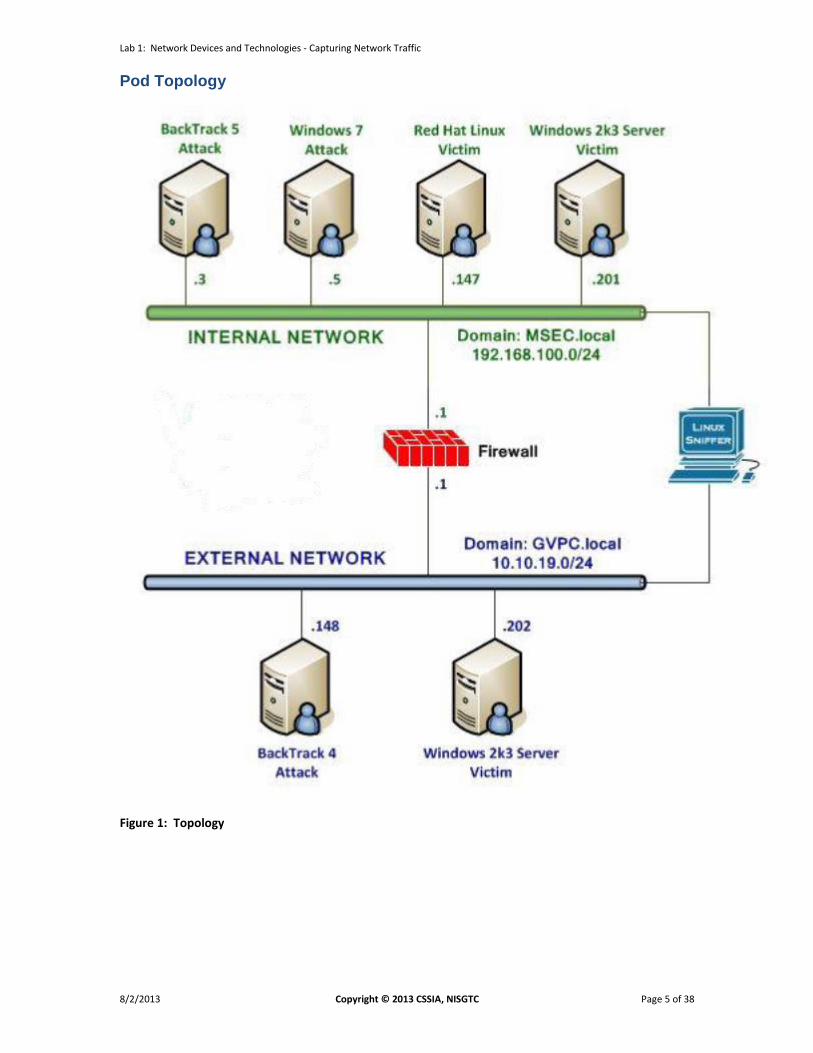
Pod Topology
Figure 1: Topology
Lab 1: Network Devices and Technologies - Capturing Network Traffic
8/2/2013 Copyright © 2013 CSSIA, NISGTC Page 6 of 38
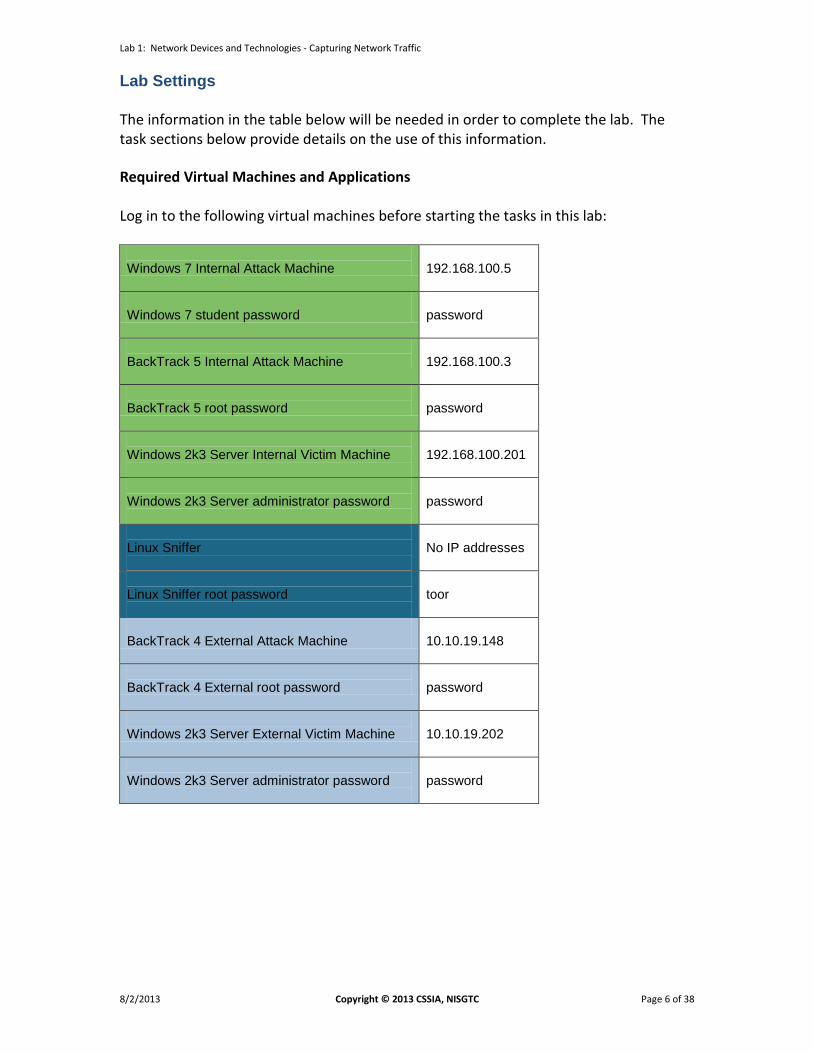
Lab Settings
The information in the table below will be needed in order to complete the lab. The task sections below provide details on the use of this information.
Required Virtual Machines and Applications Log in to the following virtual machines before starting the tasks in this lab: Windows 7 Internal Attack Machine
192.168.100.5
Windows 7 student password
password
BackTrack 5 Internal Attack Machine
192.168.100.3
BackTrack 5 root password
password
Windows 2k3 Server Internal Victim Machine
192.168.100.201
Windows 2k3 Server administrator password
password
Linux Sniffer
No IP addresses
Linux Sniffer root password
toor
BackTrack 4 External Attack Machine
10.10.19.148
BackTrack 4 External root password
password
Windows 2k3 Server External Victim Machine
10.10.19.202
Windows 2k3 Server administrator password
password

Lab 1: Network Devices and Technologies - Capturing Network Traffic
8/2/2013 Copyright © 2013 CSSIA, NISGTC Page 7 of 38
Windows 7 Internal Attack Login:
1. Click on the Windows 7 Internal Attack icon on the topology. 2. If required, enter the username, student (verify the username with your
instructor). 3. Type in the password, password, and press enter to log in (verify the password
with your instructor).
Figure 2: Windows 7 login
Linux Sniffer Login:
1. Click on the Linux Sniffer icon on the topology. 2. Type root at the bt login: username prompt and press enter. 3. At the password prompt, type toor and press enter.
For security purposes, the password will not be displayed.
4. To start the GUI, type startx at the root@bt:~# prompt and press enter.
Figure 3: Linux Sniffer login
BackTrack 5 Internal Attack Login:
1. Click on the BackTrack 5 Internal Attack icon on the topology. 2. Type root at the bt login: username prompt and press enter. 3. At the password prompt, type password and press enter.
Figure 4: BackTrack 5 login

Lab 1: Network Devices and Technologies - Capturing Network Traffic
8/2/2013 Copyright © 2013 CSSIA, NISGTC Page 8 of 38
For security purposes, the password will not be displayed.
4. To start the GUI, type startx at the root@bt:~# prompt and press enter.
Figure 5: BackTrack 5 GUI start up
Windows 2003 Server Login: (internal and external victim machines):
1. Click on the Windows2k3 Server Internal Victim icon on the topology 2. Use the PC menu in the NETLAB+ Remote PC Viewer to send a Ctrl-Alt-Del
(version 2 viewer), or click the Send Ctrl-Alt-Del link in the bottom right corner of the viewer window (version 1 viewer).
3. Enter the User name, Administrator (verify the username with your instructor). 4. Type in the password, password, and click the OK button (verify the password
with your instructor). 5. Repeat these steps to log into the Windows 2k3 Server External Victim.
Figure 6: Windows 2k3 login
BackTrack 4 External Attack Login:
1. Click on the BackTrack 4 External Attack icon on the topology. 2. Type root at the bt login: username prompt and press enter. 3. At the password prompt, type toor and press enter.
For security purposes, the password will not be displayed.
Lab 1: Network Devices and Technologies - Capturing Network Traffic
8/2/2013 Copyright © 2013 CSSIA, NISGTC Page 9 of 38
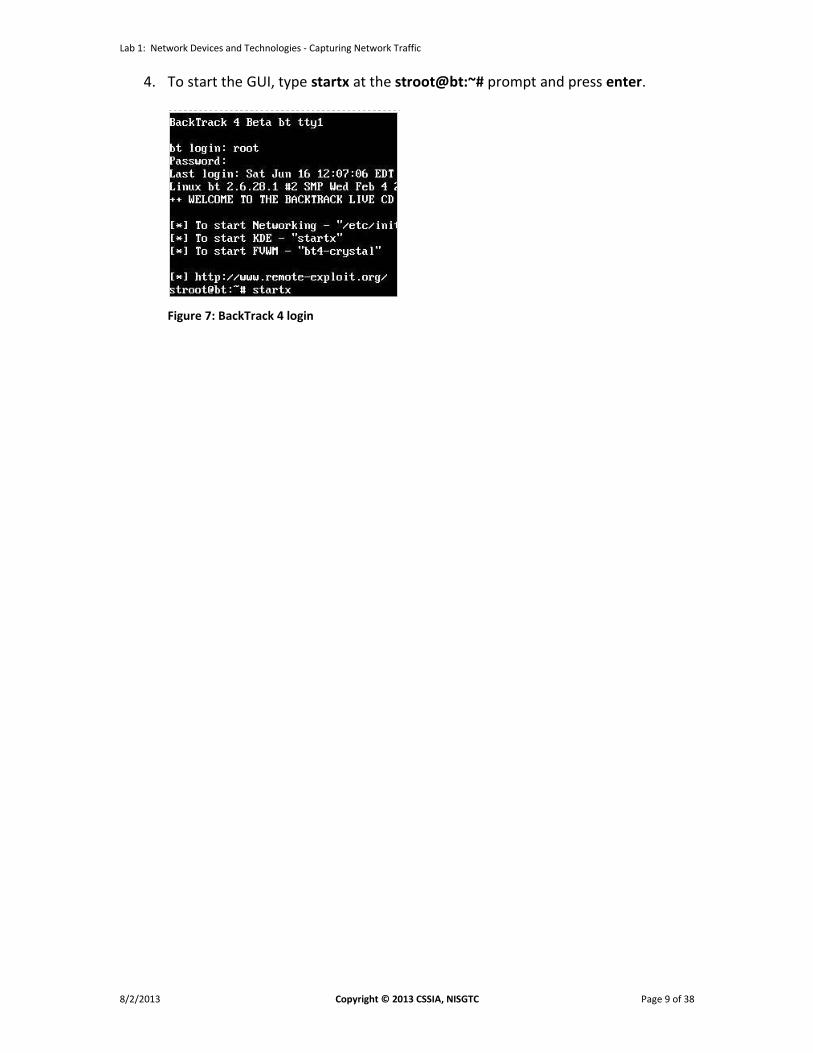
4. To start the GUI, type startx at the stroot@bt:~# prompt and press enter.
Figure 7: BackTrack 4 login

Lab 1: Network Devices and Technologies - Capturing Network Traffic
8/2/2013 Copyright © 2013 CSSIA, NISGTC Page 10 of 38
1 Using tcpdump to Capture Network Traffic
Part of a network administrator’s job can be to capture and analyze network traffic. This is done for a variety of reasons, including the identification of the cause of bottlenecks, determining who is responsible for certain download activity, or analyzing an intrusion. There are many tools that can be utilized to capture network traffic, including tcpdump.
Keep in mind that Linux commands are case sensitive. The commands below must be entered exactly as shown.
1.1 Using tcpdump
The Linux distribution BackTrack is installed on the sniffer. BackTrack is a distribution used by security professionals for penetration testing and forensics. Log on to the Linux Sniffer
If you have already logged into the Linux Sniffer as described in the Lab Settings section, skip this first step and begin this task at Step 2.
1. Log into the Linux Sniffer with the username of root with the password of toor.
For security purposes, the password will not be displayed.
Type the following command to initialize the GUI (Graphical User Interface):
root@bt:~#startx
Figure 8: Logging on to the Sniffer
2. Open a terminal on the Linux Sniffer system by clicking on the image to the left
of Firefox in the task bar, in the bottom of the screen.

Lab 1: Network Devices and Technologies - Capturing Network Traffic
8/2/2013 Copyright © 2013 CSSIA, NISGTC Page 11 of 38
Figure 9: The Terminal Windows within BackTrack
One of the nice features of some versions of BackTrack is that they are not automatically assigned IP addresses through the use of DHCP, or Dynamic Host Configuration Protocol. This is because the interfaces are not active – they must be manually enabled. The idea is to come on the network quietly without being detected.
3. Only the loopback address, 127.0.0.1, is displayed when you type: root@bt:~#ifconfig
Figure 10: No IP address, other than the Loopback Address of 127.0.0.1, is Displayed
4. Type the following command to view all available interfaces on the system:
root@bt:~#ifconfig -a

Lab 1: Network Devices and Technologies - Capturing Network Traffic
8/2/2013 Copyright © 2013 CSSIA, NISGTC Page 12 of 38
Figure 11: All Available Interfaces on the System
Neither of the interfaces, eth0 or eth1, are assigned IP addresses on their respective networks. The reason the sniffer has two interfaces is that it is located on two networks.
The pfSense Firewall also has 2 interfaces and is also connected to both networks.
Figure 12: The Sniffer is Connected to Two Networks
Lab 1: Network Devices and Technologies - Capturing Network Traffic
8/2/2013 Copyright © 2013 CSSIA, NISGTC Page 13 of 38
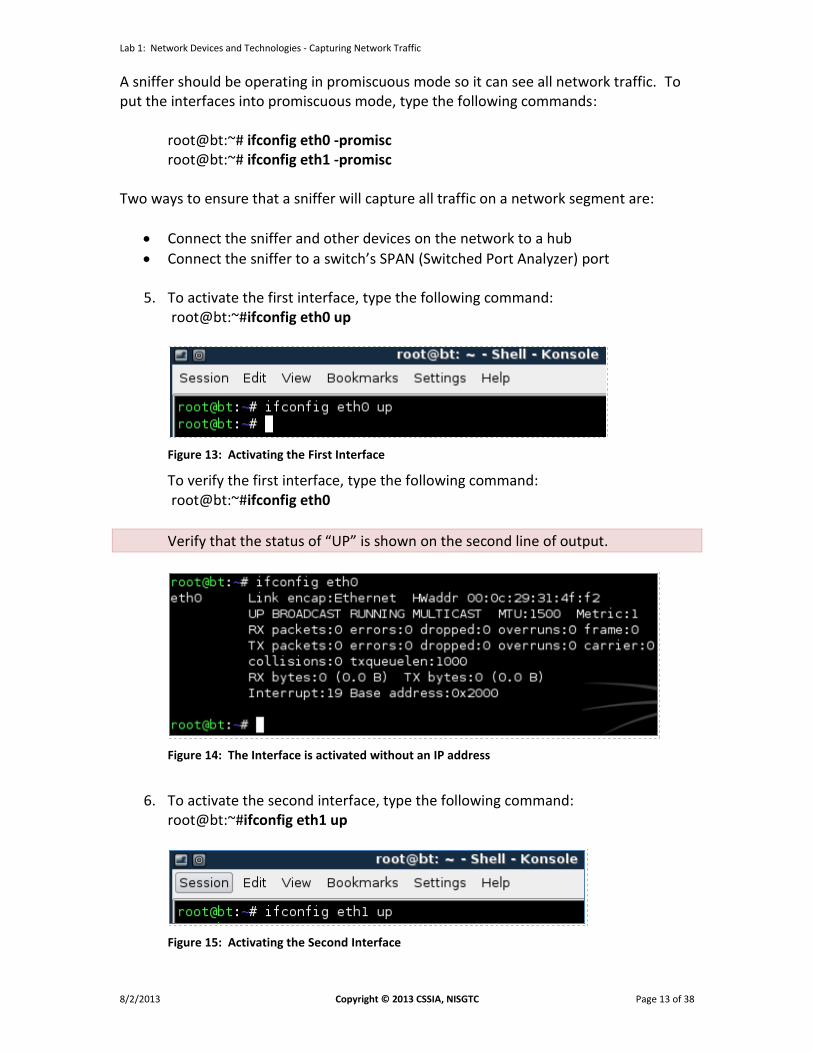
A sniffer should be operating in promiscuous mode so it can see all network traffic. To put the interfaces into promiscuous mode, type the following commands: root@bt:~# ifconfig eth0 -promisc root@bt:~# ifconfig eth1 -promisc Two ways to ensure that a sniffer will capture all traffic on a network segment are:
Connect the sniffer and other devices on the network to a hub
Connect the sniffer to a switch’s SPAN (Switched Port Analyzer) port
5. To activate the first interface, type the following command: root@bt:~#ifconfig eth0 up
Figure 13: Activating the First Interface
To verify the first interface, type the following command: root@bt:~#ifconfig eth0
Verify that the status of “UP” is shown on the second line of output.
Figure 14: The Interface is activated without an IP address
6. To activate the second interface, type the following command:
root@bt:~#ifconfig eth1 up
Figure 15: Activating the Second Interface

Lab 1: Network Devices and Technologies - Capturing Network Traffic
8/2/2013 Copyright © 2013 CSSIA, NISGTC Page 14 of 38
7. To verify the second interface, type the following command: root@bt:~#ifconfig eth1
Verify that the status of “UP” is shown on the second line of output.
Figure 16: The Interface is activated without an IP address
The Linux/UNIX utility, tcpdump, is commonly used by network administrators to capture network traffic on a sniffer. Many sniffer machines do not have GUI, or Graphical User Interfaces, so running GUI-based tools like Wireshark or Network Miner is not possible. Another benefit to using tcpdump is that it handles very large capture files well.
8. Type the following command to view several available switches for tcpdump: root@bt:~#tcpdump --help
Figure 17: The Available Options for tcpdump
Lab 1: Network Devices and Technologies - Capturing Network Traffic
8/2/2013 Copyright © 2013 CSSIA, NISGTC Page 15 of 38
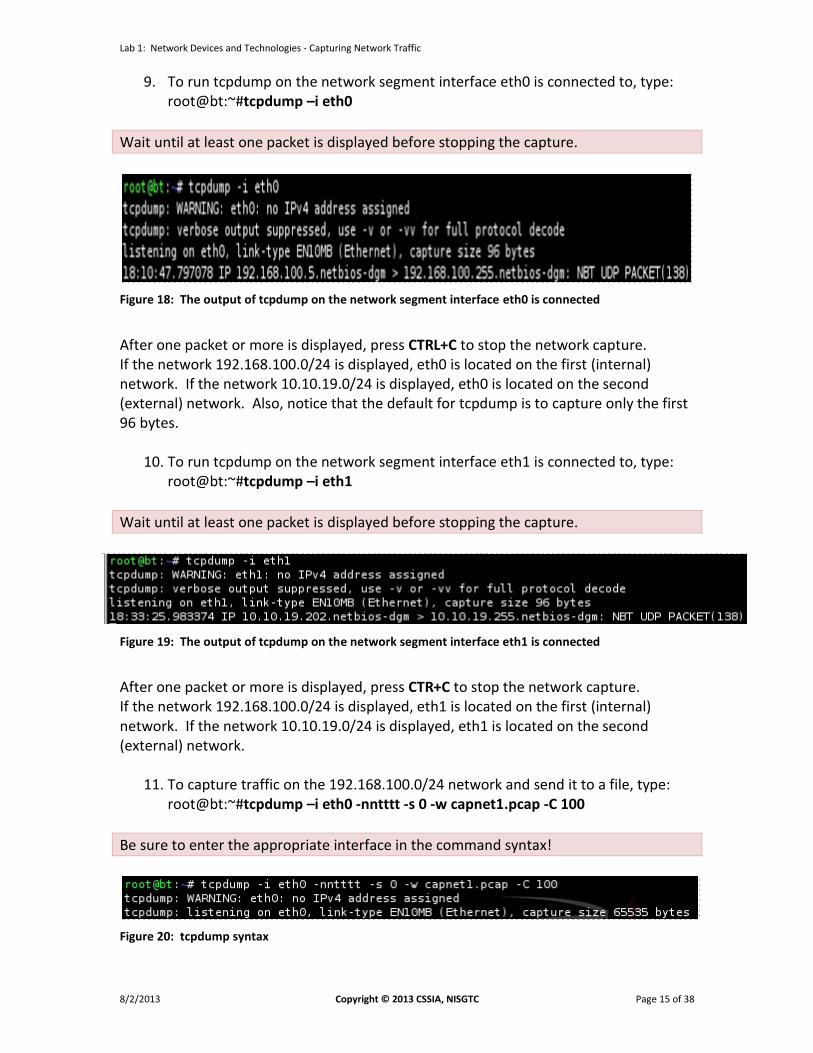
9. To run tcpdump on the network segment interface eth0 is connected to, type: root@bt:~#tcpdump –i eth0
Wait until at least one packet is displayed before stopping the capture.
Figure 18: The output of tcpdump on the network segment interface eth0 is connected
After one packet or more is displayed, press CTRL+C to stop the network capture. If the network 192.168.100.0/24 is displayed, eth0 is located on the first (internal) network. If the network 10.10.19.0/24 is displayed, eth0 is located on the second (external) network. Also, notice that the default for tcpdump is to capture only the first 96 bytes.
10. To run tcpdump on the network segment interface eth1 is connected to, type: root@bt:~#tcpdump –i eth1
Wait until at least one packet is displayed before stopping the capture.
Figure 19: The output of tcpdump on the network segment interface eth1 is connected
After one packet or more is displayed, press CTR+C to stop the network capture. If the network 192.168.100.0/24 is displayed, eth1 is located on the first (internal) network. If the network 10.10.19.0/24 is displayed, eth1 is located on the second (external) network.
11. To capture traffic on the 192.168.100.0/24 network and send it to a file, type: root@bt:~#tcpdump –i eth0 -nntttt -s 0 -w capnet1.pcap -C 100
Be sure to enter the appropriate interface in the command syntax!
Figure 20: tcpdump syntax

Lab 1: Network Devices and Technologies - Capturing Network Traffic
8/2/2013 Copyright © 2013 CSSIA, NISGTC Page 16 of 38
The following table lists details of the switches used with the tcpdump command:
Be aware that Linux commands are case sensitive. The commands below must be entered exactly as shown.
-i eth0 Use interface zero
-nntttt
Disable DNS resolution, date and time format
-s 0
Disables default packet size of 96 bytes, full packet size
-w
Write to a capture file, instead of displaying to the screen
-C
Split the captures into files of this size
Figure 21: Detailed tcpdump Syntax Explained
Wait about 5 minutes so that your capture file will have some generated traffic. Press CTRL-C to stop tcpdump from running and discontinue the network capture.
12. To view the capture file, type the following command at the BackTrack terminal: root@bt:~#wireshark capnet1.pcap
Figure 22: Opening the tcpdump capture with Wireshark

Lab 1: Network Devices and Technologies - Capturing Network Traffic
8/2/2013 Copyright © 2013 CSSIA, NISGTC Page 17 of 38
13. Check the Don’t show the message again box and click the OK button.
Figure 23: Opening the tcpdump capture with Wireshark
Wireshark will open and the capture file will appear, similar to the one seen below: Notice that the traffic listed takes place on the 192.168.100.0/24 network.
Figure 24: The tcpdump Capture is Displayed within Wireshark
14. Close Wireshark. 15. To capture traffic on the 10.10.19.0/24 network and send it to a file, type:
root@bt:~#tcpdump –i eth1 -nntttt -s 0 -w capnet2.pcap -C 100
Figure 25: tcpdump syntax
Wait about 5 minutes so that your capture file will have some generated traffic. Press CTRL+C to stop tcpdump from running and discontinue the network capture.

Lab 1: Network Devices and Technologies - Capturing Network Traffic
8/2/2013 Copyright © 2013 CSSIA, NISGTC Page 18 of 38
16. To view the capture file, type the following command at the BackTrack terminal: root@bt:~#wireshark capnet2.pcap
Figure 26: Opening the tcpdump capture with Wireshark
Wireshark will open and the capture file will appear similar to the one seen below: Notice that the traffic listed takes place on the 10.10.19.0/24 network. Exit Wireshark when finished by clicking the “X” in the upper right corner of the screen..
Figure 27: The tcpdump Capture is Displayed within Wireshark
You can also filter which type of traffic you want to see with tcpdump. For example, if you just want to see ICMP traffic, you can filter tcpdump for that type of traffic.
If you have already logged into the machine, as described in the Lab Settings section, you may skip this step.

Lab 1: Network Devices and Technologies - Capturing Network Traffic
8/2/2013 Copyright © 2013 CSSIA, NISGTC Page 19 of 38
17. Log on to the Windows 2k3 Server Internal Victim Machine. Use the PC menu in the NETLAB+ Remote PC Viewer to send a Ctrl-Alt-Del (version 2 viewer), or click the Send Ctrl-Alt-Del link in the bottom right corner of the viewer window (version 1 viewer). Log on with the username of Administrator and the password of password.
Figure 28: Send Ctrl-Alt-Del to the Windows 2003 Server
18. Double-click the shortcut to the command prompt icon on the Windows 2003
Desktop.
Figure 29: Windows 2003 Command Prompt
19. Type the following command to initiate a continuous ping of the gateway:
C:\ping 192.168.100.1 –t
Figure 30: Pinging the Gateway

Lab 1: Network Devices and Technologies - Capturing Network Traffic
8/2/2013 Copyright © 2013 CSSIA, NISGTC Page 20 of 38
20. On the Linux Sniffer, type the following to capture ICMP traffic on the first (Internal) network:
root@bt:~#tcpdump –i eth0 icmp
Figure 31: Capturing ICMP Traffic with tcpdump
Notice, in the figure above, that the output of the traffic includes the source address followed by the destination address. For each echo request, there is a reply. Press CTRL-C to stop tcpdump from running and discontinue the network capture. On the Windows 2003 Server system, type CTRL-C to stop the continuous ping.
If you have already logged into the machine, as described in the Lab Settings section, you may skip this step.
21. On the Windows 2k3 Server Internal Victim Machine, type the following
command to continuously ping the BackTrack 4 External Attack VM: C:\ping 10.10.19.148 –t
Figure 32: Pinging the External BackTrack Machine

Lab 1: Network Devices and Technologies - Capturing Network Traffic
8/2/2013 Copyright © 2013 CSSIA, NISGTC Page 21 of 38
22. On the Linux Sniffer, type the following to capture ICMP traffic on Network 2: root@bt:~#tcpdump –i eth1 icmp
Figure 33: Capturing ICMP Traffic with tcpdump
23. Press CTRL-C to stop tcpdump from running and discontinue the network
capture. 24. In the Windows 2003 Server system, press CTRL-C to stop the continuous ping.

Lab 1: Network Devices and Technologies - Capturing Network Traffic
8/2/2013 Copyright © 2013 CSSIA, NISGTC Page 22 of 38
1.2 Conclusion
The tcpdump command is built into the Linux and Unix operating systems. It can be used to capture network traffic. The benefits of using tcpdump include the fact that many sniffer machines do not have GUIs, or Graphical User Interfaces, so running GUI based tools like Wireshark is not possible. Another benefit to using tcpdump is that it handles very large capture files with no problem, and it allows you to filter for specific traffic.
1.3 Discussion Questions
1. Does a network interface on a sniffer machine require an IP address? 2. In what mode does a sniffer’s network interface operate? 3. How do you determine available switches for tcpdump? 4. How can you display all of the network interfaces in Linux?

Lab 1: Network Devices and Technologies - Capturing Network Traffic
8/2/2013 Copyright © 2013 CSSIA, NISGTC Page 23 of 38
2 Capturing and Analyzing Traffic with Wireshark
Wireshark is a GUI, or Graphical User Interface, tool that will allow you to capture and analyze network traffic. Wireshark runs on Windows, Linux, and Mac OS X. Wireshark can be downloaded from the following link: http://www.wireshark.org/download.html. 2.1 Using Wireshark
Before using Wireshark, it is important to bring the sniffer interfaces up. Even though this was done in Task 1, it is a good idea to start over to practice all of the required steps.
1. On the Linux Sniffer system, bring both of the sniffer interfaces up by typing the following two commands:
root@bt:~#ifconfig eth0 up root@bt:~#ifconfig eth1 up
Figure 34: Turning both Sniffer Interfaces on
2. Type the following to verify that no IP address has been set for either interface:
root@bt:~#ifconfig
Verify that the status of “UP” is shown on the second line of output.
Figure 35: Verifying that the Sniffer Interfaces do not have IP addresses
Lab 1: Network Devices and Technologies - Capturing Network Traffic
8/2/2013 Copyright © 2013 CSSIA, NISGTC Page 24 of 38
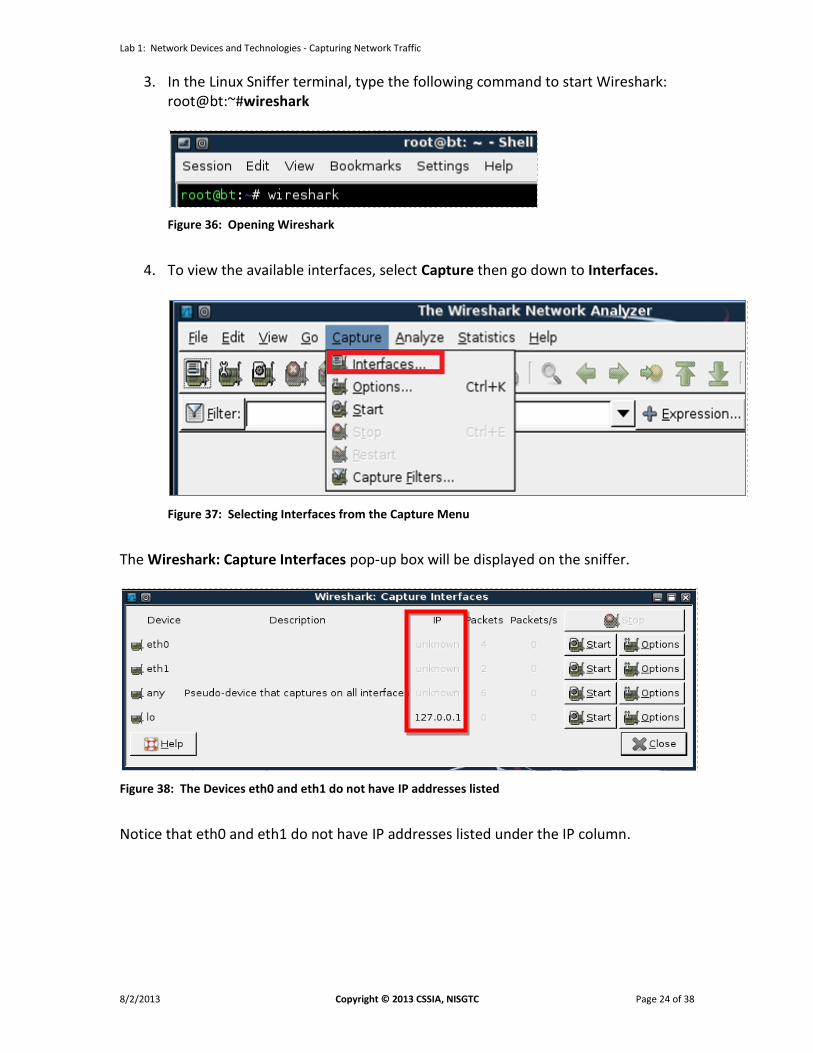
3. In the Linux Sniffer terminal, type the following command to start Wireshark: root@bt:~#wireshark
Figure 36: Opening Wireshark
4. To view the available interfaces, select Capture then go down to Interfaces.
Figure 37: Selecting Interfaces from the Capture Menu
The Wireshark: Capture Interfaces pop-up box will be displayed on the sniffer.
Figure 38: The Devices eth0 and eth1 do not have IP addresses listed
Notice that eth0 and eth1 do not have IP addresses listed under the IP column.
Lab 1: Network Devices and Technologies - Capturing Network Traffic
8/2/2013 Copyright © 2013 CSSIA, NISGTC Page 25 of 38
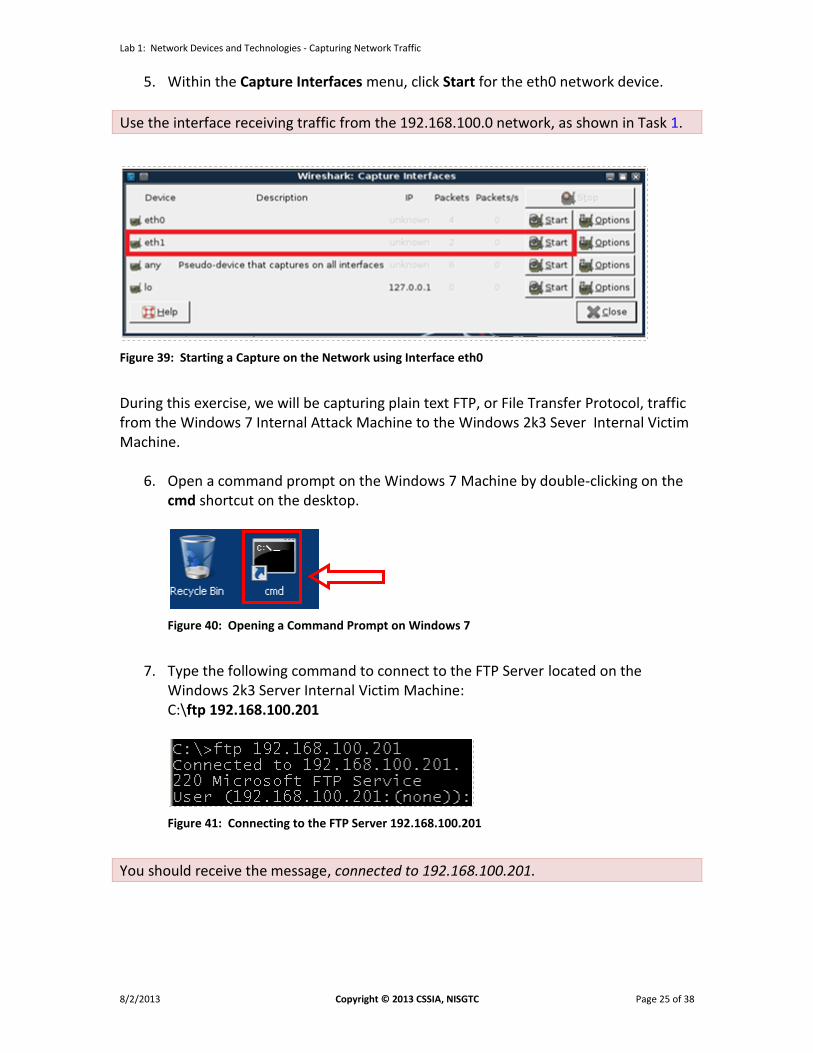
5. Within the Capture Interfaces menu, click Start for the eth0 network device.
Use the interface receiving traffic from the 192.168.100.0 network, as shown in Task 1.
Figure 39: Starting a Capture on the Network using Interface eth0
During this exercise, we will be capturing plain text FTP, or File Transfer Protocol, traffic from the Windows 7 Internal Attack Machine to the Windows 2k3 Sever Internal Victim Machine.
6. Open a command prompt on the Windows 7 Machine by double-clicking on the cmd shortcut on the desktop.
Figure 40: Opening a Command Prompt on Windows 7
7. Type the following command to connect to the FTP Server located on the
Windows 2k3 Server Internal Victim Machine: C:\ftp 192.168.100.201
Figure 41: Connecting to the FTP Server 192.168.100.201
You should receive the message, connected to 192.168.100.201.

Lab 1: Network Devices and Technologies - Capturing Network Traffic
8/2/2013 Copyright © 2013 CSSIA, NISGTC Page 26 of 38
8. For the username, type ftp and press enter. For the password, type mysecurepass and press enter.
For security purposes, the password will not be displayed when you type it
Figure 42: Logging in to the FTP Server
You should receive the message, 230 Anonymous user logged in.
9. On the Linux Sniffer, click the stop button on Wireshark to stop the capture.
Figure 43: Stopping the Wireshark capture
10. On the Linux Sniffer, type ftp in the filter pane and click Apply.
Figure 44: Typing ftp in the Wireshark filter pane
Lab 1: Network Devices and Technologies - Capturing Network Traffic
8/2/2013 Copyright © 2013 CSSIA, NISGTC Page 27 of 38
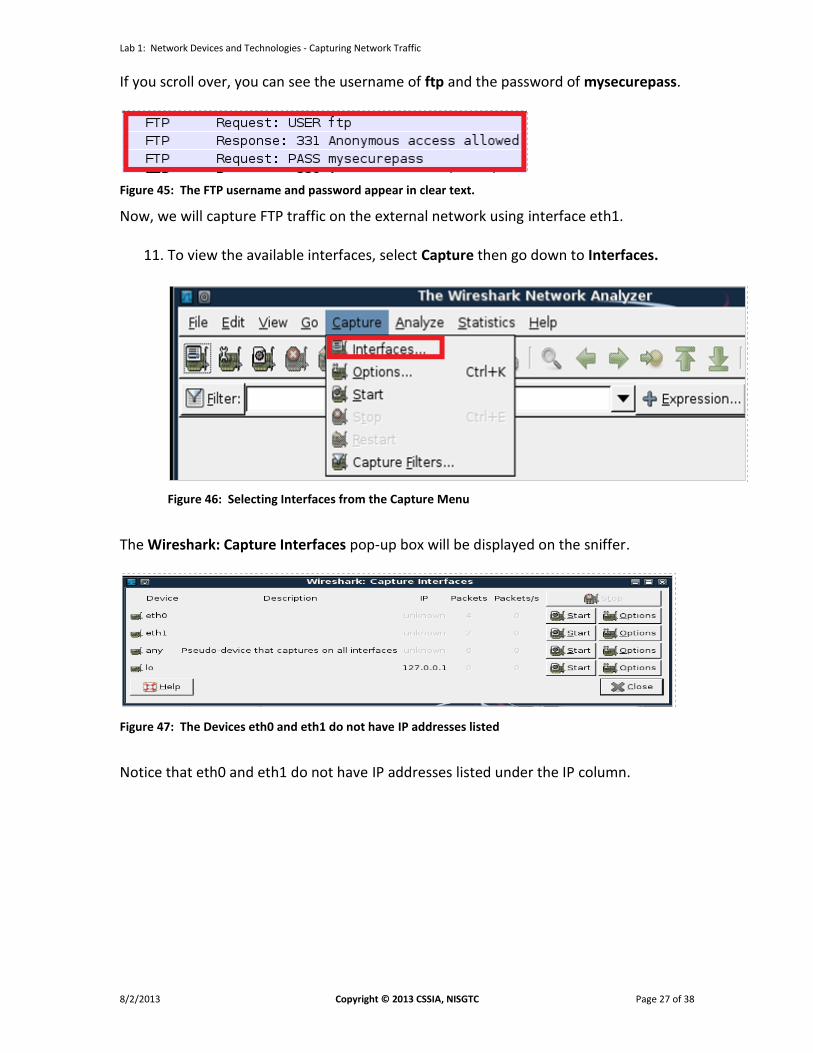
If you scroll over, you can see the username of ftp and the password of mysecurepass.
Figure 45: The FTP username and password appear in clear text.
Now, we will capture FTP traffic on the external network using interface eth1.
11. To view the available interfaces, select Capture then go down to Interfaces.
Figure 46: Selecting Interfaces from the Capture Menu
The Wireshark: Capture Interfaces pop-up box will be displayed on the sniffer.
Figure 47: The Devices eth0 and eth1 do not have IP addresses listed
Notice that eth0 and eth1 do not have IP addresses listed under the IP column.

Lab 1: Network Devices and Technologies - Capturing Network Traffic
8/2/2013 Copyright © 2013 CSSIA, NISGTC Page 28 of 38
12. Within the Capture Interfaces menu, click Start for the eth1 network device.
Use the interface receiving traffic from the 192.168.100.0 network, as shown in Task 1.
Figure 48: Starting a Capture on the Network using Interface eth1
During this exercise, we will be capturing plain text FTP, or File Transfer Protocol, traffic from the BackTrack 4 External Attack Machine to the Windows 2k3 Server External Victim Machine.
13. Click Continue without Saving if you receive a warning message.
Figure 49: Continue Without Saving
14. In the Windows 7 Internal Attack Machine’s command prompt window, type the
command bye to exit the ftp connection. 15. Log into the BackTrack 4 External Attack Machine with the username of root and
the password of password. For security purposes, the password won't be displayed.

Lab 1: Network Devices and Technologies - Capturing Network Traffic
8/2/2013 Copyright © 2013 CSSIA, NISGTC Page 29 of 38
16. Type the following command to initialize the GUI, Graphical User Interface: root@bt:~#startx
Figure 50: Logging on to the External BackTrack Machine
17. Open a terminal on the Backtrack 4 External Attack system by clicking on the
image to the left of Firefox in the task bar, in the bottom of the screen.
Figure 51: The BackTrack Terminal
18. Type the following command to connect to the FTP Server located on the
Windows 2k3 Server External Victim Machine: root@bt:~#ftp 10.10.19.202
Figure 52: Connecting to the FTP Server 192.168.100.201
You should receive the message, Connected to 10.10.19.202.
Lab 1: Network Devices and Technologies - Capturing Network Traffic
8/2/2013 Copyright © 2013 CSSIA, NISGTC Page 30 of 38
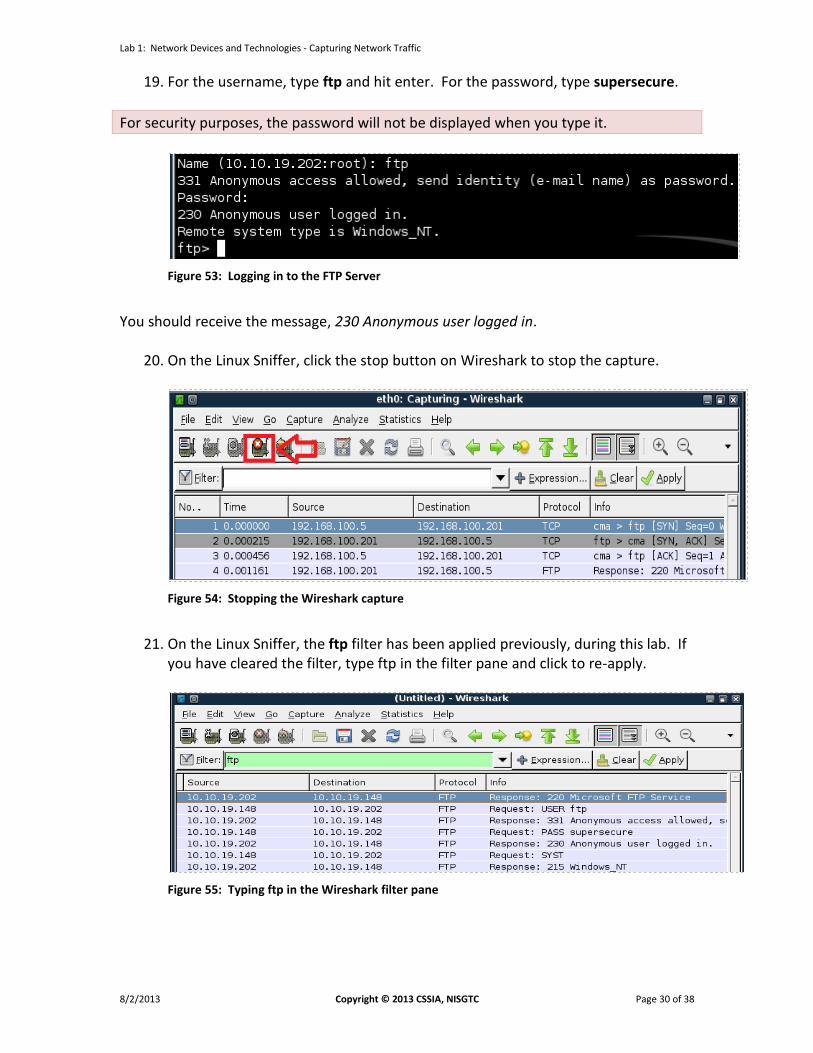
19. For the username, type ftp and hit enter. For the password, type supersecure.
For security purposes, the password will not be displayed when you type it.
Figure 53: Logging in to the FTP Server
You should receive the message, 230 Anonymous user logged in.
20. On the Linux Sniffer, click the stop button on Wireshark to stop the capture.
Figure 54: Stopping the Wireshark capture
21. On the Linux Sniffer, the ftp filter has been applied previously, during this lab. If
you have cleared the filter, type ftp in the filter pane and click to re-apply.
Figure 55: Typing ftp in the Wireshark filter pane

Lab 1: Network Devices and Technologies - Capturing Network Traffic
8/2/2013 Copyright © 2013 CSSIA, NISGTC Page 31 of 38
If you scroll over, you will see the username of ftp and the password of supersecure.
Figure 56: The FTP username and password appear in clear text.
22. Exit Wireshark. In the BackTrack 4 External Attack terminal, type the command
bye to exit the ftp connection. 2.2 Conclusion
Wireshark is a GUI, or Graphical User Interface, tool that will allow you to capture and analyze network traffic. Wireshark runs on Windows, Linux, and Mac OS X. Wireshark can be used to capture network traffic on an interface on the sniffer without an IP address. The Wireshark filter pane can be used to filter for various types of traffic. 2.3 Discussion Questions
1. Do FTP usernames and passwords appear in clear text? 2. How do you choose the interface to capture on within Wireshark? 3. How do you filter for a certain protocol within the Wireshark program? 4. How do you open the Wireshark program from the terminal in Linux?

Lab 1: Network Devices and Technologies - Capturing Network Traffic
8/2/2013 Copyright © 2013 CSSIA, NISGTC Page 32 of 38
3 Capturing and Analyzing Traffic with Network Miner
Network Miner is an NFAT, or Network Forensics Analysis Tool, that runs on Windows operating systems. The tcpdump command has no Graphical User Interface and is only utilized within a Linux terminal. Wireshark shows you the raw output of network traffic captures and allows you to analyze them. Network Miner will allow you to capture data, and it will also pull out items like clear text messages and pictures. 3.1 Using Network Miner
Open Network Miner
1. Open Network Miner on the Windows 7 Internal Attack Machine by double-clicking on the desktop shortcut.
Figure 57: Opening Network Miner
2. Click the arrow to the right of the words Select a network adapter in the list and
select: Socket: Intel® PRO/1000MT Network Connection(192.168.100.5)
Figure 58: Selecting the Appropriate Interface

Lab 1: Network Devices and Technologies - Capturing Network Traffic
8/2/2013 Copyright © 2013 CSSIA, NISGTC Page 33 of 38
Verify that the correct Interface has now been selected within Network Miner.
Figure 59: The Correct Interface has been selected within Network Miner
3. Click the Start button, located on the right, to start a network capture.
Figure 60: Staring the Capture
4. Click on the Internet Explorer Icon in the Windows Taskbar.
Figure 61: Opening Internet Explorer
Internet Explorer should open to a Blank Page with about:blank in the URL bar.
Figure 62: A Blank Page in Internet Explorer

Lab 1: Network Devices and Technologies - Capturing Network Traffic
8/2/2013 Copyright © 2013 CSSIA, NISGTC Page 34 of 38
5. In the URL bar, type the following to connect to the Windows 2k3 Server Internal Victim Machine’s Web Page:http://192.168.100.201/
Figure 63: The Windows 2003 Web Page
You should see the msec.local's Test Page.
6. In the URL bar, type the following to connect to the Red Hat Enterprise Linux (RHEL) Web Page:
http://192.168.100.147/
Figure 64: The RHEL Web Site
You should see the Red Had Enterprise Linux Test Page.
7. Click on the Stop button to end the Network Miner capture.
Figure 65: Files within the Network Capture

Lab 1: Network Devices and Technologies - Capturing Network Traffic
8/2/2013 Copyright © 2013 CSSIA, NISGTC Page 35 of 38
8. Click on the Files tab within the Network Miner Program.
Figure 66: Files within the Network Capture
9. Right click on the first index.html file and select open file.
Figure 67: The index.html file saved within the Network Capture
You should see msec.local's Test Page.
Figure 68: Opening a Local Copy of the Index.html file

Lab 1: Network Devices and Technologies - Capturing Network Traffic
8/2/2013 Copyright © 2013 CSSIA, NISGTC Page 36 of 38
10. Right click on the second index.html file and select open file.
Figure 69: The index.html file saved within the Network Capture
You should see the Red Hat Enterprise Linux Test Page.
Figure 70: Opening a Local Copy of the Index.html file
11. Click on the Images tab within the Network Miner Program.
Figure 74: Images within the Network Capture
You should see the images captured from the web pages visited during the capture.

Lab 1: Network Devices and Technologies - Capturing Network Traffic
8/2/2013 Copyright © 2013 CSSIA, NISGTC Page 37 of 38
3.2 Conclusion
Network Miner is an NFAT, or Network Forensics Analysis Tool, that runs on Windows operating systems. Network Miner will allow you to capture data and will also pull out items like clear text messages, pictures, and web pages from visited sites. 3.3 Discussion Questions
1. What kind of tool is Network Miner? 2. On what operating systems will the Network Miner program run? 3. How do you parse out web pages of visited sites in Network Miner? 4. What needs to be configured within Network Miner prior to capturing data?

Lab 1: Network Devices and Technologies - Capturing Network Traffic
8/2/2013 Copyright © 2013 CSSIA, NISGTC Page 38 of 38
References
1. Wireshark:
http://www.wireshark.org/
2. Network Miner: http://www.netresec.com/?page=NetworkMiner
3. Man Page of tcpdump: http://www.tcpdump.org/tcpdump_man.html
4. Wireshark Download: http://www.wireshark.org/download.html
5. Network Miner Download:
http://sourceforge.net/projects/networkminer/files/latest/download