lab 3: spectroscopy - university of...
TRANSCRIPT

GEOL104: Exploring the Planets
1
LAB 3: SPECTROSCOPY OBJECTIVES: I. Review the basics of spectroscopy, including how to identify different materials on
the basis of spectra. II. Develop an understanding of general spectroscopic features of rocks and minerals. III. Learn how to identify specific rocks and minerals in the visible and near-infrared
wavelength range. IV. Strengthen rock and mineral hand sample identification skills. MATERIALS: Ocean Optics laboratory spectrometer, light source, laboratory stand, clamps, calibration sheet, various rock and mineral samples, white paper, paint samples, colored pencils SAFETY WARNING: The light sources used in this lab quickly become VERY HOT. Make sure to always be aware of your proximity to the light source at all times. ALSO, absolutely NO LIQUID OR FOOD is allowed near the spectroscopy materials to prevent incidents with the ELECTRICAL OUTLETS of the extension cords. Please help to make sure there are no INJURIES during this lab. BACKGROUND: Your lab instructor will review the following topics: What is a spectrum? How do colors relate to spectra? Why do different materials have different spectra? How can we identify rocks and minerals on the basis of spectra?
Spectroscopy is the study of the interaction between radiation and an object, as a function of wavelength. A spectrum is a 2-dimensonal plot of the intensity of radiation from an object vs. its wavelength. [Note the word ‘spectrum’ is singular, and ‘spectra’ is plural]. The radiation that is emitted from an object is modified by its compositional properties. The emitted radiation of a rock is controlled by its chemical makeup (the atoms and bonds within its minerals). Since the spectrum of a rock will change based on variations in rock chemistry, this is one way we can identify different rock compositions on the basis of spectra. In the visible wavelength region, the chemistry of an object is reflected in its color. This color strongly controls the shape of its spectra, as we will see later in lab. INTRODUCTION: A trained geologist can gather diagnostic information just by looking at the color, texture, density, and other physical properties. In fact, we did this in Lab 2 with different minerals and rocks. A typical human eye will respond to wavelengths from about 380 to 750 nm (the ‘visible’ portion of the wavelength spectrum). In this lab, you will use a portable reflectance spectrometer to extend your “vision” to a slightly longer wavelength range. The Ocean Optics spectrometer wavelength range is 450-1000 nm, or equivalently, 0.45-1.00 µm (see table below). Then, we will look at the reflectance spectra of minerals out to even longer wavelengths into the near-infrared.
GEOL104: Exploring the Planets
2
Useful Wavelength Units Converting nanometers to meters: 1 nm = 1x10⁻⁹ m Converting microns to meters: 1 µm = 1x10⁻⁶ m Converting microns to nanometers: 1 µm = 1000 nm CALIBRATION:
We want to examine the spectra of light reflected from color samples and similarly colored minerals. Incoming light (in this case from lamps) has its own spectrum; we are going to take a measurement of the lamp spectrum so the software can remove it from our measurements. After calibration, the spectra should only be from light reflected off the samples.
1. Set up lamp on the stand (~5-10 cm above base of the stand). 2. Turn the computer. 3. Log-on (username: EPS password: Quartz), 4. Plug the spectrometer in to the computer BEFORE the next step. 5. Open SpectraSuite software: FinderèApplicationsèSpectraSuite (rainbow
icon). Select “R” for reflectance! 6. Collect a dark spectrum with the cap on the spectrometer cable (click black light
bulb icon). 7. Classroom florescent lights need to be turned off before next step. 8. Collect a reference spectrum of the lamp light shining onto a white paper (click
yellow light bulb icon). 9. After you store the reference spectra, your light intensity (y-axis) should be
around 1 across the entire plot, because a number divided by itself equals one.
Your spectrometer is now calibrated!

GEOL104: Exploring the Planets
3
Malachite
Olivine
Galena
Chlorite
Sulfur
Fluorite
Figure 1
Figure 2

GEOL104: Exploring the Planets
4
We’ve taken spectra from both an area rich in clay (“On Clay,” signified in red) and an area with little or no clay (“Off Clay,” signified in green). Here we have them plotted together on the same graph. Note that they both have a similar overall slope, but that the “Off Clay” spectrum is more “bland” with no distinct absorption features.
Figure 3
Figure 4

GEOL104: Exploring the Planets
5
In order to enhance the signature in the “On Clay” spectrum, as planetary spectroscopists often do, we will divide the “On Clay” spectrum by the “Off Clay” (or bland) spectrum. This is done by dividing the reflectance value of every point in the “On Clay” spectrum by the reflectance of the “Off Clay” spectrum at the same wavelength. Dividing one spectrum by the other removes the features in common to both spectra (for example, the overall sloping of the spectra) and enhances the features. This gives us a so-called “ratioed spectrum” as seen below.
Figure 5
Figure 6

GEOL104: Exploring the Planets
6
Name: Lab Instructor: Lab Section: SPECTRA OF COLOR SAMPLES: Use the Ocean Optics instrument (with your lab instructor) to acquire a spectrum of the red, yellow, green, and blue paint samples. Note the peak wavelength below AND sketch the spectra on the graph provided on the next page. 1. What is the peak wavelength of the red sheet? (note: it may resemble a “shoulder” rather than a “peak”) ____________________________ 2. What is the peak wavelength of the yellow sheet? ____________________________ 3. What is the peak wavelength of the blue sheet? _____________________________ 4. What is the peak wavelength of the green sheet? _____________________________ 5. Based on your observations, what can you say, generally, about the relationship between the spectrum of an object in the visible wavelengths, and its color? ________________________________________________________________________
Reflectance
0 .5 0.6 0.7 0.8 0.9 1.0 Wavelength (µm)
GEOL104: Exploring the Planets
7
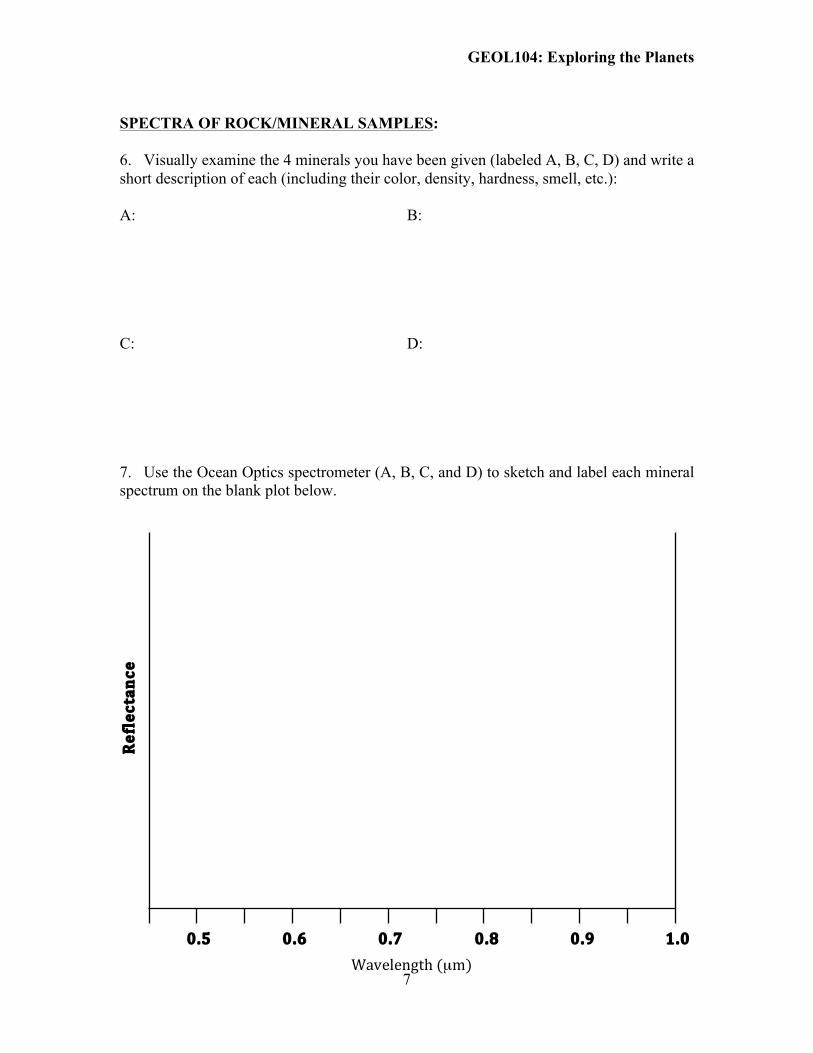
SPECTRA OF ROCK/MINERAL SAMPLES: 6. Visually examine the 4 minerals you have been given (labeled A, B, C, D) and write a short description of each (including their color, density, hardness, smell, etc.): A: B: C: D: 7. Use the Ocean Optics spectrometer (A, B, C, and D) to sketch and label each mineral spectrum on the blank plot below.
Reflectance
0 .5 0.6 0.7 0.8 0.9 1.0 Wavelength (µm)

GEOL104: Exploring the Planets
8
8. Use the spectral library mineral plot (Figure 1) and your spectra sketches on the previous page to identify each of the samples:
A: ____________________________ B: ____________________________ C: ____________________________ D: ____________________________ 9. Now use the instrument on sample E (Pyrite). How does this spectrum compare to Galena, which has a very flat or ‘bland’ shape from 450-1000 nm. 10. What does this indicate about using spectroscopy to identify minerals with featureless (bland) spectra? VISIBLE AND NEAR-INFRARED SPECTROSCOPY: Now we will look at some spectra taken in the visible and near-infrared (longer wavelengths). The longer wavelength range is sensitive to: 1) the energy transitions of electrons between orbital shells within particular atoms that make up many (but not all) minerals, and 2) vibrations of the bonds between those atoms. Both the electron transitions and bond vibrations absorb energy at different wavelengths, which are diagnostic of the absorbing mineral. Because of this, visible and near-infrared wavelengths are useful for identifying many types of minerals. Figure 2 is an example of several minerals in this wavelength range (note that the spectra have been vertically offset so you can more easily see the differences in their shapes). 11. Minerals rich in iron (Fe) often have a large, broad ‘bowl-shaped’ absorption feature at around 1.0 µm, due to electronic transitions in the Fe atom. Which of the above minerals and/or unknown mixtures contains Fe? ____________________________ 12. The “Unknown mix” is a rock. As rocks are aggregates of multiple minerals, this rock is composed of two minerals. As such, the spectrum of this rock has components of the spectral shape of both minerals (i.e. it has absorption features that are present in both). What two minerals make up the “Unknown mix” rock? ____________________________ ____________________________

GEOL104: Exploring the Planets
9
MARS SURFACE SPECTROSCOPY: Finally, we will take a look at an example spectrum from the planet Mars. CRISM (Compact Reconnaissance Imaging Spectrometer for Mars) is a spectrometer onboard the Mars Reconnaissance Orbiter spacecraft, which is orbiting Mars. Planetary scientists use the CRISM visible and near-infrared spectra to interpret some of the mineralogical variations on the surface of Mars, including the identification of new outcrops of phyllosilicates (clay minerals). Figure 3 is an example image that CRISM has taken in a region called Nili Fossae. We will compare the ratioed spectrum (Figure 5) of our clay-rich outcrop with several different phyllosilicates from a spectral library (samples from Earth, measured in a laboratory spectrometer). The spectral library (Figure 6) shows the Mars clay-rich outcrop (“Outcrop”) plotted with other laboratory phyllosilicates (“SMECTITE”, “KAOLINITE”, and “ILLITE”). 13. Identify the type of phyllosilicate that is found in the Nili Fossae outcrop (Hint: be sure that the wavelength value of the minimum point of each absorption feature matches the Nili Fossae outcrop spectrum by using a ruler or straight edge): 14. On Earth, these clays form in the presence of liquid water. What implication does this statement have for the Nili Fossae area on Mars?