lab view fundamentals 2devenpor/aoe3054/manual/inst4/labview...today’s lab overview 1. labview...
TRANSCRIPT
AOE 3054
LabView Programming
Today’s Lab Overview1. LabView Fundamentals
• Quick overview of the basics
2. Programming practice exercises • Two programming problems
3. Ex 6 preparation and programming time• Work in your groups to prepare your experiment and programs
for Experiment 6.
Lab View Fundamentals• Strings• Numeric• Waveforms• Dynamic Data Type • Loops
– While Loops– For Loops– Accessing previous node Data
• Arrays• Clusters• Decisions
– Select function– Case Structures
Getting Help With LabView• Context Sensitive Help
– Help menu, Show Context Help.• Find Examples
– Help menu, Find Examples…• Right Click item on Block Diagram
– Select Help• Tools Pallet Search• NI.com
– Search Support

Finding problems• Broken run button• Find Errors• Probes• Breakpoints• Highlight Execution• Pause button

Project
• Write VI that will control the frequency output of the function Generator
• Go over different labview concepts with the program
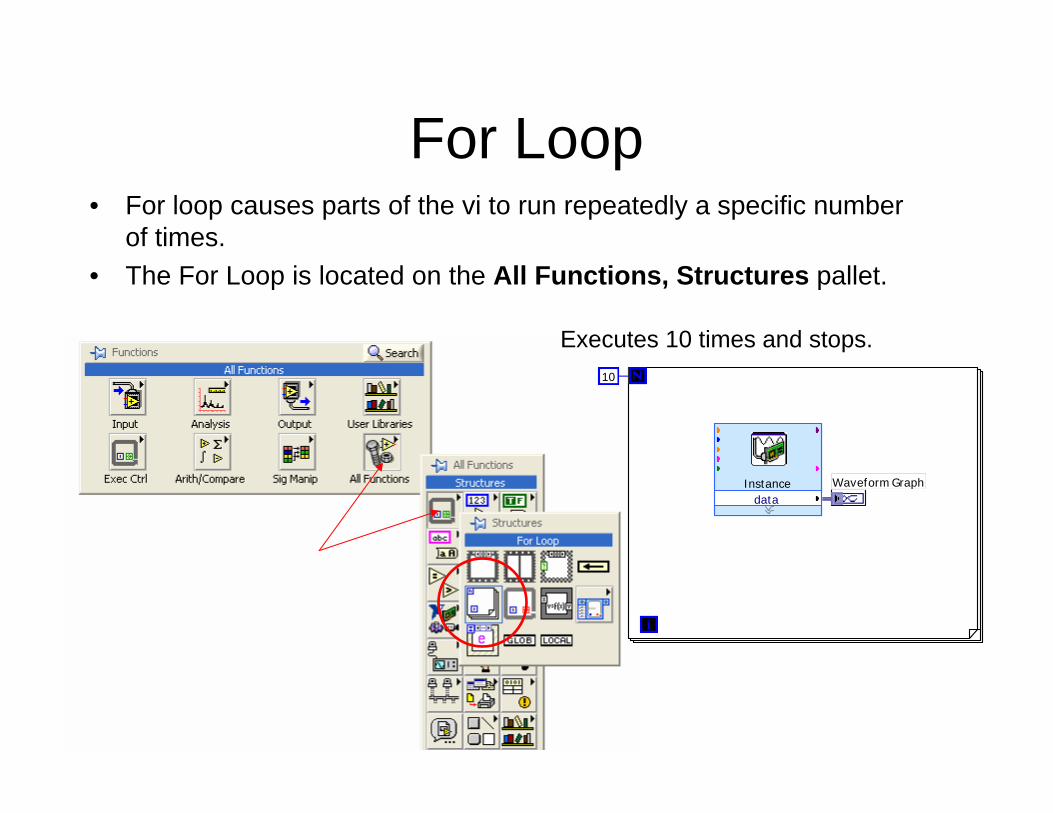
For Loop• For loop causes parts of the vi to run repeatedly a specific number
of times.• The For Loop is located on the All Functions, Structures pallet.
dataInstance Waveform Graph
10
Executes 10 times and stops.
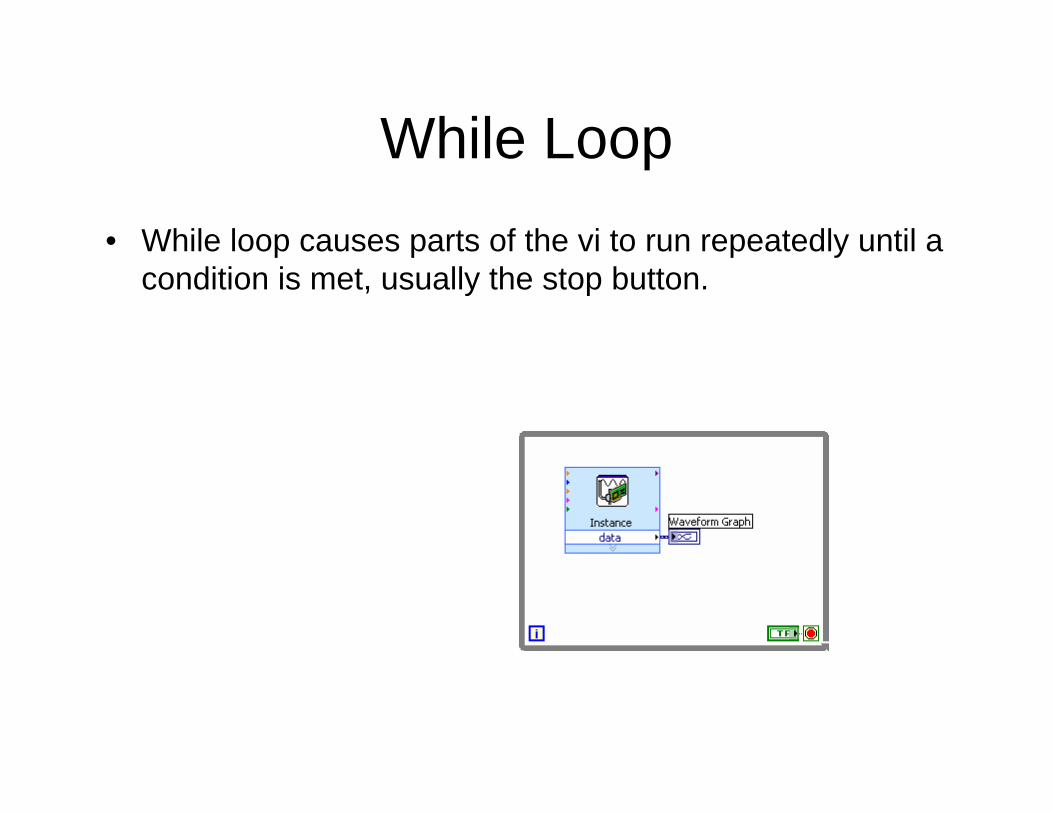
While Loop• While loop causes parts of the vi to run repeatedly until a
condition is met, usually the stop button.
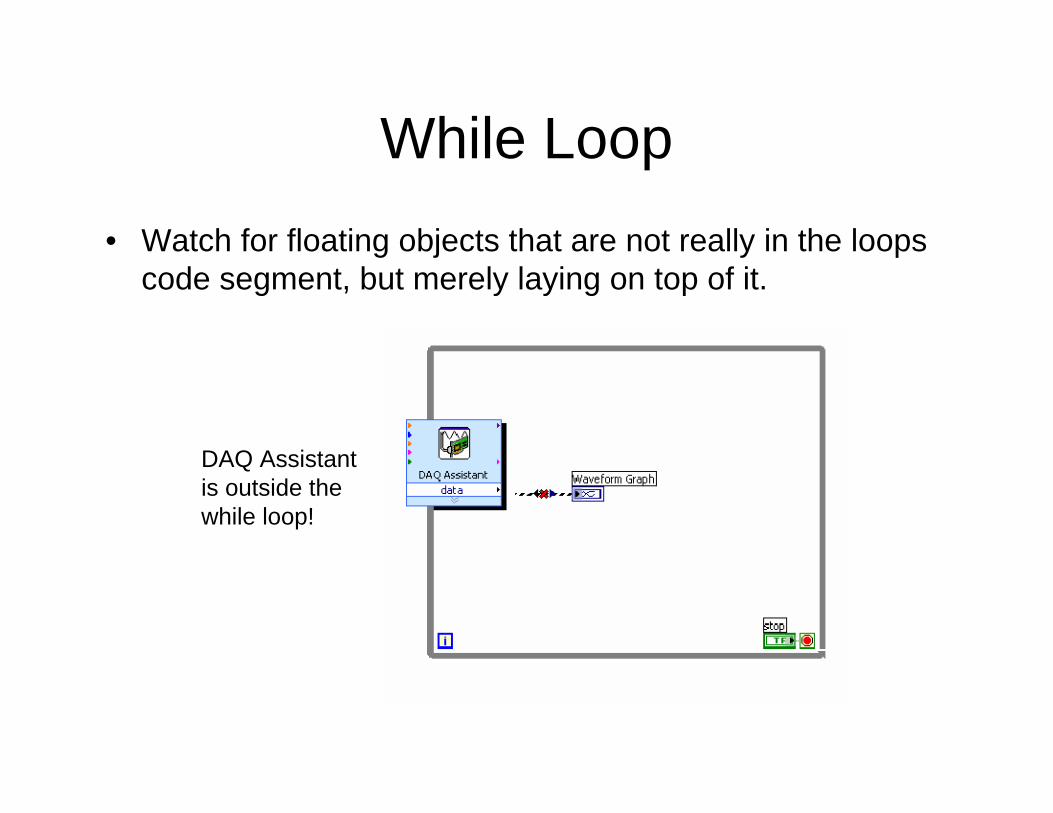
While Loop• Watch for floating objects that are not really in the loops
code segment, but merely laying on top of it.
DAQ Assistant is outside the while loop!

Graph cursors, legends, etc.• Graphs:
– Can have multiple scales.– Values can be changed– Auto scaling enabled or disabled
• Cursors can be added to graphs– assist in viewing data points– Can be assigned to different plots– Lock to plot to help reading data
• Legends– Automatically named– Allow changing data plots while running– Can be assigned to different scales
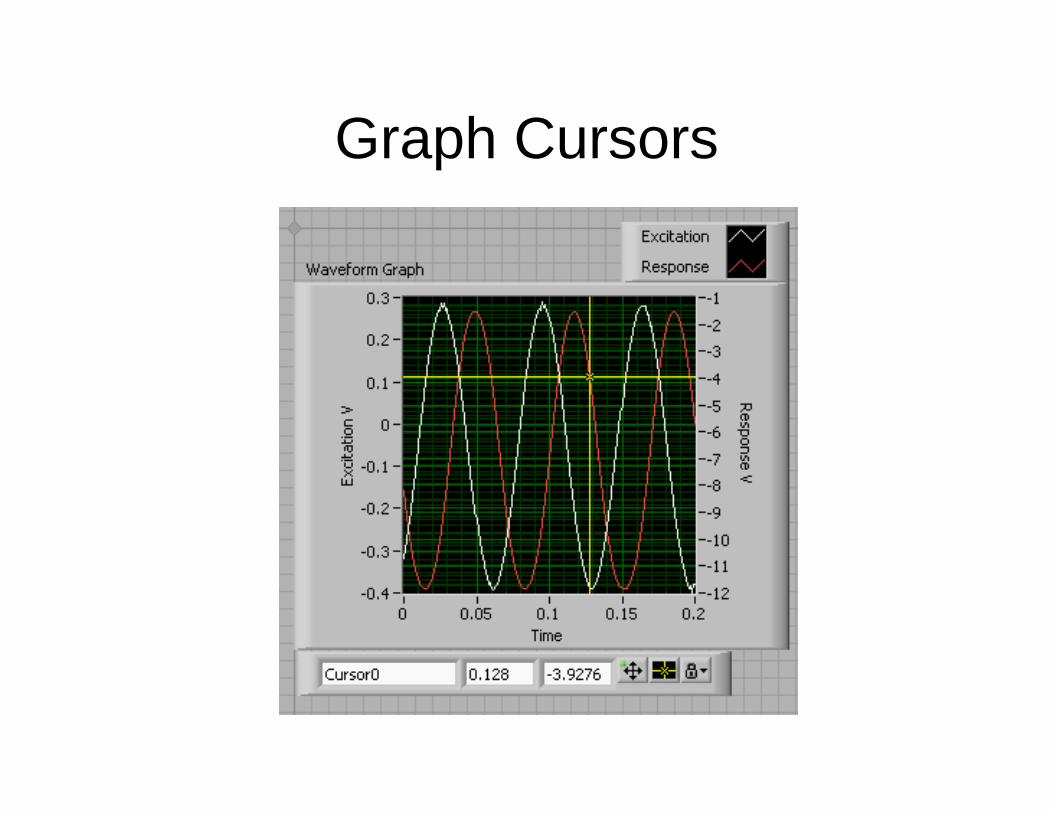
Graph Cursors
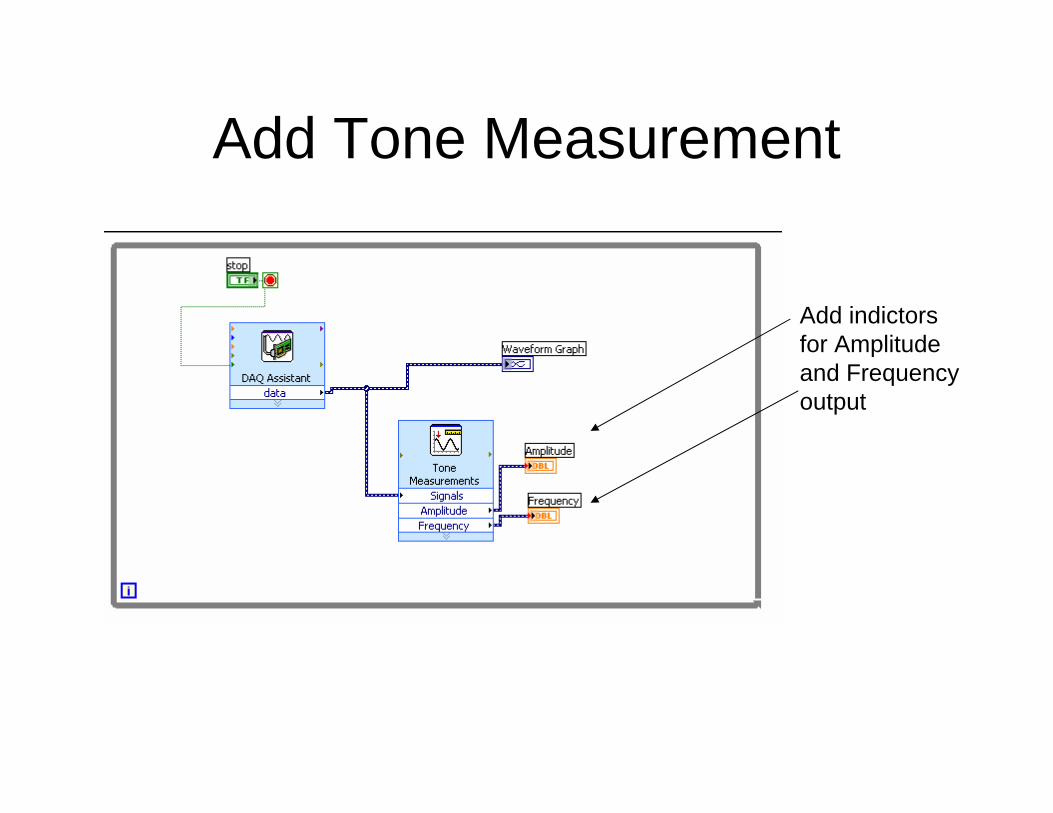
Add Tone Measurement
Add indictors for Amplitude and Frequency output
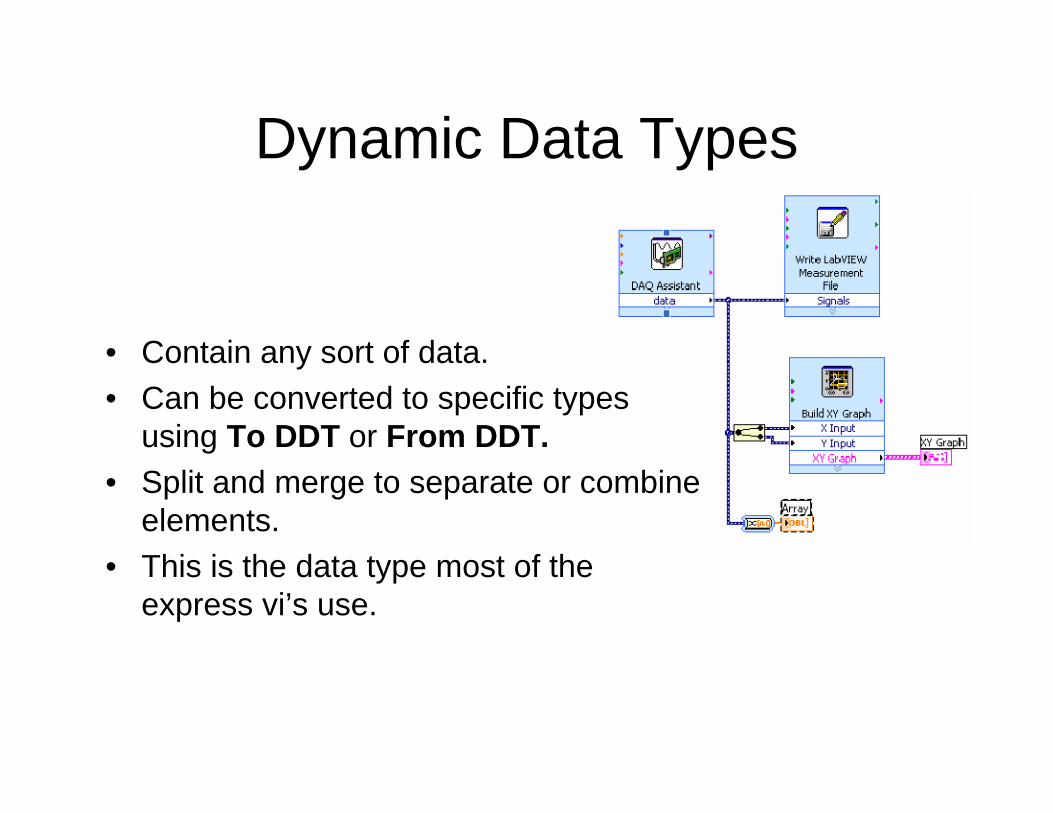
Dynamic Data Types
• Contain any sort of data.• Can be converted to specific types
using To DDT or From DDT.• Split and merge to separate or combine
elements.• This is the data type most of the
express vi’s use.
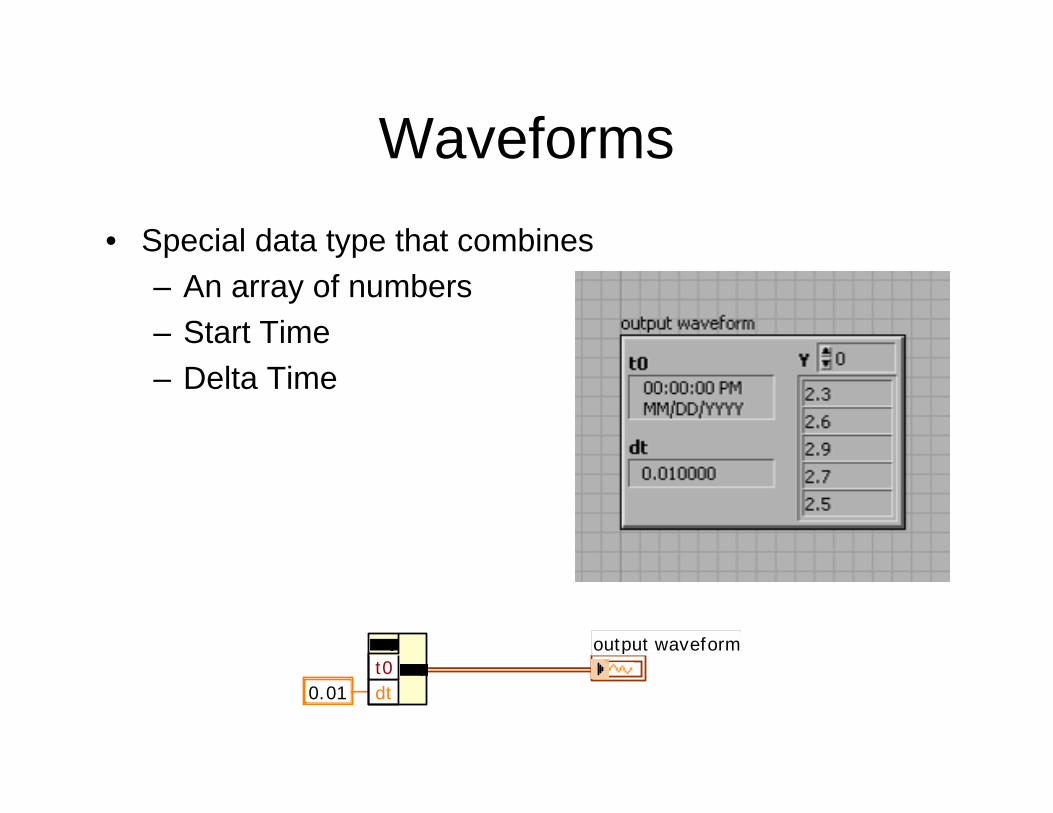
Waveforms• Special data type that combines
– An array of numbers– Start Time– Delta Time
dtt0
output waveform
0.01
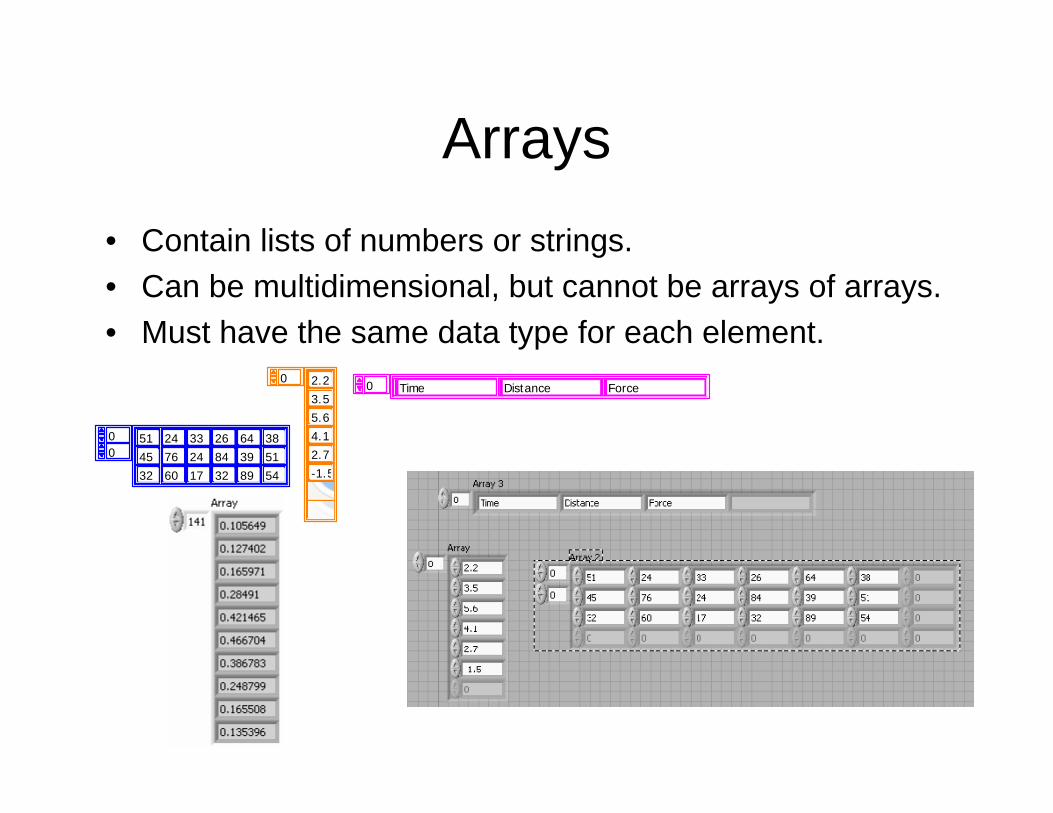
Arrays• Contain lists of numbers or strings.• Can be multidimensional, but cannot be arrays of arrays.• Must have the same data type for each element.
3.55.64.12.7-1.52.22.2
2.20ForceTime Distance0
51 24 33 26 64 3845 76 24 84 39 5132 60 17 32 89 54
00
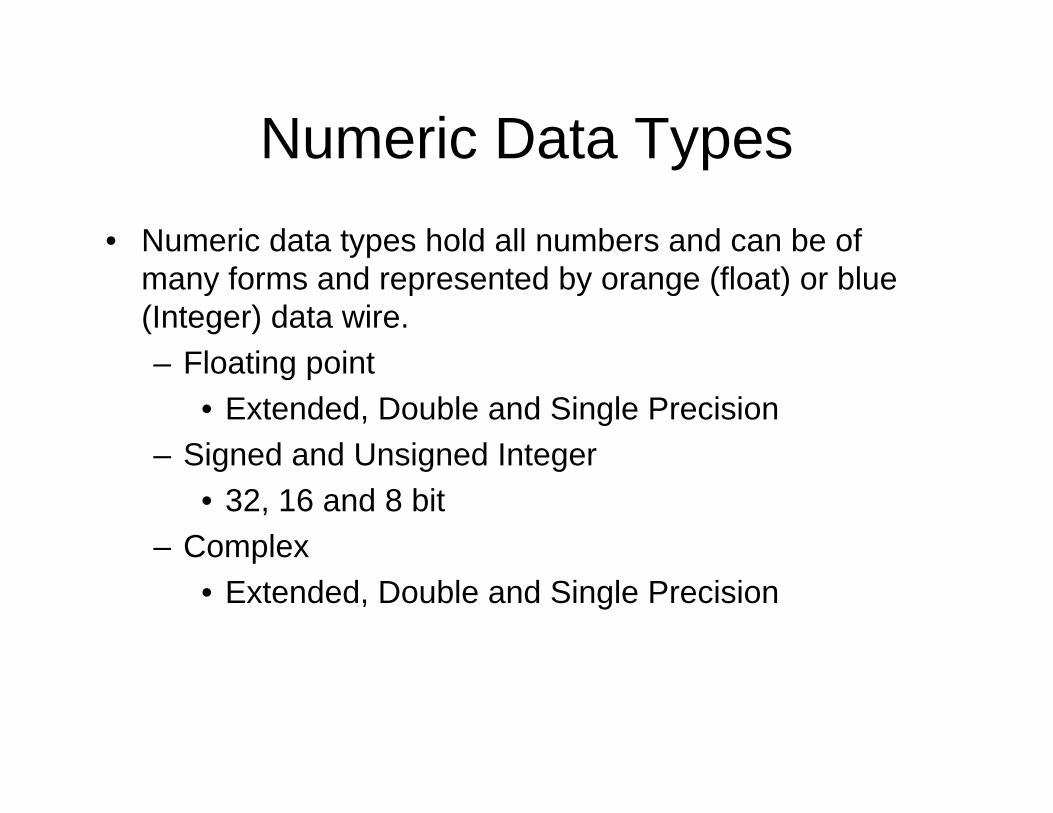
Numeric Data Types• Numeric data types hold all numbers and can be of
many forms and represented by orange (float) or blue (Integer) data wire.– Floating point
• Extended, Double and Single Precision– Signed and Unsigned Integer
• 32, 16 and 8 bit– Complex
• Extended, Double and Single Precision

Numeric Data Types• Lab view will convert data types as it sees appropriate.
(represented by a dot.)
• Creating data by right clicking, create… will usually create the proper data type.
• To select, Right click numeric on block diagram and select Representation.
Floating point
Integer
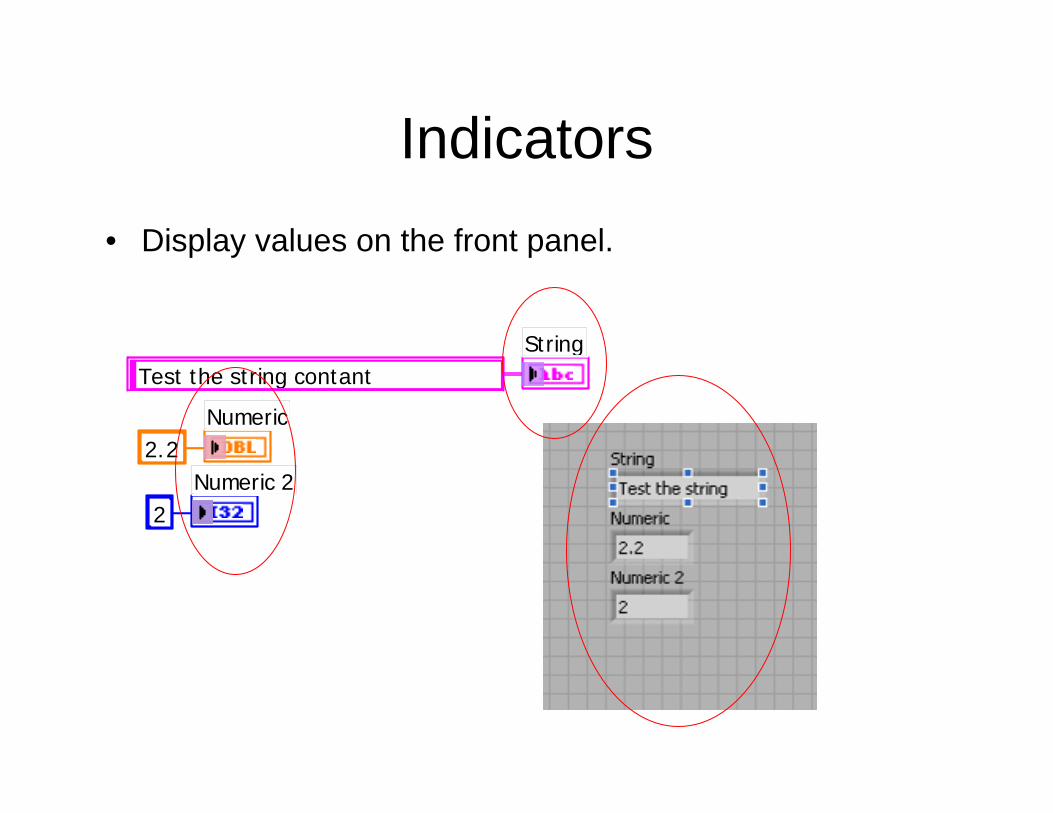
Indicators• Display values on the front panel.
Test the string contant
2.2
2
String
Numeric
Numeric 2
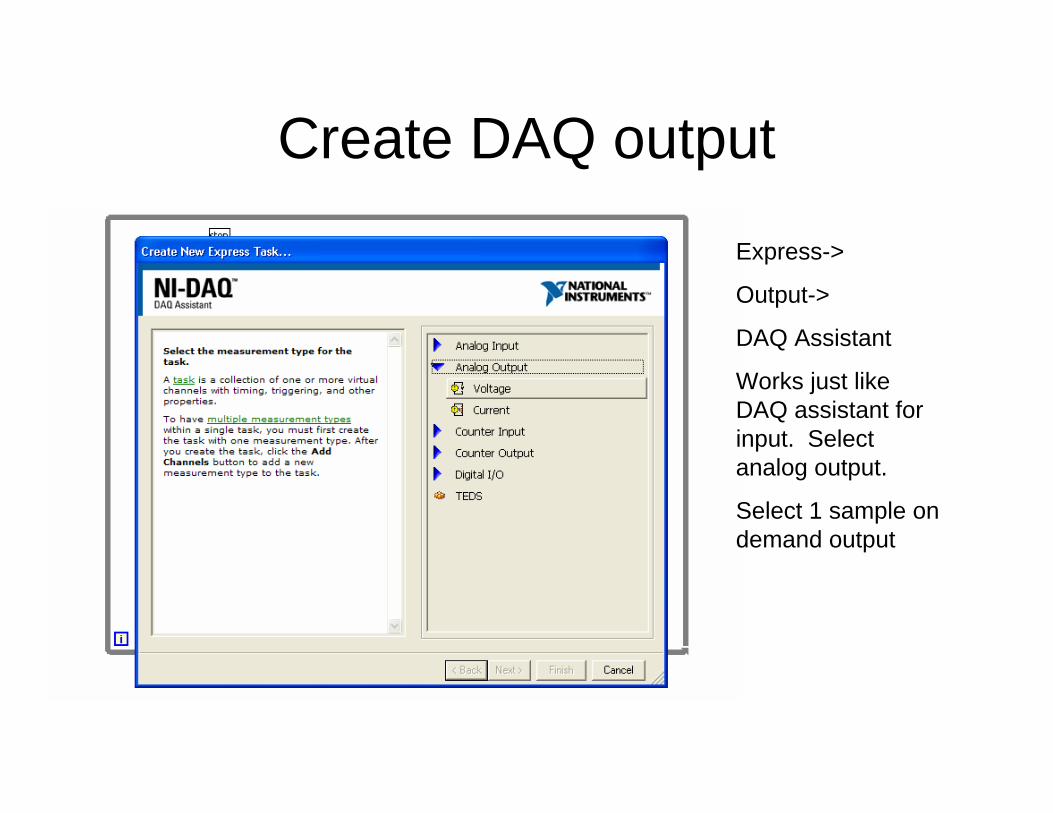
Create DAQ output
Express->
Output->
DAQ Assistant
Works just like DAQ assistant for input. Select analog output.
Select 1 sample on demand output

Digital World
Create a numeric control for the DAQ output data.
Connect stop button to DAQ out.
Real world
Hook AO0 and AO GND to multimeter with DC voltage settings using grabber cables

Controls• Input values or conditions on the front panel.

Front Panel Objects• Numerics
– Thermometer– Gages– Knobs (control)– Dials (indicator)
• Graphs• Charts

Sizing• Most front panel objects can be resized. Look for the
handles as the cursor hovers over objects.• Block diagram loops and case structures can be resized.• Some block diagram components need to be resized,
like split signals.
Handles
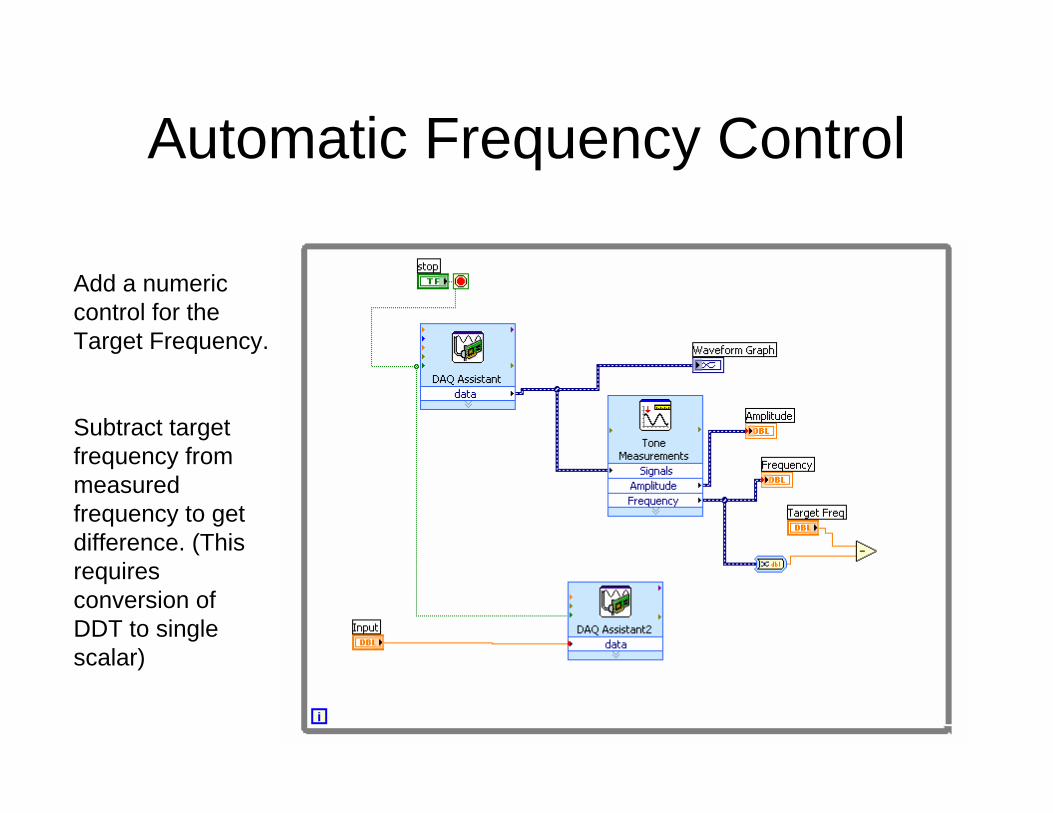
Automatic Frequency Control
Add a numeric control for the Target Frequency.
Subtract target frequency from measured frequency to get difference. (This requires conversion of DDT to single scalar)
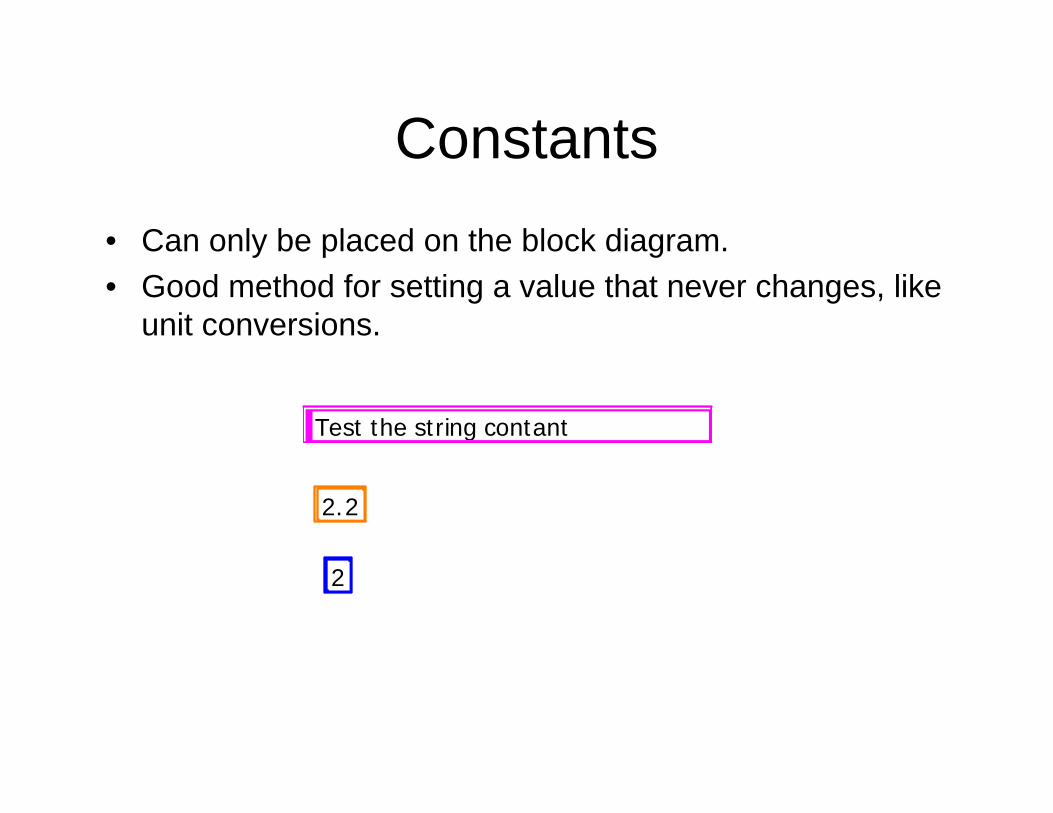
Constants• Can only be placed on the block diagram.• Good method for setting a value that never changes, like
unit conversions.
Test the string contant
2.2
2
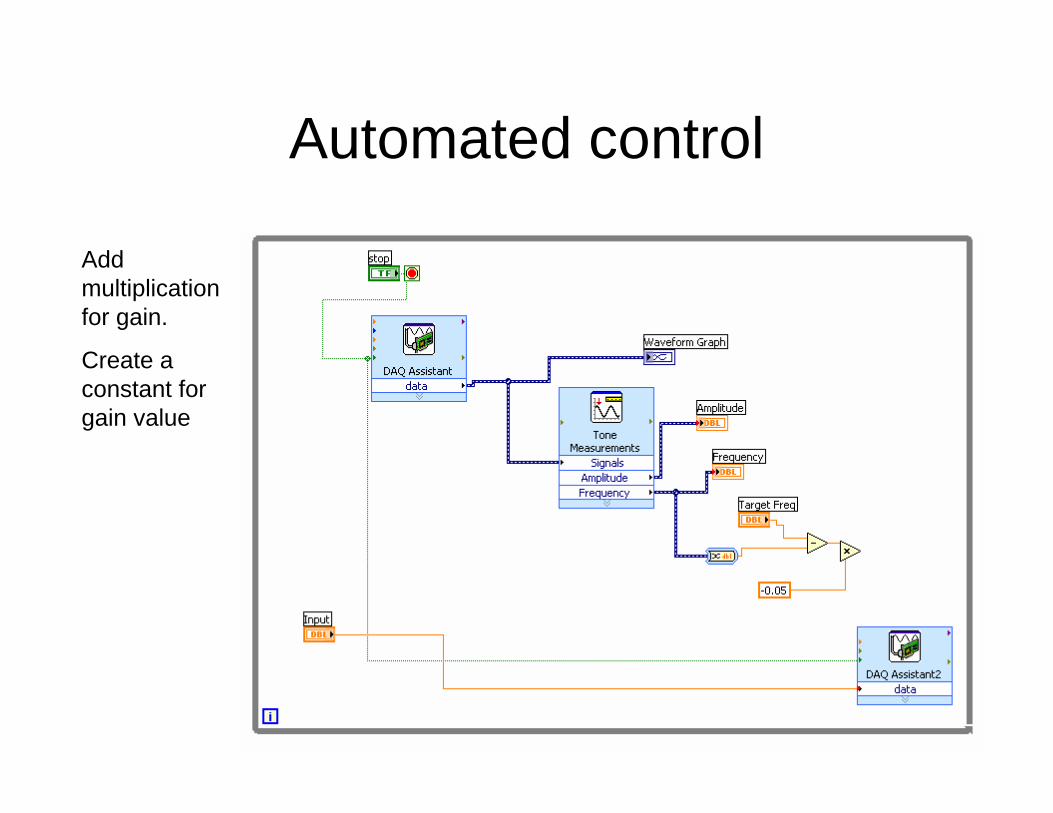
Automated control
Add multiplication for gain.
Create a constant for gain value
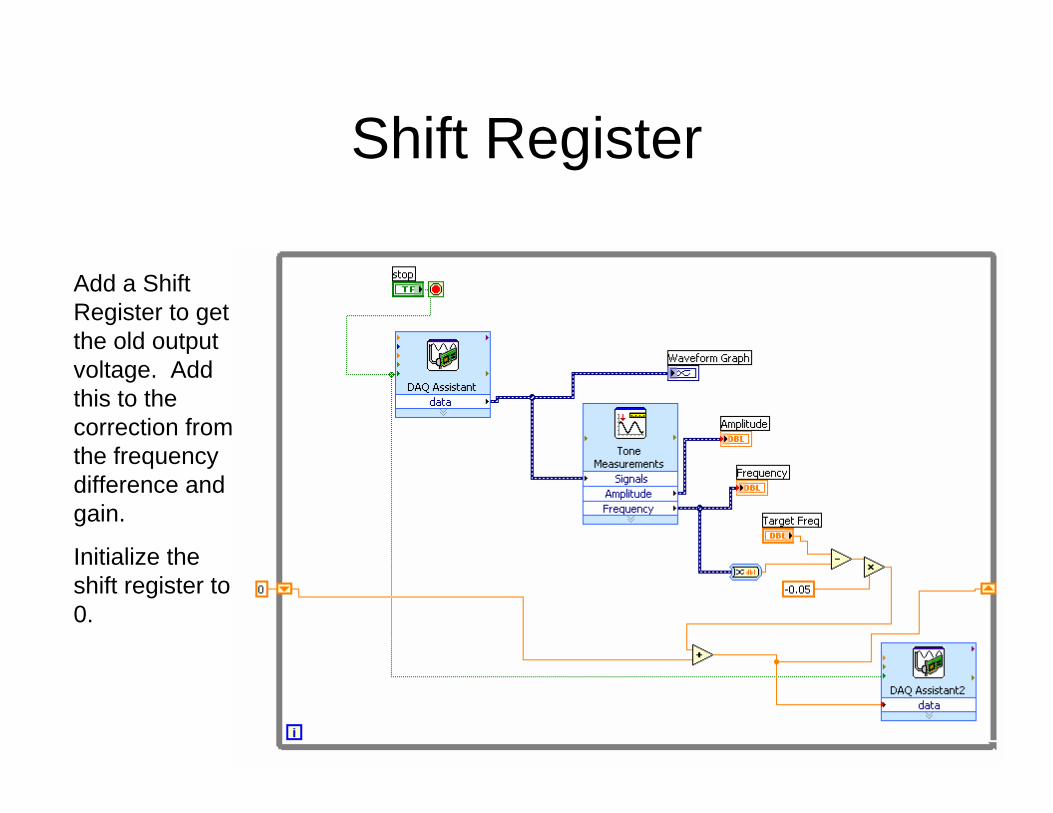
Shift Register
Add a Shift Register to get the old output voltage. Add this to the correction from the frequency difference and gain.
Initialize the shift register to 0.
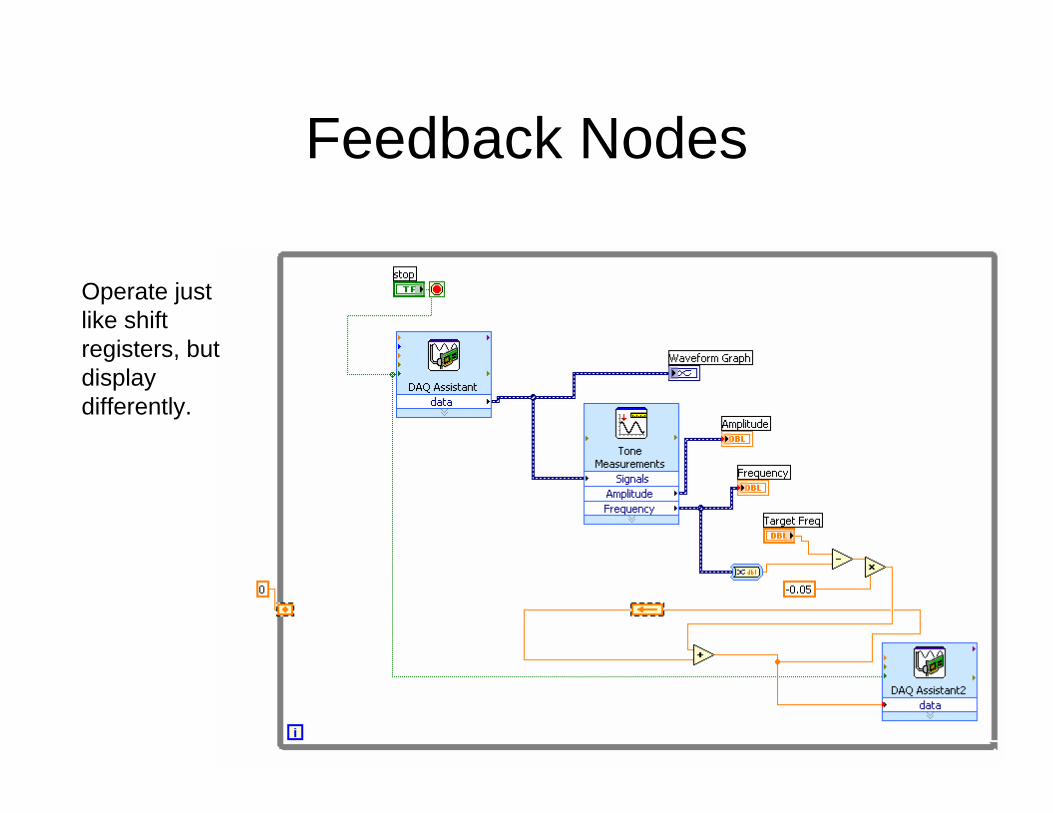
Feedback Nodes
Operate just like shift registers, but display differently.

Error Clusters
Wire Error outputs to Error inputs on all express vi’s.
This is good programming practice to ensure the program stops when an error occurs.
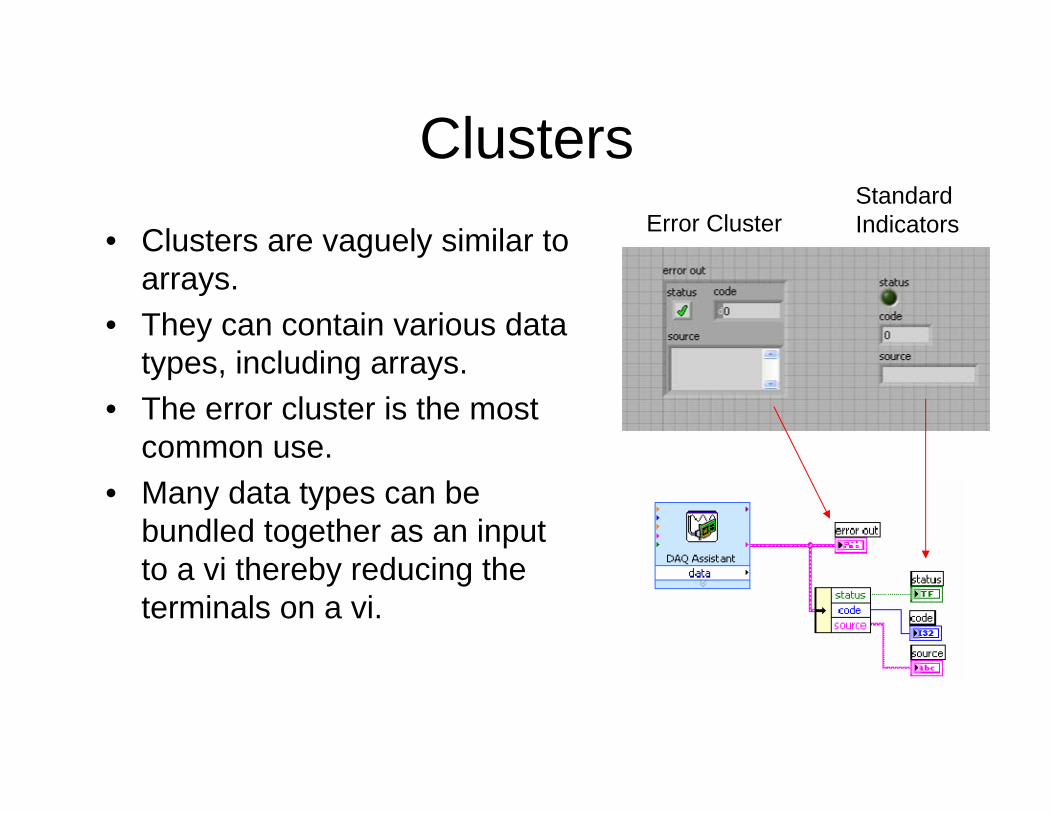
Clusters• Clusters are vaguely similar to
arrays.• They can contain various data
types, including arrays.• The error cluster is the most
common use.• Many data types can be
bundled together as an input to a vi thereby reducing the terminals on a vi.
Error ClusterStandardIndicators
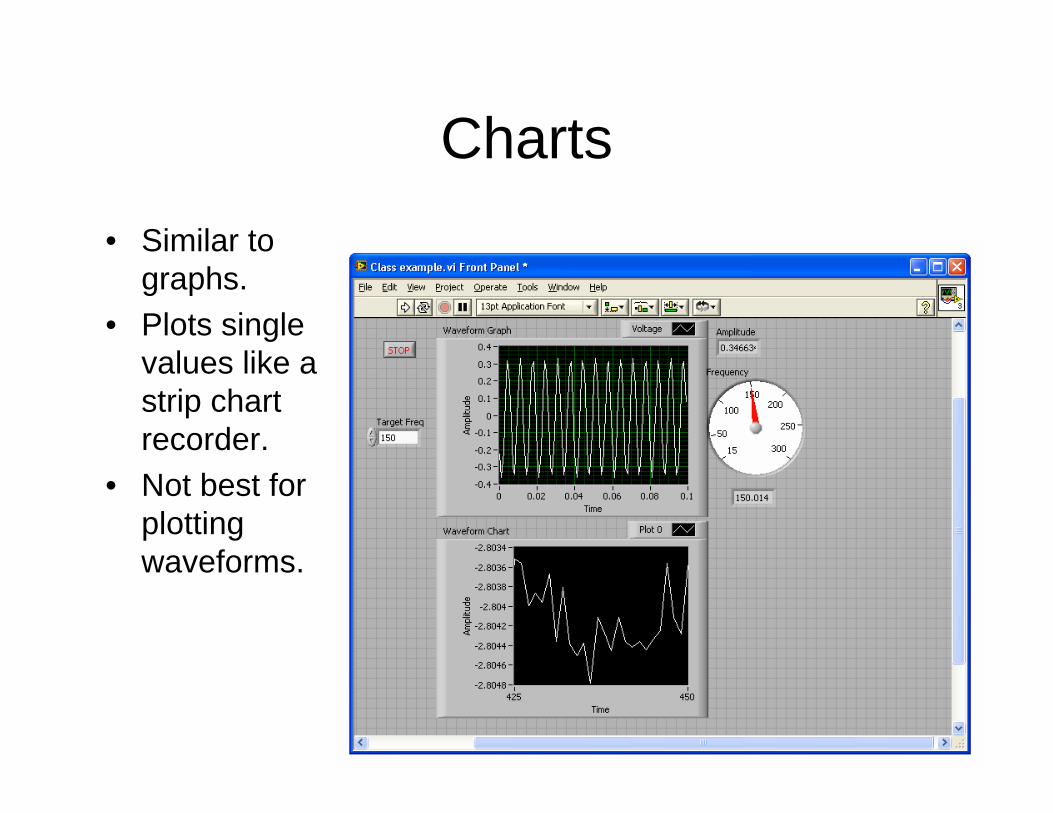
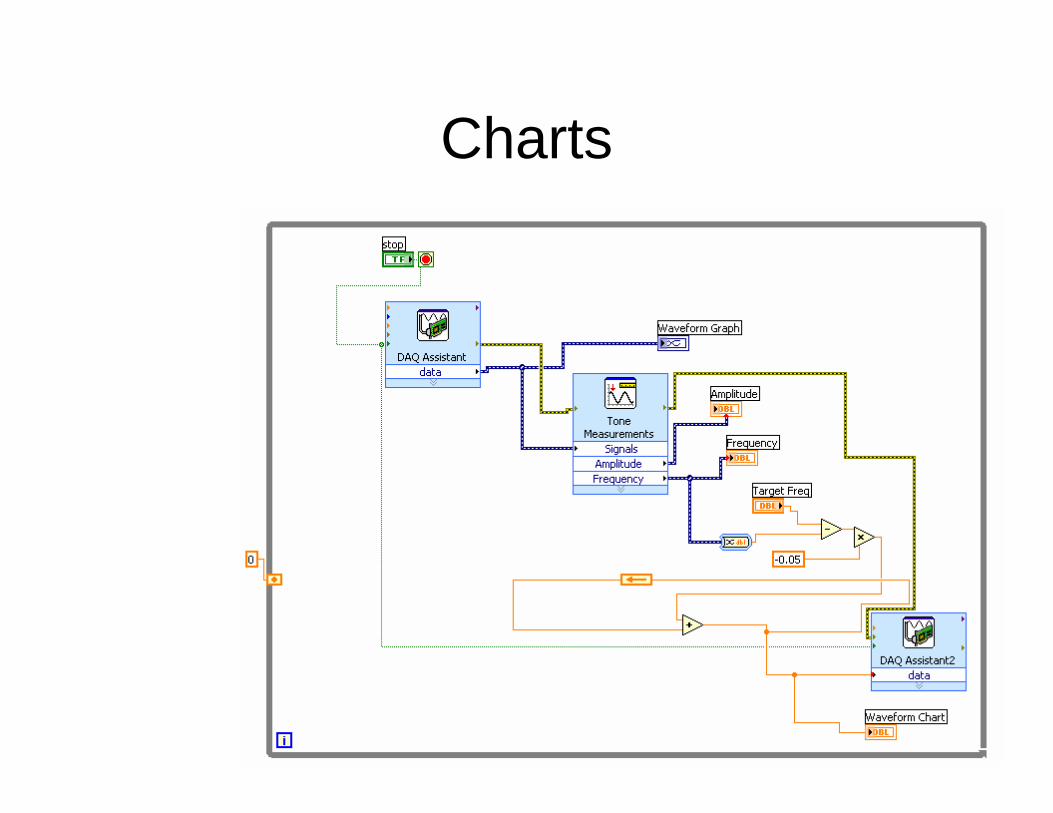
Charts• Similar to
graphs.• Plots single
values like a strip chart recorder.
• Not best for plotting waveforms.
Charts
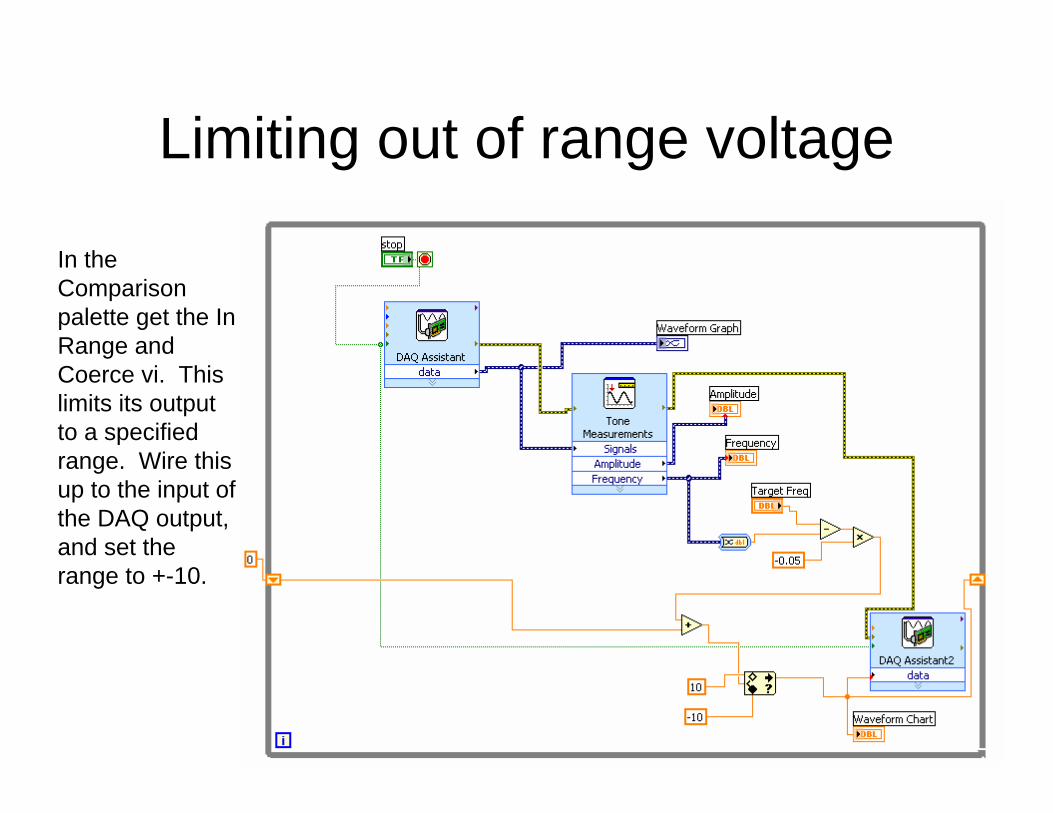
Limiting out of range voltage
In the Comparison palette get the In Range and Coerce vi. This limits its output to a specified range. Wire this up to the input of the DAQ output, and set the range to +-10.

Add a status output
Add the selector function, two string constants, and a string indicator.•Selector function selects from two inputs based on Boolean value.
Strings• Represent characters like letters and numbers as ASCII
codes and represented by a pink data wire.• Many operations can be performed like searching strings
and inserting and deleting characters.• Can be added to the comment of the write LVM file.