label-free monitoring of tissue biochemistry following
TRANSCRIPT

Analyst
PAPER
Cite this: Analyst, 2017, 142, 132
Received 5th October 2016,Accepted 27th November 2016
DOI: 10.1039/c6an02238c
www.rsc.org/analyst
Label-free monitoring of tissue biochemistryfollowing traumatic brain injury using Ramanspectroscopy
Jakub Maciej Surmacki,a,b Laura Ansel-Bollepalli,a,b Francesca Pischiutta,c
Elisa R. Zanier,*c Ari Ercole*d and Sarah Elizabeth Bohndiek*a,b
Traumatic brain injury (TBI) constitutes a major cause of death and long-term disability. At present, we
lack methods to non-invasively track tissue biochemistry and hence select appropriate interventions for
patients. We hypothesized that detailed label-free vibrational chemical analysis of focal TBI could provide
such information. We assessed the early spatial and temporal changes in tissue biochemistry that are
associated with brain injury in mice. Numerous differences were observed in the spectra of the contusion
core and pericontusional tissue between 2 and 7 days. For example, a strong signal from haem was seen
in the contusion core at 2 days due to haemorrhage, which subsequently resolved. More importantly,
elevated cholesterol levels were demonstrated by 7 days, which may be a marker of important cell repair
processes. Principal component analysis revealed an early ‘acute’ component dominated by haemorrhage
and a delayed component reflecting changes in protein and lipid composition. Notably we demonstrated
changes in Raman signature with time even in the contralateral hemisphere when compared to sham
control mice. Raman spectroscopy therefore shows promise as a probe that is sensitive to important
pathobiological processes in TBI and could be applied in future both in the experimental setting, as well
as in the clinic.
Introduction
Traumatic brain injury (TBI) constitutes a major cause ofdeath and long-term disability, including late cognitive deficitsin survivors of even milder injuries. The societal costs of acuteand chronic care, as well as from lost economic activity, forsuch patients is enormous. TBI is a complex disease whosepathogenesis continues for weeks after the initial injury.Progress towards improving outcome in patients has beenlimited because the complex, multifactorial pathobiology ofTBI is not well understood; hence opportunities for thera-peutic intervention are missed.
Studies to date indicate that TBI is a disease governed bythe host response to the injury, which varies dramaticallybetween patients and has a complex spatiotemporal profile.Some commonalities include cell damage and loss of axonalconnectivity over the first 24 hours and neuronal phospholipidmembrane breakdown, clinically evidenced by early elevationin extracellular glycerol concentrations.1 A variety of molecularprocesses, such as excitotoxicity/calcium influx, oxidativeinjury and inflammation, along with cellular changes in resi-dent microglial cells and recruitment of macrophages, maycontinue to drive injury.2–4 These insights have been providedby traditional experimental techniques, such as immunohisto-chemistry that must be performed ex vivo and has specificity topredetermined epitopes only. Cerebral microdialysis canprovide some chemical information in vivo but has poor spatialresolution and is only sensitive to small molecules and thesemust be present in the extracellular fluid. Non-invasive tools totrack brain tissue biochemistry after injury remains an unmetneed, which if met, could shed light on disease pathobiologyand furthermore, assist clinically with translation of precise andtimely interventions, such as neuroprotective therapies.5
Raman spectroscopy (RS) is a powerful label-free analyticaltechnique that has been widely used to study tissue biochemis-try, for example, profiling lipid, protein and nucleic acid
aDepartment of Physics, University of Cambridge, JJ Thomson Avenue, Cambridge,
CB3 0HE, UK. E-mail: [email protected], [email protected],
[email protected]; Tel: +44 (0)1223 769697, +44 (0)1223 337267bCancer Research UK Cambridge Institute, University of Cambridge, Robinson Way,
Cambridge, CB2 0RE, UK. Tel: +44 (0)1223 769697, +44 (0)1223 337267cDepartment of Neuroscience, IRCCS - Istituto de Ricerche Farmacologiche Mario
Negri, Via G. La Masa 19, 20156 Milano, Italy.
E-mail: [email protected], [email protected];
Tel: +39 02 39 014 721, +39 02 39 014 204dDivision of Anaesthesia, University of Cambridge, Addenbrooke’s Hospital,
Hills Road, Cambridge, CB2 0QQ, UK. E-mail: [email protected];
Tel: +44 (0)1223 217889
132 | Analyst, 2017, 142, 132–139 This journal is © The Royal Society of Chemistry 2017
Ope
n A
cces
s A
rtic
le. P
ublis
hed
on 2
8 N
ovem
ber
2016
. Dow
nloa
ded
on 2
2/09
/201
7 16
:24:
19.
Thi
s ar
ticle
is li
cens
ed u
nder
a C
reat
ive
Com
mon
s A
ttrib
utio
n 3.
0 U
npor
ted
Lic
ence
.
View Article OnlineView Journal | View Issue

composition.6–8 All twelve major and minor human brainlipids can be identified using RS at 785 nm.9 Previous workhas revealed that RS can indicate brain tissue damage inresponse to both radiation10 and penetrating11 injuries. In thelatter study, RS was able to delineate injured and healthy brainregions in a mouse model of motor cortex needle injury on thebasis of reduced signal intensity at 1660 cm−1, attributed toamide I vibration of proteins and CvC stretching of lipids,and at 1002 cm−1, attributed to the ring breathing mode ofphenylalanine in proteins.11 However, these data were acquiredexclusively in the motor cortex and penetrating injury does notreflect the vast majority of TBI seen clinically. Furthermore,the study was conducted at a single time point immediatelyafter injury, which does not provide crucial information on theevolution of the pathology.2–4
We hypothesized that RS could monitor the progressionand resolution of brain injury over space and time in a clini-cally relevant model of focal TBI. To test this hypothesis, westudied for the first time using RS the spatial and temporaldistribution of early changes in brain biochemistry after focalsevere TBI modelled by controlled cortical impact in mice. Wefound that RS provides a sensitive readout of the evolution oftissue injury in our model.
ExperimentalAnimals
C57BL/6 mice (adult male mice, Envigo, Italy) were housed ina specific pathogen free vivarium at a constant temperature(21 ± 1 °C) with a 12 h light-dark cycle and ad libitum accessto food and water. The IRCCS-Instituto di RicercheFarmacologiche Mario Negri (IRFMN) adheres to the prin-ciples set out in the following laws, regulations, and policiesgoverning the care and use of laboratory animals: ItalianGoverning Law (D.lgs 26/2014; Authorization no. 19/2008-Aissued March 6, 2008 by Ministry of Health); Mario NegriInstitutional Regulations and Policies providing internal autho-rization for persons conducting animal experiments (QualityManagement System Certificate – UNI EN ISO 9001:2008 – Reg.No. 6121); the NIH Guide for the Care and Use of LaboratoryAnimals (2011 edition) and EU directives and guidelines (EECCouncil Directive 2010/63/UE). The Statement of Compliance(Assurance) with the Public Health Service (PHS) Policy onHuman Care and Use of Laboratory Animals has been recentlyreviewed (9/9/2014) and will expire on September 30, 2019(Animal Welfare Assurance #A5023-01). All efforts were madeto minimize animal suffering and to reduce the number ofanimals used.
Experimental traumatic brain injury
Adult male mice (11 week old) were anesthetized with iso-flurane inhalation (induction: 3%, maintenance: 1.5%) in anN2O/O2 (70%/30%) mixture and placed in a stereotaxic frame.Rectal temperature was maintained at 37 °C. Mice were thensubjected to craniectomy followed by induction of controlled
cortical impact brain injury as previously described.12–15 Theinjury was induced using a 3 mm rigid impactor driven by apneumatic piston rigidly mounted at an angle of 20° from thevertical plane and applied vertically to the exposed dura mater,between bregma and lambda, over the left parieto-temporalcortex (antero-posteriority: −2.5 mm, laterality: −2.5 mm), atimpactor velocity of 5 ms−1 and deformation depth of 1 mm.The craniotomy was then covered with a cranioplasty and thescalp sutured. Sham (control)-operated mice received identicalanesthesia and surgery without brain injury.
Mice were sacrificed at 2 or 7 days after TBI (n = 3 per timepoint) under deep anesthesia (ketamine 30 mg/medetomidine0.3 mg). The brains were then removed, washed once with phos-phate buffered saline (PBS) then frozen immediately into liquidnitrogen and stored at −80 °C. Before commencing Raman ana-lysis brains were thawed for 20 min at room temperature.
Reference chemicals
Cholesterol (Acros Organics, CAS 57-88-5), cholesteryl non-anoate (Eastman Organic Chemicals, no. 9669), cholesteryloleyl carbonate (Eastman Organic Chemicals, no. 10053), intra-lipid (Sigma-Aldrich, no. I141) and albumin from bovineserum (Sigma-Aldrich, no. A7906) were investigated.
Raman data acquisition and analysis
Raman spectroscopy was performed with a confocal Alpha300M+ Raman microscope (WITec GmbH, Ulm, Germany)equipped with a 785 nm single mode diode laser (XTRA II;Toptica Photonics Inc., USA), a 300 mm triple grating imagingspectrometer (Acton SpectraPro SP-2300; Princeton InstrumentsInc., USA) with 600 g mm−1 grating (BLZ = 750 nm), a thermo-electrically cooled CCD camera (DU401A-BV; Andor, Ireland)and 20× objective (LD Plan-Neofluar; Zeiss, Germany). Althoughhere we are collecting data using a confocal microscope, itshould be noted that previous studies have found exciting tissueat 785 nm can yield Raman signals from 5–10 mm of depth,depending on the optical properties of the tissue.16
Whole brain samples were placed on a 25 mm round micro-scope coverslip in a petri dish and illuminated with 35 mW at785 nm. Single Raman spectra were collected with 1 s inte-gration time and 10 accumulations. At each position interro-gated (as indicated on the figures), at least 10 spectra were col-lected along a line scan up to 70 μm length. Total numbers ofrecorded Raman spectra used in the analysis are: contralateral(CL; n(2 days) = 330, n(7 days) = 330, n(control) = 560); pericon-tusional (PC; n(2 days) = 330, n(7 days) = 180, n(control) = 240);contusion core (CC; n(2 days) = 140, n(7 days) = 240, n(control) =360) and ipsilateral tissue distant from the contusion core (ID;n(2 days) = 120, n(7 days) = 120, n(control) = 200).
Data processing was performed using Project Plus Four 4.1(WITec), Origin 2016 (OriginLab) and MATLAB withPLS-Toolbox (Mathworks). All Raman spectra were cosmic rayand baseline corrected then normalized to the area-under-curve. Statistical significance was analysed using two-wayANOVA, followed by Tukey’s multiple comparison test. p < 0.05was considered statistically significant.
Analyst Paper
This journal is © The Royal Society of Chemistry 2017 Analyst, 2017, 142, 132–139 | 133
Ope
n A
cces
s A
rtic
le. P
ublis
hed
on 2
8 N
ovem
ber
2016
. Dow
nloa
ded
on 2
2/09
/201
7 16
:24:
19.
Thi
s ar
ticle
is li
cens
ed u
nder
a C
reat
ive
Com
mon
s A
ttrib
utio
n 3.
0 U
npor
ted
Lic
ence
.View Article Online

Results
Raman spectroscopy (RS) was performed at a range of spatiallocations on the excised brains at 2 (Fig. 1A) and 7 (Fig. 1B)days after TBI, or in sham control brains (Fig. 1C). The spatiallocations are identified as: contralateral (CL); ipsilateral tissue,distant from the contusion core (ID); pericontusional (PC);and contusion core (CC). The injury was delivered to the leftparietotemporal cortex, so the right hemisphere is contralat-eral. Significant discoloration in the injured site can beobserved in the sample at 2 days of TBI as a result of mechan-ical damage to the tissue and associated bleeding (Fig. 1A).The spatial and temporal distribution of the RS data (Fig. 1D–F) shows dominant spectral contributions from lipids and pro-teins as expected from tissue. Example spectra from 2 daysafter TBI are annotated in detail in Fig. 2; no additional peakswere identified at 7 days, so only data from 2 days are anno-tated for clarity. Comparing qualitatively the contralateralhemisphere with the contusion core (Fig. 2A and B) at 2 daysafter TBI, we can see additional strong bands at ∼754, 1224,1547, 1562, 1620 cm−1 from haemoglobin and decreasedintensity of the bands at around 718, 1264, 1440 and1660 cm−1 from lipids. We also recorded spectra at the coordi-nates of the contusion core in sham (control) mice. Based ontheir similarity to the spectra of the contralateral hemisphereat 2 and 7 days after TBI (Fig. 2C and D), for all further analysiswe compared contusion, pericontusional and ipsilateraldistant data to the contralateral side of the same brain.
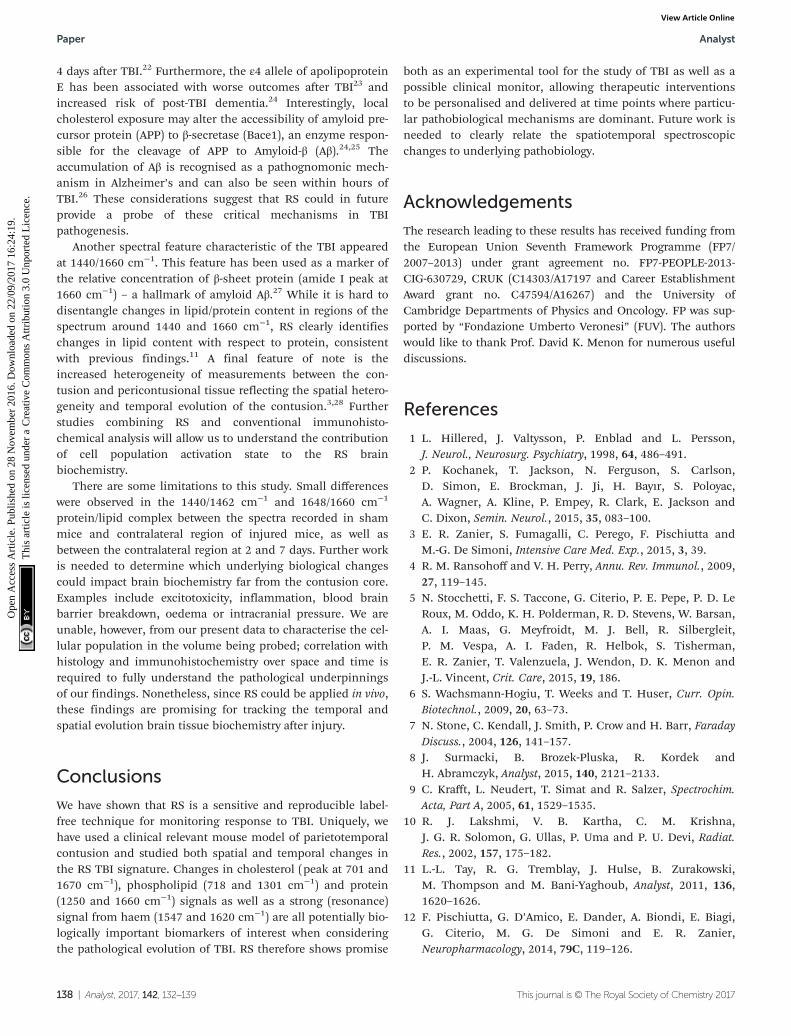
To examine the changes recorded by RS in more detail, wecomputed the differences between the average spectra across
all mice at each spatial location and time point (Fig. 3). Nosignificant difference was observed between the CL hemi-sphere and ID measurements made at ‘uninjured’ tissue awayfrom the contusion core (identified qualitatively from thebright field images) either at 2 or 7 days (Fig. 3A and B).Small differences are apparent when comparing contralateralcontrol tissue between 2 days and 7 days, associated with thepeaks at 1140, 1462, 1648, and 1660 cm−1 (Fig. 3C). Strikingdifferences arise between the contralateral controls and thecontusion core at 2 days (Fig. 3D). Some of these resolve withtime, in particular the spectral shoulder between the peaks at1562 and 1620 cm−1, which we ascribe to resonance excitationof haemoglobin,17 but the spectral signatures remain verydifferent compared to contralateral also at 7 days (Fig. 3E).Comparing the contusion core between 2 days and 7 days(Fig. 3F), interesting spectral differences can be noted inbands at 426, 701, 801, 1128, 1301, 1440, 1462 and 1660 cm−1,associated with lipids. Peaks at 426, 675, 754, 1003, 1224,1547, 1562, 1620 cm−1 are likely due to resonance excitation ofhaemoglobin;17 the extensive area of bleeding present at 2days after TBI has largely resolved by 7 days resulting ina decreasing signal of haemoglobin (Fig. 1A and B).Pericontusional tissue showed similar changes to thecontusion core.
To isolate the origin of the changing lipid signal observed,we acquired average Raman spectra (Fig. 4A) of cholesterol(Fig. 4B), cholesteryl nonanoate (Fig. 4C), cholesteryl oleyl car-bonate (Fig. 4D), as well as a mixed lipid solution (intralipid)and protein albumin. The most intense bands from cholesterolare at 426, 546, 605, 701, 741, 1128, 1440, 1462 and 1670 cm−1;
Fig. 1 Raman spectroscopy reveals changes in tissue biochemistry following traumatic brain injury (TBI). Bright field microscopy composites ofexample murine brains at 2 days (a) and 7 days (b) after TBI, as well as control (c) (Inset photographs show sample preparation). Average Ramanspectra shown in (d), (e) and (f ) were acquired from the areas indicated in matching colours in the photos (a), (b) and (c). CL = contralateral; ID = ipsi-lateral distant from contusion core; PC = pericontusional tissue; and CC = contusion core. Spectra were acquired at 785 nm, with 1 s exposure and10 accumulations; the average is performed over 30 separate spatial points.
Paper Analyst
134 | Analyst, 2017, 142, 132–139 This journal is © The Royal Society of Chemistry 2017
Ope
n A
cces
s A
rtic
le. P
ublis
hed
on 2
8 N
ovem
ber
2016
. Dow
nloa
ded
on 2
2/09
/201
7 16
:24:
19.
Thi
s ar
ticle
is li
cens
ed u
nder
a C
reat
ive
Com
mon
s A
ttrib
utio
n 3.
0 U
npor
ted
Lic
ence
.View Article Online
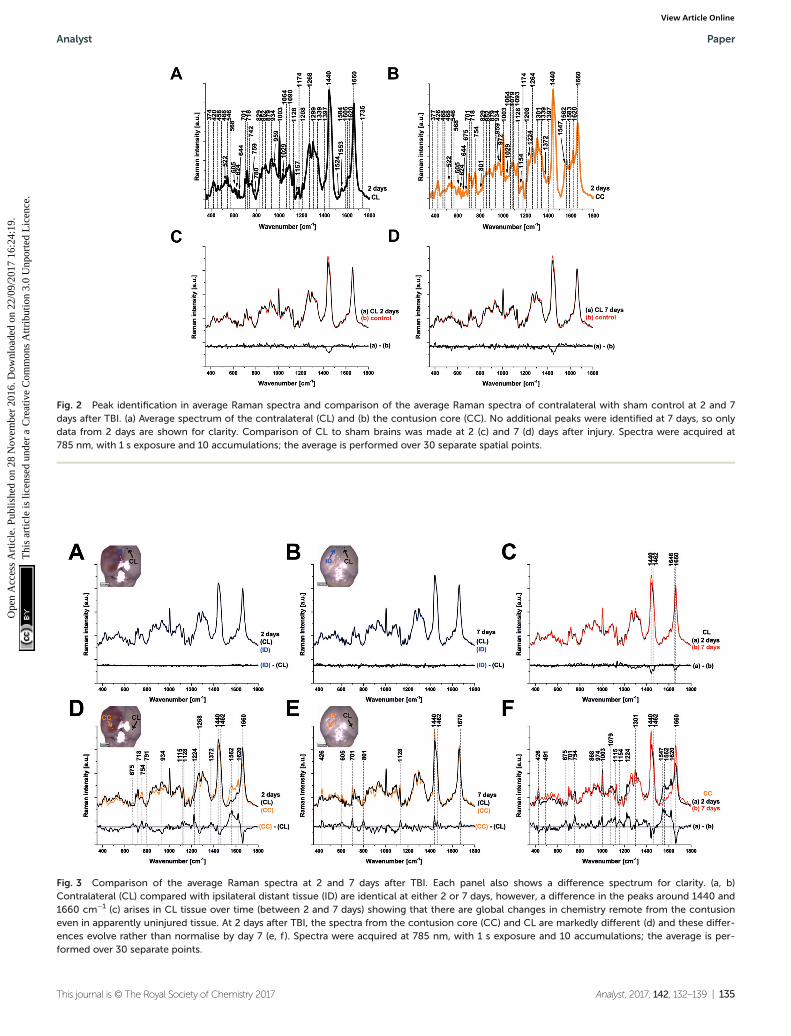
Fig. 3 Comparison of the average Raman spectra at 2 and 7 days after TBI. Each panel also shows a difference spectrum for clarity. (a, b)Contralateral (CL) compared with ipsilateral distant tissue (ID) are identical at either 2 or 7 days, however, a difference in the peaks around 1440 and1660 cm−1 (c) arises in CL tissue over time (between 2 and 7 days) showing that there are global changes in chemistry remote from the contusioneven in apparently uninjured tissue. At 2 days after TBI, the spectra from the contusion core (CC) and CL are markedly different (d) and these differ-ences evolve rather than normalise by day 7 (e, f ). Spectra were acquired at 785 nm, with 1 s exposure and 10 accumulations; the average is per-formed over 30 separate points.
Fig. 2 Peak identification in average Raman spectra and comparison of the average Raman spectra of contralateral with sham control at 2 and 7days after TBI. (a) Average spectrum of the contralateral (CL) and (b) the contusion core (CC). No additional peaks were identified at 7 days, so onlydata from 2 days are shown for clarity. Comparison of CL to sham brains was made at 2 (c) and 7 (d) days after injury. Spectra were acquired at785 nm, with 1 s exposure and 10 accumulations; the average is performed over 30 separate spatial points.
Analyst Paper
This journal is © The Royal Society of Chemistry 2017 Analyst, 2017, 142, 132–139 | 135
Ope
n A
cces
s A
rtic
le. P
ublis
hed
on 2
8 N
ovem
ber
2016
. Dow
nloa
ded
on 2
2/09
/201
7 16
:24:
19.
Thi
s ar
ticle
is li
cens
ed u
nder
a C
reat
ive
Com
mon
s A
ttrib
utio
n 3.
0 U
npor
ted
Lic
ence
.View Article Online

the band at 1440 cm−1 can be assigned to CH deformationand 1670 cm−1 to CvC stretch vibrations.9 Additional bandsat 1735 cm−1 (ester group) as well as 1029 cm−1 and 1301 cm−1
(fatty acid chains) are observed in the spectra of cholesterolderivatives. Characteristic bands of intralipid (phospholipidstabilized soybean oil) are at 718, 845, 879, 970, 1064, 1079,1264, 1301, 1440, 1656 and 1745 cm−1. Symmetric and anti-
symmetric stretch vibrations of the choline group N+(CH3)3 inphospholipid9 can be found at 718 and 879 cm−1. Albumin isthe most common α-helical protein with the Raman bands at508, 852, 1003, 1093, 1206, 1339, 1450, 1586, 1604 and1656 cm−1. Evidence of these Raman bands from cholesterol,cholesterol derivatives, phospholipids and protein areobserved in our RS data from the brain samples.
Fig. 4 Raman spectral characterization of lipids. (a) Average Raman spectra of the cholesterol (b), cholesteryl nonanoate (c), cholesteryl oleyl car-bonate (d) and intralipid (no structure shown as mixed lipids). Protein albumin is also shown for reference. Spectra were acquired at 785 nm, with 1 sexposure and 10 accumulations at 175 mw; the average is performed over 10 separate spatial points.
Fig. 5 Two-way anova analysis of Raman peak intensity ratios. (a) I(701)/I(718), (b) I(1301)/I(1250), (c) I(1440)/I(1660), and (d) I(1301)/I(1620).Replicates used in the analysis are: contralateral (CL; n(2 days) = 33, n(7 days) = 33); pericontusional tissue (PC; n(2 days) = 33, n(7 days) = 18) andcontusion core (CC; n(2 days) = 8, n(7 days) = 19). Box plots indicate means ± sd; *p < 0.05 was considered as statistically significant. Spectra wereacquired at 785 nm, with 1 s exposure and 10 accumulations; the average is performed over 10 separate spatial points.
Paper Analyst
136 | Analyst, 2017, 142, 132–139 This journal is © The Royal Society of Chemistry 2017
Ope
n A
cces
s A
rtic
le. P
ublis
hed
on 2
8 N
ovem
ber
2016
. Dow
nloa
ded
on 2
2/09
/201
7 16
:24:
19.
Thi
s ar
ticle
is li
cens
ed u
nder
a C
reat
ive
Com
mon
s A
ttrib
utio
n 3.
0 U
npor
ted
Lic
ence
.View Article Online

We used the knowledge of these peak identifications toguide our statistical analysis to assess the most significantspatial and temporal changes in the RS data. Changes in lipidand protein metabolism are of particular interest biologicallyafter TBI in relation to cell damage and inflammatory pro-cesses. Unfortunately, many lipid and protein Raman signalsoverlap which makes a clean interpretation difficult.Nevertheless, in an attempt to obtain some mechanisticinsight, we performed two-way ANOVA tests using the extractedpeak intensity ratios for I(701)/I(718) (cholesterol9/phos-pholipid;7,9 Fig. 5A), I(1301)/I(1250) (mixed fatty acidchains7–10 and amide III protein;8,10 Fig. 5B), I(1440)/I(1660)(CH deformation7–10/mixed amide I protein7,8,10 and CvCstretching of lipids;7–10 Fig. 5C), and I(1301)/I(1620) (mixedamide III protein8,10 and fatty acid chains7–10/haemoglobin;17
Fig. 5D). All metrics showed a statistically significant differ-ence between the contralateral and pericontusional/con-tusional regions at 7 days after TBI; all except I(1440)/I(1660)also showed changes at 2 days after TBI. I(1301)/I(1250) also
showed a significant difference between the pericontusionaland contusional locations. Interestingly a large effect wasobserved in the ratio I(701)/I(718) demonstrating a significantrelative increase in cholesterol and decrease in phospholipidcontributions.
In an attempt to determine a TBI ‘fingerprint’ we sub-sequently performed principal component analysis on theentire data set. The distribution of scores on principal com-ponents 2 and 3 (Fig. 6A) clearly distinguish the contusion andpericontusion regions from the distant contusional region andcontralateral hemisphere, as well as the temporal evolution ofthe data at 2 and 7 days after TBI, based on the illustratedloadings (Fig. 6B). From Fig. 6A, principal component 2 ismost effective at distinguishing injured and control tissuewhereas component 3 discriminates better at 7 days. FromFig. 6B, PC2 is dominated by intense signals between 1547and 1620 cm−1, representing resonance Raman shift fromhaemoglobin and so the acute phase is dominated by thecontribution from bleeding at/near the contusion site. Animportant feature of PC3 the peaks at 701 cm−1 representingan increase in cholesterol signal with respect to the 718 cm−1
phospholipid peak.
Discussion
RS is a powerful label-free analytical technique that has beenwidely used to study tissue biochemistry. Our results demon-strate that RS can track the evolution of TBI over the first7 days following injury. While the contralateral and ipsilateraldistant regions are similar at the two time points studied, thespectrum of the contusion core is strikingly different already at2 days after injury and evolves further up to 7 days.
One striking spectral feature results from resonant exci-tation of haemoglobin in the pericontusional and contusioncore regions, consistent with haemorrhage resulting from vas-cular disruption and bleeding at the lesion.18 Haemorrhagicconversion and contusion expansion is a potentially devastat-ing pathology after TBI, which can lead to oxidative damageand cytotoxicity19 so it is particularly important that any non-invasive monitoring technique is sensitive to this process. Thehaemoglobin signals are no longer apparent by 7 days; themacroscopic appearance of the tissue is consistent with thephagocytic clearance of erythrocytes and endocytosis ofhaemoglobin and haem by macrophages/microglia.20
A second striking spectral feature appears in the pro-nounced peaks at 701 cm−1, assigned to cholesterol and718 cm−1, assigned to phospholipid. Our normalised spectrashow a relative increase of cholesterol signal and decrease inphospholipid in the contusion core compared to the contralat-eral tissue and over time. The relative change at 701/718 cm−1
provides strong evidence of a change in lipid chemistry in thepericontusional tissue and contusion core at 2 days thatremains at 7 days. Cholesterol is known to be critical for cellu-lar repair, in neurodegenerative diseases21 and the apolipo-proteins involved in cholesterol transport are up-regulated at
Fig. 6 Principal components analysis of all Raman spectroscopy data.(a) Scatter plot of the score values of each single Raman spectrum forthe second and third principal components from the murine brains 2days (triangles) and 7 days (circles) after TBI: contralateral (CL, black),ipsilateral distant (ID, blue), contusion core (CC, orange) and pericontu-sional tissue (PC, green). (b) Loadings plot of principal components PC1,PC2 and PC3 indicating the peaks that contribute to these principalcomponents.
Analyst Paper
This journal is © The Royal Society of Chemistry 2017 Analyst, 2017, 142, 132–139 | 137
Ope
n A
cces
s A
rtic
le. P
ublis
hed
on 2
8 N
ovem
ber
2016
. Dow
nloa
ded
on 2
2/09
/201
7 16
:24:
19.
Thi
s ar
ticle
is li
cens
ed u
nder
a C
reat
ive
Com
mon
s A
ttrib
utio
n 3.
0 U
npor
ted
Lic
ence
.View Article Online
4 days after TBI.22 Furthermore, the ε4 allele of apolipoproteinE has been associated with worse outcomes after TBI23 andincreased risk of post-TBI dementia.24 Interestingly, localcholesterol exposure may alter the accessibility of amyloid pre-cursor protein (APP) to β-secretase (Bace1), an enzyme respon-sible for the cleavage of APP to Amyloid-β (Aβ).24,25 Theaccumulation of Aβ is recognised as a pathognomonic mech-anism in Alzheimer’s and can also be seen within hours ofTBI.26 These considerations suggest that RS could in futureprovide a probe of these critical mechanisms in TBIpathogenesis.
Another spectral feature characteristic of the TBI appearedat 1440/1660 cm−1. This feature has been used as a marker ofthe relative concentration of β-sheet protein (amide I peak at1660 cm−1) – a hallmark of amyloid Aβ.27 While it is hard todisentangle changes in lipid/protein content in regions of thespectrum around 1440 and 1660 cm−1, RS clearly identifieschanges in lipid content with respect to protein, consistentwith previous findings.11 A final feature of note is theincreased heterogeneity of measurements between the con-tusion and pericontusional tissue reflecting the spatial hetero-geneity and temporal evolution of the contusion.3,28 Furtherstudies combining RS and conventional immunohisto-chemical analysis will allow us to understand the contributionof cell population activation state to the RS brainbiochemistry.
There are some limitations to this study. Small differenceswere observed in the 1440/1462 cm−1 and 1648/1660 cm−1
protein/lipid complex between the spectra recorded in shammice and contralateral region of injured mice, as well asbetween the contralateral region at 2 and 7 days. Further workis needed to determine which underlying biological changescould impact brain biochemistry far from the contusion core.Examples include excitotoxicity, inflammation, blood brainbarrier breakdown, oedema or intracranial pressure. We areunable, however, from our present data to characterise the cel-lular population in the volume being probed; correlation withhistology and immunohistochemistry over space and time isrequired to fully understand the pathological underpinningsof our findings. Nonetheless, since RS could be applied in vivo,these findings are promising for tracking the temporal andspatial evolution brain tissue biochemistry after injury.
Conclusions
We have shown that RS is a sensitive and reproducible label-free technique for monitoring response to TBI. Uniquely, wehave used a clinical relevant mouse model of parietotemporalcontusion and studied both spatial and temporal changes inthe RS TBI signature. Changes in cholesterol (peak at 701 and1670 cm−1), phospholipid (718 and 1301 cm−1) and protein(1250 and 1660 cm−1) signals as well as a strong (resonance)signal from haem (1547 and 1620 cm−1) are all potentially bio-logically important biomarkers of interest when consideringthe pathological evolution of TBI. RS therefore shows promise
both as an experimental tool for the study of TBI as well as apossible clinical monitor, allowing therapeutic interventionsto be personalised and delivered at time points where particu-lar pathobiological mechanisms are dominant. Future work isneeded to clearly relate the spatiotemporal spectroscopicchanges to underlying pathobiology.
Acknowledgements
The research leading to these results has received funding fromthe European Union Seventh Framework Programme (FP7/2007–2013) under grant agreement no. FP7-PEOPLE-2013-CIG-630729, CRUK (C14303/A17197 and Career EstablishmentAward grant no. C47594/A16267) and the University ofCambridge Departments of Physics and Oncology. FP was sup-ported by “Fondazione Umberto Veronesi” (FUV). The authorswould like to thank Prof. David K. Menon for numerous usefuldiscussions.
References
1 L. Hillered, J. Valtysson, P. Enblad and L. Persson,J. Neurol., Neurosurg. Psychiatry, 1998, 64, 486–491.
2 P. Kochanek, T. Jackson, N. Ferguson, S. Carlson,D. Simon, E. Brockman, J. Ji, H. Bayır, S. Poloyac,A. Wagner, A. Kline, P. Empey, R. Clark, E. Jackson andC. Dixon, Semin. Neurol., 2015, 35, 083–100.
3 E. R. Zanier, S. Fumagalli, C. Perego, F. Pischiutta andM.-G. De Simoni, Intensive Care Med. Exp., 2015, 3, 39.
4 R. M. Ransohoff and V. H. Perry, Annu. Rev. Immunol., 2009,27, 119–145.
5 N. Stocchetti, F. S. Taccone, G. Citerio, P. E. Pepe, P. D. LeRoux, M. Oddo, K. H. Polderman, R. D. Stevens, W. Barsan,A. I. Maas, G. Meyfroidt, M. J. Bell, R. Silbergleit,P. M. Vespa, A. I. Faden, R. Helbok, S. Tisherman,E. R. Zanier, T. Valenzuela, J. Wendon, D. K. Menon andJ.-L. Vincent, Crit. Care, 2015, 19, 186.
6 S. Wachsmann-Hogiu, T. Weeks and T. Huser, Curr. Opin.Biotechnol., 2009, 20, 63–73.
7 N. Stone, C. Kendall, J. Smith, P. Crow and H. Barr, FaradayDiscuss., 2004, 126, 141–157.
8 J. Surmacki, B. Brozek-Pluska, R. Kordek andH. Abramczyk, Analyst, 2015, 140, 2121–2133.
9 C. Krafft, L. Neudert, T. Simat and R. Salzer, Spectrochim.Acta, Part A, 2005, 61, 1529–1535.
10 R. J. Lakshmi, V. B. Kartha, C. M. Krishna,J. G. R. Solomon, G. Ullas, P. Uma and P. U. Devi, Radiat.Res., 2002, 157, 175–182.
11 L.-L. Tay, R. G. Tremblay, J. Hulse, B. Zurakowski,M. Thompson and M. Bani-Yaghoub, Analyst, 2011, 136,1620–1626.
12 F. Pischiutta, G. D’Amico, E. Dander, A. Biondi, E. Biagi,G. Citerio, M. G. De Simoni and E. R. Zanier,Neuropharmacology, 2014, 79C, 119–126.
Paper Analyst
138 | Analyst, 2017, 142, 132–139 This journal is © The Royal Society of Chemistry 2017
Ope
n A
cces
s A
rtic
le. P
ublis
hed
on 2
8 N
ovem
ber
2016
. Dow
nloa
ded
on 2
2/09
/201
7 16
:24:
19.
Thi
s ar
ticle
is li
cens
ed u
nder
a C
reat
ive
Com
mon
s A
ttrib
utio
n 3.
0 U
npor
ted
Lic
ence
.View Article Online

13 E. R. Zanier, M. Montinaro, M. Vigano, P. Villa,S. Fumagalli, F. Pischiutta, L. Longhi, M. L. Leoni,P. Rebulla, N. Stocchetti, L. Lazzari and M.-G. De Simoni,Crit. Care Med., 2011, 39, 2501–2510.
14 E. R. Zanier, F. Pischiutta, L. Riganti, F. Marchesi,E. Turola, S. Fumagalli, C. Perego, E. Parotto, P. Vinci,P. Veglianese, G. D’Amico, C. Verderio and M.-G. DeSimoni, Neurother. J. Am. Soc. Exp. Neurother., 2014, 11,679–695.
15 E. R. Zanier, F. Marchesi, F. Ortolano, C. Perego,M. Arabian, T. Zoerle, E. Sammali, F. Pischiutta andM.-G. De Simoni, J. Neurotrauma, 2016, 33, 1060–1072.
16 A. M. Mohs, M. C. Mancini, S. Singhal, J. M. Provenzale,B. Leyland-Jones, M. D. Wang and S. Nie, Anal. Chem.,2010, 82, 9058–9065.
17 B. R. Wood, P. Caspers, G. J. Puppels, S. Pandiancherri andD. McNaughton, Anal. Bioanal. Chem., 2007, 387, 1691–1703.
18 D. Kurland, C. Hong, B. Aarabi, V. Gerzanich andJ. M. Simard, J. Neurotrauma, 2012, 29, 19–31.
19 J. Aronowski and X. Zhao, Stroke, 2011, 42, 1781–1786.20 N. Schallner, R. Pandit, R. LeBlanc, A. J. Thomas,
C. S. Ogilvy, B. S. Zuckerbraun, D. Gallo, L. E. Otterbeinand K. A. Hanafy, J. Clin. Invest., 2015, 125, 2609–2625.
21 J. Zhang and Q. Liu, Protein Cell, 2015, 6, 254–264.22 A. Iwata, K. D. Browne, X.-H. Chen, T. Yuguchi and
D. H. Smith, J. Neurosci. Res., 2005, 82, 103–114.23 G. M. Teasdale, J. A. Nicoll, G. Murray and M. Fiddes,
Lancet, 1997, 350, 1069–1071.24 S. Shively, A. I. Scher, D. P. Perl and R. Diaz-Arrastia, Arch.
Neurol., 2012, 69, 1245–1251.25 N. Nathoo, R. Chetty, J. R. van Dellen and G. H. Barnett,
Mol. Pathol., 2003, 56, 132–136.26 V. E. Johnson, W. Stewart and D. H. Smith, Nat. Rev.
Neurosci., 2010, 11, 361–370.27 R. Michael, C. Otto, A. Lenferink, E. Gelpi,
G. A. Montenegro, J. Rosandić, F. Tresserra, R. I. Barraquerand G. F. J. M. Vrensen, Exp. Eye Res., 2014, 119, 44–53.
28 A. Kumar, D.-M. Alvarez-Croda, B. A. Stoica, A. I. Faden andD. J. Loane, J. Neurotrauma, 2016, 33, 1732–1750.
Analyst Paper
This journal is © The Royal Society of Chemistry 2017 Analyst, 2017, 142, 132–139 | 139
Ope
n A
cces
s A
rtic
le. P
ublis
hed
on 2
8 N
ovem
ber
2016
. Dow
nloa
ded
on 2
2/09
/201
7 16
:24:
19.
Thi
s ar
ticle
is li
cens
ed u
nder
a C
reat
ive
Com
mon
s A
ttrib
utio
n 3.
0 U
npor
ted
Lic
ence
.View Article Online