labor market responses to legal work hour reduction ... · labor market responses to legal work...
TRANSCRIPT

Labor Market Responses to Legal Work HourReduction: Evidence from Japan1
Daiji Kawaguchi2 and Hisahiro Naito3 and Izumi Yokoyama4
December 27, 2008
1This paper is a part of the research program by the Economic Social Research Institute (ESRI)of the Cabinet Office. Special permission was granted by the Ministry of Internal Affairs andCommunications to use micro data from the Basic Survey of Wage Structure. We thank Yuko Uenoof the Cabinet Office for her assistance in the data application process. Statistical analysis based onthe Basic Survey of Wage Structure was exclusively implemented by Daiji Kawaguchi and HisahiroNaito. We appreciate the comments from Hidehiko Ichimura, Sachiko Kuroda, Ryo Nakajima, IsaoYamamoto, and seminar participants at the ESRI of the Cabinet Office, the RIETI labor studygroup, the RIETI labor law and economics group, the OEIO conference at the University of Tokyo,and the 2008 Asian Conference on Applied Micro-Economics/Econometrics.
2Faculty of Economics, Hitotsubashi University.3Graduate School of Humanities and Social Sciences, The University of Tsukuba.4Department of Economics, The University of Michigan.

Abstract
Japan’s labor standard law defines weekly legal work hours, and employers must pay a 25-percent wage premium for overtime. The number of legal work hours was 48 in 1987 andgradually declined to 40 by 1997. During the corresponding period, the average weeklyhours of work dropped from 45 to 41, suggesting the causal effect of legal regulation on theactual hours of work. Exploiting the different timing of the regulation change by industryand establishment size, this paper estimates the causal impact of legal work hour reductionon labor market outcomes. The analysis results indicate that a one-hour reduction of legalwork hours led to a reduction of 0.14 actual hours worked, but it was not accompanied bya reduction in monthly cash earnings. The recruitment of new school graduates was sup-pressed in response to an increase in the hourly wage rate.
JEL Classification: J23 (Labor Demand); J80 (Labor Standards: General)Keywords: Work Hour Regulation; Labor Standard Law; Overtime Premium; Hours ofWork; Japan

1 Introduction
Setting legal standard work hours has long been used as a policy tool to reduce the actual
hours worked, and recently it has attracted attention as a tool to attain employment creation
through work sharing. With long work hours compared with other developed countries as a
background (Estevao and Sa (2008)), the revision of the Labor Standard Law that sets work
hour regulation is vigorously debated in Japan (Ogura (2007)).
In contrast to the interest in the effect of work hour regulation on actual work hours,
theoretical works reveal that the effect of legal work hours on actual work hours depends on
the parameter values of the production function and the fixed cost of employment, even in a
perfectly competitive labor market where hourly wage rate is exogenously given (Calmfors
and Hoel (1988) and the references therein), and even more fundamentally, the structure of
the labor market, whether wage rate is exogenously determined or not ((Boeri et al., 2008,
Chapter 4)). In response to the need for empirical works to gauge plausible effects, several
papers have emerged to examine its actual effects.1 Hunt (1999) examines the effect of the
reduction of standard work hours from 40 to 35 in Germany from the mid 1980s to the mid
1990s. She finds that a one-hour reduction of standard work hours reduces the actual work
hours by 0.8 to 1 hour. This reduction of actual work hours was not fully compensated for
by a reduction in monthly salary, and it resulted in an employment reduction because the
hourly wage rate increased. Crepon and Kramarz (2002) examines the French case of 1981
that reduced the standard hours from 40 to 39 without allowing for a reduction of weekly pay
for existing workers. They found this law change reduced employment among workers who
worked 40 hours before the reduction of standard hours and induced the workers’ turnover
1Several studies examine the effect of scheduled work hours on actual hours worked in the Japanesecontext. Brunello (1989) set up an macroeconomic model in which hours, employment, and earnings aresimultaneously determined with exogenous scheduled work hours. He fits the model to a macroeconomic time-series between 1973 and 1986. From the estimated parameters, he obtains a prediction that the reductionof legal work hours will prolong actual work hours, increase earnings, and reduce employment. Niimi (1998)and Saito and Tachibanaki (2002) examine the effect of the reduction of scheduled work hours on the levelof employment assuming the exogeneity of scheduled work hours. Niimi (1998) concludes that the reductionof legal work hours reduces employment, but Saito and Tachibanaki (2002) obtains the opposite prediction.These works do not explicitly discuss how legal work hours determine scheduled work hours.
1
that replaces workers with existing contracts with workers with new contracts. Estevao
and Sa (2008) examines additional standard hour reduction from 39 hours to 35 hours in
France between 2000 and 2002 and finds that standard hour reduction reduced actual hours
worked and increased hourly rate of pay and job workers’ turnover. Raposo and van Ours
(2008) finds similar results for 1996 revision of labor standard law in Portugal that reduced
workweek from 44 hours to 40 hours. Skuterud (2007) examines the case of Quebec, Canada
that reduced legal work hour from 44 hours to 40 hours between 1997 and 2000 and finds
effect on actual hours worked, but no effect on employment. Hamermesh and Trejo (2000)
examines the effect of an introduction of an 8 hours per day limit for men in 1980 in addition
to a pre-existing 40 hour per week limit in California and concluded that the work hour
regulation effectively reduced hours worked per day. It is worth noting that none of these
studies directly support the effectiveness of work-sharing.
Given burgeoning empirical literature on the effect of the legal work hour on actual hours
worked, this paper contributes to the literature by examining the Japanese experience from
1988 to 1997, which offers a very nice natural experiment. Japan experienced intense criti-
cism for its large current account surplus in the early 1980s, and the government responded
to this criticism by reducing domestic production through work hour reduction. The govern-
ment revised the labor standard act in 1987; before the revision, the number of legal work
hours was set at 48 per week and 8 per day, but the weekly legal work hours were gradually
reduced to 40 by 1997. The hours worked exceeding this legal limit should be compensated
by at least a 25-percent premium. The timing of the legal work hour reduction differed
across industries and establishment sizes.
Figure 1 indicates the time series of the weighted average of legal work hours weighted
by workers’ composition by industry and establishment size for mining, construction, man-
ufacturing, and public utility industries. The figure also includes the average work hours
of all workers in the industries. This figure seems to suggest the causal effect of the legal
work hour on the actual hours worked, but the macroeconomic condition also changed dra-
2

matically during the corresponding period. The Japanese economy started contracting from
19912, and this almost coincided with the reduction of actual work hours. To identify the
effect of the legal work hours on actual work hours, we exploit the heterogeneous timing of
the reduction of legal work hours by industry and establishment size.
Analysis results based on repeated cross-sectional data from the Basic Survey of Wage
Structure suggest that the current legal work hours assigned to specific industries and estab-
lishment sizes had modest effects on actual hours worked. The most-preferred specification
that allows for year-, industry-, and establishment size-specific effects indicates that a re-
duction of one legal work hour led to 0.14 fewer actual hours worked. Shortened legal work
hours reduce actual hours worked, but they virtually do not affect the monthly salary. There
is no sign of maneuvering the straight wage rate or bonus payments to neutralize the effect
of legal work hour reduction. Anecdotes suggest that reducing the monthly wage of existing
workers in accordance with the work hour reduction was extremely difficult at the time be-
cause of opposition by workers and labor unions. The reduced work hours without a monthly
pay reduction resulted in an increase of the hourly wage rate. The adjustment took place
at the margin of the recruitment of new school graduates. The fraction of newly recruited
workers from school to existing permanent employees was reduced by 0.1 percentage point in
response to the one-hour reduction of the legal work hour, while the average new recruitment
rate between 1989 and 1999 was around 5 percent.
This paper is organized as follows. Section 2 reviews the legal setting of Japan’s legal
work hour. Section 3 lays out a theoretical discussion on the possible effects of the legal
work hour on actual work hours. Section 4 discusses the econometric identification strategy.
Section 5 introduces the data set. Section 6 reports the estimation results. Section 7 further
discusses the effect of work hour regulation on monthly wage and the new recruitment of
workers. The last section concludes.
2see Motonishi and Yoshikawa (1999), Hayashi and Prescott (2002) and Kobayashi and Inaba (2006) forvarious explanations.
3

2 Legal Institution on Work Hour in Japan
Japan’s labor standard law prohibits employers from employing workers exceeding the daily
and weekly legal work hours. The current legal work hours are 40 per week and 8 per day
(Article 32). Employers can allow employees to exceed these legal limits only under an
agreement with a workers’ representative that represents the majority of employees. This
agreement is called the Article 36 agreement because Article 36 of Labor Standards Law de-
fines exceptions to the legal work hour standard. Overtime work hours under this agreement
should be compensated by at least a 25-percent wage premium (Article 37).3
The weekly legal work hours had been set at 48 per week until 1987 and then gradually
declined to 40 by 1997. In response to diplomatic pressure to reduce the current account
surplus, prior to the Tokyo summit of May 1986, the Japanese government established a
clear policy goal to set a standard of 40 work hours per week. In accordance with this
policy goal, the Labor Standard Law was revised in 1987 and implemented from April 1,
1988. Moratorium periods were given depending on industry and establishment size, and
this transition is summarized in Appendix Table 1. The moratorium periods ended by March
1997, by which time the standard work hours had become 40 hours per week uniformly across
industries and establishment sizes with a few exceptions.4
Another important legal standard was set by the Temporary Act for the Promotion of
Work Hour Reduction, which is often called Jitan Sokushin Ho, enacted on September 1,
1992. The law was effective for five years and offered three legal provisions. First, the law
promoted the formation of an establishment-level committee, which consisted of employer
and employee representatives, for work hour reduction. The agreement in the committee
that is submitted to local labor standard office becomes a legally binding contact as a usual
3See (Sugeno, 2002, Chapter 3 Section 5) for an overview of the Japanese legal system on work hours.4Exceptions apply to small establishments that usually hire less than 10 employees in commerce and
service industries. In addition, the workers in managerial-supervising positions are exempted from the workhour regulation, and for those workers, overtime work hours and overtime compensation are not recorded(Article 41). The definition of the managerial-supervising position is rather vague, and there are accumulatedcourt cases over this definition.
4

labor agreement (Roushi Kyoyaku). Second, the law provided the potential exemption from
the Antitrust Law for the employers’ collusion in an effort to reduce work hours. This
exemption was provided because establishments may exceedingly compete for quick service,
and this excess competition may result in long working hours. Third, the law established a
subsidy scheme that provided up to 3 million yen (about 30 thousand US dollars) to promote
labor-saving capital investment for establishments that hired up to 300 regular employees.
This paper abstracts from the effect of Jitan Sokushin Ho, but the law’s effect should be
absorbed by year dummy variables or the interaction terms of year and establishment size
dummy variables.
3 Theory
This section discusses the effect of legal work hours on the actual hours worked and em-
ployment based on a simple static labor demand model, as in Calmfors and Hoel (1988)
and Hunt (1999). Assume the firm produces output by using labor and capital and it faces
an exogenous wage rate (w), rental rate of capital (r). The firm chooses the hours of work
per worker (h), employment (N), and capital (K) given legal work hours (h̄), the overtime
premium (p), and the fixed cost of employment (f). The firm produces output sold at a
unit price using a given technology expressed as a production function g(h,N,K). The firm
solves the following profit maximization problem:
maxh,N,K
g(h,N, K)− whN − fN − pw max(0, (h− h̄))N − rK. (1)
The reduction of legal work hours h̄ increases the marginal cost of labor, and this reduces
employment through the scale effect. In addition, the increase of the marginal cost of labor
causes a substitution to capital. The isoquant and isocost curves on the hour and employment
planes are drawn in Figure 2. This figure also indicates how the isocost curve changes when
the number of legal work hours is reduced.
5
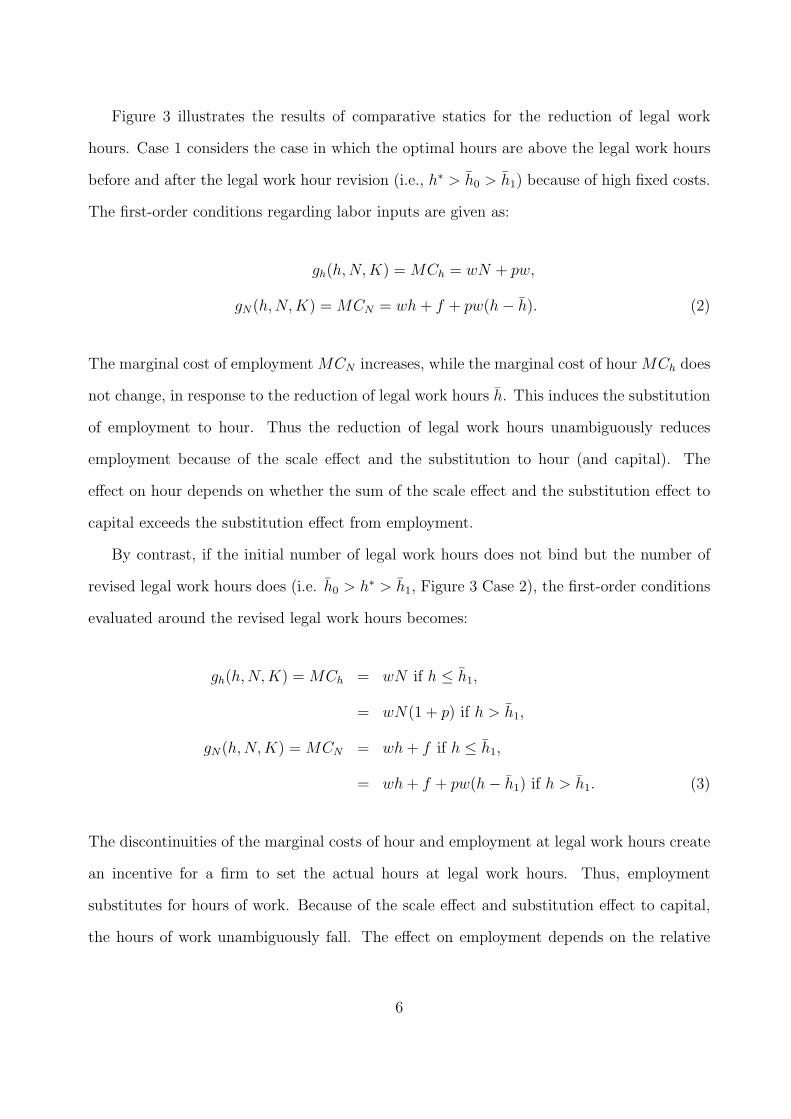
Figure 3 illustrates the results of comparative statics for the reduction of legal work
hours. Case 1 considers the case in which the optimal hours are above the legal work hours
before and after the legal work hour revision (i.e., h∗ > h̄0 > h̄1) because of high fixed costs.
The first-order conditions regarding labor inputs are given as:
gh(h,N, K) = MCh = wN + pw,
gN(h,N, K) = MCN = wh + f + pw(h− h̄). (2)
The marginal cost of employment MCN increases, while the marginal cost of hour MCh does
not change, in response to the reduction of legal work hours h̄. This induces the substitution
of employment to hour. Thus the reduction of legal work hours unambiguously reduces
employment because of the scale effect and the substitution to hour (and capital). The
effect on hour depends on whether the sum of the scale effect and the substitution effect to
capital exceeds the substitution effect from employment.
By contrast, if the initial number of legal work hours does not bind but the number of
revised legal work hours does (i.e. h̄0 > h∗ > h̄1, Figure 3 Case 2), the first-order conditions
evaluated around the revised legal work hours becomes:
gh(h,N, K) = MCh = wN if h ≤ h̄1,
= wN(1 + p) if h > h̄1,
gN(h,N, K) = MCN = wh + f if h ≤ h̄1,
= wh + f + pw(h− h̄1) if h > h̄1. (3)
The discontinuities of the marginal costs of hour and employment at legal work hours create
an incentive for a firm to set the actual hours at legal work hours. Thus, employment
substitutes for hours of work. Because of the scale effect and substitution effect to capital,
the hours of work unambiguously fall. The effect on employment depends on the relative
6

size of the substitution effect between hours and employment, and the sum of the scale effect
and the substitution effects to capital.
The analysis of the static model reveals that the reduction of legal work hours is more
likely to reduce actual hours worked when 1. the fixed cost of employment is small (i.e., the
legal work hour is initially not binding), 2. the scale effect is large (i.e., the labor cost share
is large and product demand is price elastic), and 3. the capital substitution is large (i.e.,
the elasticity of substitution between labor and capital is large and capital supply is price
elastic).
The dynamic structure of the legal work hour reduction adds another complexity to our
analysis. The legal work hour reduction in Japan in the late 1980s and early 1990s took
place gradually with moratorium periods, and the schedule of the legal work hour reduction
was known in 1988. The adjustment cost of work hours could be high because it involves a
reorganization of the work schedule and a full revision of the employment contract. If the
cost of the work hour adjustment is sufficiently large, the employer is likely to reduce the
actual work hours only once after the first reduction of legal work hours. Suppose that an
employer experiences a 2-hour reduction in the legal work hours this year and expects an
additional 2-hour reduction in 2 years. If the lump-sum adjustment cost is sufficiently high,
the employer reduces the work hours by 4 hours so that the employer pays the adjustment
cost only once, and not twice. In this situation, the steady state legal work hour, instead of
the current legal work hour, affects the actual work hours once the employer experiences the
legal work hour change.
4 Identification Strategies
The change in the actual hours of work in response to the change of legal work hours can be
examined by estimating the following regression model, which was also employed by Hunt
(1999).
hijst = αh̄jst + Dj + Ds + Dt + DjDs + DjDt + DsDt + uijst, (4)
7

where hijst is actual hours worked. The subscript i is for individual, j for industry, s for
establishment size, and t for year. Legal work hours is denoted as h̄jst defined by industry,
establishment size, and year. The dummy variables are included for industry, establish-
ment size, and year to capture industry, establishment size, and year-specific macroeconomic
shocks. In the actual implementation, we gradually add the dummy variables to examine
which level of aggregate shock is the crucial determinant of work hours that is correlated
with legal work hours.
Additional identification information can be obtained from the heterogeneity of the initial
work hour distribution across industries and establishment sizes. The theory in the previous
section predicts that the reduction of legal work hours reduces actual hours worked through
the substitution effect when legal work hours are initially not binding but become binding
after the revision. The data set does not allow us to directly test this prediction at the
establishment level because it does not have a panel structure. We instead use the industry,
establishment size, year-level fraction of workers for whom the work hour regulation was
initially not binding but becomes binding after the revision.
The fraction of workers whose work hours are below the current legal work hours but
above the revised legal work hours in industry j, establishment size s in year t is denoted as
fajst. The estimation equation becomes:
hijst = α1h̄jst + α2h̄jst × fajst−1 + α3fajst−1 + dummy variables + uijst. (5)
The theory predicts α2 > 0 through the substitution effect because the higher the fraction
of affected workers, the more effective the work hour regulation is. If the reduction of work
hours in response to the legal work hour reduction is mainly caused by the scale effect,
α1 > 0, but α2 = 0 holds.
We further consider the econometric model that takes a dynamic adjustment into con-
sideration. The econometric model that allows for the lump-sum adjustment cost of work
8

hours becomes:
hijst = αh̄adjjst + dummy variables + uijst, (6)
where h̄adjjst = 48 if the legal work hour is not yet revised and h̄adj
jst = 40 once the legal work
hour is revised. This specification embodies the theoretical prediction that the adjustment
of work hours takes place at one time without a gradual adjustment.
5 Data
The data set used in this study is micro data from the Basic Survey on Wage Structure
(BSWS), compiled annually by the Japanese government between 1989 and 1999.5 This
survey is conducted in June of every year and includes observations randomly chosen from
almost all regions and industries in Japan except for agriculture. The annual number of
observations is approximately 1.5 million workers from 60-70 thousand establishments. The
sample includes all establishments with 10 or more employees in both private and public
sectors and all establishments that belong to private firms with 5 to 9 employees.
The establishments in the sample are randomly chosen in proportion to the size of prefec-
tures, industries, and number of employees from the Establishment and Enterprise Census
(EEC hereafter), which lists all establishments in Japan.6 The randomly selected estab-
lishments were asked to extract their workers’ information from their payroll records.7 The
establishment and individual files were merged using an establishment identification number.
The unit of analysis is an individual worker with relevant information from the establish-
5Having a cross-section before the initial reduction of the legal work hour before 1998 would have beenideal, but the data before 1989 were not available for this project.
6This list is revised every 2-5 years. Of the years relevant to our analysis, the lists were revised in 1986,1991, 1994, 1996, 1999, and 2001. The BSWS 1989-1992 sample is randomly picked from the 1986 EEClist, the 1993-1995 sample is from the 1991 list, the 1996-1997 sample is from the 1994 list, the 1998-2001sample is from the 1996 list, and the 2002-2003 sample is from the 1999 list. While the sampling is basedon the same list, about half of the establishments are chosen in two consecutive years, but only about 1/10of the establishments in the sample are picked at the time of the list revision. We should recognize the largediscontinuity of the analysis sample at the times of the list revision: 1993, 1996, 1998, and 2002.
7A person in charge of personnel matters in each establishment was asked to randomly choose a numberof workers from its pool of employees based on the given instructions for random sampling, including thesampling probability, which depended on the establishment’s size and industry.
9

ment to which he/she belongs. Among the variables related to work hours, scheduled work
hours and overtime work hours in June are available. Other variables include each worker’s
scheduled monthly payment in June, overtime payment in June, bonus payment of the previ-
ous calendar year, age, sex, educational attainment, full-time/part-time status, type of work
or job, employment status (with or without permanent status), working days/hours, as well
as the firm’s attributes, including the number of permanent workers (Joyo Rodo Sha)8, firm
size, industry, and location.
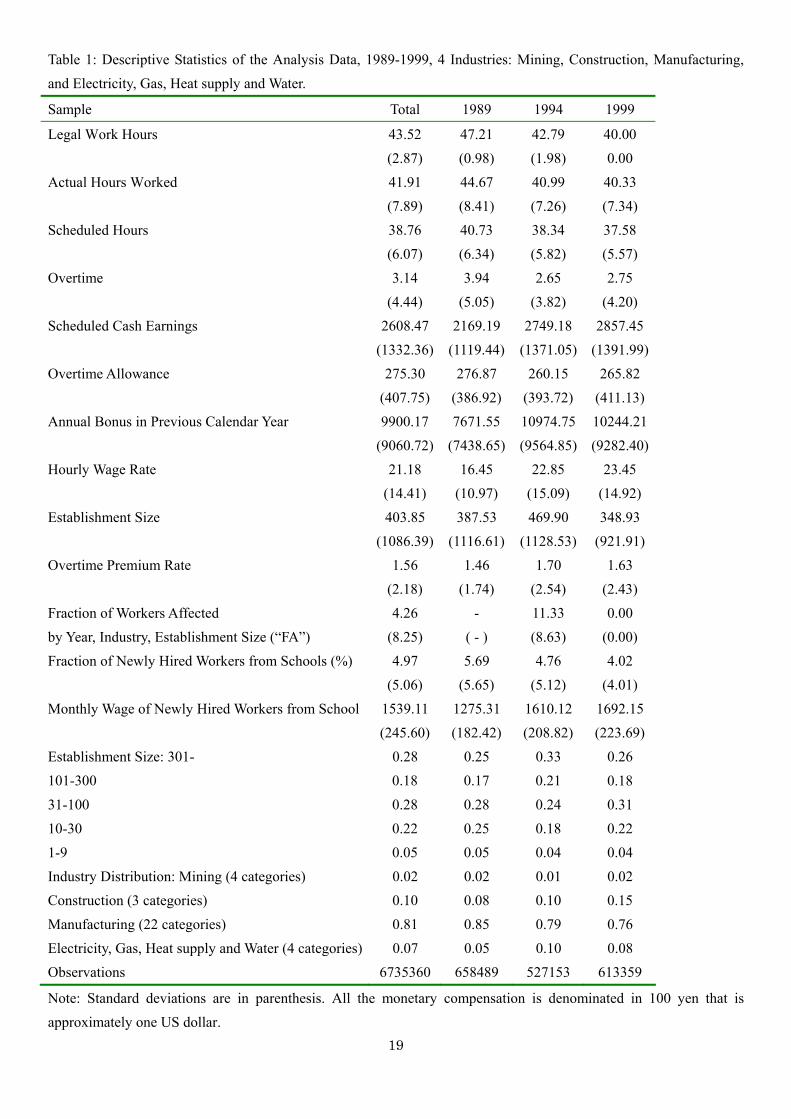
Table 1 reports the descriptive statistics of the analysis data. The weighted average of
legal work hours declined to 40 in 1999 from 47.21 in 1989. Weekly actual hours worked
also decreased from 44.67 in 1989 to 40.33 in 1999. While hours worked declined during
the period, monthly scheduled cash earnings and annual bonuses increased during the cor-
responding period. Accordingly, the imputed hourly wage rate increased from 1,645 yen to
2,345 yen between 1989 and 1999.
Figure 4 compares the distribution of actual hours worked (=scheduled work hours +
overtime work hours) in 1989 and 1999. The distribution apparently shifts to the left and
becomes less dispersed.
Figure 5 examines compliance to the overtime pay premium regulation. Labor standard
law requires employers to pay a wage premium of between 25 and 50 percent to compensate
for overtime. To examine compliance to this regulation, the overtime wage premium is
calculated by the hourly wage for overtime (= unscheduled wage in June / unscheduled
work hour in June) divided by the hourly wage for scheduled work hours (= (scheduled
wage in June - legal allowances) / scheduled work hours in June). In this calculation,
those workers in managerial-supervising positions who are exempted from the work hour
regulation are not included in the sample because overtime work hours and wage payment
are not recorded. The mode of the distribution is 1.25, but many workers do not receive the
8Those workers who satisfy one of the following three criteria are classified as permanent workers: 1. oncontracts that do not clearly specify a contractual time period, 2. on contracts that last more than a month,or 3. on contracts that last less than a month, but on which the workers worked 18 or more days in the lasttwo months. This classification includes part-time workers if one of the criteria above is satisfied.
10

expected overtime premium. This seemingly noncompliance to the law is partly because the
work hours exceeding scheduled work hours are not necessarily work hours exceeding the legal
work hours, but a portion may result from noncompliance to the law. The noncompliance to
the law attenuates the effect of the legal work hour on actual work hours. By contrast, in a
significant number of cases the overtime wage premium exceeds 25 percent. There are several
reasons for this. First, employers must pay at least a 35-percent holiday wage premium for
having workers work on holidays. Second, at least a 25-percent wage premium should be paid
for the work schedule that takes place between 10 p.m. and 5 a.m. as a midnight premium.
A midnight premium should be added on to the usual overtime or holiday premium if the
overtime or holiday work takes place during the aforementioned period, and thus the total
of the legal premium goes up to 60 percent.
6 Results on Hours Worked
Table 2 reports the results of the regressions of actual hours worked on legal work hours
with several specifications. The estimated coefficient of 0.481 reported in Column 1 implies
that a one-hour reduction of legal work hour reduces the actual work hour by about 30
minutes. This relationship is robust even after controlling for industry and establishment
heterogeneity, as reported in Columns 2, 3, and 4.
However, once the year effects are allowed for, the coefficient dramatically drops to 0.140,
as reported in Column 5. This implies that a one-hour reduction in the legal work hours
reduces the actual hours worked by a mere 8.4 minutes (=60 × 0.140). This coefficient
is rather stable after including year and industry interaction terms and industry and size
interaction terms, as reported in Columns 6 and 7. The coefficient further drops to 0.093
after including size and year interaction dummy variables, but there is not much variation
in legal work hour for this specification. If we take 0.140 as the causal effect, among 4 actual
work hour reductions between 1989 and 1999, about a 1-hour reduction (480 minutes ×
0.140) was attained by the reduction of legal work hours.
11

The effect of the legal work hour reduction on actual hours worked should depend on
the fraction of workers who are directly affected by the change of legal work hours, if the
substitution effect is important. Table 3 reports the regression results that include the
interaction terms of legal work hours and the lagged fraction of workers who are affected
by the reduction of work hours. The results are mixed, but the results in Columns 5,
6, and 8 confirm the theoretical prediction that the effect is stronger in the industries and
establishment sizes where the fraction of workers who are affected by the change in legal work
hour is high. However, the results are of weak statistical significance and rather suggestive for
the importance of the substitution effect. By contrast, the straight effect of legal work hours
on actual hours worked continues to be significant in a robust way, and this is suggestive for
the relative importance of the scale effect.
Table 4 reports the regression results that allow for a specific form of adjustment for
hours worked with dynamic consideration. The explanatory variable is “eventual legal work
hours” that takes 48 hours before the legal work hour revision and 40 hours after the revi-
sion. If establishments adjust their work hours toward 40 hours once the reduction of legal
work hour applies, this explanatory variable should pick up its effect. The estimated coef-
ficients are similar to the ones reported in Table 2, but once the year dummy variables are
included, the coefficient virtually becomes zero, as reported in Columns 5 through 8. The
dynamic adjustment consideration does not seem to be an important explanation for why
the estimated coefficients reported in Table 2 are small.
Previous studies point out that there is nonnegotiable unrecorded hours of work in Japan
(Takahashi (2005) and Ogura (2007)) and one might wonder how this unrecorded hours of
work affect the previous estimates. We infer that its effect is minimal because the gap be-
tween employers’ reported hours of work and employees’ reported hours of work based on two
independent government surveys had been almost stable during the period of legal change,
which is 1988-1997 (Takahashi (2005)). Furthermore, to address the concern, we estimate the
hour equation only using production workers as analysis sample because unrecorded hours
12

of work is presumably negligible among production workers. Table 5 reports the results of
regression and we confirm that the coefficients are almost identical to the results reported
in Table 2 while the size of coefficients get slightly larger.
7 Effects on Wage and Employment
7.1 Effects on Monthly Wage
The theoretical analysis in the previous section assumed that the firms are wage takers
operating in a perfectly competitive market. In the presence of friction in the labor market,
however, firms and workers could potentially negotiate a package of total compensation and
work hours.
Within this negotiation framework, Trejo (1991) points out that efficient negotiations be-
tween firms and workers nullify the work hour regulation because firms and workers continue
to contract on the identical package of total compensation and work hours. He finds evidence
for this in the US. In contrast, Hunt (1999) finds that monthly pay had not changed when
actual hours declined in the mid 1980s in Germany and, as a result, the effective hourly wage
increased. Nymoen (1989) also found that, in the short run, the reduction of work hours
increased hourly wage based on Norwegian time-series data. Pencavel and Holmlund (1988)
finds a similar result based on Swedish data.
To examine the effect of the tighter work hour regulation on monthly total compensation,
which is defined as scheduled wage and overtime wage in June plus bonus payments in the
previous year/12, is regressed upon the legal work hours. The results of regressions for
several specifications are reported in Table 6. The specifications without year effects render
negative coefficients, but the specifications with year effects, reported in Columns 5 through
8, indicate that the tighter work hour regulation had decreased monthly total compensation,
but the estimates are not statistically significant except for the specification reported in
Column 7. The size of the coefficient, which is 0.004, is very small because when the legal
13

work hour is reduced by one hour, which is a 2.5-percent reduction from 40 hours, monthly
pay is reduced by 0.4 percent. The elasticity is about 0.16. Combined with the previous
findings that the tighter work hour regulation reduced the actual hours worked, the reduction
of the legal work hours resulted in an increase of the hourly wage rate.
To further investigate the reasons why monthly total compensation hardly changed in
response to the reduction of the legal work hours, the monthly compensation is divided into
regular monthly salary and bonus parts, using the following relationship:
ln(Scheduled Wage + Overtime Wage + Annual Bonus/12)
= ln{(Scheduled Wage + Overtime Wage)
×(1 +Annual Bonus/12
Scheduled Wage + Overtime Wage)}
' ln(Scheduled Wage + Overtime Wage)
+Annual Bonus/12
Scheduled Wage + Overtime Wage.
The approximation ln(1 + ρ) ' ρ is used to derive the third line.
The log of monthly cash earnings and the fraction of bonus to monthly wage are separately
regressed on the legal work hour to decompose the legal work hour’s effect on monthly total
compensation.
Table 7 reports the results for the regressions of monthly wage, including overtime pay,
on legal work hours. The specifications with year dummy variables report that the tighter
legal hour restriction was associated with the reduction of monthly wage, but these estimates
are not statistically significant, except for a specification in Column 7. Table 8 reports the
results for the regressions of the fraction of bonus to monthly wage on legal work hours. All
the estimated coefficients are almost zero.
Overall, neither monthly wage nor the bonus fraction responds to the change of the work
hour resection in a significant way. Combined with evidence that the reduction in the legal
work hour reduced the actual hours worked, the reduced legal work hour increases the hourly
14
wage rate, or hourly labor cost.
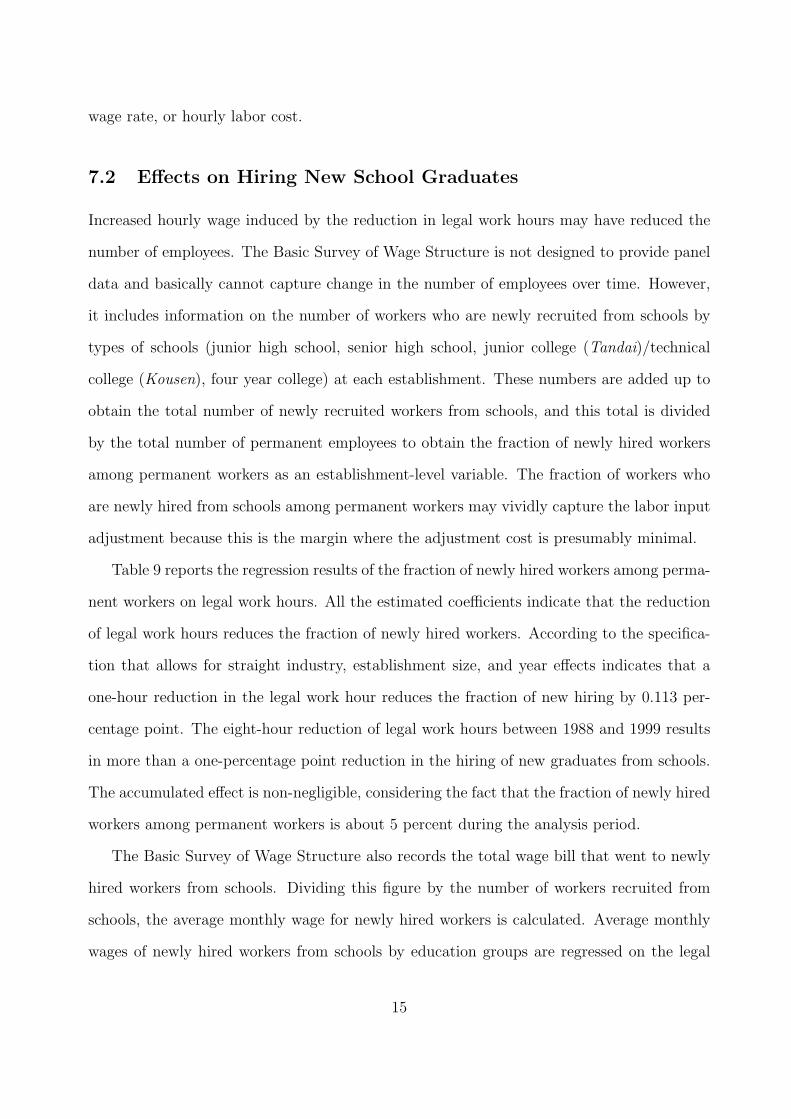
7.2 Effects on Hiring New School Graduates
Increased hourly wage induced by the reduction in legal work hours may have reduced the
number of employees. The Basic Survey of Wage Structure is not designed to provide panel
data and basically cannot capture change in the number of employees over time. However,
it includes information on the number of workers who are newly recruited from schools by
types of schools (junior high school, senior high school, junior college (Tandai)/technical
college (Kousen), four year college) at each establishment. These numbers are added up to
obtain the total number of newly recruited workers from schools, and this total is divided
by the total number of permanent employees to obtain the fraction of newly hired workers
among permanent workers as an establishment-level variable. The fraction of workers who
are newly hired from schools among permanent workers may vividly capture the labor input
adjustment because this is the margin where the adjustment cost is presumably minimal.
Table 9 reports the regression results of the fraction of newly hired workers among perma-
nent workers on legal work hours. All the estimated coefficients indicate that the reduction
of legal work hours reduces the fraction of newly hired workers. According to the specifica-
tion that allows for straight industry, establishment size, and year effects indicates that a
one-hour reduction in the legal work hour reduces the fraction of new hiring by 0.113 per-
centage point. The eight-hour reduction of legal work hours between 1988 and 1999 results
in more than a one-percentage point reduction in the hiring of new graduates from schools.
The accumulated effect is non-negligible, considering the fact that the fraction of newly hired
workers among permanent workers is about 5 percent during the analysis period.
The Basic Survey of Wage Structure also records the total wage bill that went to newly
hired workers from schools. Dividing this figure by the number of workers recruited from
schools, the average monthly wage for newly hired workers is calculated. Average monthly
wages of newly hired workers from schools by education groups are regressed on the legal
15

work hour. Table 10 reports the results of the regression, and the estimated coefficients for
the specifications with industry, establishment size, and year dummy variables imply that
the reduced legal work hours had no impact on the monthly salary of newly recruited workers
from schools. This nominal rigidity may well have amplified the quantity adjustment.
8 Conclusion
This paper examined the effect of the weekly legal work hour reduction on actual work hours
through both theoretical and empirical analysis. The theoretical analysis with exogenous
wage revealed that whether the reduction of the legal work hour reduces the actual work
hours critically depends on production technology, including the fixed cost of employment
and the elasticity of substitution between the hours of work and the number of workers.
The empirical examination exploited a natural experiment in Japan; the number of legal
work hours was reduced from 48 in 1988 to 40 in 1997. The analysis, based on micro data
from the Basic Survey of Wage Structure, revealed that the reduction of legal work hours
modestly reduced actual hours worked. The most preferred estimate implies that a one-hour
reduction in the legal work hours reduced actual work hours by 0.14 hour, or 8.4 minutes.
Thus an 8-hour reduction in the legal work hours had reduced work hours by 1 hours and 7
minutes. This is a modest effect, considering the fact that actual work hours had declined by
4 hours and 20 minutes: from 44 hours and 40 minutes in 1989 to 40 hours and 20 minutes in
1999. The effect of the legal work hour reduction on actual hours worked is not necessarily
stronger in industries where a higher fraction of workers are affected. This finding suggests
the relative importance of the scale effect rather than the substitution effect, contrary to
policymakers’ intentions.
While the reduction of the legal work hour modestly reduced the actual hours worked,
it did not decrease monthly compensation to workers, even after taking bonus payment into
account. As a result, the effective hourly wage increased after the legal work hour reduction.
This increase in hourly wage reduced new recruitment from schools. This set of results is
16

similar to the German experience in the 1980s reported by Hunt (1999). Nominal monthly
wage rigidity increased the hourly wage rate in response to a legal work hour reduction, even
without an explicit legal provision that employers could not reduce total weekly or monthly
pay in accordance with the reduced hours worked, as was the case in France (Crepon and
Kramarz (2002)). This mechanism could well be one of the reasons why work-sharing policies
does not seem to work well in many countries, as pointed out by Freeman (1997) and Kapteyn
et al. (2004).
As for Japanese macroeconomic implications, the finding in this paper is consistent with
that of Niimi (1998), indicating that the reduction of scheduled work hours does not increase
the number of employees. The increased hourly labor cost may well have contributed to the
increase of the labor wedge, which is the gap between the value of marginal labor product and
the marginal rate of substitution between leisure and consumption. Kobayashi and Inaba
(2006) pointed out the increase of labor wedge as a reason for the long-term stagnation of the
Japanese economy during the 1990s and the early 2000s, based on business cycle accounting.
In this sense, this paper offers additional evidence that reduced legal work hours can partly
explain Japan’s recession in the 1990s, as claimed by Hayashi and Prescott (2002), but
through a different mechanism.
References
Boeri, T., M. C. Burda, F. Kramarz, P. Cahuc, B. Crepon, D. S. Hamermesh, O. N. Skans,T. Schank, G. van Lomwel, P. Weil, and A. Zylberberg (2008). Working Hours and JobSharing in the EU and USA. Oxford University Press.
Brunello, G. (1989). The employment effects of shorter working hours: An application toJapanese data. Economica 56 (224), 473–486.
Calmfors, L. and M. Hoel (1988). Work sharing and overtime. The Scandinavian Journal ofEconomics 90 (1), 45–62.
Crepon, B. and F. Kramarz (2002). Employed 40 hours or not employed 39: Lessons fromthe 1982 mandatory reduction of the workweek. Journal of Political Economy 110 (6),1356–1389.
Estevao, M. and F. Sa (2008). The 35-hour workweek in france: Straightjacket or welfareimprovement? Economic Policy 23 (55), 417–463.
17
Freeman, R. (1997). Demand Side Policies for Low-Wage Labor Markets, Chapter Work-sharing to full employment: serious option of populist fallacy? Russell Sage Foundation.
Hamermesh, D. S. and S. J. Trejo (2000). The demand for hours of labor: Direct evidencefrom California. The Review of Economics and Statistics 82 (1), 38–47.
Hayashi, F. and E. Prescott (2002). The 1990s in Japan: A lost decade. Review of EconomicDynamics 5 (1), 206–235.
Hunt, J. (1999). Has work-sharing worked in Germany? The Quarterly Journal of Eco-nomics 114 (1), 117–148.
Kapteyn, A., A. Kalwiji, and A. Zaidi (2004). The myth of worksharing. Labour Eco-nomics 11 (3), 293–313.
Kobayashi, K. and M. Inaba (2006). Business cycle accounting for the Japanese economy.Japan and the World Economy 18 (4), 418–440.
Motonishi, T. and H. Yoshikawa (1999). Causes of the long stagnation of Japan during the1990s: Financial or real? Journal of the Japanese and International Economies 13 (3),181–200.
Niimi, K. (1998). Economic analysis on short work hour policy and work sharing. JapanResearch Review . in Japanese.
Nymoen, R. (1989). Wages and the length of the working day: an empirical test based on30 Norwegian quarterly manufacturing data. Scandinavian Journal of Economics 91 (3),599–612.
Ogura, K. (2007). Endless Workers. Nikkei Publisher. in Japanese.
Pencavel, J. and B. Holmlund (1988). The determination of wages, employment and work-hours in an economy with centralised wage-setting: Sweden, 1950-83. The EconomicJournal 98 (393), 1105–1126.
Raposo, P. and J. C. van Ours (2008). How working time reduction affects employment andearnings. IZA Discussion Papers 3723, Institute for the Study of Labor (IZA).
Saito, T. and T. Tachibanaki (2002). Empirical analysis on the possibility of work-sharingin Japan. Nihon Keizai Kenkyu 44, 46–62. in Japanese.
Skuterud, M. (2007). Identifying the potential of work-sharing as a job-creation strategy.Journal of Labor Economics 25 (2), 265–287.
Sugeno, K. (2002). Japanese employment and labor law (Translated from Japanese by LeoKanowitz ed.). Carolina Academic Press.
Takahashi, Y. (2005). Economic background of white collar workers’ unpaid overwork.Japanese Journal of Labor Studies 536, 56–68. in Japanese.
Trejo, S. J. (1991). The effects of overtime pay regulation on worker compensation. AmericanEconomic Review 81 (4), 719–740.
18
19
Table 1: Descriptive Statistics of the Analysis Data, 1989-1999, 4 Industries: Mining, Construction, Manufacturing,
and Electricity, Gas, Heat supply and Water.
Sample Total 1989 1994 1999
Legal Work Hours 43.52 47.21 42.79 40.00
(2.87) (0.98) (1.98) 0.00
Actual Hours Worked 41.91 44.67 40.99 40.33
(7.89) (8.41) (7.26) (7.34)
Scheduled Hours 38.76 40.73 38.34 37.58
(6.07) (6.34) (5.82) (5.57)
Overtime 3.14 3.94 2.65 2.75
(4.44) (5.05) (3.82) (4.20)
Scheduled Cash Earnings 2608.47 2169.19 2749.18 2857.45
(1332.36) (1119.44) (1371.05) (1391.99)
Overtime Allowance 275.30 276.87 260.15 265.82
(407.75) (386.92) (393.72) (411.13)
Annual Bonus in Previous Calendar Year 9900.17 7671.55 10974.75 10244.21
(9060.72) (7438.65) (9564.85) (9282.40)
Hourly Wage Rate 21.18 16.45 22.85 23.45
(14.41) (10.97) (15.09) (14.92)
Establishment Size 403.85 387.53 469.90 348.93
(1086.39) (1116.61) (1128.53) (921.91)
Overtime Premium Rate 1.56 1.46 1.70 1.63
(2.18) (1.74) (2.54) (2.43)
Fraction of Workers Affected 4.26 - 11.33 0.00
by Year, Industry, Establishment Size (“FA”) (8.25) ( - ) (8.63) (0.00)
Fraction of Newly Hired Workers from Schools (%) 4.97 5.69 4.76 4.02
(5.06) (5.65) (5.12) (4.01)
Monthly Wage of Newly Hired Workers from School 1539.11 1275.31 1610.12 1692.15
(245.60) (182.42) (208.82) (223.69)
Establishment Size: 301- 0.28 0.25 0.33 0.26
101-300 0.18 0.17 0.21 0.18
31-100 0.28 0.28 0.24 0.31
10-30 0.22 0.25 0.18 0.22
1-9 0.05 0.05 0.04 0.04
Industry Distribution: Mining (4 categories) 0.02 0.02 0.01 0.02
Construction (3 categories) 0.10 0.08 0.10 0.15
Manufacturing (22 categories) 0.81 0.85 0.79 0.76
Electricity, Gas, Heat supply and Water (4 categories) 0.07 0.05 0.10 0.08
Observations 6735360 658489 527153 613359
Note: Standard deviations are in parenthesis. All the monetary compensation is denominated in 100 yen that is
approximately one US dollar.

20
Table 2: The Effect of Legal Work Hours on Actual Hours Worked
Dependent var. Actual Hours ( = Scheduled Hours + Overtime)
(1) (2) (3) (4) (5) (6) (7) (8)
Legal Work Hours 0.481 0.472 0.450 0.441 0.140 0.130 0.132 0.093
(0.021) (0.015) (0.023) (0.016) (0.041) (0.032) (0.016) (0.068)
Industry No Yes No Yes Yes Yes Yes Yes
Establishment Size No No Yes Yes Yes Yes Yes Yes
Year No No No No Yes Yes Yes Yes
Year×Industry No No No No No Yes Yes Yes
Industry×Size No No No No No No Yes Yes
Size×Year No No No No No No No Yes
N 6735360 6735360 6735360 6735360 6735360 6735360 6735360 6735360
R-squared 0.031 0.065 0.033 0.069 0.083 0.087 0.096 0.096
Note: Standard errors robust against the clustering within year × industry × size clusters (1772 clusters) are reported
in parentheses. Actual hours worked is defined as scheduled hours plus overtime hours.
Table 3: The Effect of Legal Work Hours on Actual Hours Worked Exploiting the Variation of the Degree of Bind
Dependent var. Actual Hours
(1) (2) (3) (4) (5) (6) (7) (8)
Legal Work Hours 0.432 0.431 0.396 0.392 0.149 0.157 0.146 0.121
(0.028) (0.021) (0.030) (0.022) (0.047) (0.037) (0.020) (0.074)
0.008 0.004 0.008 0.005 0.006 0.004 -0.001 0.007 Legal Work Hours
* Fraction Affected (0.003) (0.002) (0.003) (0.002) (0.003) (0.003) (0.001) (0.003)
Fraction Affected -0.266 -0.127 -0.296 -0.171 -0.220 -0.165 0.040 -0.282
(0.127) (0.091) (0.125) (0.085) (0.127) (0.128) (0.053) (0.113)
Industry No Yes No Yes Yes Yes Yes Yes
Establishment Size No No Yes Yes Yes Yes Yes Yes
Year No No No No Yes Yes Yes Yes
Year×Industry No No No No No Yes Yes Yes
Industry×Size No No No No No No Yes Yes
Size×Year No No No No No No No Yes
N 6076065 6076065 6076065 6076065 6076065 6076065 6076065 6076065
R-squared 0.025 0.058 0.027 0.062 0.073 0.077 0.086 0.086
Note: Standard errors robust against the clustering within year × industry × size clusters (1598 clusters) are reported in
parentheses. “Fraction Affected” is defined by year, industry, establishment size, and this value is the fraction of
workers whose work hours in the previous year are between the legal work hours in the previous year and the current
legal work hours. The sample size is reduced from Table 2 because 1989 observations are dropped and “Bind” is not
defined for some cells because of missing observations.

21
Table 4: The Effect of Legal Work Hours on Actual Hours Worked Incorporating a Dynamic Adjustment
Dependent variable Actual Hours
(1) (2) (3) (4) (5) (6) (7) (8)
Eventual Legal Work Hours 0.462 0.441 0.425 0.406 0.019 0.035 0.038 0.014
(0.026) (0.015) (0.026) (0.013) (0.020) (0.019) (0.008) (0.023)
Industry No Yes No Yes Yes Yes Yes Yes
Establishment Size No No Yes Yes Yes Yes Yes Yes
Year No No No No Yes Yes Yes Yes
Year×Industry No No No No No Yes Yes Yes
Industry×Size No No No No No No Yes Yes
Size×Year No No No No No No No Yes
N 6735360 6735360 6735360 6735360 6735360 6735360 6735360 6735360
R-squared 0.023 0.057 0.026 0.062 0.083 0.087 0.095 0.096
Note: Standard errors robust against the clustering within year × industry × size clusters (1772 clusters) are reported in
parentheses. “Eventual Legal Work Hours” takes 48 hours if the current legal work hours are 48 hours and takes 40
hours if the current legal work hours are below 48 hours.
Table 5: The Effect of Legal Work Hours on Actual Hours Worked among Production Workers
Dependent var. Actual Hours Worked ( = Scheduled Hours + Overtime)
(1) (2) (3) (4) (5) (6) (7) (8)
Legal Work Hours 0.517 0.515 0.483 0.492 0.168 0.149 0.143 0.251
(0.026) (0.017) (0.027) (0.017) (0.050) (0.040) (0.020) (0.127)
Industry No Yes No Yes Yes Yes Yes Yes
Establishment Size No No Yes Yes Yes Yes Yes Yes
Year No No No No Yes Yes Yes Yes
Year×Industry No No No No No Yes Yes Yes
Industry×Size No No No No No No Yes Yes
Size×Year No No No No No No No Yes
N 3589764 3589764 3589764 3589764 3589764 3589764 3589764 3589764
R-squared 0.031 0.064 0.033 0.066 0.08 0.083 0.091 0.091
Note: Standard errors robust against the clustering within year × industry × size clusters (1249 clusters) are
reported in parentheses. Actual hours worked is defined as scheduled hours plus overtime hours.

22
Table 6: The Effect of Legal Work Hours on Monthly Total Compensation
Dependent variable ln (Monthly Total Compensation)
(1) (2) (3) (4) (5) (6) (7) (8)
Legal Work Hours -0.046 -0.042 -0.027 -0.022 0.004 0.004 0.004 0.004
(0.003) (0.002) (0.003) (0.001) (0.004) (0.003) (0.001) (0.004)
Industry No Yes No Yes Yes Yes Yes Yes
Establishment Size No No Yes Yes Yes Yes Yes Yes
Year No No No No Yes Yes Yes Yes
Year×Industry No No No No No Yes Yes Yes
Industry×Size No No No No No No Yes Yes
Size×Year No No No No No No No Yes
N 6735360 6735360 6735360 6735360 6735360 6735360 6735360 6735360
R-squared 0.047 0.189 0.125 0.271 0.275 0.277 0.288 0.288
Note: Standard errors robust against the clustering within year × industry × size clusters (1772 clusters) are reported in
parentheses. Monthly total compensation is defined as scheduled wage plus overtime wage plus one twelfth of the
bonus amount of previous calendar year.
Table 7: The Effect of Legal Work Hours on Cash Earnings in June
Dependent variable ln (Cash Earnings in June)
(1) (2) (3) (4) (5) (6) (7) (8)
Legal Work Hours -0.041 -0.037 -0.027 -0.022 0.003 0.003 0.004 0.003
(0.003) (0.002) (0.002) (0.001) (0.004) (0.003) (0.001) (0.003)
Industry No Yes No Yes Yes Yes Yes Yes
Establishment Size No No Yes Yes Yes Yes Yes Yes
Year No No No No Yes Yes Yes Yes
Year×Industry No No No No No Yes Yes Yes
Industry×Size No No No No No No Yes Yes
Size×Year No No No No No No No Yes
N 6735360 6735360 6735360 6735360 6735360 6735360 6735360 6735360
R-squared 0.046 0.179 0.100 0.240 0.243 0.245 0.255 0.255
Note: Standard errors robust against the clustering within year × industry × size clusters (1772 clusters) are reported in
parentheses. Cash earnings in June is defined as scheduled wage plus overtime wage in June.

23
Table 8: The Effect of Legal Work Hours on (annual bonus payment in previous year/12) / (cash earnings in June)
Dependent variable (Annual Bonus Payment in Previous Year/12) / (Cash Earnings in June)
(1) (2) (3) (4) (5) (6) (7) (8)
Legal Work Hours -0.007 -0.005 0.000 0.000 0.000 0.000 0.000 0.001
(0.001) (0.001) (0.001) (0.000) (0.001) (0.001) (0.000) (0.002)
Industry No Yes No Yes Yes Yes Yes Yes
Establishment Size No No Yes Yes Yes Yes Yes Yes
Year No No No No Yes Yes Yes Yes
Year×Industry No No No No No Yes Yes Yes
Industry×Size No No No No No No Yes Yes
Size×Year No No No No No No No Yes
N 6735360 6735360 6735360 6735360 6735360 6735360 6735360 6735360
R-squared 0.015 0.112 0.145 0.229 0.233 0.236 0.246 0.246
Note: Standard errors robust against the clustering within year × industry × size clusters (1772 clusters) are reported in
parentheses. Cash earnings in June is defined as scheduled wage plus overtime wage in June.
Table 9: The Effect of Legal Work Hours on the hiring ratio of New Graduates to Permanent Employees
Dependent variable (Number of Hiring from New Graduates) / (Number of Permanent Employees) * 100
(1) (2) (3) (4) (5) (6) (7) (8)
Legal Work Hours 0.326 0.322 0.198 0.203 0.126 0.113 0.109 0.259
(0.022) (0.018) (0.013) (0.012) (0.040) (0.031) (0.026) (0.109)
Industry No Yes No Yes Yes Yes Yes Yes
Establishment Size No No Yes Yes Yes Yes Yes Yes
Year No No No No Yes Yes Yes Yes
Year×Industry No No No No No Yes Yes Yes
Industry×Size No No No No No No Yes Yes
Size×Year No No No No No No No Yes
N 98263 98263 98263 98263 98263 98263 98263 98263
R-squared 0.031 0.056 0.180 0.191 0.192 0.199 0.208 0.215
Note: Observation units are establishments. Standard errors robust against the clustering within year × industry× size
clusters (1636 clusters) are reported in parentheses.

Table 10: The Effect of Legal Work Hours on Monthly Wage of New Graduates
Dependent var. Log (Monthly Wage of New Graduates)
(1) (2) (3) (4) (5) (6) (7) (8)
Legal Work Hours -0.032 -0.031 -0.030 -0.029 -0.001 -0.001 -0.001 -0.003
(0.001) (0.001) (0.001) (0.001) (0.001) (0.001) (0.001) (0.003)
Industry No Yes No Yes Yes Yes Yes Yes
Establishment Size No No Yes Yes Yes Yes Yes Yes
Year No No No No Yes Yes Yes Yes
Year×Industry No No No No No Yes Yes Yes
Industry×Size No No No No No No Yes Yes
Size×Year No No No No No No No Yes
N 98263 98263 98263 98263 98263 98263 98263 98263
R-squared 0.282 0.353 0.288 0.363 0.443 0.447 0.456 0.458
Note: Observation units are establishments. Standard errors robust against the clustering within year × industry× size
clusters (1636 clusters) are reported in parentheses.
Figure 1: Time Series of Weighted Average of the Work Hour Standard and Actual Work Hours
40
42
44
46
48
hou
rs/w
eek
1990 1993 1996 1999year
Average of Actual Work Hours Average of Standard Work Hours
Note: Figures are based on microdata of Basic Survey of Wage Structure.
24

Figure 2: Isocost Curve with the Work Hour Standard
Isoquant Curve
),;,( qkNhgf
Isocost Curve
hhifrKNhhpwfNwhNC
)(
hhifrKfNwhN�
hh
hhpwfwh
rKC
hhfwh
rKC
N
if )(
if
N
Isocost Curve
Isoquant Curve
hh
When h decreases from 0h to 1h , the Isocost curve will switch to the red line.
N
Old Isocost Curve New Isocost Curve
0h1h h
25

Figure 3: The Effect of the Work Hour Standard Change on Actual Work Hours and Employment
(Case 1) *01 hhh The optimal hours are above even the original standard hours.
(Case 2) 01 * hhh The initial standard hours do not bind, but the revised standard hours do.
(Case 3) 01* hhh The optimal hours are below even the revised standard hours.
Case 1 is likely to occur when the fixed cost of employment f is high.
The higher f becomes, the flatter of the slope of isocost will be.
�
hhifhhpwfwh
pwN
hhiffwh
wN
MC
MCSlope
fN
h
)(
)1(
Case 1 (f is high) *01 hhh
N
h
0h1h *0h
Substitution Effect
Scale Effect
Substitution Effect: The slope gets flatter at the new tangent point.
)(
)1(
hhpwfwh
pwN
MC
MCSlope
N
h
26
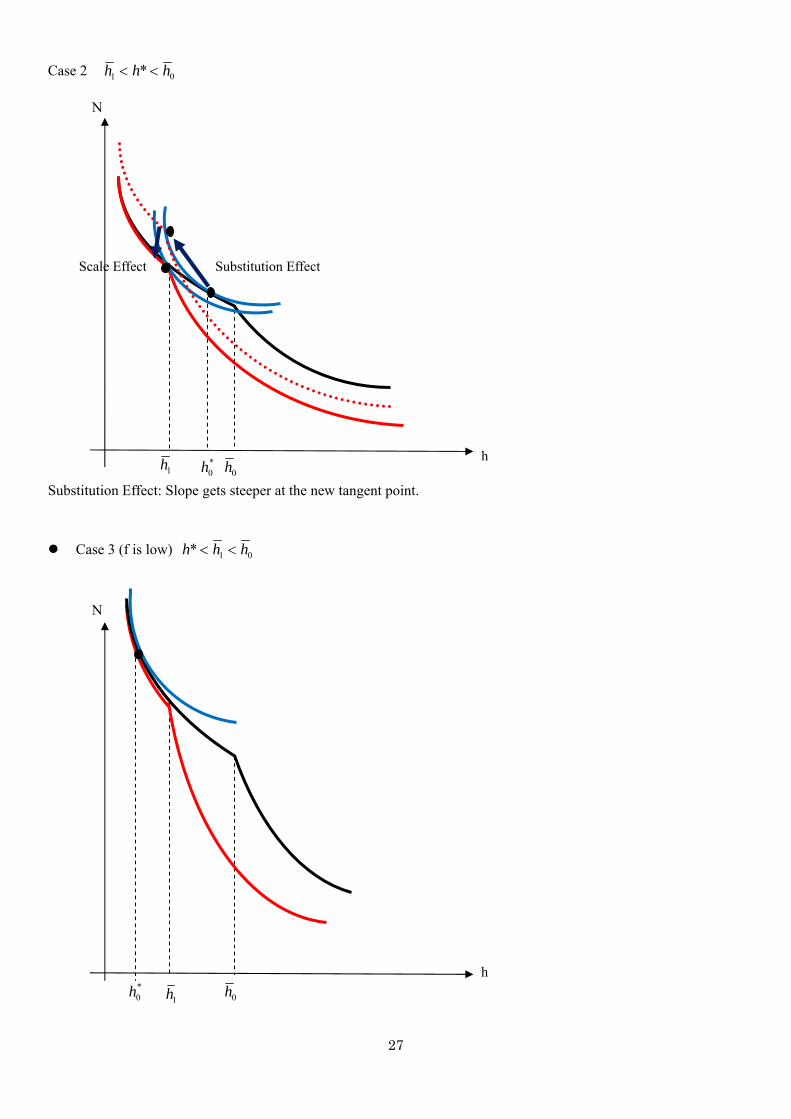
Case 2 01 * hhh
N
27
Substitution Effect: Slope gets steeper at the new tangent point.
Case 3 (f is low) 01* hhh
N
h 0h1h *
0h
Substitution Effect Scale Effect
0h1h
*0h
h

Figure 4: Distribution of Actual Work Hours, 1989 and 1999 0
.02
.04
.06
.08
.1
10 30 50 70Actual Work Hours(hours/week)
1989 1999
Distribution of Actual Work Hours
Figure 5: Compliance to overtime premium regulation
0.5
11
.52
2.5
Den
sity
0 1 1.25 2 3Overtime Premium Rate
Histogram of Overtime Premium Rate;1989-1999
Note: Hours Scheduled / )Allowances- Wage(Scheduled
Hours Overtime / WageOvertimeRate Premium Overtime
28

29
Appendix Table 1: History of Standard Work Hours (Industries 1-3 are used for the analysis)
1988/4~1991/3 1991/4~1993/3
Type of Industry/Establishment Size 301- 101-
300
31-
100
10-30 1-9 301- 101-
300
31-
100
10-30 1-9
1.Manufacturing 46 46 48 48 48 44 44 46 46 46
2.Mining 48 48 48 48 48 46 46 46 46 46
3.Construction 46 48 48 48 48 44 46 46 46 46
4.Transportation 48 48 48 48 48 46 46 46 46 46
5.Handling Cargo 46 46 46 48 48 44 44 44 46 46
8.Commercial 46 46 48 48 48* 44 44 46 46 48
9.Banking/Advertising 46 46 46 46 46 44 44 44 44 44
10.Motion Picture/Theatrical Performance 46 46 46 48 48* 44 44 44 46 48
11.Communication 46 46 46 46 46 44 44 44 44 44
12.Education and Research 46 46 46 46 46 44 44 44 44 44
13.Health and Hygiene 46 46 46 48 48* 44 44 44 46 48
14.Service Trade and Reception Center 46 48 48 48 48* 44 46 46 46 48
15.Sanitation and Livestock 48 48 48 48 48 46 46 46 46 46
16.Public Agencies 46 46 46 46 46 44 44 44 44 44
17.Other*** 46 48 48 48 48 44 46 46 46 46
1993/4~1994/3 1994/4~1995/3
Type of Industry/Establishment Size 301- 101-
300
31-
100
10-30 1-9 301- 101-
300
31-
100
10-30 1-9
1.Manufacturing 44 44 46 46 46 40 44 44 44 46
2.Mining 44 44 46 46 46 44 44 44 44 46
3.Construction 44 44 46 46 46 40 44 44 44 46
4.Transportation 44 44 46 46 46 44 44 44 44 46
5.Handling Cargo 44 44 44 46 46 44 44 44 44 46
8.Commercial 44 44 46 46 48 40 44 44 44 46**
9.Banking/Advertising 44 44 44 44 44 40 40 40 40 40
10.Motion Picture/Theatrical Performance 44 44 44 46 48 40 40 44 44 46
11.Communication 44 44 44 44 44 40 40 40 40 40
12.Education and Research 44 44 44 44 44 40 44 44 44 44
13.Health and Hygiene 44 44 44 46 48 40 44 44 44 46**
14.Service Trade and Reception Center 44 44 46 46 48 40 44 44 44 46
15.Sanitation and Livestock 44 44 46 46 46 44 44 44 44 46
16.Public Agencies 44 44 44 44 44 40 40 40 40 40
17.Other*** 44 44 46 46 46 40 40 44 44 44

30
Appendix Table 1 (Continued)
1995/4~1997/3 1997/4~2001/3
Type of Industry/Establishment Size 301- 101-
300
31-
100
10-30 1-9 301- 101-
300
31-
100
10-30 1-9
1.Manufacturing 40 44 44 44 44 40 40 40 40 40
2.Mining 44 44 44 44 44 40 40 40 40 40
3.Construction 40 44 44 44 44 40 40 40 40 40
4.Transportation 44 44 44 44 44 40 40 40 40 40
5.Handling Cargo 44 44 44 44 44 40 40 40 40 40
8.Commercial 40 44 44 44 46 40 40 40 40 46
9.Banking/Advertising 40 40 40 40 40 40 40 40 40 40
10.Motion Picture/Theatrical Performance 40 40 44 44 46 40 40 40 40 46
11.Communication 40 40 40 40 40 40 40 40 40 40
12.Education and Research 40 44 44 44 44 40 40 40 40 40
13.Health and Hygiene 40 44 44 44 46 40 40 40 40 46
14.Service Trade and Reception Center 40 44 44 44 46 40 40 40 40 46
15.Sanitation and Livestock 44 44 44 44 44 40 40 40 40 40
16.Public Agencies 40 40 40 40 40 40 40 40 40 40
17.Other 40 40 44 44 44 40 40 40 40 40
2001/4~
Type of Industry/Establishment Size 301- 101-
300
31-
100
10-30 1-9
1.Manufacturing 40 40 40 40 40
2.Mining 40 40 40 40 40
3.Construction 40 40 40 40 40
4.Transportation 40 40 40 40 40
5.Handling Cargo 40 40 40 40 40
8.Commercial 40 40 40 40 44
9.Banking/Advertising 40 40 40 40 40
10.Motion Picture/Theatrical Performance 40 40 40 40 44
11.Communication 40 40 40 40 40
12.Education and Research 40 40 40 40 40
13.Health and Hygiene 40 40 40 40 44
14.Service Trade and Reception Center 40 40 40 40 44
15.Sanitation and Livestock 40 40 40 40 40
16.Public Agencies 40 40 40 40 40
17.Other 40 40 40 40 40
*Working hours of Commercial enterprises, Motion Picture and Theatrical Performance enterprises, Health and
Hygiene enterprises, and Service Trade/Reception Center enterprises with 1-4 employees shall be 54 hours per week
until 3/31 in 1991.
**Working hours of Commercial enterprises and Service Trade/Reception center enterprises with 1-4 employees shall

31
be 48 hours per week until 3/31 in 1995.
***Other excludes agricultural and forestry, marine products, and livest