laboratory 2 effect of detector and timing parameters on ... v32 2009-03-24.pdflaboratory 2. effect...
TRANSCRIPT
55
Laboratory 2
Effect of Detector and Timing Parameters on the Operation of the Cross Street of an
Isolated Intersection

56

57
CONTENTS (LABORATORY 2) 1. Introduction .................................................................................................................................................................. 59
1.1 Purpose .................................................................................................................................................................... 59
1.2 Goals and Learning Objectives ..................................................................................................................................... 59
1.3 Organization and Time Allocation ................................................................................................................................. 59
2. Terms........................................................................................................................................................................... 60
3. Experiment #1: How A Traffic Phase Times ........................................................................................................................ 61
3.1 Learning Objective ..................................................................................................................................................... 61
3.2 Overview .................................................................................................................................................................. 61
3.3 Questions to Consider ................................................................................................................................................ 61
3.4 List of Steps .............................................................................................................................................................. 61
3.5 Running the Experiment ............................................................................................................................................. 62
3.6 Discussion ................................................................................................................................................................ 64
4. Experiment #2: Effect Of Detection Zone Length On Green Duration ..................................................................................... 68
4.1 Learning Objective ..................................................................................................................................................... 68
4.2 Overview .................................................................................................................................................................. 68
4.3 Questions to Consider ................................................................................................................................................ 69
4.4 List of Steps .............................................................................................................................................................. 69
4.5 Running the Experiment ............................................................................................................................................. 70
4.6 Discussion ................................................................................................................................................................ 74
5. Experiment #3: Determining The Length Of The Minimum Green Time .................................................................................. 80
5.1 Learning Objective ..................................................................................................................................................... 80
5.2 Overview .................................................................................................................................................................. 80
5.3 Questions to Consider ............................................................................................................................................. 80
5.4 List of Steps .............................................................................................................................................................. 80
58
5.5 Running the Experiment ............................................................................................................................................. 81
5.6 Discussion ................................................................................................................................................................ 84
6. Experiment #4: Observing Vehicle Headways In The Departing Queue ................................................................................... 89
6.1 Learning Objectives ................................................................................................................................................... 89
6.2 Overview .................................................................................................................................................................. 89
6.3 Questions to Consider ................................................................................................................................................ 89
6.4 List of Steps .............................................................................................................................................................. 89
6.5 Running the Experiment ............................................................................................................................................. 90
6.6 Discussion ................................................................................................................................................................ 91
7. Experiment #5: Relating Headway To Unoccupancy Time And Vehicle Extension Time .............................................................. 94
7.1 Learning Objectives ................................................................................................................................................... 94
7.2 Overview .................................................................................................................................................................. 94
7.3 Questions to Consider ................................................................................................................................................ 94
7.4 List of Steps .............................................................................................................................................................. 94
7.5 Running the Experiment ............................................................................................................................................. 95
7.6 Discussion ................................................................................................................................................................ 97
8. Experiment #6: Design Exercise-Setting The Minimum Green Time And The Vehicle Extension Time ........................................ 101
8.1 Learning Objective ................................................................................................................................................... 101
8.2 Overview ................................................................................................................................................................ 101
8.3 Questions to Consider .............................................................................................................................................. 101
8.4 List of Steps ............................................................................................................................................................ 101
8.5 Running the Experiment ........................................................................................................................................... 102
8.6 Discussion .............................................................................................................................................................. 106
9. Closure: Summary Of Key Points Learned ........................................................................................................................ 112

Laboratory 2. Effect of Detector and Timing Parameters on the Operation of the Cross Street of an Isolated Intersection
Section 1. Introduction 59
1. INTRODUCTION
1.1 Purpose How and when should a green indication terminate at a signalized intersection? There are a number of factors that affect the termination of green including the desired efficiency of traffic signal operation, the quality of service provided to motorists, and the safety of motorists traveling through the intersection. In Laboratory 2, you will explore the timing and termination of a phase for the cross street approach of an isolated actuated intersection. You will focus on one aspect of the phase termination process: How the length of the detection zone, together with the Vehicle Extension time and Minimum Green time settings in the traffic controller, must be considered together in order to produce an efficient, safe, and quality operation. You will consider stop bar presence detection on the cross street with light to moderate traffic volumes. In Expermint#6, you will prepare a design, integrating the various concepts and skills that you have learned in Laboratory 2.
1.2 Goals and Learning Objectives The goal of Laboratory 2 is to develop a detector design (length of the detection zone) and timing design (Minimum Green and Vehicle Extension time parameters) for a cross street at an isolated intersection. When you have completed Laboratory 2 you will: • Understand the relationship between detection zone length,
detector location, Vehicle Extension time, and Minimum Green time for the operation of a phase.
• Be able to determine the duration of the Minimum Green time and the Vehicle Extension time given the length and placement of the detector.
1.3 Organization and Time Allocation Laboratory 2 is divided into nine sections, including this introduction. The eight sections that follow and the approximate time allocated to each section are listed in Table 1. Table 1 Laboratory sections and approximate completion times
Section Title Approximate Time (min)
1 Introduction 5
2 Terms 10
3 Experiment #1: How a traffic phase times
15
4 Experiment #2: Effect of detection zone length on green duration
15
5 Experiment #3: Determining the length of the Minimum Green time
30
6 Experiment #4: Observing vehicle headways in the departing queue
30
7 Experiment #5: Relating headway to unoccupancy time and Vehicle Extension time
45
8 Experiment #6: Design exercise- setting the Minimum Green time and the Vehicle Extension time
60
9 Closure: Summary of key points learned
15

Laboratory 2. Effect of Detector and Timing Parameters on the Operation of the Cross Street of an Isolated Intersection
Section 2. Terms 60
2. TERMS Standard definitions for traffic signal terminology are provided by the National Electrical Manufacturers Association (NEMA) [9] and by the National Transportation Communications for ITS Protocol (NTCIP) 1202 document, “Object Definitions for Actuated Traffic Signal Controller Units” [2]. Definitions are also provided in the Federal Highway Administration’s Traffic Signal Timing Manual [5]. The definitions presented here are adapted from these sources. Actuated Signal Control: A type of signal control in which the timing of each phase is at least partially controlled by detector actuations. Actuation: The operation of any type of detector. Call: An actuation of a phase by vehicle detection or by an internal signal controller setting (a “recall”). A phase that is not called will be skipped. Gap Out: A method of terminating a phase resulting when the Passage Timer expires. Interval: The duration of time during which the indications do not change their state (active or off). Typically, one or more timing parameters control the duration of an interval. The green interval duration is controlled by a number of parameters including minimum time, maximum time, and gap time. Isolated intersection: An intersection located outside the influence of and not coordinated with other signalized intersections, commonly one mile or more from other signalized intersections. Max Out: A method of terminating a phase resulting when the Maximum Green time for the phase is reached.
Maximum Green: The maximum length of time that a phase can be green in the presence of a conflicting call. Minimum Green: The minimum amount of time for a green indication that must be given to a phase. Movement: A path of travel through an intersection that is regulated by a signal indication. Typical vehicle movements are left, through, and right. Passage Time: A parameter that specifies the maximum allowable duration of time between vehicle calls on a phase before the phase is terminated (Also called Vehicle Interval, Gap, Passage Gap, or Unit Extension) [Note: the term Vehicle Extension (in lieu of “Phase Time”) is used in this text, as this is the terminology used by the Econolite ASC/3 traffic controller, the controller that is part of the MOST simulation environment.] Phase: A timing unit associated with the control of one or more indications or movements. Serviceable Conflicting Call: A call that occurs on a conflicting phase not having the right-of-way at the time the call is placed. Unoccupancy time: The time that a detection zone is unoccupied, measured from the departure of the rear end of one vehicle from the zone to the arrival of the front end of the following vehicle in the detection zone. [Note: This term is sometimes referred to as “gap time.”]
Laboratory 2. Effect of Detector and Timing Parameters on the Operation of the Cross Street of an Isolated Intersection
Section 3. Experiment #1: How A Traffic Phase Times 61
3. EXPERIMENT #1: HOW A TRAFFIC PHASE TIMES
3.1 Learning Objective • Be able to describe the two primary methods for the
termination of a traffic phase at an isolated intersection.
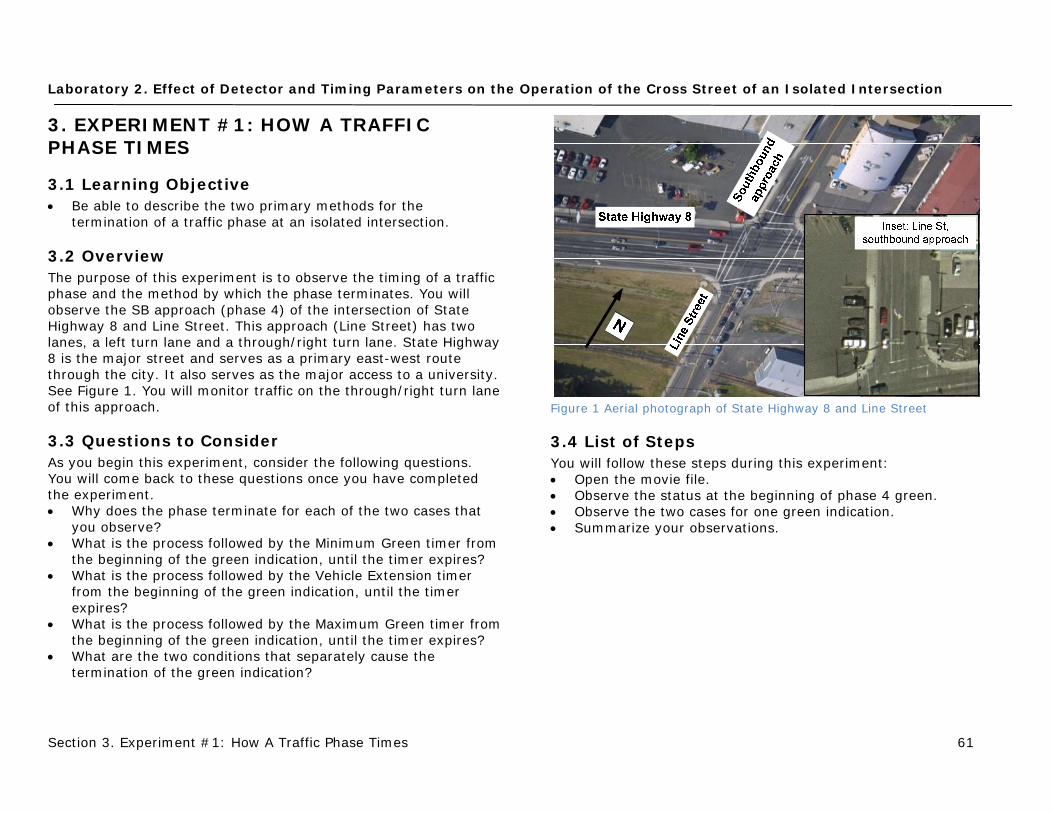
3.2 Overview The purpose of this experiment is to observe the timing of a traffic phase and the method by which the phase terminates. You will observe the SB approach (phase 4) of the intersection of State Highway 8 and Line Street. This approach (Line Street) has two lanes, a left turn lane and a through/right turn lane. State Highway 8 is the major street and serves as a primary east-west route through the city. It also serves as the major access to a university. See Figure 1. You will monitor traffic on the through/right turn lane of this approach.
3.3 Questions to Consider As you begin this experiment, consider the following questions. You will come back to these questions once you have completed the experiment. • Why does the phase terminate for each of the two cases that
you observe? • What is the process followed by the Minimum Green timer from
the beginning of the green indication, until the timer expires? • What is the process followed by the Vehicle Extension timer
from the beginning of the green indication, until the timer expires?
• What is the process followed by the Maximum Green timer from the beginning of the green indication, until the timer expires?
• What are the two conditions that separately cause the termination of the green indication?
Figure 1 Aerial photograph of State Highway 8 and Line Street
3.4 List of Steps You will follow these steps during this experiment: • Open the movie file. • Observe the status at the beginning of phase 4 green. • Observe the two cases for one green indication. • Summarize your observations.

Laboratory 2. Effect of Detector and Timing Parameters on the Operation of the Cross Street of an Isolated Intersection
Section 3. Experiment #1: How A Traffic Phase Times 62
3.5 Running the Experiment In this experiment, you will consider two cases, each illustrating a different method for the termination of phase 4 (which serves the SB through/right turn movements). You will observe how the phase times (the timing processes for the Minimum Green, Vehicle Extension, and Maximum Green timers), and how it terminates for each case. The two cases have been placed side-by-side in a movie format so that you can observe the traffic flow and timing processes at the same time. The simulation has been set to run at less than real time, slow enough so that you can observe all timing and traffic flow processes. Step 1. Open the movie file.
• Locate the “MOST input files” folder. • Go to the “Lab2” folder, then the “Exp1” folder. • Open the file: “lab2-exp1.wmv.” Step 2. Observe the status at the beginning of phase 4 green. • Move the animation to t = 45.6 seconds (which is equivalent to
about 00:23 on the Windows Media Player clock). Observe the following conditions for the scene on the left for the SB approach. o Two vehicles in queue, one of which is in the detection
zone. o The red indication showing for the SB movement (which is
about to end). o The ASC/3 controller status screen showing that phase 4 is
just about to begin timing (“T”) and has an active call (“C”) from the detector.
o The ASC/3 controller status screen showing that phase 4 is active in ring 1, that the Minimum Green timer is at 5.0 seconds, and that the Maximum Green timer is not active (“0.0”).
Figure 2 Traffic flow and controller status at t = 45.6
Note: There is a slight time delay between the ASC/3 controller and VISSIM, the simulation model. While the controller is now timing Minimum Green, the simulation will not be updated for a fraction of a second. As soon as you move forward from this instant in time, the simulation will show a green indication. These brief differences between what the controller is doing and what the simulation is displaying will only occasionally be noticeable (as when the simulation is paused).
Laboratory 2. Effect of Detector and Timing Parameters on the Operation of the Cross Street of an Isolated Intersection
Section 3. Experiment #1: How A Traffic Phase Times 63
Step 3. Observe the two cases for one green indication.
• [Note: Remember, the animation that you are about to observe plays at much slower than real time. This will allow you to monitor the traffic flow and the timing processes at the same time!]
• Start the Windows Media Player animation. • First, watch the traffic flow, the detector status, and the timing
processes for phase 4 for the case on the left. Monitor these conditions for the entire green indication.
• When this green indication is nearly complete for the case on the left, consider the reason for the phase terminating.
• Now turn your attention to the case on the right. The green indication is just beginning for this case. Again, monitor these conditions for the entire green indication.
• Note when the green indication ends for each of the two cases, and why.
Step 4. Summarize your observations. • You may have to run (or scroll through) the movie file more
than once to complete your observations. • Reflect on what you have observed on how a phase terminates. • Write a summary of your observations in the space provided at
right.
Observations:

Laboratory 2. Effect of Detector and Timing Parameters on the Operation of the Cross Street of an Isolated Intersection
Section 3. Experiment #1: How A Traffic Phase Times 64
3.6 Discussion Let’s now consider each of the five questions that were presented at the beginning of this experiment. • Why does the phase terminate for each of the two cases that
you observed? • What is the process followed by the Minimum Green timer from
the beginning of the green indication, until the timer expires? • What is the process followed by the Vehicle Extension timer
from the beginning of the green indication, until the timer expires?
• What is the process followed by the Maximum Green timer from the beginning of the green indication, until the timer expires?
• What are the two conditions that separately cause the termination of the green indication?
Take a few minutes to review each question and write brief answers to each question in the box on the right based on your observations from this experiment.
Answers to questions:

Laboratory 2. Effect of Detector and Timing Parameters on the Operation of the Cross Street of an Isolated Intersection
Section 3. Experiment #1: How A Traffic Phase Times 65
1. Why does the phase terminate for each of the two cases that you observed?
In the first case, the phase terminated because the Vehicle Extension timer expired (“gapped out”). In the second case, the phase terminated because the Maximum Green timer expired (“maxed out”). 2. What is the process followed by the Minimum Green timer from the beginning of the green indication, until the timer expires?
The Minimum Green timer begins timing at the start of the green indication. Its initial value is equal to the Minimum Green time. It continues timing until it reaches zero. The duration of the green indication is at least equal to the length of the Minimum Green time. See Figure 3. 3. What is the process followed by the Vehicle Extension timer from the beginning of the green indication, until the timer expires?
The Vehicle Extension timer begins timing when the detection zone becomes unoccupied and there is no call on the active phase. If it reaches zero, the green indication may terminate. If it has not expired, the Vehicle Extension timer is reset when another call is received. See Figure 4. 4. What is the process followed by the Maximum Green timer from the beginning of the green indication, until the timer expires?
The Maximum Green timer begins timing when there is a serviceable call on a conflicting phase. Once it begins to time, the timer continues until it reaches zero. When it reaches zero, the green indication is terminated. See Figure 5.
Figure 3 Minimum Green timing process
Figure 4 Vehicle Extension timing process
Figure 5 Maximum Green timing process
G
Vehicle Extension time setting
Maximum Green timer setting

Laboratory 2. Effect of Detector and Timing Parameters on the Operation of the Cross Street of an Isolated Intersection
Section 3. Experiment #1: How A Traffic Phase Times 66
5. What are the two conditions that separately cause the termination of the green indication?
There are two conditions for termination of the green indication at an isolated actuated intersection: (1) the Minimum Green timer equals zero and the Vehicle Extension timer equals zero, or (2) the Maximum Green timer equals zero. Figure 6 shows the ASC/3 controller status at t = 52.6, when phase 4 has just gapped out and the yellow interval has begun. This is the case on the left that you just observed. Figure 7 shows the ASC/3 controller status at t = 71.4, when phase 4 has just maxed out and the yellow interval has begun. This is the case on the right side of the movie.
Figure 6 Gap out process at t = 52.6 (case at left)
Figure 7 Max out process at t = 71.4 (case at right)

Laboratory 2. Effect of Detector and Timing Parameters on the Operation of the Cross Street of an Isolated Intersection
Section 3. Experiment #1: How A Traffic Phase Times 67
Figure 8 shows the process of “gapping out,” the first condition described on the previous page. The green indication begins at t = 45.7 seconds; the Minimum Green timer also begins at this point. The Minimum Green timer expires after 5 seconds. The Vehicle Extension timer begins timing down at t = 50.1 seconds, when the detection zone is first unoccupied. When it reaches zero (at t = 52.6 seconds), the green indication ends (the phase “gaps out”) and the yellow interval begins. Figure 9 shows the process of “maxing out,” the second condition described on the previous page. The green indication begins at t = 51.4 seconds. The Minimum Green timer begins at this point and continues to time down until it reaches zero at t = 56.4 seconds. The Vehicle Extension timer remains at its initial value (2.5 seconds) as long as a vehicle is in the detection zone (and a call remains active on phase 4). The timer begins to time down several times during this green indication but is reset to 2.5 when the next vehicle enters the detection zone. You can observe this process of timing and resetting in the middle chart of Figure 9. The Maximum Green timer also begins at the beginning of the green indication because there is an active call on phase 2 (a conflicting phase) at this point. The Maximum Green timer times down and the green indication terminates, even though the Vehicle Extension timer is still active.
Figure 8 Gap out process
Figure 9 Max out process
0
123
45
45 50 55 60 65 70 75
0.00.51.0
1.52.0
2.5
45 50 55 60 65 70 75
GreenSimulation time, sec
0
1
23
4
5
45 50 55 60 65 70 75
0.0
0.5
1.0
1.52.0
2.5
45 50 55 60 65 70 75
0
10
20
45 50 55 60 65 70 75
Laboratory 2. Effect of Detector and Timing Parameters on the Operation of the Cross Street of an Isolated Intersection
Section 4. Experiment #2: Effect of Detection Zone Length on Green Duration 68
4. EXPERIMENT #2: EFFECT OF DETECTION ZONE LENGTH ON GREEN DURATION
4.1 Learning Objective • Be able to relate the length of the detection zone to the
duration of the green indication.
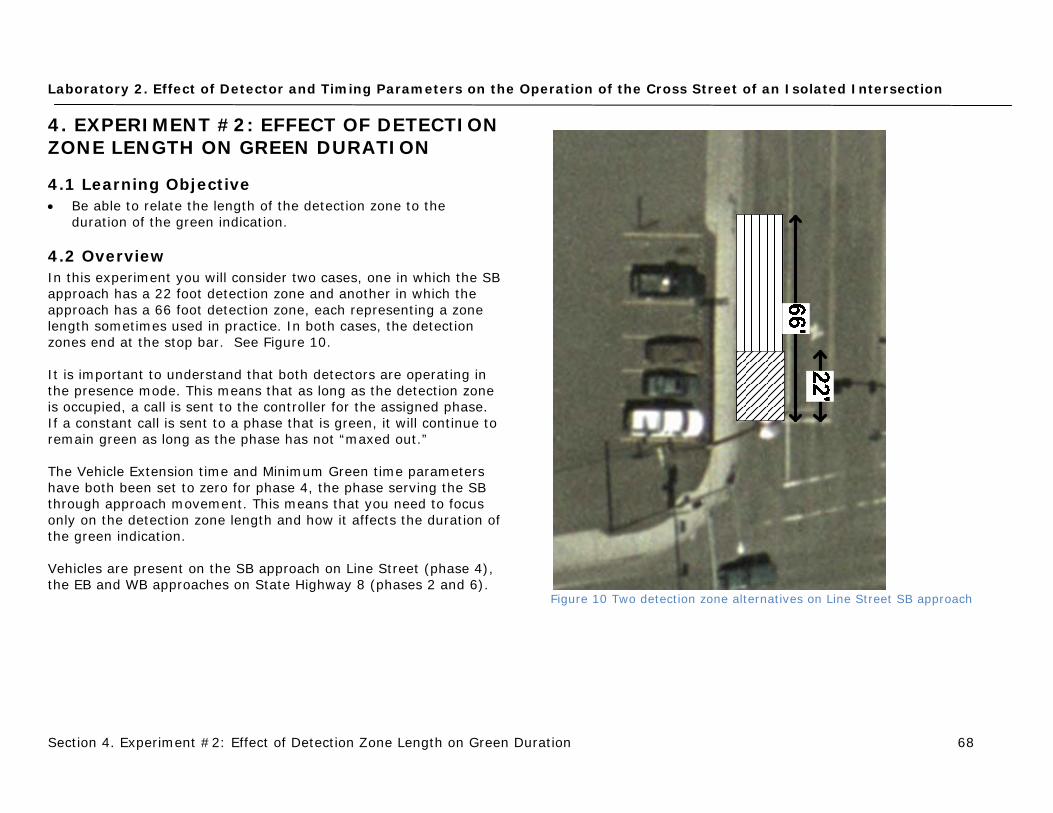
4.2 Overview In this experiment you will consider two cases, one in which the SB approach has a 22 foot detection zone and another in which the approach has a 66 foot detection zone, each representing a zone length sometimes used in practice. In both cases, the detection zones end at the stop bar. See Figure 10. It is important to understand that both detectors are operating in the presence mode. This means that as long as the detection zone is occupied, a call is sent to the controller for the assigned phase. If a constant call is sent to a phase that is green, it will continue to remain green as long as the phase has not “maxed out.” The Vehicle Extension time and Minimum Green time parameters have both been set to zero for phase 4, the phase serving the SB through approach movement. This means that you need to focus only on the detection zone length and how it affects the duration of the green indication. Vehicles are present on the SB approach on Line Street (phase 4), the EB and WB approaches on State Highway 8 (phases 2 and 6).
Figure 10 Two detection zone alternatives on Line Street SB approach
Laboratory 2. Effect of Detector and Timing Parameters on the Operation of the Cross Street of an Isolated Intersection
Section 4. Experiment #2: Effect of Detection Zone Length on Green Duration 69
4.3 Questions to Consider As you begin this experiment, consider the following questions. You will come back to these questions once you have completed the experiment. • When is the detector active and when is it inactive? • When does the phase terminate for the SB direction for each of
the two cases? • Why does the phase terminate for each of the two cases? • Do you think that the phase is operating efficiently or not for
the two cases? • Do you think that the quality of service provided to the motorist
is good or not? • If the phase terminates too early or extends too long, what
solutions should be considered?
4.4 List of Steps You will follow these steps during this experiment: • Start the MOST software tool and open the input files. • Note information in the simulation windows. • Start the simulation. • Observe the simulation at t = 49.1. • Observe the simulation at t = 49.9. • Observe the simulation from t = 54.0 to 54.3. • Observe the simulation from t = 60.1 to 61.4.

Laboratory 2. Effect of Detector and Timing Parameters on the Operation of the Cross Street of an Isolated Intersection
Section 4. Experiment #2: Effect of Detection Zone Length on Green Duration 70
4.5 Running the Experiment In this experiment, you will consider two cases, one with the detection zone length of 22 feet, and the other with a zone length of 66 feet. In both cases, the zones are located at the stop bar. The Vehicle Extension time and Minimum Green time are set to zero. The detectors are both operating in presence mode. You will observe how and when the phase terminates for both cases, and the status of the controller at several points in the simulation. Step 1. Start the MOST software tool and open the input files.
• Start the MOST software tool and select “Open File.” (See Figure 11)
• Locate the “MOST input files” folder. • Go to the “Lab2” folder, then the “Exp2” folder • Open the file for the 22 foot detector: “lab2-exp2-22ft.inp.” • Select “File”, then “Open Second File.” Open the file for the 66
foot detector: “lab2-exp2-66ft.inp.”
Figure 11 MOST interface, Open File menu

Laboratory 2. Effect of Detector and Timing Parameters on the Operation of the Cross Street of an Isolated Intersection
Section 4. Experiment #2: Effect of Detection Zone Length on Green Duration 71
Step 2. Note information in the simulation windows.
• You have several options for running the simulation. You will primarily use two options, running the simulation continuously (“Run Mode”) or advancing the simulation in 0.1 second time steps (“Run Mode Single Step”). See Figure 12.
• The simulation window shows the animation of vehicles traveling through the intersection as well as other data (see Figure 13): o The current simulation time is noted in the lower left. o The detection zones (and their numbers) are shown in each
approach lane as boxes.
Figure 12 Simulation run options
Figure 13 Features of animation window

Laboratory 2. Effect of Detector and Timing Parameters on the Operation of the Cross Street of an Isolated Intersection
Section 4. Experiment #2: Effect of Detection Zone Length on Green Duration 72
Step 3. Start the simulation.
• Select “Pause At” and enter “49.0.” This action will allow the simulation to run continuously until it reaches the time of t = 49.0 seconds.
• Press the “Run Mode” button to start the simulation. • Feel free to move the VISSIM and ASC/3 windows as needed to
provide an optimal view of the information provided. • [Note that when you select “49.0” above, the simulation
actually will pause 0.1 seconds after this time, as noted below. This results from a slight delay in the software response.]
Step 4. Observe the simulation at t = 49.1.
• When the simulation reaches t = 49.1 seconds, observe the conditions at the intersection and in the controller for both cases. See Figure 14.
• For the SB approach, four vehicles are in queue for both cases. • Point B on the controller status screen shows the status for
phases 2 and 6, the current active phases in rings 1 and 2. The red clearance timer is active, with a current value of 0.7 seconds. And, phases 2 and 6 have gapped out, as noted in the status screen.
• The controller status screen shows that phase 4 has an active call (noted by the “C” at point A) and is in “phase next” status (noted by the “N”). This means that when phase 2 has terminated, phase 4 will be the next phase to be served.
Figure 14 ASC/3 status screen at t = 49.1 for both cases
A
B

Laboratory 2. Effect of Detector and Timing Parameters on the Operation of the Cross Street of an Isolated Intersection
Section 4. Experiment #2: Effect of Detection Zone Length on Green Duration 73
Step 5. Observe the simulation at t = 49.9.
• “Single step” the simulation until it reaches t = 49.9 seconds. • Record your observations on the status of phase 4 in the box
on the right. What is the color of the active indication? Step 6. Observe the simulation from t = 54.1 to 54.3.
• Set “Pause At” to 53.9. • Click the “Run Mode” button. • “Single step” the simulation from t = 54.1 seconds to t = 54.3
seconds. • Observe the simulation on the left of the screen (the 22 foot
detector case). • Record your observations of the controller status window in the
box at right, noting in particular the status of any calls, the timing status of phase 4, and the timing processes and timing parameter values for phase 4.
• Also, record the status of the queue being served. Step 7. Observe the simulation from t = 60.1 to 61.4.
• Set “Pause At” to 59.8. • Click the “Run Mode” button. • “Single step” the simulation from t = 60.1 seconds to t = 61.4
seconds. • Observe the simulation on the right of the screen (the 66 foot
detector case). • Record your observations of the controller status window in the
box at right, noting in particular the status of any calls, the timing status of phase 4, and the timing processes and timing parameter values for phase 4.
• Also, record the status of the queue being served.
Observations at t = 49.9: Observations from t = 54.1 to 54.3: Observations from t = 60.1 to 61.4:

Laboratory 2. Effect of Detector and Timing Parameters on the Operation of the Cross Street of an Isolated Intersection
Section 4. Experiment #2: Effect of Detection Zone Length on Green Duration 74
4.6 Discussion Let’s now consider each of the six questions that were presented at the beginning of this experiment. • When is the detector active and when is it inactive? • When does the phase terminate for the SB direction for each of
the two cases? • Why does the phase terminate for each of the two cases? • Do you think that the phase is operating efficiently or not for
the two cases? • Do you think that the quality of service provided to the motorist
is good or not? • If the phase terminates too early or extends too long, what
solutions should be considered? Take a few minutes to review each question and write brief answers to each question in the box on the right based on your observations from this experiment.
Answers to questions:

Laboratory 2. Effect of Detector and Timing Parameters on the Operation of the Cross Street of an Isolated Intersection
Section 4. Experiment #2: Effect of Detection Zone Length on Green Duration 75
Let’s first examine data collected during the simulations that we’ve just observed. These data are shown in Table 2. For the 22 foot detection zone case, the duration of the green is 4.3 seconds. Only three vehicles are served before the green indication ends, and two vehicles are left unserved at the stop bar. For the 66 foot detection zone case, the green duration is 11.3 seconds. The detection zone becomes empty at 61.0 seconds, and the yellow interval begins at 61.2 seconds. Why? Because the Vehicle Extension time is zero and the phase will terminate immediately when the zone is empty. [Note: This apparent discrepancy is caused by a 0.1 second time lag between the ASC/3 controller clock and the simulation screen.]
Table 2 Data collection table with results
Event/Variable L=22’ L=66’
Beginning of green for SB approach (movement 2).
49.9 49.9
Detection zone for SB approach becomes empty.
54.0 61.0
Beginning of the yellow interval.
54.2 61.2
Number of vehicles served during green indication.
3 7
Duration of green.
4.3 11.3

Laboratory 2. Effect of Detector and Timing Parameters on the Operation of the Cross Street of an Isolated Intersection
Section 4. Experiment #2: Effect of Detection Zone Length on Green Duration 76
Let’s now review these data and consider again the questions that were asked at the beginning of this experiment. 1. When is the detector active and when is it inactive?
Figure 15 shows the controller status window, with the detector status data highlighted with the red boxes for phases 2 and 4. Here, phase 4 (the SB approach) has no active call (as indicated by the “.” in the controller status window). This is confirmed by looking at the SB approach where no vehicles are in the detection zone. While you can’t see the EB approach in Figure 15, you will note that there is an active call on phase 2 (as indicated by the “C” in the controller status window). 2. When does the phase terminate for the SB direction for each of the two cases?
From Table 2, you can see that phase 4 terminates at t = 54.2 seconds for the 22 foot detection zone case and at t = 61.2 seconds for the 66 foot case.
Figure 15 ASC/3 status screen showing call and timing status for phases 2 and 4 (case 1)

Laboratory 2. Effect of Detector and Timing Parameters on the Operation of the Cross Street of an Isolated Intersection
Section 4. Experiment #2: Effect of Detection Zone Length on Green Duration 77
3. Why does the phase terminate for each of the two cases?
For both cases, the phase terminates because the unoccupancy time exceeds the value set for the Vehicle Extension time. In this case, the Vehicle Extension time is set to zero, so the phase terminates immediately after the detection zone becomes empty. [Reminder: Unoccupancy time is the time that a detection zone is unoccupied, measured from the downstream departure of the rear end of one vehicle to the upstream arrival of the front end of the following vehicle in the detection zone. It is also referred to as “gap time.”] Figure 16 shows the status of the 66 foot detection zone case at t = 61.2. The black vehicle has just exited from the detection zone and the blue vehicle has not yet entered the zone. When the zone becomes empty, the call is dropped (note the “.” in the controller status window for phase 4), the green indication immediately terminates for the SB approach, and the yellow timer has begins timing. Finally, the status for phase 4 shows “gap out,” indicating that the phase is terminating because the unoccupancy time (the time that the detection is unoccupied) exceeds the value set for the Vehicle Extension time. In this example, the blue vehicle enters the intersection on yellow and clears before the conflicting phase begins.
Figure 16 ASC/3 controller status screen at t = 61.2 (case 2)

Laboratory 2. Effect of Detector and Timing Parameters on the Operation of the Cross Street of an Isolated Intersection
Section 4. Experiment #2: Effect of Detection Zone Length on Green Duration 78
You can also graphically show the interaction of the vehicles arriving and leaving the detection zone with the status of the phase. The two figures on the right illustrate the 66 foot detection zone case. Figure 17 shows the times that each vehicle enters into (diamond) and departs from (square) the detection zone. Figure 18 contrasts the times that one vehicle leaves the zone and the following vehicle enters the zone, zooming in for the time period that the green indication is active. For example, vehicle 4 enters the zone before vehicle 3 exits the zone, so that the zone is continuously occupied and the unoccupancy time is zero. The arrow emphasizes that the arrival of vehicle 4 into the zone occurs before the departure of vehicle 3 from the zone. By contrast, vehicle 6 exits the detection zone at t = 61.0, 0.6 seconds before vehicle 7 enters the zone. The unoccupancy time is thus 0.6 seconds, and since the Vehicle Extension time has been set to zero, the phase will terminate at this point. And, this is exactly what you observed in the animation. Here, the arrow notes that vehicle 6 departs from the zone before vehicle 7 arrives in the zone.
Figure 17 Arrival and departure times in detection zone
Figure 18 ( ) Unoccupancy time
R G Y R0
1
2
3
4
5
6
7
8
0 20 40 60 80
Vehi
cle
num
ber
Simulation time, sec
Arrival in zoneDeparture from zone
R G Y R0
1
2
3
4
5
6
7
8
45 50 55 60 65 70
Vehi
cle
num
ber
Simulation time, sec
Arrival in zoneDeparture from zone
4
3
7
6

Laboratory 2. Effect of Detector and Timing Parameters on the Operation of the Cross Street of an Isolated Intersection
Section 4. Experiment #2: Effect of Detection Zone Length on Green Duration 79
4. Do you think that the phase is operating efficiently or not for the two cases?
Clearly, the short detection zone does not reasonably serve all the vehicles in the queue. The longer detection zone provides more efficient service by clearing the last vehicle during the yellow. 5. Do you think that the quality of service provided to the motorist is good or not?
Only the longer zone provides efficient operation, while the 22 foot zone case “gaps out” too early. This is because there are still vehicles in the queue that should be served but were not. 6. If the phase terminates too early or extends too long, what solutions should be considered?
Our goal is to make sure that the queue that is present at the beginning of green is served and that the phase does not terminate too early (before the queue ends) or extend too long (after the queue has been served). The detection zone itself cannot do this alone. You also need to consider the Minimum Green time and the Vehicle Extension time, and the value that they bring to the operation of the intersection. This point can be illustrated by Figure 19, which shows the headways as measured at the stop bar for each of the first seven vehicles in the queue, for the 66 foot detection zone case. These headways vary about the ideal saturation headway value of 1.9 seconds, something that you would expect to see in the field as a result of the differences in driver behavior and reactions. This point is illustrated by the seventh vehicle in the queue which has a longer headway (2.9 seconds) and faces a yellow indication
because the unoccupancy time is greater than zero. In this case, the vehicle was too close to the intersection to stop and entered on yellow. In the following experiments, you will see how the Minimum Green time and the Vehicle Extension time can be used to maintain efficient operations and improve the quality of service to the motorist, in combination with the detection zone length.
Figure 19 Headway vs. time by position in queue
0.0
0.5
1.0
1.5
2.0
2.5
3.0
3.5
45 50 55 60 65
Hea
dway
Time
1
2
34 5
6
7
R G Y
Simulation time, sec

Laboratory 2. Effect of Detector and Timing Parameters on the Operation of the Cross Street of an Isolated Intersection
Section 5. Experiment #3: Determining the Length of the Minimum Green Time 80
5. EXPERIMENT #3: DETERMINING THE LENGTH OF THE MINIMUM GREEN TIME
5.1 Learning Objective • Be able to relate the length of the Minimum Green time to the
efficient operation of a phase.
5.2 Overview In this experiment, you will see the importance of the Minimum Green time during the early portion of the green indication, and how you can define the roles of the Minimum Green time and the Vehicle Extension time to ensure efficient intersection operations. You will again observe the operation of the SB approach of Line Street, at State Highway 8, and make observations about the operation. You will again consider stop bar detection, with a detection zone length of 22 feet.
5.3 Questions to Consider As you begin this experiment, consider the following questions. You will come back to these questions once you have completed the experiment. • When is the Minimum Green time too long? • How long should the Minimum Green time be in order to get
vehicles moving during the early portion of green? • What are the respective roles of Minimum Green time and
Vehicle Extension time in producing efficient operations?
5.4 List of Steps You will follow these steps during this experiment: • Start the MOST software tool and open the input files. • Verify that the signal timing settings in the ASC/3 controller
have been correctly set for phase 4. • Observe the traffic conditions and the controller status at the
end of red for phase 2. • Observe the timing and the termination of the SB phase for the
two cases, using “Run Mode Single Step.” • Observe vehicle start-ups, using “Run Mode Single Step.” (Case
1 only, left side)

Laboratory 2. Effect of Detector and Timing Parameters on the Operation of the Cross Street of an Isolated Intersection
Section 5. Experiment #3: Determining the Length of the Minimum Green Time 81
5.5 Running the Experiment Step 1. Start the MOST software tool and open the input files. • Start the MOST software tool and select “Open File.” • Locate the “MOST input files” folder. • Go to the “Lab2” folder, then the “Exp3” folder. • Open the first and second files for this experiment: “lab2-exp3-
5sec.inp” and “lab2-exp3-10sec.inp.” Step 2. Verify that the signal timing settings in the ASC/3 controller have been correctly set for phase 4. • Figure 20 shows the controller screen for the ASC/3 database
editor. To access this editor, select “Open ASC/3 Database Editor,” then select the controller number that you want to check.
• The Minimum Green time should be set to 5 seconds for phase 4 for the first case and 10 seconds for phase 4 for the second case.
• The Vehicle Extension time should be set to 2.2 seconds for phase 4.
Step 3. Observe the traffic conditions and the controller status at the end of red for phase 2.
• Set “Pause At” to 59.9. • Start the simulation using the “Run Mode” button. • At t = 60.0, observe the traffic on the SB approach and the
status of the timing processes for phase 2 and phase 4. • Record your observations in the box on the right.
Figure 20 ASC/3 Database Editor
Observations:
Laboratory 2. Effect of Detector and Timing Parameters on the Operation of the Cross Street of an Isolated Intersection
Section 5. Experiment #3: Determining the Length of the Minimum Green Time 82
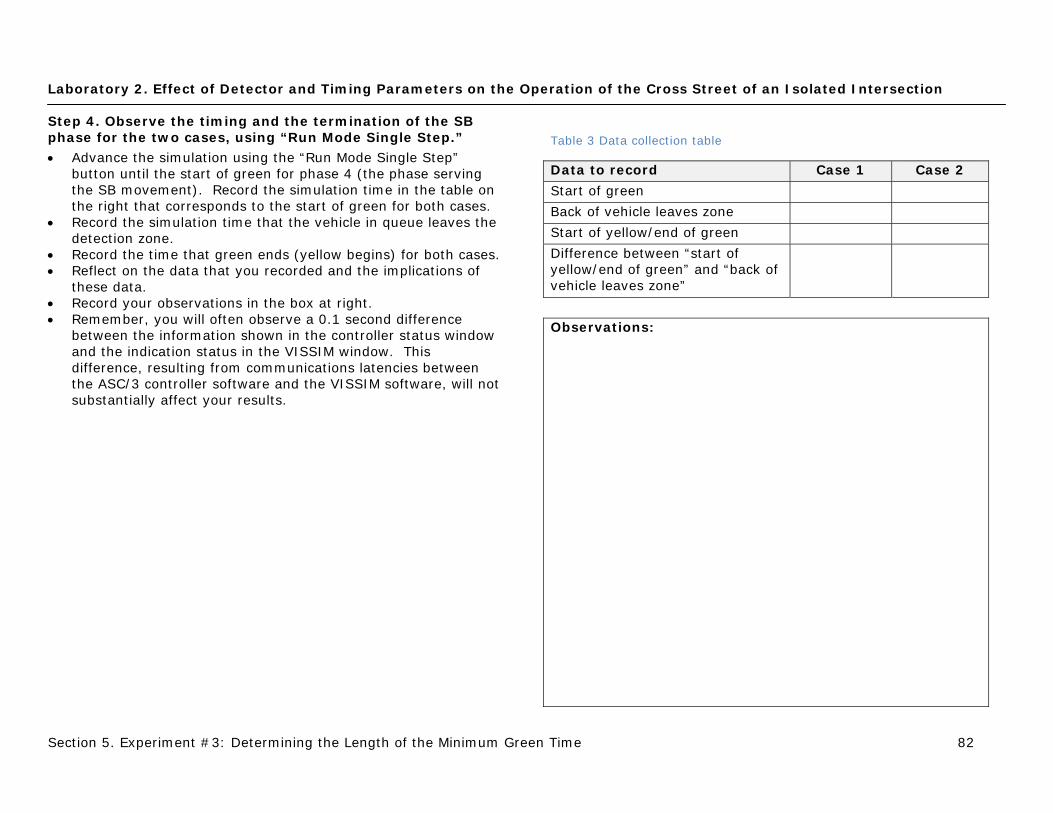
Step 4. Observe the timing and the termination of the SB phase for the two cases, using “Run Mode Single Step.” • Advance the simulation using the “Run Mode Single Step”
button until the start of green for phase 4 (the phase serving the SB movement). Record the simulation time in the table on the right that corresponds to the start of green for both cases.
• Record the simulation time that the vehicle in queue leaves the detection zone.
• Record the time that green ends (yellow begins) for both cases. • Reflect on the data that you recorded and the implications of
these data. • Record your observations in the box at right. • Remember, you will often observe a 0.1 second difference
between the information shown in the controller status window and the indication status in the VISSIM window. This difference, resulting from communications latencies between the ASC/3 controller software and the VISSIM software, will not substantially affect your results.
Table 3 Data collection table
Data to record Case 1 Case 2
Start of green
Back of vehicle leaves zone
Start of yellow/end of green
Difference between “start of yellow/end of green” and “back of vehicle leaves zone”
Observations:
Laboratory 2. Effect of Detector and Timing Parameters on the Operation of the Cross Street of an Isolated Intersection
Section 5. Experiment #3: Determining the Length of the Minimum Green Time 83
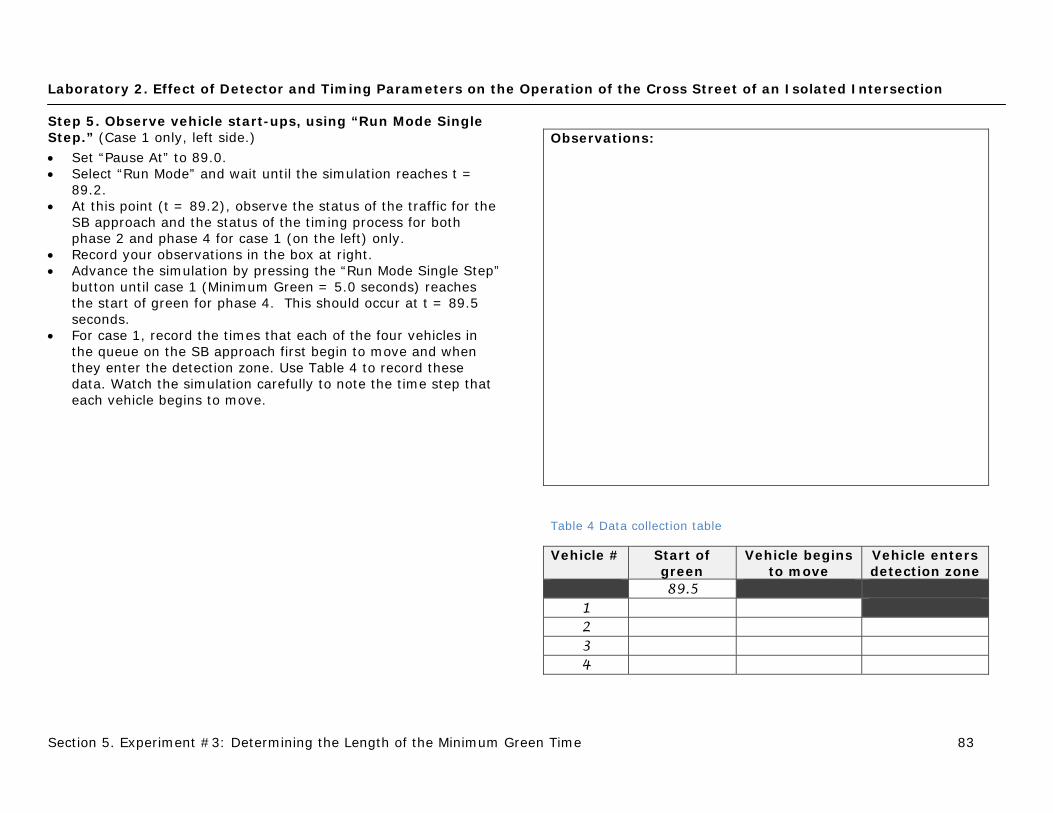
Step 5. Observe vehicle start-ups, using “Run Mode Single Step.” (Case 1 only, left side.)
• Set “Pause At” to 89.0. • Select “Run Mode” and wait until the simulation reaches t =
89.2. • At this point (t = 89.2), observe the status of the traffic for the
SB approach and the status of the timing process for both phase 2 and phase 4 for case 1 (on the left) only.
• Record your observations in the box at right. • Advance the simulation by pressing the “Run Mode Single Step”
button until case 1 (Minimum Green = 5.0 seconds) reaches the start of green for phase 4. This should occur at t = 89.5 seconds.
• For case 1, record the times that each of the four vehicles in the queue on the SB approach first begin to move and when they enter the detection zone. Use Table 4 to record these data. Watch the simulation carefully to note the time step that each vehicle begins to move.
Observations: Table 4 Data collection table
Vehicle # Start of green
Vehicle begins to move
Vehicle enters detection zone
89.5 1 2 3 4
Laboratory 2. Effect of Detector and Timing Parameters on the Operation of the Cross Street of an Isolated Intersection
Section 5. Experiment #3: Determining the Length of the Minimum Green Time 84
5.6 Discussion Let’s now consider each of the three questions that were presented at the beginning of this experiment. • When is the Minimum Green time too long? • How long should the Minimum Green time be in order to get
vehicles moving during the early portion of green? • What are the respective roles of Minimum Green time and
Vehicle Extension time in producing efficient operations? Take a few minutes to review each question and write brief answers to each question in the box on the right based on your observations from this experiment.
Answers to questions:

Laboratory 2. Effect of Detector and Timing Parameters on the Operation of the Cross Street of an Isolated Intersection
Section 5. Experiment #3: Determining the Length of the Minimum Green Time 85
1. When is the Minimum Green time too long?
Table 5 shows the results of the data collection from the first green indication for cases 1 and 2. The green indication begins at t = 62.5 seconds and the back of the vehicle in queue leaves the detection zone at t = 64.8 seconds. But the green indication ends at different times, depending the length of the Minimum Green time setting. For case 1, the green indication ends at 5 seconds after the beginning of green, while the green indication ends at 10 seconds after the beginning of green for case 2. Figure 21 shows a graphical representation of the data presented in Table 5. For case 1, with a Minimum Green time of 5 seconds, the end of green comes 2.7 seconds after the vehicle leaves the detection zone and enters the intersection (line “a” in Figure 21). For case 2, with a higher Minimum Green time of 10 seconds, the end of green comes 7.7 seconds after the vehicle enters the intersection (line “b” in Figure 21). In case 2, there is a significant amount of unused green time (7.7 seconds) that is wasted and could be used more efficiently in serving other phases. Clearly, for short queues (in this example, a queue of one vehicle) a shorter Minimum Green time provides a more efficient termination of the phase. As you will see in Experiment#4, it is the function of the Vehicle Extension time to make sure that the phase continues to time as long as a queue is present and to terminate the phase when the queue has been served. Asking the Minimum Green timer to take care of this function (with longer settings) only results in inefficient use of green time.
Table 5 Data collection table with results
Data to record Case 1 Case 2
Start of green 62.5 62.5
Back of vehicle leaves zone 64.8 64.8
Start of yellow/end of green 67.5 72.5
Difference between “start of yellow/end of green” and “back of vehicle leaves zone”
2.7 7.7
Figure 21 Green duration for cases 1 and 2
0
62 64 66 68 70 72 74
Simulation time, sec
Cas
e 1
Cas
e 2

Laboratory 2. Effect of Detector and Timing Parameters on the Operation of the Cross Street of an Isolated Intersection
Section 5. Experiment #3: Determining the Length of the Minimum Green Time 86
2. How long should the Minimum Green time be in order to get vehicles moving during the early portion of green?
Table 6 shows data collected for the second green indication presented in the simulation for the SB approach, for case 1 (Minimum Green time is set at 5 seconds). Figure 22 presents a graphical representation of the data shown in Table 6. Vehicle 1 begins to move 0.9 seconds after the beginning of green. Thus vehicle 1 “gets going” during the Minimum Green duration. Vehicle 2 also begins to move and continues its movement into the detection zone during the Minimum Green period. It is important to remember from Experiment#2 that the longer the detection zone, the less likely the phase will terminate prematurely because of slowly starting vehicles. For example, a 66 foot detection zone would eliminate any start-up concerns regarding the first three vehicles in the queue. All three vehicles would be present in the zone at the beginning of the green indication, so the call would remains active and the phase would continue to time as long as at least one of these vehicles remains in the zone (until, of course, the Maximum Green timer expires). A Minimum Green time of 5 seconds, for the example presented here, provides a reasonable length of time for the queue to begin to move out of the 22 foot detection zone. Other factors may also contribute to the Minimum Green time setting used in practice by a local or state jurisdiction. For example, suppose that one vehicle waiting in queue makes a right turn on red after phase 4 has been selected as “Next.” While the phase has called, the calling vehicle has left the zone. A driver upstream of the intersection may observe the following indications: red, either no green or a very short green, yellow, and red. While this is an efficient operation, the upstream driver may report a problem due to the short or non-existent green.
Table 6 Data collection table with results
Vehicle # Start of green
Vehicle begins to move
Vehicle enters detection zone
89.5 1 90.4 2 91.7 92.8 3 93.3 96.9 4 94.7 99.4
Figure 22 Vehicles begin to move and enters detection zone
0
85 90 95 100 105
Simulation time, sec
Start of green
Vehicle begins to move
Vehicle enters zone
Vehi
cle
1V
ehic
le 2
Vehi
cle
3Ve
hicl
e 4
Laboratory 2. Effect of Detector and Timing Parameters on the Operation of the Cross Street of an Isolated Intersection
Section 5. Experiment #3: Determining the Length of the Minimum Green Time 87
It is useful at this point to note guidance from the “Traffic Signal Timing Manual” [5]: “The Minimum Green interval represents the least amount
of time that a green signal indication will be displayed for a movement. Minimum Green is used to allow drivers to react to the change to green at the start of the phase and meet driver expectancy. Its duration may also be based on considerations of queue length. A Minimum Green that is too long may result in wasted time at the intersection; one that is too short may not allow the intersection to time efficiently. Minimum Green time may also be used to allow for pedestrian crossing in the case where pedestrian indications are not used.”
And: “The intent of the Minimum Green interval is to ensure that
each green is displayed for a length that will satisfy driver expectancy.”
The manual also notes that agencies commonly set Minimum Green time as low as 2 seconds and as high as 15 seconds. Is this practice reasonable based on your observations in this experiment?

Laboratory 2. Effect of Detector and Timing Parameters on the Operation of the Cross Street of an Isolated Intersection
Section 5. Experiment #3: Determining the Length of the Minimum Green Time 88
3. What are the respective roles of Minimum Green time and Vehicle Extension time in producing efficient operations?
One of the primary purposes of the Minimum Green time is to provide sufficient time for the queue to begin to move before the phase begins to operate under the Vehicle Extension timer. It needs to be long enough to prevent premature “gap out” due to sluggish queued vehicles just upstream of the detection zone. The Vehicle Extension time then takes over and maintains the green as long as the headways between vehicles are not longer than the maximum allowable headway. We suggest that the Minimum Green and Vehicle Extension time parameters must be determined in a systematic process, clearly understanding the interrelated roles and functions of each timing parameter. These timing parameters are also closely related to the length of the detection zone. • When the signal display changes to green, drivers react and
begin to move into the intersection. The role of the Minimum Green parameter is to make sure that the queue has sufficient time to begin to move into the intersection.
• Once the queue is moving, the role of the Vehicle Extension time parameter is to either continue the green as long as headways remain less than the maximum allowable headway (which means that the queue is still clearing) or to terminate the green when a headway exceeds the maximum allowable headway (which usually means that the queue has cleared).
You will learn more about the Vehicle Extension parameter in Experiment #4.

Laboratory 2. Effect of Detector and Timing Parameters on the Operation of the Cross Street of an Isolated Intersection
Section 6. Experiment #4: Observing Vehicle Headways in the Departing Queue 89
6. EXPERIMENT #4: OBSERVING VEHICLE HEADWAYS IN THE DEPARTING QUEUE
6.1 Learning Objectives • Understand the variation of vehicle headways in a departing
queue. • Be able to establish a desired maximum allowable headway.
6.2 Overview In previous experiments in Laboratory 2, you learned that when the Minimum Green and Vehicle Extension times are set to zero, the phase will terminate immediately when the detection zone becomes unoccupied. You also learned that the detection zone length alone will not guarantee good quality of service to the motorist, since the phase may terminate before the entire queue has been served. This is especially true for the shorter 22 foot detection zone, in which it is difficult to allow more than one vehicle in the zone at the same time. Finally, you learned that the Minimum Green time should be long enough to make sure that the queue immediately upstream of the detection zone begins to move, and enters the detection zone before the green indication prematurely ends.
In this experiment, the detection zone length is 22 feet. The Minimum Green time is set to 7 seconds. The Vehicle Extension time is set to 5 seconds, a very conservative value. You will observe the operation of the SB movement, developing an understanding of the normal variation of headways in a departing queue. You will also identify the desired maximum headway, the longest headway in a departing queue that you are willing to tolerate without terminating the green indication. This will help you to understand how to establish the Vehicle Extension time, which will be covered in Experiment#5.
6.3 Questions to Consider As you begin this experiment, consider the following questions. You will come back to these questions once you have completed the experiment. • How much variation is there in the headways between vehicles
in the departing queue? • Based on the headways that you observed in the departing
queue, what is your recommendation for the desired maximum allowable headway?
6.4 List of Steps You will follow these steps during this experiment: • Start the MOST software tool and open the input file. • Observe and record headways for one cycle.

Laboratory 2. Effect of Detector and Timing Parameters on the Operation of the Cross Street of an Isolated Intersection
Section 6. Experiment #4: Observing Vehicle Headways in the Departing Queue 90
6.5 Running the Experiment Step 1. Start the MOST software tool and open the input file.
• Start the MOST software tool and select “Open File.” • Locate the “MOST input files” folder. • Go to the “Lab2” folder, then the “Exp4” folder. • Open the file: “lab2-exp4.inp.” Step 2. Observe and record headways for one cycle. • Set “Pause At” to 66.0. • Start the simulation using the “Run Mode” button. • When the simulation time reaches t = 66.1 seconds, observe
the status of the traffic flow and the timing processes and note these in the box at right.
• Advance the simulation by 0.1 second by pressing the “Run Mode Single Step” button.
• Record the following values in Table 7 for phase 4 serving the SB through movement. o Record the simulation clock time that the indication changes
to green (“Start of green” in the table). o Record the clock time that the front of each vehicle reaches
the stop bar. o Compute the headway for each vehicle (the time difference
between when this vehicle enters the intersection and when the previous vehicle entered the intersection) and record your results in the table.
Observations:
Table 7 Data collection table
Vehicle number
Start of green
Time front of vehicle reaches
stop bar
Headway
1
2
3
4
5
6
7
8
9
10
Laboratory 2. Effect of Detector and Timing Parameters on the Operation of the Cross Street of an Isolated Intersection
Section 6. Experiment #4: Observing Vehicle Headways in the Departing Queue 91
6.6 Discussion Let’s now consider each of the two questions that were presented at the beginning of this experiment. • How much variation is there in the headways between vehicles
in the departing queue? • Based on the headways that you observed in the departing
queue, what is your recommendation for the desired maximum allowable headway?
Take a few minutes to review each question and write brief answers to each question in the box on the right based on your observations from this experiment.
Answers to questions:
Laboratory 2. Effect of Detector and Timing Parameters on the Operation of the Cross Street of an Isolated Intersection
Section 6. Experiment #4: Observing Vehicle Headways in the Departing Queue 92
1. How much variation is there in the headways between vehicles in the departing queue?
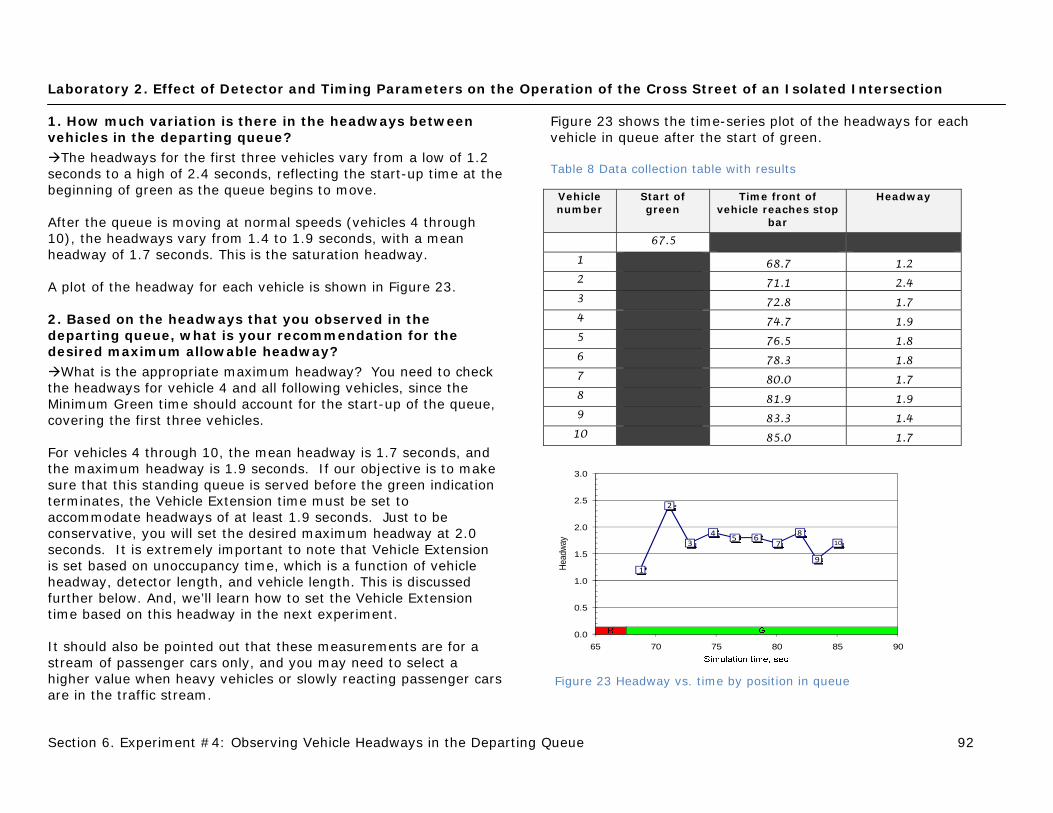
The headways for the first three vehicles vary from a low of 1.2 seconds to a high of 2.4 seconds, reflecting the start-up time at the beginning of green as the queue begins to move. After the queue is moving at normal speeds (vehicles 4 through 10), the headways vary from 1.4 to 1.9 seconds, with a mean headway of 1.7 seconds. This is the saturation headway. A plot of the headway for each vehicle is shown in Figure 23. 2. Based on the headways that you observed in the departing queue, what is your recommendation for the desired maximum allowable headway?
What is the appropriate maximum headway? You need to check the headways for vehicle 4 and all following vehicles, since the Minimum Green time should account for the start-up of the queue, covering the first three vehicles. For vehicles 4 through 10, the mean headway is 1.7 seconds, and the maximum headway is 1.9 seconds. If our objective is to make sure that this standing queue is served before the green indication terminates, the Vehicle Extension time must be set to accommodate headways of at least 1.9 seconds. Just to be conservative, you will set the desired maximum headway at 2.0 seconds. It is extremely important to note that Vehicle Extension is set based on unoccupancy time, which is a function of vehicle headway, detector length, and vehicle length. This is discussed further below. And, we’ll learn how to set the Vehicle Extension time based on this headway in the next experiment. It should also be pointed out that these measurements are for a stream of passenger cars only, and you may need to select a higher value when heavy vehicles or slowly reacting passenger cars are in the traffic stream.
Figure 23 shows the time-series plot of the headways for each vehicle in queue after the start of green. Table 8 Data collection table with results
Vehicle number
Start of green
Time front of vehicle reaches stop
bar
Headway
67.5
1 68.7 1.2 2 71.1 2.4 3 72.8 1.7 4 74.7 1.9 5 76.5 1.8 6 78.3 1.8 7 80.0 1.7 8 81.9 1.9 9 83.3 1.4
10 85.0 1.7
Figure 23 Headway vs. time by position in queue
0.0
0.5
1.0
1.5
2.0
2.5
3.0
65 70 75 80 85 90
Head
way
Time
1
2
34
5 67
8
9
10

Laboratory 2. Effect of Detector and Timing Parameters on the Operation of the Cross Street of an Isolated Intersection
Section 6. Experiment #4: Observing Vehicle Headways in the Departing Queue 93
In the field, traffic control systems using presence detection don’t typically measure flow rates or headways but rather the unoccupancy time. The unoccupancy time is the time that a detection zone is unoccupied (does not register a call), measured from the departure of the rear end of one vehicle to the arrival of the front end of the following vehicle in the detection zone. When the unoccupancy time exceeds the Vehicle Extension time, the phase will terminate, assuming the Minimum Green timer has also expired and no other special features are active. The unoccupancy time depends directly on the length of the detection zone, as well as the vehicle speed (which may vary over time) and vehicle length, as shown in the figures at right. In Figure 24, the horizontal distance between points A and B (red arrow) represents the unoccupancy time, the time between when vehicle 4 leaves the detection zone and vehicle 5 arrives in the detection zone. After point A, the Vehicle Extension timer will begin to time down. The Vehicle Extension timer will be reset at point B, as long as the time interval between A and B is less than the Vehicle Extension time. In Figure 25, with a longer detection zone, the event represented by point B occurs before that represented by point A (vehicle 5 arrives in the detection zone before vehicle 4 leaves the zone), so the unoccupancy time is zero. In this case, the Vehicle Extension timer will not begin to time and the phase will continue (as long as the Maximum Green timer has not expired).
You will consider the relationship between the headway, the unoccupancy time, and the Vehicle Extension time in Experiment #5.
Figure 24 Vehicle trajectories and shorter detection zone
Figure 25 Vehicle trajectories and longer detection zone

Laboratory 2. Effect of Detector and Timing Parameters on the Operation of the Cross Street of an Isolated Intersection
Section 7. Experiment #5: Relating Headway to Unoccupancy Time and Vehicle Extension Time 94
7. EXPERIMENT #5: RELATING HEADWAY TO UNOCCUPANCY TIME AND VEHICLE EXTENSION TIME
7.1 Learning Objectives • Be able to relate the maximum allowable headway to
unoccupancy time. • Be able to determine the Vehicle Extension time based on the
length of the detection zone and the desired maximum allowable headway.
7.2 Overview In Experiment #4, you observed the normal variation in headways in a departing queue, and based on these observations, you selected a maximum allowable headway that represents the longest headway in a departing queue that you are willing to tolerate without terminating the green indication. In this experiment, you will relate this headway to its equivalent unoccupancy time. You will then select a Vehicle Extension time based on this unoccupancy time that, in combination with the detection zone length, ensures both efficient operation and good service quality.
In this experiment, the detection zone length is 22 feet and the Minimum Green time is set to 7 seconds. The Vehicle Extension time is set to 5 seconds.
7.3 Questions to Consider As you begin this experiment, consider the following questions. You will come back to these questions once you have completed the experiment. • What is your recommendation for the Vehicle Extension time,
based on your recommended desired maximum headway? • If the detection zone length was longer than 22 feet, would
your recommended Vehicle Extension time value be higher or lower?
7.4 List of Steps You will follow these steps during this experiment: • Start the MOST software tool and open the input file. • Collect data.
Laboratory 2. Effect of Detector and Timing Parameters on the Operation of the Cross Street of an Isolated Intersection
Section 7. Experiment #5: Relating Headway to Unoccupancy Time and Vehicle Extension Time 95
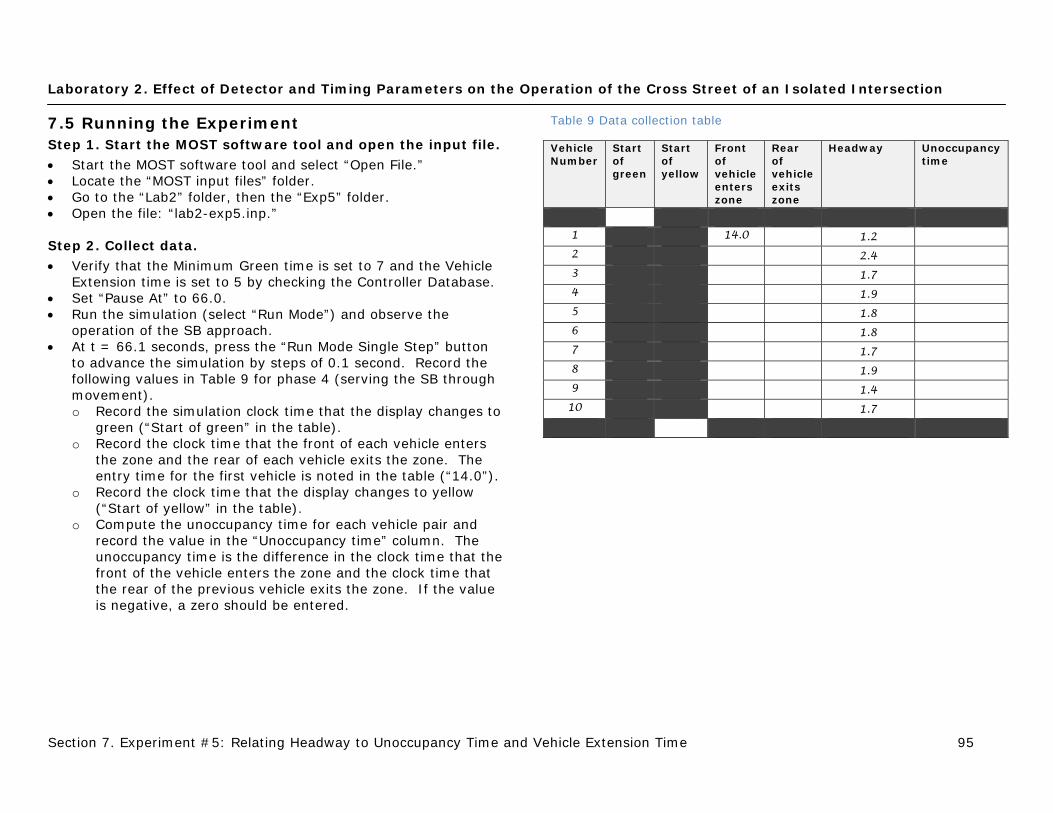
7.5 Running the Experiment Step 1. Start the MOST software tool and open the input file.
• Start the MOST software tool and select “Open File.” • Locate the “MOST input files” folder. • Go to the “Lab2” folder, then the “Exp5” folder. • Open the file: “lab2-exp5.inp.” Step 2. Collect data. • Verify that the Minimum Green time is set to 7 and the Vehicle
Extension time is set to 5 by checking the Controller Database. • Set “Pause At” to 66.0. • Run the simulation (select “Run Mode”) and observe the
operation of the SB approach. • At t = 66.1 seconds, press the “Run Mode Single Step” button
to advance the simulation by steps of 0.1 second. Record the following values in Table 9 for phase 4 (serving the SB through movement). o Record the simulation clock time that the display changes to
green (“Start of green” in the table). o Record the clock time that the front of each vehicle enters
the zone and the rear of each vehicle exits the zone. The entry time for the first vehicle is noted in the table (“14.0”).
o Record the clock time that the display changes to yellow (“Start of yellow” in the table).
o Compute the unoccupancy time for each vehicle pair and record the value in the “Unoccupancy time” column. The unoccupancy time is the difference in the clock time that the front of the vehicle enters the zone and the clock time that the rear of the previous vehicle exits the zone. If the value is negative, a zero should be entered.
Table 9 Data collection table
Vehicle Number
Start of green
Start of yellow
Front of vehicle enters zone
Rear of vehicle exits zone
Headway Unoccupancy time
1 14.0 1.2
2 2.4
3 1.7
4 1.9
5 1.8
6 1.8
7 1.7
8 1.9
9 1.4
10 1.7
Laboratory 2. Effect of Detector and Timing Parameters on the Operation of the Cross Street of an Isolated Intersection
Section 7. Experiment #5: Relating Headway to Unoccupancy Time and Vehicle Extension Time 96
Write a brief summary of your observations in the space provided on the right. Note any patterns that you see between the headway data and the unoccupancy time data. What would be the basis of a relationship between these two parameters?
Observations:
Laboratory 2. Effect of Detector and Timing Parameters on the Operation of the Cross Street of an Isolated Intersection
Section 7. Experiment #5: Relating Headway to Unoccupancy Time and Vehicle Extension Time 97
7.6 Discussion Let’s now consider each of the two questions that were presented at the beginning of this experiment. • What is your recommendation for the Vehicle Extension time,
based on your recommended desired maximum headway? • If the detection zone length was longer than 22 feet, would
your recommended Vehicle Extension time value be higher or lower?
Take a few minutes to review each question and write brief answers to each question in the box on the right based on your observations from this experiment.
Answers to questions:

Laboratory 2. Effect of Detector and Timing Parameters on the Operation of the Cross Street of an Isolated Intersection
Section 7. Experiment #5: Relating Headway to Unoccupancy Time and Vehicle Extension Time 98
Table 10 shows the results from observing this simulation. The green time begins at t = 67.5. The headway data collected earlier are also included in this table. The important point is the relationship between the headway and the unoccupancy time. For vehicles served after the Minimum Green time expires (vehicles 4 through 10), the unoccupancy time is about one second less than the headway. Is this a consistent and stable value, and if so why?
Table 10 Data collection table with results
Vehicle Number
Start of
green
Start of
yellow
Front of
vehicle enters zone
Rear of
vehicle exits zone
Headway Unoccupancy time
67.5
1 14.0 69.8 1.2
2 69.4 71.6 2.4 0
3 71.9 73.2 1.7 0.3
4 73.9 75.0 1.9 0.7
5 75.9 76.9 1.8 0.9
6 77.7 78.6 1.8 0.8
7 79.4 80.3 1.7 0.8
8 81.3 82.3 1.9 1.0
9 82.7 83.7 1.4 0.4
10 84.4 85.4 1.7 0.7
90.3

Laboratory 2. Effect of Detector and Timing Parameters on the Operation of the Cross Street of an Isolated Intersection
Section 7. Experiment #5: Relating Headway to Unoccupancy Time and Vehicle Extension Time 99
Figure 26 shows the formal relationship between the headway and the unoccupancy time. Suppose vehicles 1 and 2 are separated by the desired maximum headway, h. This headway consists of two parts, the time that the detection zone is occupied (to) and the time that the detection zone is unoccupied, or the unoccupancy time (tu).
uo tth +=
The occupancy time (to) is the sum of the time it takes for a vehicle to travel both its own length (Lv) and the length of the detection zone (LD), traveling at speed v.
vLL
t Dvo
+=
In this case, for the data shown in Table 10, the occupancy time (to) is 1 second. The unoccupancy time is then related to the desired maximum headway according to the following equation:
vLL
htht Dvou
+−=−=
And, why is this relationship important? This is a critical relationship that will help us to set the Vehicle Extension time, once we’ve agreed to a desired maximum headway. The Vehicle Extension time should be set to the unoccupancy time that is equivalent to the desired maximum headway. Based on this relationship, for a desired maximum headway of 2.0 seconds (for the headway characteristics measured in Experiment#4), the Vehicle Extension time should be set to 1 second:
1.0 1.0 - 2.0 tht ou ==−=
Figure 26 Relationship between headway and unoccupancy time
Dis
tance
LD
Lv
Laboratory 2. Effect of Detector and Timing Parameters on the Operation of the Cross Street of an Isolated Intersection
Section 7. Experiment #5: Relating Headway to Unoccupancy Time and Vehicle Extension Time 100
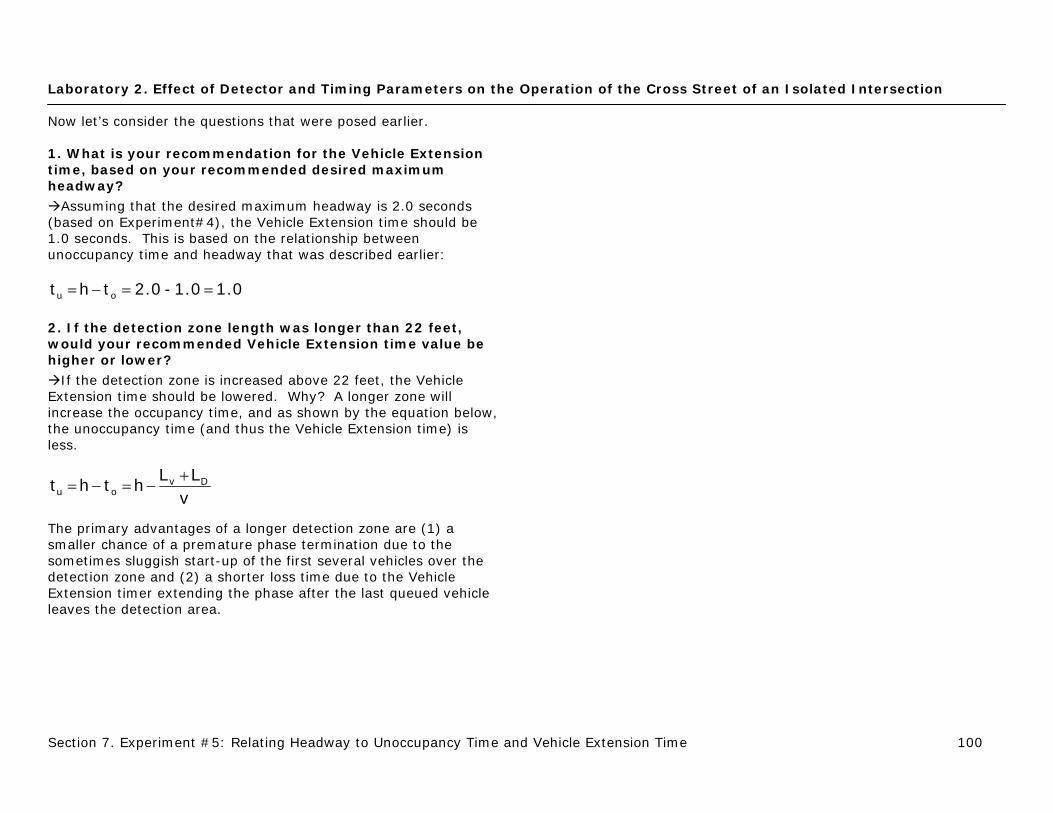
Now let’s consider the questions that were posed earlier. 1. What is your recommendation for the Vehicle Extension time, based on your recommended desired maximum headway?
Assuming that the desired maximum headway is 2.0 seconds (based on Experiment#4), the Vehicle Extension time should be 1.0 seconds. This is based on the relationship between unoccupancy time and headway that was described earlier:
1.0 1.0 - 2.0 tht ou ==−=
2. If the detection zone length was longer than 22 feet, would your recommended Vehicle Extension time value be higher or lower?
If the detection zone is increased above 22 feet, the Vehicle Extension time should be lowered. Why? A longer zone will increase the occupancy time, and as shown by the equation below, the unoccupancy time (and thus the Vehicle Extension time) is less.
vLL
htht Dvou
+−=−=
The primary advantages of a longer detection zone are (1) a smaller chance of a premature phase termination due to the sometimes sluggish start-up of the first several vehicles over the detection zone and (2) a shorter loss time due to the Vehicle Extension timer extending the phase after the last queued vehicle leaves the detection area.

Laboratory 2. Effect of Detector and Timing Parameters on the Operation of the Cross Street of an Isolated Intersection
Section 8. Experiment #6: Design Exercise-Setting The Minimum Green time and The Vehicle Extension Time 101
8. EXPERIMENT #6: DESIGN EXERCISE-SETTING THE MINIMUM GREEN TIME AND THE VEHICLE EXTENSION TIME
8.1 Learning Objective • Be able to set the Minimum Green time and the Vehicle
Extension time, balancing risks of early termination and inefficient green extension.
8.2 Overview In the previous experiments, you learned about the effect of detection zone length on the duration of the green indication, the effect of the Minimum Green time in ensuring that a queue has sufficient time to begin to move at the beginning of the green indication, and the importance of the Vehicle Extension time in ensuring that the green indication extends long enough to serve a queue but not any longer. In this experiment, you will set the Minimum Green time and the Vehicle Extension time for traffic conditions that you might find in the real world. This experiment includes four separate green intervals for the SB approach, with a mix of passenger cars and heavy vehicles, and a range of driver behavior characteristics. As before, the detection zone length is 22 feet. As a starting point, the Minimum Green time is set to 10 seconds and the Vehicle Extension time is set to 5 seconds. How do you determine “efficient” operations, balancing the risks of early termination in which a queue is not served before the end of green (known as “cycle failure”) and inefficiently long green time (in which the queue clears but the phase continues to time)? The following are criteria that you can use to refine your design, from the initial settings of Minimum Green time and Vehicle Extension time. • The phase is not extended inefficiently for a very short queue.
• The phase extends long enough to clear the standing queue. • The phase doesn’t extend beyond the time that it takes for the
queue to clear.
8.3 Questions to Consider As you begin this experiment, consider the following questions. You will come back to these questions once you have completed the experiment. • What are the primary characteristics of the traffic streams for
each of the four cycles that you observed that will affect the settings for the Minimum Green time and the Vehicle Extension time?
• What changes did you make to the given settings? • What are some of the trade-offs that you considered in setting
the values for these two timing parameters? • Have you met the criteria established above?
8.4 List of Steps You will follow these steps during this experiment: • Start the MOST software tool and open the input file. • Observe the simulation of the SB approach with the given
values of Minimum Green time and Vehicle Extension time. • Experiment with the Minimum Green time setting for phase 4. • Experiment with the Vehicle Extension time setting for phase 4. • Continue to experiment with the values of these two timing
parameters until you reasonably meet the criteria listed below. • Prepare a justification of your recommended parameters.

Laboratory 2. Effect of Detector and Timing Parameters on the Operation of the Cross Street of an Isolated Intersection
Section 8. Experiment #6: Design Exercise-Setting The Minimum Green time and The Vehicle Extension Time 102
8.5 Running the Experiment Step 1. Start the MOST software tool and open the input file.
• Start the MOST software tool and select “Open File.” • Locate the “MOST input files” folder. • Go to the “Lab2” folder, then the “Exp6” folder. • Open the file: “lab2-exp6.inp.”
Step 2. Observe the simulation of the SB approach with the given values of Minimum Green time and Vehicle Extension time. • Verify that the Minimum Green time and the Vehicle Extension
time for phase 4 are set to 10 seconds and 5 seconds, respectively.
• Set “Pause At” to 50.9, and click “Run Mode.” • Observe the operation of the SB approach for four cycles
beginning at t = 51.0. Describe the major characteristics of the traffic stream for each cycle. Identify any problems with the operations of the intersection that you think can be solved with changes to the given settings of the Minimum Green time and the Vehicle Extension time. Record your observations in the box on the right.
• An example of an observation would be: “The green indication extended well beyond the time that the last vehicle demanded service on the SB approach.”
Observations:

Laboratory 2. Effect of Detector and Timing Parameters on the Operation of the Cross Street of an Isolated Intersection
Section 8. Experiment #6: Design Exercise-Setting The Minimum Green time and The Vehicle Extension Time 103
Step 3. Experiment with the Minimum Green time setting for phase 4. • Based on your initial observations of the traffic flow
characteristics, modify the value of the Minimum Green time setting for phase 4.
• Re-run the simulation. • Do the changes that you tried make any difference in the traffic
flow? • Document the results of your experiment in the box on the
right.
Observations:
Laboratory 2. Effect of Detector and Timing Parameters on the Operation of the Cross Street of an Isolated Intersection
Section 8. Experiment #6: Design Exercise-Setting The Minimum Green time and The Vehicle Extension Time 104
Step 4. Experiment with the Vehicle Extension time setting for phase 4. • Based on your initial observations of the traffic flow
characteristics, modify the value of the Vehicle Extension time setting for phase 4.
• Re-run the simulation. • Do the changes that you tried make any difference in the traffic
flow? • Document the results of your experiment in the box on the
right.
Observations:
Laboratory 2. Effect of Detector and Timing Parameters on the Operation of the Cross Street of an Isolated Intersection
Section 8. Experiment #6: Design Exercise-Setting The Minimum Green time and The Vehicle Extension Time 105
Step 5. Continue to experiment with the values of these two timing parameters until you reasonably meet the criteria listed below.
• Re-run the simulation, making any further changes to the Minimum Green time and/or the Vehicle Extension time so that you meet the three criteria listed below.
• Document the results of your experiments in the box on the right.
Criteria: • The phase is not extended inefficiently for a very short queue. • The phase extends long enough to clear the standing queue. • The phase doesn’t extend beyond the time that it takes for the
queue to clear. Step 6. Prepare a justification of your recommended parameters.
• Document the values of Minimum Green time and Vehicle Extension time that you recommend for this intersection.
• Write a brief justification of these recommended values in the box on the right.
Observations:
Justification:

Laboratory 2. Effect of Detector and Timing Parameters on the Operation of the Cross Street of an Isolated Intersection
Section 8. Experiment #6: Design Exercise-Setting The Minimum Green time and The Vehicle Extension Time 106
8.6 Discussion Let’s now consider the questions that were presented at the beginning of this experiment. • What are the primary characteristics of the traffic streams for
each of the four cycles that you observed that will affect the settings for the Minimum Green time and the Vehicle Extension time?
• What changes did you make to the given settings? • What are some of the trade-offs that you considered in setting
the values for these two timing parameters? • Have you met the criteria established above? Take a few minutes to review each question and write brief answers to each question in the box on the right based on your observations from this experiment.
Answers to questions:

Laboratory 2. Effect of Detector and Timing Parameters on the Operation of the Cross Street of an Isolated Intersection
Section 8. Experiment #6: Design Exercise-Setting The Minimum Green time and The Vehicle Extension Time 107
1. What are the primary characteristics of the traffic streams for each of the four cycles that you observed that will affect the settings for the Minimum Green time and the Vehicle Extension time?
Each of the four cycles that you observed had different traffic flow characteristics, as you would expect to see in the field. • Cycle 1 (Vehicle Extension time too long resulting in wasted
green time): o The six vehicles in the queue at the beginning of green were
served during the green. o Five of these six vehicles discharged while the Minimum
Green timer was timing. o The phase extended for several seconds after the last
vehicle entered the intersection and then gapped out. • Cycle 2 (Minimum Green time too long resulting in wasted
green): o One vehicle was in the queue at the beginning of green. o After this vehicle discharged, the phase continued to time
for over 7 seconds, as the Minimum Green timer continued to time.
o For a short queue as you observed here, the Minimum Green time is too long.
• Cycle 3 (Vehicle Extension time too long resulting in wasted green): o Six vehicles were in the queue, including two heavy
vehicles. o The first two vehicles, including one of the heavy vehicles,
discharged during the Minimum Green time. o The fourth vehicle, also a heavy vehicle, was slow in
reaching the detection zone; the Vehicle Extension timer timed for over 2.5 seconds before the fourth vehicle entered the detection zone.
o The phase continued to time for a significant period after the last vehicle exited the detection zone indicating that the Vehicle Extension time is too long.
• Cycle 4 (Vehicle Extension time too long resulting in wasted green time):
o There are ten vehicles in the queue. o The Minimum Green timer expires after the fourth vehicle
has discharged. o The phase should terminate after the tenth vehicle has
entered the intersection but continues timing to serve three additional vehicles.
o Again, this shows that the Vehicle Extension time is too long.
We can make two general conclusions about the initial settings. • The Minimum Green time is too long, especially when the initial
queue is short (here, one vehicle). • The Vehicle Extension time is too long, extending the phase too
long after the last vehicle in the queue is served, and continuing service to additional vehicles that are not part of the initial queue.

Laboratory 2. Effect of Detector and Timing Parameters on the Operation of the Cross Street of an Isolated Intersection
Section 8. Experiment #6: Design Exercise-Setting The Minimum Green time and The Vehicle Extension Time 108
2. What changes did you make to the given settings?
The discussion here is based on a set of timings that may be different than those that you tried. However, it may be helpful to you to follow these example trials, what the results were, and how that led to the next trial. One of the major issues in trial #1 was the length of the Minimum Green time. It was too long, especially for very short queues, a common occurrence on the cross street approach. In trial #2, the Minimum Green time was reduced to 5 seconds to address this problem, while the Vehicle Extension time was maintained at 5 seconds. Table 11 shows the results of trial #2, as compared to trial #1. The reduction of the Minimum Green time to 5 seconds solved the problem of the excessive (wasted) green time during cycle 2, when there was a queue of one vehicle.
Table 11 Results of trials 1 and 2
Cycle Trial #1 (Minimum Green = 10) (Vehicle Extension time = 5)
Trial #2 (Minimum Green = 5) (Vehicle Extension time = 5)
1 6 vehicles in queue. All vehicles served. Phase gaps out.
Unchanged.
2 1 vehicle in queue. Excessive green time after vehicle served because of Minimum Green setting.
1 vehicle in queue. No excessive green time with lower Minimum Green setting.
3 6 vehicles in queue, including 2 heavy vehicles. Long headway between vehicles 3 and 4. Excessive green time after final vehicle enters intersection.
Unchanged.
4 10 vehicles in queue. Green continues after queue clears. 3 vehicles not in queue served because of Vehicle Extension setting.
Unchanged.
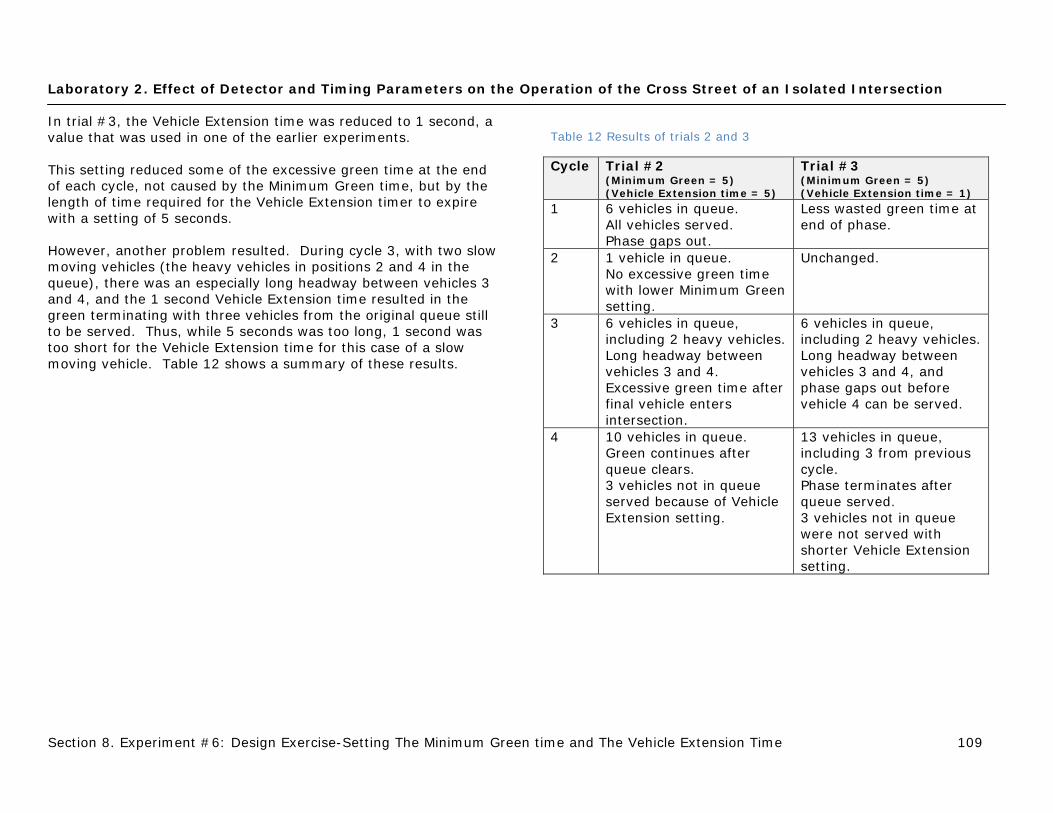
Laboratory 2. Effect of Detector and Timing Parameters on the Operation of the Cross Street of an Isolated Intersection
Section 8. Experiment #6: Design Exercise-Setting The Minimum Green time and The Vehicle Extension Time 109
In trial #3, the Vehicle Extension time was reduced to 1 second, a value that was used in one of the earlier experiments. This setting reduced some of the excessive green time at the end of each cycle, not caused by the Minimum Green time, but by the length of time required for the Vehicle Extension timer to expire with a setting of 5 seconds. However, another problem resulted. During cycle 3, with two slow moving vehicles (the heavy vehicles in positions 2 and 4 in the queue), there was an especially long headway between vehicles 3 and 4, and the 1 second Vehicle Extension time resulted in the green terminating with three vehicles from the original queue still to be served. Thus, while 5 seconds was too long, 1 second was too short for the Vehicle Extension time for this case of a slow moving vehicle. Table 12 shows a summary of these results.
Table 12 Results of trials 2 and 3
Cycle Trial #2 (Minimum Green = 5) (Vehicle Extension time = 5)
Trial #3 (Minimum Green = 5) (Vehicle Extension time = 1)
1 6 vehicles in queue. All vehicles served. Phase gaps out.
Less wasted green time at end of phase.
2 1 vehicle in queue. No excessive green time with lower Minimum Green setting.
Unchanged.
3 6 vehicles in queue, including 2 heavy vehicles. Long headway between vehicles 3 and 4. Excessive green time after final vehicle enters intersection.
6 vehicles in queue, including 2 heavy vehicles. Long headway between vehicles 3 and 4, and phase gaps out before vehicle 4 can be served.
4 10 vehicles in queue. Green continues after queue clears. 3 vehicles not in queue served because of Vehicle Extension setting.
13 vehicles in queue, including 3 from previous cycle. Phase terminates after queue served. 3 vehicles not in queue were not served with shorter Vehicle Extension setting.

Laboratory 2. Effect of Detector and Timing Parameters on the Operation of the Cross Street of an Isolated Intersection
Section 8. Experiment #6: Design Exercise-Setting The Minimum Green time and The Vehicle Extension Time 110
In trial #4, the Vehicle Extension time was changed to 3 seconds, a compromise between the initial setting of 5 seconds, and the 1 second value from trial #3. This setting provided sufficient time for the queue to be served during cycle 3, while making sure that most of the vehicles arriving during cycle 4 after the queue cleared were not served. Table 13 shows a summary of these results.
Table 13 Results of trials 3 and 4
Cycle Trial #3 (Minimum Green = 5) (Vehicle Extension time = 1)
Trial #4 (Minimum Green = 5) (Vehicle Extension time = 3)
1 6 vehicles in queue. All vehicles served. Phase gaps out.
Unchanged.
2 1 vehicle in queue. No excessive green time with lower Minimum Green setting.
Unchanged.
3 6 vehicles in queue, including 2 heavy vehicles. Long headway between vehicles 3 and 4, and phase gaps out before vehicle 4 can be served.
6 vehicles in queue, including 2 heavy vehicles. All vehicles served, even vehicle 4.
4 13 vehicles in queue, including 3 from previous cycle. Phase terminates after queue served. 3 vehicles not in queue were not served with shorter Vehicle Extension setting.
10 vehicles in queue. Phase terminates after queue served, though 1 vehicle not in queue enters the intersection on yellow. 2 other vehicles not in queue were not served with this Vehicle Extension setting.

Laboratory 2. Effect of Detector and Timing Parameters on the Operation of the Cross Street of an Isolated Intersection
Section 8. Experiment #6: Design Exercise-Setting The Minimum Green time and The Vehicle Extension Time 111
3. What are some of the trade-offs that you considered in setting the values for these two timing parameters?
For the Minimum Green time setting, the reduction from 10 seconds to 5 seconds eliminated the excessive green time at the end of cycle 2. This change was positive and required no consideration of trade-offs. It may be possible to reduce the Minimum Green time even further, but this will require an additional trial to be run. For the Vehicle Extension time setting, the trade-off was between providing enough time to serve slow moving (heavy) vehicles and extending the green too long so that one of the vehicles not in the initial queue was served. In this case, it is better to serve the heavy vehicle and not stop it. This will prevent its slow acceleration and speed characteristics from being felt during two cycles, and not just one. It should be emphasized that a 3 second Vehicle Extension time is longer than is commonly used in practice. However, if there is a high number of trucks or other heavy vehicles, as was illustrated in this example, a longer extension time is sometimes used. The point to be made here is that the extension time should be sensitive to the traffic conditions that the traffic engineer must address. 4. Have you met the criteria established above?
Yes. The shorter Minimum Green time (5 seconds, compared to the initial value of 10 seconds) ensures that the phase is not extended inefficiently for a very short queue. The Vehicle Extension time of 3 seconds ensures that the phase extends long enough to clear the standing queue but doesn’t extend beyond the time that it takes for the queue to clear.

Laboratory 2. Effect of Detector and Timing Parameters on the Operation of the Cross Street of an Isolated Intersection
Section 9. Closure: Summary of Key Points Learned 112
9. CLOSURE: SUMMARY OF KEY POINTS LEARNED In this laboratory, you looked at the factors that should be considered when the Minimum Green time and the Vehicle Extension time parameters are set, for a given length of the detection zone. It should be pointed out that we’ve only considered stop bar detection, and other detection zone configurations will result in different results. You saw in Experiment #1 how a phase times, and two common ways in which a phase is terminated: (1) the Minimum Green and Vehicle Extension timers both expire, resulting in a “gap out,” and (2) the Maximum Green timer expires, resulting in a “max out.” You saw in Experiment #2 that the detection zone itself can provide some extension of the green as vehicles arrive at the intersection and enter the zone. A longer zone provides more of this extension capability. In Experiment #3, you learned how the Minimum Green time must be set long enough so that the queue begins to move but short enough so that the phase doesn’t extend inefficiently when very short queues are present. In Experiments #4 and #5, you learned about the desired maximum headway, how it relates to the unoccupancy time, and how both factors help to set the Vehicle Extension time. Finally, in Experiment #6, you experimented with the Minimum Green time and Vehicle Extension time settings for a case with a wide range of conditions. In practice, you need to decide what conditions you will tolerate. Do we want to risk that the green will terminate too soon and leave some vehicles unserved or that the green will not terminate soon enough, resulting in wasted green
time? Balancing these risks is one of the keys to efficient and effective signal timing. It should also be noted that some agencies use 40 foot, 60 foot, and occasionally longer detection zones to keep Minimum Green and Vehicle Extension times to their lowest practical values. In Laboratory 3, you will learn how the timing parameters on one approach affect the operation on the other approaches and the intersection overall.