laboratory and field studies of pavement temperature sensors
TRANSCRIPT

2005-44Final Report
The Aurora Consortium: Laboratory and Field Studies of Pavement Temperature Sensors
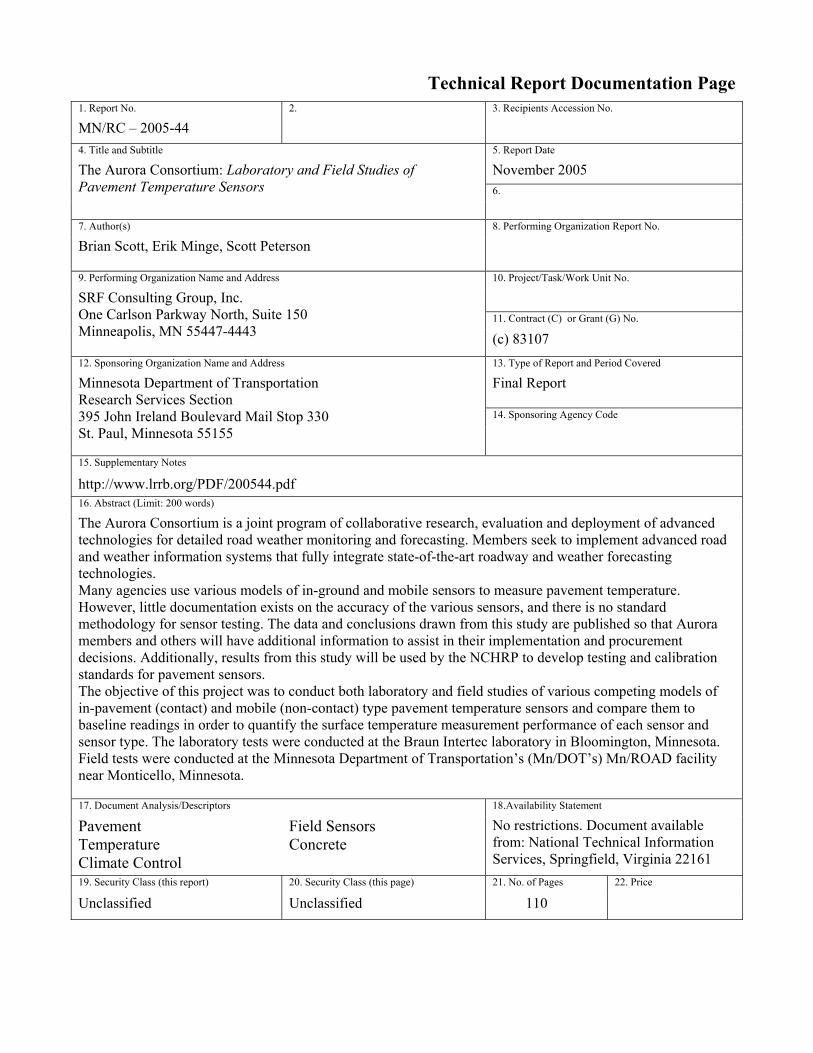
Technical Report Documentation Page1. Report No. 2. 3. Recipients Accession No.
MN/RC – 2005-44 4. Title and Subtitle 5. Report Date
November 2005 6.
The Aurora Consortium: Laboratory and Field Studies of Pavement Temperature Sensors 7. Author(s) 8. Performing Organization Report No.
Brian Scott, Erik Minge, Scott Peterson
9. Performing Organization Name and Address 10. Project/Task/Work Unit No.
11. Contract (C) or Grant (G) No.
SRF Consulting Group, Inc. One Carlson Parkway North, Suite 150 Minneapolis, MN 55447-4443 (c) 83107 12. Sponsoring Organization Name and Address 13. Type of Report and Period Covered
Final Report 14. Sponsoring Agency Code
Minnesota Department of Transportation Research Services Section 395 John Ireland Boulevard Mail Stop 330 St. Paul, Minnesota 55155
15. Supplementary Notes
http://www.lrrb.org/PDF/200544.pdf 16. Abstract (Limit: 200 words)
The Aurora Consortium is a joint program of collaborative research, evaluation and deployment of advanced technologies for detailed road weather monitoring and forecasting. Members seek to implement advanced road and weather information systems that fully integrate state-of-the-art roadway and weather forecasting technologies. Many agencies use various models of in-ground and mobile sensors to measure pavement temperature. However, little documentation exists on the accuracy of the various sensors, and there is no standard methodology for sensor testing. The data and conclusions drawn from this study are published so that Aurora members and others will have additional information to assist in their implementation and procurement decisions. Additionally, results from this study will be used by the NCHRP to develop testing and calibration standards for pavement sensors. The objective of this project was to conduct both laboratory and field studies of various competing models of in-pavement (contact) and mobile (non-contact) type pavement temperature sensors and compare them to baseline readings in order to quantify the surface temperature measurement performance of each sensor and sensor type. The laboratory tests were conducted at the Braun Intertec laboratory in Bloomington, Minnesota. Field tests were conducted at the Minnesota Department of Transportation’s (Mn/DOT’s) Mn/ROAD facility near Monticello, Minnesota. 17. Document Analysis/Descriptors 18.Availability Statement
Pavement Temperature Climate Control
Field Sensors Concrete
No restrictions. Document available from: National Technical Information Services, Springfield, Virginia 22161
19. Security Class (this report) 20. Security Class (this page) 21. No. of Pages 22. Price
Unclassified Unclassified 110
The Aurora Consortium: Laboratory and Field Studies of Pavement Temperature Sensors
Final Report
Prepared by: Brian Scott Erik Minge
Scott Peterson
SRF Consulting Group, Inc.
November 2005
Published by: Minnesota Department of Transportation
Research Services Section 395 John Ireland Boulevard, MS 330
St. Paul, MN 55155
This report represents the results of research conducted by the authors and does not necessarily represent the views or policies of the Minnesota Department of Transportation and/or the Center for Transportation Studies. This report does not contain a standard or specified technique.

Laboratory and Field Studies of Pavement i Final Report
Temperature Sensors
TABLE OF CONTENTS
Executive Summary ........................................................................................................................ 1 1 Introduction......................................................................................................................... 4
1.1 Background .................................................................................................................. 4 1.2 Project Overview ......................................................................................................... 4
2 Methodology Overview....................................................................................................... 5
2.1 Literature Search.......................................................................................................... 5 2.2 Sensor Procurement ..................................................................................................... 5 2.3 Data Acquistion System............................................................................................... 6 2.4 Baseline Methodology ................................................................................................. 7 2.4.1 Baseline Equipment........................................................................................ 9 2.4.2 Thermistor Testing ....................................................................................... 10 2.4.3 Baseline Bench Test ..................................................................................... 11 2.4.4 Actual Baseline Installation Proceedures ..................................................... 11 2.5 Statistical Methods..................................................................................................... 12 2.5.1 Accuracy....................................................................................................... 12 2.5.2 Statistical Significance ................................................................................. 12
3 Test Plans........................................................................................................................... 14
3.1 Test Plan 1: Controlled Climate Tests ...................................................................... 15 3.1.1 Objective 1-1: Fixed Temperature .............................................................. 23 3.1.2 Objective 1-2: Varying Temperature .......................................................... 24 3.1.3 Objective 1-3: Mobile Sensor Acclimation Time ....................................... 24 3.1.4 Objective 1-4: Varied Infrared Sensor Height ............................................ 25 3.1.5 Objective 1-5: Cold Day with and without Direct Solar Impact ................. 26 3.1.6 Objective 1-6: Warm Pavement with Snowfall........................................... 26 3.1.7 Objective 1-7: Cold Pavement with Rainfall .............................................. 27 3.1.8 Objective 1-8: Iced Pavement with Rainfall ............................................... 27 3.1.9 Objective 1-9: Compacted Snow (melting)................................................. 27 3.1.10 Objective 1-10: Frost Depositing ................................................................ 28 3.1.11 Objective 1-11: Mobile Sensor Performance in Varying Ambient Temperatures. 28
3.2 Test Plan 2: Chemical Tests...................................................................................... 29 3.2.1 Objective 2-1: Sodium Chloride - Cold Day with and without Direct Solar Impact 29 3.2.2 Objective 2-2: Sodium Chloride - Cold Pavement with Snowfall .............. 30 3.2.3 Objective 2-3: Sodium Chloride - Cold Pavement with Rainfall................ 30 3.2.4 Objective 2-4: Sodium Chloride - Iced Pavement with Rainfall................. 30 3.3 Test Plan 3: Field Tests............................................................................................. 31 3.3.1 Objective 3-1: Field - Cold Day, with and without Direct Solar Impact ... 35 3.3.2 Objective 3-2: Field - Cold Night with and without Strong Radiational Cooling 35 3.3.3 Objective 3-3: Field - Warm Pavement with Snowfall ............................... 35 3.3.4 Objective 3-4: Field - Cold Pavement with Rainfall ................................... 35 3.3.5 Objective 3-5: Field - Iced Pavement with Rainfall.................................... 35 3.3.6 Objective 3-6: Field - Mobile Sensor Field Evaluation .............................. 35

Laboratory and Field Studies of Pavement ii Final Report
Temperature Sensors
4 Results ................................................................................................................................ 38
4.1 Summary and Results ................................................................................................ 39 4.1.1 Controlled Climate and Chemical Test Summary........................................ 39 4.1.2 Field Test Summary ..................................................................................... 42
4.2 Detailed Controlled Climate Test Results.................................................................. 43 4.2.1 Test 1-1: Fixed Temperature Tests.............................................................. 43 4.2.2 Test 1-2: Variable Temperature Tests ......................................................... 46 4.2.3 Test 1-3: Mobile Sensor Acclimation Time ................................................ 48 4.2.4 Test 1-4: Varied Infrared Sensor Height ..................................................... 50 4.2.5 Test 1-5: Cold Day with and without Direct Solar Impact.......................... 53 4.2.6 Test 1-6: Warm Pavement with Snowfall ................................................... 55 4.2.7 Test 1-7: Cold Pavement with Rainfall ....................................................... 57 4.2.8 Test 1-8: Iced Pavement with Rainfall ........................................................ 58 4.2.9 Test 1-9: Compacted Snow (melting) ......................................................... 59 4.2.10 Test 1-10: Frost Depositing......................................................................... 60 4.2.11 Test 1-11: Mobile Sensor Performance in Varying Ambient Temperatures... 61
4.3 Detailed Anti-Icing Chemical Test Results ............................................................... 62 4.3.1 Test 2-1: Sodium Chloride - Cold Day with and without Direct Solar Impact .... 62 4.3.2 Test 2-2: Sodium Chloride - Warm Pavement with Snowfall..................... 64 4.3.3 Test 2-3: Sodium Chloride - Cold Pavement with Rainfall ........................ 65 4.3.4 Test 2-4: Sodium Chloride - Iced Pavement with Rainfall ......................... 67
4.4 Detailed Field Test Results ........................................................................................ 68 4.4.1 Test 3-1: Field - Cold Day with and without Direct Solar Impact .............. 69 4.4.2 Test 3-2: Field - Cold Night with and without Strong Radiational Cooling .. 70 4.4.3 Test 3-3: Field - Warm Pavement with Snowfall........................................ 72 4.4.4 Test 3-4: Field - Cold Pavement with Rainfall............................................ 73 4.4.5 Test 3-5: Field - Iced Pavement with Rainfall ............................................ 74 4.4.6 Test 3-6: Field - Mobile Sensor Field Evaluation ....................................... 75
5 Conclusions and Suggested Research ............................................................................. 81
6 References .......................................................................................................................... 83
Appendix A: Literature Search..........................................................................A-1
Appendix B: Baseline Sensor Specifications......................................................B-1
Appendix C: Anti-icing Guidelines....................................................................C-1
Appendix D: Statistical Significance Results....................................................D-1
Appendix E: Detailed Test Results (Available Upon Request).......................E-1

Laboratory and Field Studies of Pavement iii Final Report
Temperature Sensors
List of Figures
Figure 1 Data Acquisition System Schematic for Field Tests ..................................................8
Figure 2 Data Acquisition System at the Laboratory ...............................................................8
Figure 3 Thermistor Ice-Bath Testing ....................................................................................10
Figure 4 Schematic of the Pavement Test Section and Mobile Sensor Installation ...............15
Figure 5 Saw Cutting and Drilling of Laboratory Concrete Test Section ..............................16
Figure 6 Concrete Core Drilling in Preparation for Sensor Installation .................................17
Figure 7 Concrete Sensor Installation.....................................................................................17
Figure 8 Laboratory Sensor Locations (Concrete) .................................................................18
Figure 9 Removal of Asphalt Test Section at Mn/ROAD Facility.........................................19
Figure 10 Placement of Asphalt Test Section on Concrete and Steel Plate .............................19
Figure 11 Asphalt Core Drilling in Preparation for Sensor Installation...................................20
Figure 12 Asphalt Sensor Installation.......................................................................................20
Figure 13 Laboratory Sensor Locations (Asphalt) ..................................................................21
Figure 14 Laboratory Test Chamber ........................................................................................23
Figure 15 Laboratory Solar Impact Test...................................................................................26
Figure 16 Cold Pavement after Simulated Rainfall Test (Asphalt) ..........................................27
Figure 17 Pavement Preparation for sensor Installation (Saw Cutting) ...................................31
Figure 18 Field Sensor Placement ............................................................................................32
Figure 19 Final Sensor and Baseline Installation .....................................................................32
Figure 20 Field Sensor Locations – Asphalt.............................................................................33
Figure 21 Field Sensor Locations – Concrete...........................................................................34
Figure 22 Cold Pavement with Simulated Rainfall Test ..........................................................36
Figure 23 Mobile Ice-bath Set-up for Field Testing.................................................................36
Figure 24 Mobile Ice-bath Set-up for Field Testing (Close-up)...............................................36
List of Tables
Table 1 Participating Vendors .................................................................................................6
Table 2 Baseline System Components ....................................................................................9
Table 3 Laboratory Results Summary...................................................................................40
Table 4 Field Test Summary .................................................................................................42
Table 5 Controlled Climate Summary……….......................................................................44
Table 6 Mobile Sensor Acclimation Time Summary............................................................49
Table 7 Varied Mobile Sensor Height Summary ..................................................................51
Table 8 Test 1-11 Summary ..................................................................................................61
Table 9 Chemical Test Summary ..........................................................................................62
Table 10 Field Test Summary .................................................................................................68
Table 11 Mobile Sensor Field Evaluation Summary ..............................................................76
Table 12 Test 3-6c Summary by Sub-Test ..............................................................................80 H:\Trans\4544 Pavement Sensor\Final Report\Aurora Final Draft (05.05.2005).doc

Laboratory and Field Studies of Pavement 1 Final Report
Temperature Sensors
Executive Summary
Project Overview This report presents the methods, results and conclusions of the Laboratory and Field Studies of
Pavement Temperature Sensors evaluation sponsored by the Aurora Consortium. The objective of this project was to conduct both laboratory and field studies to evaluate the pavement surface temperature reporting performance of various models of in-pavement (contact) and mobile (non-contact) pavement temperature sensors in varying environmental conditions.
Methodology Overview Sensors Tested Six in-pavement sensors were tested in this study:
• Aanderaa 3565 Road Condition Sensor
• Boschung America BOSO Passive
• LUFFT FASS Black Ice Detector IRS-21
• Point Six Wireless Point Probe
• SSI FP-2000
• Vaisala DRS 511 Two mobile sensors were also tested:
• Control Products 999J
• Sprague RoadWatch All of the sensors were evaluated by comparing their reported temperature readings, at any given time, to the readings of closely-located, highly-accurate baseline thermistors that were affixed to the pavement surface.
Laboratory Tests The laboratory tests were performed in a controlled climate test chamber to ensure that accurate, repeatable and reproducible results would be obtained. Two pavement test-sections (one asphalt and one concrete) served as test platforms for each test. The in-pavement sensors were installed in each of the two pavement test sections according to vendor specifications. Mobile sensors were mounted approximately four feet above each test section to simulate a vehicle mounted installation. The surface temperature reporting performance of each sensor was evaluated with the following environmental tests: fixed and varying temperatures, with and without direct solar impact, snowfall, rainfall, frost and the application of sodium chloride solutions. Additionally, the mobile sensors were subjected to a series of tests to determine the effects of varying acclimation times, installation heights and air temperatures. A total of 15 sets of laboratory tests were conducted as part of this evaluation project.

Laboratory and Field Studies of Pavement 2 Final Report
Temperature Sensors
Field Tests The field tests were performed on temperature sensors installed in both concrete and asphalt portions of an existing low-volume test road to analyze sensor performance under “real world” conditions. The six in-pavement sensors were installed in the existing roadway, and the two mobile sensors were mounted to a test vehicle. A total of six sets of field tests were conducted.
Results Overview Mean absolute error was the primary statistical measure used to present and compare sensor results.
In-Pavement Sensor Results In the laboratory, the constant temperature tests yielded the most accurate results, with sensor readings averaging within 0.4° C (0.7° F) of the baseline temperature. During the various environmental factor tests, such as varying temperature, rain or snow, the average temperature error was 0.8° C (1.4° F). Much of the error associated with the varying environmental conditions resulted from in-pavement sensors reporting temperature change more slowly than the actual pavement surface temperature. The field testing indicated that daily thermal cycles (solar heating or radiational cooling) can have a significant effect on sensor accuracy. Clear sky conditions during either day or night resulted in sensor errors, typically between 0.5 and 1.0° C (0.9 and 1.8° F). It was shown that cloud cover affects radiational cooling and the accuracy of the sensor. During clear sky conditions, some sensors reported the changing temperature at a different rate than the baseline pavement sensors.
Mobile Sensor Results Overall, the mobile sensors reported similar levels of performance and accuracy to the in-pavement sensors. The average temperature error for the mobile sensors for the laboratory and field tests was 0.8° C (1.4° F). The laboratory testing indicated that the mobile sensors were more accurate on concrete than on asphalt. The concrete average error was 0.3° C (0.55° F) compared to an asphalt average error of 0.7° C (1.26° F). The field testing suggested a similar trend.
Conclusions and Recommendations Through a wide range of Aurora-approved laboratory and field test procedures, this study met its objective of evaluating the surface temperature reporting performance of various models of fixed and mobile pavement temperature sensors in varying environmental conditions.

Laboratory and Field Studies of Pavement 3 Final Report
Temperature Sensors
The study results offer a detailed understanding of the range of accuracy that can be expected with these sensors. Development of an acceptable range of accuracy is one possible direction that the RWIS community may wish to further explore.
Other sensor performance characteristics, such as detection of surface moisture condition or freezing point, were not tested or evaluated as part of this study. It is recommended that these parameters be considered for a future study. A separate study conducted under the National Cooperative Highway Research Program (NCHRP) Project 6-15 includes development of testing methods for pavement surface conditions and chemical solution freezing point.
The following conclusions were drawn from the laboratory and field test results presented within the main body of this report:
General
• Throughout a variety of environmental conditions tested in both the laboratory and the field, on average, both the in-pavement and mobile sensors reported surface temperatures within 0.8° C (1.4° F) of the actual pavement surface temperature.
• Tests involving the application of sodium chloride to the sensors demonstrated that the effect of sodium chloride on sensor temperature reporting performance was insignificant.
In-Pavement Sensors
• Laboratory tests indicate the performance of in-pavement sensors was not significantly affected by pavement type.
• In the field tests, however, the in-pavement sensors installed in asphalt pavement were more accurate than the sensors installed in concrete.
• Field temperature tests indicate that in the “real world,” the in-pavement sensors might not track ambient temperature fluctuations as well as in the laboratory.
Mobile Sensors
• In both laboratory and field tests, pavement type was shown to have a noticeable effect on mobile pavement sensor performance. The mobile sensors, on average, performed 0.5° C (0.9° F) more accurately in the tests on concrete.
• Additional field investigation of the mobile sensors is recommended to determine how varying pavement type and environmental conditions, such as snow, ice, wind and solar radiation, affect sensor performance.
This report presents and summarizes the results of the study for the reader, as a possible aid in determining which sensors are best suited for their needs. This report does not rank or judge the quality of sensors. Instead, it presents results that readers may use to choose the best sensor for their needs.

Laboratory and Field Studies of Pavement 4 Final Report
Temperature Sensors
1 Introduction This report presents the findings of the Aurora-sponsored Laboratory and Field Studies of
Pavement Temperature Sensors. The objective of this study was to measure and compare the surface temperature reporting performance of various competing models of pavement temperature sensors in varying environmental conditions.
1.1 Background
The Aurora Consortium is a joint program of collaborative research, evaluation and deployment of advanced technologies for detailed road weather monitoring and forecasting. Members seek to implement advanced road and weather information systems that fully integrate state-of-the-art roadway and weather forecasting technologies.
Many agencies use various models of in-ground and mobile sensors to measure pavement temperature. However, little documentation exists on the accuracy of the various sensors, and there is no standard methodology for sensor testing. The data and conclusions drawn from this study are published so that Aurora members and others will have additional information to assist in their implementation and procurement decisions. Additionally, results from this study will be used by the NCHRP to develop testing and calibration standards for pavement sensors.
1.2 Project Overview
The objective of this project was to conduct both laboratory and field studies of various competing models of in-pavement (contact) and mobile (non-contact) type pavement temperature sensors and compare them to baseline readings in order to quantify the surface temperature measurement performance of each sensor and sensor type. The laboratory tests were conducted at the Braun Intertec laboratory in Bloomington, Minnesota. Field tests were conducted at the Minnesota Department of Transportation’s (Mn/DOT’s) Mn/ROAD facility near Monticello, Minnesota.
The scope of the project included:
• Conducting telephone interviews and/or e-mail surveys of Aurora members to determine their desires and requirements for the study.
• Conducting a literature search and contacting key experts from around the world to determine the state-of-the-practice for pavement sensor research.
• Soliciting vendors to participate in the study.
• Acquiring sensors from Aurora members and vendors.
• Preparing an Evaluation Test Plan.
• Comparing sensor readings in a controlled laboratory environment.
• Comparing sensor readings in an “operational” field environment.
• Comparing sensor readings under various temperature and weather conditions.
• Comparing the effects of commonly-used road anti-icing chemicals on sensor readings.
• Analyzing and managing data.
• Preparing a Draft Report.
• Soliciting comments from vendors and Aurora team.
• Preparing a Final Report and publishing it on the Aurora Consortium’s website.

Laboratory and Field Studies of Pavement 5 Final Report
Temperature Sensors
2 Methodology Overview This section presents on overview of the methodology used in developing the tests. This section includes information about the literature search on pavement sensor testing, sensor procurement, data acquisition, baseline theory and statistical analyses.
2.1 Literature Search
A literature search was conducted to gather and summarize existing knowledge pertaining to pavement temperature accuracy and testing. The search used a combination of Internet search engines and the following transportation literature resources:
• National Transportation Library
• Transportation Research Board Database
• CalTrans PATH Database
• Mn/DOT Library The majority of the pavement temperature test documents focused on the performance difference of sensors installed in different pavement types and at varying temperatures. The temperature sensors themselves were rarely evaluated. Although these tests were interesting, they generally did not describe lessons learned in conducting pavement temperature sensor evaluations. There were two studies that should be noted for their applicability to the Aurora evaluation: 1. The Ohio Department of Transportation (ODOT) in conjunction with Ohio University
conducted a study to evaluate the accuracy of ODOT Roadway/Weather Sensor Systems for Snow and Ice Removal Operations. This study focused on Road Weather Information System (RWIS) pavement sensors, which were tested under controlled conditions in a climate chamber. The scope of this test included temperature, chemical concentration and liquid depth measurement. The study was done in the summer of 2002 [4].
2. Ministère de l'Equipment des Transports et du Logement (METL) has developed a pavement
sensor calibration methodology and testing procedure. This document describes in detail the test method and procedures that were used for calibrating and testing the accuracy of pavement temperature sensors under various conditions.
See Appendix A for references to these and other studies related to pavement sensor testing.
2.2 Sensor Procurement
Pavement temperature sensors were procured using the following process: 1. Aurora members were polled for instruments that they were are able to provide for the test.
Laboratory and Field Studies of Pavement 6 Final Report
Temperature Sensors
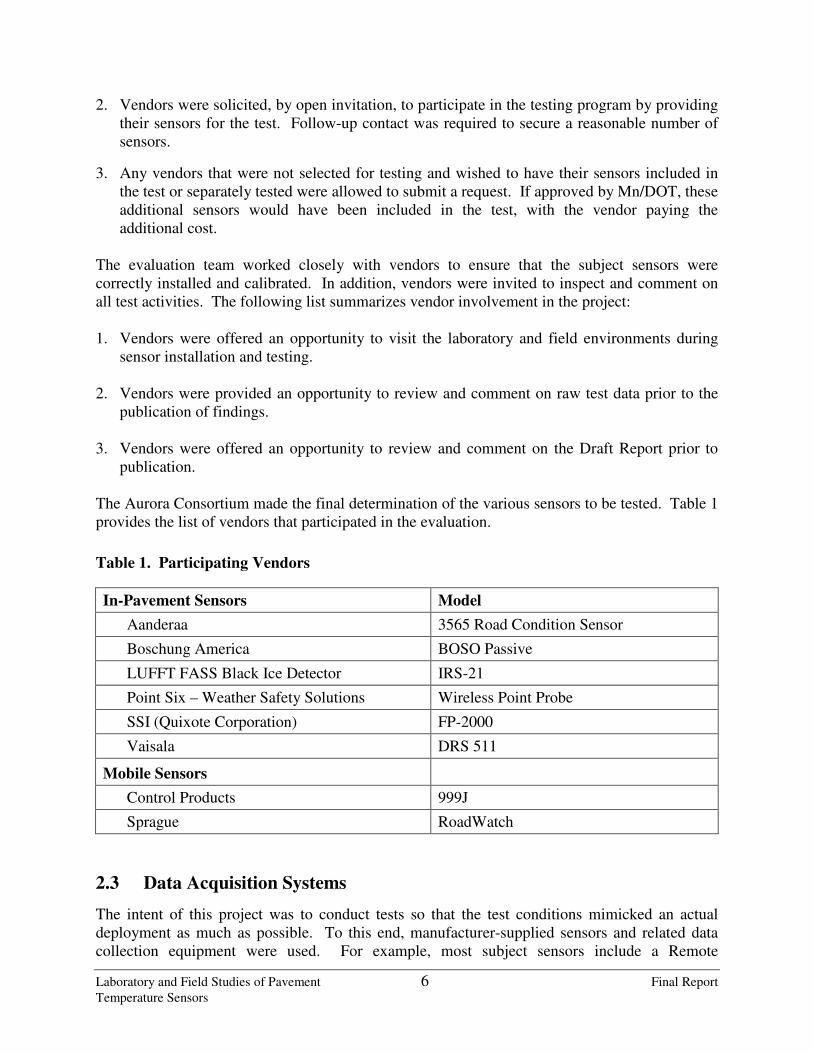
2. Vendors were solicited, by open invitation, to participate in the testing program by providing their sensors for the test. Follow-up contact was required to secure a reasonable number of sensors.
3. Any vendors that were not selected for testing and wished to have their sensors included in
the test or separately tested were allowed to submit a request. If approved by Mn/DOT, these additional sensors would have been included in the test, with the vendor paying the additional cost.
The evaluation team worked closely with vendors to ensure that the subject sensors were correctly installed and calibrated. In addition, vendors were invited to inspect and comment on all test activities. The following list summarizes vendor involvement in the project: 1. Vendors were offered an opportunity to visit the laboratory and field environments during
sensor installation and testing. 2. Vendors were provided an opportunity to review and comment on raw test data prior to the
publication of findings. 3. Vendors were offered an opportunity to review and comment on the Draft Report prior to
publication. The Aurora Consortium made the final determination of the various sensors to be tested. Table 1 provides the list of vendors that participated in the evaluation.
Table 1. Participating Vendors
In-Pavement Sensors Model
Aanderaa 3565 Road Condition Sensor
Boschung America BOSO Passive
LUFFT FASS Black Ice Detector IRS-21
Point Six – Weather Safety Solutions Wireless Point Probe
SSI (Quixote Corporation) FP-2000
Vaisala DRS 511
Mobile Sensors
Control Products 999J
Sprague RoadWatch
2.3 Data Acquisition Systems
The intent of this project was to conduct tests so that the test conditions mimicked an actual deployment as much as possible. To this end, manufacturer-supplied sensors and related data collection equipment were used. For example, most subject sensors include a Remote
Laboratory and Field Studies of Pavement 7 Final Report
Temperature Sensors
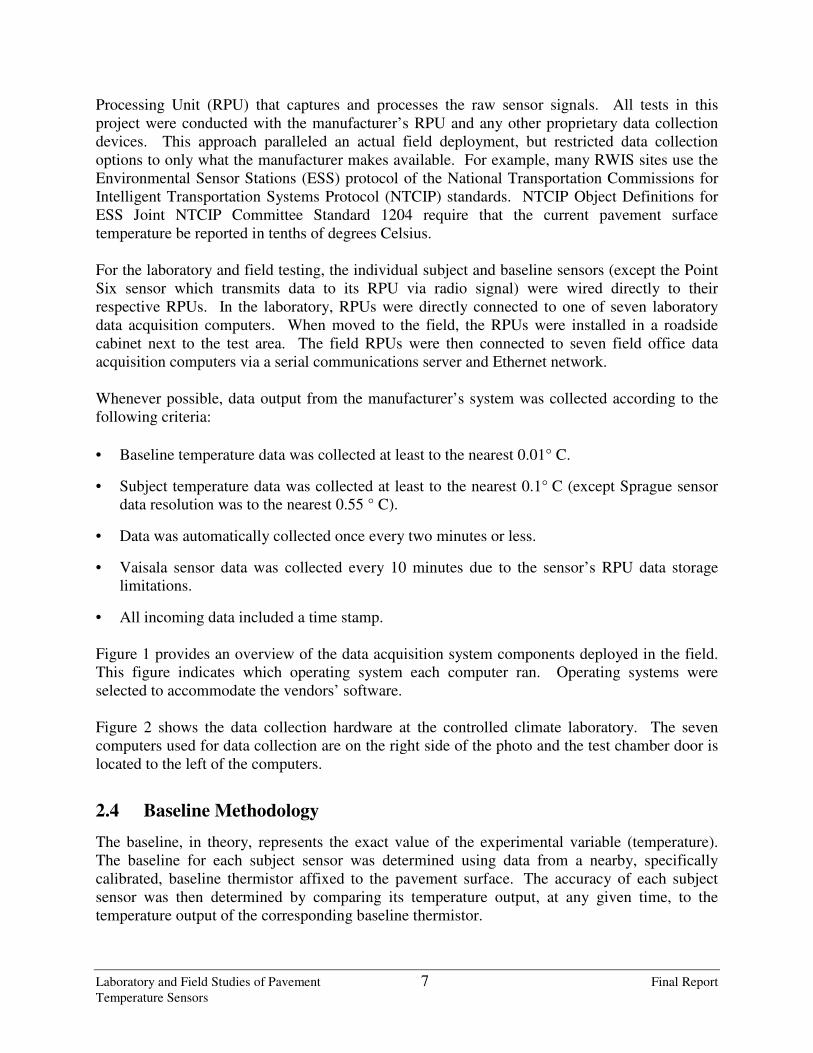
Processing Unit (RPU) that captures and processes the raw sensor signals. All tests in this project were conducted with the manufacturer’s RPU and any other proprietary data collection devices. This approach paralleled an actual field deployment, but restricted data collection options to only what the manufacturer makes available. For example, many RWIS sites use the Environmental Sensor Stations (ESS) protocol of the National Transportation Commissions for Intelligent Transportation Systems Protocol (NTCIP) standards. NTCIP Object Definitions for ESS Joint NTCIP Committee Standard 1204 require that the current pavement surface temperature be reported in tenths of degrees Celsius. For the laboratory and field testing, the individual subject and baseline sensors (except the Point Six sensor which transmits data to its RPU via radio signal) were wired directly to their respective RPUs. In the laboratory, RPUs were directly connected to one of seven laboratory data acquisition computers. When moved to the field, the RPUs were installed in a roadside cabinet next to the test area. The field RPUs were then connected to seven field office data acquisition computers via a serial communications server and Ethernet network. Whenever possible, data output from the manufacturer’s system was collected according to the following criteria:
• Baseline temperature data was collected at least to the nearest 0.01° C.
• Subject temperature data was collected at least to the nearest 0.1° C (except Sprague sensor data resolution was to the nearest 0.55 ° C).
• Data was automatically collected once every two minutes or less.
• Vaisala sensor data was collected every 10 minutes due to the sensor’s RPU data storage limitations.
• All incoming data included a time stamp. Figure 1 provides an overview of the data acquisition system components deployed in the field. This figure indicates which operating system each computer ran. Operating systems were selected to accommodate the vendors’ software. Figure 2 shows the data collection hardware at the controlled climate laboratory. The seven computers used for data collection are on the right side of the photo and the test chamber door is located to the left of the computers.
2.4 Baseline Methodology
The baseline, in theory, represents the exact value of the experimental variable (temperature). The baseline for each subject sensor was determined using data from a nearby, specifically calibrated, baseline thermistor affixed to the pavement surface. The accuracy of each subject sensor was then determined by comparing its temperature output, at any given time, to the temperature output of the corresponding baseline thermistor.

Laboratory and Field Studies of Pavement 8 Final Report
Temperature Sensors
Figure 1
Data Acquisition System Schematic for Field Tests
Figure 2
Data Acquisition System at the Laboratory

Laboratory and Field Studies of Pavement 9 Final Report
Temperature Sensors
The pavement sensors were compared with the baseline sensor that was closest to each sensor because there is some spatial temperature variability in on the surface of the slab. Because the cooling fans were located in the upper back of the room and pushed air towards the front of the room, all points on the surface of the slab did not maintain exactly the same temperature. While comparing closely situated sensors and baselines, both the baselines and sensors had reached stable temperatures. For the baselines, which were affixed to the surface of the pavement, stability occurred when the pavement’s surface had become stabilized. The baseline data for both the laboratory and field portions of the evaluation was produced from calibrated thermistors capable of measuring temperatures to an accuracy of 0.10° C at 0° C (0.18° F at 32° F). The baseline sensor system’s accuracy was stable over a temperature range of 0° C to 70° C (32° F to 158° F). As the measurement temperature proceeded below 0° C (32° F) this accuracy was 0.18° C at –20° C (0.32° F at –2° F) and 0.25° C at –40° C (0.45° F at –40° F).
2.4.1 Baseline Equipment Thermistor-based sensors were selected over technologies such as Resistance Temperature Detectors (RTDs) or thermocouples. This decision was based on accuracy, temperature range, instrumentation availability, package design and cost. Omega was selected as the source for most of the baseline equipment to minimize system integration complexities. Yellow Springs Instruments (YSI) was selected for the thermistor elements because they are Omega’s supplier (aiding in system integration) and they offered superior selection and service for this important element. The Omega InstruNet Series, Direct Sensor Data Acquisition System, was selected. It is a PC-based system using a PCI data acquisition card capable of controlling 16 interface boxes. Each interface box was capable of eight sensor inputs. One advantage of the InstruNet system was that the interface boxes could monitor thermistors, RTDs, or thermocouples, providing cost-effective flexibility if the need arose. Table 2 provides a breakdown of the baseline system components used for this project. Technical sheets and specifications are presented in Appendix B.
Table 2
Baseline System Components
Vendor Part Description Qty
Omega INET 200 PCI data acquisition card 1
Omega INET 100HC Sensor interface box 3
Omega INET 311-5 Power supply 1
Omega INET 300 Network power adaptor 1
Omega OT 201-16 Thermo-conductive paste 1
Omega OB 400 Thermo-conductive cement 1
Omega OMX-R4.7K Precision Shunt 24
YSI YSI-081-55033-NA-FP-480ST Thermistor (calibrated at 0° C) 20
YSI YSI-081-55033-NA-FP-480ST Thermistor (calibrated at –40°, 0° & 25° C) 4
Laboratory and Field Studies of Pavement 10 Final Report
Temperature Sensors
The Yellow Springs Instruments YSI-081-55033-NA-FP-480ST thermistor was selected due to its small thermal mass and its maximum interchangeability error of ±0.10° C over 0° C to +70° C temperature range (±0.18° F over 32° F to +158° F). This thermistor was a nominal 2252-ohm thermistor with 480-inch vinyl cable leads and was packaged in a 3/8 diameter by 1/8 high stainless steel package. The 55xxx series probes were glass encapsulated providing a hermetic seal. YSI also calibrated each thermistor, minimizing interchangeability variations in the baseline data. Omega OB 400 thermal conductive cement was used to maximize thermal conductivity between the thermistors and pavement test sections. The Omega INET 200 data acquisition card spooled the baseline sensor data, by channel, into a spreadsheet format for analysis.
2.4.2 Thermistor Testing
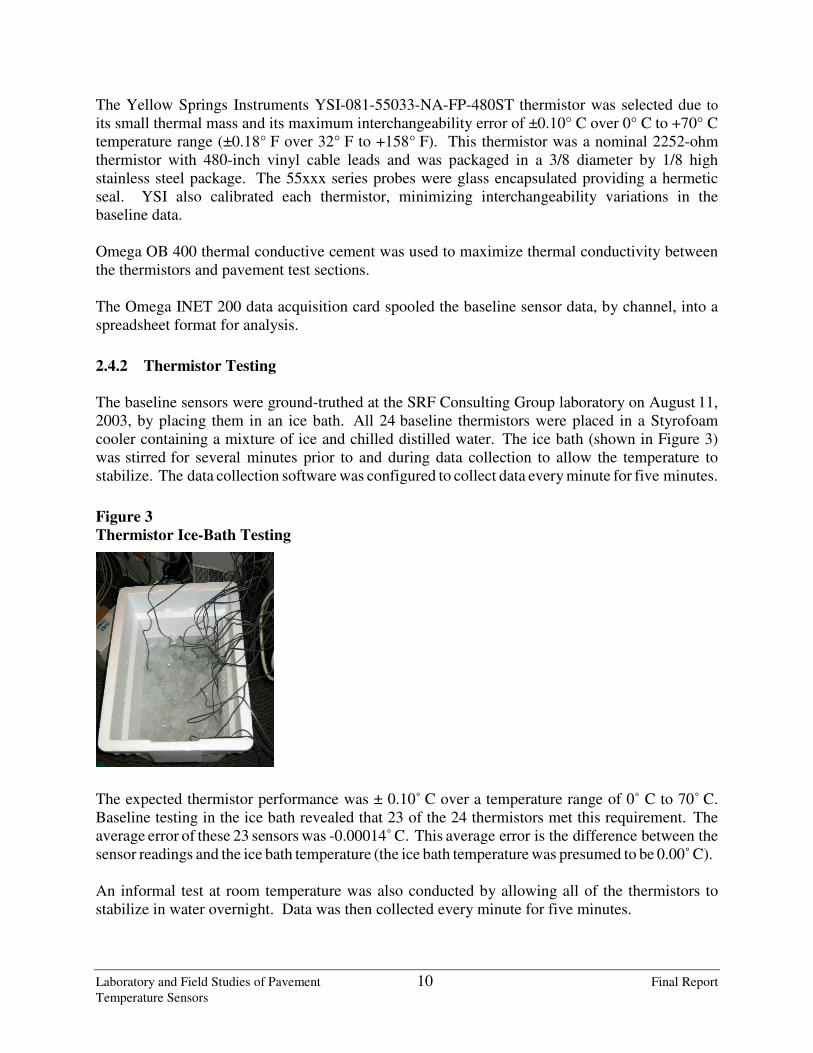
The baseline sensors were ground-truthed at the SRF Consulting Group laboratory on August 11, 2003, by placing them in an ice bath. All 24 baseline thermistors were placed in a Styrofoam cooler containing a mixture of ice and chilled distilled water. The ice bath (shown in Figure 3) was stirred for several minutes prior to and during data collection to allow the temperature to stabilize. The data collection software was configured to collect data every minute for five minutes.
Figure 3
Thermistor Ice-Bath Testing
The expected thermistor performance was ± 0.10˚ C over a temperature range of 0˚ C to 70˚ C. Baseline testing in the ice bath revealed that 23 of the 24 thermistors met this requirement. The average error of these 23 sensors was -0.00014˚ C. This average error is the difference between the sensor readings and the ice bath temperature (the ice bath temperature was presumed to be 0.00˚ C). An informal test at room temperature was also conducted by allowing all of the thermistors to stabilize in water overnight. Data was then collected every minute for five minutes.

Laboratory and Field Studies of Pavement 11 Final Report
Temperature Sensors
The one thermistor (serial number 016) that did not meet the manufacturer’s specified temperature accuracy reported higher temperatures in the ice bath test (0.17˚ C) and in the room temperature test (approximately 0.2˚ C higher). This sensor was not used in the testing.
2.4.3 Baseline Bench Test
Prior to commencing with the subject test plan, verification of the baseline procedure was performed through bench testing at SRF’s laboratory. This verification was performed to verify the data collection procedures and provide confidence in the measurement systems operation and accuracy. Additionally, another test was conducted to evaluate different options for attaching the thermistors to the pavement. The attachment options included affixing the baseline sensor to the surface of the pavement or placing the sensor in a ¼-inch deep hole, which would be dug into the pavement. Thermal conductivity between the sensor and pavement was accomplished through the use of a thermal cement, Omega OB 400.
2.4.4 Baseline Installation Procedures
In the laboratory, 16 baseline sensors (thermistors) were affixed to the pavement surface using Omega OB 400 thermal cement. Each baseline sensor was installed approximately six inches from its respective subject sensor. In the field, six baseline sensors were installed into shallow (0.25-inch deep) slots cut into the pavement. The slots were used to protect the baseline sensors from vehicle traffic. Each baseline sensor was installed within several feet of its respective subject sensors. The first 12 to 24 inches of the test leads for baseline pavement-mounted sensors were mounted in contact with the slab and insulated from the air with ½” wide duct tape. The thermistor end of the baseline sensors was affixed to the pavement with thermal epoxy. To provide ambient air temperature data, two baseline sensors were suspended from wood frames approximately three feet above the test sections. The baseline sensors mounted to the test sections remained in place for all tests in the environmental chamber. Following the controlled laboratory testing, the baseline sensors were carefully removed and reused for the field evaluation portion of the project.

Laboratory and Field Studies of Pavement 12 Final Report
Temperature Sensors
2.5 Statistical Methods
This section presents the statistical analysis techniques that were used to quantify the differences between sensor readings and baseline data sources. Several different statistical test analyses were conducted.
2.5.1 Accuracy
Accuracy is defined as the difference between the sensor reading and baseline data. Accuracy was quantified with the following statistical methods.
• Mean Difference is the average difference of all sensor readings. This value is useful in identifying the general trend or bias in sensor performance. However, it can hide sensor errors because high and low readings are averaged, which may result in a little net error overall. The mean values are presented in Appendix E, Detailed Test Results.
• Mean Absolute Difference is the average of the absolute values of the differences between the sensor and baseline readings. This value does not allow high and low values to cancel each other because the absolute value of each difference is measured. The mean absolute difference was selected as the primary performance measure for summarizing the test results because the values are readily understood by a diverse audience.
• Root Mean Square Difference also does not allow high and low values to cancel each other out. Additionally, it is more sensitive to data points that are further from the mean. For example, a sensor that provided five out of five readings that were 1° C different would have a lower root mean square than a sensor that had four accurate readings and a fifth reading that was 5° C different. Root mean square values are presented in Appendix E: Detailed Test Results.
• Scatter Plots were used to graphically display the raw baseline and subject sensor data. Visually comparing scatter plots can be an excellent method of detecting trends and variations between the different sensors and/or tests. Appendix E contains the scatter plots for all tests.
2.5.2 Statistical Significance
Statistical significance testing was performed to provide a tangible, objective method of determining whether or not a subject sensor’s test performance differed significantly from its corresponding baseline sensor. The statistical significance testing was designed to be an additional tool for the reader to use in comparing subject sensor performance. This is not intended to classify sensor performance as “good” or “bad.”
Laboratory and Field Studies of Pavement 13 Final Report
Temperature Sensors
The statistical significance testing was performed in a spreadsheet using a two tailed, two sample Z-test. The test used the variance of each data set (baseline and subject sensor) along with a confidence factor (95%) to determine whether the mean values, for the baseline and subject sensor data, were “significantly” different. Tests that contained less than 30 data points were omitted from statistical testing. Sample sizes less than approximately 30 magnified the significance level to a point where nearly every data set was “statistically different.” Caution is advised when interpreting the significance data. The results of the statistical significance testing are presented in Appendix D. Overall, the statistical significance difference results reinforced the trends shown by the mean absolute error values. Typically, sensors with smaller error values (often less than 1.0° C) were determined not to be statistically different than their corresponding baseline sensor. Conversely, subject sensors with larger error values (often greater than 1.0° C) were typically determined to be statistically different than the baseline sensor. It should be noted that the statistical significance can be affected by the variance of the test data. For example, if the variance of the baseline and subject sensor is relatively small, the statistical significance threshold will be smaller for that data; small errors will be deemed statistically significant. The reverse is also true. Relatively large variances will result in higher statistical significance thresholds. The main application of the statistical significance tests, as presented in this project, is to aid in performance differentiation between several sensors (on a given test) with similar mean absolute error values. However, this analysis will be left up to the reader. The purpose of this report was to present the facts and summarize the general results of the tests, not to provide individual recommendations.

Laboratory and Field Studies of Pavement 14 Final Report
Temperature Sensors
3 Test Plans The goal of this study was to measure and compare the pavement surface temperature reporting performance of various models of pavement temperature sensors in various environmental conditions. This goal was divided into three separate test plans: assess sensor performance in a controlled climate, with de-icing chemicals and in field tests. Each test plan consisted of a series of specific test objectives to further measure sensor accuracy under a variety of environmental conditions. Lastly, each test objective was conducted using both concrete and asphalt pavements to investigate the effects that pavement type might have on sensor performance. The test plans and objectives are listed below:
Test Plan 1: Controlled Climate Tests
Objective 1-1 Fixed Temperature
Objective 1-2 Varying Temperature
Objective 1-3 Mobile Sensor Acclimation Time
Objective 1-4 Varied Mobile Sensor Height
Objective 1-5 Cold Day with and without Direct Solar Impact
Objective 1-6 Warm Pavement with Snowfall
Objective 1-7 Cold Pavement with Rainfall
Objective 1-8 Iced Pavement with Rainfall
Objective 1-9 Compacted Snow (melting)
Objective 1-10 Frost Depositing
Objective 1-11 Mobile Sensor Performance in Varying Ambient Temperature
Test Plan 2: De-icing Chemical Tests
Objective 2-1 Sodium Chloride - Cold Day with and without Direct Solar Impact
Objective 2-2 Sodium Chloride - Warm Pavement with Snowfall
Objective 2-3 Sodium Chloride - Cold Pavement with Rainfall
Objective 2-4 Sodium Chloride - Iced Pavement with Rainfall
Test Plan 3: Field Tests
Objective 3-1 Field - Cold Day with and without Direct Solar Impact
Objective 3-2 Field - Cold Night with and without Strong Radiational Cooling
Objective 3-3 Field - Warm Pavement with Snowfall
Objective 3-4 Field - Cold Pavement with Rainfall
Objective 3-5 Field - Iced Pavement with Rainfall
Objective 3-6 Field - Mobile Sensor Field Evaluation

Laboratory and Field Studies of Pavement 15 Final Report
Temperature Sensors
3.1 Test Plan 1: Controlled Climate Tests
This section presents the approach used to evaluate pavement temperature sensors in a controlled climate. The controlled climate tests were designed to provide accurate, repeatable and reproducible results. Two pavement test-sections (one asphalt and one concrete) served as test platforms for evaluating the subject sensors in the laboratory. One subject sensor of each type was installed in each of these test sections. The test sections measured approximately 27-inches wide by 60-inches long by 5.5-inches deep and weighed approximately 500 lbs. Test section size was selected to accommodate up to nine different fixed subject sensors while still being small enough to be maneuverable. A schematic diagram is shown in Figure 4.
Figure 4
Schematic of the Pavement Test Section and Mobile Sensor Installation
27 "
Subject
Sensors
5.5
"
A sphalt o r ConcretePavem ent Test-
S ection
M obile
S ensors
60 "
B aselineS ensors
48
"
M ounting F ram e
Subject
S ensors
B aseline A ir
Tem perature S ensor
60 "
Top V iew
S ide V iew

Laboratory and Field Studies of Pavement 16 Final Report
Temperature Sensors
The concrete test section was made according to Mn/DOT Standard Construction Specification Number 2301 [2] and used a type of concrete that is typical for highway construction. The concrete was poured into a wood frame measuring approximately 27-inches wide by 60-inches long by 5.5-inches deep. The concrete was vibrated to remove air voids. After the concrete had hardened, the wood frame was removed. Figures 5, 6, 7 and 8 are pictures of the concrete test section. The asphalt test section was obtained by excavating a section of in-place asphalt located at Mn/DOT’s Mn/ROAD research facility. The test section had the same dimensions as the concrete test section. After excavation the asphalt section was mounted onto a metal base-plate to provide structural strength for the asphalt during transport and sensor installation. A one-inch layer of concrete was placed between the asphalt and steel plate in order to support the low and high points of the underside of the asphalt. Forklifts were used to move the sections. Refer to Figures 9 through 13 for pictures of the asphalt excavation and sensor installation. Notice that the crack visible between the different layers of asphalt in Figure 9 was caused by the stress of moving the slab. The crack closed when the sample was placed on the metal base-plate. The six chosen models of fixed sensors were installed in both the concrete and asphalt test sections according to vendor specifications and the procedures recommended in SHRP report number H-351 (RWIS, Volume II Implementation Guide) [3]. The core drilling and saw cutting were carefully performed to minimize cracking and breakage of the test sections. All cutting and drilling was performed prior to sensor installation. Vendors were offered the opportunity to participate on-site in the installation of their sensors.
Figure 5
Saw Cutting and Drilling of Laboratory Concrete Test Section

Laboratory and Field Studies of Pavement 17 Final Report
Temperature Sensors
Figure 6
Concrete Core Drilling in Preparation for Sensor Installation
Figure 7
Concrete Sensor Installation

Laboratory and Field Studies of Pavement 18 Final Report
Temperature Sensors
Figure 8
Laboratory Sensor Locations (Concrete)

Laboratory and Field Studies of Pavement 19 Final Report
Temperature Sensors
Figure 9
Removal of Asphalt Test Section at Mn/ROAD Facility
Figure 10
Placement of Asphalt Test Section on Concrete and Steel Plate

Laboratory and Field Studies of Pavement 20 Final Report
Temperature Sensors
Figure 11
Asphalt Core Drilling in Preparation for Sensor Installation
Figure 12
Asphalt Sensor Installation

Laboratory and Field Studies of Pavement 21 Final Report
Temperature Sensors
Figure 13
Laboratory Sensor Locations (Asphalt)

Laboratory and Field Studies of Pavement 22 Final Report
Temperature Sensors
The test sections were then carefully transported to the Braun test facility. The test sections were placed on wood pallets and then placed on metal dollies to facilitate movement in and out of the environmental test chamber. The tests were conducted with the test sections resting on the wood pallets and dollies. A two-inch aluminum barrier was constructed around the exterior edge of each test section to hold snow/ice in place during testing. The barrier was installed such that it did not retain water.
It is important to note that evaluation of the pavement test sections on pallets and dollies differs from a real world pavement because the undersides of the sections are exposed to the air. In the real world, the pavement is in contact with the ground, a significant heat source and heat sink. Also, the sections were exposed to the air, not surrounded by pavement or other material. These factors cause the thermal properties of the pavement to differ from a real world environment by an unknown amount. Due to space considerations, these differences are inherent limitations of the tests.
Mobile sensors were installed on a framework centered above the test sections at a height of four feet in all cases except the varied height tests described in Objective 1-4. This height was chosen because it represented a typical installation height on a deployed vehicle. This height also conformed to each manufacturers’ recommended installation height; Sprague required the sensor to be mounted a minimum of 20 inches above the pavement surface. Control Products stated that the sensor could be installed at any height. See Figure 4 for a schematic diagram and Figure 14 for placement in the test chamber. The Braun environmental chamber was used to conduct the laboratory portion of the test. This chamber is a walk-in seven feet wide by eight feet high by nine feet deep chamber with temperature range from -23º C to +38º C (-10º F to 100º F). The door opening is 35 3/4” wide. The chamber is capable of maintaining a stable temperature that varies by approximately 0.5º C (1.0º F). The chamber temperature variation is created as the cooling unit cycles on and off in response to the thermostat. Both fixed and mobile sensors were evaluated using the environmental chamber. Figure 14 is a picture of the inside of the test chamber. Sensor data output from the subject sensors and baseline sensors were collected according to the following criteria, unless otherwise noted:
• Baseline temperature data was collected at least to the nearest 0.01° C.
• Subject temperature data was collected at least to the nearest 0.1° C (except for Sprague sensor data resolution was to only the nearest 0.55° C).
• Data was automatically collected once every two minutes or less.
• Vaisala sensor data was collected every 10 minutes due to the sensor’s RPU data storage limitations.
• All incoming data included a time stamp.

Laboratory and Field Studies of Pavement 23 Final Report
Temperature Sensors
Figure 14
Laboratory Test Chamber
*Note the mobile sensor installation above the test sections
Each specific test objective is described as follows:
3.1.1 Objective 1-1: Fixed Temperature The objective of this test was to evaluate subject sensor performance at different constant temperatures. Subject sensors were evaluated against baseline readings at each given temperature. For each test, the temperatures of the pavement test sections were stabilized in the environmental chamber. Once stabilized, baseline and subject sensor data was collected for approximately 30 minutes. The subject sensors were evaluated at the following four different temperatures: Objective 1-1a: Warm (5° C (41° F)) – Above this point, application of de-icing and anti-icing chemical is typically not required.

Laboratory and Field Studies of Pavement 24 Final Report
Temperature Sensors
Objective 1-1b: Freezing point (0 ° C, 32° F) – The critical temperature range where ice begins to form and frost may form. Objective 1-1c: Cold (-6° C, 21° F) –Near the lower end of the temperature range where NaCl application typically works well. Objective 1-1d: Very Cold (-17° C, 1° F) – Temperature below which NaCl is not typically applied.
3.1.2 Objective 1-2: Varying Temperature Objective 1-2a: This test captured the temperature outputs of the subject sensors and baseline sensors in a declining temperature environment. The purpose of these varying temperature tests was to simulate real-world conditions where temperatures can quickly rise and fall. To conduct this test, the pavement test section was brought to a stable temperature of approximately 16° C (60° F) in the test chamber. Next, the test chamber was programmed to gradually lower the temperature of the air in the chamber until it reached -17° C (1° F). The chamber’s cooling rate was approximately 5.6° C (10° F) per hour. The test was concluded when the test section temperatures have stabilized. The subject sensors were evaluated against baseline readings during the pavement cool-down. Objective 1-2b: A second test was run to capture the temperature outputs of the subject and baseline sensors in an increasing temperature environment. In this test, the pavement test sections were stabilized at -17° C (1° F) in the environmental chamber and then warmed to 16° C (60° F). Similar to cooling, the rate of heating was approximately 5.6° C (10° F) per hour. The subject sensors were evaluated against baseline readings during the pavement warm-up.
3.1.3 Objective 1-3: Mobile Sensor Acclimation Time This test measured the time required for the mobile sensors to stabilize at a reading when moved from a warm environment to a cold environment. Acclimation time tests were conducted at four different temperatures. The goal of these tests was to simulate a typical operation in which a truck with a mobile sensor is parked inside a heated garage and then driven out into a cold environment. In each case, the mobile sensors were first brought to a stable temperature outside of the environmental test chamber. Room temperature was approximately 16° C (60° F)). A minimum of two hours was allotted for the mobile sensors to stabilize at room temperature. Next, the mobile sensors were brought into the environmental chamber to measure stabilized pavement temperatures of -17° , -7° , 0° , and 6° C (1, 19, 32, and 43° F). The test data was analyzed to quantify how long it took the sensors to report a stabilized reading of the pavement’s temperature. The times required to reach three specific temperature thresholds were obtained. First, the time for the mobile sensors to report the pavement temperature to within 10.0° C (18° F) was recorded. As the test continued, the mobile sensors acclimated and the readings became more accurate. Next, the time to report the pavement temperature to within 5.0° C (9° F) was recorded. This continued until each mobile sensor provided a reading that was within 1.0° C (1.8° F) of the baseline sensors. The test was given a time limit of 5 hours.

Laboratory and Field Studies of Pavement 25 Final Report
Temperature Sensors
Objective 1-3a: Time to acclimate with pavement at 6° C (43° F). Objective 1-3b: Time to acclimate with pavement at 0° C (32° F). Objective 1-3c: Time to acclimate with pavement at -7° C (19° F). Objective 1-3d: Time to acclimate with pavement at -17° C (1° F).
3.1.4 Objective 1-4: Varied Mobile Sensor Height The purpose of this test was to determine the effects of mounting height on sensor accuracy (mobile sensors only). The relevance of this test is that in practice, mobile sensors are mounted on variety of vehicles and in varying positions that affects sensor mounting height. However, there is little documentation regarding the relation between sensor height and accuracy. The Sprague sensor’s recommended mounting height was at least 20 inches above the pavement surface. The Control Products installation manual stated that their sensor could be installed at any height. For this test, each mobile sensor was installed on a variable height structure and aimed directly down at the center of the concrete and asphalt test sections. The mobile sensors were carefully aimed to ensure that only the asphalt/concrete portions of the test sections are in sensor’s field of view, not other in-pavement sensors or the chamber floor. This was important because the emissivity value of the in-pavement sensor surfaces is different than the nearby pavement. Before the test, the mobile sensors and test sections were allowed to stabilize at one of four temperatures, -17° , -5° , 0° and 6° C (1, 23, 32 and 43° F). For each temperature setting, the mobile sensors were tested at four different mounting heights, resulting in a total of 16 different tests. After adjusting the sensor to each mounting height, the sensor was allowed to stabilize for a minimum of five minutes. After stabilization, data was collected for approximately 30 minutes. Tests were conducted at the following heights above the pavement: 1-foot, 2 feet, 3 feet and 4 feet. Higher mounting locations were not possible because of test chamber height limitations. However, this test does not account for conditions that would be encountered in an actual deployment. These other environmental factors include roadway sand/salt/water spray, vibrations, pavement variations or the thermal effects of nearby objects including vehicle engines or exhaust systems. Objective 1-4a: Varied Mobile Sensor Height at temperature of 6° C (43° F). Objective 1-4b: Varied Mobile Sensor Height at temperature of 0° C (32° F). Objective 1-4c: Varied Mobile Sensor Height at temperature of -5° C (23° F). Objective 1-4d: Varied Mobile Sensor Height at temperature of -17° C (1° F).

Laboratory and Field Studies of Pavement 26 Final Report
Temperature Sensors
3.1.5 Objective 1-5: Cold Day With and Without Direct Solar Impact
Objective 1-5a: To simulate a cold day without direct solar impact, the pavement test-sections
were placed in the environmental chamber and allowed to stabilize at a temperature of -7° C (19° F). Data from the subject and baseline sensors were then collected for approximately 25 minutes. Objective 1-5b: To simulate a cold day with direct solar impact, a sunlight-simulator (two 500-watt halogen lights) was placed above each pavement test-section and illuminated to simulate solar radiation. See Figure 15 for a picture taken during the solar impact test. The intent was to find a low-cost sunlight simulator that had energy output characteristics similar to sunlight (i.e., similar energy output in infrared, visible and ultraviolet wavelengths). The lighting was turned on and the baseline and subject sensor values were then recorded for approximately four hours.
Figure 15
Laboratory Solar Impact Test
3.1.6 Objective 1-6: Warm Pavement With Snowfall
Since snowfall is a difficult phenomenon to artificially replicate, this test condition was performed by distributing finely shaved ice across the pavement test surface. First, ice shaved by a Zamboni® was collected from a local ice skating arena and then allowed to reach a stable temperature of -6° C (21° F) in a separate environmental chamber. The primary
chamber containing the pavement section was set to 5° C (41° F) and allowed to stabilize. Sensor values were recorded at this stable condition. Next, the shaved ice was placed on the test section and evenly distributed in small increments using a broom. The shaved ice was distributed such that two inches had accumulated after 15 minutes. The 2-inch barrier around the exterior of the test sections kept the crushed ice in place, but allowed melt water to drain from the pavement surface. Sensor readings were recorded throughout the application process and during the four hours that followed.

Laboratory and Field Studies of Pavement 27 Final Report
Temperature Sensors
3.1.7 Objective 1-7: Cold Pavement With Rainfall
For this test the environmental chamber was stabilized at a temperature of -7° C (19° F). A spray tank filled with distilled water was cooled to a stable temperature of 2° C (35° F) in a separate environmental chamber. A mist was then sprayed over the pavement test-section to simulate a light rain. The mist was applied incrementally to avoid pooling and run-off. Water was applied such that 0.2-inches of ice had accumulated in 30 to 60 minutes. Sensor values were automatically recorded throughout this test and during the following four hours.
3.1.8 Objective 1-8: Iced Pavement With Rainfall
At the conclusion of the above test, the iced-over -7° C (19° F) pavement test-sections were
again sprayed with a 2° C (35° F) mist of distilled water to simulate rain. The mist was applied incrementally to avoid pooling and runoff. The water was applied such that 0.2-inches of ice accumulated in 30 to 60 minutes. The goal of this test was to simulate iced pavement with rainfall. Sensor values were automatically recorded throughout this test and for the following four hours. The asphalt test section following the rainfall test is shown in Figure 16; note the layer of ice across the pavement.
Figure 16
Cold Pavement After Simulated Rainfall Test (Asphalt)
3.1.9 Objective 1-9: Compacted Snow (Melting) For this test, the pavement sections were cleared of all moisture and cooled to a stable temperature
of 0° C (32° F). Shaved ice was then collected and allowed to reach a stable temperature of -6° C (21° F) in a separate environmental chamber. Next, the shaved ice was distributed across the pavement to a uniform depth. Then the shaved ice was evenly compacted to simulate compacted snow. The temperature of the pavement section was allowed to stabilize at 0° C (32° F).

Laboratory and Field Studies of Pavement 28 Final Report
Temperature Sensors
Once the pavement section temperatures had stabilized at 0° C (32° F), the chamber temperature was gradually increased at a rate of approximately 5.6° C (10° F) per hour until all the snow had melted, and the test was complete. The test sections were equipped with a two-inch high barrier around the perimeter to contain the snow. The barrier was designed to allow water from the melting snow to drain off the pavement surface.
3.1.10 Objective 1-10: Frost Depositing
The objective of this test was to create and document the formation of frost on the test sections of the pavement. First, the environmental test chamber and test sections were allowed to stabilize
at a temperature of -6° C (21° F). Next, humidity in the test chamber had to be increased in order to facilitate the formation of frost. An obstacle was encountered while trying to raise the humidity within the test chamber. The ambient moisture was condensing out of the air, onto the cooling fins inside the air conditioning
unit while the -6° C (21° F) temperature was being maintained. To counteract this obstacle, a large cooler full of hot tap water was placed in the chamber and continuously stirred during the test to rapidly increase the relative humidity in the chamber. This added moisture was then deposited as frost on the test sections. The test technician observed and recorded the point when frost formation was first visible on the pavement surfaces. Baseline and subject sensor values were automatically recorded throughout the procedure and for one hour after the formation of frost.
3.1.11 Objective 1-11: Mobile Sensor Performance in Varying Ambient Temperature
This test was used to determine the effect of ambient air temperature on sensor readings when the two mobile sensors were aimed at a target of constant temperature. To conduct this test, the mobile sensors were removed from the chamber and installed above an ice/water bath. The ambient temperature in the room of the ice bath was approximately 18° C (65° F). After the mobile sensor readings stabilized, five readings were recorded over 10 minutes. Next, the mobile sensors and ice water bath were brought into the chamber which had been cooled to a stable temperature of 0° C (32° F). Readings were recorded over the next hour.

Laboratory and Field Studies of Pavement 29 Final Report
Temperature Sensors
3.2 Test Plan 2: De-icing Chemical Tests
Both anti-icing and de-icing applications are commonly used to prevent pavement surfaces from icing. Anti-icing refers to the spraying of a chemical onto pavement surfaces before the ice development or snow events. Deicing generally refers to the spreading of pre-wetted solid sodium chloride (NaCl) onto pavement surfaces after the ice or snow events. For both methods, the applied chemical lowers the freezing/melting point of water/ice, resulting in wet road surface conditions instead of icy and slippery conditions. The general procedures and sequences for comparing the sensors under chemical test conditions were similar to the procedures outlined in Test Plan 1. All chemical tests were conducted in the environmental test chamber.
The NaCl used in this test was obtained from Mn/DOT, which was one of the Aurora agencies involved in the study. The liquid 23% by NaCl by weight mixture was applied at a rate of 25 to 40 gallons per lane mile. Application rates were obtained from Guideline 35.25 in the Wisconsin Department of Transportation (another Aurora member agency) State Highway Maintenance
Manual. These guidelines are provided in Appendix C.
A spray tank filled with the NaCl mixture was cooled to 2° C (35° F) in order to approximate actual application temperatures. The NaCl solution was then sprayed onto the pavement test sections and housings of the mobile sensors in order to simulate an actual deployment in which sensors are subjected to salt spray. Note that the NaCl solution did not come in direct contact with the optical lenses of the mobile sensors. An actual field deployment would subject the sensors to additional roadway spray. The following objectives were tested:
3.2.1 Objective 2-1: Sodium Chloride – Cold Day With and Without Direct Solar Impact
This test followed the same procedures as Objective 1-5, except the NaCl mixture was applied prior to the start of the test. The pavement temperature for this test was -7° C (19° F) and an application of 25 gallons of liquid salt mixture per lane mile was applied. This application rate was derived from the Appendix C guidance for a predicted event of frost or black ice. Objective 2-1a: To simulate a cold day without direct solar impact, the pavement test-sections
were placed in the environmental chamber and allowed to stabilize at a temperature of -7°C
(19°F). Data from the subject and baseline sensors were then collected for approximately 25 minutes. Objective 2-1b: To simulate a cold day with direct solar impact, two 500-watt halogen lights were placed above each pavement test-section and illuminated to simulate solar radiation. After the lights were switched on, the baseline and subject sensor values were recorded for approximately four hours.

Laboratory and Field Studies of Pavement 30 Final Report
Temperature Sensors
3.2.2 Objective 2-2: Sodium Chloride – Warm Pavement With Snowfall
This test followed the same procedures as Objective 1-6, except the NaCl mixture was applied prior to the start of the test and directly applied to the mobile sensors. The pavement temperature for this test was 4° C (39° F) and an application of 40 gallons of liquid salt mixture per lane mile was applied. This application rate was derived from the Appendix C guidance for a predicted precipitation event of moderate or heavy snow (more than ½ inch per hour).
3.2.3 Objective 2-3: Sodium Chloride – Cold Pavement With Rainfall
This test used the same procedure as Objective 1-7, except the NaCl mixture was applied prior to the start of the test. The pavement temperature for this test was -6° C (21° F) and an application of 30 gallons of liquid salt mixture per lane mile was applied. This application rate was derived from the Appendix C guidance for a predicted precipitation event of light snow (less than ½ inch per hour).
3.2.4 Objective 2-4: Sodium Chloride – Iced Pavement With Rainfall
This test used the same procedure as Objective 1-8, except the NaCl mixture was applied prior to the start of the test. The pavement temperature for this test was -6° C (21° F) and an application of 30 gallons of liquid salt mixture per lane mile was applied. Note that this test immediately followed the previous test, simulating a condition in which chemicals were applied before and after a weather event. Therefore, the application rate selected is for a repeat application as indicated in the guideline in Appendix C for a predicted precipitation event of light snow (less than ½ inch per hour).

Laboratory and Field Studies of Pavement 31 Final Report
Temperature Sensors
3.3 Test Plan 3: Field Tests
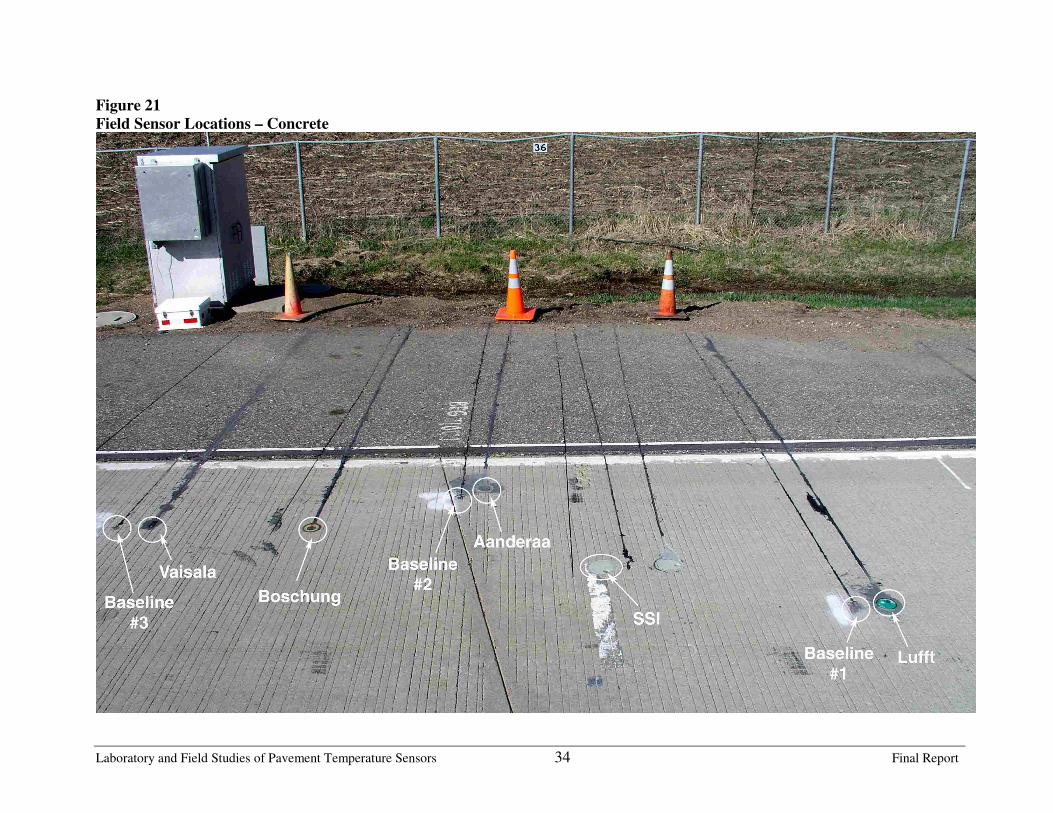
The following field tests were conducted at the Mn/DOT’s Mn/ROAD research facility near Monticello, Minnesota. New sensors were installed into the in-place pavement (concrete and asphalt) on a low volume test road. The test road had occasional passenger vehicle and semi-truck traffic driven at periodic intervals for pavement research purposes. The test road was otherwise closed to public traffic. The purposes of these tests were to analyze sensor performance under “real world” conditions and compare this data with the previous laboratory data. See Figures 17 through 21 for pictures of sensor installation and placement at the field test facility. Also note the baseline sensor installed to the right of the sensor in Figure 19. The Point Six sensor was installed in the field, but repeated attempts to establish communication with the sensor failed. The vendor indicated they were satisfied with the results from the laboratory tests and asked to be withdrawn from the field testing.
Figure 17
Pavement Preparation for sensor Installation (Saw Cutting)

Laboratory and Field Studies of Pavement 32 Final Report
Temperature Sensors
Figure 18
Field Sensor Placement
Figure 19
Final Sensor and Baseline Installation

Laboratory and Field Studies of Pavement Temperature Sensors 33 Final Report
Figure 20
Field Sensor Locations – Asphalt
Laboratory and Field Studies of Pavement Temperature Sensors 34 Final Report
Figure 21
Field Sensor Locations – Concrete

Laboratory and Field Studies of Pavement 35 Final Report
Temperature Sensors
3.3.1 Objective 3-1: Cold day With and Without Direct Solar Impact
Objective 3-1a: For cold day (temperatures less than 0° C (32° F)) with direct solar impact, data was collected on a day with no cloud cover.
Objective 3-1b: For cold day (temperatures less than 0° C (32° F)) without direct solar impact, data was collected on a day with cloud cover.
3.3.2 Objective 3-2: Cold night With and Without Strong Radiational Cooling Objective 3-2a: For the cold night without strong radiational cooling, data was collected on an overcast night with a low temperature of approximately 7° C (45° F).
Objective 3-2b: For the cold night with strong radiational cooling, data was collected on a clear night with temperatures of approximately 0° C (32° F). These conditions were chosen because there was no incoming radiation from the sun or downward radiation from the clouds. The pavement radiates heat to the atmosphere, but the clouds do not radiate heat back down to the pavement. As a result, the pavement can cool to temperatures below the ambient air temperature.
3.3.3 Objective 3-3: Warm Pavement With Snowfall
This test was conducted when the pavement temperature was approximately 7° C (45° F) and the pavement was clear of snow and ice. Since natural snowfall is difficult to predict, artificial snow was manually distributed over the subject and baseline sensors. Crushed ice (ranging from dust to pea size particles) was used as the artificial snow. Sensor readings were recorded throughout the application process and for the following four hours.
3.3.4 Objective 3-4: Cold Pavement With Rainfall
This test was conducted when the ambient air temperature was approximately -12° C (9° F) and the pavement was clear of snow and ice. A spray tank was filled with distilled water and was cooled to a stable temperature of 2° C (35° F). Next, a fine mist was sprayed over the pavement test-sections to simulate a light rain. Refer to Figure 22 for a picture of the rainfall test.
3.3.5 Objective 3-5: Iced Pavement With Rainfall
At the conclusion of the previous test, the iced-over pavement was again sprayed with a fine 2° C
(35° F) mist of distilled water to simulate rain. The goal of this test was to simulate iced pavement with rainfall.
3.3.6 Objective 3-6: Mobile Sensor Field Evaluation Mobile sensor performance was evaluated in the field by mounting the sensors to a platform that was then attached to the front bumper of a passenger vehicle. See Figures 23 and 24 for pictures of the mobile sensor set-up; these pictures were taken during an ice bath test.

Laboratory and Field Studies of Pavement 36 Final Report
Temperature Sensors
Figure 22
Cold Pavement With Simulated Rainfall Test
Figure 23
Mobile Ice-bath Set-up for Field Testing
Figure 24
Mobile Ice-bath Set-up for Field Testing (Close-up)
Laboratory and Field Studies of Pavement 37 Final Report
Temperature Sensors
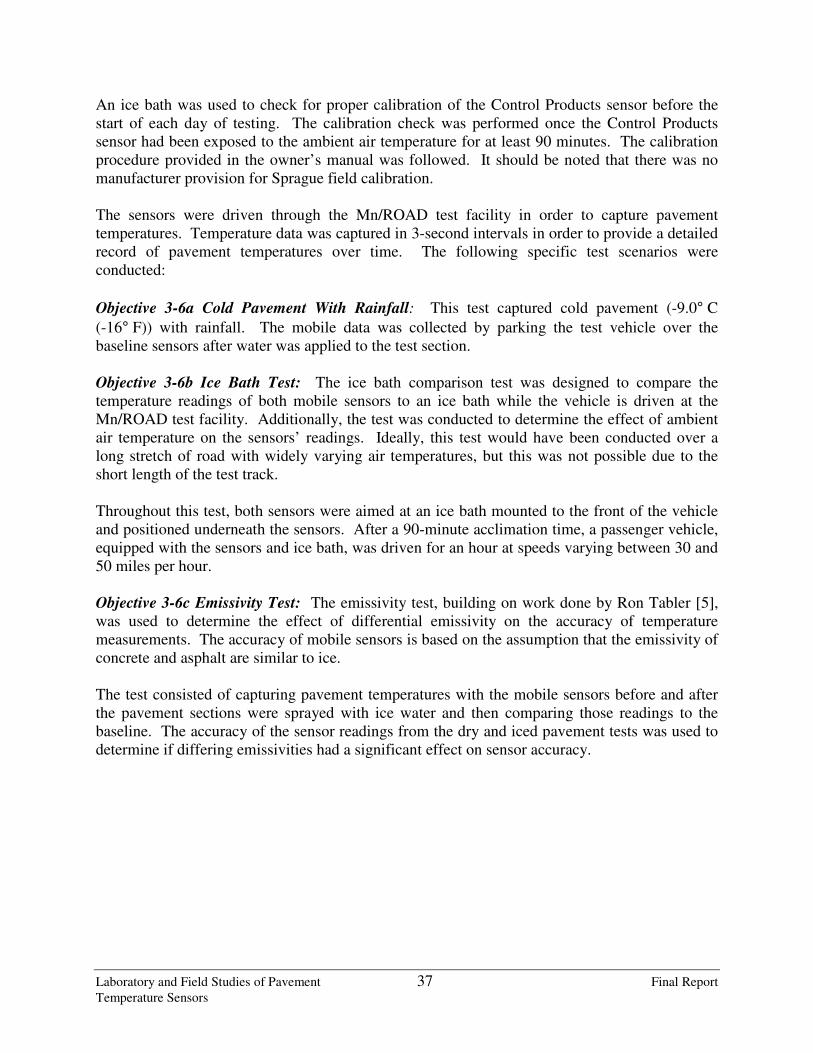
An ice bath was used to check for proper calibration of the Control Products sensor before the start of each day of testing. The calibration check was performed once the Control Products sensor had been exposed to the ambient air temperature for at least 90 minutes. The calibration procedure provided in the owner’s manual was followed. It should be noted that there was no manufacturer provision for Sprague field calibration. The sensors were driven through the Mn/ROAD test facility in order to capture pavement temperatures. Temperature data was captured in 3-second intervals in order to provide a detailed record of pavement temperatures over time. The following specific test scenarios were conducted:
Objective 3-6a Cold Pavement With Rainfall: This test captured cold pavement (-9.0° C
(-16° F)) with rainfall. The mobile data was collected by parking the test vehicle over the baseline sensors after water was applied to the test section. Objective 3-6b Ice Bath Test: The ice bath comparison test was designed to compare the temperature readings of both mobile sensors to an ice bath while the vehicle is driven at the Mn/ROAD test facility. Additionally, the test was conducted to determine the effect of ambient air temperature on the sensors’ readings. Ideally, this test would have been conducted over a long stretch of road with widely varying air temperatures, but this was not possible due to the short length of the test track. Throughout this test, both sensors were aimed at an ice bath mounted to the front of the vehicle and positioned underneath the sensors. After a 90-minute acclimation time, a passenger vehicle, equipped with the sensors and ice bath, was driven for an hour at speeds varying between 30 and 50 miles per hour. Objective 3-6c Emissivity Test: The emissivity test, building on work done by Ron Tabler [5], was used to determine the effect of differential emissivity on the accuracy of temperature measurements. The accuracy of mobile sensors is based on the assumption that the emissivity of concrete and asphalt are similar to ice. The test consisted of capturing pavement temperatures with the mobile sensors before and after the pavement sections were sprayed with ice water and then comparing those readings to the baseline. The accuracy of the sensor readings from the dry and iced pavement tests was used to determine if differing emissivities had a significant effect on sensor accuracy.

Laboratory and Field Studies of Pavement 38 Final Report
Temperature Sensors
4 Results The results of the statistical analysis are presented in the appendixes. The mean absolute error was selected as the primary statistic for expressing results because it does not allow for values higher and lower than the baseline to offset each other, as would be the case with a basic mean calculation. Also, it was felt that mean absolute values are widely understood by the report’s intended audience. The mean error was also incorporated for further clarification and comparison when needed. The root mean square was also calculated for each of the tests, but was not presented in the text of the report in the interest of brevity. See Appendix E for additional statistics. The majority of the data presented in this report is unedited data captured directly from each sensor. However, there are two situations in which the raw sensor data required adjustment in order to provide an accurate picture of the sensors performance.
Control Products Mobile Sensors The first situation involved the two Control Products mobile sensors. Upon preliminary inspection of the laboratory test results, the sensors consistently reported temperature values approximately 0.9° C higher than its baseline. Investigation suggested that the sensors may have been mis-calibrated prior to the laboratory testing. In order to test this hypothesis, the sensors were recalibrated and retested in the laboratory after the original testing was completed. It was determined that the original miscalibration occurred during an ice bath calibration procedure; the original ice bath was not mixed properly and/or was not given sufficient time for the water temperature to equilibrate. After the Control Products sensors were carefully recalibrated, several constant and variable temperature tests were performed again in the laboratory. The average of the mean absolute errors for these tests was less than 0.1° C. Therefore, it was concluded that the Control Products sensors were miscalibrated during the initial laboratory testing. To compensate for the miscalibration, the average of the mean absolute errors for the entire laboratory testing as calculated for the asphalt and concrete sensors. These average values, 0.84 and 1.05° C for the asphalt and concrete respectively, were assumed to be the magnitude of the initial miscalibration. These miscalibration values were then subtracted from all of the initial laboratory raw data. This modified laboratory data is presented throughout this report. It should be noted that the Control Products sensors were thoroughly re-calibrated prior to the original field testing. Additionally, analysis of the field data did not show the consistent miscalibration patterns that were present during the laboratory testing. Therefore, no adjustment was made to the field data.
Sprague Mobile Sensors The second situation involved data captured from the Sprague sensors. Preliminary inspection of the raw data showed a significant number of erratic temperature values. Closer inspection showed that these erratic data points corresponded to the air temperature inside the laboratory test chamber. Through direct comparison of the live-sensor and the computer-recorded data, it was determined that the computer used to record the raw data was erratically capturing air temperature data points and reporting them as pavement data points. Therefore, the raw data was manually filtered to remove the obvious erratic air temperature values. This filtered data is presented throughout this report.

Laboratory and Field Studies of Pavement 39 Final Report
Temperature Sensors
4.1 Summary of Results This section of the report presents summarized findings from each of the tests. It also contains some interpretation to further explain why certain sensors may have responded to the given condition. Sections 4.2, 4.3 and 4.4 present more detailed results for each of the tests. The test results are presented in the same order as the test plans.
4.1.1 Controlled Climate and Chemical Test Summary
This section presents results and explains issues encountered in the laboratory. Because the environment could be carefully controlled, it was easier to note the differences between the sensors. This part of the testing isolated issues that affect the accuracy of the sensor compared to the baseline. Throughout the laboratory testing, the average mean error was 0.7° C for the in-pavement sensors and 0.8° C for the mobile sensors. The results of Test 1-5b and Test 2-1b, direct solar impact in the test laboratory, were highly varied. The variation that the baseline sensors provided when compared to one another was of particular note. Both baseline and subject sensor data varied within each pavement section. The field version of this test, Test 3-1a, reported significantly more stable and consistent temperatures. This would suggest that the laboratory procedure for simulating solar radiation was ineffective and that extreme caution should be used when analyzing sensor performance during the artificial solar testing.
– NOTE –
To minimize the amount of text in the graphs, sensors are often labeled with letters. The following list shows which sensor corresponds with each letter:
• Sensor A: Aanderaa 3565 Road Condition Sensor
• Sensor B: Boschung BOSO Passive
• Sensor C: Lufft FASS Black Ice Detector IRS-21
• Sensor D: Point Six Wireless Point Probe
• Sensor E: SSI FP-2000
• Sensor F: Vaisala DRS 511
• Sensor G: Sprague RoadWatch
• Sensor H: Control Products 999J

Laboratory and Field Studies of Pavement 40 Final Report
Temperature Sensors
Table 3: Laboratory Results Summary
TEST NO.
Asphalt Concrete Asphalt Concrete Asphalt Concrete Asphalt Concrete Asphalt Concrete Asphalt Concrete
AANDERAA 0.16 0.24 0.03 0.12 1.06 1.23 0.11 0.06 1.74 4.75 1.52 2.91
BOSCHUNG 1.82 0.19 0.20 0.16 0.22 0.19 0.06 0.06 1.22 0.26 1.10 0.36
LUFFT 0.21 0.08 0.11 0.03 0.10 0.05 0.53 0.40 0.36 0.42 0.55 0.35
POINT 6 1.60 0.89 0.38 0.74 0.20 0.07 0.23 0.27 0.54 0.29 1.43 1.17
SSI 0.45 0.49 0.40 0.30 0.73 0.58 0.74 0.60 1.23 0.97 0.14 0.15
VAISALA 0.13 0.12 0.08 0.11 0.07 0.12 0.08 0.05 0.13 0.19 1.16 0.14
SPRAGUE 0.78 0.52 1.13 0.36 1.53 0.46 1.56 0.33 N/A 0.98 N/A 0.68
CONTROL PRODUCTS 0.20 0.20 0.08 0.10 0.55 0.30 1.20 0.31 N/A 0.75 N/A 0.70
TEST NO.
Asphalt Concrete Asphalt Concrete Asphalt Concrete Asphalt Concrete Asphalt Concrete Asphalt Concrete
AANDERAA 0.31 0.31 3.35 3.17 1.34 1.05 0.85 0.62 0.43 0.58 1.20 0.56
BOSCHUNG 0.17 0.16 0.97 0.55 0.85 0.32 0.65 0.63 0.44 0.34 0.88 0.56
LUFFT 0.16 0.06 0.23 0.16 0.46 0.15 0.90 0.92 0.31 0.30 0.55 0.60
POINT 6 0.28 0.19 0.68 1.47 0.76 0.67 1.27 0.74 0.97 0.77 0.61 1.12
SSI 0.50 0.54 2.10 1.52 0.55 0.47 1.42 1.17 0.67 1.09 0.39 0.76
VAISALA 0.07 0.08 3.35 1.23 0.79 0.76 1.17 0.75 0.89 0.62 N/A N/A
SPRAGUE 1.13 0.47 1.15 N/A 1.01 0.37 1.96 N/A 1.98 0.83 1.39 0.63
CONTROL PRODUCTS 0.10 0.15 2.80 0.63 0.56 0.71 0.95 0.49 0.67 0.42 1.76 0.87
TEST NO.
Asphalt Concrete Asphalt Concrete Asphalt Concrete Asphalt Concrete Asphalt Concrete Asphalt Concrete
AANDERAA 0.66 0.62 0.09 0.05 2.14 1.68 1.58 1.06 0.50 0.51 0.67 0.52
BOSCHUNG 0.52 0.22 0.22 0.18 0.51 0.46 0.28 0.63 0.37 0.26 0.45 0.26
LUFFT 0.37 0.24 0.10 0.10 0.31 0.37 1.10 0.28 0.60 0.59 N/A N/A
POINT 6 1.27 N/A 0.18 0.14 1.76 1.17 0.72 0.57 1.08 0.56 1.34 0.74
SSI 0.38 0.32 0.62 0.43 2.62 1.44 0.44 0.51 0.68 0.77 1.10 0.97
VAISALA 0.20 0.14 N/A N/A 2.15 1.16 0.71 0.60 0.34 0.48 0.38 0.54
SPRAGUE 1.21 N/A 0.82 N/A 0.71 N/A 0.94 N/A 1.27 N/A 2.02 N/A
CONTROL PRODUCTS 0.80 0.51 0.30 0.16 2.61 0.20 0.93 1.06 0.54 0.39 0.39 0.38
1. Values in table are Mean Absolute Differences between sensor and baseline temperature in Degrees Celsius.
2. N/A represents test data not available. See test result section for more detailed explanation.
Test Description:Fixed Temperature Fixed Temperature Fixed Temperature
5º C 0º C -6º C -17º C
1-1d
Fixed Temperature Declining Increasing
Temperature Temperature
w/o Solar Impact
1-1a 1-1b 1-1c
w/ Rainfall
1-2a 1-2b
Test Description:Cold Pavement Cold Pavement Warm Pavement Cold Pavement Iced Pavement Compacted Snow
(melting)
1-5a 1-5b 1-6 1-7 1-8 1-9
w/ Solar Impact w/ Snowfall w/ Rainfall
Test Description:Frost NaCl: Cold NaCl: Cold NaCl: Warm NaCl: Cold NaCl: Iced Pavement
Depositing w/o Solar Impact w/ Solar Impact w/ Snow w/ Rainfall w/ Rainfall
2-3 2-41-10 2-1a 2-1b 2-2

Laboratory and Field Studies of Pavement 41 Final Report
Temperature Sensors
Summary of In-Pavement Sensor Laboratory
In varying environmental testing, such as varying air temperature or adding rain and snow, some in-pavement sensors performed better than others, but most reported errors less than 1.5° C. In fact, 90 percent of the test results reported temperature errors less than 1.4° C, and the average absolute error was 0.7° C. Many of the errors associated with the varying environmental conditions were caused by the pavement sensors reporting temperature variations at a different rate than the baseline sensors. Some pavement sensors provided more stable readings, but registered the temperature change after a delay between five to 15 minutes for precipitation events and between 15 to 50 minutes for changes in the ambient air temperature. For example, an occasional trend was that the Aanderaa and Point Six sensors took approximately 20 minutes longer than the other sensors (30 minutes instead of 10 minutes) to fully respond to the abrupt temperature decreases associated with snowfall events. This response time may be due to the location of the temperature sensing element within these sensors. For example, if the element is two inches below the pavement surface, a temperature change would not be registered until the temperature change was transmitted to the temperature sensing element. However, the thermistor baselines were mounted at the surface of the pavement and were quickly influenced by temperature changes. Sensors that are buried below the pavement surface have some desirable qualities, such as more consistent temperature reporting when subjected to short-term influences. Because their temperature sensing elements are not at the surface, these sensors do not show rapid fluctuations when precipitation occurs. It would often be more important to know that there is a long-term dangerous condition developing than a short-term temperature change at the surface of the pavement. In addition, the Vaisala sensor was configured to report data in 10- or 30-minute intervals while the other sensors reported data in two-minute intervals. The larger Vaisala intervals were due to the software limitations of the Vaisala-supplied RPU that only allowed for 144 data “events” to be stored. The time interval was lengthened in order to capture data over the duration of the test. It did not appear that less frequent data collection significantly affected the end result of the data analysis.
Summary of Mobile Sensor Laboratory Tests
Overall, the mobile sensors reported similar levels of performance and accuracy as the in-pavement sensors. Throughout the mobile sensor testing, reported temperature errors ranged between 0.1 and 2.0° C. Additionally, 90 percent of the test results reported temperature errors less than 1.6° C. Tests of mobile sensors installed at different heights revealed that mounting height does not affect mobile sensor performance.
Laboratory and Field Studies of Pavement 42 Final Report
Temperature Sensors
It is important to note that the mobile sensors use remote sensing technology and are not in direct contact with the pavement. Because of this indirect temperature sensing, the mobile sensors are often not able to determine the pavement temperature when the roadway surface is covered by ice and/or snow. However, throughout this study, the mobile sensors were generally able to provide accurate data, even when the pavement was covered with thin layers of ice or snow. The Sprague mobile sensor regularly had the highest temperature variation from its baseline, often reporting a 1.0 or 1.5° C spread of temperatures on individual tests. A partial explanation for the variation is that the Sprague sensor had the lowest temperature resolution of the sensors tested, reporting temperatures to only the nearest 0.55° C. The Sprague sensor also required an approximate 30-minute acclimation period when transferred between significantly different ambient air temperatures; for example, when transported from a warm garage to the cold outdoors. Readings taken during this acclimation period were inaccurate by up to 20° C. Also, the Sprague sensor performance was impacted when the sensor was subjected to varying ambient air conditions when aimed at an ice bath during the change.
4.1.2 Field Test Summary
Overall, the field tests produced results that were similar to those of the laboratory. Table 4 provides a summary of the field test results.
Table 4: Field Test Summary
TEST NO.
Asphalt Concrete Asphalt Concrete Asphalt Concrete Asphalt Concrete
AANDERAA 0.39 1.66 N/A N/A 0.09 0.17 0.44 0.39
BOSCHUNG 0.58 2.05 0.29 0.92 0.76 0.74 0.61 1.01
LUFFT 0.23 1.85 0.10 1.07 0.63 0.87 0.91 1.37
SSI 0.58 1.31 0.50 0.68 0.30 0.74 0.08 0.46
VAISALA 1.49 2.25 0.94 1.37 0.98 0.94 1.09 1.01
TEST NO.
Asphalt Concrete Asphalt Concrete Asphalt Concrete
AANDERAA 0.65 1.27 1.53 1.70 0.56 1.44
BOSCHUNG 0.80 0.49 2.03 1.34 0.35 0.76
LUFFT 0.53 0.37 1.73 1.43 0.40 1.20
SSI 0.37 0.70 2.47 2.51 0.69 1.40
VAISALA 1.28 2.75 1.50 1.59 2.42 0.63
1. Values in table are Mean Absolute Differences between sensor and baseline temperature in Degrees Celsius
2. N/A represents test data not available. See test result section for more detailed explanation.
3-3 3-4 3-5
w/ Snowfall w/ Rainfall w/ RainfallTest Description:
Warm Pavement Cold Pavement Iced Pavement
3-1a 3-1b 3-2a 3-2b
Cold Night
w/ Solar Impact w/o Solar Impact w/o Radiation Cooling w/ Radiation CoolingTest Description:
Cold Day Cold Day Cold Night
Laboratory and Field Studies of Pavement 43 Final Report
Temperature Sensors
Summary of In-Pavement Sensor Field Tests The results of the field testing showed that the in-pavement sensors performed slightly less accurately in a “real” field environment than in the laboratory. The average error reported by the in-pavement sensors was 1.0° C and 90 percent of the test results reported temperature errors less than 1.9° C. One trend noticed at Mn/ROAD was that during the varying temperature tests (Tests 3-1 and 3-2) the subject sensors over-reported the temperature during day-time temperature increases and under-reported the pavement temperature during nighttime temperature decreases. These trends were not observed during the snow and rain tests. “Real-world” factors, such as solar radiation, radiational cooling, heating capacities or wind, may have affected sensor accuracy. Limited conclusions could be drawn regarding the Vaisala sensor’s accuracy or performance due to the large data reporting intervals of the Vaisala sensor.
Summary of Mobile Sensor Field Tests The average mobile sensor error during the field testing (Test 3-6) was 1.2° C. During some portions of field testing, both mobile sensors would over- or under-report the true pavement temperature. The sensors accuracy during other portions of the field tests made miscalibration an unlikely cause. Differing emissivities of the pavement and/or ice could be the cause. However, further field testing is necessary to confirm this theory.
4.2 Detailed Controlled Climate Test Results
This section presents detailed results and in-depth commentary on the controlled climate tests performed in the laboratory. Table 5 below summarizes the results from the controlled climate laboratory testing.
4.2.1 Fixed Temperature Tests Overall, most sensors reported temperatures within 1.0° C of their baseline sensors. The average error for the fixed temperature tests was 0.4° C; see the graph below for summarized data for this test. Sensors A through H are identified at the beginning of this chapter.
Test 1-1 Results
0.00
0.50
1.00
1.50
2.00
A B C D E F G H
Sensor
Me
an
Ab
so
lute
Err
or
(C)
Test 1-1A Asphalt
Test 1-1A Concrete
Test 1-1B Asphalt
Test 1-1B Concrete
Test 1-1c Asphalt
Test 1-1c Concrete
Test 1-1d Asphalt
Test 1-1d Concrete

Laboratory and Field Studies of Pavement 44 Final Report
Temperature Sensors
Table 5: Controlled Climate Summary
TEST NO.
Asphalt Concrete Asphalt Concrete Asphalt Concrete Asphalt Concrete Asphalt Concrete Asphalt Concrete
AANDERAA 0.16 0.24 0.03 0.12 1.06 1.23 0.11 0.06 1.74 4.75 1.52 2.91
BOSCHUNG 1.82 0.19 0.20 0.16 0.22 0.19 0.06 0.06 1.22 0.26 1.10 0.36
LUFFT 0.21 0.08 0.11 0.03 0.10 0.05 0.53 0.40 0.36 0.42 0.55 0.35
POINT 6 1.60 0.89 0.38 0.74 0.20 0.07 0.23 0.27 0.54 0.29 1.43 1.17
SSI 0.45 0.49 0.40 0.30 0.73 0.58 0.74 0.60 1.23 0.97 0.14 0.15
VAISALA 0.13 0.12 0.08 0.11 0.07 0.12 0.08 0.05 0.13 0.19 1.16 0.14
SPRAGUE 0.78 0.52 1.13 0.36 1.53 0.46 1.56 0.33 N/A 0.98 N/A 0.68
CONTROL PRODUCTS 0.20 0.20 0.08 0.10 0.55 0.30 1.20 0.31 N/A 0.75 N/A 0.70
TEST NO.
Asphalt Concrete Asphalt Concrete Asphalt Concrete Asphalt Concrete Asphalt Concrete Asphalt Concrete Asphalt Concrete
AANDERAA 0.31 0.31 3.35 3.17 1.34 1.05 0.85 0.62 0.43 0.58 1.20 0.56 0.66 0.62
BOSCHUNG 0.17 0.16 0.97 0.55 0.85 0.32 0.65 0.63 0.44 0.34 0.88 0.56 0.52 0.22
LUFFT 0.16 0.06 0.23 0.16 0.46 0.15 0.90 0.92 0.31 0.30 0.55 0.60 0.37 0.24
POINT 6 0.28 0.19 0.68 1.47 0.76 0.67 1.27 0.74 0.97 0.77 0.61 1.12 1.27 N/A
SSI 0.50 0.54 2.10 1.52 0.55 0.47 1.42 1.17 0.67 1.09 0.39 0.76 0.38 0.32
VAISALA 0.07 0.08 3.35 1.23 0.79 0.76 1.17 0.75 0.89 0.62 N/A N/A 0.20 0.14
SPRAGUE 1.13 0.47 1.15 N/A 1.01 0.37 1.96 N/A 1.98 0.83 1.39 0.63 1.21 N/A
CONTROL PRODUCTS 0.10 0.15 2.80 0.63 0.56 0.71 0.95 0.49 0.67 0.42 1.76 0.87 0.80 0.51
1. Values in table are Mean Absolute Differences between sensor and baseline temperature in Degrees Celsius
2. N/A represents test data not available. See test result section for more detailed explanation.
Test Description:Fixed Temperature Fixed Temperature Fixed Temperature
5º C 0º C -6º C -17º C
1-1d
Fixed Temperature Declining Increasing
Temperature Temperature
w/o Solar Impact
1-1a 1-1b 1-1c
w/ Rainfall
1-2a 1-2b
Test Description:Cold Pavement Cold Pavement Warm Pavement Cold Pavement Iced Pavement Compacted Snow
(melting)
1-5a 1-5b 1-6 1-7 1-8 1-9
w/ Solar Impact w/ Snowfall w/ Rainfall
Frost
Depositing
1-10

Laboratory and Field Studies of Pavement 45 Final Report
Temperature Sensors
Throughout the fixed temperature testing, the Sprague sensor reported temperature variations significantly greater than the other sensors tested. On any given test, the Sprague sensors’ raw data varied by 1.0 to 2.0° C while the other sensors varied by only 0.1 or 0.2° C. It is important to note that the Sprague sensor had a data resolution of 0.55° C while the other sensors reported resolution around 0.1° C. Averaging the Sprague sensor’s raw data yielded an average error of 0.8° C for the fixed temperature tests. The graph on the left illustrates a typical in-pavement sensor’s performance (in this case, Vaisala) while the performance of the Sprague sensor is provided on the right. The difference in data variation is shown in the graphs as well.
Comparison Between Baseline and Vaisala
Test 1-1b: Asphalt
-2.00
-1.50
-1.00
-0.50
0.00
0.50
1.00
1.50
2.00
15:36 15:43 15:50 15:57 16:04 16:12
Time (Hour:Min)
Te
mp
era
ture
(C
)
Baseline
Vaisala
Comparison Between Baseline and Sprague
Test 1-1b: Concrete
-2.00
-1.50
-1.00
-0.50
0.00
0.50
1.00
1.50
2.00
15:36 15:43 15:50 15:57 16:04 16:12
Time (Hour:Min)
Te
mp
era
ture
(C
)
Baseline
Sprague
Test 1-1a: 5° C For both the concrete and asphalt portions of the test, the individual baseline temperatures were constant, ranging between 4.4 and 4.8° C. The Aanderaa, Lufft, SSI, Vaisala and Control Products sensors reported mean absolute errors less than 0.5° C. On the concrete test, Boschung and Sprague reported mean absolute errors of 0.5° C or less and the Point Six reported a mean absolute error of 0.9° C. For the asphalt test, the Sprague sensor reported a mean absolute error of 0.8° C and the Boschung and Point Six reported mean absolute errors less than 1.9° C.
Test 1-1b: 0° C For both the concrete and asphalt portions of the test, the individual baseline temperatures were constant, ranging between 0.0 and 0.5° C. The Aanderaa, Boschung, Lufft, SSI, Vaisala and Control Products sensors reported mean absolute errors less than 0.5° C. The Sprague sensor had significant temperature variation on this constant temperature test, reporting a 1.2 and 3.0° C variation on the concrete and asphalt tests respectively. The following graph is a sample.
Comparison Between Baseline and Sprague
Test 1-1b: Asphalt
-2.00
-1.50
-1.00
-0.50
0.00
0.50
1.00
1.50
2.00
15:36 15:43 15:50 15:57 16:04 16:12
Time (Hour:Min)
Te
mp
era
ture
(C
)
Baseline
Sprague

Laboratory and Field Studies of Pavement 46 Final Report
Temperature Sensors
Test 1-1c: -6° C For both the concrete and asphalt portions of the test, the individual baseline temperatures were constant, ranging between -4.5 and -6.7° C. The wide range of baseline temperatures indicated that the pavement test sections may not have been given enough time to fully acclimate to the test temperature before the data was collected. Despite this wide variation, the Lufft, Vaisala, Point Six and Boschung reported mean absolute errors less than 0.3° C. The Control Products, SSI and Aanderaa sensors reported mean absolute errors less than 0.6, 0.8 and 1.3° C, respectively. The Sprague reported mean absolute errors of 0.5 and 1.5° C on the concrete and asphalt tests respectively. Test 1-1d: -17° C For both the concrete and asphalt portions of the test, the individual baseline temperatures were constant, ranging between -16.9 and -17.6° C. The Aanderaa, Boschung, Point Six and Vaisala reported mean absolute errors less than 0.3° C. It should be noted that the Point Six had six bad data points on the concrete test that were eliminated from the analysis. The Lufft and SSI reported mean absolute errors were less than 0.8° C. The Control Products sensor reported mean absolute errors of 1.2 and 0.3° C on the asphalt and concrete tests respectively. The Sprague reported a mean absolute error of 0.3° C on the concrete test. On the asphalt test the Sprague reported a wide variation in temperatures with values ranging from -16.0 to -19.5° C as shown in the following graphs.
Comparison Between Baseline and Sprague
Test 1-1d: Fixed Temperature on Concrete
-20.00
-19.50
-19.00
-18.50
-18.00
-17.50
-17.00
-16.50
-16.00
-15.50
-15.00
14:16 14:24 14:31 14:38 14:45
Time (Hour:Min)
Te
mp
era
ture
(C
)
Baseline
Sprague
Comparison Between Baseline and Sprague
Test 1-1d: Fixed Temperature on Asphalt
-20.00
-19.50
-19.00
-18.50
-18.00
-17.50
-17.00
-16.50
-16.00
-15.50
-15.00
14:16 14:24 14:31 14:38 14:45
Time (Hour:Min)
Te
mp
era
ture
(C
)
Baseline
Sprague
4.2.2 Variable Temperature Tests During the variable temperature tests, most of the sensors reported mean absolute errors less than 1.5° C. The average error was 0.9° C. During both asphalt tests, there was a data collection error in which the data captured from both mobile sensors (Control Products & Sprague) was the air tempera-ture instead of the pavement temperature. The asphalt mobile sensor data was omitted from analysis.
Test 1-2 Results
0.00
1.00
2.00
3.00
4.00
5.00
A B C D E F G H
Sensor
Me
an
Ab
so
lute
Err
or
(C)
Test 1-2A Asphalt
Test 1-2A Concrete
Test 1-2B Asphalt
Test 1-2B Concrete
Laboratory and Field Studies of Pavement 47 Final Report
Temperature Sensors
Test 1-2a: Declining Temperature For both the concrete and asphalt portions of the test, the baseline temperatures smoothly transitioned from 16 to -17° C. The Lufft, Point Six and Vaisala sensors all reported mean absolute errors of 0.5° C or less. The Control Products and Sprague sensors reported mean absolute errors less than 1.0° C during the concrete test. The SSI and Boschung errors were less than 1.3° C. The Aanderaa reported mean absolute errors of 1.7 and 4.8° C on the asphalt and concrete tests respectively. The following graphs are examples of typical sensor performance (left) and Aanderaa performance (right) on concrete. Because the baseline and sensor data for the graph on the right are so close, it is evident that the Vaisala sensor was very responsive to the changing temperature. In contrast, the graph on the right shows that the Aanderaa sensor was slower to respond to the temperature change. This discrepancy is caused by the placement of the Aanderaa sensor’s temperature sensing element. Because the sensing element is deeper in the pavement section, it does not respond as quickly to temperature change. Because the primary measure for sensor performance is the difference between subject sensors and baseline sensors attached to the surface of the pavement, these sensors appear to be in error during sudden changes in temperature. It is evident from the data at the end of the testing period that after the pavement section has stabilized the Aanderaa sensor reaches the stable temperature. Thus, while the Aanderaa sensor is accurate, the test simply shows that it does not respond as quickly as other sensors.
Comparison Between Baseline and Vaisala
Test 1-2a: Concrete
-20.00
-15.00
-10.00
-5.00
0.00
5.00
10.00
15.00
20.00
14:24 19:12 0:00 4:48 9:36 14:24
Time (Hour:Min)
Te
mp
era
ture
(C
)
Baseline
Vaisala
Comparison Between Baseline and Aanderaa
Test 1-2a: Concrete
-20.00
-15.00
-10.00
-5.00
0.00
5.00
10.00
15.00
20.00
14:24 19:12 0:00 4:48 9:36 14:24
Time (Hour:Min)
Te
mp
era
ture
(C
)
Baseline
Aanderaa
Test 1-2b: Increasing Temperature For both the concrete and asphalt portions of the test, the baseline temperatures smoothly transitioned from -17 to 15° C. The Lufft and SSI reported mean absolute errors less than 0.6° C. The Control Products and Sprague sensors both reported mean absolute errors of 0.7° C during the concrete test. The Boschung, Point Six and Vaisala reported mean absolute errors less than 1.5° C. The Aanderaa reported mean absolute errors of 1.5 and 2.9° C on the asphalt and concrete tests respectively.

Laboratory and Field Studies of Pavement 48 Final Report
Temperature Sensors
4.2.3 Mobile Sensor Acclimation Time
This test measured the time required for the mobile sensors to stabilize at a reading when moved from a warm to a cold environment. Acclimation time tests were conducted at four different temperatures (-17, -7, 0 and 6° C). The approximate average acclimation times for the Control Products sensor were 2.5 and 20 minutes to achieve accuracy within 5 and 1° C respectively. The Sprague sensor consistently reported significantly longer acclimation times than the Control Products sensor, approximately 19 minutes longer to achieve accuracy within 1 and 5° C. Also, as might be expected, the greater the initial temperature contrast between the pavement and sensor, the greater the acclimation time. The graphs below present sample data and Table 6 presents the test data.
Test 1-3: Acclimation Times
0
10
20
30
40
50
60
70
80
90
100
10°
C
5°
C
1°
C
10°
C
5°
C
1°
C
10°
C
5°
C
1°
C
10°
C
5°
C
1°
C
1-3a: Pavement 6° C 1-3b: Pavement 0° C 1-3c: Pavement -7° C 1-3d: Pavement -17° C
Test
Tim
e (
Min
ute
s)
Sprague (Concrete)
Sprague (Asphalt)
Control Products (Concrete)
Control Products (Asphalt)
Test 1-3a: Time to Acclimate With Pavement at 6° C During both the concrete and asphalt tests, the pavement test sections were a constant 5.6° C. The Control Products sensor responded the quickest to the temperature change, providing accuracy within 1.0° C after only 12 minutes of acclimation. The Sprague sensor took 26 minutes to respond to the same level of accuracy.
Test 1-3b: Time to Acclimate With Pavement at 0° C The pavement test sections were a constant 0.1° C during both the concrete and asphalt tests. The Control Products sensor again responded the quickest to the temperature change, providing accuracy within 1.0° C of its final temperature after only six minutes of acclimation. The Sprague sensor took 32 minutes to respond to the same level of accuracy.

Laboratory and Field Studies of Pavement 49 Final Report
Temperature Sensors
Concrete
TEST NO.
10° C 5° C 1° C 10° C 5° C 1° C 10° C 5° C 1° C 10° C 5° C 1° C
Sprague 2 12 26 2 14 28 2 16 44 2 28 62
Control Products 2 2 8 2 2 6 2 2 4 2 2 92
Asphalt
TEST NO.
10° C 5° C 1° C 10° C 5° C 1° C 10° C 5° C 1° C 10° C 5° C 1° C
Sprague 14 18 26 16 20 32 18 28 40 26 34 300
Control Products 2 2 12 2 2 2 2 2 2 2 6 80
TEST NO.
Asphalt Concrete Asphalt Concrete Asphalt Concrete Asphalt Concrete
Sprague 1.76 1.01 2.30 1.18 2.35 1.44 3.55 1.66
Control Products 0.40 0.37 0.43 0.47 0.80 0.57 1.15 0.86
*Test Summary values are calculated using the data from the entire test duration (3-5 hours)
Minutes to report accuracy within:
Minutes to report accuracy within:
1-3a: Pavement 6° C 1-3b: Pavement 0° C 1-3c: Pavement -7° C 1-3d: Pavement -17° C
Table 6: Mobile Sensor Acclimation Time Summary
1-3a: Pavement 6° C 1-3b: Pavement 0° C 1-3c: Pavement -7° C 1-3d: Pavement -17° C
Pavement 6° C Pavement 0° C Pavement -7° C Pavement -17° C
Test Summary: Mean Absolute Error Values
1-3a 1-3b 1-3c 1-3d

Laboratory and Field Studies of Pavement 50 Final Report
Temperature Sensors
Test 1-3c: Time to Acclimate With Pavement at -7° C During the concrete and asphalt tests, the pavement test sections were a constant -7.1 and -6.3° C respectively. The Control Products sensor responded the quickest to the temperature change, providing accuracy within 1.0° C of its final temperature after only four minutes of acclimation. The Sprague sensor took 44 minutes to respond to the same level of accuracy.
Test 1-3d: Time to Acclimate With Pavement at -17° C During the concrete and asphalt tests, the pavement test sections were a constant -17.5 and -17.1° C, respectively. The times required to acclimate to within 1.0° C were significantly longer for this test, presumably due to the colder temperature. The Control Products sensor acclimated the quickest to 5.0° C accuracy within six minutes and then to within 1.0° C accuracy after an average of 86 minutes. The Sprague sensor over concrete acclimated to within 5.0 and 1.0° C accuracy after 34 and 62 minutes. During the five-hour asphalt test, the Sprague sensor never reached accuracy within 1.0° C.
Comparison Between Baseline and Control Products
Test 1-3d: Asphalt
-20.00
-15.00
-10.00
-5.00
0.00
5.00
10.00
15.00
20.00
25.00
30.00
18:21 18:36 18:50 19:04
Time (Hour:Min)
Te
mp
era
ture
(C
)
Baseline
Control Products
Comparison Between Baseline and Sprague
Test 1-3d: Asphalt
-20.00
-15.00
-10.00
-5.00
0.00
5.00
10.00
15.00
20.00
25.00
30.00
18:21 18:36 18:50 19:04
Time (Hour:Min)
Te
mp
era
ture
(C
)
Baseline
Sprague
4.2.4 Varied Mobile Sensor Height
This test was conducted with the mobile sensors mounted at varying heights. Table 7 presents the summarized results. Overall, the Control Products sensor provided the most accurate, consistent and precise data with an average mean absolute error of 0.31° C, while the Sprague reported 0.72° C. The average error for sensors over asphalt was 0.71° C while the average error over concrete was 0.32° C. The Sprague sensor produced highly variable raw data and often ranged up to 1.5° C per test. A standard deviation test was performed to confirm this; the Sprague sensor reported a standard deviation five times higher than the Control Products (0.10 compared to 0.52). It is necessary to note that some of the Sprague’s variability is due to its 0.55° C data resolution (the Control Products sensor has data resolution of 0.1° C). While the Sprague sensor reported high variability in its raw data, averaging the raw data yielded significantly more accurate results, often within 0.5° C of its baseline sensor. Across all temperatures, mounting heights and pavement types, the Sprague sensor had an average error of 0.72° C. The following graphs provide a comparison of the Control Products temperature (left) and the Sprague variability (right).
Laboratory and Field Studies of Pavement 51 Final Report
Temperature Sensors
Table 7: Varied Mobile Sensor Height Summary
Asphalt Concrete Asphalt Concrete Asphalt Concrete Asphalt Concrete
Sprague 0.73 0.46 0.72 0.35 0.61 0.30 0.79 0.47 0.55
Control Products 0.12 0.15 0.12 0.16 0.12 0.07 0.06 0.15 0.12
Sprague 1.27 0.41 0.86 0.29 1.02 0.32 1.13 0.34 0.71
Control Products 0.06 0.14 0.08 0.15 0.11 0.06 0.08 0.09 0.10
Sprague 0.81 0.41 0.90 0.23 0.84 0.29 1.53 0.46 0.68
Control Products 0.37 0.14 0.37 0.10 0.46 0.19 0.55 0.30 0.31
Sprague 1.44 0.22 1.37 0.59 1.71 0.33 1.56 0.31 0.94
Control Products 1.27 0.43 0.56 0.56 0.55 1.53 0.54 0.32 0.72
Summary Sprague 1.06 0.38 0.96 0.37 1.05 0.31 1.25 0.40 0.72 N/A
Control Products 0.46 0.22 0.28 0.24 0.31 0.46 0.31 0.22 0.31 N/A
Both Sensors 0.76 0.30 0.62 0.30 0.68 0.39 0.78 0.31 N/A 0.52
6° C
0° C
-5° C
-17° C
Temperature Sensor
Average
of Both
Sensors
Average
By
Sensor
0.34
0.40
0.50
0.83
Mounting Height
1 foot 2 feet 3 feet 4 feet
* Values in table are mean absolute differences between sensor and baseline temperature in degrees Celsius.
* Average of standard deviations of baseline/sensor difference for Control Products sensors were 0.07° C and 0.13° C for asphalt and concrete respectively.
* Average of standard deviations of baseline/sensor difference for Sprague sensors were 0.71° C and 0.33° C for asphalt and concrete respectively.
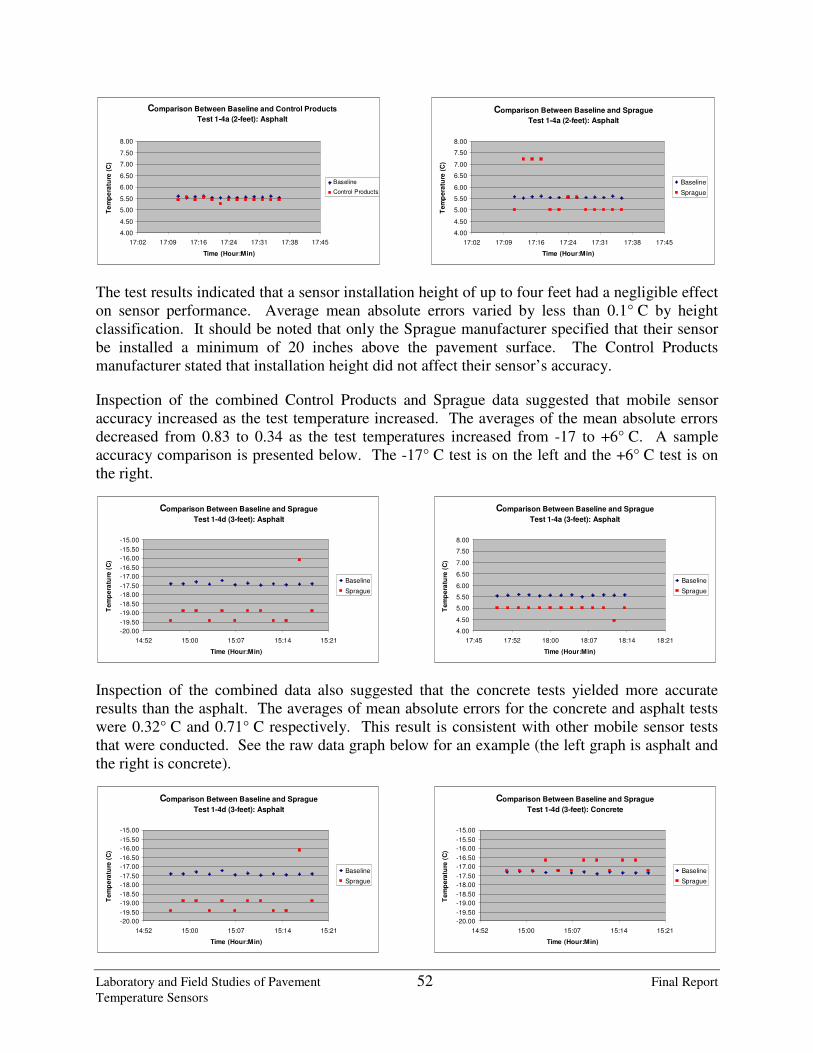
Laboratory and Field Studies of Pavement 52 Final Report
Temperature Sensors
Comparison Between Baseline and Control Products
Test 1-4a (2-feet): Asphalt
4.00
4.50
5.00
5.50
6.00
6.50
7.00
7.50
8.00
17:02 17:09 17:16 17:24 17:31 17:38 17:45
Time (Hour:Min)
Te
mp
era
ture
(C
)
Baseline
Control Products
Comparison Between Baseline and Sprague
Test 1-4a (2-feet): Asphalt
4.00
4.50
5.00
5.50
6.00
6.50
7.00
7.50
8.00
17:02 17:09 17:16 17:24 17:31 17:38 17:45
Time (Hour:Min)
Te
mp
era
ture
(C
)
Baseline
Sprague
The test results indicated that a sensor installation height of up to four feet had a negligible effect on sensor performance. Average mean absolute errors varied by less than 0.1° C by height classification. It should be noted that only the Sprague manufacturer specified that their sensor be installed a minimum of 20 inches above the pavement surface. The Control Products manufacturer stated that installation height did not affect their sensor’s accuracy. Inspection of the combined Control Products and Sprague data suggested that mobile sensor accuracy increased as the test temperature increased. The averages of the mean absolute errors decreased from 0.83 to 0.34 as the test temperatures increased from -17 to +6° C. A sample accuracy comparison is presented below. The -17° C test is on the left and the +6° C test is on the right.
Comparison Between Baseline and Sprague
Test 1-4d (3-feet): Asphalt
-20.00
-19.50
-19.00
-18.50
-18.00
-17.50
-17.00
-16.50
-16.00
-15.50
-15.00
14:52 15:00 15:07 15:14 15:21
Time (Hour:Min)
Te
mp
era
ture
(C
)
Baseline
Sprague
Comparison Between Baseline and Sprague
Test 1-4a (3-feet): Asphalt
4.00
4.50
5.00
5.50
6.00
6.50
7.00
7.50
8.00
17:45 17:52 18:00 18:07 18:14 18:21
Time (Hour:Min)
Te
mp
era
ture
(C
)
Baseline
Sprague
Inspection of the combined data also suggested that the concrete tests yielded more accurate results than the asphalt. The averages of mean absolute errors for the concrete and asphalt tests were 0.32° C and 0.71° C respectively. This result is consistent with other mobile sensor tests that were conducted. See the raw data graph below for an example (the left graph is asphalt and the right is concrete).
Comparison Between Baseline and Sprague
Test 1-4d (3-feet): Asphalt
-20.00
-19.50
-19.00
-18.50
-18.00
-17.50
-17.00
-16.50
-16.00
-15.50
-15.00
14:52 15:00 15:07 15:14 15:21
Time (Hour:Min)
Te
mp
era
ture
(C
)
Baseline
Sprague
Comparison Between Baseline and Sprague
Test 1-4d (3-feet): Concrete
-20.00
-19.50
-19.00
-18.50
-18.00
-17.50
-17.00
-16.50
-16.00
-15.50
-15.00
14:52 15:00 15:07 15:14 15:21
Time (Hour:Min)
Te
mp
era
ture
(C
)
Baseline
Sprague

Laboratory and Field Studies of Pavement 53 Final Report
Temperature Sensors
Test 1-4a: Varied Mobile Sensor Height at 6° C All tests were performed at a constant 5.6° C. For each test, the Control Products sensor displayed linear and consistent data. The Control Products sensor reported an average mean absolute error of 0.1° C. The Sprague data was significantly more sporadic, often showing a 1.0 or 1.5° C range of values. Averaging the sporadic raw data yielded more accurate results, averaging only 0.32° C of mean error per test.
Test 1-4b: Varied Mobile Sensor Height at 0° C All tests were performed at constant temperatures between 0.0 and 0.4° C. The Control Products sensor performed consistently with an average mean absolute error of 0.1° C. The Sprague sensor performed sporadically during the asphalt testing (3.0° C range of values) and less so during the concrete tests (1.0° C range of values). Averaging the sporadic raw data yielded average mean errors of less than 0.5° C.
Test 1-4c: Varied Mobile Sensor Height at -5° C The asphalt tests were performed between -5.3 and -5.6° C, and the concrete tests were performed between -5.9 and -6.1° C. The Control Products sensor performed consistently with an average mean absolute error of 0.3° C. The Sprague sensor showed sporadic temperature variations of around 1.0° C for each test. Again, averaging the sporadic raw data yielded average mean errors of approximately 0.6° C.
Test 1-4d: Varied Mobile Sensor Height at -17° C All tests were performed at constant temperatures between -17.2 and -17.5° C. The Control Products sensor performed consistently with an average mean absolute error of 0.7° C. The Sprague sensor performed significantly better on the concrete than on the asphalt tests. During the concrete tests, individual data points generally had a 0.5° C range, with average errors less than 0.6° C. During the concrete tests, individual data points generally had a 1.0° C range, with average errors of less than 1.5° C.
4.2.5 Cold Day With and Without Direct Solar Impact
Without direct solar impact (Test 1-5a), the average mean absolute error was 0.3° C. However, with direct solar impact (Test 1-5b), results varied with several sensors reporting errors greater than 1.0° C. The average mean absolute error for Test 1-5b was 1.6° C. Apparently, each sensor reacted differently to direct solar exposure of Test 1-5b. Since the sensors had significantly lower errors without solar impact (Test 1-5a) and in Test 1-2b (increasing temperature test), the direct solar heating of the pavement surface is likely the cause of the varied readings. Both the precise depth of each sensor’s temperature “sensing element” and an uneven distribution of heat from the lamp could have caused the varied results from this test. The key finding from this test is that the addition of a heat source makes the baseline surface temperature deviate from the sensor’s measured temperature more than if there was no additional heat source.

Laboratory and Field Studies of Pavement 54 Final Report
Temperature Sensors
Test 1-5 Results
0.00
0.50
1.00
1.50
2.00
2.50
3.00
3.50
4.00
A B C D E F G H
Sensor
Mean
Ab
so
lute
Err
or
(C)
Test 1-5A Asphalt
Test 1-5A Concrete
Test 1-5B Asphalt
Test 1-5B Concrete
Test 1-5a: Without Direct Solar Impact The tests were performed at constant temperatures between -6.7° and -7.5° C. Except for the Sprague sensor during the asphalt test, all of the sensors performed within 0.6° C of their respective baseline sensors. During the asphalt test, the Sprague’s raw data had a wide variation, ranging from -8.5 to -5.0° C. Sprague’s mean absolute error was 1.1° C for the asphalt test. When directly averaged however, the Sprague data showed a 0.6° C error. The Vaisala sensor only reported three readings during the 25-minute test period.
Test 1-5b: With Direct Solar Impact Pavement temperatures (baseline readings) increased from -7.0° to around 0.0° C during the test. It would appear that the pavement was not evenly heated by the “solar source” due to a wide variation in the final baseline temperatures, which were between -3° and +3° C. Furthermore, the wide variation in subject sensor performance would suggest that the subject sensors were impacted unevenly and/or responded to the solar impact differently. The following graphs illustrate the variation in baseline and subject sensor readings.
Comparison Between Baseline and Vaisala
Test 1-5b: Asphalt
-7.00
-5.00
-3.00
-1.00
1.00
3.00
5.00
12:57 14:09 15:21 16:33 17:45 18:57
Time (Hour:Min)
Te
mp
era
ture
(C
)
Baseline
Vaisala
Comparison Between Baseline and Vaisala
Test 1-5b: Concrete
-7.00
-5.00
-3.00
-1.00
1.00
3.00
5.00
12:57 14:09 15:21 16:33 17:45 18:57
Time (Hour:Min)
Te
mp
era
ture
(C
)
Baseline
Vaisala

Laboratory and Field Studies of Pavement 55 Final Report
Temperature Sensors
The Lufft and Boschung sensors most closely followed their respective baselines with mean absolute errors less than 1.0° C. The SSI and Point Six sensors reported mean absolute errors less than 2.1° C. The Vaisala reported mean absolute errors of 3.4 and 1.2° C on the asphalt and concrete tests respectively. The Aanderaa reported mean absolute errors less than 3.4° C. The Control Products sensor reported a mean absolute error of 0.6° C on the concrete test and a 2.8° C mean absolute error on the asphalt test. On asphalt, the Sprague sensor had a mean error of 1.15° C. However, the Sprague had a malfunction during the concrete test, reporting a constant reading of 21.1° C (70° F). The cause of the Sprague malfunction is unknown, but it is possible that the sensor was erroneously reporting the ambient temperature from hours earlier; the 21° C reading corresponds to the temperature at which the sensor was stored at prior to the testing. The following graphs show Sprague data on asphalt and concrete.
Comparison Between Baseline and Sprague
Test 1-5b: Asphalt
-7.00
-5.00
-3.00
-1.00
1.00
3.00
5.00
12:57 14:09 15:21 16:33 17:45 18:57
Time (Hour:Min)
Te
mp
era
ture
(C
)
Baseline
Sprague
Comparison Between Baseline and Sprague
Test 1-5b: Concrete
-7.00-5.00-3.00-1.001.003.005.007.009.00
11.0013.0015.0017.0019.0021.0023.00
12:57 14:09 15:21 16:33 17:45 18:57
Time (Hour:Min)
Te
mp
era
ture
(C
)
Baseline
Sprague
Solar radiation is difficult to reproduce in a laboratory environment. One of the factors that led to the relatively greater errors found in this test might be uneven heating by the lamps. In field deployments, the sun heats sensors and the pavement that surrounds them far more evenly. In the laboratory, the lamps were mounted asymmetrically over the pavement slabs. Even a small difference in distance between the lamp and sensor and the lamp and baseline could affect the temperature. Also, the way the light or heat reflected off the surface of the pavement is likely to have affected temperature inconsistencies in this test. Also, this test compared the pavement sensors during a warming period. Initially, the subject sensors and baselines were at the same temperature and were warmed. The temperatures generally immediately diverged as either the baseline or subject sensor reported a warmer condition. The test was not run long enough to see whether the baseline and pavement sensor temperatures would converge when the temperatures in the pavement sections had reached temperature equilibrium.
4.2.6 Test 1-6: Warm Pavement With Snowfall This test was conducted to determine the effects of the situation where recently fallen snow melts when it contacts the pavement. The initial stabilized pavement temperature was 4.6° C. After the application of snow, the pavement underwent a rapid temperature drop, and the pavement stabilized at 0° C. The baseline sensors reported the duration of this 4.6° C temperature drop to be less than two minutes.

Laboratory and Field Studies of Pavement 56 Final Report
Temperature Sensors
Test 1-6 Results
0.00
0.20
0.40
0.60
0.80
1.00
1.20
1.40
1.60
A B C D E F G H
Sensor
Mean
Ab
so
lute
Err
or
(C)
Asphalt
Concrete
The Lufft and SSI sensors reported the temperature drop in less than four minutes and reported mean absolute errors less than 0.6° C. The following graph notes the quick response time of the Lufft sensor.
Comparison Between Baseline and Lufft
Test 1-6: Concrete
-2.00
-1.00
0.00
1.00
2.00
3.00
4.00
5.00
6.00
7.00
20:20 20:30 20:40 20:50 21:00 21:10 21:20 21:30
Time (Hour:Min)
Tem
pera
ture
(C
)
Baseline
Lufft
The Boschung, Vaisala and Control Products sensors also responded to the temperature drop in less than four minutes and reported mean absolute errors of less than 0.9° C. The Sprague sensor responded to the temperature drop in less than four minutes and had mean absolute errors of 0.4 and 1.0 for the concrete and asphalt tests respectively. The Aanderaa took almost 30 minutes to report within 1.0° C of the final temperature and had a mean absolute error less than 1.4° C. Aanderaa’s longer acclimation time is shown in the following graph.
Comparison Between Baseline and Aanderaa
Test 1-6: Concrete
-2.00
-1.00
0.00
1.00
2.00
3.00
4.00
5.00
6.00
7.00
20:20 20:30 20:40 20:50 21:00 21:10 21:20 21:30
Time (Hour:Min)
Tem
pera
ture
(C
)
Baseline
Aanderaa

Laboratory and Field Studies of Pavement 57 Final Report
Temperature Sensors
The Point Six sensor fully responded to the temperature drop after 20 minutes, but the final temperature was almost 1.0° C below the baseline on the asphalt test. Point Six’s mean absolute errors were less than 0.8° C.
4.2.7 Test 1-7: Cold Pavement With Rainfall
For the cold pavement with rainfall test, the initial pavement temperature was a steady -7.2° C. During the rainfall event (approximately 60 minutes in duration), the baseline temperatures rose 3° or 4° C and varied erratically between the initial -7.2° and 0.0° C. The erratic readings were due to the simulated rainfall event where the water (being warmer than the pavement) was incrementally sprayed onto the pavement. Because the baseline sensors were affixed to the pavement surface, they responded to the incremental spraying. The warmer water would contact the pavement (and sensor) then cool to the pavement temperature each time that the pavement was sprayed with water. After the rain event, the baseline temperatures dropped approximately 2° C and then stabilized at -5.5° C.
Test 1-7 Results
0.00
0.50
1.00
1.50
2.00
2.50
A B C D E F G H
Sensor
Mean
Ab
so
lute
Err
or
(C)
Asphalt
Concrete
During this test, the Aanderaa, Boschung, Lufft and Control Products sensors reported mean absolute errors of 1.0° C or less. The Point Six, SSI and Vaisala reported mean absolute errors of 1.4° C or less. It should be noted that data for the Point Six and Aanderaa did not show the erratic variation that the baseline sensors did during the rain event. In this case, the Point Six and Aanderaa actually provided more consistent pavement temperature data during the rain event than the baseline sensors did. A graphical comparison is presented below; on the left, the baseline and subject sensor report temperature variations as the rain contacts the pavement during the rain event are shown. On the right, the subject senor does not report the same temperature variations as the baseline.

Laboratory and Field Studies of Pavement 58 Final Report
Temperature Sensors
Comparison Between Baseline and Boschung
Test 1-7: Asphalt
-10.00
-9.00
-8.00
-7.00
-6.00
-5.00
-4.00
-3.00
-2.00
-1.00
0.00
1.00
2.00
11:30 12:00 12:30 13:00 13:30 14:00 14:30
Time (Hour:Min)
Tem
pera
ture
(C
)
Baseline
Boschung
Comparison Between Baseline and Aanderaa
Test 1-7: Asphalt
-10.00
-9.00
-8.00
-7.00
-6.00
-5.00
-4.00
-3.00
-2.00
-1.00
0.00
1.00
2.00
11:30 12:00 12:30 13:00 13:30 14:00 14:30
Time (Hour:Min)
Te
mp
era
ture
(C
)
Baseline
Aanderaa
The Sprague sensor reported erratic and widely ranging data throughout the asphalt segment of the test. Averaging the erratic asphalt data resulted in a mean error of 1.7° C. During the concrete portion of the test, the Sprague sensor failed and reported a steady value of 21.1° C. See below for graphs of the Sprague sensor.
Comparison Between Baseline and Sprague
Test 1-7: Asphalt
-10.00-9.00-8.00
-7.00-6.00-5.00-4.00
-3.00-2.00-1.000.00
1.002.00
11:30 12:00 12:30 13:00 13:30 14:00 14:30
Time (Hour:Min)
Te
mp
era
ture
(C
)
Baseline
Sprague
Comparison Between Baseline and Sprague
Test 1-7: Concrete
-10.00
-5.00
0.00
5.00
10.00
15.00
20.00
25.00
11:30 12:00 12:30 13:00 13:30 14:00 14:30
Time (Hour:Min)
Te
mp
era
ture
(C
)
Baseline
Sprague
4.2.8 Test 1-8: Iced Pavement With Rainfall
For the iced pavement with rainfall test, the initial pavement temperature was a steady -7.0° C. During the rainfall event (approximately 60 minutes in duration), the baseline temperatures rose 3° or 4° C and varied erratically between the initial -7.0° and 1.0° C. Again, the erratic variation was due to the simulated rainfall application. After the rain event, the baseline temperatures dropped to 2° C and then stabilized between -6.5° and -7.0° C as ice formed on the pavement.
Test 1-8 Results
0.00
0.50
1.00
1.50
2.00
2.50
A B C D E F G H
Sensor
Mean
Ab
so
lute
Err
or
(C)
Asphalt
Concrete

Laboratory and Field Studies of Pavement 59 Final Report
Temperature Sensors
The results from this test were very similar to the results from the previous test (Test 1-7 Cold Pavement with Rainfall). The Aanderaa, Boschung, Lufft and Control Products followed their baseline sensors with mean absolute errors less than 0.7° C. The Point Six, SSI and Vaisala reported mean absolute errors less than 1.1° C. The Point Six and Aanderaa sensors lacked the erratic variation of the other sensors during the rain event which was probably because their temperature sensing elements are further below the surface.
Comparison Between Baseline and Sprague
Test 1-8: Asphalt
-9.00
-8.00
-7.00
-6.00
-5.00
-4.00
-3.00
-2.00
-1.00
0.00
1.00
23:00 23:30 0:00 0:30 1:00 1:30
Time (Hour:Min)
Te
mp
era
ture
(C
)
Baseline
Sprague
4.2.9 Test 1-9: Compacted Snow (Melting)
For the compacted snow test, the initial pavement temperature was 0.3° C. When the snow was applied, the pavement temperature dropped to around -1.0° C and then slowly rose over the next 10 to 20 minutes, steadying at 0.0° C. After the snow finally melted, the pavement temperature rapidly increased 5° to 10° C during the next 45 minutes. After the 45-minute rapid rise, the rate of temperature increase slowed until the test was ended. At the conclusion of the test, the baseline sensors reported temperatures between 10 and 14° C.
Test 1-9 Results
0.00
0.50
1.00
1.50
2.00
A B C D E F G H
Sensor
Mean
Ab
so
lute
Err
or
(C)
Asphalt
Concrete
During this test, the Boschung, Lufft and SSI reported mean absolute errors less than 0.9° C. The Aanderaa and Point Six sensors reported mean absolute errors of 1.2° C or less. The mobile sensors, Control Products and Sprague, reported mean absolute errors less than 1.8° C.

Laboratory and Field Studies of Pavement 60 Final Report
Temperature Sensors
The Lufft sensor data during the rapid temperature increase was missing for the concrete test. The Point Six reported no data during several portions of the concrete test. The Boschung and SSI sensors had 30- to 60-minute delays in reporting the rapid temperature increase, as shown in the following graph. The Vaisala’s data collection computer malfunctioned during the test and reported no data. Both mobile sensors performed significantly better during the asphalt testing.
Comparison Between Baseline and SSI
Test 1-9: Concrete
-2.00
0.00
2.00
4.00
6.00
8.00
10.00
12.00
14.00
16.00
15:36 18:00 20:24 22:48 1:12 3:36
Time (Hour:Min)
Tem
pera
ture
(C
)
Baseline
SSI
4.2.10 Test 1-10: Frost Depositing
Frost formation on a pavement’s surface greatly affects the temperature of the top of the pavement surface and affects temperature below the surface to a lesser extent. The initial baseline temperatures for this test were between -5.5° and -6.5° C. Approximately 60 minutes after the test begun, frost began to form on the pavement. At that point, the baseline sensors recorded a temperature spike followed by increasing readings.
Test 1-10 Results
0.00
0.20
0.40
0.60
0.80
1.00
1.20
1.40
A B C D E F G H
Sensor
Mean
Ab
so
lute
Err
or
(C)
Asphalt
Concrete
Three hours later the baseline pavement temperatures had risen to approximately -1.0° C, see below for a sample Aanderaa graph (note the baseline temperature spike just before 14:24). It is assumed that the temperature increase during the test was due to the warm water that was placed in the test chamber to facilitate frost formation.

Laboratory and Field Studies of Pavement 61 Final Report
Temperature Sensors
Comparison Between Baseline and Aanderaa
Test 1-10: Asphalt
-7.00
-6.00
-5.00
-4.00
-3.00
-2.00
-1.00
0.00
12:00 13:12 14:24 15:36 16:48 18:00 19:12
Time (Hour:Min)
Tem
pera
ture
(C
)
Baseline
Aanderaa
Initial Frost
Formation
The Lufft, SSI and Vaisala reported mean absolute errors less than 0.4° C. The Aanderaa, Boschung and Control Products sensors had mean absolute errors of 0.8° C or less. The Point Six sensor failed to output usable data for the concrete test and reported a mean error of -1.3° C during the asphalt test. The Sprague sensor reported a mean absolute error of 1.2° C for the asphalt test. The Sprague sensor failed during the concrete tests, displaying a constant 21.1° C for the duration of the test.
4.2.11 Test 1-11: Mobile Sensor Performance in Varying Ambient Temperature
This test was conducted similar to Test 1-3 Mobile Sensor Acclimation Times”. Similar results were yielded. First, the mobile sensors (Sprague and Control Products) were acclimated to an ambient temperature of approximately 18° C while aimed at an ice bath. Next, the sensors were brought into the test chamber where the ambient and target temperatures were 0.0° C. During this transition, the sensors remained aimed at the ice bath in order to isolate the effect that varying ambient air temperature has on mobile sensor performance. Test results are summarized in Table 8.
Table 8: Test 1-11 Summary
Sensor
Mean
Difference (°C)
Mean Absolute
Difference (°C)
Root Mean Square
Difference (°C)
Sprague 3.81 4.68 7.90
Control Products -0.40 0.40 0.77 During the initial room temperature portion of the test, the Sprague sensor, aimed at an ice bath, reported a reading of -1.5° C. When the Sprague was moved into the test chamber, the readings rapidly rose to 13.0° C. After the temperature increase, the reading declined over the following 30 minutes, back down to the baseline of 0.0° C. The sensor characteristics for this test were

Laboratory and Field Studies of Pavement 62 Final Report
Temperature Sensors
similar to those shown in Test 1-3. The Sprague’s mean absolute error was 4.7° C. The Sprague performance is shown below. The Control Products sensor initially reported a temperature drop to -0.5° C and then leveled off to the baseline temperature of zero degrees Celsius, as shown below. These results suggest that the Sprague sensor is more influenced by varying ambient air temperature than the Control Products sensor.
Comparison Between Baseline and Sprague
Test 1-11
-5.00
-3.00
-1.00
1.00
3.00
5.00
7.00
9.00
11.00
13.00
15.00
1:15 1:30 1:45 2:00 2:15 2:30 2:45
Time (Hour:Min)
Te
mp
era
ture
(C
)
Baseline
Sprague
Comparison Between Baseline and Control Products
Test 1-11
-5.00
-3.00
-1.00
1.00
3.00
5.00
7.00
9.00
11.00
13.00
15.00
1:15 1:30 1:45 2:00 2:15 2:30 2:45
Time (Hour:Min)
Te
mp
era
ture
(C
)
Baseline
Control Products
4.3 Detailed Chemical Test Results
This section presents the results from the anti-icing chemical tests conducted in the laboratory. In these tests Sodium Chloride (NaCl) was chosen as the anti-icing chemical. Anti-icing chemicals were applied in accordance with WisDOT Guideline 35.25 (see Appendix C). Table 9 summarizes the results from the NaCl laboratory tests. Table 9: Chemical Test Summary
TEST NO.
Asphalt Concrete Asphalt Concrete Asphalt Concrete Asphalt Concrete Asphalt Concrete
AANDERAA 0.09 0.05 2.14 1.68 1.58 1.06 0.50 0.51 0.67 0.52
BOSCHUNG 0.22 0.18 0.51 0.46 0.28 0.63 0.37 0.26 0.45 0.26
LUFFT 0.10 0.10 0.31 0.37 1.10 0.28 0.60 0.59 N/A N/A
POINT 6 0.18 0.14 1.76 1.17 0.72 0.57 1.08 0.56 1.34 0.74
SSI 0.62 0.43 2.62 1.44 0.44 0.51 0.68 0.77 1.10 0.97
VAISALA N/A N/A 2.15 1.16 0.71 0.60 0.34 0.48 0.38 0.54
SPRAGUE 0.82 N/A 0.71 N/A 0.94 N/A 1.27 N/A 2.02 N/A
CONTROL PRODUCTS 0.30 0.16 2.61 0.20 0.93 1.06 0.54 0.39 0.39 0.38
1. Values in table are Mean Absolute Differences between sensor and baseline temperature in Degrees Celsius
2. N/A represents test data not available. See test result section for more detailed explanation
Test Description:NaCl: Cold Pavement NaCl: Cold Pavement NaCl: Warm Pavement NaCl: Cold Pavement NaCl: Iced Pavement
w/o Solar Impact w/ Solar Impact w/ Snow w/ Rainfall w/ Rainfall
2-42-1a 2-1b 2-2 2-3
4.3.1 Sodium Chloride – Cold Day With and Without Direct Solar Impact
The NaCl solar impact test produced results similar to the solar impact test without NaCl (Test 1-5b); both tests produced widely ranging baseline and subject sensor temperatures. It would appear that each sensor reacted differently to the solar impact simulator and that perhaps the solar simulator was not evenly distributing the solar radiation.

Laboratory and Field Studies of Pavement 63 Final Report
Temperature Sensors
Test 2-1 Results
0.00
0.50
1.00
1.50
2.00
2.50
3.00
A B C D E F G H
Sensor
Mean
Ab
so
lute
Err
or
(C)
Test 2-1a, Asphalt
Test 2-1a, Concrete
Test 2-1b, Asphalt
Test 2-1b, Concrete
Test 2-1a: Without Direct Solar Impact Prior to the start of this test, a NaCl mixture (application rate of 25 gallons per lane mile) was applied to the pavement and mobile sensors. The pavement temperature was constant during the 25-minute test, with individual baselines varying between 6.0° and 7.0° C. The Aanderaa, Boschung, Lufft, Point Six and Control Products sensors reported mean absolute errors of 0.3° C or less. The SSI reported mean absolute errors or 0.6° C or less. The Sprague failed during the concrete test (reported a constant reading of 21.1° C) and reported a 2.5° C range of temperature values during the asphalt test. Sprague’s mean absolute error was 1.2° C for the asphalt test. There was a data collection error in which the Vaisala data was not recorded. The two sample graphs below illustrate typical sensor performance (left) and the Sprague variability (right).
Comparison Between Baseline and Point 6
Test 2-1a: Asphalt
-8.00
-7.50
-7.00
-6.50
-6.00
-5.50
-5.00
0:40 0:45 0:50 0:55 1:00 1:05
Time (Hour:Min)
Te
mp
era
ture
(C
)
Baseline
Point 6
Comparison Between Baseline and Sprague
Test 2-1a: Asphalt
-8.00
-7.50
-7.00
-6.50
-6.00
-5.50
-5.00
0:40 0:45 0:50 0:55 1:00 1:05
Time (Hour:Min)
Te
mp
era
ture
(C
)
Baseline
Sprague
Test 2-1b: With Direct Solar Impact Test 2-1b immediately followed Test 2-1a. At 1:07 the sunlight simulator lights were switched on. Baseline temperatures rapidly rose during the next hour and continued to gradually rise until the end of the test. It should be noted that there was significant temperature variation between

Laboratory and Field Studies of Pavement 64 Final Report
Temperature Sensors
baseline sensors during this test. At the completion of the test, the baseline sensors varied between -4.0° and 4.0° C, see below. This wide variability in baseline readings is consistent with the results found without NaCl application (see Test 1-5b), suggesting that the pavements were not evenly heated by the “solar source.”
Comparison Between Baseline and Lufft
Test 2-1b: Asphalt
-8.00
-6.00
-4.00
-2.00
0.00
2.00
4.00
6.00
1:00 1:30 2:00 2:30 3:00 3:30 4:00 4:30 5:00 5:30
Time (Hour:Min)
Tem
pera
ture
(C
)
Baseline
Lufft
Comparison Between Baseline and Boschung
Test 2-1b: Asphalt
-8.00
-6.00
-4.00
-2.00
0.00
2.00
4.00
6.00
1:00 1:30 2:00 2:30 3:00 3:30 4:00 4:30 5:00 5:30
Time (Hour:Min)
Tem
pera
ture
(C
)
Baseline
Boschung
The Lufft and Boschung sensors followed their baselines, reporting mean absolute errors of 0.5° C or less. The Aanderaa, Point Six, SSI, Vaisala and Control Products also followed their baseline trends, but reported larger temperature errors with mean absolute errors between 1.2 and 2.6° C.
The Aanderaa, Point Six, SSI, Vaisala and Control Products sensors all performed significantly better during the concrete test than during the asphalt test. The averaged mean absolute errors were 1.1° C less during the concrete test. The following sample graphs illustrate this performance difference.
Comparison Between Baseline and Control Products
Test 2-1b: Asphalt
-8.00
-6.00
-4.00
-2.00
0.00
2.00
4.00
6.00
1:00 1:30 2:00 2:30 3:00 3:30 4:00 4:30 5:00 5:30
Time (Hour:Min)
Te
mp
era
ture
(C
)
Baseline
Control Products
Comparison Between Baseline and Control Products
Test 2-1b: Concrete
-8.00
-6.00
-4.00
-2.00
0.00
2.00
4.00
6.00
1:00 1:30 2:00 2:30 3:00 3:30 4:00 4:30 5:00 5:30
Time (Hour:Min)
Te
mp
era
ture
(C
)
Baseline
Control Products
The Sprague failed during the concrete test (reported a constant temperature of 21.1° C) and reported a mean absolute error of 0.7° C during the asphalt test.
4.3.2 Test 2-2: Sodium Chloride – Warm Pavement With Snowfall
For this test, the initial pavement temperatures were between 4.0° and 5.0° C. Within approximately 5 minutes of the snowfall event, the pavement temperatures dropped to a constant 0.0° C.

Laboratory and Field Studies of Pavement 65 Final Report
Temperature Sensors
Test 2-2 Results
0.00
0.20
0.40
0.60
0.80
1.00
1.20
1.40
1.60
1.80
A B C D E F G H
Sensor
Me
an
Ab
so
lute
Err
or
(C)
Asphalt
Concrete
The Boschung, Point Six and SSI sensors reported mean absolute errors of 0.7° C or less and responded to within 1.0° C of their baselines within 10 minutes or less. The Vaisala and Aanderaa sensors took longer to acclimate to their baselines, between 15 and 40 minutes. The Vaisala and Aanderaa reported averaged mean absolute errors of 0.7 and 1.3° C respectively for the asphalt and concrete tests. The variation in sensor acclimation time is show below, approximately 40 minutes on the left and four minutes on the right.
Comparison Between Baseline and Aanderaa
Test 2-2: Asphalt
-3.00
-2.00
-1.00
0.00
1.00
2.00
3.00
4.00
5.00
6.00
7.00
23:30 23:45 0:00 0:15 0:30
Time (Hour:Min)
Tem
pera
ture
(C
)
Baseline
Aanderaa
Comparison Between Baseline and SSI
Test 2-2: Asphalt
-3.00
-2.00
-1.00
0.00
1.00
2.00
3.00
4.00
5.00
6.00
7.00
23:30 23:45 0:00 0:15 0:30
Time (Hour:Min)
Tem
pera
ture
(C
)
Baseline
SSI
The Control Products sensor responded to the temperature drop within 10 minutes and reported mean absolute errors or 0.9 and 1.1° C for the asphalt and concrete test respectively. On the Asphalt test, the Sprague responded to the temperature drop within 10 minutes and reported a mean absolute error of 0.9° C. Averaging Sprague’s raw temperature data yielded results within 0.2° C of its baseline for the asphalt test. The Sprague failed during the concrete test, reporting a constant 21.1° C. The findings from this test are consistent with the findings from the same test without NaCl (see Test 1-6).
4.3.3 Test 2-3: Sodium Chloride – Cold Pavement With Rainfall
The initial pavement temperatures were between -6.0° and -6.5° C. During the approximate 70-minute rain event, baseline temperatures tended to increase several degrees, erratically varied

Laboratory and Field Studies of Pavement 66 Final Report
Temperature Sensors
between -6.0 and -1.0° C. The erratic temperature variations were due to the application of the simulated rain. Following the rain event, the baseline temperatures decreased and then leveled-off around the initial -6.5° C temperature. These test results do not differ significantly from the same test conducted without NaCl (see Test 1-7).
Test 2-3 Results
0.00
0.20
0.40
0.60
0.80
1.00
1.20
1.40
A B C D E F G H
Sensor
Me
an
Ab
so
lute
Err
or
(C)
Asphalt
Concrete
The Aanderaa, Boschung Lufft, Vaisala and Control Products sensors followed the baseline temperatures reporting mean absolute errors less of 0.6° C or less. Additionally, during the rain event, the Aanderaa and Point Six raw data did not have the erratic reading of the base sensor; the sensor data smoothly increased during the rain event. The Point Six and SSI sensors also followed their baselines with mean absolute errors less than 1.1° C. Shown below are examples of the baseline temperature variation during the rain event; note the Point Six has a smoother transition during the rain event.
Comparison Between Baseline and Lufft
Test 2-3: Asphalt
-9.00
-8.00
-7.00
-6.00
-5.00
-4.00
-3.00
-2.00
-1.00
2:00 2:30 3:00 3:30 4:00 4:30
Time (Hour:Min)
Tem
pera
ture
(C
)
Baseline
Lufft
Comparison Between Baseline and Point 6
Test 2-3: Asphalt
-9.00
-8.00
-7.00
-6.00
-5.00
-4.00
-3.00
-2.00
-1.00
2:00 2:30 3:00 3:30 4:00 4:30
Time (Hour:Min)
Tem
pera
ture
(C
)
Baseline
Point 6
During the asphalt test, the Sprague sensor had significant temperature variation (between -5.0 and -9.0° C) and reported a mean absolute error of 1.3° C. The Sprague failed during the concrete test, displaying a constant 21.1° C. Shown below is an illustration of Sprague’s variability.

Laboratory and Field Studies of Pavement 67 Final Report
Temperature Sensors
Comparison Between Baseline and Sprague
Test 2-3: Asphalt
-9.00
-8.00
-7.00
-6.00
-5.00
-4.00
-3.00
-2.00
-1.00
2:00 2:30 3:00 3:30 4:00 4:30
Time (Hour:Min)
Te
mp
era
ture
(C
)
Baseline
Sprague
4.3.4 Test 2-4: Sodium Chloride – Iced Pavement With Rainfall
The initial pavement temperatures were between -5.0 and -6.0° C. During the approximate 70-minute rain event, baseline temperatures tended to increase several degrees, erratically varying between -6 and -1° C. Again the erratic temperature variations were due to the application of the simulated rain. Following the rain event, the baseline temperatures decreased and then leveled-off around the initial -5.5° C temperature. The findings from this test are consistent with the findings from the same test without NaCl (see Test 1-8). The Boschung, Vaisala and Control Products sensors followed their baseline sensors reporting mean absolute errors of 0.5° C or less; see below for a Boschung data graph. The Aanderaa reported mean absolute errors less than 0.7° C. The Point Six and SSI sensors reported mean absolute errors less than 1.4° C.
Test 2-4 Results
0.00
0.50
1.00
1.50
2.00
2.50
A B C D E F G H
Sensor
Me
an
Ab
so
lute
Err
or
(C)
Asphalt
Concrete
The SSI’s temperature decrease seemed to be an hour delayed from its respective baseline sensor during both tests. A raw data graph is shown below. The Lufft sensor’s data was lost because of a data collection error. During the asphalt test, that Sprague data was somewhat erratic, increasing from -11.0° C and then leveling off around -6.5° C; see below for a raw data graph. The mean absolute error for the Sprague during the asphalt test was 2.0° C. During the Concrete test the Sprague failed, reading a constant 21.1° C as shown below.

Laboratory and Field Studies of Pavement 68 Final Report
Temperature Sensors
Comparison Between Baseline and Boschung
Test 2-4: Asphalt
-11.00
-10.00
-9.00
-8.00
-7.00
-6.00
-5.00
-4.00
-3.00
-2.00
-1.00
0.00
22:00 22:30 23:00 23:30 0:00
Time (Hour:Min)
Te
mp
era
ture
(C
)
Baseline
Boschung
Comparison Between Baseline and SSI
Test 2-4: Asphalt
-11.00
-10.00
-9.00
-8.00
-7.00
-6.00
-5.00
-4.00
-3.00
-2.00
-1.00
0.00
22:00 22:30 23:00 23:30 0:00
Time (Hour:Min)
Tem
pera
ture
(C
)
Baseline
SSI
Comparison Between Baseline and Sprague
Test 2-4: Asphalt
-11.00
-10.00
-9.00
-8.00
-7.00
-6.00
-5.00
-4.00
-3.00
-2.00
-1.00
0.00
22:00 22:30 23:00 23:30 0:00
Time (Hour:Min)
Te
mp
era
ture
(C
)
Baseline
Sprague
Comparison Between Baseline and Sprague
Test 2-4: Concrete
-10.00
-5.00
0.00
5.00
10.00
15.00
20.00
25.00
22:00 22:30 23:00 23:30 0:00
Time (Hour:Min)T
em
pe
ratu
re (
C)
Baseline
Sprague
4.4 Detailed Field Test Results
This section presents the results from the field tests conducted at Mn/ROAD. Table 10 summarizes the field test results for the in-pavement sensors. Table 10: Field Test Summary
TEST NO.
Asphalt Concrete Asphalt Concrete Asphalt Concrete Asphalt Concrete
AANDERAA 0.39 1.66 N/A N/A 0.09 0.17 0.44 0.39
BOSCHUNG 0.58 2.05 0.29 0.92 0.76 0.74 0.61 1.01
LUFFT 0.23 1.85 0.10 1.07 0.63 0.87 0.91 1.37
SSI 0.58 1.31 0.50 0.68 0.30 0.74 0.08 0.46
VAISALA 1.49 2.25 0.94 1.37 0.98 0.94 1.09 1.01
TEST NO.
Asphalt Concrete Asphalt Concrete Asphalt Concrete
AANDERAA 0.65 1.27 1.53 1.70 0.56 1.44
BOSCHUNG 0.80 0.49 2.03 1.34 0.35 0.76
LUFFT 0.53 0.37 1.73 1.43 0.40 1.20
SSI 0.37 0.70 2.47 2.51 0.69 1.40
VAISALA 1.28 2.75 1.50 1.59 2.42 0.63
1. Values in table are Mean Absolute Differences between sensor and baseline temperature in Degrees Celsius
2. N/A represents test data not available. See test result section for more detailed explanation
Test Description:Cold Day Cold Day Cold Night Cold Night
w/ Solar Impact w/o Solar Impact w/o Radiation Cooling w/ Radiation Cooling
3-1a 3-1b 3-2a 3-2b
Test Description:Warm Pavement Cold Pavement Iced Pavement
w/ Snowfall w/ Rainfall w/ Rainfall
3-3 3-4 3-5

Laboratory and Field Studies of Pavement 69 Final Report
Temperature Sensors
4.4.1 Field – Cold Day With and Without Direct Solar Impact During both asphalt tests, the subject sensors closely followed their respective baselines. As was expected, the sunny day with solar impact test showed pavement temperatures increasing at a faster rate than during the cloudy day without solar impact. During both concrete tests, the subject sensors generally reported greater temperature increases than their respective baselines. This temperature discrepancy was more pronounced during the test with solar impact.
Test 3-1 Results
0.00
0.50
1.00
1.50
2.00
2.50
A B C E F
Sensor
Me
an
Ab
so
lute
Err
or
(C)
Test 3-1a, Asphalt
Test 3-1a, Concrete
Test 3-1b, Asphalt
Test 3-1b, Concrete
Test 3-1a: With Direct Solar Impact This test was conducted on a sunny morning between 9:00 and 11:50 a.m. The average wind speed was 7.7 miles per hour, and the ambient air temperature increased from -7.1° to -4.2° C during the test period. The asphalt sensors followed their respective baselines, reporting temperature increases from 1.0 to 14.0° C over the test period. The Aanderaa, Boschung, Lufft and SSI reported mean absolute errors less than 0.6° C. The Vaisala reported data every 30 minutes and had a mean absolute error of 1.5° C. The concrete sensors followed the increasing trend of their respective baselines. However, they consistently reported temperatures approximately 2.0° C greater than their baselines. The concrete baselines began the test reporting 0.0° C while the concrete sensors generally reported initial readings of 0.5° C. After the first hour of testing, the subject sensors were reporting temperatures approximately 2.0° C greater than their baselines. At the conclusion of the test, the baselines were reporting approximately 10.0° C while the subject sensors were reporting approximately 12.0° C. See figure below. The sun is a powerful heat source and it warms the pavement sensor from the top surface to the bottom. Thus it has a greater impact on the top of the sensor than the bottom or sides of the sensor. As the sun shines, it heats the top surface and the heat propagates through the pavement sensor. One major factor that affects when the sensor reports a temperature change depends on where the temperature sensing element is located within the sensor. The sensor material
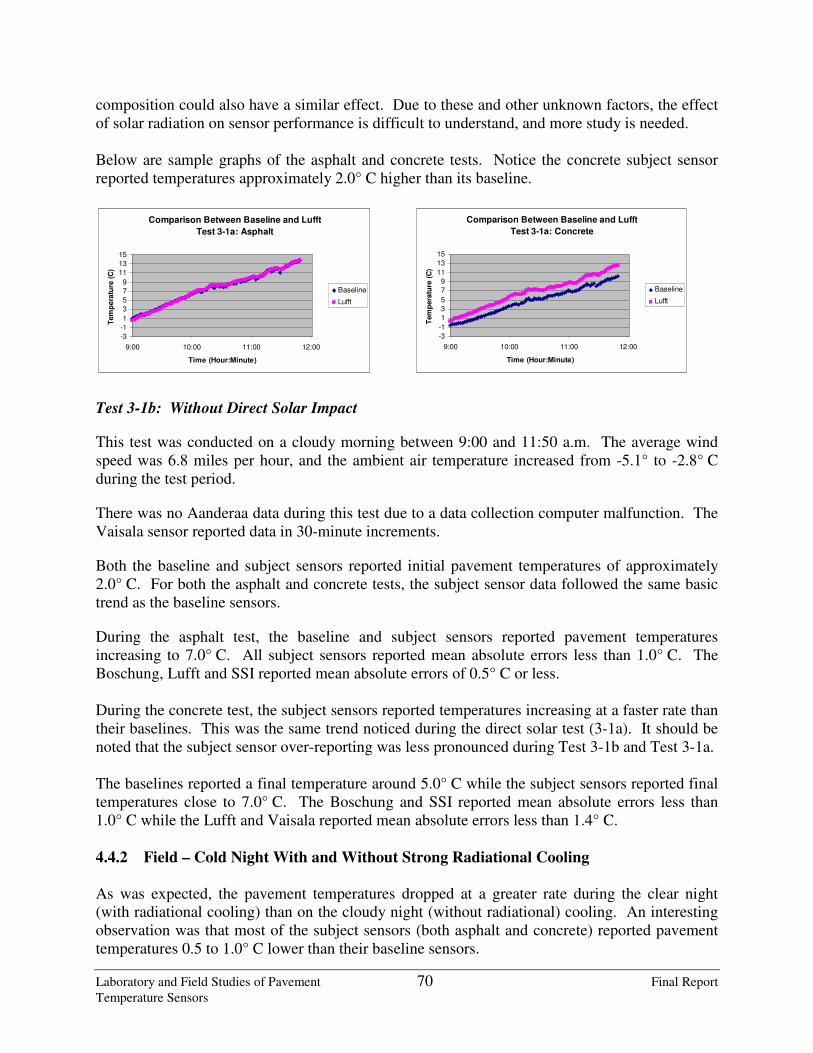
Laboratory and Field Studies of Pavement 70 Final Report
Temperature Sensors
composition could also have a similar effect. Due to these and other unknown factors, the effect of solar radiation on sensor performance is difficult to understand, and more study is needed. Below are sample graphs of the asphalt and concrete tests. Notice the concrete subject sensor reported temperatures approximately 2.0° C higher than its baseline.
Comparison Between Baseline and Lufft
Test 3-1a: Asphalt
-3
-1
1
3
5
7
9
11
13
15
9:00 10:00 11:00 12:00
Time (Hour:Minute)
Tem
pera
ture
(C
)
Baseline
Lufft
Comparison Between Baseline and Lufft
Test 3-1a: Concrete
-3
-1
1
3
5
7
9
11
13
15
9:00 10:00 11:00 12:00
Time (Hour:Minute)
Tem
pera
ture
(C
)
Baseline
Lufft
Test 3-1b: Without Direct Solar Impact This test was conducted on a cloudy morning between 9:00 and 11:50 a.m. The average wind speed was 6.8 miles per hour, and the ambient air temperature increased from -5.1° to -2.8° C during the test period. There was no Aanderaa data during this test due to a data collection computer malfunction. The Vaisala sensor reported data in 30-minute increments. Both the baseline and subject sensors reported initial pavement temperatures of approximately 2.0° C. For both the asphalt and concrete tests, the subject sensor data followed the same basic trend as the baseline sensors. During the asphalt test, the baseline and subject sensors reported pavement temperatures increasing to 7.0° C. All subject sensors reported mean absolute errors less than 1.0° C. The Boschung, Lufft and SSI reported mean absolute errors of 0.5° C or less. During the concrete test, the subject sensors reported temperatures increasing at a faster rate than their baselines. This was the same trend noticed during the direct solar test (3-1a). It should be noted that the subject sensor over-reporting was less pronounced during Test 3-1b and Test 3-1a. The baselines reported a final temperature around 5.0° C while the subject sensors reported final temperatures close to 7.0° C. The Boschung and SSI reported mean absolute errors less than 1.0° C while the Lufft and Vaisala reported mean absolute errors less than 1.4° C.
4.4.2 Field – Cold Night With and Without Strong Radiational Cooling
As was expected, the pavement temperatures dropped at a greater rate during the clear night (with radiational cooling) than on the cloudy night (without radiational) cooling. An interesting observation was that most of the subject sensors (both asphalt and concrete) reported pavement temperatures 0.5 to 1.0° C lower than their baseline sensors.
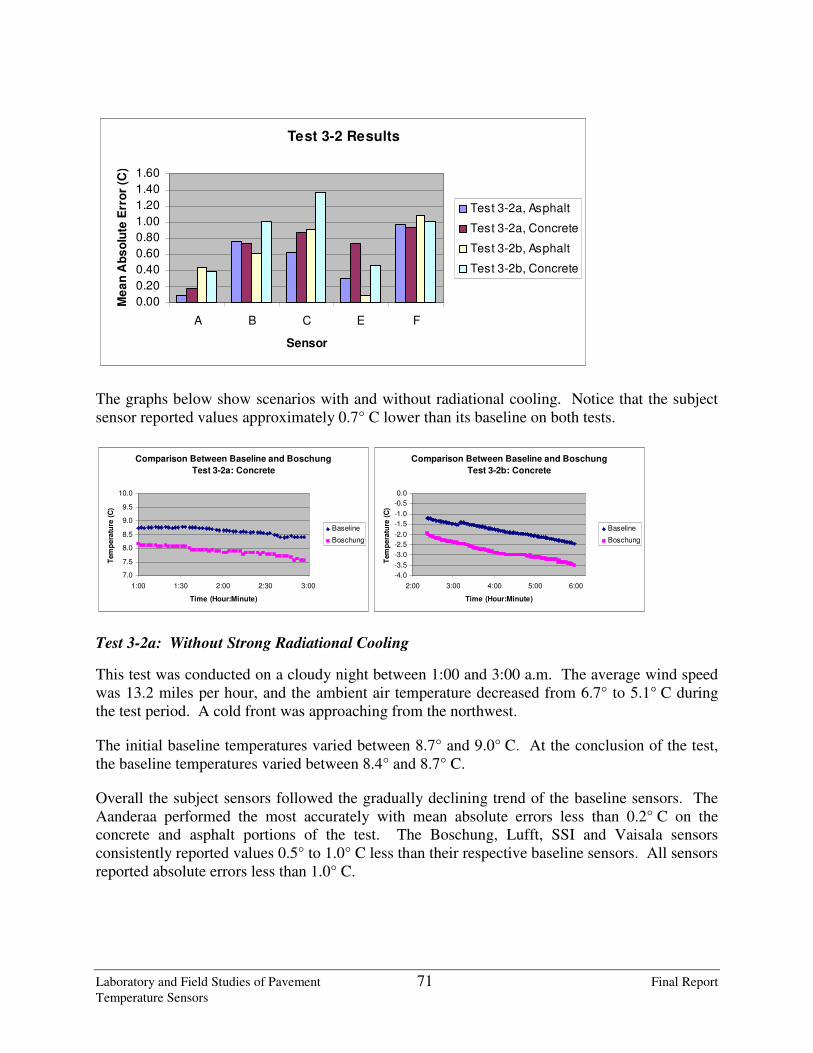
Laboratory and Field Studies of Pavement 71 Final Report
Temperature Sensors
Test 3-2 Results
0.00
0.20
0.40
0.60
0.80
1.00
1.20
1.40
1.60
A B C E F
Sensor
Me
an
Ab
so
lute
Err
or
(C)
Test 3-2a, Asphalt
Test 3-2a, Concrete
Test 3-2b, Asphalt
Test 3-2b, Concrete
The graphs below show scenarios with and without radiational cooling. Notice that the subject sensor reported values approximately 0.7° C lower than its baseline on both tests.
Comparison Between Baseline and Boschung
Test 3-2a: Concrete
7.0
7.5
8.0
8.5
9.0
9.5
10.0
1:00 1:30 2:00 2:30 3:00
Time (Hour:Minute)
Tem
pera
ture
(C
)
Baseline
Boschung
Comparison Between Baseline and Boschung
Test 3-2b: Concrete
-4.0
-3.5
-3.0
-2.5
-2.0
-1.5
-1.0
-0.5
0.0
2:00 3:00 4:00 5:00 6:00
Time (Hour:Minute)
Tem
pera
ture
(C
)
Baseline
Boschung
Test 3-2a: Without Strong Radiational Cooling This test was conducted on a cloudy night between 1:00 and 3:00 a.m. The average wind speed was 13.2 miles per hour, and the ambient air temperature decreased from 6.7° to 5.1° C during the test period. A cold front was approaching from the northwest. The initial baseline temperatures varied between 8.7° and 9.0° C. At the conclusion of the test, the baseline temperatures varied between 8.4° and 8.7° C. Overall the subject sensors followed the gradually declining trend of the baseline sensors. The Aanderaa performed the most accurately with mean absolute errors less than 0.2° C on the concrete and asphalt portions of the test. The Boschung, Lufft, SSI and Vaisala sensors consistently reported values 0.5° to 1.0° C less than their respective baseline sensors. All sensors reported absolute errors less than 1.0° C.

Laboratory and Field Studies of Pavement 72 Final Report
Temperature Sensors
Test 3-2b: With Strong Radiational Cooling On nights which have no cloud cover to radiate heat back to the earth’s surface, the pavement sensor cools much more quickly from the top surface than when there is cloud cover. Even small amounts of transitory clouds can have a great warming effect on surface temperature. In clear conditions, while the bottom of the sensor remains warmer from the relatively warmer pavement beneath it, the top surface is exposed to colder temperatures. The temperature sensing element’s position within the sensor and the material composition of the sensor can affect how fast these temperature sensors cool. This test was conducted on a clear night between 2:00 and 6:00 a.m. The average wind speed was 2.3 miles per hour, and the ambient air temperature decreased from 0.2 to -2.2° C during the test period. The initial asphalt temperatures varied between -0.5° and -0.7° C while the initial concrete temperatures varied between -1.0° and -1.5° C. At the conclusion of the test, both pavements reported a reading of -2.5° C. While subject sensors followed the declining trend of the baseline sensors, they also tended to report temperatures 0.5° to 1.0° C lower than their baselines. The Aanderaa and SSI reported mean absolute error less than 0.5° C on both the concrete and asphalt tests. The remaining sensors reported mean absolute errors less than 1.4° C. 4.4.3 Test 3-3: Field: Warm Pavement With Snowfall This test began at 8:37 a.m. when the ambient temperature was approximately 4.0° C and the average wind speed was six miles per hour. The concrete temperature was between 6.0° and 7.0° C and the asphalt was between 7.0° and 8.0° C. Since real snow could not be obtained, 600 pounds of crushed ice (particles ranging between dust and pea sizes) was distributed around the pavement sensors. The ice was distributed to a depth of 1.5 inches and was spread on and around the sensor so that it covered the surrounding 12 to 18 inches of pavement.
Test 3-3 Results
0.00
0.50
1.00
1.50
2.00
2.50
3.00
A B C E F
Sensor
Me
an
Ab
so
lute
Err
or
(C)
Asphalt
Concrete

Laboratory and Field Studies of Pavement 73 Final Report
Temperature Sensors
Prior to the test, the pavement temperatures were increasing due to the morning sunshine. Within five minutes of the crushed ice application, the baseline readings rapidly dropped and then stabilized between 1.0° and 2.0° C until the ice melted. All the sensors (Vaisala excluded due to its 30-minute time increments) responded to the temperature within 10 minutes of the ice being applied. The Boschung, Lufft and SSI sensors followed the baseline temperature drop within and reported mean absolute errors of 0.8° C or less. The Aanderaa’s temperature drop was approximately 5 to 10 minutes behind its baseline sensor. The Aanderaa’s mean absolute errors were 0.65 and 1.27° C for the asphalt and concrete tests respectively. Only three data points were reported for the Vaisala, but its mean absolute errors were 1.28° and 0.74° C for the asphalt and concrete tests respectively. Shown below is a typical raw data graph (in this case SSI) followed by a graph illustrating the temperature delay observed with the Aanderaa sensor.
Comparison Between Baseline and SSI
Test 3-3: Concrete
0
1
2
3
4
5
6
7
8
9
10
8:30 8:45 9:00 9:15 9:30
Time (Hour:Minute)
Te
mp
era
ture
(C
)
Baseline
SSI
Comparison Between Baseline and Aanderaa
Test 3-3: Concrete
0
1
2
3
4
5
6
7
8
9
10
8:30 8:45 9:00 9:15 9:30
Time (Hour:Minute)
Tem
pera
ture
(C
)
Baseline
Aanderaa
4.4.4 Test 3-4: Field: Cold Pavement With Rainfall This test began at 7:35 a.m. when the ambient temperature was -12.0° C and the average wind speed was 2.4 miles per hour. The concrete and asphalt temperatures were -9.0 and -10.2° C respectively. Water was applied to the pavement using a spray bottle. Upon water application, the baseline temperatures rapidly rose to between -2.0 and -4.0° C and then gradually dropped to around -8.0° C during the following 30 minutes. See below for summarized test results.
Test 3-4 Results
0.00
0.50
1.00
1.50
2.00
2.50
3.00
A B C E F
Sensor
Me
an
Ab
so
lute
Err
or
(C)
Asphalt
Concrete
*Note: There was limited Vaisala data due to the 10-minute data intervals.
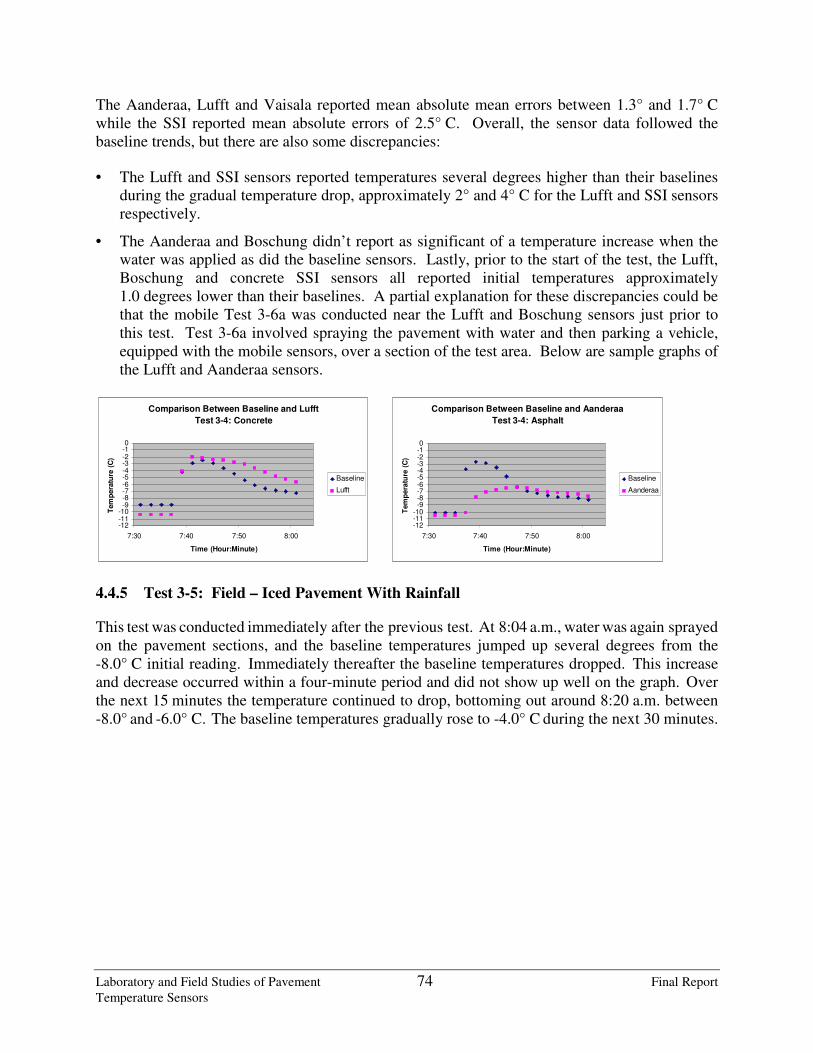
Laboratory and Field Studies of Pavement 74 Final Report
Temperature Sensors
The Aanderaa, Lufft and Vaisala reported mean absolute mean errors between 1.3° and 1.7° C while the SSI reported mean absolute errors of 2.5° C. Overall, the sensor data followed the baseline trends, but there are also some discrepancies:
• The Lufft and SSI sensors reported temperatures several degrees higher than their baselines during the gradual temperature drop, approximately 2° and 4° C for the Lufft and SSI sensors respectively.
• The Aanderaa and Boschung didn’t report as significant of a temperature increase when the water was applied as did the baseline sensors. Lastly, prior to the start of the test, the Lufft, Boschung and concrete SSI sensors all reported initial temperatures approximately 1.0 degrees lower than their baselines. A partial explanation for these discrepancies could be that the mobile Test 3-6a was conducted near the Lufft and Boschung sensors just prior to this test. Test 3-6a involved spraying the pavement with water and then parking a vehicle, equipped with the mobile sensors, over a section of the test area. Below are sample graphs of the Lufft and Aanderaa sensors.
Comparison Between Baseline and Lufft
Test 3-4: Concrete
-12-11-10-9-8-7-6-5-4-3-2-10
7:30 7:40 7:50 8:00
Time (Hour:Minute)
Tem
pera
ture
(C
)
Baseline
Lufft
Comparison Between Baseline and Aanderaa
Test 3-4: Asphalt
-12-11-10-9-8-7-6-5-4-3-2-10
7:30 7:40 7:50 8:00
Time (Hour:Minute)
Tem
pera
ture
(C
)
Baseline
Aanderaa
4.4.5 Test 3-5: Field – Iced Pavement With Rainfall This test was conducted immediately after the previous test. At 8:04 a.m., water was again sprayed on the pavement sections, and the baseline temperatures jumped up several degrees from the -8.0° C initial reading. Immediately thereafter the baseline temperatures dropped. This increase and decrease occurred within a four-minute period and did not show up well on the graph. Over the next 15 minutes the temperature continued to drop, bottoming out around 8:20 a.m. between -8.0° and -6.0° C. The baseline temperatures gradually rose to -4.0° C during the next 30 minutes.

Laboratory and Field Studies of Pavement 75 Final Report
Temperature Sensors
Test 3-5 Results
0.00
0.50
1.00
1.50
2.00
2.50
3.00
A B C E F
Sensor
Me
an
Ab
so
lute
Err
or
(C)
Asphalt
Concrete
The Boschung sensor followed its baseline the most accurately, reporting absolute errors less than 0.8° C. Compared to their baselines, the concrete Aanderaa, Lufft and SSI sensors experienced a delay of approximately 15 minutes during the application of the water. On the asphalt section, the sensors showed a delay of approximately five minutes. The concrete Aanderaa, Lufft and SSI sensors reported mean absolute errors between 0.4° and 1.5° C during the test period. The Vaisala reported data every 10 minutes and had mean absolute errors of 0.6 and 2.4° C on the concrete and asphalt tests respectively. Shown below are graphs of the Boschung and Aanderaa’s test data. The subject sensor’s temperature delay is illustrated in the second graph.
Comparison Between Baseline and Boschung
Test 3-5: Concrete
-9
-8
-7
-6
-5
-4
-3
-2
-1
0
8:03 8:18 8:32 8:47 9:01
Time (Hour:Minute)
Tem
pera
ture
(C
)
Baseline
Boschung
Comparison Between Baseline and SSI
Test 3-5: Concrete
-9
-8
-7
-6
-5
-4
-3
-2
-1
0
8:03 8:18 8:32 8:47 9:01
Time (Hour:Minute)
Tem
pera
ture
(C
)
Baseline
SSI
4.4.6 Field – Mobile Sensor Field Evaluation
Throughout Test 3-6, both mobile sensors followed the trend of their baselines and reported average errors of 0.7° and 1.9° C for the Control Product and Sprague sensors, respectively. However, during portions of each test, the Control Products sensor would over-report the baseline temperature by approximately 1.0° C. The accurate results during certain portions of the testing rules out miscalibration as the cause. Differing pavement emissivities could be the cause. However, additional field testing is required to confirm this hypothesis. Table 11 shows three types of averages for each of the mobile sensor field tests.
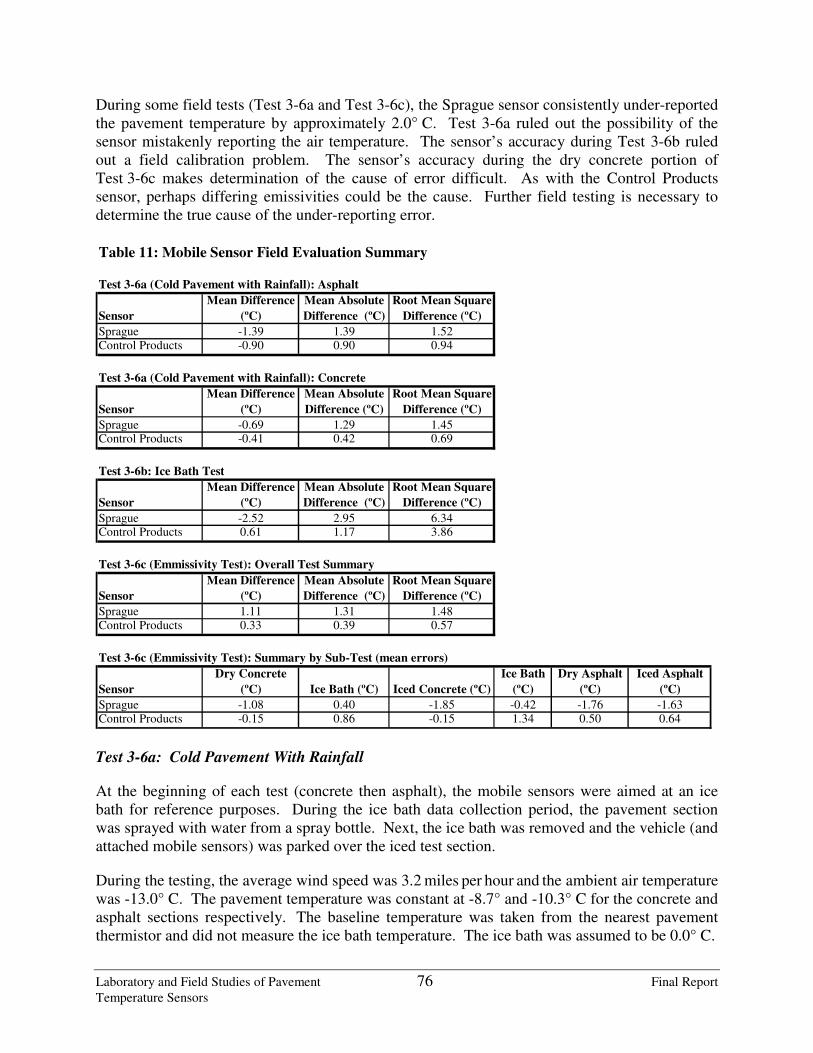
Laboratory and Field Studies of Pavement 76 Final Report
Temperature Sensors
During some field tests (Test 3-6a and Test 3-6c), the Sprague sensor consistently under-reported the pavement temperature by approximately 2.0° C. Test 3-6a ruled out the possibility of the sensor mistakenly reporting the air temperature. The sensor’s accuracy during Test 3-6b ruled out a field calibration problem. The sensor’s accuracy during the dry concrete portion of Test 3-6c makes determination of the cause of error difficult. As with the Control Products sensor, perhaps differing emissivities could be the cause. Further field testing is necessary to determine the true cause of the under-reporting error.
Table 11: Mobile Sensor Field Evaluation Summary
Test 3-6a (Cold Pavement with Rainfall): Asphalt
Sensor
Mean Difference
(ºC)
Mean Absolute
Difference (ºC)
Root Mean Square
Difference (ºC)
Sprague -1.39 1.39 1.52Control Products -0.90 0.90 0.94
Test 3-6a (Cold Pavement with Rainfall): Concrete
Sensor
Mean Difference
(ºC)
Mean Absolute
Difference (ºC)
Root Mean Square
Difference (ºC)
Sprague -0.69 1.29 1.45Control Products -0.41 0.42 0.69
Test 3-6b: Ice Bath Test
Sensor
Mean Difference
(ºC)
Mean Absolute
Difference (ºC)
Root Mean Square
Difference (ºC)
Sprague -2.52 2.95 6.34Control Products 0.61 1.17 3.86
Test 3-6c (Emmissivity Test): Overall Test Summary
Sensor
Mean Difference
(ºC)
Mean Absolute
Difference (ºC)
Root Mean Square
Difference (ºC)
Sprague 1.11 1.31 1.48Control Products 0.33 0.39 0.57
Test 3-6c (Emmissivity Test): Summary by Sub-Test (mean errors)
Sensor
Dry Concrete
(ºC) Ice Bath (ºC) Iced Concrete (ºC)
Ice Bath
(ºC)
Dry Asphalt
(ºC)
Iced Asphalt
(ºC)
Sprague -1.08 0.40 -1.85 -0.42 -1.76 -1.63Control Products -0.15 0.86 -0.15 1.34 0.50 0.64
Test 3-6a: Cold Pavement With Rainfall At the beginning of each test (concrete then asphalt), the mobile sensors were aimed at an ice bath for reference purposes. During the ice bath data collection period, the pavement section was sprayed with water from a spray bottle. Next, the ice bath was removed and the vehicle (and attached mobile sensors) was parked over the iced test section. During the testing, the average wind speed was 3.2 miles per hour and the ambient air temperature was -13.0° C. The pavement temperature was constant at -8.7° and -10.3° C for the concrete and asphalt sections respectively. The baseline temperature was taken from the nearest pavement thermistor and did not measure the ice bath temperature. The ice bath was assumed to be 0.0° C.

Laboratory and Field Studies of Pavement 77 Final Report
Temperature Sensors
During the ice bath test, the Control Products sensor reported constant readings of approximately 1.0° C while the Sprague reported readings within 1° C of the presumed 0.0° C ice bath. When the mobile sensors were positioned over the iced pavement, the Control Products sensor reported temperatures within 0.2° and 1.0° C of the baseline for the concrete and asphalt pavements respectively. The Sprague reported temperatures approximately 2.0° C below its baseline for the concrete and asphalt pavements. Samples of the Control Products and Sprague data are shown in the following graphs.
Comparison Between Baseline and Sprague
Test 3-6a: Asphalt
-13.0
-11.0
-9.0
-7.0
-5.0
-3.0
-1.0
1.0
3.0
7:27 7:28 7:29 7:30 7:31 7:32 7:33
Time (Hour:Minute)
Te
mp
era
ture
(C
)
Sprague
BaselineIce Bath Iced Asphalt
Comparison Between Baseline and Control Products
Test 3-6a: Asphalt
-13.0
-11.0
-9.0
-7.0
-5.0
-3.0
-1.0
1.0
3.0
7:27 7:28 7:29 7:30 7:31 7:32 7:33
Time (Hour:Minute)
Tem
pera
ture
(C
)
Control Products
Baseline
Ice Bath Iced Asphalt

Laboratory and Field Studies of Pavement 78 Final Report
Temperature Sensors
Test 3-6b: Ice Bath Comparison Test During this test, the average wind speed was 1.0 miles per hour and the ambient air temperature
ranged between 2.6 and 3.2° C. Prior to the test, both sensors were mounted to the front of the test vehicle and were allowed to acclimate to the ambient temperature for 60 minutes. Note that this location is near the vehicle’s radiator which had an unknown impact on the temperature readings. It is assumed that turbulent flow from the moving vehicle would minimize any impacts, but further study would be required to prove this hypothesis.
After 60 minutes, an ice bath, presumed to be 0.0° C, was mounted beneath the sensors. The sensors were then allowed to acclimate to the ice bath for 15 additional minutes. At 1:45, the vehicle was driven continuously for 60 minutes at speeds between 30 and 50 miles per hour.
The Control Products sensor mostly reported constant readings around 1.2° C during the initial
ice bath acclimation and readings close to 0.0° C during the driven portion of the test. The
Sprague generally reported temperatures within 1.0° C of the baseline.
Both sensors reported a significant number of data points near -17.0° C. These -17.0° C readings
correspond to approximately 0.0° F. It is possible that these readings represent intermittent power or communications errors. In other words, the sensor might output 0.0 in the event of an intermittent error. The live road conditions, such as vibrations or electrical interference, could have caused these failures.
The Control Products sensor reported a 1.0° C drop after the vehicle began traveling. This could suggest that the sensor was affected by the ambient temperature immediately above the targeted ice bath. Also, it is possible that heat which radiated from the vehicle has a lesser effect on the temperature readings as the vehicle started traveling.
Overall, the mean absolute errors were 1.2° and 3.0° C for the Control Products and Sprague sensors respectively. The mean absolute errors were calculated with the assumption that the ice
bath was a constant 0.00° C. Raw data is shown in the following graphs.
Test 3-6b: Control Products
-20
-15
-10
-5
0
5
10
1:30 1:45 2:00 2:15 2:30 2:45 3:00
Time (Hour:Minute)
Rep
ort
ed
Tem
pera
ture
(C
)
Control Products
Baseline
Test 3-6b: Sprague
-20
-15
-10
-5
0
5
10
1:30 1:45 2:00 2:15 2:30 2:45 3:00
Time (Hour:Minute)
Rep
ort
ed
Tem
pera
ture
(C
)
Sprague
Baseline

Laboratory and Field Studies of Pavement 79 Final Report
Temperature Sensors
Test 3-6c: Emissivity Check This test was conducted between 7:10 and 7:34 a.m. The average wind speed was 2.4 miles per
hour, and the ambient air temperature was -13.2° C. The baseline asphalt and concrete pavement temperatures were -10.2 and -8.7 respectively throughout the test. Prior to the test, both mobile sensors were acclimated to the ambient environment for at least 30 minutes. At 7:10, the sensor vehicle was parked over the dry concrete test-section of
roadway. At 7:14, an ice bath (presumed to be 0.0° C) was placed under the sensors. At 7:17, the ice bath was removed, and water was then sprayed onto the concrete pavement section; by 7:19 the water had frozen. At 7:27, an ice bath was again briefly positioned (for approximately 30 seconds) underneath the mobile sensors. At 7:27:30 the vehicle moved and parked over the dry asphalt test section. At 7:28:30, the pavement was sprayed with water; by 7:29:30 the water had frozen. The raw data graphs for each sensor are shown below.
Test 3-6c: Control Products
-13
-11
-9
-7
-5
-3
-1
1
3
7:09 7:14 7:19 7:24 7:29 7:34
Time (Hour:Minute)
Re
po
rte
d T
em
pe
ratu
re (
C) Control Products
Baseline
Dry Concrete
Ice
Bath Iced Concrete
Ice Bath
Dry Asphalt
Iced Asphalt
Freezing
Water
Freezing Water
Test 3-6c: Sprague
-13
-11
-9
-7
-5
-3
-1
1
3
7:09 7:14 7:19 7:24 7:29 7:34
Time (Hour:Minute)
Re
po
rte
d T
em
pe
ratu
re (
C) Sprague
Baseline
Dry Concrete Iced Concrete
Ice
BathFreezing
Water Iced Asphalt
Dry
Asphalt
Ice Bath Freezing Water
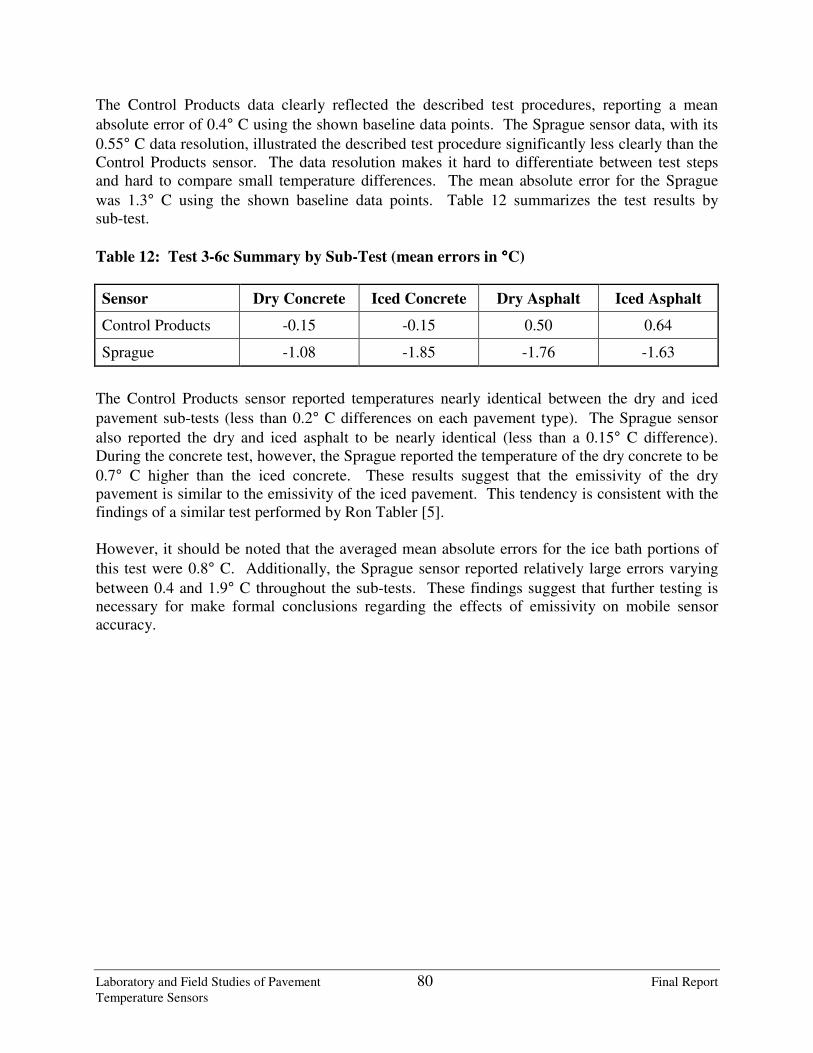
Laboratory and Field Studies of Pavement 80 Final Report
Temperature Sensors
The Control Products data clearly reflected the described test procedures, reporting a mean
absolute error of 0.4° C using the shown baseline data points. The Sprague sensor data, with its
0.55° C data resolution, illustrated the described test procedure significantly less clearly than the Control Products sensor. The data resolution makes it hard to differentiate between test steps and hard to compare small temperature differences. The mean absolute error for the Sprague
was 1.3° C using the shown baseline data points. Table 12 summarizes the test results by sub-test.
Table 12: Test 3-6c Summary by Sub-Test (mean errors in °°°°C)
Sensor Dry Concrete Iced Concrete Dry Asphalt Iced Asphalt
Control Products -0.15 -0.15 0.50 0.64
Sprague -1.08 -1.85 -1.76 -1.63
The Control Products sensor reported temperatures nearly identical between the dry and iced
pavement sub-tests (less than 0.2° C differences on each pavement type). The Sprague sensor
also reported the dry and iced asphalt to be nearly identical (less than a 0.15° C difference). During the concrete test, however, the Sprague reported the temperature of the dry concrete to be
0.7° C higher than the iced concrete. These results suggest that the emissivity of the dry pavement is similar to the emissivity of the iced pavement. This tendency is consistent with the findings of a similar test performed by Ron Tabler [5]. However, it should be noted that the averaged mean absolute errors for the ice bath portions of
this test were 0.8° C. Additionally, the Sprague sensor reported relatively large errors varying
between 0.4 and 1.9° C throughout the sub-tests. These findings suggest that further testing is necessary for make formal conclusions regarding the effects of emissivity on mobile sensor accuracy.

Laboratory and Field Studies of Pavement 81 Final Report
Temperature Sensors
5 Conclusions and Suggested Research Through a wide range of Aurora-approved laboratory and field test procedures, this study met its objective of evaluating the surface temperature reporting performance of various models of both in-pavement and mobile pavement temperature sensors in varying environmental conditions. The following conclusions were drawn from the laboratory and field test results presented within the main body of this report. It is not the intent of this report to draw subjective conclusions regarding the performance of individual sensors or to recommend which units performed the best. It is left to the readers to examine the results and determine which sensor might best meet their needs. Thus, the conclusions below are general in nature.
All Sensors
• Throughout the variety of environmental conditions tested, on average, the sensors reported surface temperatures within 0.8° C (1.4° F) of the actual pavement surface temperature.
• The application of sodium chloride to the sensors had an insignificant impact on sensor temperature reporting performance.
• Solar impact was difficult to reproduce in the laboratory environment because non-uniform spatial distribution of the simulated solar light caused different surfaces and locations of the pavement to heat differently.
In-Pavement Sensors
• In general, most in-pavement sensors tended to read within 1.5° C (2.7° F) of their baseline sensors.
• Laboratory tests indicate that the performance of in-pavement sensors was not significantly affected by pavement type.
• Field tests, however, indicated that in-pavement sensors installed in asphalt pavement reported more accurate surface temperature readings than in-pavement sensors installed in concrete pavement. This was confirmed by a statistical significance test.
• Field temperature tests indicate that in the “real world,” the in-pavement sensors might not track ambient temperature fluctuations as well as in the laboratory. The differences are most pronounced when solar radiation is present, suggesting that the connection between solar radiation and sensor performance is complex. This may be due to the effects of temperature cycles (solar heating and radiational cooling) or the pavement’s thermal properties. Additional field testing is recommended to quantify these factors.
• Sensors with temperature sensing elements beneath the surface of the pavement are less responsive to rapid temperature fluctuation.
Laboratory and Field Studies of Pavement 82 Final Report
Temperature Sensors
Mobile Sensors
• In the laboratory and field, pavement type was shown to have a noticeable effect on mobile pavement sensor performance. The mobile sensors, on average, performed 0.5° C (0.9° F) more accurately on the concrete tests.
• Mobile sensor mounting height did not have a significant effect on accuracy.
Suggested Research
The laboratory and field tests conducted for this project revealed a great deal of information on the performance of RWIS sensors under a variety of conditions. Analysis of the test results also reveals areas where additional research would be beneficial to the RWIS community. The following items are proposed as opportunities for further research:
• The current research focused exclusively on temperature. Other parameters, such as freezing point and surface state, could be evaluated with the equipment currently available. A follow-up study to analyze these parameters would be a cost-effective way of assessing the parameters by using the test sections and sensors already procured.
• The field data revealed some interesting effects related to radiational cooling and solar heating that could not be replicated in the laboratory. Further research into these effects would help further the understanding of RWIS sensors.
• Additional field investigation of the mobile sensors would reveal how varying pavement type and environmental conditions, such as snow, ice, wind or solar radiation, affect sensor performance.
The study results offer detailed understanding of the range of accuracy that can be expected with pavement temperature sensors. Development of an acceptable range of accuracy could be developed with the data obtained in this study. This step is left to the reader to determine because each agency has its own needs, which may vary depending on the application. In general, the sensors were found to perform without significant failures and within a definable range. The greater RWIS community may want to explore the creation of an acceptable range of accuracy, possibly through other RWIS projects like the Clarus initiative.

Laboratory and Field Studies of Pavement 83 Final Report
Temperature Sensors
6 References 1. Devore, Jay, Statistics: The Exploration and Analysis of Data, 2nd Edition, Duxbury
Press, 1993. 2. Minnesota Department of Transportation, Standard Specifications for Construction, 2000
Edition. 3. Road Weather Information Systems, Volume 2: Implementation Guide, Strategic
Highway Research Program (SHRP-H-351), 1993. 4. Ohio University, Evaluation of ODOT Roadway/Weather Sensor Systems of Snow and
Ice Removal (FHWA/OH-2003/008C), 2003. 5. Tabler, R. D., Comparison of RoadWatch and Control Products, Inc., Model 999J
Infrared Sensors.

Aurora Pavement Temperature Senor Study A-1 Final Report Version 2.0
Appendix A
Literature Summary

Aurora Pavement Temperature Senor Study A-2 Final Report Version 2.0
Appendix A
Literature Summary
No. Name and Contact Literature Source and Study Description
1 Doug Jonas Matrix Management Group [email protected]
Group discussion about IR/Pavement sensor comparative accuracy. http://www.sicop.net/IR-Pavment%20Sensor%20Comp,%202-26-00.pdf
2 Duane Smith Iowa State University 515-294-8817 [email protected]
“Concept Highway Maintenance Vehicle Final Report: Phase II”, Center for Transportation Research and Education (CTRE) at Iowa State University, December 1998 http://www.ctre.iastate.edu/Research/conceptv/conveph2/ Chapter 9 includes information regarding using temperature sensors on winter maintenance vehicle to automatically collect air and pavement temperature data. Appendix H is a referenced report that provides results of a comparative performance test conducted with Control Products 996A and a Sprague RoadwayWatch surface temperature monitoring system. The test was performed by Braun Intec Corporation, Portland, Organ
3 Roger Green Office of Pavement Engineering Ohio DOT Office Phone: 614-995-5993 http://www.dot.state.oh.us/pavement/ Dr. Shad Sargand Ohio University 740-593-1467 [email protected]
OHIO/DOT Strategic Highway Research Program (SHRP) Test Road Project http://www.dot.state.oh.us/pavement/Research/del23.htm As part of the support for the Strategic Highway Research Program (SHRP), the Ohio Department of Transportation, in conjunction with the Federal Highway Administration, constructed a comprehensive test road encompassing four of nine experiments in the Specific Pavement Studies (SPS). This project affords SHRP with a unique opportunity to compare the performance of pavement sections in these experiments at one site where topography, soil, and climate are uniform.
4 Graves Clark Kentucky Transportation Center University of Kentucky 606-257-4513, Ext. 248 [email protected]
“Evaluation of Road Weather Information System”, Research Report, May 1999. The report describes the study that monitored and evaluated the Kentucky Transportation Cabinet’s Road Weather Information System. Pavement sensors and surface temperature were discussed in the report,

Aurora Pavement Temperature Senor Study A-3 Final Report Version 2.0
No. Name and Contact Literature Source and Study Description
5 F. Fabre, A. Klose Commission of the European Community
Cost 309 Road Weather Conditions Report. EUR 13847 EN, 1992. The report includes the information about the Test of Roadway Weather Monitoring System and Sensors. Members and Experts in project management committee are listed in the report.
6 Lars Frimodig Swedish National Road Administration 46-243-750-00 Dr. Torbjorn Gustavsson Bergaba Consultants 46-31-84-83-80
Cost 309 Test of Road Weather Monitoring System and Sensors
7 Marilyn H Burtwell Transportation Research Laboratory UK 44-01344-770214 [email protected]
“Assessment of Road Surface Freezing Point Sensors for the UK”, Marilyn Burtwell, Transport Research Laboratory. Pages 767 to 778. Preprint for the 1998 Xth PIARC International Winter Road Congress in Lulea, Sweden. This paper describes a series of road experiments to monitor the performance of all types of sensors, including roadway and laboratory tests.
8 Dan Roosevelt Virginia DOT 804-293-1924 [email protected]
“Standardized Testing Methodologies for Pavement Sensors”, Castle Rock Consultants, December 7, 1999 The project researched procedures for calibrating and testing RWIS pavement sensors. Contact List for the project is included in the Appendix E.
9 Edward Boselly Matrix Management Group
“An Analysis of the PM-4 Non-contact Thermometer and Performance Characteristics of the SCAN Surface Sensor”, Surface Systems, Inc. April 11, 1991 The study documented the performance test of the PM-4 SCAN thermometers.
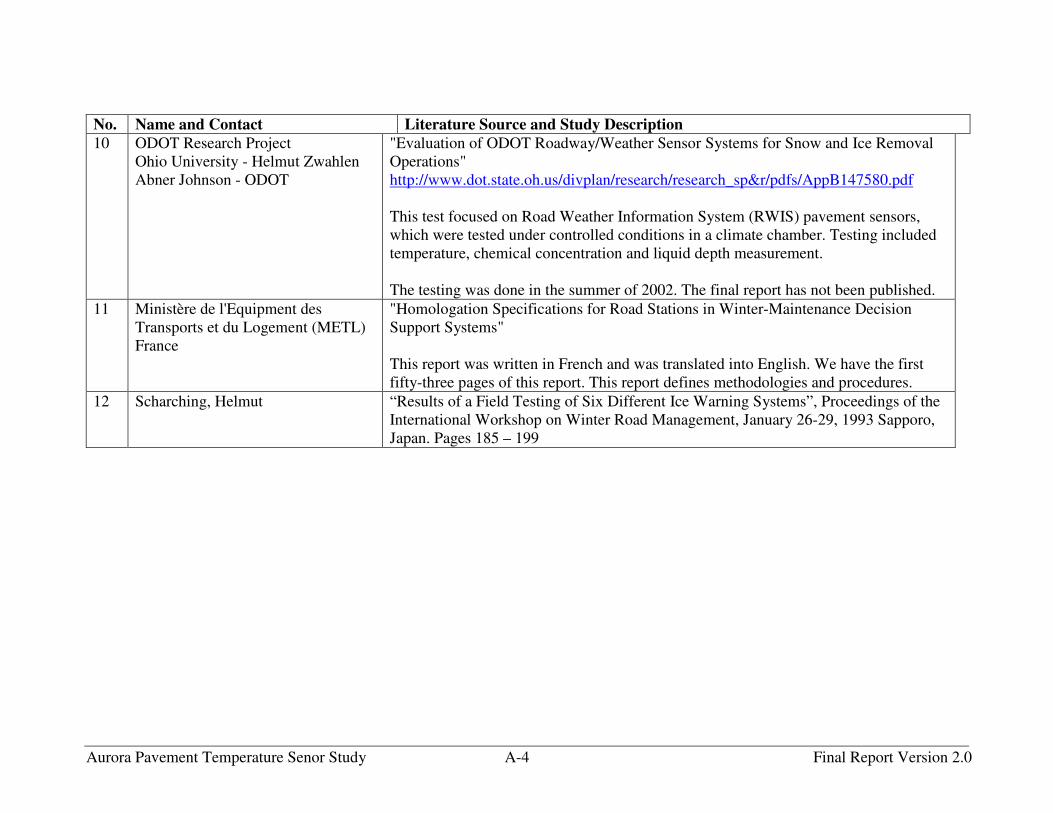
Aurora Pavement Temperature Senor Study A-4 Final Report Version 2.0
No. Name and Contact Literature Source and Study Description
10 ODOT Research Project Ohio University - Helmut Zwahlen Abner Johnson - ODOT
"Evaluation of ODOT Roadway/Weather Sensor Systems for Snow and Ice Removal Operations" http://www.dot.state.oh.us/divplan/research/research_sp&r/pdfs/AppB147580.pdf This test focused on Road Weather Information System (RWIS) pavement sensors, which were tested under controlled conditions in a climate chamber. Testing included temperature, chemical concentration and liquid depth measurement. The testing was done in the summer of 2002. The final report has not been published.
11 Ministère de l'Equipment des Transports et du Logement (METL) France
"Homologation Specifications for Road Stations in Winter-Maintenance Decision Support Systems" This report was written in French and was translated into English. We have the first fifty-three pages of this report. This report defines methodologies and procedures.
12 Scharching, Helmut
“Results of a Field Testing of Six Different Ice Warning Systems”, Proceedings of the International Workshop on Winter Road Management, January 26-29, 1993 Sapporo, Japan. Pages 185 – 199

Aurora Pavement Temperature Senor Study B-1 Final Report Version 2.0
Appendix B
Baseline Sensor Specifications

Aurora Pavement Temperature Senor Study B-2 Final Report Version 2.0

Aurora Pavement Temperature Senor Study B-3 Final Report Version 2.0

Aurora Pavement Temperature Senor Study B-4 Final Report Version 2.0

Aurora Pavement Temperature Senor Study B-5 Final Report Version 2.0

Aurora Pavement Temperature Senor Study B-6 Final Report Version 2.0

Aurora Pavement Temperature Senor Study B-7 Final Report Version 2.0

Aurora Pavement Temperature Senor Study B-8 Final Report Version 2.0

Aurora Pavement Temperature Senor Study C-1 Draft Report Version 2.0
Appendix C
Wisconsin Department of Transportation
State Highway Maintenance Manual
Guideline 35.30
Application Rates – De-icing
Aurora Pavement Temperature Senor Study C-2 Draft Report Version 2.0
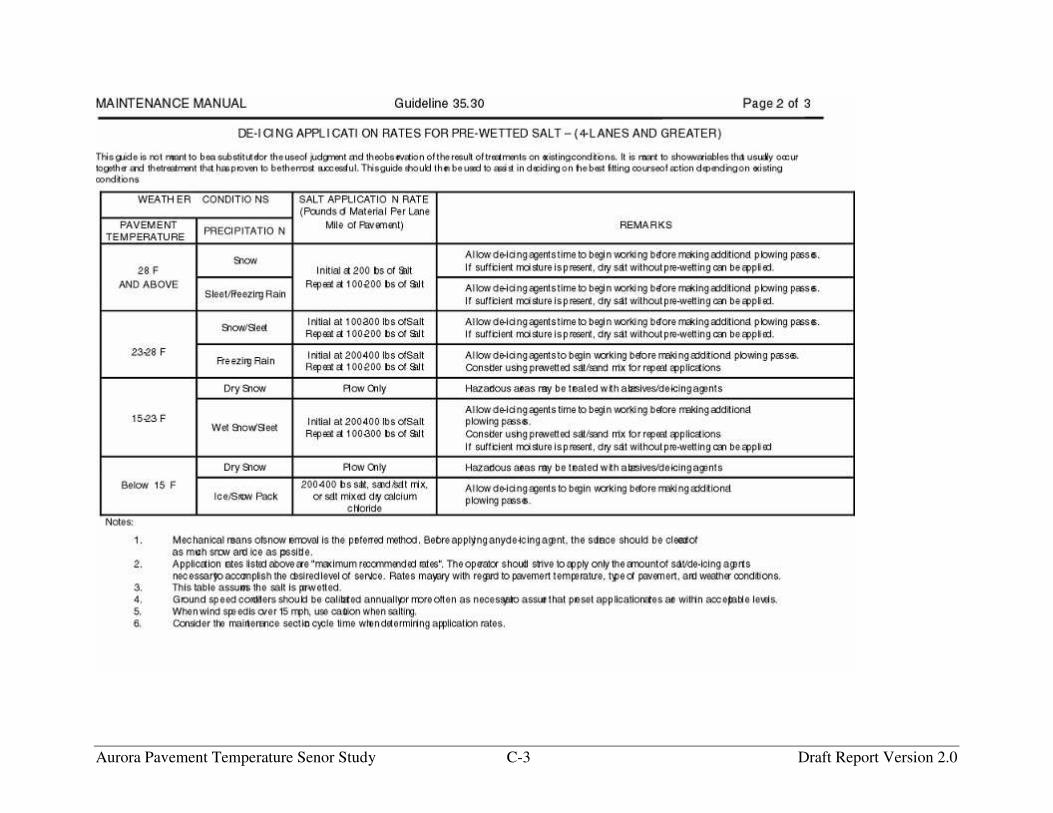
Aurora Pavement Temperature Senor Study C-3 Draft Report Version 2.0

Aurora Pavement Temperature Senor Study C-4 Draft Report Version 2.0

Auro
ra Pav
emen
t Tem
peratu
re Sen
or S
tud
y C
-5 D
raft Rep
ort V
ersion 2
.0
S
TA
TE
HIG
HW
AY
MA
INT
EN
AN
CE
MA
NU
AL
G
uid
elin
e 3
5.2
5
Effe
ctiv
e: O
cto
be
r 1, 2
00
2 (Is
su
ed
5/0
2)
35
.00
Win
ter O
pe
ratio
ns - D
e-ic
ing
Age
nts
an
d A
bra
siv
es
Su
pe
rse
de
s:
Initia
l Issue
3
5.2
5
Ap
plic
atio
n R
ate
s - A
nti-ic
ing
By: D
irecto
r, Bu
rea
u o
f Hig
hw
ay O
pe
ratio
ns
P
age
1 o
f 1
COMMENTS
1) Consider treating approaches as well as bridge decks.
2) Treat ice patches, if needed, with pre-wetted salt at
100 lb/lane-mi.
1) Consider treating approaches as well as bridge decks.
2) Treat ice patches, if needed, with pre-wetted salt at
100 lb/lane-mi.
It is not recommended to apply liquid de-icing agents in
an anti-icing mode prior to freezing rain events.
If anti-icing is performed prior to a snow event, re-
application may be necessary to prevent re-freeze. It also
may be necessary to switch to a de-icing mode.
1) Do not apply liquid anti-icing agents onto heavy snow
accumulation or packed snow.
2) Applications will need to be more frequent at lower
temperatures and higher snowfall rates.
3) If anti-icing is performed prior to a snow event, re-
application may be necessary to prevent re-freeze. It also
may be necessary to switch to a de-icing mode.
(4) 4-Lanes and Greater
(5) 2 Lanes
Guideline
s Rate
Pre-wetted
Salt
(lb/lane-mi)
50-150
200-400(4)
100-300(5)
200-400(4)
100-300(5)
100-200
100-300
Anti-icing
Application
Liquid
(gal/lane-mi.)
20-30 (frost)
30-40 (Black Ice)
20 Recommended
30 Maximum
Not
Recommended
30 Recommended
40 Maximum
40 Recommended
50 Maximum
(3) Time initial anti-
icing agent
applications and
subsequent de-icing
agent applications to
prevent deteriorating
conditions or
development of
packed and bonded
snow.
Recommended
Locations
Bridge Decks and
Trouble Spots
Bridge Decks and
Trouble Spots and
Intersections
Any area of concern
Trouble Spots and
Intersections
Trouble Spots and
Intersections
(2) It is not
recommended to
apply de-icing
agents in an anti-
icing mode when
the pavement
temperature is
below 20ºF or
drifting is a
problem.
PREDICTED
PRECIPITATION
EVENT
Frost or Black Ice
Sleet
Freezing Rain
Light Snow
(< 1/2" in./hr.)
Moderate or Heavy
Snow
(> 1/2 in./hr)
Notes:
(1) Anti-icing
operations typically
should be conducted
during normal, non-
overtime working
hours.

Aurora Pavement Temperature Senor Study D-1 Final Report Version 2.0
Appendix D
Statistical Significance Results
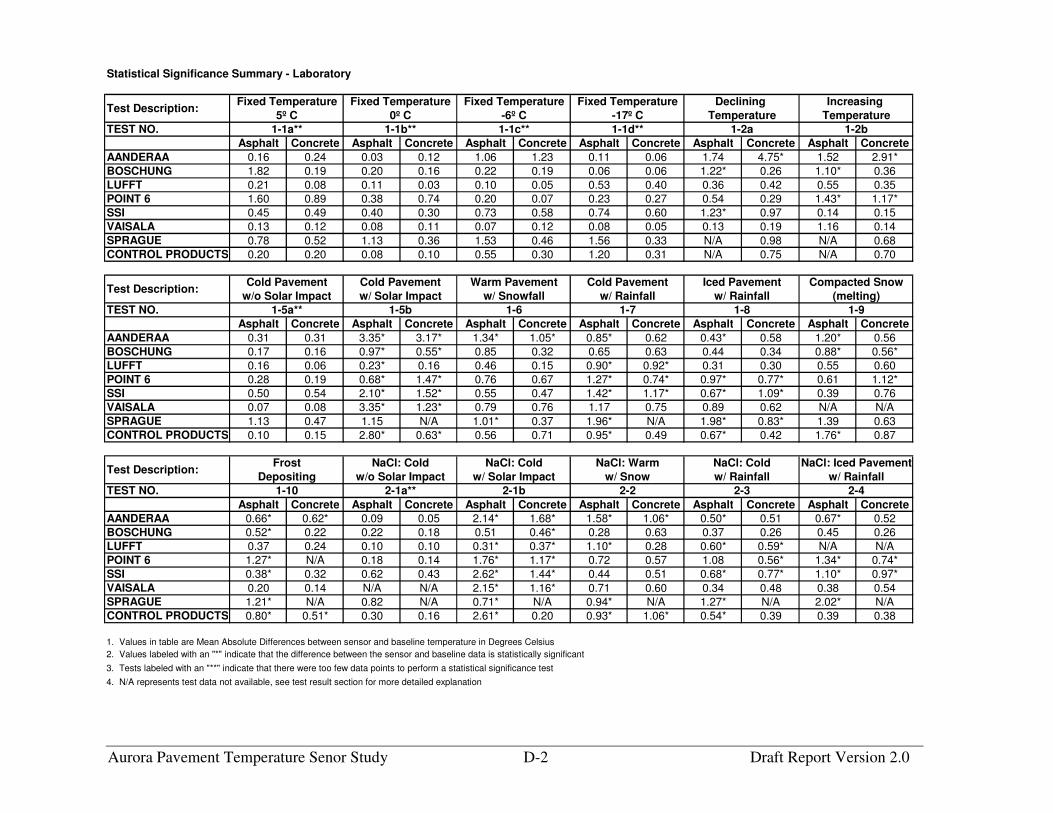
Aurora Pavement Temperature Senor Study D-2 Draft Report Version 2.0
Statistical Significance Summary - Laboratory
TEST NO.
Asphalt Concrete Asphalt Concrete Asphalt Concrete Asphalt Concrete Asphalt Concrete Asphalt Concrete
AANDERAA 0.16 0.24 0.03 0.12 1.06 1.23 0.11 0.06 1.74 4.75* 1.52 2.91*
BOSCHUNG 1.82 0.19 0.20 0.16 0.22 0.19 0.06 0.06 1.22* 0.26 1.10* 0.36
LUFFT 0.21 0.08 0.11 0.03 0.10 0.05 0.53 0.40 0.36 0.42 0.55 0.35
POINT 6 1.60 0.89 0.38 0.74 0.20 0.07 0.23 0.27 0.54 0.29 1.43* 1.17*
SSI 0.45 0.49 0.40 0.30 0.73 0.58 0.74 0.60 1.23* 0.97 0.14 0.15
VAISALA 0.13 0.12 0.08 0.11 0.07 0.12 0.08 0.05 0.13 0.19 1.16 0.14
SPRAGUE 0.78 0.52 1.13 0.36 1.53 0.46 1.56 0.33 N/A 0.98 N/A 0.68
CONTROL PRODUCTS 0.20 0.20 0.08 0.10 0.55 0.30 1.20 0.31 N/A 0.75 N/A 0.70
TEST NO.
Asphalt Concrete Asphalt Concrete Asphalt Concrete Asphalt Concrete Asphalt Concrete Asphalt Concrete
AANDERAA 0.31 0.31 3.35* 3.17* 1.34* 1.05* 0.85* 0.62 0.43* 0.58 1.20* 0.56
BOSCHUNG 0.17 0.16 0.97* 0.55* 0.85 0.32 0.65 0.63 0.44 0.34 0.88* 0.56*
LUFFT 0.16 0.06 0.23* 0.16 0.46 0.15 0.90* 0.92* 0.31 0.30 0.55 0.60
POINT 6 0.28 0.19 0.68* 1.47* 0.76 0.67 1.27* 0.74* 0.97* 0.77* 0.61 1.12*
SSI 0.50 0.54 2.10* 1.52* 0.55 0.47 1.42* 1.17* 0.67* 1.09* 0.39 0.76
VAISALA 0.07 0.08 3.35* 1.23* 0.79 0.76 1.17 0.75 0.89 0.62 N/A N/A
SPRAGUE 1.13 0.47 1.15 N/A 1.01* 0.37 1.96* N/A 1.98* 0.83* 1.39 0.63
CONTROL PRODUCTS 0.10 0.15 2.80* 0.63* 0.56 0.71 0.95* 0.49 0.67* 0.42 1.76* 0.87
TEST NO.
Asphalt Concrete Asphalt Concrete Asphalt Concrete Asphalt Concrete Asphalt Concrete Asphalt Concrete
AANDERAA 0.66* 0.62* 0.09 0.05 2.14* 1.68* 1.58* 1.06* 0.50* 0.51 0.67* 0.52
BOSCHUNG 0.52* 0.22 0.22 0.18 0.51 0.46* 0.28 0.63 0.37 0.26 0.45 0.26
LUFFT 0.37 0.24 0.10 0.10 0.31* 0.37* 1.10* 0.28 0.60* 0.59* N/A N/A
POINT 6 1.27* N/A 0.18 0.14 1.76* 1.17* 0.72 0.57 1.08 0.56* 1.34* 0.74*
SSI 0.38* 0.32 0.62 0.43 2.62* 1.44* 0.44 0.51 0.68* 0.77* 1.10* 0.97*
VAISALA 0.20 0.14 N/A N/A 2.15* 1.16* 0.71 0.60 0.34 0.48 0.38 0.54
SPRAGUE 1.21* N/A 0.82 N/A 0.71* N/A 0.94* N/A 1.27* N/A 2.02* N/A
CONTROL PRODUCTS 0.80* 0.51* 0.30 0.16 2.61* 0.20 0.93* 1.06* 0.54* 0.39 0.39 0.38
1. Values in table are Mean Absolute Differences between sensor and baseline temperature in Degrees Celsius
2. Values labeled with an "*" indicate that the difference between the sensor and baseline data is statistically significant
3. Tests labeled with an "**" indicate that there were too few data points to perform a statistical significance test
4. N/A represents test data not available, see test result section for more detailed explanation
NaCl: Iced Pavement
w/ Rainfall
2-4
Test Description:Fixed Temperature Fixed Temperature Fixed Temperature
5º C 0º C -6º C -17º C
1-1d**
Fixed Temperature Declining Increasing
Temperature Temperature
w/o Solar Impact
1-1a** 1-1b** 1-1c**
w/ Rainfall
1-2a 1-2b
Test Description:Cold Pavement Cold Pavement Warm Pavement Cold Pavement Iced Pavement Compacted Snow
(melting)
1-5a** 1-5b 1-6 1-7 1-8 1-9
w/ Solar Impact w/ Snowfall w/ Rainfall
Test Description:Frost NaCl: Cold NaCl: Cold NaCl: Warm NaCl: Cold
Depositing w/o Solar Impact w/ Solar Impact w/ Snow w/ Rainfall
2-31-10 2-1a** 2-1b 2-2

Aurora Pavement Temperature Senor Study D-3 Draft Report Version 2.0
Statistical Significance Summary - Field
TEST NO.
Asphalt Concrete Asphalt Concrete Asphalt Concrete Asphalt Concrete
AANDERAA 0.39 1.66* N/A N/A 0.09* 0.17* 0.44* 0.39*
BOSCHUNG 0.58 2.05* 0.29 0.92* 0.76* 0.74* 0.61* 1.01*
LUFFT 0.23 1.85* 0.10 1.07* 0.63* 0.87* 0.91* 1.37*
SSI 0.58 1.31* 0.50 0.68* 0.30* 0.74* 0.08 0.46*
VAISALA 1.49 2.25 0.94 1.37 0.98* 0.94* 1.09* 1.01*
TEST NO.
Asphalt Concrete Asphalt Concrete Asphalt Concrete
AANDERAA 0.65 1.27* 1.53 1.70 0.56 1.44
BOSCHUNG 0.80 0.49 2.03 1.34 0.35 0.76
LUFFT 0.53 0.37 1.73 1.43 0.40 1.20
SSI 0.37 0.70 2.47 2.51 0.69 1.40
VAISALA 1.28 2.75 1.50 1.59 2.42 0.63
1. Values in table are Mean Absolute Differences between sensor and baseline temperature in Degrees Celsius
2. Values labeled with an "*" indicate that the difference between the sensor and baseline data is statistically significant
3. Tests labeled with an "**" indicate that there were too few data points to perform a statistical significance test
4. N/A represents test data not available, see test result section for more detailed explanation
Test Description:Cold Day Cold Day Cold Night Cold Night
w/ Solar Impact w/o Solar Impact w/o Radiation Cooling w/ Radiation Cooling
3-1a 3-1b 3-2a 3-2b
Test Description:Warm Pavement Cold Pavement Iced Pavement
w/ Snowfall w/ Rainfall w/ Rainfall
3-3 3-4** 3-5**

Aurora Pavement Temperature Senor Study E-1 Draft Report Version 2.0
Appendix E
Detailed Test Results
(Available Upon Request)