laboratory manual - jawaharlal nehru engineering college graphics.pdf · submission related to...
TRANSCRIPT
Jawaharlal Nehru Engineering College
Laboratory Manual
Computer Graphics
For
Second Year Students CSE Dept: Information Technology
FORWARD
It is my great pleasure to present this laboratory manual for Second year engineering students for the
subject of Computer Graphics.
As a student, many of you may be wondering with some of the questions in your mind regarding the
subject and exactly what has been tried is to answer through this manual.
As you may be aware that MGM has already been awarded with ISO 9001:2000 certification and it is
our endure to technically equip our students taking the advantage of the procedural aspects of ISO
9001:2000 Certification. Faculty members are also advised that covering these aspects in initial stage itself, will greatly relived
them in future as much of the load will be taken care by the enthusiasm energies of the students once
they are conceptually clear.
Dr. S.D.Deshmukh Principal
2
LABORATORY MANUAL CONTENTS
This manual is intended for the Second year students of Computer Science and Engineering in the
subject of Computer Graphics. This manual typically contains practical/Lab Sessions related
Programming. In C covering various aspects related the subject to enhanced understanding.
Students are advised to thoroughly go though this manual rather than only topics mentioned in the
syllabus as practical aspects are the key to understanding and conceptual visualization of theoretical
aspects covered in the books.
Good Luck for your Enjoyable Laboratory Sessions
Trupti V. Kenekar Prof. S.N.Jaiswal
Lecturer, IT Dept. HOD,IT
DOs and DON’Ts in Laboratory:
1. Make entry in the Log Book as soon as you enter the Laboratory.
2. All the students should sit according to their roll numbers starting from their left to right.
3. All the students are supposed to enter the terminal number in the logbook.
4. Do not change the terminal on which you are working.
5. All the students are expected to get at least the algorithm of the program/concept
to be implemented.
6. Strictly observe the instructions given by the teacher/Lab Instructor.
Instruction for Laboratory Teachers::
1. Submission related to whatever lab work has been completed should be done during the next
lab session. The immediate arrangements for printouts related to submission on the day of
practical assignments.
2. Students should be taught for taking the printouts under the observation of lab
teacher.
3. The promptness of submission should be encouraged by way of marking and
evaluation patterns that will benefit the sincere students.

Vision of JNEC
College seeks to be the engineering college of choice in Maharashtra that can provide the
best learning experience, the most productive learning community, and the most creative
learning environment in Engineering Education and will be recognized as one of the best
Engineering Colleges in India.
Mission of JNEC
To develop innovative engineers with human values, well equipped to solve complex
technical problems, address the needs of modern society and pursue lifelong learning, by
providing them competent, caring and committed faculty.
Short-Term Goals:
Fostering lifelong learning
Encourage and facilitate sponsored projects, consultancy and technology transfer that
will benefit society, region and the nation.
We provide an applied, values-based learning experience that produces well-
rounded, innovative engineers and technology leaders who have the technical skills,
passion, and courage to make a difference.
Effectively and efficiently balance breadth with depth in engineering education to
prepare students for global competition.
Integrate research and innovation into the teaching learning process.
IT DEPARTMENT
IT Vision:
IT department is committed to ensure the quality education to students‟ by providing
innovative resources & continuous up-gradation of the department. To achieve “Heights
of Excellence” in the world we strive to organize regular interaction with Industry and
Alumni.
IT Mission:
To impart core technical competency & knowledge in students through curriculum and
certification programs to fulfill the industry requirements which ultimately benefits
society at large.
Program Educational Objectives:
I. Preparation: To prepare students to excel in PG program or to succeed in Industry
/Technical profession through global, rigorous education.
II. Core Competence: To provide students with a solid foundation in mathematical,
scientific and engineering fundamentals required to solve engineering problems and
also to pursue higher studies.
III. Breadth: To train students with good scientific and engineering breadth so as to
comprehend, analyze, design and create novel product and solution for the real life
problems.
IV. Professionalism: To inculcate in students‟ professional and ethical attitude, effective
communication skills, team work skills, multi-disciplinary approach and an ability to
relate engineering issues to broader social context.
V. Learning Environment: To provide students with academic environment aware of
excellence, leadership, written ethical codes and guidelines and lifelong learning
needed for successful professional career.
SUBJECT INDEX
1. Study of basic graphics functions defined in “graphics.h”.
2. Study of graphics standards like CORE, GKS (Graphics Kernel System), GKS-
3D(Graphics Kernel System -3 Dimensions), PHIGS (Programmer's Hierarchical
Interactive Graphics Systems), CGM
(Computer Graphics Metafile), CGI (Computer Graphics Interface).
3. Program to implement basic graphics primitives in OpenGL.
4. Program for Line Drawing using DDA algorithm using C and OpenGL.
5. Program for Line Drawing using Bresenham‟s algorithm using C and OpenGL.
6. Programs using 2-D transformations in C.
7. Implement Polygon filling algorithms [Flood-Fill Algorithm] in C.
8. Programs to study window to viewport transformations in C.
9. Program for Cohen Sutherland Line clipping algorithm in C.
10. Programs to study 3-D transformations in C.
1.Study of basic graphics functions defined in “graphics.h”.
Aim : Study of basic graphics functions defined in “graphics.h”.
Theory:
What is computer graphics?
• Computer graphics deals with all aspects of creating images with a computer
Hardware
Software
Applications
Computer graphics are graphics created using computers and, more generally, the
representation and manipulation of image data by a computer.
The development of computer graphics, or simply referred to as CG, has made
computers easier to interact with, and better for understanding and interpreting manytypes of
data. Developments in computer graphics have had a profound impact on many types of
media and have revolutionized the animation and video game industry.
Typically, the term computer graphics refers to several different things:
· the representation and manipulation of image data by a computer
· the various technologies used to create and manipulate images
· the images so produced and The subfield
of computer science which studies
methods for digitally synthesizing and manipulating visual content
Applications:
· Computer Aided Design
· Computer simulation
· Digital art
· Education
· Graphic design
· Information visualization
· Scientific visualization
· Video Games
· Virtual reality
· Web design

Graphics mode Initialization
First of all we have to call the initgraph function that will intialize the graphics mode on the
computer. initigraph have the following prototype.
void initgraph(int far *graphdriver, int far *graphmode, char far *pathtodriver);
Initgraph initializes the graphics system by loading a graphics driver from disk (or validating a
registered driver) then putting the system into graphics mode. Initgraph also resets all graphics
settings (color, palette, current position, viewport, etc.) to their defaults, then resets graphresult
to 0.
*graphdriver Integer that specifies the graphics driver to be used. You can give graphdriver a
value using a constant of the graphics_drivers enumeration type.
*graphmode Integer that specifies the initial graphics mode (unless *graphdriver = DETECT).
If *graphdriver = DETECT, initgraph sets *graphmode to the highest resolution available for the
detected driver. You can give *graphmode a value using a constant of the graphics_modes
enumeration type.
*pathtodriver Specifies the directory path where initgraph looks for graphics drivers (*.BGI)
first.
1. If they‟re not there, initgraph looks in the current directory.
2. If pathtodriver is null, the driver files must be in the current directory.
*graphdriver and *graphmode must be set to valid graphics_drivers and graphics_mode values or
you‟ll get unpredictable results. (The exception is graphdriver = DETECT.)
After a call to initgraph, *graphdriver is set to the current graphics driver, and *graphmode is set
to the current graphics mode. You can tell initgraph to use a particular graphics driver and mode,
or to autodetect the attached video adapter at run time and pick the corresponding driver. If you
tell initgraph to autodetect, it calls detectgraph to select a graphics driver and mode.
Basic Function :
Cleardevice() Clears all previous graphical outputs generated by the previous programs.Its a
good practice to include this method at the starting of each program.
cleardevice()
gotoxy() This will initialize the graphics cusor to the specified co-ordiante.In C gotoxy function
is used very frequently to locate the cursor at different locations whenever as necessary.
Syntax : gotoxy(x,y)
putpixex() It will colour the pixel specified by the co-ordinates.
Syntax: putpixel(x,y,WHITE)
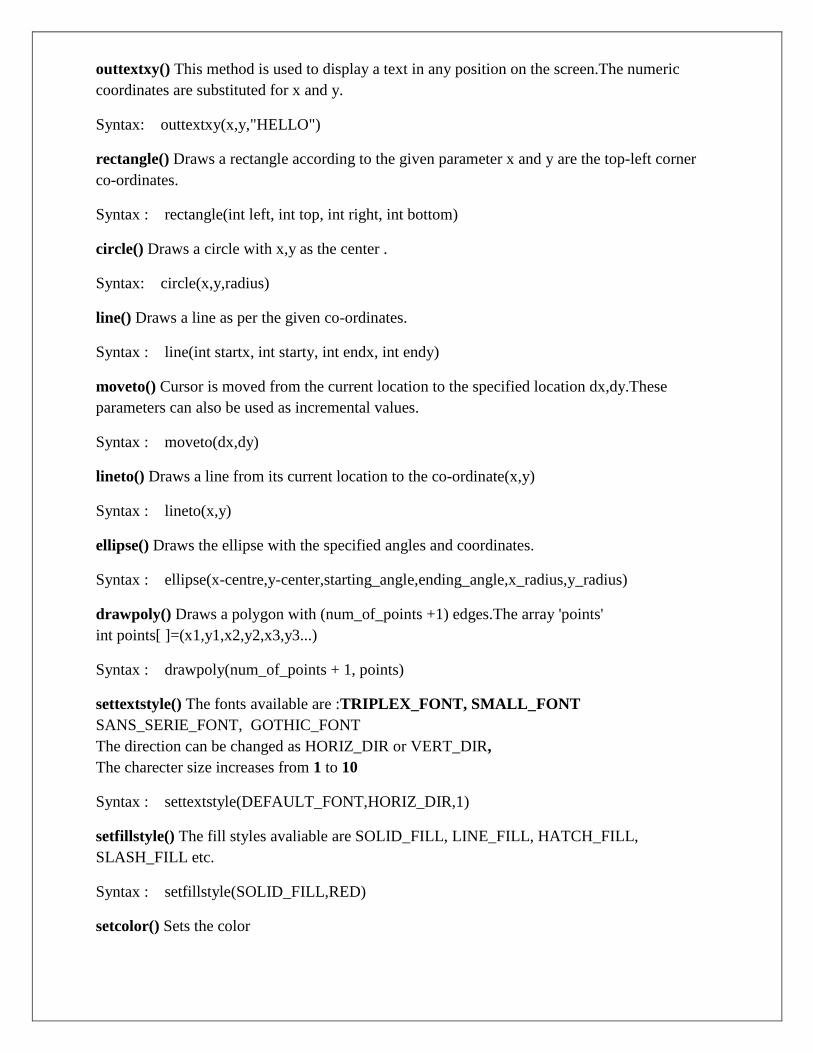
outtextxy() This method is used to display a text in any position on the screen.The numeric
coordinates are substituted for x and y.
Syntax: outtextxy(x,y,"HELLO")
rectangle() Draws a rectangle according to the given parameter x and y are the top-left corner
co-ordinates.
Syntax : rectangle(int left, int top, int right, int bottom)
circle() Draws a circle with x,y as the center .
Syntax: circle(x,y,radius)
line() Draws a line as per the given co-ordinates.
Syntax : line(int startx, int starty, int endx, int endy)
moveto() Cursor is moved from the current location to the specified location dx,dy.These
parameters can also be used as incremental values.
Syntax : moveto(dx,dy)
lineto() Draws a line from its current location to the co-ordinate(x,y)
Syntax : lineto(x,y)
ellipse() Draws the ellipse with the specified angles and coordinates.
Syntax : ellipse(x-centre,y-center,starting_angle,ending_angle,x_radius,y_radius)
drawpoly() Draws a polygon with (num_of_points +1) edges.The array 'points'
int points[ ]=(x1,y1,x2,y2,x3,y3...)
Syntax : drawpoly(num_of_points + 1, points)
settextstyle() The fonts available are :TRIPLEX_FONT, SMALL_FONT
SANS_SERIE_FONT, GOTHIC_FONT
The direction can be changed as HORIZ_DIR or VERT_DIR,
The charecter size increases from 1 to 10
Syntax : settextstyle(DEFAULT_FONT,HORIZ_DIR,1)
setfillstyle() The fill styles avaliable are SOLID_FILL, LINE_FILL, HATCH_FILL,
SLASH_FILL etc.
Syntax : setfillstyle(SOLID_FILL,RED)
setcolor() Sets the color
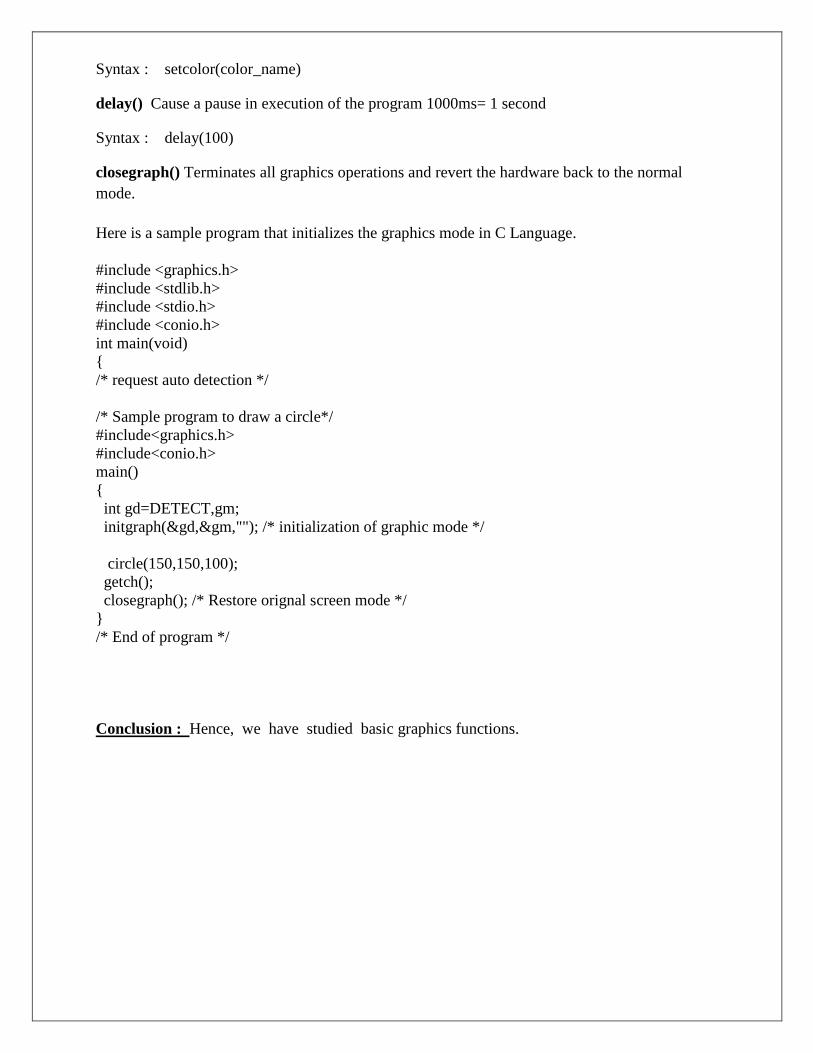
Syntax : setcolor(color_name)
delay() Cause a pause in execution of the program 1000ms= 1 second
Syntax : delay(100)
closegraph() Terminates all graphics operations and revert the hardware back to the normal
mode.
Here is a sample program that initializes the graphics mode in C Language.
#include <graphics.h>
#include <stdlib.h>
#include <stdio.h>
#include <conio.h>
int main(void)
{
/* request auto detection */
/* Sample program to draw a circle*/
#include<graphics.h>
#include<conio.h>
main()
{
int gd=DETECT,gm;
initgraph(&gd,&gm,""); /* initialization of graphic mode */
circle(150,150,100);
getch();
closegraph(); /* Restore orignal screen mode */
}
/* End of program */
Conclusion : Hence, we have studied basic graphics functions.
2 Study of graphics standards like CORE, GKS (Graphics Kernel System), GKS-
3D(Graphics Kernel System -3 Dimensions), PHIGS (Programmer's Hierarchical
Interactive Graphics Systems), CGM (Computer Graphics Metafile), CGI (Computer
Graphics Interface).
Aim : Study of different Graphics standard
Theory :
Graphical Kernel System
The Graphical Kernel System (GKS) is accepted as an international standard for
two-dimensional graphics (although largely ignored in the USA.
The two-dimensional Computer Graphics is closely related to the six output
functions of GKS. These are:-
1. Polyline. Draws one or more straight lines through the coordinates supplied.
2. Polymarker. Draws a symbol at each of the coordinates supplied. The software
allows the choice of one of the five symmetric symbols, namely: x + * 0
3. Text. This allows a text string to be output in a number of ways, starting at the
coordinate given.
4. Fill-area. This allows a polygon to be drawn and filled, using the coordinates
given. Possible types of fill include hollow, solid and a variety of hatching and
patterns.
5. Cell-array. This allows a pattern to be defined and output in the rectangle
defined by the coordinates given. This is discussed in the section "Patterns &
Pictures".
6. Generalised Drawing Primitive (GDP). This allows the provision of a variety of
other facilities. Most systems include software for arcs of circles or ellipses and
the drawing of a smooth curve through a set of points (I have called this
"polysmooth" elsewhere in this text).
Following the acceptance of GKS as an international standard, work commenced
on two related standards, namely CGI and CGM. The "Computer Graphics Interface"
provides a low-level standard between the actual hardware and GKS and specifies how
device-drivers should be written. The "Computer Graphics Metafile" is used to
transfer graphics segments from one computer system to another.
PHIGS
The Programmer's Hierarchical Interactive Graphics System (PHIGS) is a 3D graphics standard
which was developed within ISO in parallel to GKS-3D. The PHIGS standard defines a set of
functions and data structures to be used by a programmer to manipulate and display 3-D
graphical objects. It was accepted as a full International Standard in 1988. A great deal of PHIGS
is identical to GKS-3D, including the primitives, the attributes, the workstation concept, and the
viewing and input models. However, PHIGS has a single Central Structure Store (CSS), unlike
the separate Workstation Dependent and Workstation Independent Segment Storage (WDSS and
WISS) of GKS. The CSS contains Structures which can be configured into a hierarchical
directed-graph database, and within the structures themselves are stored the graphics primitives,
attributes, and so forth. PHIGS is aimed particularly at highly interactive applications with
complicated hierarchical data structures, for example: Mechanical CAD, Molecular Modelling,
Simulation and Process Control.
At the end of 1991, CERN acquired an implementation of PHIGS in a portable machine-
independent version (i.e. it did not consider hardware-dependent packages supplied by the
hardware manufacturers). The package is from the French companie G5G -- Graphisme 5eme
Generation --. This specific implementation of PHIGS, the only one officially supported at
CERN, is called GPHIGS. The package is available on the following platforms: VAX VMS, HP
(HP/UX), Silicon Graphics, IBM RISC 6000, SUN (SunOS and Solaris), DEC Station (Ultrix),
DEC ALPHA (OpenVMS and OSF/1). Both the FORTRAN and C bindings are available. The
following driver interfaces are available: X-Window, DEC-Windows, GL, Starbase, XGL, HP
GL, CGM, and PostScript. A new version (3.1) is now available, as announced in CNL 216.
COMPUTER GRAPIDCS METAFILE
These concerns were addressed by the American National Standards Institute and their
solution for this challenge introduced the Computer Graphics Metafile. The CGM standard was
designed by the ANSI X3H3 Committee, the same committee that has given the graphics
industry such graphics standards as GKS, PHIGS, and the CGI. The ANSI X3H3 committee,
which is comprised of representatives of the computer graphics industry, is the most qualified
entity for the implementation of a graphics standard such as the CGM. One of the most important
aspects of the CGM is its implementation and the adherence of the vendor to the specifications of
the design of the CGM. When comparing any two implementations of the CGM ~ere is little
likelihood that both implementations will be identical or even completely compatible. This
incompatibility is typically due to variations or customizations of the CGM made by a vendor
during the implementation, or a different interpretation of the specifications of the CGM. The
cooperation of various manufacturers with regards to testing the compatibility of their respective
CGM has been the solution for these incompatibility problems.
WHAT IS THE CGM?
The CGM is an ANSI standard for the storage and transfer of computer graphics between
incompatible graphics systems. Specifically, the CGM standardizes the syntax and format of
common graphics primitives such as lines, polygons, and fill areas, as well as text. There are
three CGM storage formats:
1.Bmary.
2. Character Encoded.
3. Oear text.
The binary coding is most commonly used format because of its speed with regards to reading.
writing, and interpreting files.
IMPORTANCE OF CGM
The CGM can ease decision making of graphics products by offering immediate compatIoility. It
can also assist with the introdnction of new products, particularly graphics hardcopy devices
which normally take months to be integrated into the market. Currently there is no industry
standard like the CGM, so it is left up to graphics vendors to write device drivers and interfaces
for other manufacturer's products. Writing device drivers and interfaces is a task that is easily
postponed until sufficient market share_ develops for a new product. The CGM would offer
immediate support in this situation as well as many others like it SAS/GRAPH converted using
Teknigraphics' CGM and edited with Lotus Freelance Plus.
Conclusion : Hence, we have studied basic graphics standard

3 Program to implement basic graphics primitives in OpenGL.
Aim : Program to implement basic graphics primitives in OpenGL.
Theory :
Introduction to OPENGL
OpenGL is a software interface that allows the programmer to create 2D and 3D graphics
images. OpenGL is both a standard API and the implementation of that API. You can call the
functions that comprise OpenGL from a program you write and expect to see the same results no
matter where your program is running.
OpenGL is independent of the hardware, operating, and windowing systems in use. The
fact that it is windowing-system independent, makes it portable. OpenGL program must interface
with the windowing system of the platform where the graphics are to be displayed. Therefore, a
number of windowing toolkits have been developed for use with OpenGL.
OpenGL functions in a client/server environment. That is, the application program
producing the graphics may run on a machine other than the one on which the graphics are
displayed.The server part of OpenGL, which runs on the workstation where the graphics are
displayed, can access whatever physical graphics device or frame buffer is available on that
machine.
OpenGL (Open Graphics Library) is a standard specification defining a cross-language, cross-
platform API for writing applications that produce 2D and 3D Computer graphics. The interface
consists of over 250 different function calls which can be used to draw complex three-
dimensional scenes from simple primitives.
OpenGL provides a powerful but primitive set of rendering commands, and all higher-level
drawing must be done in terms of these commands. Also, OpenGL programs have to use the
underlying mechanisms of the windowing system. A number of libraries exist to allow you to
simplify your programming tasks, including the following:
The OpenGL Utility Library (GLU) contains several routines that use lower-level OpenGL
commands to perform such tasks as setting up matrices for specific viewing orientations and
projections, performing polygon tessellation, and rendering surfaces. GLU routines use the prefix
glu.
For every window system, there is a library that extends the functionality of that window
system to support OpenGL rendering. For machines that use the X Window System, the OpenGL
Extension to the X Window System (GLX) is provided as an adjunct to OpenGL. GLX routines
use the prefix glX. For Microsoft Windows, the WGL routines provide the Windows to OpenGL
interface. All WGL routines use the prefix wgl. For IBM OS/2, the PGL is the Presentation
Manager to OpenGL interface, and its routines use the prefix pgl.
The OpenGL Utility Toolkit (GLUT) is a window system-independent toolkit, written by
Mark Kilgard, to hide the complexities of differing window system APIs. Provides functionality
common to all window systems
Open a window
Get input from mouse and keyboard
Menus
Event-driven
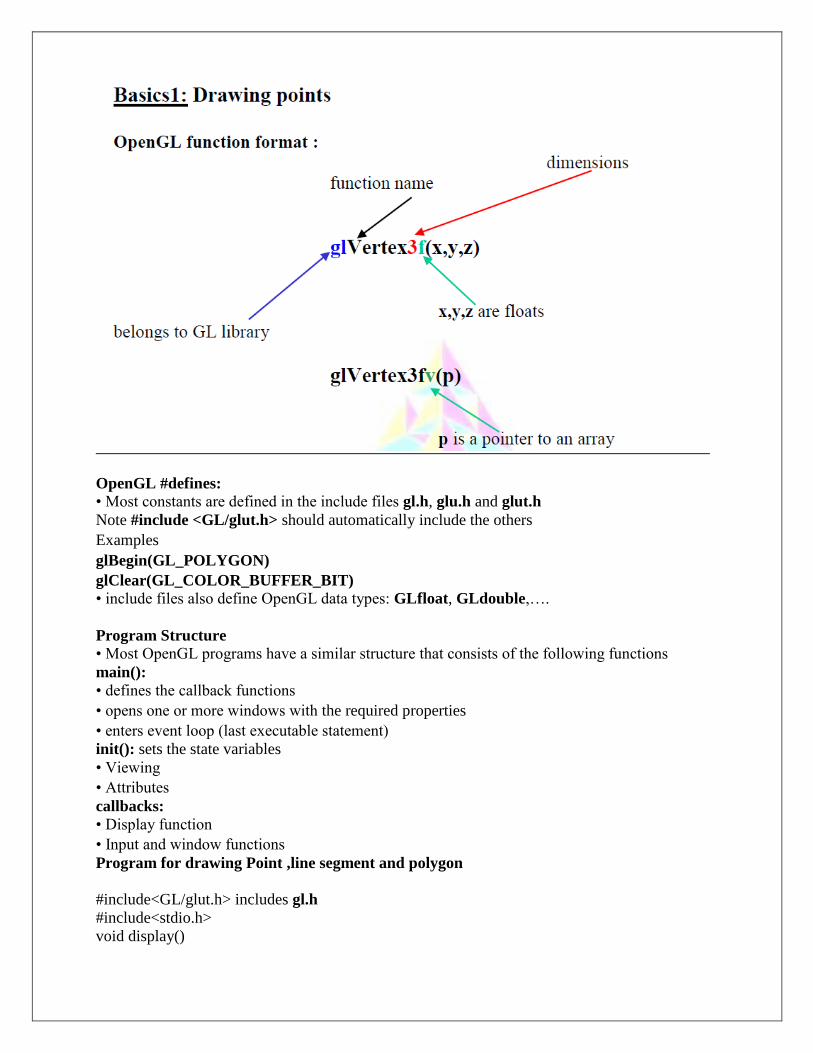
OpenGL #defines: • Most constants are defined in the include files gl.h, glu.h and glut.h
Note #include <GL/glut.h> should automatically include the others
Examples
glBegin(GL_POLYGON)
glClear(GL_COLOR_BUFFER_BIT) • include files also define OpenGL data types: GLfloat, GLdouble,….
Program Structure • Most OpenGL programs have a similar structure that consists of the following functions
main():
• defines the callback functions
• opens one or more windows with the required properties
• enters event loop (last executable statement)
init(): sets the state variables
• Viewing
• Attributes
callbacks:
• Display function
• Input and window functions
Program for drawing Point ,line segment and polygon
#include<GL/glut.h> includes gl.h
#include<stdio.h>
void display()

{
glClear(GL_COLOR_BUFFER_BIT);
glColor3f(1.0,0.0,0.0); /*fill/ draw in red*/
glPointSize(2.0); /*set size of the point*/
glBegin(GL_POINTS); /*type of object*/
glVertex2f(0.0,0.0); /*location of vertex*/
glVertex2f(0.0,0.5);
glEnd(); /*end of object definition*/
glBegin(GL_LINES); /* type of object*/
glVertex2f(0.0,0.0); /*location of vertex*/
glVertex2f(0.0,0.5);
glEnd(); /*end of object definition*/
glBegin(GL_POLYGON); /* type of object*/
glVertex2f(0.0,0.0); /*location of vertex*/
glVertex2f(0.0,0.5);
glEnd(); /*end of object definition*/
glFlush();
}
void myinit() opaque window
{
glClearColor(0.0,0.0,0.0,1.0); black clear color
gluOrtho2D(-1.0,1.0,-1.0,1.0); viewing volume
}
void main(int argc, char **argv)
{
glutInit(&argc,argv);
glutInitDisplayMode(GLUT_RGB|GLUT_SINGLE);
glutInitWindowSize(500,500);
glutInitWindowPosition(0,0); define window properties
glutCreateWindow("Simple demo");
myinit();
glutDisplayFunc(display); set OpenGL state
display callback
glutMainLoop();
enter event loop
}
* Note that the program defines a display callback function named display
Every glut program must have a display callback
The display callback is executed whenever OpenGL decides the display must be refreshed, for
example when the window is opened
The main function ends with the program entering an event loop
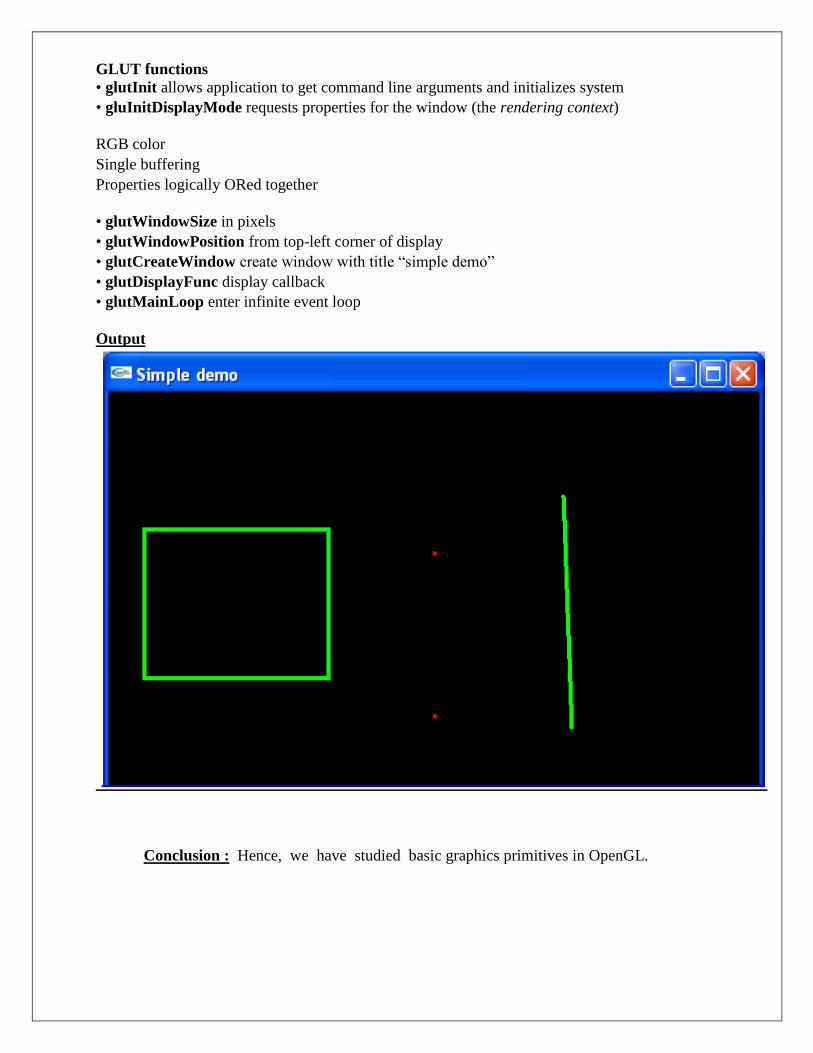
GLUT functions
• glutInit allows application to get command line arguments and initializes system
• gluInitDisplayMode requests properties for the window (the rendering context)
RGB color
Single buffering
Properties logically ORed together
• glutWindowSize in pixels
• glutWindowPosition from top-left corner of display
• glutCreateWindow create window with title “simple demo”
• glutDisplayFunc display callback
• glutMainLoop enter infinite event loop
Output
Conclusion : Hence, we have studied basic graphics primitives in OpenGL.
3 .Program for Line Drawing using DDA algorithm using C and OpenGL.
Aim : Program for Line Drawing using DDA algorithm using C.
Theory :
Line drawing is accomplished by calculating intermediate positions along the
line path between specified end points.
The simplest way to rasterize a line is to solve the governing differential Equation :
Equation of the straight line is
Y = mx + c
Differential with respect to x
_dy/ _dy = m = constant (1)
Assume that the _y and _x are the small increment in x and y direction along the path
respectively along the path.
Equation (1) can be written as _y/ _x =y2 y1/ x2 – x1 = constant (2)
Equation (2) has one solution
Yi +1 = yi + _y= yi + (y2 y1/ x2 – x1) (3)
Equation (3) represents a recursive relation for successive values of y along the
required line x1, y1, x2, y2 are the end points of the required line .
When equation (3) is used to rasterise the line then it is called as digital
differential analyzer (DDA).
ALGORITHM
Step 1). Initialize(x1,y1), (x2,y2)
if abs(x2 – x1) _ abs(y2 – y1) then
len = abs(x2 – x1)
else
len = abs(y2 – y1)
Step 2). dx = (x2 – x1)/len
dy = (y2 – y1)/len
x = x1 + 0.5 * sign(dx)
y = y1 + 0.5 * sign(dy)
begin main loop
Step 3) i=1
while( i _ len)
plot (integer(x),integer(y))
x = (x + _x)
y = (y + _y)
i = i + 1
end while
Step 4) finish
Line Drawing Algorithm Drawbacks
DDA is the simplest line drawing algorithm

Not very efficient
Round operation is expensive
Program for Line Drawing using DDA algorithm using OPENGL
Code :
#include <iostream>
#include <math.h>
#include <GL/glut.h>
using namespace std;
GLdouble X1, Y1, X2, Y2;
void LineDDA(void)
{
GLdouble dx=X2-X1 , dy=Y2-Y1,steps;
float xInc,yInc,x=X1,y=Y1;
steps=(abs(dx)>abs(dy))?abs(dx):abs(dy);
xInc=dx/(float)steps;
yInc=dy/(float)steps;
glClear(GL_COLOR_BUFFER_BIT);
glBegin(GL_POINTS);
glVertex2d(x,y);
for(int k=0;k<steps;k++)
{
x+=xInc;
y+=yInc;
glVertex2d(x,y);
}
glEnd();
glFlush();
}
void Init()
{
glClearColor(1.0,1.0,1.0,0);
glColor3f(1.0,0.0,0.0);
glViewport(0 , 0 , 640 , 480);
glMatrixMode(GL_PROJECTION);
glLoadIdentity();
gluOrtho2D(0 , 640 , 0 , 480);
}
int main(int argc, char **argv)
{
cout<<"Enter Two Points for Draw LineDDA:\n";
cout<<"\nEnter Point1( X1 , Y1):";
cin>>X1>>Y1;
cout<<"\nEnter Point2( X2 , Y2):";
cin>>X2>>Y2;

glutInit(&argc,argv);
glutInitDisplayMode(GLUT_SINGLE | GLUT_RGB);
glutInitWindowSize(640,480);
glutInitWindowPosition(0,0);
glutCreateWindow("LineDDA");
Init();
glutDisplayFunc(LineDDA);
glutMainLoop();
return 0;
}
Output:
Enter X1, Y1: 10, 10
Enter x2, Y2: 50, 50
Conclusion:
Hence, we have studied program for Line Drawing using DDA algorithm.
5 Program for Line Drawing using Bresenham’s algorithm using C and OpenGL.
Aim : Program for Line Drawing using Bresenham’s algorithm using C and OpenGL
Theory :
This algorithm seeks to select the optimum raster location to represents a
straight line. To achieve this, the algorithm always implemented by one unit in either x
or y directions depending on the slope of the line.
The increment in the other variables either 0 or 1, is determined by examining
the distance between the actual line location and the nearest grid location. This
distance is called the error and only error term is needed to be examined.
ALGORITHM
Step 1 : Read the line ends point (x1,y1,x2,y2) such that they are enot equal.
Step 2 : dx=x2-x1
Dy=y2-y1
Step 3 : Initialize sorting points
Step 4: e=2x.dy-dx
Step 5 : i=1
Step 6 : Plot(x,y)
Step 7: while(e>=0)
{
y=y+1
e=e-2.dx
}
x=x+1
e=e+2dy
Step 8: i=i+1
Step 9 :if(i<=dx)
Goto step 6
Step 10:stop
Program for Line Drawing using Bresenham’s algorithm using OpenGL
#include <iostream>
#include <math.h>
#include <GL/glut.h>
using namespace std;
GLdouble X1, Y1, X2, Y2;
void LineBres (void)
{
glClear(GL_COLOR_BUFFER_BIT);
int dx = abs (X1 - X2), dy = abs (Y1 - Y2);
int p = 2 * dy - dx;
int twoDy = 2 * dy, twoDyDx = 2 * (dy - dx);
int x, y, xEnd;
if (X1 > X2)
{
x = X2;
y = Y2;
xEnd = X1;
}
else
{
x = X1;
y = Y1;
xEnd = X2;
}
glBegin(GL_POINTS);
glVertex2d(x,y);
while (x < xEnd)
{
x++;
if (p < 0)
p += twoDy;
else
{
y++;
p += twoDyDx;
}
glVertex2d(x,y);
}
glEnd();
glFlush();
}
void Init()
{
//glClearColor(1.0,1.0,1.0,0);
//glColor3f(0.0,0.0,0.0);
glViewport(0 , 0 , 640 , 480);
glMatrixMode(GL_PROJECTION);
glLoadIdentity();
gluOrtho2D(0 , 640 , 0 , 480);
}
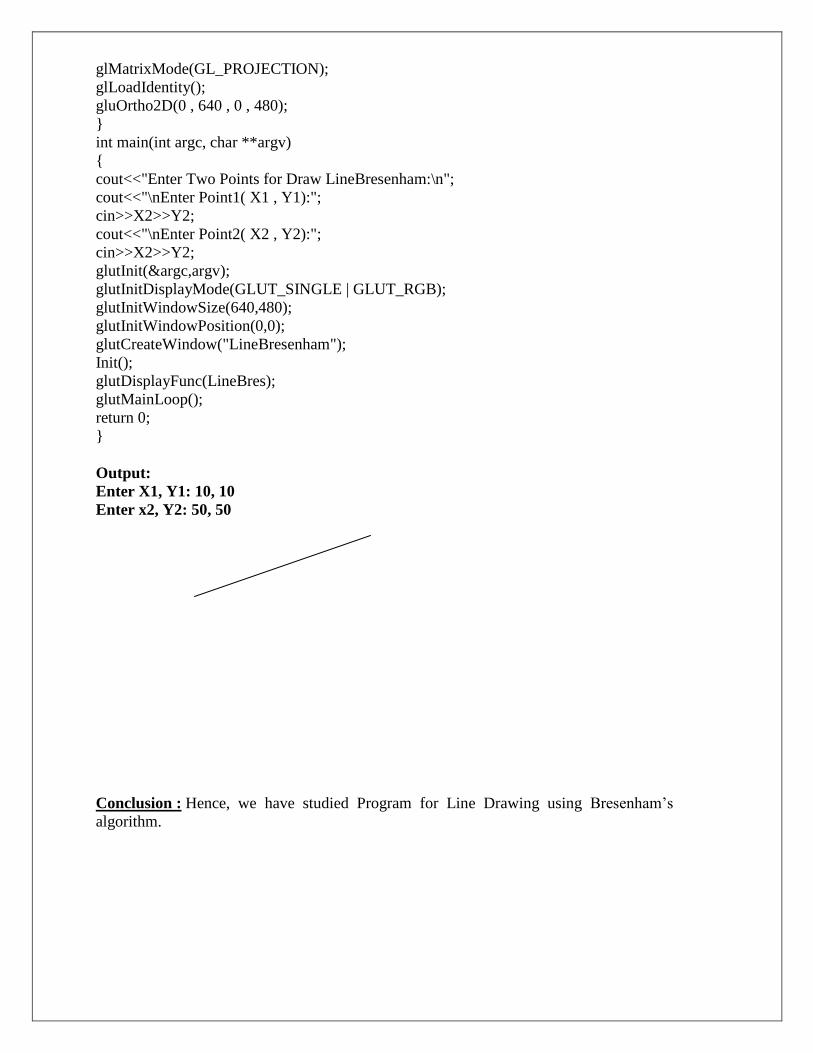
int main(int argc, char **argv)
{
cout<<"Enter Two Points for Draw LineBresenham:\n";
cout<<"\nEnter Point1( X1 , Y1):";
cin>>X2>>Y2;
cout<<"\nEnter Point2( X2 , Y2):";
cin>>X2>>Y2;
glutInit(&argc,argv);
glutInitDisplayMode(GLUT_SINGLE | GLUT_RGB);
glutInitWindowSize(640,480);
glutInitWindowPosition(0,0);
glutCreateWindow("LineBresenham");
Init();
glutDisplayFunc(LineBres);
glutMainLoop();
return 0;
}
Output:
Enter X1, Y1: 10, 10
Enter x2, Y2: 50, 50
Conclusion : Hence, we have studied Program for Line Drawing using Bresenham‟s
algorithm.
6 Programs using 2-D transformations in C.
Aim : Write a program for 2d Transformations – Translation, Scaling & Rotation
Theory :
2D Transformation :
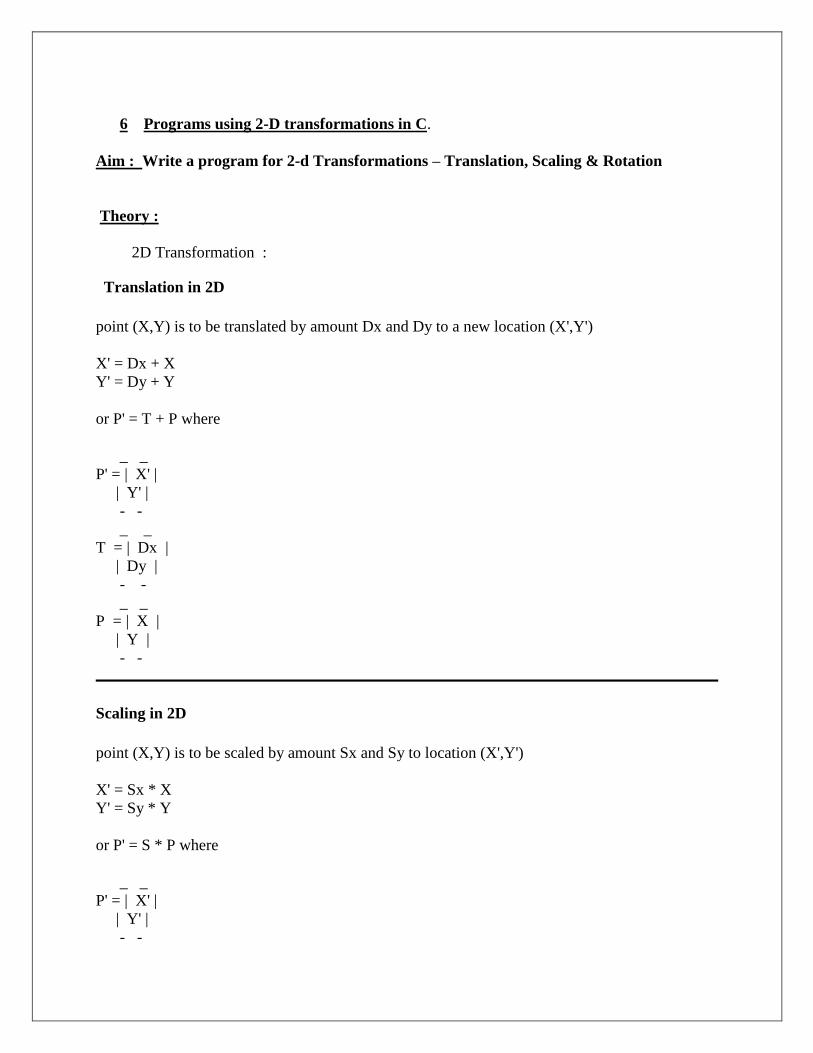
Translation in 2D
point (X,Y) is to be translated by amount Dx and Dy to a new location (X',Y')
X' = Dx + X
Y' = Dy + Y
or P' = T + P where
_ _
P' = | X' |
| Y' |
- -
_ _
T = | Dx |
| Dy |
- -
_ _
P = | X |
| Y |
- -
Scaling in 2D
point (X,Y) is to be scaled by amount Sx and Sy to location (X',Y')
X' = Sx * X
Y' = Sy * Y
or P' = S * P where
_ _
P' = | X' |
| Y' |
- -

_ _
S = | Sx 0 |
| 0 Sy |
- -
_ _
P = | X |
| Y |
- -
scaling is performed about the origin (0,0) not about the center of the line/polygon/whatever
Scale > 1 enlarge the object and move it away from the origin.
Scale = 1 leave the object alone
Scale< 1 shrink the object and move it towards the origin.
uniform scaling: Sx = Sy
differential scaling Sx != Sy -> alters proportions
Rotation in 2D
point (X,Y) is to be rotated about the origin by angle theta to location (X',Y')
X' = X * cos(theta) - Y * sin(theta)
Y' = X * sin(theta) + Y *cos(theta)
note that this does involve sin and cos which are much more costly than addition or
multiplication
or P' = R * P where
_ _
P' = | X' |
| Y' |
- -
_ _
R = | cos(theta) -sin(theta) |
| sin(theta) cos(theta) |
- -
_ _
P = | X |
| Y |
- -

/*2D Transformation*/
#include<stdio.h>
#include<conio.h>
#include<graphics.h>
void main()
{
int gd=DETECT,gm;
int x,y,x1,y1,tx,ty,tx1,ty1;
int ch,sx,sy,ang;
clrscr();
initgraph(&gd,&gm,"");
clrscr();
printf("\n Enter the cordinate of rectangle(left,top,right,bottom):");
scanf("%d%d%d%d",&x,&y,&x1,&y1);
setcolor(BLACK);
rectangle(x,y,x1,y1);
do
{
printf("TRANSFORMATION");
printf("\n1.translation\n2.scaling\n3.rotation\n4.exit");
printf("\nEnter your choice\n");
scanf("%d",&ch);
switch(ch)
{
case 1:
printf("translation:\n");
printf("enter translation distance(tx,ty,tx1,ty1):");
scanf("%d%d%d%d",&tx,&ty,&tx1,&ty1);
clrscr();
setcolor(BLACK);
rectangle((x+tx),(y+ty),(x1+tx1),(y1+ty1));
break;
case 2:
printf("\n Scalling:");
printf("\nEnter the scalling factor(sx,sy):");
scanf("%d%d",&sx,&sy);
clrscr();
setcolor(BLACK);
rectangle(x,y,(x1*sx),(y1*sy));
break;
case 3:
printf("\nROTATION");
printf("\nEnter the angles:");
scanf("%d",&ang);
clrscr();
setcolor(BLACK);
rectangle(x,y,((x*cos(ang))+(y*sin(ang))),((x*sin(ang))+(y*cos(ang))));
break;
case 4:
exit(0);
}
}while(ch!=4);
getch();
}
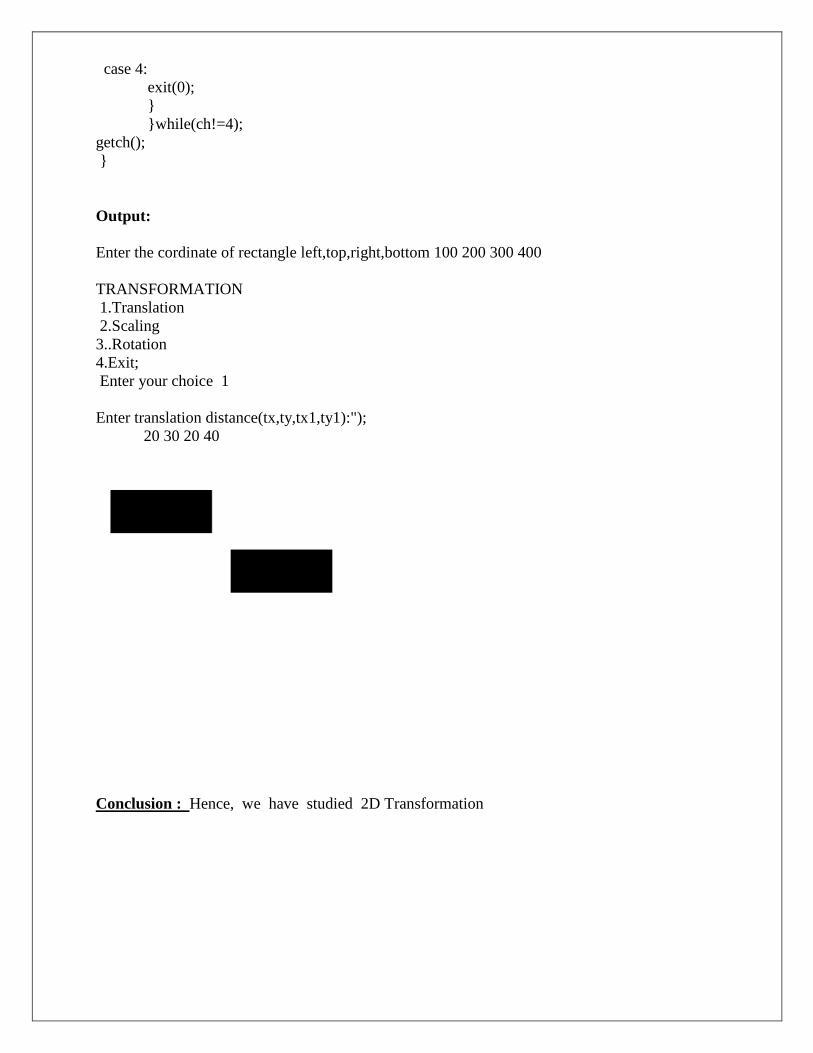
Output:
Enter the cordinate of rectangle left,top,right,bottom 100 200 300 400
TRANSFORMATION
1.Translation
2.Scaling
3..Rotation
4.Exit;
Enter your choice 1
Enter translation distance(tx,ty,tx1,ty1):");
20 30 20 40
Conclusion : Hence, we have studied 2D Transformation
7. Implement Polygon filling algorithms [Flood-Fill Algorithm] in C.
Aim : Implement Polygon filling algorithms [Flood-Fill Algorithm] in C.
Theory :
Polygon Filling :
Approaches used to fill polygon
1 )Seed Fill Approaches
2 algorithms: Boundary Fill and Flood Fill
works at the pixel level
suitable for interactive painting applications
2) Scan line Fill Approaches
works at the polygon level
better performance
Flood fill, also called seed fill, is an algorithm that determines the area connected to a
given node in a multi-dimensional array. It is used in the "bucket" fill tool of paint programs to
fill connected, similarly-colored areas with a different color, and in games such
as Go and Minesweeper for determining which pieces are cleared. When applied on an image to
fill a particular bounded area with color, it is also known as boundary fill.
#include stdio.h
#include conio.h
#include graphics.h
#include dos.h
void flood(int,int,int,int);
void main()
{
int gd,gm=DETECT;
clrscr();
detectgraph(&gd,&gm);
initgraph(&gd,&gm,”c:\\tc\\bgi”);
rectangle(50,50,100,100);
flood(55,55,12,0);
getch();
}
void flood(int x,int y, int fill_col, int old_col)
{
if(getpixel(x,y)==old_col)
{
delay(10);
putpixel(x,y,fill_col);
flood(x+1,y,fill_col,old_col);
flood(x-1,y,fill_col,old_col);
flood(x,y+1,fill_col,old_col);
flood(x,y-1,fill_col,old_col);
}
}
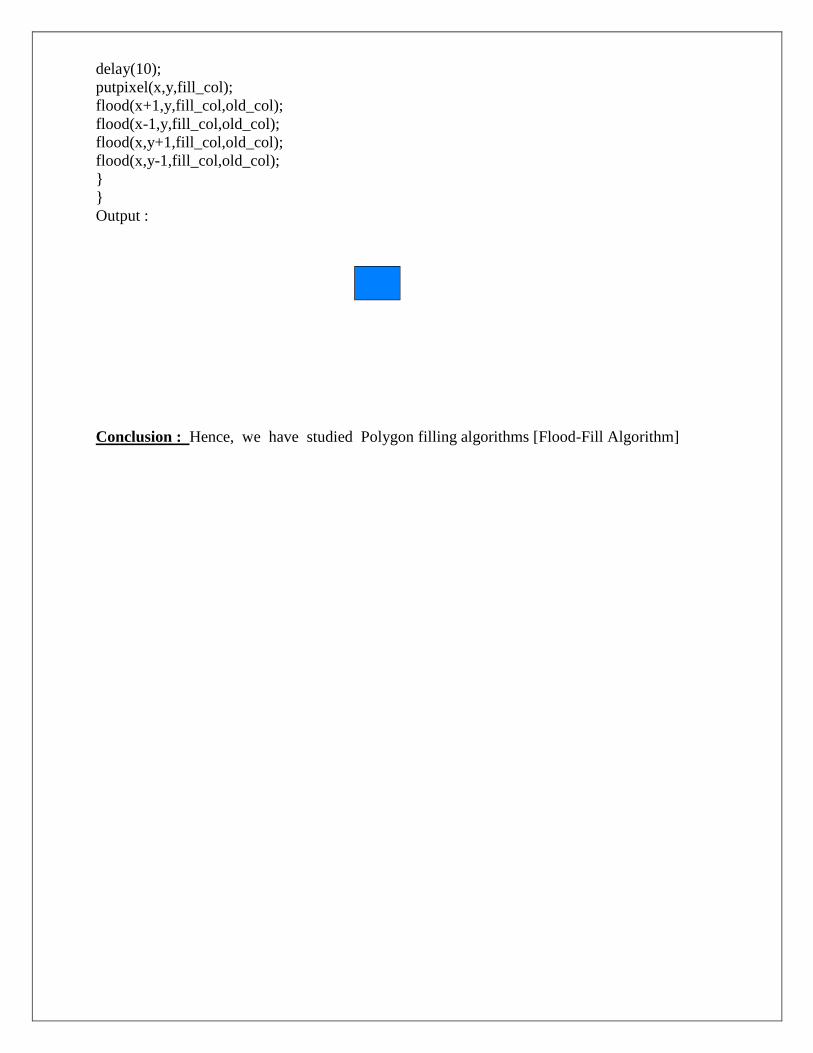
Output :
Conclusion : Hence, we have studied Polygon filling algorithms [Flood-Fill Algorithm]
8 Programs to study window to viewport transformations in C.
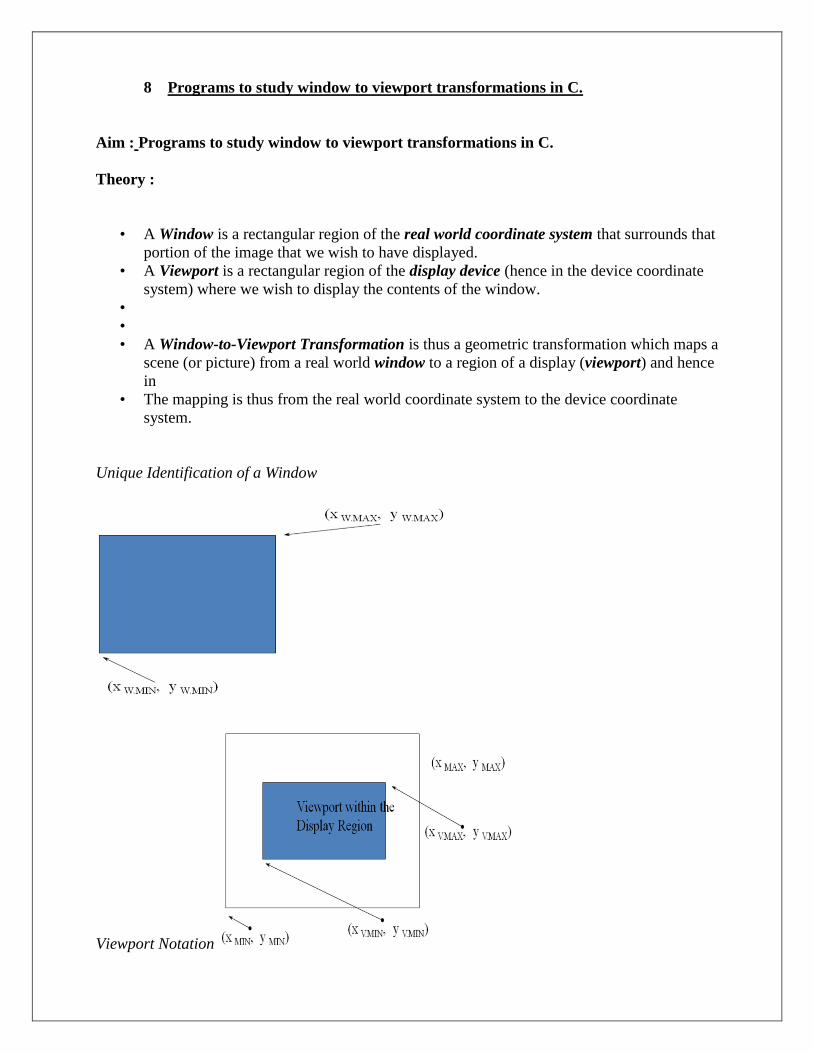
Aim : Programs to study window to viewport transformations in C.
Theory :
• A Window is a rectangular region of the real world coordinate system that surrounds that
portion of the image that we wish to have displayed.
• A Viewport is a rectangular region of the display device (hence in the device coordinate
system) where we wish to display the contents of the window.
•
•
• A Window-to-Viewport Transformation is thus a geometric transformation which maps a
scene (or picture) from a real world window to a region of a display (viewport) and hence
in
• The mapping is thus from the real world coordinate system to the device coordinate
system.
Unique Identification of a Window
Viewport Notation

The Aspect Ratio of any rectangle is the ratio:
(height of the rectangle) / (width of the rectangle)
It is important for transformations from real world scenes to display with the same aspect ratio as
any change in the aspect ratio may alter the appearance of the displayed object.
Where the aspect ration is not maintained, shapes such as a circle may appear in the viewport as
an ellipse, a square may appear as a rectangle etc.
Conclusion : Hence, we have studied window to viewport transformations in C
„
9. Program for Cohen Sutherland Line clipping algorithm in C.
Aim : Program for Cohen Sutherland Line clipping algorithm in C.
Theory
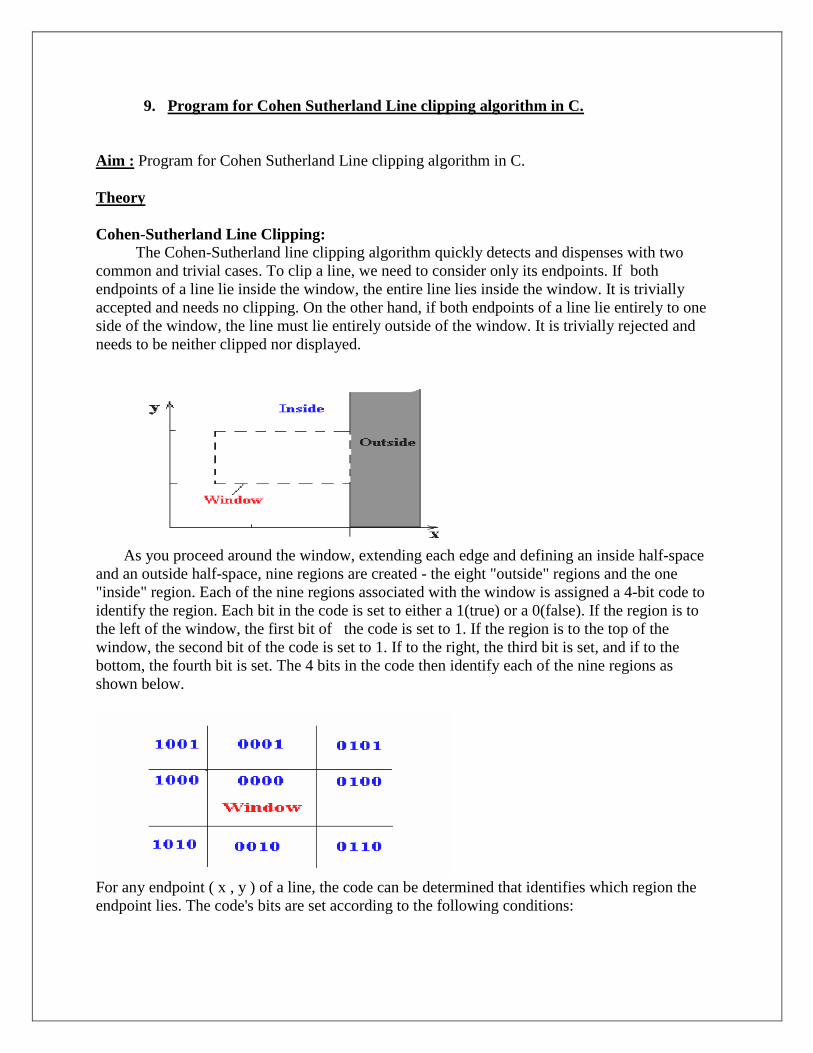
CohenSutherland Line Clipping:
The CohenSutherland line clipping algorithm quickly detects and dispenses with two
common and trivial cases. To clip a line, we need to consider only its endpoints. If both
endpoints of a line lie inside the window, the entire line lies inside the window. It is trivially
accepted and needs no clipping. On the other hand, if both endpoints of a line lie entirely to one
side of the window, the line must lie entirely outside of the window. It is trivially rejected and
needs to be neither clipped nor displayed.
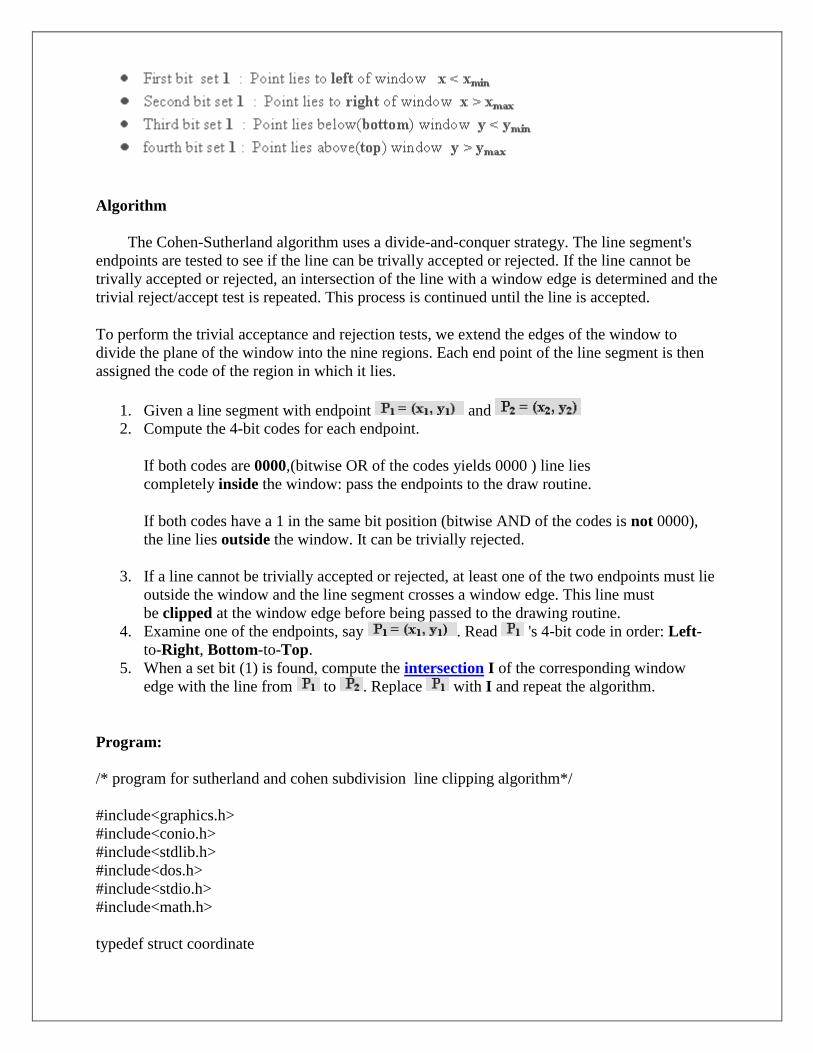
As you proceed around the window, extending each edge and defining an inside halfspace
and an outside halfspace, nine regions are created the eight "outside" regions and the one
"inside" region. Each of the nine regions associated with the window is assigned a 4bit code to
identify the region. Each bit in the code is set to either a 1(true) or a 0(false). If the region is to
the left of the window, the first bit of the code is set to 1. If the region is to the top of the
window, the second bit of the code is set to 1. If to the right, the third bit is set, and if to the
bottom, the fourth bit is set. The 4 bits in the code then identify each of the nine regions as
shown below.
For any endpoint ( x , y ) of a line, the code can be determined that identifies which region the
endpoint lies. The code's bits are set according to the following conditions:
Algorithm
The Cohen-Sutherland algorithm uses a divide-and-conquer strategy. The line segment's
endpoints are tested to see if the line can be trivally accepted or rejected. If the line cannot be
trivally accepted or rejected, an intersection of the line with a window edge is determined and the
trivial reject/accept test is repeated. This process is continued until the line is accepted.
To perform the trivial acceptance and rejection tests, we extend the edges of the window to
divide the plane of the window into the nine regions. Each end point of the line segment is then
assigned the code of the region in which it lies.
1. Given a line segment with endpoint and
2. Compute the 4-bit codes for each endpoint.
If both codes are 0000,(bitwise OR of the codes yields 0000 ) line lies
completely inside the window: pass the endpoints to the draw routine.
If both codes have a 1 in the same bit position (bitwise AND of the codes is not 0000),
the line lies outside the window. It can be trivially rejected.
3. If a line cannot be trivially accepted or rejected, at least one of the two endpoints must lie
outside the window and the line segment crosses a window edge. This line must
be clipped at the window edge before being passed to the drawing routine.
4. Examine one of the endpoints, say . Read 's 4-bit code in order: Left-
to-Right, Bottom-to-Top.
5. When a set bit (1) is found, compute the intersection I of the corresponding window
edge with the line from to . Replace with I and repeat the algorithm.
Program:
/* program for sutherland and cohen subdivision line clipping algorithm*/
#include<graphics.h>
#include<conio.h>
#include<stdlib.h>
#include<dos.h>
#include<stdio.h>
#include<math.h>
typedef struct coordinate
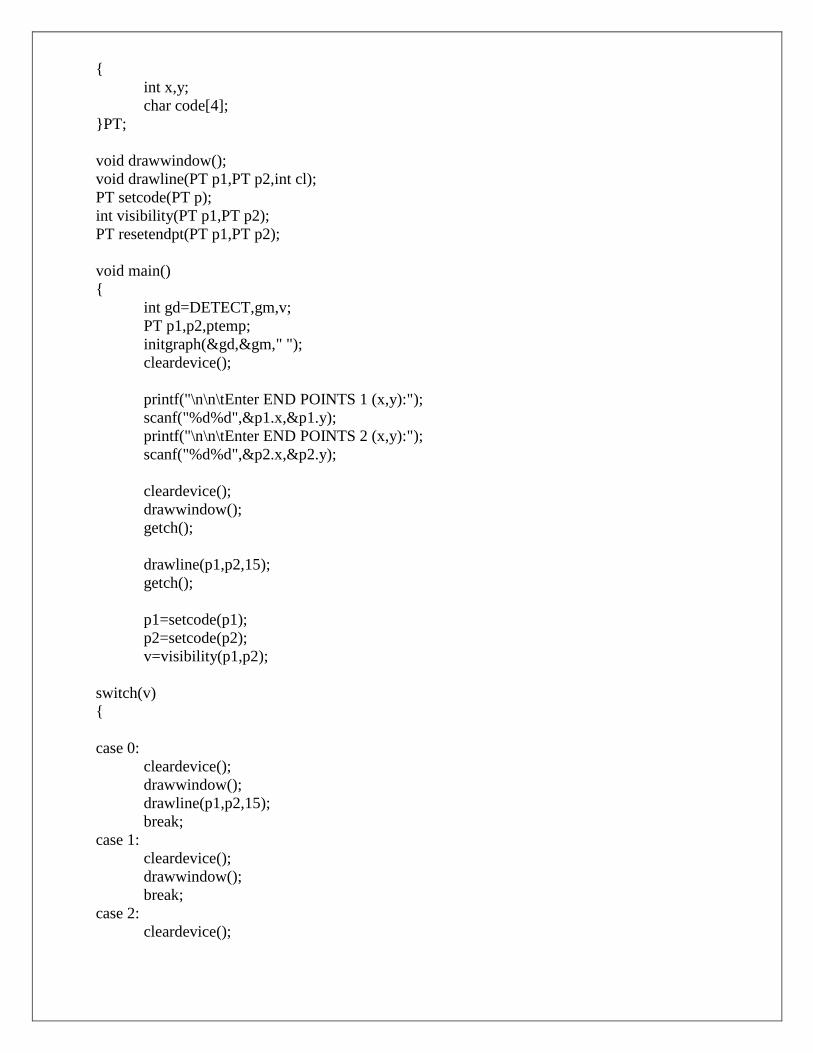
{
int x,y;
char code[4];
}PT;
void drawwindow();
void drawline(PT p1,PT p2,int cl);
PT setcode(PT p);
int visibility(PT p1,PT p2);
PT resetendpt(PT p1,PT p2);
void main()
{
int gd=DETECT,gm,v;
PT p1,p2,ptemp;
initgraph(&gd,&gm," ");
cleardevice();
printf("\n\n\tEnter END POINTS 1 (x,y):");
scanf("%d%d",&p1.x,&p1.y);
printf("\n\n\tEnter END POINTS 2 (x,y):");
scanf("%d%d",&p2.x,&p2.y);
cleardevice();
drawwindow();
getch();
drawline(p1,p2,15);
getch();
p1=setcode(p1);
p2=setcode(p2);
v=visibility(p1,p2);
switch(v)
{
case 0:
cleardevice();
drawwindow();
drawline(p1,p2,15);
break;
case 1:
cleardevice();
drawwindow();
break;
case 2:
cleardevice();
p1=resetendpt(p1,p2);
p2=resetendpt(p2,p1);
drawwindow();
drawline(p1,p2,15);
break;
}
getch();
closegraph();
}
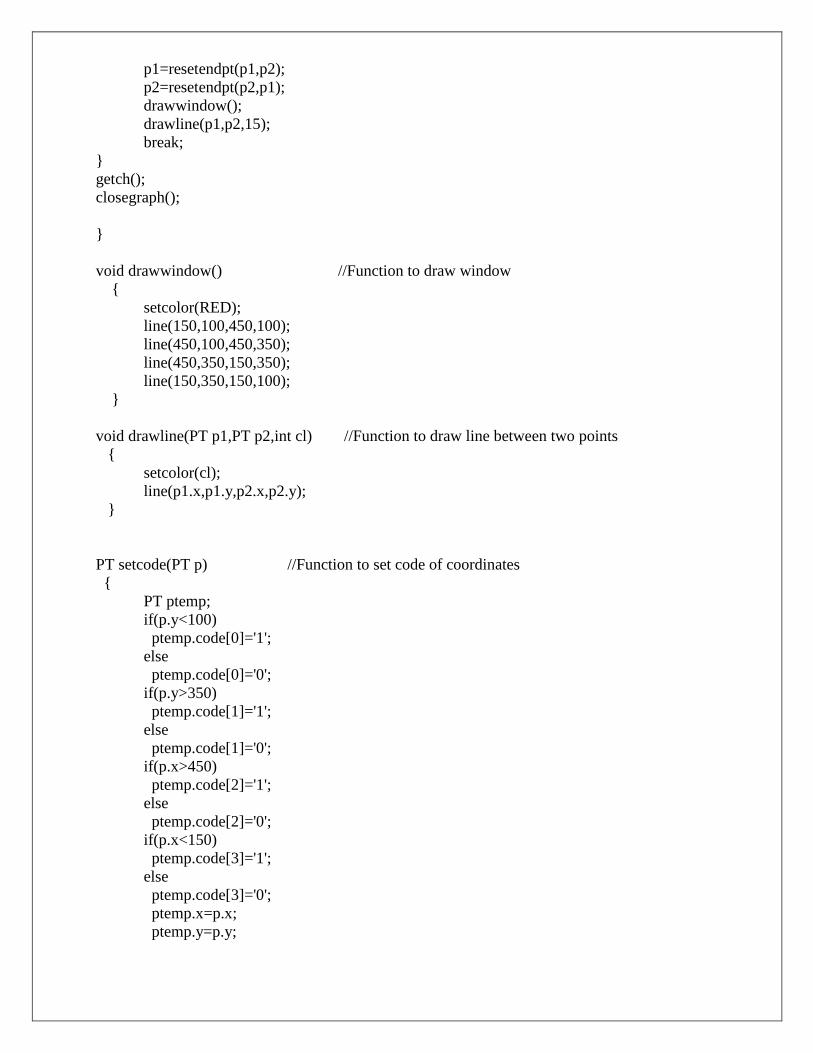
void drawwindow() //Function to draw window
{
setcolor(RED);
line(150,100,450,100);
line(450,100,450,350);
line(450,350,150,350);
line(150,350,150,100);
}
void drawline(PT p1,PT p2,int cl) //Function to draw line between two points
{
setcolor(cl);
line(p1.x,p1.y,p2.x,p2.y);
}
PT setcode(PT p) //Function to set code of coordinates
{
PT ptemp;
if(p.y<100)
ptemp.code[0]='1';
else
ptemp.code[0]='0';
if(p.y>350)
ptemp.code[1]='1';
else
ptemp.code[1]='0';
if(p.x>450)
ptemp.code[2]='1';
else
ptemp.code[2]='0';
if(p.x<150)
ptemp.code[3]='1';
else
ptemp.code[3]='0';
ptemp.x=p.x;
ptemp.y=p.y;
return(ptemp);
}
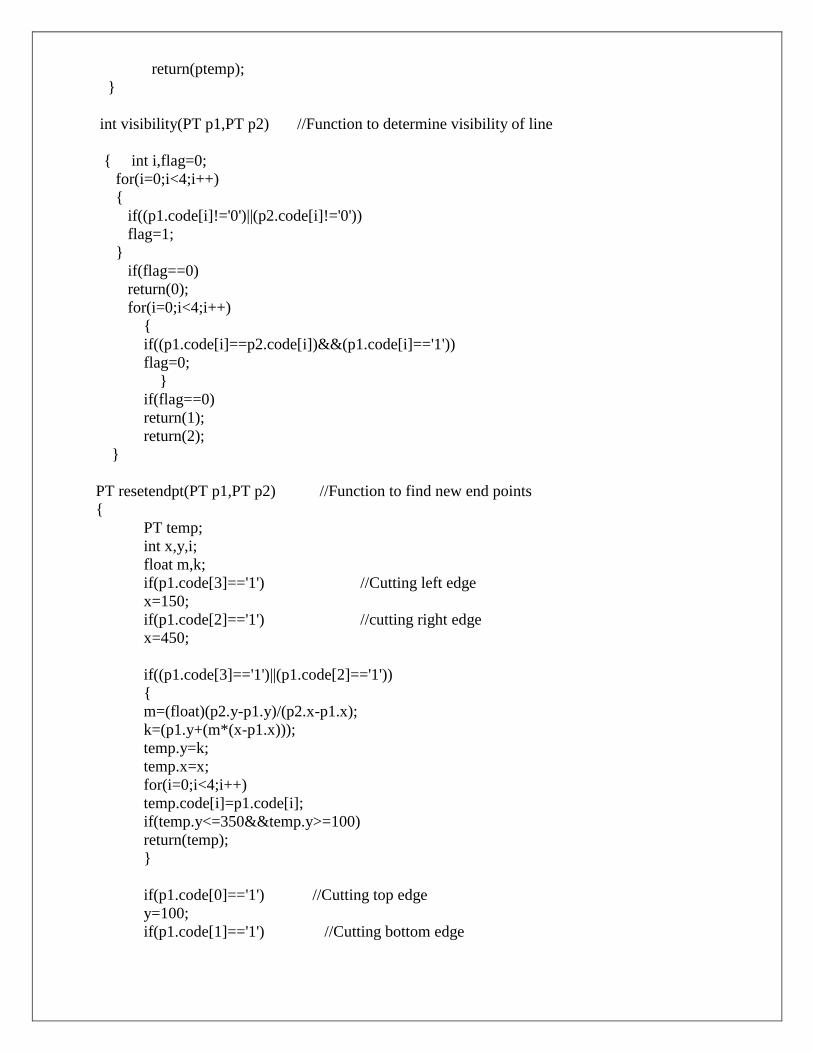
int visibility(PT p1,PT p2) //Function to determine visibility of line
{ int i,flag=0;
for(i=0;i<4;i++)
{
if((p1.code[i]!='0')||(p2.code[i]!='0'))
flag=1;
}
if(flag==0)
return(0);
for(i=0;i<4;i++)
{
if((p1.code[i]==p2.code[i])&&(p1.code[i]=='1'))
flag=0;
}
if(flag==0)
return(1);
return(2);
}
PT resetendpt(PT p1,PT p2) //Function to find new end points
{
PT temp;
int x,y,i;
float m,k;
if(p1.code[3]=='1') //Cutting left edge
x=150;
if(p1.code[2]=='1') //cutting right edge
x=450;
if((p1.code[3]=='1')||(p1.code[2]=='1'))
{
m=(float)(p2.y-p1.y)/(p2.x-p1.x);
k=(p1.y+(m*(x-p1.x)));
temp.y=k;
temp.x=x;
for(i=0;i<4;i++)
temp.code[i]=p1.code[i];
if(temp.y<=350&&temp.y>=100)
return(temp);
}
if(p1.code[0]=='1') //Cutting top edge
y=100;
if(p1.code[1]=='1') //Cutting bottom edge

y=350;
if((p1.code[0]=='1')||(p1.code[1]=='1'))
{
m=(float)(p2.y-p1.y)/(p2.x-p1.x);
k=(float)p1.x+(float)(y-p1.y)/m;
temp.x=k;
temp.y=y;
for(i=0;i<4;i++)
temp.code[i]=p1.code[i];
return(temp);
}
else
return(p1);
}
Output : :
Enter the End point 1(x,y) 70 80
Enter the End point 2(x,y) 250 280
Conclusion : Hence, we have studied cohen Sutherland line clipping algorithm
10 .Programs to study 3-D transformations in C.
Aim : Programs to study 3-D transformations in C.
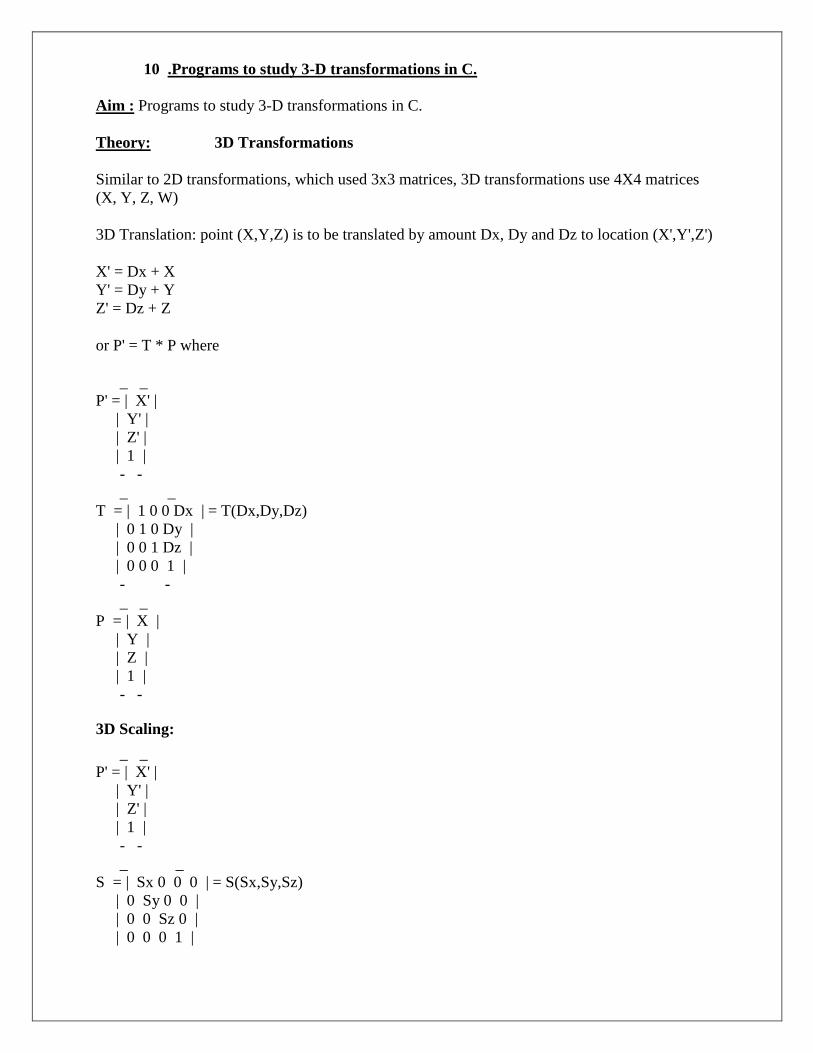
Theory: 3D Transformations
Similar to 2D transformations, which used 3x3 matrices, 3D transformations use 4X4 matrices
(X, Y, Z, W)
3D Translation: point (X,Y,Z) is to be translated by amount Dx, Dy and Dz to location (X',Y',Z')
X' = Dx + X
Y' = Dy + Y
Z' = Dz + Z
or P' = T * P where
_ _
P' = | X' |
| Y' |
| Z' |
| 1 |
- -
_ _
T = | 1 0 0 Dx | = T(Dx,Dy,Dz)
| 0 1 0 Dy |
| 0 0 1 Dz |
| 0 0 0 1 |
- -
_ _
P = | X |
| Y |
| Z |
| 1 |
- -
3D Scaling:
_ _
P' = | X' |
| Y' |
| Z' |
| 1 |
- -
_ _
S = | Sx 0 0 0 | = S(Sx,Sy,Sz)
| 0 Sy 0 0 |
| 0 0 Sz 0 |
| 0 0 0 1 |
- -
_ _
P = | X |
| Y |
| Z |
| 1 |
- -
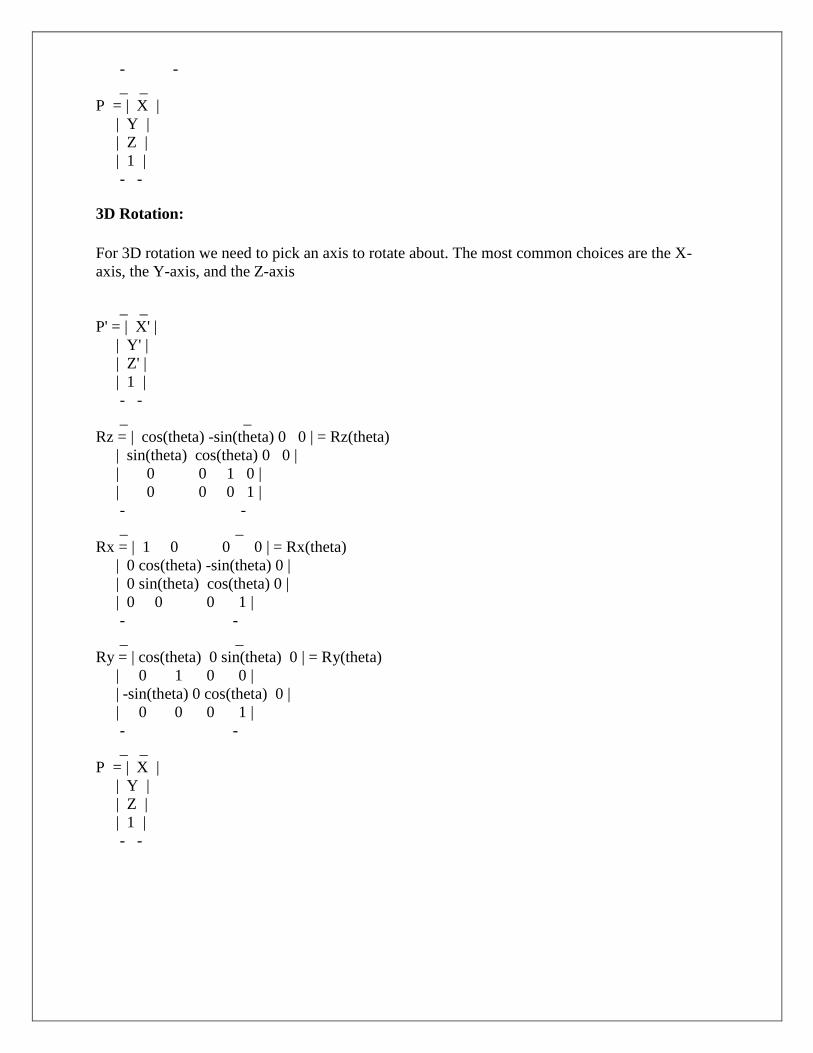
3D Rotation:
For 3D rotation we need to pick an axis to rotate about. The most common choices are the X-
axis, the Y-axis, and the Z-axis
_ _
P' = | X' |
| Y' |
| Z' |
| 1 |
- -
_ _
Rz = | cos(theta) -sin(theta) 0 0 | = Rz(theta)
| sin(theta) cos(theta) 0 0 |
| 0 0 1 0 |
| 0 0 0 1 |
- -
_ _
Rx = | 1 0 0 0 | = Rx(theta)
| 0 cos(theta) -sin(theta) 0 |
| 0 sin(theta) cos(theta) 0 |
| 0 0 0 1 |
- -
_ _
Ry = | cos(theta) 0 sin(theta) 0 | = Ry(theta)
| 0 1 0 0 |
| -sin(theta) 0 cos(theta) 0 |
| 0 0 0 1 |
- -
_ _
P = | X |
| Y |
| Z |
| 1 |
- -
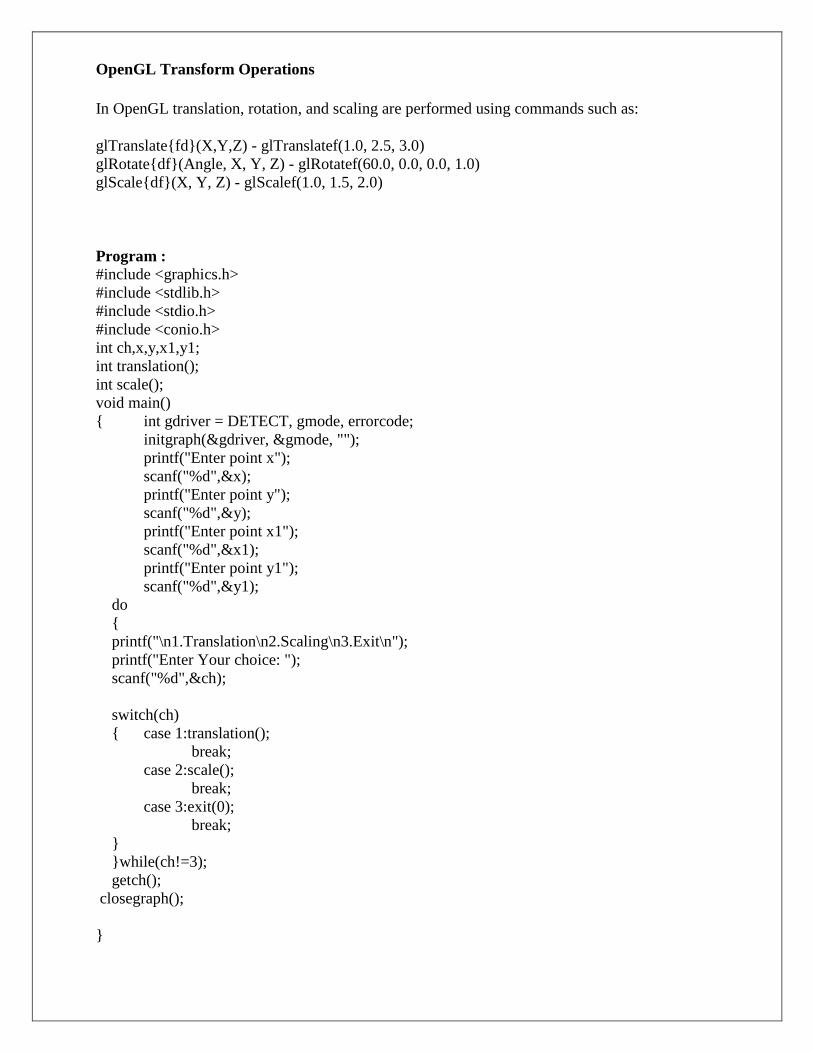
OpenGL Transform Operations
In OpenGL translation, rotation, and scaling are performed using commands such as:
glTranslate{fd}(X,Y,Z) - glTranslatef(1.0, 2.5, 3.0)
glRotate{df}(Angle, X, Y, Z) - glRotatef(60.0, 0.0, 0.0, 1.0)
glScale{df}(X, Y, Z) - glScalef(1.0, 1.5, 2.0)
Program :
#include <graphics.h>
#include <stdlib.h>
#include <stdio.h>
#include <conio.h>
int ch,x,y,x1,y1;
int translation();
int scale();
void main()
{ int gdriver = DETECT, gmode, errorcode;
initgraph(&gdriver, &gmode, "");
printf("Enter point x");
scanf("%d",&x);
printf("Enter point y");
scanf("%d",&y);
printf("Enter point x1");
scanf("%d",&x1);
printf("Enter point y1");
scanf("%d",&y1);
do
{
printf("\n1.Translation\n2.Scaling\n3.Exit\n");
printf("Enter Your choice: ");
scanf("%d",&ch);
switch(ch)
{ case 1:translation();
break;
case 2:scale();
break;
case 3:exit(0);
break;
}
}while(ch!=3);
getch();
closegraph();
}

int translation()
{ int t;
printf("Enter point t");
scanf("%d",&t);
bar3d(x, y, x1,y1, 5, 1);
x=x+t;
y=y+t;
x1=x1+t;
y1=y1+t;
bar3d(x, y, x1,y1, 5, 1);
return(0);
}
int scale()
{ int s;
printf("Enter point s");
scanf("%d",&s);
bar3d(x,y,x1,y1,5,1);
x1 = x*s;
y1 = y*s;
bar3d(x,y,x1,y1,5,1);
return(0);
}
Output :
Enter point x 100
Enter point y 200
Enter point x1 300
Enter point y1 400
1 Translation
2 Scaling
3 Exit
Enter choice 2
Enter point s 20
Conclusion : Hence, we have studied 3D transformation