promedics.de laboratory testing of pressio® 2 intracranial pressure monitorthe new pressio® 2 icp...
TRANSCRIPT

Laboratory Testing of Pressio® 2 Intracranial Pressure
Monitor
Marek Czosnyka, PhD, Peter Smielewski, PhD Zofia Czosnyka, PhD,
Cambridge Shunt Evaluation Laboratory & Academic Neurosurgical
Unit, Addenbrooke’s Hospital, P.O. Box 167, Hills Road, Cambridge
CB2 2QQ, UK
Address for correspondence:
Dr. Marek Czosnyka Academic Neurosurgical Unit BOx 167, Addenbrooke’s Hospital Cambridge CB2 2QQ, UK fax: +44 1223 216926 E-mail: [email protected]

ABSTRACT
Objectives: The aim of this evaluation is to provide extensive bench testing to
evaluate the Pressio® 2 ICP Monitoring System. Where it was possible
absolute accuracy was assessed, otherwise comparison to Codman Express
ICP transducer and monitor was studied
Design: Drift of pressure measurement over 7 days, drift with temperature,
frequency response and accuracy of measurement of both static and pulsatile
pressures have been tested simultaneously in Pressio® 2 and Codman
transducers using a standard laboratory rig. Connectivity of the systems was
also assessed.
Results Long term (10 days) zero drift was less than 2 mm Hg in both
transducers. Temperature drift of Pressio® 2 was low (0.2 mmHg per 20oC).
The frequency bandwidth of the Pressio® 2 was 20 Hz (relative to Codman
transducer).
Absolute static accuracy of Pressio® 2 was better than 2 mm Hg over the range
from -30 to 120 mm Hg. Pulse waveform accuracy (relative to Codman) was
better than 0.2 mm Hg over the range from 1 mm Hg to 20 mm Hg. The
frequency bandwidth of the Pressio® 2 was 17 Hz (relative to Codman
transducer).
Long term (10 days) zero drift was less than 2 mm Hg in both transducers.
Temperature drift of Pressio® 2 was low (0.2 mmHg per 20oC). Pressio® 2 ICP
Monitor can transmit data directly to external computer without use of pressure
transducer bridge amplifier with the resolution of 0.1 mm Hg. It is ‘ICM+’
compatibkle.
Conclusion: The new Pressio® 2 ICP Monitor has good accuracy as far as
both static and dynamic ICP measurement is concerned, low zero and
temperature drift and excellent frequency properties. The monitor is absolutely
comparable with Codman Express Monitor and may be, from metrological point
of view, used as an alternative in clinical ICP monitoring

INTRODUCTION
Introduction of intracranial pressure (ICP) microtransducers revolutionized intensive
care long term monitoring of ICP. Increased rate of infections seen after two-three days
of monitoring through ventricular drain (or EVD) has decreased dramatically [1].
Frequency properties of microtransducers are much better than water filled manometer
lines with external transducers, allowing more precise waveform analysis [2]. A potential
weak point of microtransducers is that they do not offer any possibility to check and
correct a zero drift, a possibility which is always available in external transducers.
Another problem is associated with the site of measurement. While fluid-filled external
transducers measure CSF pressure in ventricles (also in lumbar CSF space; and less
frequently: in subarachnoid space on brain convexity), microtransducers in most cases
are inserted intraparenchymally. Pressure in CSF, according to Pascal’s law, is
uniform through the brain (provided that there is no major blockage in CSF circulation).
It is, in horizontal body position, the same through the whole CNS axis. Obviously, in
non-horizontal position CSF hydrostatic gradients should be accounted for. As
microtransducers measure intraparenchymal pressure, pressure gradients may be
observed. They may be, in extreme situations, as great as 20 mm Hg [3].
Intraparenchymal transducers measure stress in brain tissue rather than CSF pressure!
A program of laboratory assessment of metrological properties of various ICP
transducers has been carried out systematically in Cambridge Shunt Evaluation
Laboratory since 1996. Among the known microtransducers we tested Codman [2,4],
Camino [2], Pressio [5] and InnerSpace [2]. A new version of Pressio®ICP monitor is
currently being launched (called Pressio® 2 ICP Monitor, software version V3.25) and
the evaluation program was repeated to confirm the metrological properties of new
Pressio® 2 ICP monitoring system .

Figure 1. View of Pressio® 2 ICP Monitor
The new Pressio® 2 ICP Monitoring System (sensor and monitor) manufactured by
Sophysa SA includes a strain-gauge microtransducer and a digital multifunction monitor
for displaying current value of ICP, ICP waveform and time trends in variable time
scales, and transmitting analog differential signal to bed-side monitoring system
(transducer input) or, optionally via Micro USB port, to external computer.
Within Pressio® 2 microtransducer both ICP and temperature probes are contained-
therefore both ICP and brain temperature can be monitored with one microtransducer.
The aim of this evaluation is to provide extensive bench testing to compare the
Pressio® 2 ICP Monitor to the Codman ICP transducer, previously evaluated in our
laboratory [2]. A long-term (7 days) and a temperature drift, a frequency response
characteristics, the accuracy of measurement of static and pulsatile pressures, and
other properties were studied. Accuracy of temperature sensor was not assessed.

METHODS
The testing rig, as described in [5] is shown in Fig. 2
Figure 2. Testing rig. Elements are explained in the text
Two fresh transducers: Pressio and Codman were zeroed according to the
manufacturer’s recommendations and sealed in the model the cerebrospinal fluid (CSF)
space, a wide-necked feeding bottle (270 ml, BOOTS,UK) filled with deionised water
(mimicking CSF). Compliance of the system was mimicked by leaving approximately 20
ml of air. In dynamic measurement the compliance was further reduced by excluding
any remaining air. The model also included a resistance to CSF outflow in the form of a
lumbar puncture needle, giving a resistance to CSF flow of 7.4 mmHg ml-1min-1, within
the 6-10 mmHg range found in humans.
The bottle was submerged horizontally in a water bath with the stabilised temperature.
Static pressure was produced by a water column in a graded vertical tube (1.5 m high).
A pulsatile pressure waveform of fundamental frequency, controlled from the waveform

generator was applied using a Pressure System Calibrator (Biotek Instruments Inc.,
Winooski, VT). Additionally, a fluid infusion at a variable rate was performed to gradually
increase the pressure inside the tubing.
The Codman Transducer was connected to the Codman ICP Express and the
Pressio®probe was connected to the Pressio® 2 ICP Monitor. The electrical output
(transducer) from Codman ICP Express was connected to the Spiegelberg CPP Brain
Pressure monitor. The digital outputs of the two monitors were connected to computer
running ICM+ software (http://www.neurosurg.cam.ac.uk/icmplus ).
Signals were sampled with a frequency of 100 Hz. Digital spectral analysis was
performed using a 512 point FFT algorithm. The amplitudes of the fundamental
harmonics of periodic waveforms (amplitude and frequency) were calculated using high
precision interpolation algorithm. The mean values of the measured pressures were
calculated as an average of 512 consecutive samples. The power of the higher
harmonics were calculated as the averaged power spectra from 1.5 of the fundamental
frequency to 30 Hz. One minute average values of the calculated parameters from over
20 consecutive epochs were computed, displayed and stored on hard disc. Data were
than exported to a commercial statistical package (Statgraphic+, Manugistic, Rockville,
MD) for final calculations.

RESULTS.
Absolute Static Accuracy of Pressio ® 2
Relationship between reference water column and reading of Pressio® 2 ICP Monitor is
presented in Figure 3. Characteristic is linear (better than 0.5% to best fit straight line), R2=0.998,
95% average confidence limits for mean less than +/-0.98 mm Hg at all steps (on a basis of
N=10 repetitions). Absolute accuracy of ICP Monitor in static conditions (reference pressure
measured as a water column) is better than 2 mmHg within the range -30 to 120 mm Hg –Figure
4. Calculated random accuracy (+/-2*SD) for a single measurement is less than 1.4 mm Hg.
Figure 3. 95% confidence intervals for Pressio® 2 readings (Pressio- along y axis) compared with reference pressure scaled in mm Hg (water column).

Figure 4. Equivalent Bland-Altman plot of data presented on Fig 4. Along axis- difference of reading of Pressio® 2 monitor minus water column (scaled in mmHg)
Static relationship between Pressio® 2 and Codman reading
Comparison between static accuracy Pressio® 2 ICP Monitor versus Codman shows average x-
y relationship with very high R value (R2= 0.9998; slope of regression line 0.999)- see Figure 5
Figure 5. Static comparison between Pressio® 2 and Codman (Pressio- signal from Pressio® 2 monitor, Codman- signal from Codman Express) . Pressure was modulated by stepwise increasing flow rate from infusion pump and opened model for resistance to CSF outflow. Time scale- around 60 minutes.

The tests were repeated over one week. No discrepancy between reading of day 1 and day 7
was noted (with exception of zero drift- addressed in subsequent points): correlation was on the
level of 0.9998, and slope of regression was unchanged.
Dynamic Accuracy- Pressio® 2 relative to Codman
Recordings of pulsatile component of pressure was started from comparison of accuracy of pulse
amplitude detected from pressure waveform of fixed frequency (2Hz) sine waveform- Figure6 .
Amplitude of Pressio® 2 ICP Monitor and Codman ICP Express were correlated with each other
within range from 2 mm Hg peak-to-peak to 50 mm Hg peak-to peak (correlation R2= 0.998;
slope (Pressio: Codman)= 1.02)
Figure 6. Recording of sinusoidal waveform of frequency 2Hz. (Pressio- signal from
Pressio® 2 monitor, Codman- signal from Codman Express)
Triangular waveform showed slightly greater Pressio® 2 reading compared to Codman -- Figure
7. At peak of triangular waveform Pressio® 2 reading of 30 is associated with Codman reading
of 28.7 mm Hg. Linearity is better than 0.1% BFSL and there is no hysteresis.

Figure 7. Comparison of dynamic readings of triangular waveform (Pressio- signal
from Pressio® 2 monitor- red, Codman- signal from Codman Express-green). On tops,
reading from Pressio® 2 ICP Monitor was slightly greater than from Codman (less than
1.5 mm Hg), with overall Codman-Pressio® 2 characteristic showing high correlation with
readings from Codman monitor (R2 =0.9998) and very good linearity.
At very low amplitude of pressure pulsations (lower than <1.5 mm Hg). both transducers
showed distortion of reading due to quantization error 0.1 mm Hg- Figure 8. This precludes using
methods for morphological waveform analysis like MOCAIP [6]
Figure 8. For low amplitude of pressure pulsations (<1.5 mm Hg), quantization error (0.1
mm Hg) precludes application of precision techniques of pulse waveform analysis. (ICP-
signal from Pressio® 2 monitor)

Impulse response (step increase in pressure) indicates good agreement between Codman and
Pressio® 2 ICP Monitor (Figure 9). Output of Codman leads Pressio® 2 by around 10
milliseconds. However, such a delay is negligible in clinical applications.
Figure 9. Impulse response of Pressio® 2 (red) and Codman (green). Codman is leading
by 10 ms
Frequency response was tested from 2 to 25 Hz. Amplitude of Pressio® 2 ICP Monitor
waveform and Codman were in good agreement until 14 Hz, then Codman started to
underestimate amplitude, reaching ratio Pressio® 2 /Codman 1.25 at 25 Hz (Figure 10). Both
transducers have good frequency resolution up to 17 Hz- which allows high frequency waveform
analysis of ICP pulse wave.

Figure 10. Frequency characteristics Pressio® 2/Codman. Amplitude Pressio is a
amplitude of sinusoidal signal from Pressio®2 monitor, and Amplitude Codman-
amplitude of sinusoidal signal from Codman Express
Drift
Long term drift was the same at 0 mm Hg as on 17 mm mmHg and was limited to <1.5 mm Hg
over 10 days- see Figure 11. Wider signal envelope from Codman suggests that noise at the
baseline is greater than in Pressio®2 monitor

Figure 11. Long term drift from both transducers during 10 days. (Pressio- signal from
Pressio® 2 monitor, Codman- signal from Codman Express)
Slow frequency noise from Codman was 5 times greater than from Pressio® 2 ICP Monitor
(Standard deviation 0.15 mm Hg versus 0.015 mm Hg- see Figure 12
Figure 12. Slow frequency noise from Pressio® 2 and Codman (calculated as moving
standard deviation of 30 ten second averaged values at mean pressure 17 mm Hg). Noise
from Codman was approximately 10 times greater than from Pressio® 2. (Pressio- signal
from Pressio® 2 monitor, Codman- signal from Codman Express, Slow Presio- moving
averaged signal from Pressio® 2 monitor, Slow Codman- moving averaged signal from )
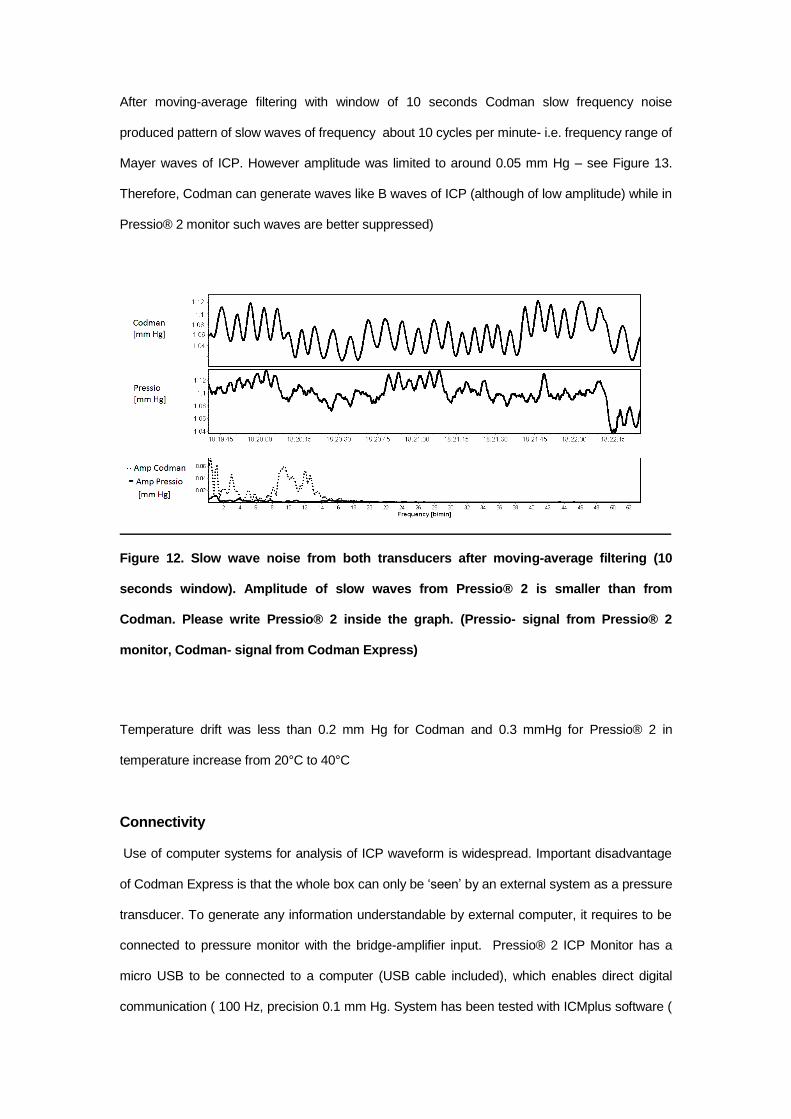
After moving-average filtering with window of 10 seconds Codman slow frequency noise
produced pattern of slow waves of frequency about 10 cycles per minute- i.e. frequency range of
Mayer waves of ICP. However amplitude was limited to around 0.05 mm Hg – see Figure 13.
Therefore, Codman can generate waves like B waves of ICP (although of low amplitude) while in
Pressio® 2 monitor such waves are better suppressed)
Figure 12. Slow wave noise from both transducers after moving-average filtering (10
seconds window). Amplitude of slow waves from Pressio® 2 is smaller than from
Codman. Please write Pressio® 2 inside the graph. (Pressio- signal from Pressio® 2
monitor, Codman- signal from Codman Express)
Temperature drift was less than 0.2 mm Hg for Codman and 0.3 mmHg for Pressio® 2 in
temperature increase from 20°C to 40°C
Connectivity Use of computer systems for analysis of ICP waveform is widespread. Important disadvantage
of Codman Express is that the whole box can only be ‘seen’ by an external system as a pressure
transducer. To generate any information understandable by external computer, it requires to be
connected to pressure monitor with the bridge-amplifier input. Pressio® 2 ICP Monitor has a
micro USB to be connected to a computer (USB cable included), which enables direct digital
communication ( 100 Hz, precision 0.1 mm Hg. System has been tested with ICMplus software (

www.neurosurg.cam.ac.uk/icmplus ) for accuracy and consistency. The system works properly
without any distortion, for best performance (the same temperature and pressure sampling
frequency) a special driver for ICM+ is needed (it has been developed during the evaluation)
Figure 14. Direct connectivity of Pressio® 2 ICP Monitor compared to indirect
connection of Codman Express to computer running ICM+ software
Conclusion
Pressio® 2 ICP Monitor is a modern ICP monitor, which has metrological properties similar to the
well known from many clinical papers and presentations, Codman system. In both monitors
piezoelectric intraparenchymal microtransducers are used. Pressio® 2 ICP Monitor has a direct
link with external computer- it can be used as a part of multimodal brain monitoring system
without using of intermediate pressure monitor.
Recommendation
Consider increase the precision of transmission of ICP value to two decimal points (exactly as
temperature)
Reference: 1. Martínez-Mañas RM, Santamarta D, de Campos JM, Ferrer E. Camino intracranial pressure
monitor: prospective study of accuracy and complications. J Neurol Neurosurg Psychiatry. 2000 Jul;69(1):82-6
2. Czosnyka M, Czosnyka Z, Pickard JD: Laboratory testing of three intracranial pressure microtransducers: Technical report. Neurosurgery 1996, 38: 219-224
3. Wolfla CE, Luerssen TG, Bowman RM, Putty TK. Brain tissue pressure gradients created by expanding frontal epidural mass lesion. J Neurosurg. 1996 Apr;84(4):642-7.
4. Williams EJ, Bunch CS, Carpenter TA, Downey SP, Kendall IV, Czosnyka M, Pickard JD, Martin J, Menon DK. Magnetic resonance imaging compatibility testing of intracranial pressure probes. Technical note. J Neurosurg. 1999 Oct;91(4):706-9
5. Allin D, Czosnyka M, Czosnyka Z. Laboratory testing of the Pressio intracranial pressure monitor. Neurosurgery. 2008 May;62(5):1158-61;
6. Kasprowicz M, Asgari S, Bergsneider M, Czosnyka M, Hamilton R, Hu X. Pattern recognition of overnight intracranial pressure slow waves using morphological features of intracranial pressure pulse. J Neurosci Methods. 2010 Jul 15;190(2):310-8.
This report was prepared in Cambridge Shunt Evaluation Laboratory, Cambridge, UK as a
part of R&D agreement between Sohysa SA and University of Cambridge.
Dr. Zofia Czosnyka
Dr. Peter Smielewski
Dr. M. Czosnyka Cambridge 20.02.2017