labview introduction -...
TRANSCRIPT

LabVIEW Introduction
Adapted from a presentation prepared by
Imran Haider Malik of McGill University CanadaImran Haider Malik of McGill University, CanadaJanuary 16, 2006 for their Measurement Lab. MECH262‐MECH261
http://www.cim.mcgill.ca/~paul/LabviewTut.pdf

OutlineOutline• Introduction• LabVIEW Introduction• Data Acquisition (DAQ)• Features of LabVIEW
E l i• Example .vi• LabVIEW Interface• Lab Equipmentq p• Goals of this UT LabVIEW Lab• List of Typical Measurements• Conclusions.

LabVIEWLabVIEW
• Product of National Instruments (NI)
• Software for Virtual Instrumentation ( vi)• Software for Virtual Instrumentation (.vi)
• Data Acquisition (DAQ)
h l• Graphical Programming
• Data Storage and Analysis for wide range of applications

Data Acquisition (DAQ)Data Acquisition (DAQ)
Time dependent Signal Recording (Acquisition)
Components of DAQ:p Q
• Physical value typically converted to voltage
• Signal conditioning (e g a filter nowadays• Signal conditioning (e.g., a filter – nowadays can be built‐in with DAQ card)
d ( b )• DAQ Card (can be USB)
• DAQ Software (DAQmx, LabVIEW)

Features of LabVIEWFeatures of LabVIEW• Design
– Signal and Image Processing
– Embedded System Programming
• (PC, DSP, FPGA, Microcontroller)
– Simulation and Prototyping
– And more…
• Control
– Automatic Controls and Dynamic Systems
– Mechatronics and Robotics
– And more…
• Measurements
– Circuits and Electronics
– Measurements and Instrumentation
– And more…

ExamplepSound Signal Acquisition
This can help Design a Tuning Device for Musical Instruments.

LabVIEW InterfaceEach Virtual Instrument (VI) has 2 Windows
Front Panel
Front Panel
Front Panel• User Interface (UI)
– Controls = Inputs– Indicators = Outputs
Block DiagramBlock Diagram
Block Diagram• Graphical Code
– Data travels on wires from controls through functions tocontrols through functions to indicators
– Blocks execute by Dataflow

LabVIEW Interface (Contd)LabVIEW Interface (Contd)• Help»Show Context Help, press the <Ctrl+H> keys
• Hover cursor over object to update windowj p
Additional HelpAdditional Help
– Right‐Click on the VI icon and choose Help, orp,
– Choose “Detailed Help.” on the context help window

LabVIEW Interface (Contd)( )

LabVIEW Interface (Contd)( )
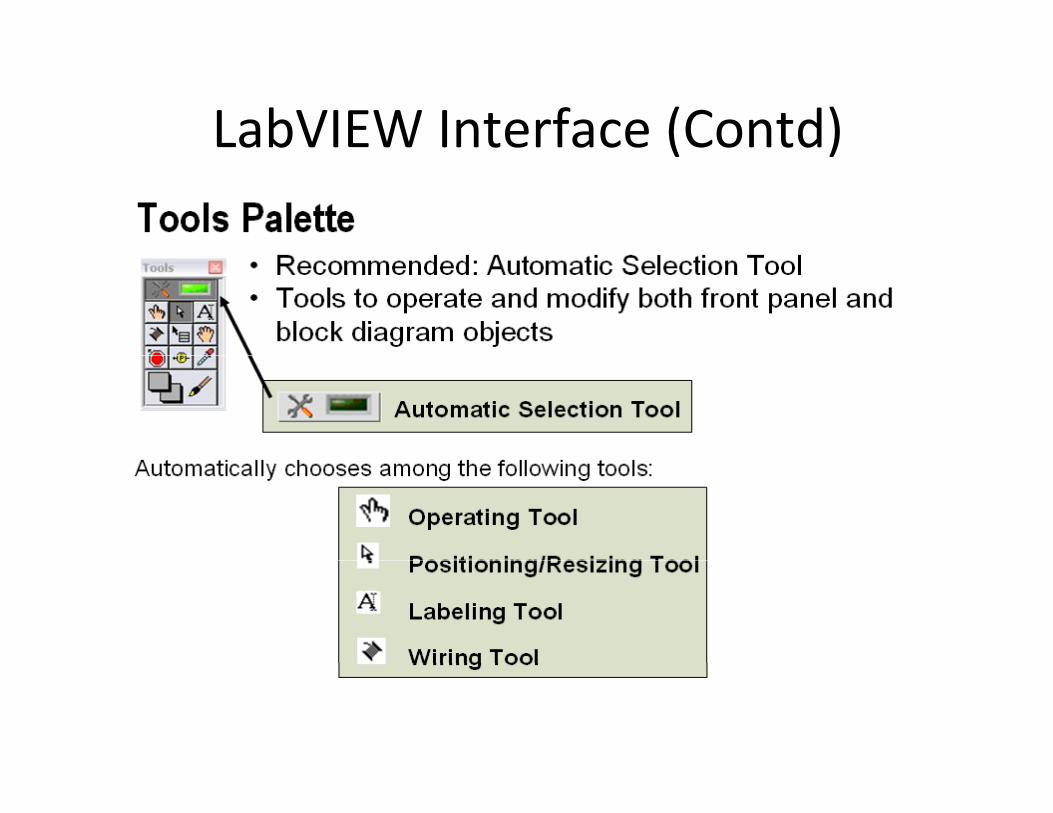
LabVIEW Interface (Contd)( )
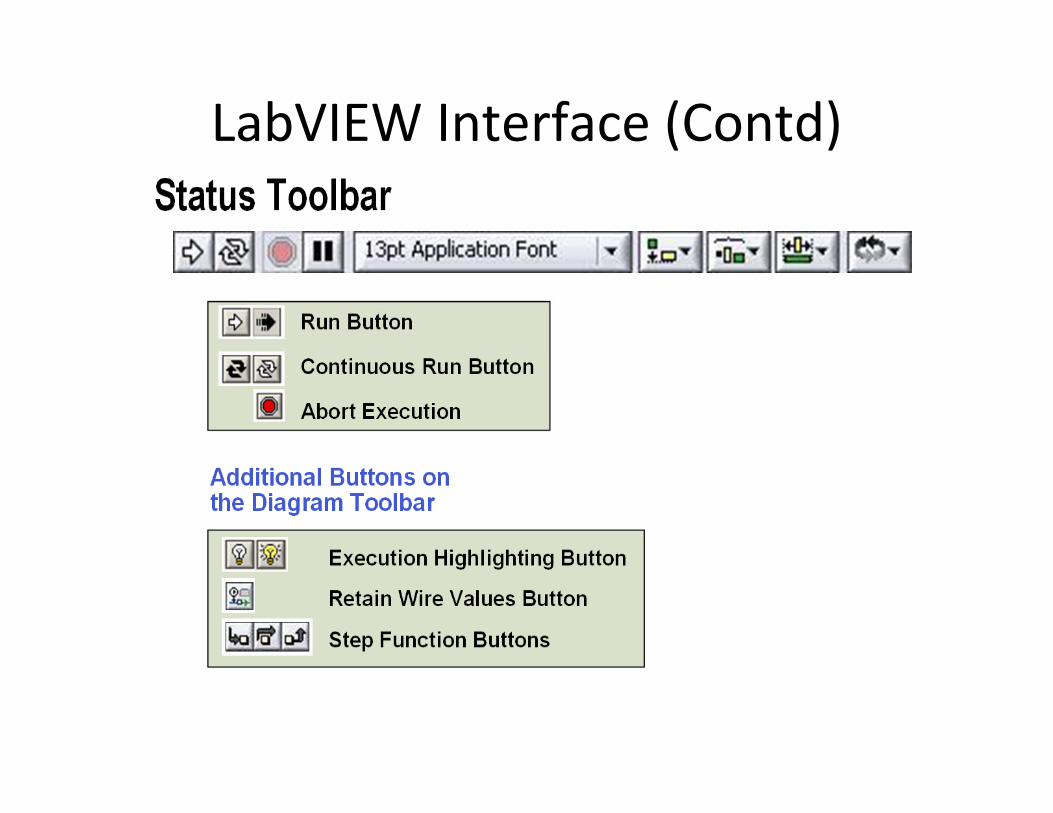
LabVIEW Interface (Contd)( )

Lab. EquipmentLab. Equipment
• Oscilloscope Universal Measuring IOscilloscope Instruments
• Function Generator Signal Generator
• Digital Voltmeter (DVM)

Goals of this week’s LabGoals of this week s Lab
• Introduce LabVIEW• Introduce LabVIEW
• Experience DAQ
f l i i• Use of Electronic instruments:
Oscilloscope, Function Generator
Digital Volt‐meter (DVM).

Measurement ExamplesMeasurement Examples1. Instrumentation Overview.
2. Introduction to LabVIEW.
3. Data Sampling.
4. Time Constant.
5. Stress and Strain.
6. Transducer Sensitivity (Part 1)
7. Transducer Sensitivity (Part 2) and Linearity
8. Pressure Transducer Calibration and Jet Profile
9. Thermocouples: Calibration and Manufacturing

What you should know about LabVIEW being a physicist
• Selection of DAQ system for an application
• Communicating with instruments (drivers, GPIB, other)GPIB, other)
• Modularity of programming approaches: making your vi’s flexible and adaptablemaking your .vi s flexible and adaptable

ReferencesReferences
• www ni com• www.ni.com
• Using the oscilloscope http://www doctronics co uk/scope htmhttp://www.doctronics.co.uk/scope.htm