lac la biche chamber of commerce - osca · alberta energy regulator (aer) coordination 4. industry...
TRANSCRIPT

Lac La Biche Chamber of Commerce
June 28, 2017

Agenda
1. Who is OSCA and 2017 Priorities2. Oil Sands Update3. Closing Remarks

OSCA - Oil Sands Community Alliance

OSCA’s Vision
To pursue innovative solutions that help to build thriving communities and shared value with our neighbours and enables the responsible growth
of Canada’s oil sands.
We facilitate engagement, build relationships and collaborate to create measurable socio-
economic benefits.

OSCA OverviewMembers and Mandate Area
• ~15 oil sands companies.
• Assets or interests in the Athabasca Oil Sands Area.

OSCA OverviewGovernance and Focus Areas
Infrastructure
Community Well-Being
Oil Sands CEO Council
CAPP Oil Sands Executive Policy
Group
Workforce

OSCA Overview2017 Priorities
• Bill 21 and municipal taxation • Fire Recovery• Infrastructure• Monitor emerging opportunities and issues
Source: Syncrude

1. Evacuation, Logistics, Critical Infrastructure 2. Incident Command System (ICS) and Training 3. Alberta Energy Regulator (AER) Coordination 4. Industry Liaison Role 5. Communication and Information Sharing
Horse River Wildfire Lessons Learned Themes

2016 LLB Stakeholder Session Priorities
• Transport and Safety • Economic Development • Essential Services• Workforce and Education • Governance and Leadership
Source: Syncrude

10
Oil Sands Update

Gov’t policy and other changes create uncertainty for industry:
Climate Leadership Plan
Environmental Policy (Methane & Caribou)
Regulatory Uncertainty
MGA Implementation
Oil prices have fallen dramatically:
$90$40
2014 2016
May 2016 Wildfire
U.S. Gov’t
$50
2017
New reality

What Price Do We Get For Our Oil?
Source: CAPP
-
20.00
40.00
60.00
80.00
100.00
120.00
140.00
20
11A J O
20
12A J O
20
13A J O
20
14A J O
20
15A J O
20
16A J O
20
17A
US$
/bb
l
Brent Spot
WTI NYMEX
Cdn Lt Swt
WCS

Oil Sands Capital Investment
Source: CAPP
0
5
10
15
20
25
30
35
40
19
85
19
86
19
87
19
88
19
89
19
90
19
91
19
92
19
93
19
94
19
95
19
96
19
97
19
98
19
99
20
00
20
01
20
02
20
03
20
04
20
05
20
06
20
07
20
08
20
09
20
10
20
11
20
12
20
13
20
14
20
15
20
16
E
20
17
F
$ Billions
Oil Sands Capital Investment -
YOY% Change
2016/15 2017/16
-26% -12%

Oil Sands Projects Cancelled or Deferred
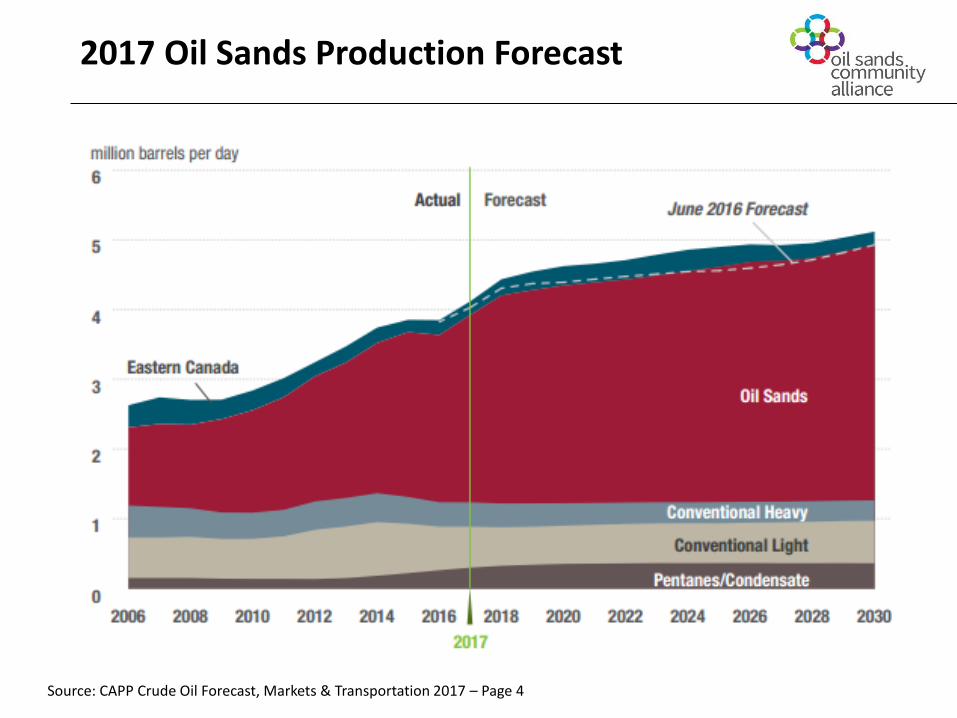
2017 Oil Sands Production Forecast
Source: CAPP Crude Oil Forecast, Markets & Transportation 2017 – Page 4

Oil Sands Employment to 2020

Conclusion
• Collaboration• Competitiveness • Growth to Operation• Global Energy Mix

Questions