lacasse road slope stability assessment · lacasse road slope stability assessment i executive...
TRANSCRIPT
Lacasse Road Slope Stability Assessment
Clarence-Rockland, ON
Prepared for: City of Clarence-Rockland 1560 rue Laurier Street Rockland, ON K4K 1P7
Prepared by: Stantec Consulting Ltd. 1331 Clyde Avenue Ottawa, ON K2C 3G4
Project No. 121620526
September 2017
LACASSE ROAD SLOPE STABILITY ASSESSMENT
i
EXECUTIVE SUMMARY
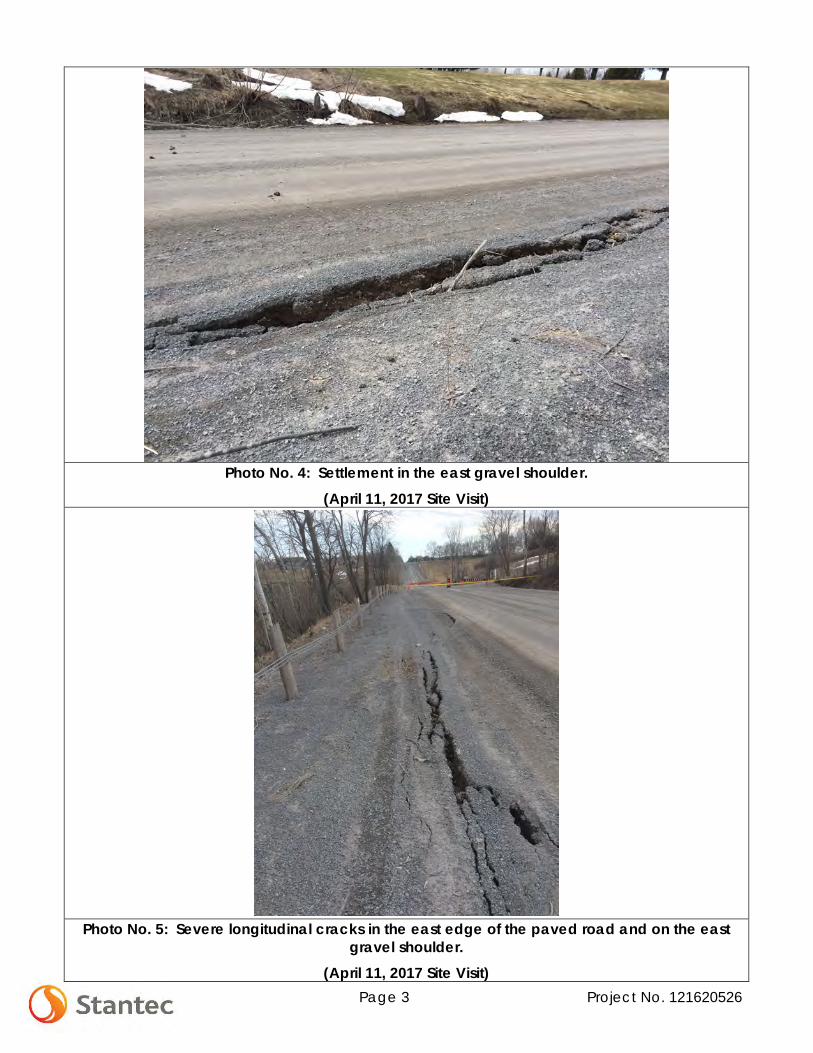
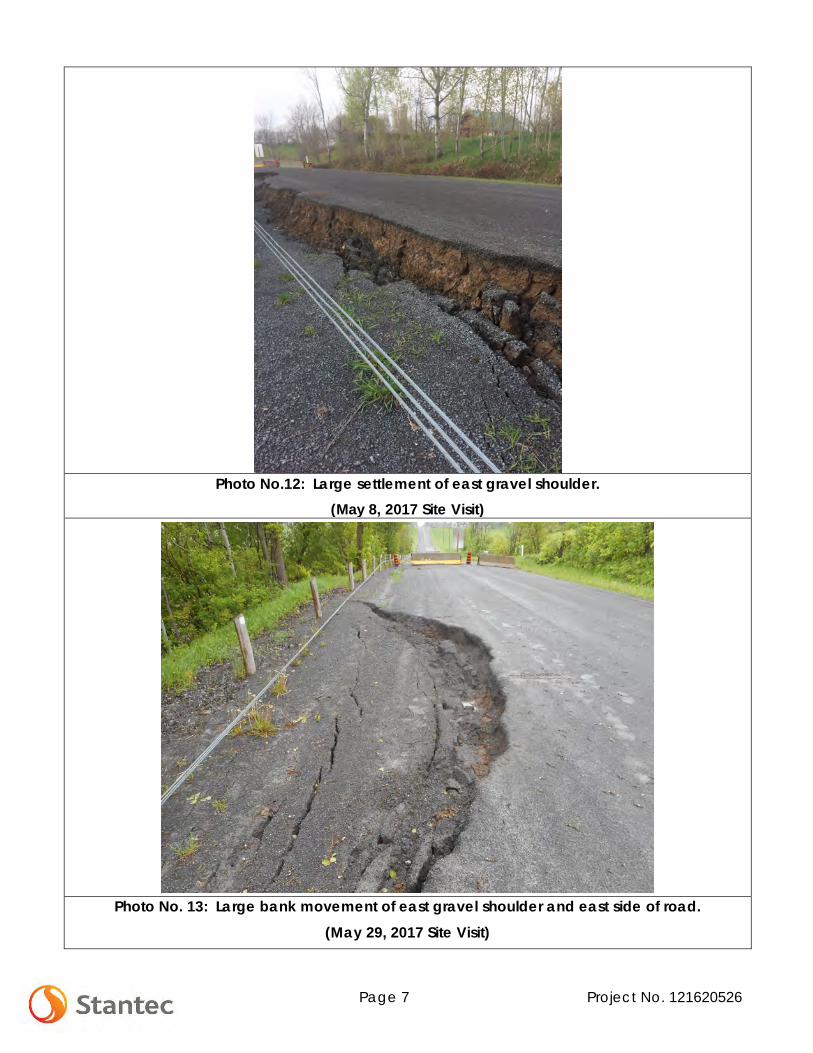
Movement and distresses were noted on Lacasse Road and the adjacent ground bank between 1240 and 1264 Lacasse Road. A site visit conducted by a representative of Stantec Consulting Ltd. (Stantec) on Monday April 10th, 2017 noted significant settlement, cracking and soil movement in an approximate 30 m span of Lacasse Road, located north of 1264 Lacasse Road. Guard rail posts remained near vertical at the time of the visit, but some posts appeared to be lower than their original height. Settlement of up to 300 mm has occurred in the east gravel shoulder within an area of semi-circular cracking at the surface. Severe longitudinal cracks were also observed at the east edge of the road and shoulder that were up to 200 mm wide and 400 mm deep. Additional signs of bank instability were also observed including localized soil movement and fallen and leaning trees. Another site visit conducted on May 29th, 2017, revealed the east gravel shoulder dropped up to 0.7 m vertically after a heavy rainfall event.
A Slope Stability Assessment was carried out by Stantec Consulting Ltd. to assess the stability of the ground bank in the area of movement, and in a location further north along Lacasse Road in the area where the ground bank becomes steeper. This assessment included drilling two (2) boreholes in the location of the bank movement, surveying the bank profile (both in the area of movement and in the steeper section of the bank, see Drawing 3 and 4 in Appendix B), and calculating the factor of safety against slope failure.
The analysis indicates that the shallow groundwater together with saturated conditions resulted in the large movement and failure of the bank. Back analysis results also indicate that the failed bank and steeper section of the bank does not meet the minimum required factor of safety against failure (as suggested by City of Ottawa slope guidelines).
Our assessment concludes that the ground bank should be stabilized to prevent further distresses to the road surface and to protect the public safety. Localized road repair without bank stabilization work is not recommended. Two stabilization options (Toe Berm and Bank Flattening) have been considered and analyzed at a conceptual level to confirm that they are feasible to meet the minimum requirements for FOS suggested by City of Ottawa guidelines.
The preferred solution should be further assessed considering costs associated with property acquisition and construction and any potential environmental constraints related to the expanded footprint of the ground bank, which is beyond the scope of this report.
LACASSE ROAD SLOPE STABILITY ASSESSMENT
ii
Table of Contents
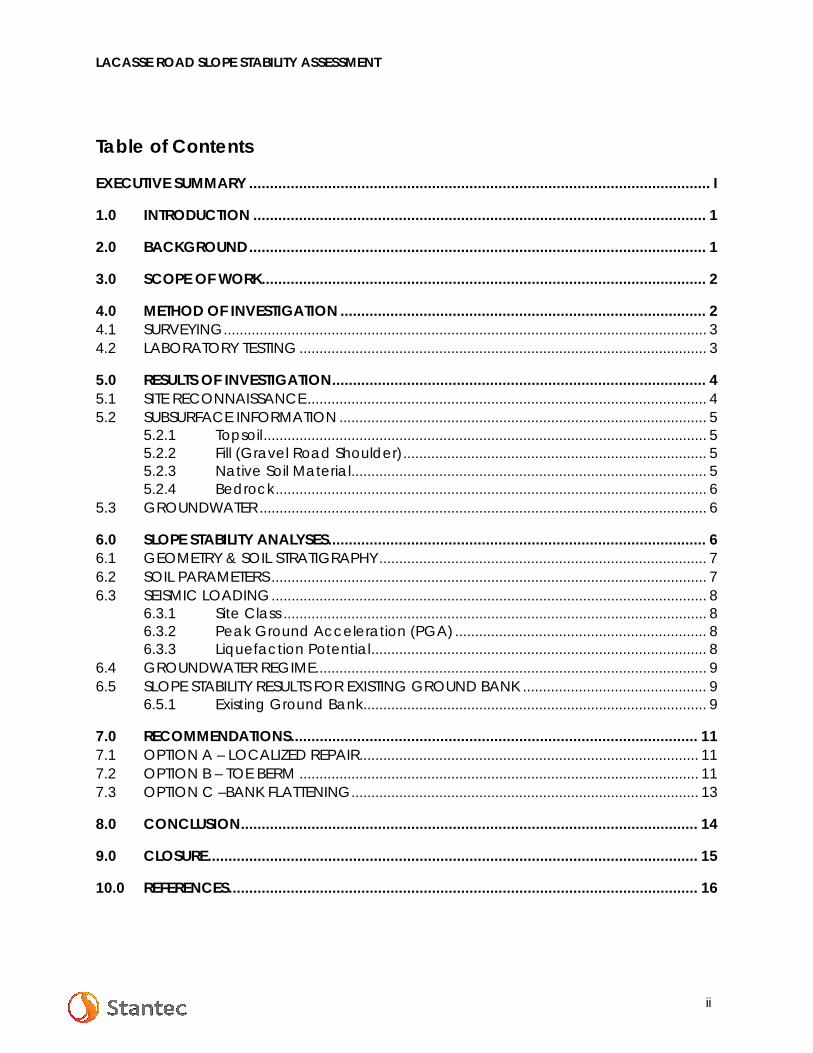
EXECUTIVE SUMMARY ............................................................................................................... I
1.0 INTRODUCTION ............................................................................................................. 1
2.0 BACKGROUND .............................................................................................................. 1
3.0 SCOPE OF WORK ........................................................................................................... 2
4.0 METHOD OF INVESTIGATION ........................................................................................ 2 4.1 SURVEYING ......................................................................................................................... 3 4.2 LABORATORY TESTING ...................................................................................................... 3
5.0 RESULTS OF INVESTIGATION .......................................................................................... 4 5.1 SITE RECONNAISSANCE .................................................................................................... 4 5.2 SUBSURFACE INFORMATION ............................................................................................ 5
5.2.1 Topsoil ............................................................................................................... 5 5.2.2 Fill (Gravel Road Shoulder) ............................................................................ 5 5.2.3 Native Soil Material ......................................................................................... 5 5.2.4 Bedrock ............................................................................................................ 6
5.3 GROUNDWATER ................................................................................................................ 6
6.0 SLOPE STABILITY ANALYSES ........................................................................................... 6 6.1 GEOMETRY & SOIL STRATIGRAPHY .................................................................................. 7 6.2 SOIL PARAMETERS ............................................................................................................. 7 6.3 SEISMIC LOADING ............................................................................................................. 8
6.3.1 Site Class .......................................................................................................... 8 6.3.2 Peak Ground Acceleration (PGA) ............................................................... 8 6.3.3 Liquefaction Potential .................................................................................... 8
6.4 GROUNDWATER REGIME.................................................................................................. 9 6.5 SLOPE STABILITY RESULTS FOR EXISTING GROUND BANK .............................................. 9
6.5.1 Existing Ground Bank ...................................................................................... 9
7.0 RECOMMENDATIONS .................................................................................................. 11 7.1 OPTION A – LOCALIZED REPAIR ..................................................................................... 11 7.2 OPTION B – TOE BERM .................................................................................................... 11 7.3 OPTION C –BANK FLATTENING ....................................................................................... 13
8.0 CONCLUSION .............................................................................................................. 14
9.0 CLOSURE ...................................................................................................................... 15
10.0 REFERENCES ................................................................................................................. 16

LACASSE ROAD SLOPE STABILITY ASSESSMENT
iii
LIST OF TABLES Table 6.1: Soil Parameters ........................................................................................................... 8 Table 6.2: Peak Ground Acceleration Data ............................................................................ 8 Table 6.3: Slope Stability Drained Analysis – Existing Slope – Cross Section A-A ............... 10 Table 6.4: Slope Stability Undrained Analysis – Existing Slopes – Cross Section A-A ......... 10 Table 6.5: Slope Stability Drained Analysis – Existing Slopes – Cross Section B-B ............... 10 Table 6.6: Slope Stability Undrained Analysis – Existing Slopes - Cross Section B-B ........... 11 Table 7.1: Slope Stability Drained Analysis – Cross Section A-A (Berm).............................. 12 Table 7.2: Slope Stability Undrained Analysis – Cross Section A-A (Berm) ......................... 12 Table 7.3: Slope Stability Drained Analysis – Cross Section B-B (Berm) ............................... 12 Table 7.4: Slope Stability Undrained Analysis – Cross Section B-B (Berm) .......................... 12 Table 7.5: Slope Stability Drained Analysis – Cross Section A-A (Flattened Slopes) ......... 13 Table 7.6: Slope Stability Undrained Analysis – Cross Section A-A (Flattened Slopes) ..... 13 Table 7.7: Slope Stability Drained Analysis – Cross Section B-B (Flattened Slopes) .......... 13 Table 7.8: Slope Stability Undrained Analysis – Cross Section B-B (Flattened Slopes) ...... 14
LIST OF APPENDICES
APPENDIX A Statement of General Conditions
APPENDIX B Drawing No. 1 – Key Plan Drawing No. 2 – Borehole Location Plan Drawing No. 3 – Section A-A Drawing No. 4 – Section B-B
APPENDIX C Symbols and Terms Used on Borehole and Test Pit Records Borehole Records Site Photographs
APPENDIX D Laboratory Test Results
APPENDIX E Drawing E1 – Geotechnical Model Drawing E2 – Geotechnical Model Output from Slope Stability Analyses
APPENDIX F NBC Seismic Hazard Calculation

LACASSE ROAD SLOPE STABILITY ASSESSMENT September 2017
1
1.0 INTRODUCTION
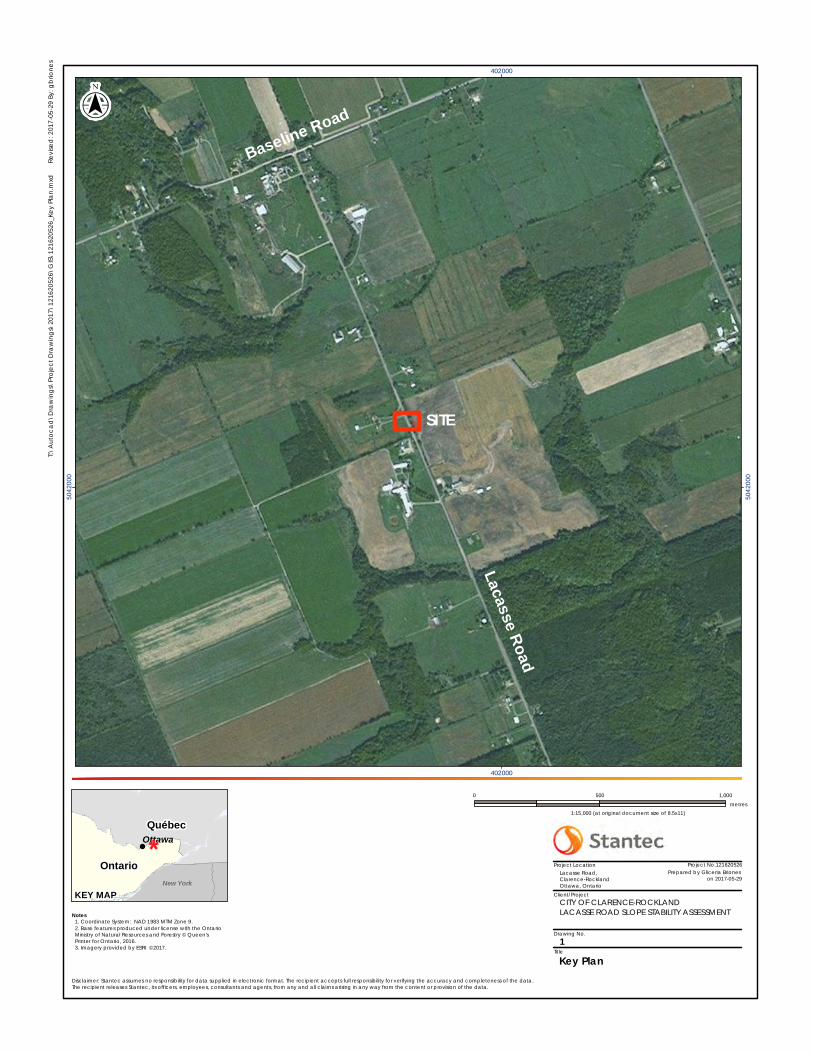
This report presents the results of the Slope Stability Assessment for a section of Lacasse Road between 1240 and 1264 Lacasse Road in Clarence-Rockland, Ontario. The location of the site is shown on the Key Plan, Drawing No. 1 in Appendix B.
The work was carried out in general accordance with Stantec Consulting Ltd. (Stantec) Proposal File No. 599439, dated April 19, 2017.
Limitations associated with the contents of this report are provided in the Statement of General Conditions included in Appendix A.
2.0 BACKGROUND
General Site Description
The section of the ground bank under consideration is located approximately 1.2 km southeast of the intersection of Baseline Road and Lacasse Road. Lacasse Road is a two-lane roadway located in a rural area, with guard rails present on the east side of the road.
Physiographic Description
Previous boreholes in the vicinity of the site recorded in the Ontario Well Database suggest that subsurface conditions within the study limits consist of deposits of clay overlying limestone bedrock. The boreholes indicate that the depth to bedrock is deeper than 25 m below ground surface. It is noted that on the west side of Lacasse Road, which is at a higher elevation, it is anticipated that there is a deposit of sand over the clay deposit. The ‘Geological Survey of Canada, Map 1425A, Surficial Materials and Terrain Features, Ottawa Hull’ map indicate that the site is part of a former landslide area and is identified as a zone of material removal and re-deposition.
Topography
The east side of the existing Lacasse Road may have been originally built on the ground bank, by slope cutting, and on grade on the west side. The west side of Lacasse Road is higher than the east side at the failed section (gentle upslope towards the west). The maximum bank height within the failed section is about 8 m and the existing bank configuration is generally 2H:1V (section A-A) to 1.5H:1V (section B-B). Beyond the failed section, the ground elevation along Lacasse Road generally decreases towards the north and south. The ground bank toe area is mostly flat to gently rolling.
LACASSE ROAD SLOPE STABILITY ASSESSMENT September 2017
2
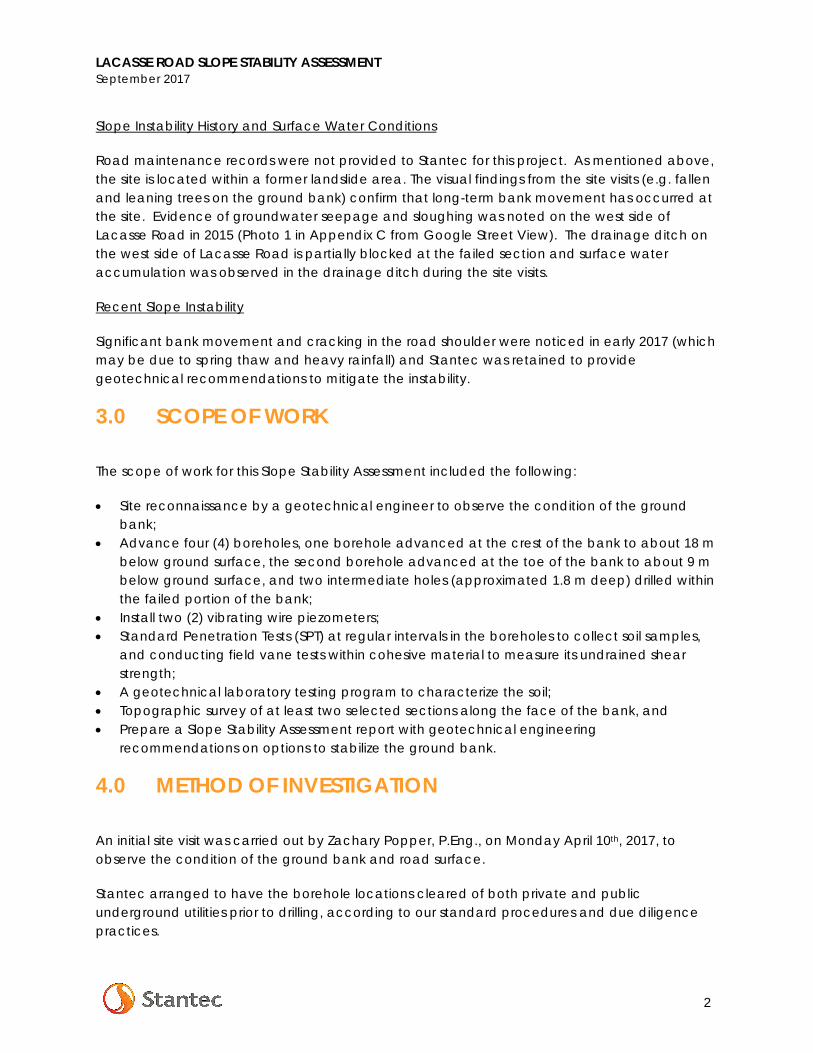
Slope Instability History and Surface Water Conditions
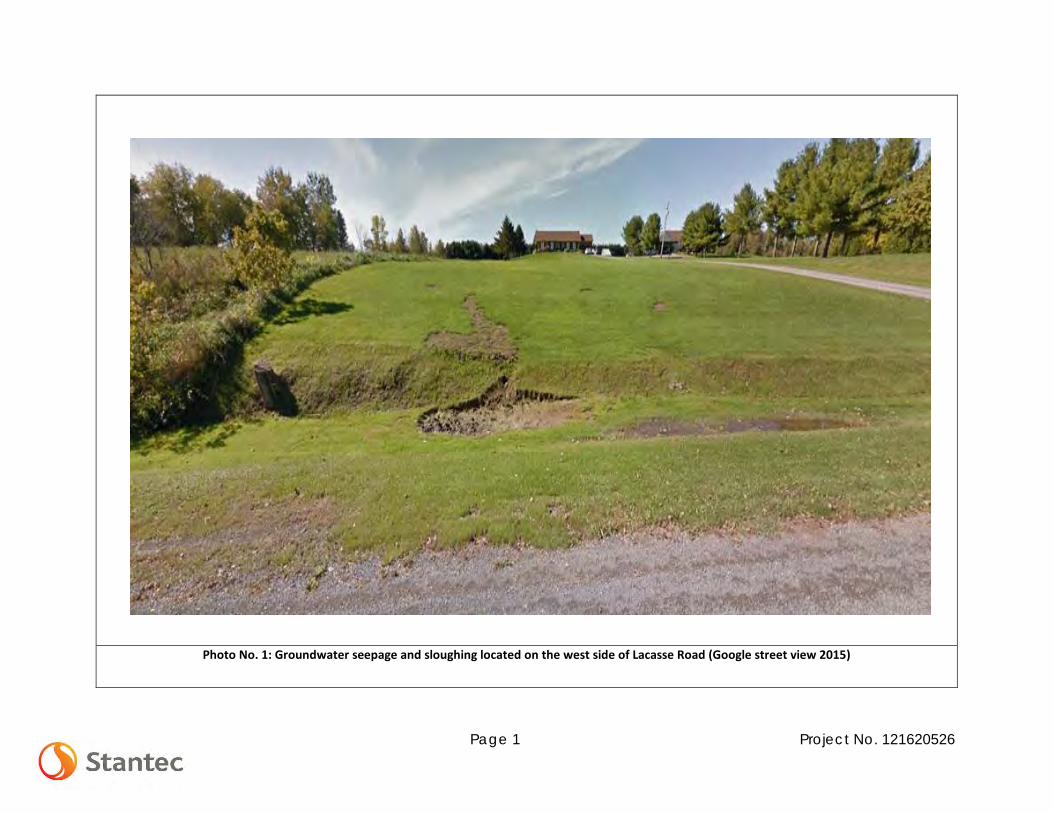
Road maintenance records were not provided to Stantec for this project. As mentioned above, the site is located within a former landslide area. The visual findings from the site visits (e.g. fallen and leaning trees on the ground bank) confirm that long-term bank movement has occurred at the site. Evidence of groundwater seepage and sloughing was noted on the west side of Lacasse Road in 2015 (Photo 1 in Appendix C from Google Street View). The drainage ditch on the west side of Lacasse Road is partially blocked at the failed section and surface water accumulation was observed in the drainage ditch during the site visits.
Recent Slope Instability
Significant bank movement and cracking in the road shoulder were noticed in early 2017 (which may be due to spring thaw and heavy rainfall) and Stantec was retained to provide geotechnical recommendations to mitigate the instability.
3.0 SCOPE OF WORK
The scope of work for this Slope Stability Assessment included the following:
• Site reconnaissance by a geotechnical engineer to observe the condition of the ground bank;
• Advance four (4) boreholes, one borehole advanced at the crest of the bank to about 18 m below ground surface, the second borehole advanced at the toe of the bank to about 9 m below ground surface, and two intermediate holes (approximated 1.8 m deep) drilled within the failed portion of the bank;
• Install two (2) vibrating wire piezometers; • Standard Penetration Tests (SPT) at regular intervals in the boreholes to collect soil samples,
and conducting field vane tests within cohesive material to measure its undrained shear strength;
• A geotechnical laboratory testing program to characterize the soil; • Topographic survey of at least two selected sections along the face of the bank, and • Prepare a Slope Stability Assessment report with geotechnical engineering
recommendations on options to stabilize the ground bank.
4.0 METHOD OF INVESTIGATION
An initial site visit was carried out by Zachary Popper, P.Eng., on Monday April 10th, 2017, to observe the condition of the ground bank and road surface.
Stantec arranged to have the borehole locations cleared of both private and public underground utilities prior to drilling, according to our standard procedures and due diligence practices.
LACASSE ROAD SLOPE STABILITY ASSESSMENT September 2017
3
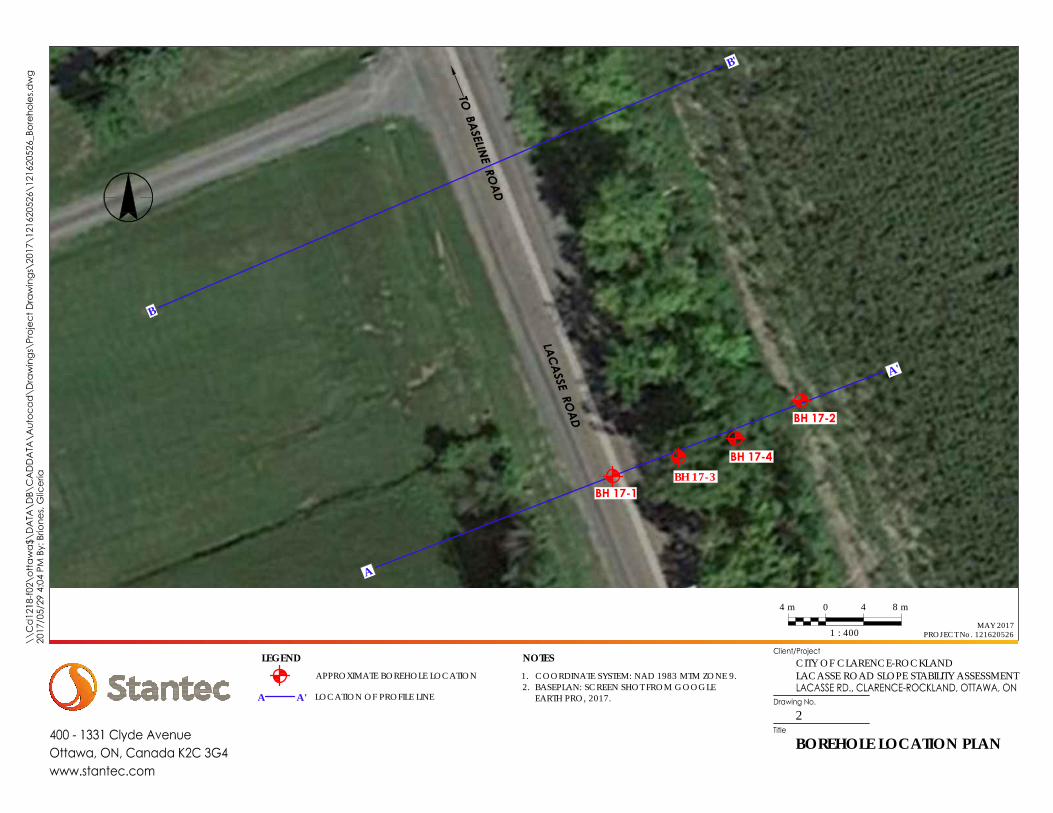
The field drilling program was carried out between May 9 and May 23, 2017. Boreholes, designated BH17-1 to BH17-4, were drilled at the locations shown on the Borehole Location Plan, Drawing No. 2 in Appendix B.
Boreholes BH17-1 to BH17-4 were advanced using a track mounted CME drill rig equipped for soil. The subsurface stratigraphy encountered in each borehole was recorded in the field by experienced Stantec personnel while performing Standard Penetration Tests (SPT). Split spoon samples were collected continuously to approximately 5 m depth and then at approximately 914 mm intervals until the termination of the boreholes. Field vane tests were also conducted within cohesive material to measure undrained shear strength. All recovered soil samples were stored in moisture-proof bags and returned to the Stantec Ottawa Laboratory for further classification and testing.
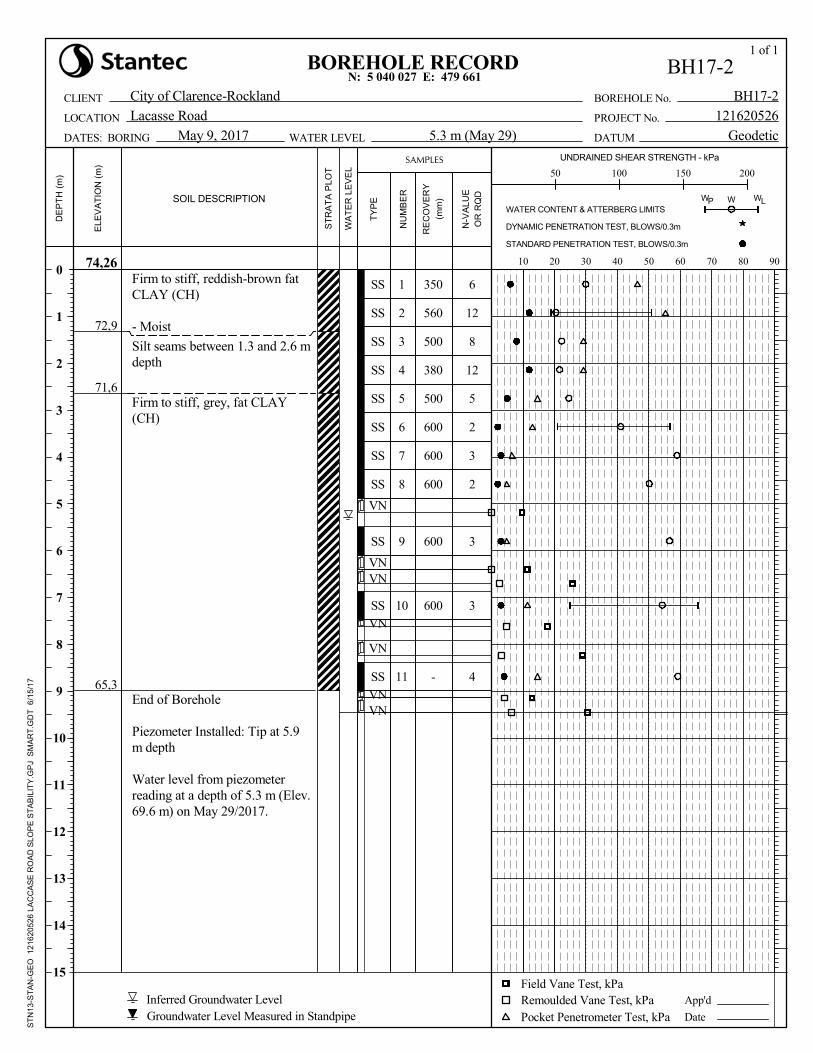
Vibrating wire piezometers (VWP) were installed in both borehole BH17-1 and BH17-2 to allow for the measurement of groundwater levels. In borehole BH17-1, the tip of the VWP was installed at a depth of 12.2 m below ground surface, backfilled with silica sand to approximately 11.3 m depth and sealed with a bentonite hole plug. In borehole BH17-2, the tip of the VWP was installed at a depth of 5.9 m below ground surface, within a 50 mm diameter rigid standpipe (with a screen from 4.9 m to 5.9 m below ground surface), then backfilled with silica sand to approximately 1.1 m above the top of the screen and sealed with a bentonite hole plug.
4.1 SURVEYING
The borehole locations and elevations were surveyed using a Trimble GPS unit with decimeter accuracy. Accuracy may be affected by satellite coverage at the time of survey. The ground surface elevation for two (2) bank sections across Lacasse Road were surveyed by Stantec registered land surveyors.
Geodetic elevations at the borehole locations and spot elevations are shown in Drawing No. 2 in Appendix B and the Borehole Records in Appendix C.
4.2 LABORATORY TESTING
All samples returned to the laboratory were subjected to detailed visual examination and classification by a geotechnical engineer. Moisture content determination was conducted on all soil samples, and select soil samples were also submitted for grain size analysis. The results of the laboratory tests are provided in the Borehole Records in Appendix C, and the figures included in Appendix D. The samples will be stored for a period of one (1) month after the issuance of this report, unless otherwise directed by the client.

LACASSE ROAD SLOPE STABILITY ASSESSMENT September 2017
4
5.0 RESULTS OF INVESTIGATION
5.1 SITE RECONNAISSANCE
A site visit was carried out by Mr. Zachary Popper, P.Eng., on Monday April 11th, 2017, to observe the condition of the ground bank. Additional visits were conducted by a Stantec technician, Jason Hopewood-Jones, on April 26, 2017 and May 8, 23 and 29, 2017.
The site photographs are presented in Appendix C, and the site observations are summarized below.
April 11, 2017 Site Visit (Photos 1 to 7)
• Bank movement (taken from the toe of the bank). • Toe of the bank. • Settlement of the east gravel shoulder. • Severe longitudinal cracks in the east edge of the paved road and on the east gravel
shoulder. • Settlement of guard rail posts. • Semi-circular cracking on the east gravel shoulder.
April 26, 2017 Site Visit (Photo 8)
• Increased width of longitudinal cracks on east gravel shoulder since April 11, 2017.
May 8, 2017 Site Visit (Photos 9 to 11)
• Increased bank movement of east gravel shoulder since April 11, 2017. • Increased settlement and tilting of the guard rail posts since April 11, 2017. • Large settlement of east gravel shoulder.
May 29, 2017 Site Visit (Photo 12)
• Large bank movement of east gravel shoulder and east side of road.
Based on the site visit observations, the following preliminary conclusions were made regarding the cause and nature of the bank failure:
• The failure was likely triggered by high groundwater conditions from recent heavy precipitation and spring thaw conditions (the failed section was likely saturated).
• There was no sign of large-scale bank movement (e.g. retrogressive failure or mass slide), nor ground heaving beyond beyond the toe and the surficial tension cracks were observed only on the east edge (bank side) of Lacasse Road. This would suggest the nature of the bank failure is shallow, translational or localized at the toe rather than a deep-seated failure.
LACASSE ROAD SLOPE STABILITY ASSESSMENT September 2017
5
5.2 SUBSURFACE INFORMATION
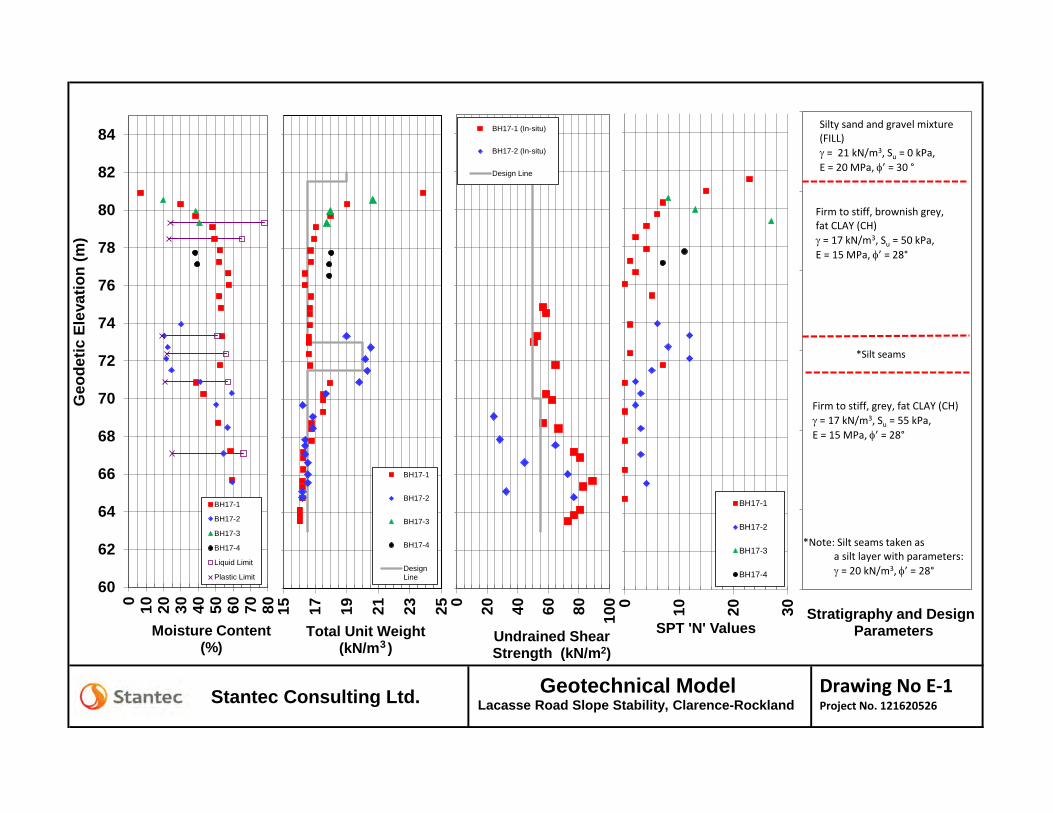
In general, the subsurface profile at the site consists of fill material or top soil, over a fat clay deposit, with silt seams within the fat clay deposit.
The subsurface conditions and results of the laboratory tests performed on soil samples are presented in the Borehole Records provided in Appendix C. An explanation of the symbols and terms used in the Borehole Records is also provided.
A summary of the observed subsurface conditions is provided below.
5.2.1 Topsoil
A 100 mm thick layer of topsoil was encountered in borehole BH17-4.
5.2.2 Fill (Gravel Road Shoulder)
Fill was encountered starting from the ground surface in borehole BH17-1 and BH17-3, with the thickness of the fill ranging from 250 to 300 mm. The fill consists mostly of a mixture of silty sand and gravel. A clay fill, 100 mm thick ,exists over the silty sand and gravel fill in borehole BH17-3.
The SPT ‘N’ values varied from 5 to 30 and the moisture content ranged from 6.9% and 19.8%.
5.2.3 Native Soil Material
5.2.3.1 Fat Clay (CH)
A Fat clay deposit was encountered below the fill or topsoil layers in boreholes BH17-1, BH17-3 and BH17-4, and was also encountered from the ground surface in borehole BH17-2. This fat clay layer extended to the termination depths of all four (4) boreholes. The SPT ‘N’ values varied from 0 to 27 blows per 0.3 m penetration, indicating a firm to very stiff consistency.
The moisture content of the fat clay layer ranged from 20.5% to 62.1%.
Vane shear tests were conducted in the fat clay layer and the undrained shear strength of the fat clay ranged from 24.2 to 88.9 kPa. Lower undrained shear strength values measured immediately below SPT spoons in borehole BH17-2 may be due to possible soil disturbances.
Three (3) representative samples of the material were chosen for grain size analysis; the results are summarized below. The grain size distribution curves are shown on Figure No. 1 in Appendix D.
• Gravel: 0% • Sand: 0% • Silt: 23-27% • Clay sized particles: 73-77%

LACASSE ROAD SLOPE STABILITY ASSESSMENT September 2017
6
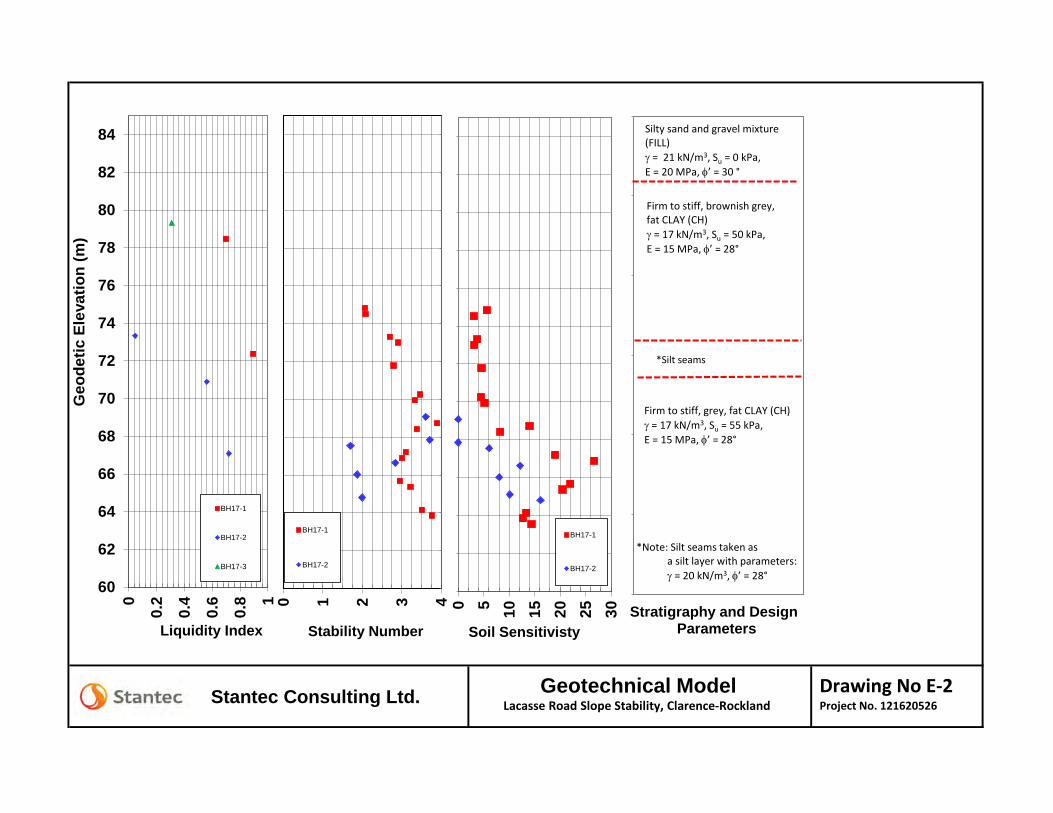
Atterberg Limit tests were carried out on portions of the six (6) samples. The tests yielded Liquid Limits of 51% to 78%, Plastic Limits of 17% to 18%, and corresponding Plasticity Indices of 32% to 54%. The Atterberg Limit tests indicate the soil can be classified as a fat clay of high plasticity (CH). Atteberg Limit results are shown on Figure No. 2 in Appendix D.
5.2.3.2 Silt Seams within Fat Clay
Thin silt seams were encountered within the fat clay layer in BH17-1 and BH17-2. This silt layer was approximately 0.9 m thick in borehole BH17-1, with a base elevation of 70.6 m and 1.3 m thick in borehole BH17-2 with a base elevation of 71.6 m.
The SPT ‘N’ values varied from 0 to 12 blows per 0.3 m penetration
The moisture content of a sample of the silt seam within the fat clay ranged from 22% to 43%.
One (1) representative sample of the silt seam within fat clay, was chosen for grain size analysis; the results are summarized below. The grain size distribution curves are shown on Figure No. 3 Appendix D.
• Gravel: 0% • Sand: 12% • Silt: 72% • Clay sized particles: 15%
5.2.4 Bedrock
Bedrock was not encountered to the termination depth of the boreholes.
5.3 GROUNDWATER
Piezometer readings taken on May 29, 2017 indicate a water level of 12.2 m below ground surface in borehole BH17-01, corresponding to an elevation of 69.6 m, and a water level of 5.3 m below ground surface in borehole BH17-02, corresponding to an elevation of 69.1 m.
Standpipe readings at the toe of the bank (borehole BH 17-2) indicate a water level of 2m (Elev. 72.3 m) below ground surface.
Fluctuations in the groundwater level should be anticipated, due to seasonal variations or in response to a particular precipitation event.
6.0 SLOPE STABILITY ANALYSES
The stability analysis was carried out in general accordance with the Canadian Highway and Bridge Design Code (CAN/CSA-S6-14) and the City of Ottawa ‘Slope Stability Guidelines for Development Applications’, and both static and seismic loading conditions are considered.
7
LACASSE ROAD SLOPE STABILITY ASSESSMENT September 2017
The analysis was carried out using the GeoStudio 2016 SLOPE/W software (Limit Equilibrium Method). The Morgenstern-Price method was used for the slope stability analyses.
6.1 GEOMETRY & SOIL STRATIGRAPHY
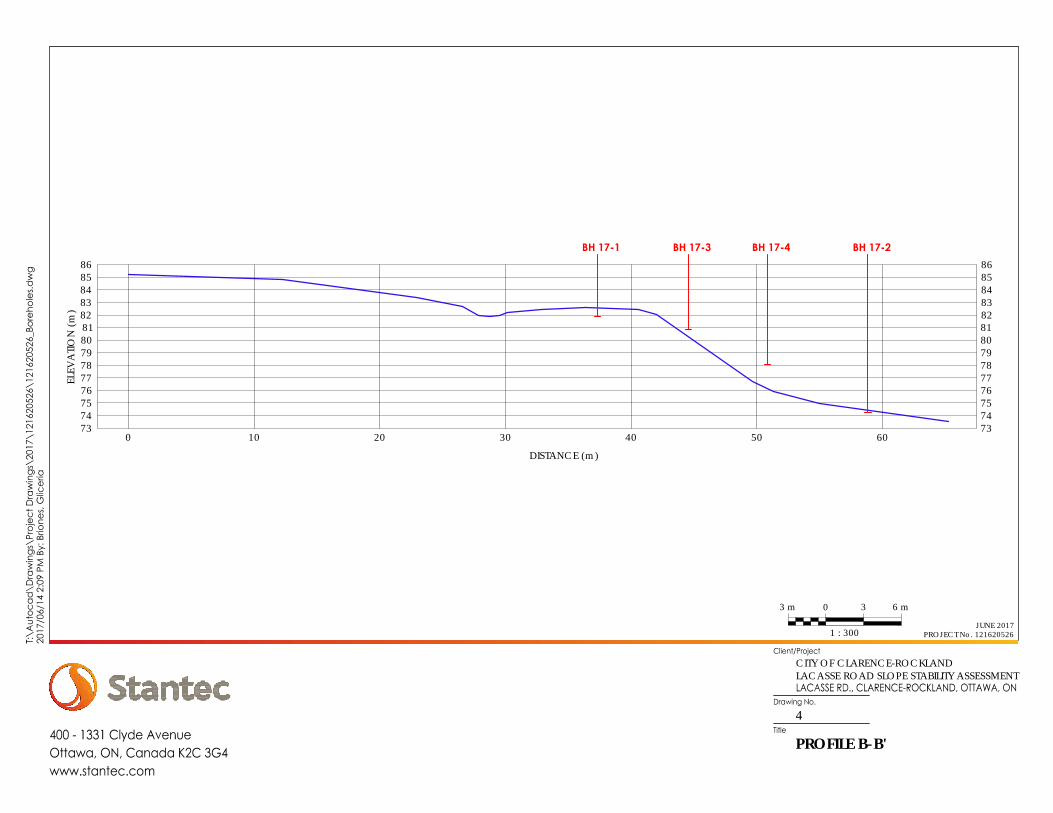
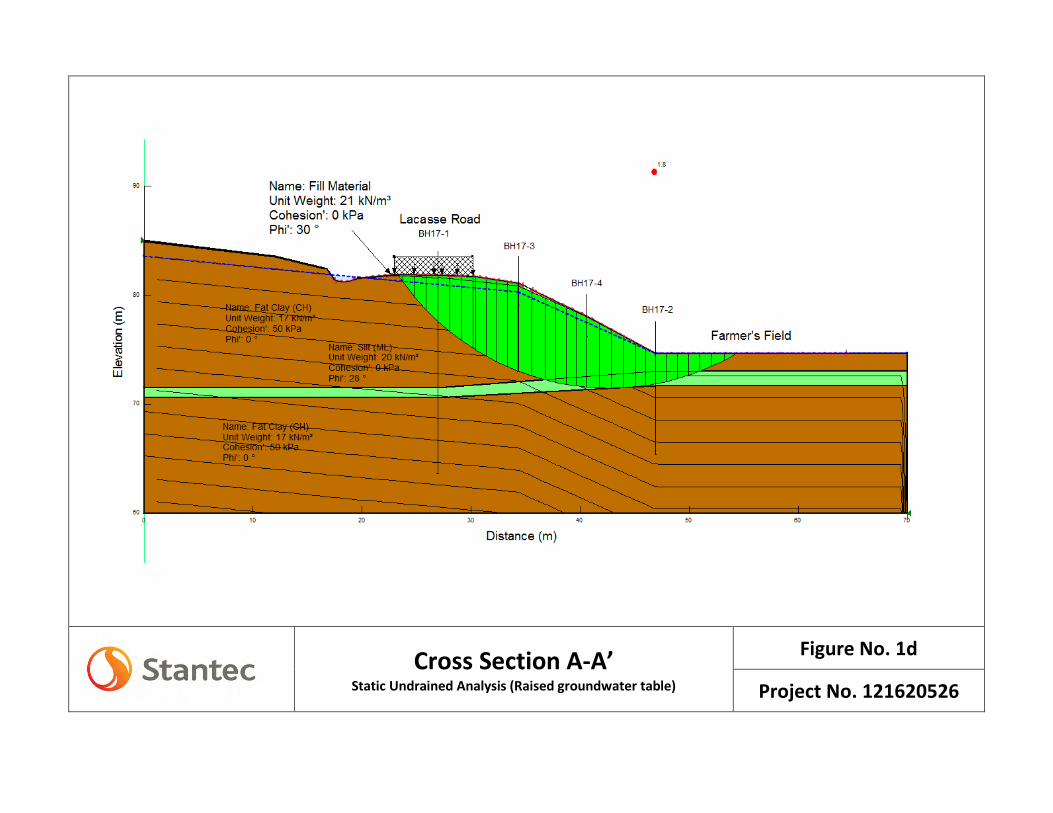
Two cross-sections (A-A & B-B) were generated perpendicular to Laccase Road. Cross section A-A coincides with boreholes BH17-1, BH17-2, BH17-2 and BH17-4 and pass through the area of failure, and cross section B-B is located further north of Lacasse Road in the area where the bank becomes steeper (1.5H:1V). The location of the section is shown on Drawing No.2 in Appendix B. The cross-section profile is provided on the Slope/W stability models (see Figures No. 1a to 4d in Appendix E).
6.2 SOIL PARAMETERS
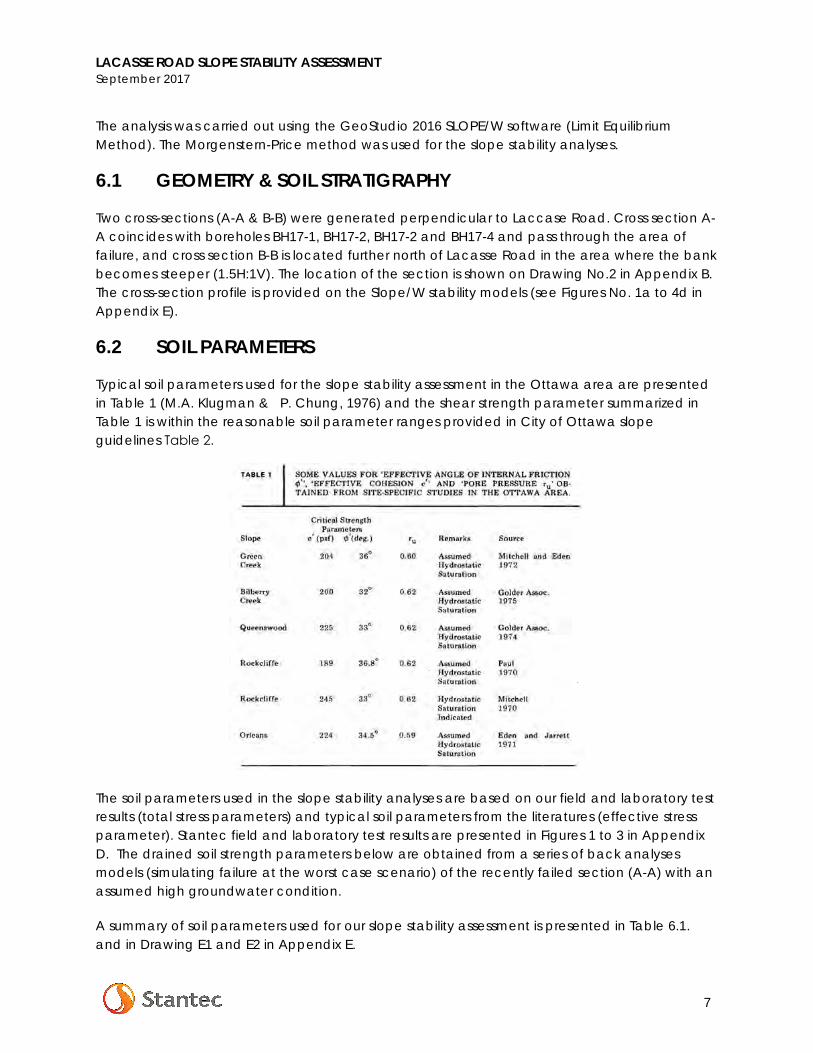
Typical soil parameters used for the slope stability assessment in the Ottawa area are presented in Table 1 (M.A. Klugman & P. Chung, 1976) and the shear strength parameter summarized in Table 1 is within the reasonable soil parameter ranges provided in City of Ottawa slope guidelines Table 2.
The soil parameters used in the slope stability analyses are based on our field and laboratory test results (total stress parameters) and typical soil parameters from the literatures (effective stress parameter). Stantec field and laboratory test results are presented in Figures 1 to 3 in Appendix D. The drained soil strength parameters below are obtained from a series of back analysesmodels (simulating failure at the worst case scenario) of the recently failed section (A-A) with anassumed high groundwater condition.
A summary of soil parameters used for our slope stability assessment is presented in Table 6.1. and in Drawing E1 and E2 in Appendix E.

LACASSE ROAD SLOPE STABILITY ASSESSMENT September 2017
8
Table 6.1: Soil Parameters
Soil Type
Design Parameters
Total Unit Weight
γ (kN/m3)
1Effective Friction Angle φ’ (°)
1 Effective Cohesion
C’ (MPa)
2Undrained Shear Strength
Su (kPa)
Silty sand and gravel mixture (FILL) 21 30 N/A N/A Firm to stiff fat CLAY (CH) 17 28 5.5 50-57 3Silt (ML) 20 28 N/A N/A Firm to stiff fat CLAY (CH) 17 28 5.5 50 -55 OPSS Select Subgrade Material 19 32 N/A N/A
Notes: 1 The friction angle is applicable to drained conditions only 2 The shear strength is applicable to undrained conditions only 3 A series of silt seams present within the fat clay layer is modeled as a silt layer
6.3 SEISMIC LOADING
6.3.1 Site Class
Based on publicly available boreholes information in the vicinity of the site (MOECC Well Database), the subsurface conditions within the study limits consist of deposits of clay overlaying limestone bedrock, where the bedrock is deeper than 25 m below ground surface.
Based on the anticipated bedrock depth and the subsurface condition encountered during Stantec geotechnical investigation, it is recommended that Site Class E as defined in Section 4.4.3 of the CHBDC (2014) be used in the seismic design.
6.3.2 Peak Ground Acceleration (PGA)
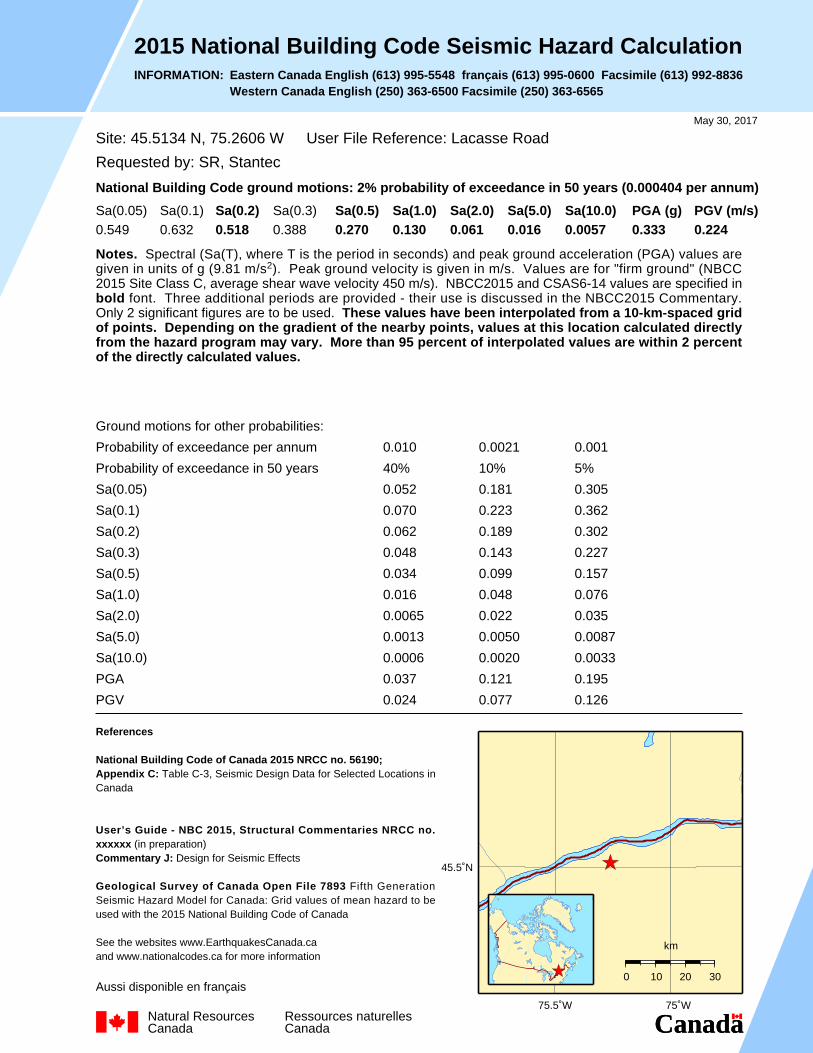
Seismic hazard values for the location of the Lacasse Road were obtained from Natural Resources Canada (2015 National Building Code). Table 6.2 below summarizes the parameters obtained and recommended for use in the design based on a 2475-year return period.
Table 6.2: Peak Ground Acceleration Data 𝑷𝑷𝑷𝑷𝑷𝑷 𝑺𝑺𝒂𝒂(0.2) 𝑷𝑷𝑷𝑷𝑷𝑷ref Site Class Site Adjusted 𝑷𝑷𝑷𝑷𝑷𝑷
0.333g 0.518g 0.2664g E 0.354g The 2015 NBC Seismic Hazard calculation sheet for Lacasse Road is provided in Appendix F.
6.3.3 Liquefaction Potential
In general, clayey soils remain non-susceptible to liquefaction, although sensitive clays can exhibit strain-softening behavior similar to that of liquefied granular soils. The recorded soil sensitivities are ranges from 0 to 23 (low to highly sensitive). It is our understanding that no
LACASSE ROAD SLOPE STABILITY ASSESSMENT September 2017
9
earthquake induced slope instability was recorded in the project area and no significant shear strength degradation of Leda clay was reported under seismic loading conditions. Based on the above understanding, a potential for soil liquefaction at the site may be not significant.
6.4 GROUNDWATER REGIME
The phreatic surface (groundwater) was estimated based on the highest groundwater measured in the standpipe at the toe of the bank. The estimated phreatic surface is shown as a blue dashed line on the Slope/W output, found in Appendix E. The groundwater levels used in the slope stability analyses are based on the following assumptions:
1. Groundwater levels measured from standpipe reading at the toe of the bank are approximately the existing groundwater level at the time of measurement.
2. A saturated condition (i.e. a raised groundwater level as suggested in the City of Ottawa guidelines).
6.5 SLOPE STABILITY RESULTS FOR EXISTING GROUND BANK
In general, a Factor of Safety (FOS) of 1.3 is accepted by most road authorities (including Ministry of Transportation Ontario) for a road side bank. An FOS of1.5 is required for more critical banks such as bridge forward banks and earth retaining structures. An FOS of 1.0 is typically accepted for a pseudo-static slope stability assessment, if PGA of 2475 years return period is utilized.
The City of Ottawa guidelines suggests an FOS of1.5 and 1.1 under static and seismic conditions, respectively. The strict use of City of Ottawa guidelines may be somewhat conservative for this project and consideration for an adjusted FOS would allow for more cost effective stability mitigation options. It should also be noted that no significant structures (e.g. houses) are located near to the bank and the anticipated traffic volume on the Lacasse Road (gravel paved road) may be minimal.
6.5.1 Existing Ground Bank
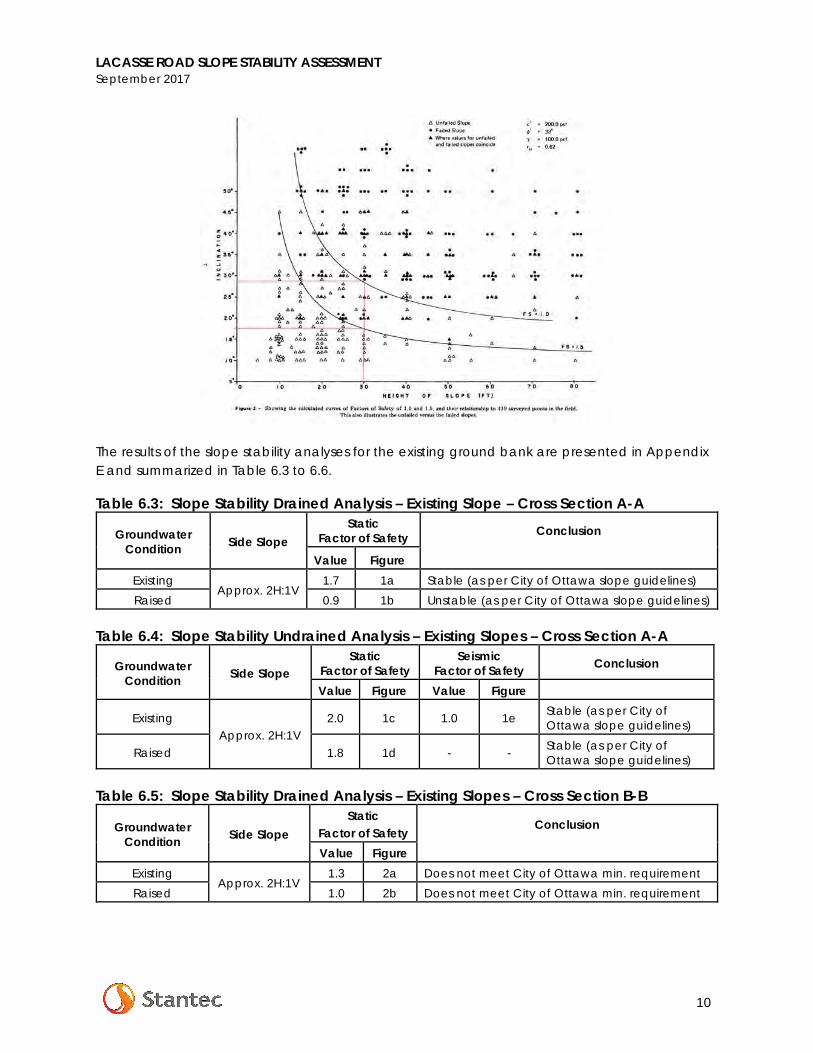
The ground bank is currently sloped at approximately 2H:1V or steeper. The following graph indicates that 2H:1V slopes (slope angle of about 27 degrees) in the Ottawa area have an insufficient safety margin (i.e. FOS is about 1). To align with the City of Ottawa suggested FOS of 1.5 a slope of about 3H:1V (slope angle about 18 degrees) is required for a permanent condition.
LACASSE ROAD SLOPE STABILITY ASSESSMENT September 2017
10
The results of the slope stability analyses for the existing ground bank are presented in Appendix E and summarized in Table 6.3 to 6.6.
Table 6.3: Slope Stability Drained Analysis – Existing Slope – Cross Section A-A
Table 6.4: Slope Stability Undrained Analysis – Existing Slopes – Cross Section A-A
Table 6.5: Slope Stability Drained Analysis – Existing Slopes – Cross Section B-B
Groundwater Condition Side Slope
Static Factor of Safety Conclusion
Value Figure
Existing Approx. 2H:1V
1.7 1a Stable (as per City of Ottawa slope guidelines) Raised 0.9 1b Unstable (as per City of Ottawa slope guidelines)
Groundwater Condition Side Slope
Static Factor of Safety
Seismic Factor of Safety Conclusion
Value Figure Value Figure
Existing Approx. 2H:1V
2.0 1c 1.0 1e Stable (as per City of Ottawa slope guidelines)
Raised 1.8 1d - - Stable (as per City of Ottawa slope guidelines)
Groundwater Condition Side Slope
Static Factor of Safety
Conclusion
Value Figure Existing
Approx. 2H:1V 1.3 2a Does not meet City of Ottawa min. requirement
Raised 1.0 2b Does not meet City of Ottawa min. requirement

LACASSE ROAD SLOPE STABILITY ASSESSMENT September 2017
11
Table 6.6: Slope Stability Undrained Analysis – Existing Slopes - Cross Section B-B
Cross-section A-A fails under drained condition and a high groundwater table (back analysis of the failed section). The following section outlines our mitigation options and recommendation to stabilize the bank.
7.0 RECOMMENDATIONS
The site observations and slope stability analyses indicate that the overall east bank of the Lacasse Road within the project limit is unstable (some sections having already failed) and will require stabilization to permit the continued use as a public roadway. Various mitigation measures have been considered for this project.
7.1 OPTION A – LOCALIZED REPAIR
The existing road could be repaired with the placement of additional fill material and reinstatement of the granular shoulder and impacted guard rail. However, as noted the existing road side bank is considered unstable and has already failed in sections. The placement of additional fill at the crest of the bank will further decrease the overall stability. Any road repair without bank stabilization work is not recommended.
7.2 OPTION B – TOE BERM
This option will include the removal of all failed soil mass (excavation), including surficial material (e.g. vegetation and unsuitable surficial material), and the replacement with OPSS Select Subgrade Material (SSM) or better to restore the existing 2H:1V slope. Proper benching - minimum OPSS 208.010 or as per City of Ottawa “Benching of Earth Slopes” drawing R18, should be implemented to enhance the stability. New fill material should be placed in maximum 300 mm thick loose lifts and compacted to 95% Standard Proctor Maximum Dry Density (SPMDD). It should be noted that OPSS SSM is not a free draining material and proper groundwater control measures (e.g. continuous drainage layer at the base of the fill or heel drains at each bench with positive drainage outlets) should be provided to minimize possible saturation of the reinstated portion. Surface water control such as a roadside drainage ditch should also be maintained to minimize the surface water infiltration to the bank. A berm with a minimum height of 4 m and top width of 4 m consisting of OPSS SSM sloped at 2H:1V, may be considered to counter balance the possible bank movement. This option would require property acquisition. To enhance the stability and long term performance of bank consideration can be given to the
Groundwater Condition Side Slope
Static Factor of Safety
Seismic Factor of Safety
Conclusion
Value Figure Value Figure
Existing Approx. 2H:1V
1.9 2c 1.0 2e Does not meet City of Ottawa min. requirement
Raised 1.7 2d - - Stable
LACASSE ROAD SLOPE STABILITY ASSESSMENT September 2017
12
use of geosynthetic reinforcement within the fill (e.g. geo-grid) and at the bank face (e.g. geo-web).
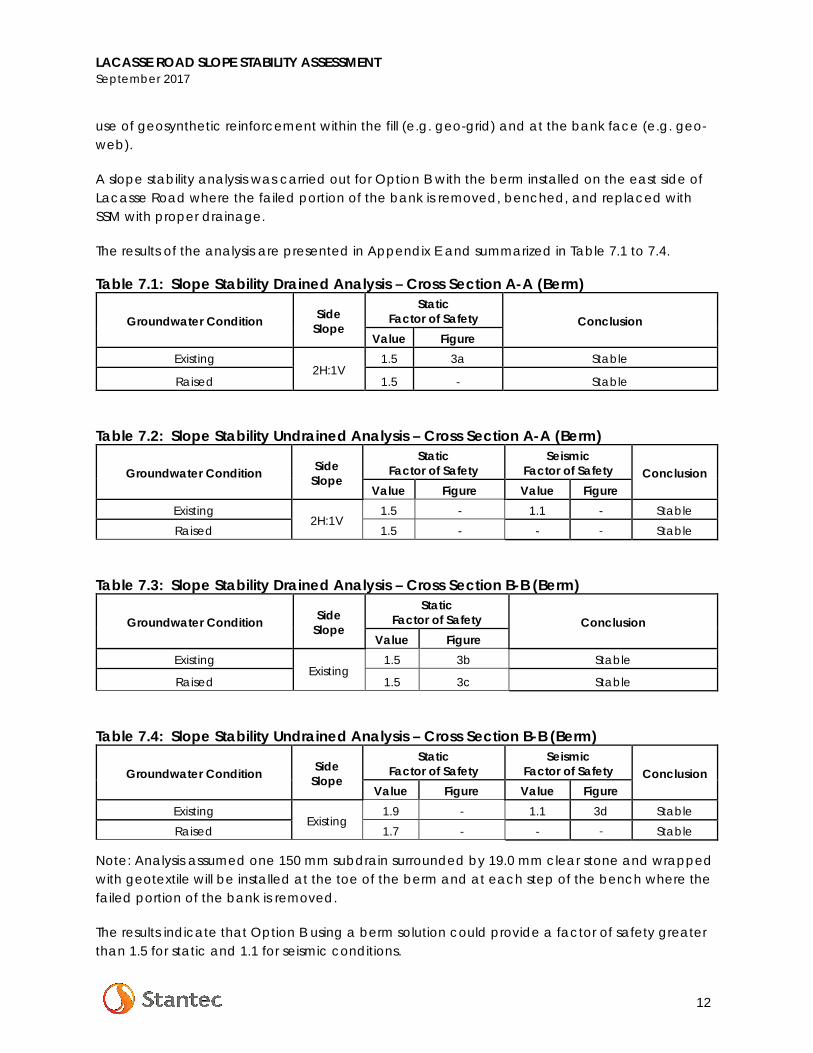
A slope stability analysis was carried out for Option B with the berm installed on the east side of Lacasse Road where the failed portion of the bank is removed, benched, and replaced with SSM with proper drainage.
The results of the analysis are presented in Appendix E and summarized in Table 7.1 to 7.4.
Table 7.1: Slope Stability Drained Analysis – Cross Section A-A (Berm)
Table 7.2: Slope Stability Undrained Analysis – Cross Section A-A (Berm)
Table 7.3: Slope Stability Drained Analysis – Cross Section B-B (Berm)
Table 7.4: Slope Stability Undrained Analysis – Cross Section B-B (Berm)
Note: Analysis assumed one 150 mm subdrain surrounded by 19.0 mm clear stone and wrapped with geotextile will be installed at the toe of the berm and at each step of the bench where the failed portion of the bank is removed.
The results indicate that Option B using a berm solution could provide a factor of safety greater than 1.5 for static and 1.1 for seismic conditions.
Groundwater Condition Side Slope
Static Factor of Safety Conclusion
Value Figure Existing
2H:1V 1.5 3a Stable
Raised 1.5 - Stable
Groundwater Condition Side Slope
Static Factor of Safety
Seismic Factor of Safety Conclusion
Value Figure Value Figure Existing
2H:1V 1.5 - 1.1 - Stable
Raised 1.5 - - - Stable
Groundwater Condition Side Slope
Static Factor of Safety Conclusion
Value Figure Existing
Existing 1.5 3b Stable
Raised 1.5 3c Stable
Groundwater Condition Side Slope
Static Factor of Safety
Seismic Factor of Safety Conclusion
Value Figure Value Figure Existing
Existing 1.9 - 1.1 3d Stable
Raised 1.7 - - - Stable
LACASSE ROAD SLOPE STABILITY ASSESSMENT September 2017
13
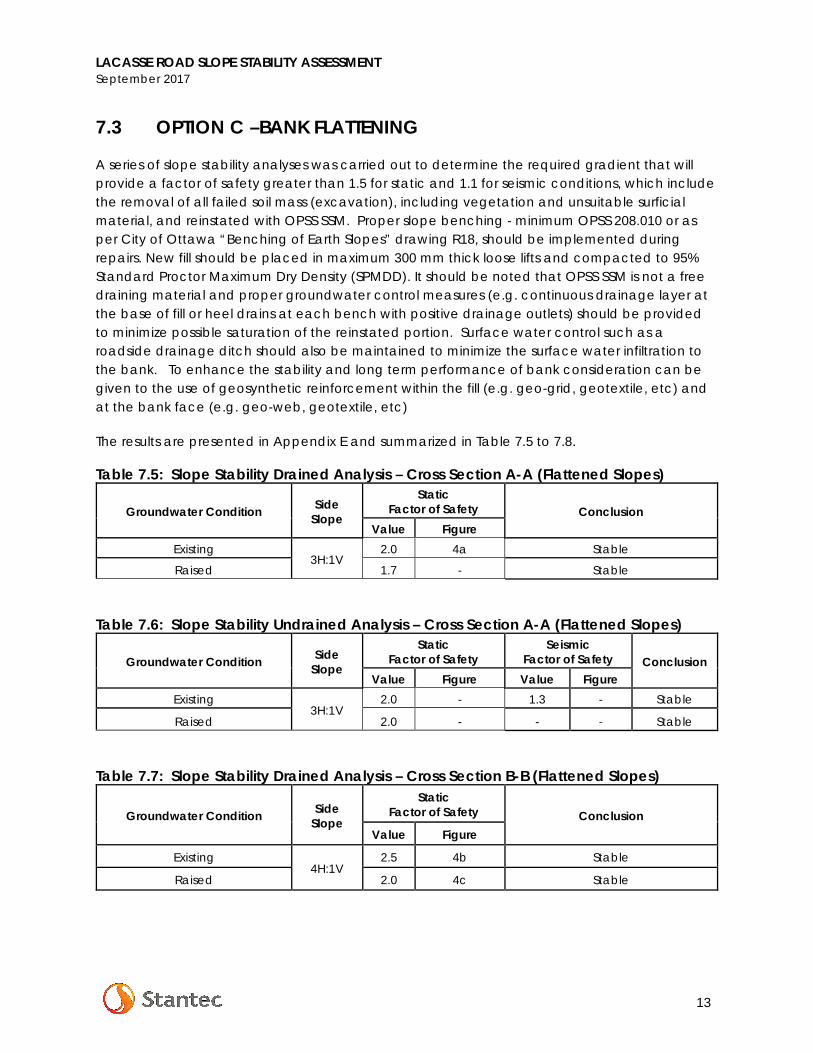
7.3 OPTION C –BANK FLATTENING
A series of slope stability analyses was carried out to determine the required gradient that will provide a factor of safety greater than 1.5 for static and 1.1 for seismic conditions, which include the removal of all failed soil mass (excavation), including vegetation and unsuitable surficial material, and reinstated with OPSS SSM. Proper slope benching - minimum OPSS 208.010 or as per City of Ottawa “Benching of Earth Slopes” drawing R18, should be implemented during repairs. New fill should be placed in maximum 300 mm thick loose lifts and compacted to 95% Standard Proctor Maximum Dry Density (SPMDD). It should be noted that OPSS SSM is not a free draining material and proper groundwater control measures (e.g. continuous drainage layer at the base of fill or heel drains at each bench with positive drainage outlets) should be provided to minimize possible saturation of the reinstated portion. Surface water control such as a roadside drainage ditch should also be maintained to minimize the surface water infiltration to the bank. To enhance the stability and long term performance of bank consideration can be given to the use of geosynthetic reinforcement within the fill (e.g. geo-grid, geotextile, etc) and at the bank face (e.g. geo-web, geotextile, etc)
The results are presented in Appendix E and summarized in Table 7.5 to 7.8.
Table 7.5: Slope Stability Drained Analysis – Cross Section A-A (Flattened Slopes)
Table 7.6: Slope Stability Undrained Analysis – Cross Section A-A (Flattened Slopes)
Table 7.7: Slope Stability Drained Analysis – Cross Section B-B (Flattened Slopes)
Groundwater Condition Side Slope
Static Factor of Safety Conclusion
Value Figure Existing
3H:1V 2.0 4a Stable
Raised 1.7 - Stable
Groundwater Condition Side Slope
Static Factor of Safety
Seismic Factor of Safety Conclusion
Value Figure Value Figure Existing
3H:1V 2.0 - 1.3 - Stable
Raised 2.0 - - - Stable
Groundwater Condition Side Slope
Static Factor of Safety Conclusion
Value Figure
Existing 4H:1V
2.5 4b Stable
Raised 2.0 4c Stable
LACASSE ROAD SLOPE STABILITY ASSESSMENT September 2017
14
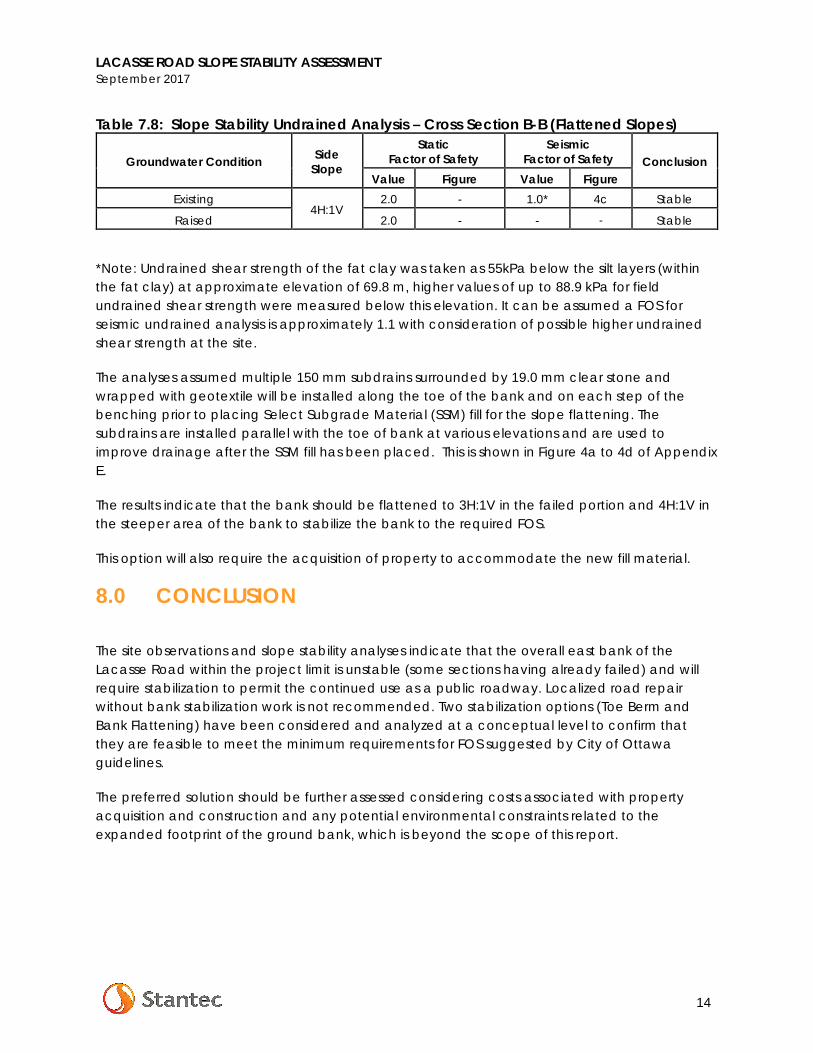
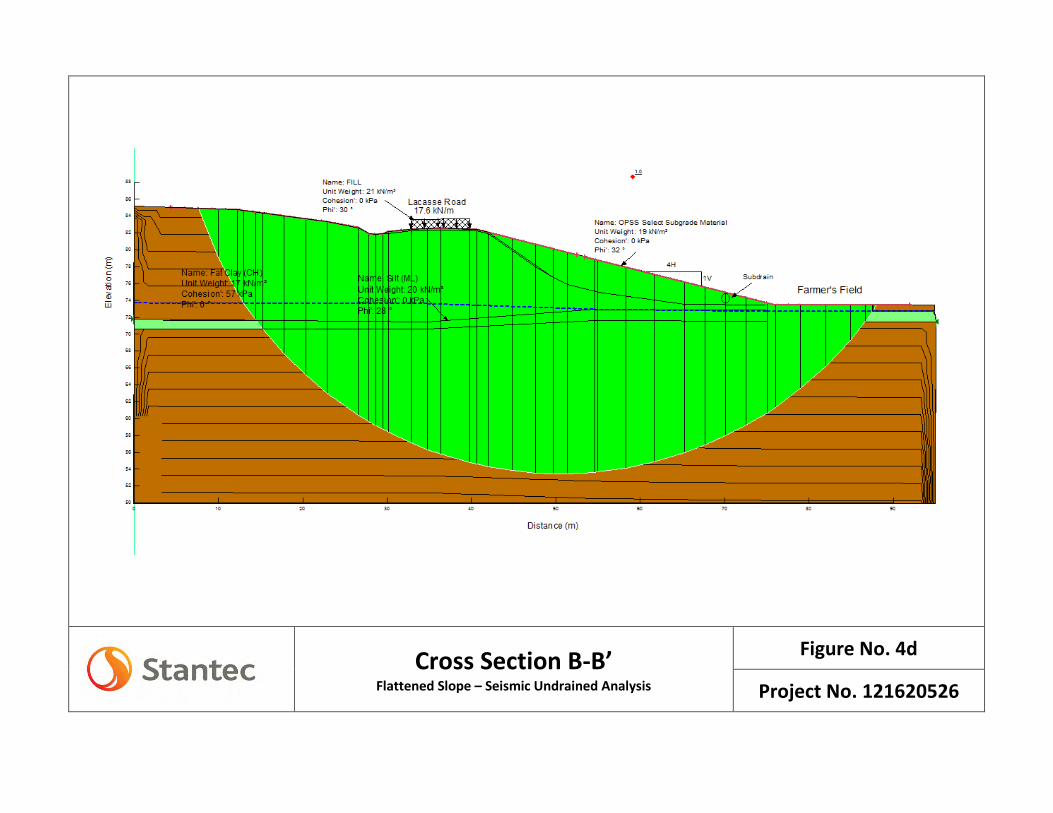
Table 7.8: Slope Stability Undrained Analysis – Cross Section B-B (Flattened Slopes)
*Note: Undrained shear strength of the fat clay was taken as 55kPa below the silt layers (within the fat clay) at approximate elevation of 69.8 m, higher values of up to 88.9 kPa for field undrained shear strength were measured below this elevation. It can be assumed a FOS for seismic undrained analysis is approximately 1.1 with consideration of possible higher undrained shear strength at the site.
The analyses assumed multiple 150 mm subdrains surrounded by 19.0 mm clear stone and wrapped with geotextile will be installed along the toe of the bank and on each step of the benching prior to placing Select Subgrade Material (SSM) fill for the slope flattening. The subdrains are installed parallel with the toe of bank at various elevations and are used to improve drainage after the SSM fill has been placed. This is shown in Figure 4a to 4d of Appendix E.
The results indicate that the bank should be flattened to 3H:1V in the failed portion and 4H:1V in the steeper area of the bank to stabilize the bank to the required FOS.
This option will also require the acquisition of property to accommodate the new fill material.
8.0 CONCLUSION
The site observations and slope stability analyses indicate that the overall east bank of the Lacasse Road within the project limit is unstable (some sections having already failed) and will require stabilization to permit the continued use as a public roadway. Localized road repair without bank stabilization work is not recommended. Two stabilization options (Toe Berm and Bank Flattening) have been considered and analyzed at a conceptual level to confirm that they are feasible to meet the minimum requirements for FOS suggested by City of Ottawa guidelines.
The preferred solution should be further assessed considering costs associated with property acquisition and construction and any potential environmental constraints related to the expanded footprint of the ground bank, which is beyond the scope of this report.
Groundwater Condition Side Slope
Static Factor of Safety
Seismic Factor of Safety Conclusion
Value Figure Value Figure Existing
4H:1V 2.0 - 1.0* 4c Stable
Raised 2.0 - - - Stable

LACASSE ROAD SLOPE STABILITY ASSESSMENT September 2017
16
10.0 REFERENCES
City of Ottawa, ‘Slope Stability Guidelines For Development Applications(http://documents.ottawa.ca/en/document/slope-stability-guidelines-development-applications)
M.A. Klugman & P. Chung, ‘Slope Stability Study of the Regional Municipality of Ottawa-Carleton Ontario Canada’, 1976

LACASSE ROAD SLOPE STABILITY ASSESSMENT September 2017
APPENDIX A Statement of General Conditions
STATEMENT OF GENERAL CONDITIONS USE OF THIS REPORT: This report has been prepared for the sole benefit of the Client or its agent and may not be used by any third party without the express written consent of Stantec Consulting Ltd. and the Client. Any use which a third party makes of this report is the responsibility of such third party. BASIS OF THE REPORT: The information, opinions, and/or recommendations made in this report are in accordance with Stantec Consulting Ltd.’s present understanding of the site specific project as described by the Client. The applicability of these is restricted to the site conditions encountered at the time of the investigation or study. If the proposed site specific project differs or is modified from what is described in this report or if the site conditions are altered, this report is no longer valid unless Stantec Consulting Ltd. is requested by the Client to review and revise the report to reflect the differing or modified project specifics and/or the altered site conditions. STANDARD OF CARE: Preparation of this report, and all associated work, was carried out in accordance with the normally accepted standard of care in the state or province of execution for the specific professional service provided to the Client. No other warranty is made. INTERPRETATION OF SITE CONDITIONS: Soil, rock, or other material descriptions, and statements regarding their condition, made in this report are based on site conditions encountered by Stantec Consulting Ltd. at the time of the work and at the specific testing and/or sampling locations. Classifications and statements of condition have been made in accordance with normally accepted practices which are judgmental in nature; no specific description should be considered exact, but rather reflective of the anticipated material behavior. Extrapolation of in situ conditions can only be made to some limited extent beyond the sampling or test points. The extent depends on variability of the soil, rock and groundwater conditions as influenced by geological processes, construction activity, and site use. VARYING OR UNEXPECTED CONDITIONS: Should any site or subsurface conditions be encountered that are different from those described in this report or encountered at the test locations, Stantec Consulting Ltd. must be notified immediately to assess if the varying or unexpected conditions are substantial and if reassessments of the report conclusions or recommendations are required. Stantec Consulting Ltd. will not be responsible to any party for damages incurred as a result of failing to notify Stantec Consulting Ltd. that differing site or sub-surface conditions are present upon becoming aware of such conditions. PLANNING, DESIGN, OR CONSTRUCTION: Development or design plans and specifications should be reviewed by Stantec Consulting Ltd., sufficiently ahead of initiating the next project stage (property acquisition, tender, construction, etc), to confirm that this report completely addresses the elaborated project specifics and that the contents of this report have been properly interpreted. Specialty quality assurance services (field observations and testing) during construction are a necessary part of the evaluation of sub-subsurface conditions and site preparation works. Site work relating to the recommendations included in this report should only be carried out in the presence of a qualified geotechnical engineer; Stantec Consulting Ltd. cannot be responsible for site work carried out without being present.
LACASSE ROAD SLOPE STABILITY ASSESSMENT September 2017
APPENDIX B Drawing No. 1 – Key Plan
Drawing No. 2 – Borehole Location Plan
Drawing No. 3 – Section A-A
Drawing No. 4 – Section B-B
ORLEA
NSBOULE V
ARD
INNES RO AD
10TH LINE ROA D
MER BLEU E RO AD
OttawaQuébec
OntarioNew York
402000
402000
5042
000
5042
000
Disclaimer: Stantec assumes no responsibility for data supplied in electronic format. The recipient accepts full responsibility for verifying the accuracy and completeness of the data. The recipient releases Stantec, its officers, employees, consultants and agents, from any and all claims arising in any way from the content or provision of the data.
0 500 1,000
metres1:15,000 (at original document size of 8.5x11)
*
1
SITE
Prepared by Gliceria Briones on 2017-05-29
Key Plan
Notes1. Coordinate System: NAD 1983 MTM Zone 9.2. Base features produced under license with the OntarioMinistry of Natural Resources and Forestry © Queen'sPrinter for Ontario, 2016.3. Imagery provided by ESRI ©2017.
KEY MAP
T:\A
utoc
ad
\Dra
win
gs\P
roje
ct D
raw
ing
s\20
17\1
2162
0526
\GIS
\121
6205
26_K
ey P
lan.
mxd
Revi
sed
: 201
7-05
-29
By: g
brio
nes
Project No.121620526Lacasse Road,Clarence-RocklandOttawa, Ontario
CITY OF CLARENCE-ROCKLANDLACASSE ROAD SLOPE STABILITY ASSESSMENT
Drawing No.
Title
Project Location
Client/Project
Lacasse Road
Baseline Road
A
A'
B'
B
BH 17-3
MAY 2017PROJECT No. 121620526
CITY OF CLARENCE-ROCKLANDLACASSE ROAD SLOPE STABILITY ASSESSMENT
2
BOREHOLE LOCATION PLAN
NOTES1. COORDINATE SYSTEM: NAD 1983 MTM ZONE 9.2. BASEPLAN: SCREEN SHOT FROM GOOGLE
EARTH PRO, 2017.
LEGENDAPPROXIMATE BOREHOLE LOCATION
LOCATION OF PROFILE LINE
0
1 : 400
4 m 4 8 m
A A'

85
83828180797877767574
8485
83828180797877767574
84
ELEV
ATIO
N (m
)
0 10 20 30 40 50DISTANCE (m)
JUNE 2017PROJECT No. 121620526
CITY OF CLARENCE-ROCKLANDLACASSE ROAD SLOPE STABILITY ASSESSMENT
3
PROFILE A-A'
0
1 : 300
3 m 3 6 m
85
83828180797877767574
8485
83828180797877767574
84
86
7373
86
0 10 20 30 40 50
DISTANCE (m)
60
ELEV
ATIO
N (m
)
JUNE 2017PROJECT No. 121620526
CITY OF CLARENCE-ROCKLANDLACASSE ROAD SLOPE STABILITY ASSESSMENT
4
PROFILE B-B'
0
1 : 300
3 m 3 6 m
LACASSE ROAD SLOPE STABILITY ASSESSMENT September 2017
APPENDIX C Symbols and Terms Used on Borehole and Test Pit Records
Borehole Records
Site Photographs
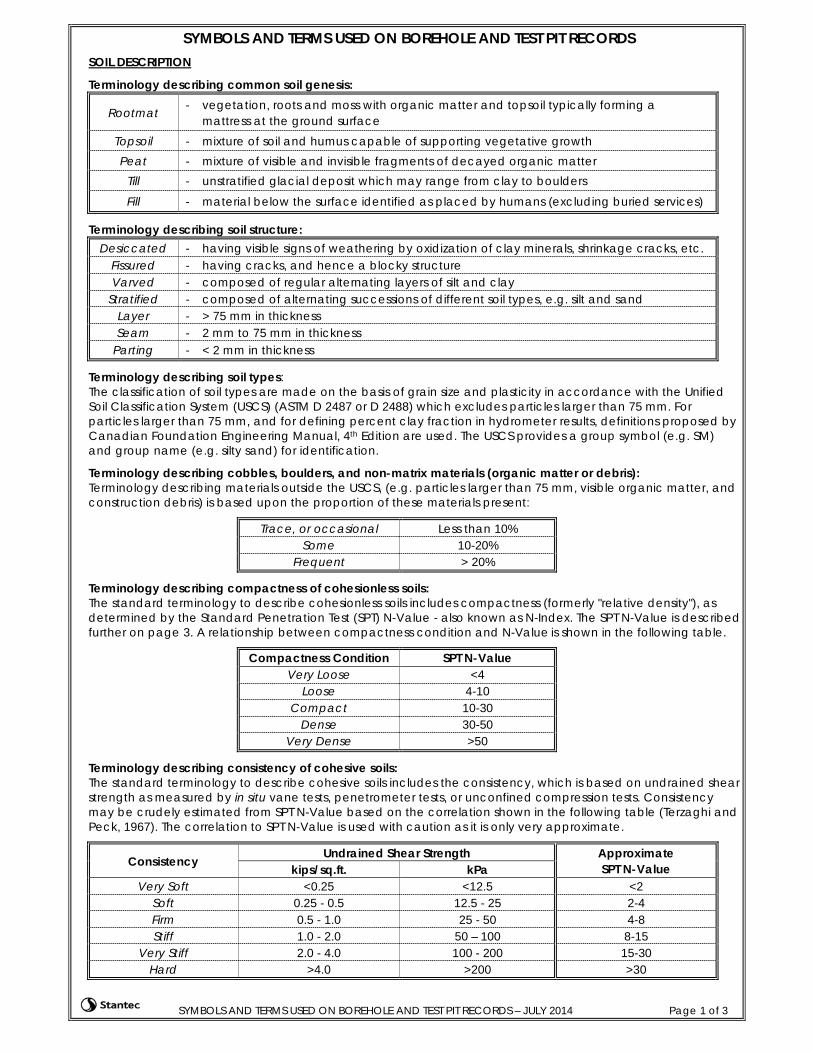
SYMBOLS AND TERMS USED ON BOREHOLE AND TEST PIT RECORDS – JULY 2014 Page 1 of 3
SYMBOLS AND TERMS USED ON BOREHOLE AND TEST PIT RECORDS SOIL DESCRIPTION
Terminology describing common soil genesis:
Rootmat - vegetation, roots and moss with organic matter and topsoil typically forming a mattress at the ground surface
Topsoil - mixture of soil and humus capable of supporting vegetative growth Peat - mixture of visible and invisible fragments of decayed organic matter
Till - unstratified glacial deposit which may range from clay to boulders
Fill - material below the surface identified as placed by humans (excluding buried services)
Terminology describing soil structure: Desiccated - having visible signs of weathering by oxidization of clay minerals, shrinkage cracks, etc.
Fissured - having cracks, and hence a blocky structure Varved - composed of regular alternating layers of silt and clay
Stratified - composed of alternating successions of different soil types, e.g. silt and sand Layer - > 75 mm in thickness Seam - 2 mm to 75 mm in thickness
Parting - < 2 mm in thickness
Terminology describing soil types: The classification of soil types are made on the basis of grain size and plasticity in accordance with the Unified Soil Classification System (USCS) (ASTM D 2487 or D 2488) which excludes particles larger than 75 mm. For particles larger than 75 mm, and for defining percent clay fraction in hydrometer results, definitions proposed by Canadian Foundation Engineering Manual, 4th Edition are used. The USCS provides a group symbol (e.g. SM) and group name (e.g. silty sand) for identification.
Terminology describing cobbles, boulders, and non-matrix materials (organic matter or debris): Terminology describing materials outside the USCS, (e.g. particles larger than 75 mm, visible organic matter, and construction debris) is based upon the proportion of these materials present:
Trace, or occasional Less than 10% Some 10-20%
Frequent > 20%
Terminology describing compactness of cohesionless soils: The standard terminology to describe cohesionless soils includes compactness (formerly "relative density"), as determined by the Standard Penetration Test (SPT) N-Value - also known as N-Index. The SPT N-Value is described further on page 3. A relationship between compactness condition and N-Value is shown in the following table.
Compactness Condition SPT N-Value Very Loose <4
Loose 4-10 Compact 10-30
Dense 30-50 Very Dense >50
Terminology describing consistency of cohesive soils: The standard terminology to describe cohesive soils includes the consistency, which is based on undrained shear strength as measured by in situ vane tests, penetrometer tests, or unconfined compression tests. Consistency may be crudely estimated from SPT N-Value based on the correlation shown in the following table (Terzaghi and Peck, 1967). The correlation to SPT N-Value is used with caution as it is only very approximate.
Consistency Undrained Shear Strength Approximate SPT N-Value kips/sq.ft. kPa
Very Soft <0.25 <12.5 <2 Soft 0.25 - 0.5 12.5 - 25 2-4 Firm 0.5 - 1.0 25 - 50 4-8 Stiff 1.0 - 2.0 50 – 100 8-15
Very Stiff 2.0 - 4.0 100 - 200 15-30 Hard >4.0 >200 >30
SYMBOLS AND TERMS USED ON BOREHOLE AND TEST PIT RECORDS – JULY 2014 Page 2 of 3
ROCK DESCRIPTION
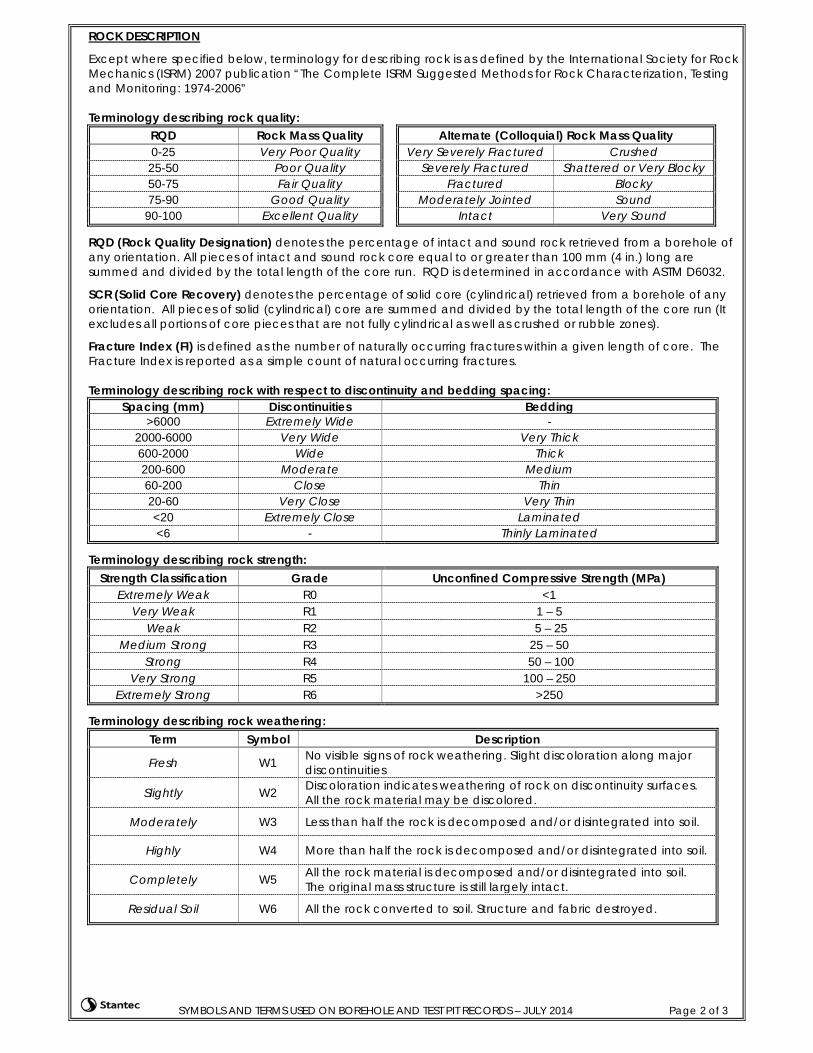
Except where specified below, terminology for describing rock is as defined by the International Society for Rock Mechanics (ISRM) 2007 publication “The Complete ISRM Suggested Methods for Rock Characterization, Testing and Monitoring: 1974-2006” Terminology describing rock quality:
RQD Rock Mass Quality Alternate (Colloquial) Rock Mass Quality 0-25 Very Poor Quality Very Severely Fractured Crushed 25-50 Poor Quality Severely Fractured Shattered or Very Blocky 50-75 Fair Quality Fractured Blocky 75-90 Good Quality Moderately Jointed Sound
90-100 Excellent Quality Intact Very Sound
RQD (Rock Quality Designation) denotes the percentage of intact and sound rock retrieved from a borehole of any orientation. All pieces of intact and sound rock core equal to or greater than 100 mm (4 in.) long are summed and divided by the total length of the core run. RQD is determined in accordance with ASTM D6032.
SCR (Solid Core Recovery) denotes the percentage of solid core (cylindrical) retrieved from a borehole of any orientation. All pieces of solid (cylindrical) core are summed and divided by the total length of the core run (It excludes all portions of core pieces that are not fully cylindrical as well as crushed or rubble zones).
Fracture Index (FI) is defined as the number of naturally occurring fractures within a given length of core. The Fracture Index is reported as a simple count of natural occurring fractures. Terminology describing rock with respect to discontinuity and bedding spacing:
Spacing (mm) Discontinuities
Bedding >6000 Extremely Wide -
2000-6000 Very Wide Very Thick 600-2000 Wide Thick 200-600 Moderate Medium 60-200 Close Thin 20-60 Very Close Very Thin <20 Extremely Close Laminated <6 - Thinly Laminated
Terminology describing rock strength: Strength Classification Grade Unconfined Compressive Strength (MPa)
Extremely Weak R0 <1 Very Weak R1 1 – 5
Weak R2 5 – 25 Medium Strong R3 25 – 50
Strong R4 50 – 100 Very Strong R5 100 – 250
Extremely Strong R6 >250
Terminology describing rock weathering: Term Symbol Description
Fresh W1 No visible signs of rock weathering. Slight discoloration along major discontinuities
Slightly W2 Discoloration indicates weathering of rock on discontinuity surfaces. All the rock material may be discolored.
Moderately W3 Less than half the rock is decomposed and/or disintegrated into soil.
Highly W4 More than half the rock is decomposed and/or disintegrated into soil.
Completely W5 All the rock material is decomposed and/or disintegrated into soil. The original mass structure is still largely intact.
Residual Soil W6 All the rock converted to soil. Structure and fabric destroyed.
SYMBOLS AND TERMS USED ON BOREHOLE AND TEST PIT RECORDS – JULY 2014 Page 3 of 3
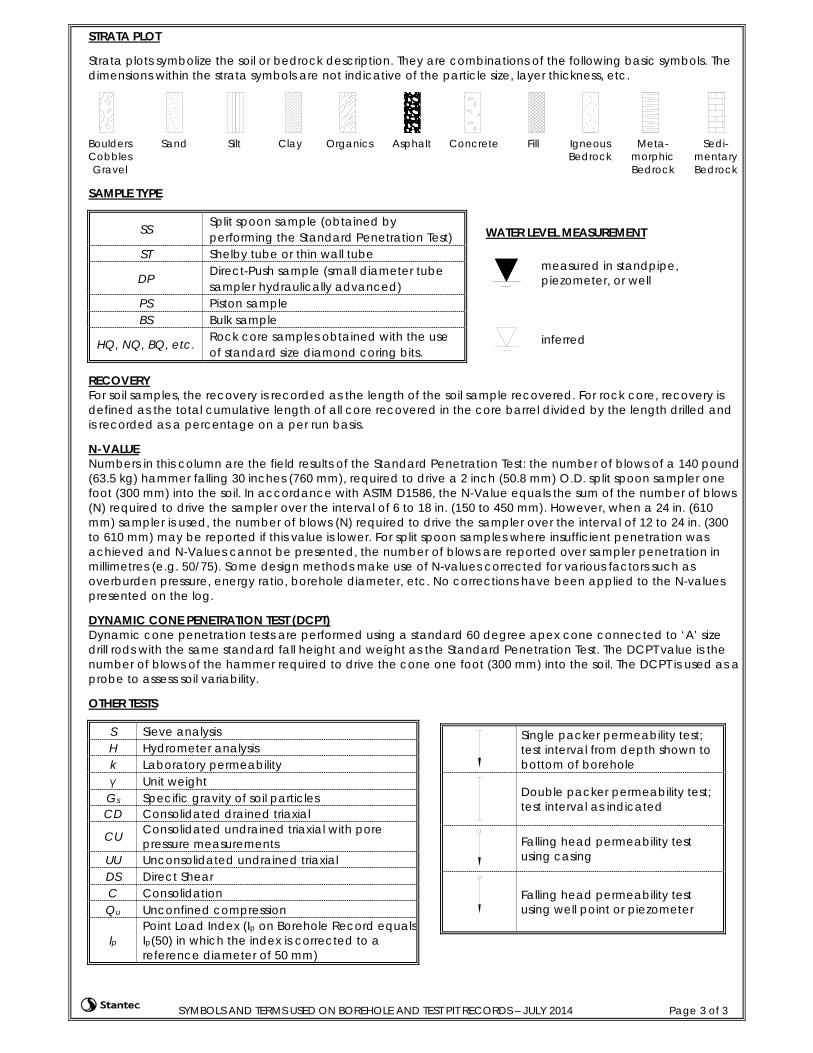
STRATA PLOT Strata plots symbolize the soil or bedrock description. They are combinations of the following basic symbols. The dimensions within the strata symbols are not indicative of the particle size, layer thickness, etc.
Boulders Cobbles Gravel
Sand Silt Clay Organics Asphalt Concrete Fill Igneous Bedrock
Meta-morphic Bedrock
Sedi-mentary Bedrock
SAMPLE TYPE
SS Split spoon sample (obtained by performing the Standard Penetration Test)
ST Shelby tube or thin wall tube
DP Direct-Push sample (small diameter tube sampler hydraulically advanced)
PS Piston sample BS Bulk sample
HQ, NQ, BQ, etc. Rock core samples obtained with the use of standard size diamond coring bits.
RECOVERY For soil samples, the recovery is recorded as the length of the soil sample recovered. For rock core, recovery is defined as the total cumulative length of all core recovered in the core barrel divided by the length drilled and is recorded as a percentage on a per run basis. N-VALUE Numbers in this column are the field results of the Standard Penetration Test: the number of blows of a 140 pound (63.5 kg) hammer falling 30 inches (760 mm), required to drive a 2 inch (50.8 mm) O.D. split spoon sampler one foot (300 mm) into the soil. In accordance with ASTM D1586, the N-Value equals the sum of the number of blows (N) required to drive the sampler over the interval of 6 to 18 in. (150 to 450 mm). However, when a 24 in. (610 mm) sampler is used, the number of blows (N) required to drive the sampler over the interval of 12 to 24 in. (300 to 610 mm) may be reported if this value is lower. For split spoon samples where insufficient penetration was achieved and N-Values cannot be presented, the number of blows are reported over sampler penetration in millimetres (e.g. 50/75). Some design methods make use of N-values corrected for various factors such as overburden pressure, energy ratio, borehole diameter, etc. No corrections have been applied to the N-values presented on the log. DYNAMIC CONE PENETRATION TEST (DCPT) Dynamic cone penetration tests are performed using a standard 60 degree apex cone connected to ‘A’ size drill rods with the same standard fall height and weight as the Standard Penetration Test. The DCPT value is the number of blows of the hammer required to drive the cone one foot (300 mm) into the soil. The DCPT is used as a probe to assess soil variability. OTHER TESTS
S Sieve analysis H Hydrometer analysis k Laboratory permeability γ Unit weight
Gs Specific gravity of soil particles CD Consolidated drained triaxial
CU Consolidated undrained triaxial with pore pressure measurements
UU Unconsolidated undrained triaxial DS Direct Shear C Consolidation Qu Unconfined compression
Ip Point Load Index (Ip on Borehole Record equals Ip(50) in which the index is corrected to a reference diameter of 50 mm)
WATER LEVEL MEASUREMENT
measured in standpipe, piezometer, or well
inferred
Single packer permeability test; test interval from depth shown to bottom of borehole
Double packer permeability test; test interval as indicated
Falling head permeability test using casing
Falling head permeability test using well point or piezometer

250 mm FILL: grey silty sandand gravel mixture
Stiff, reddish brown fat CLAY(CH)
Grey to brown below 1.8 mdepth
Silt seams between 10.4 and 11.3m depth
1
2
3
4
5
6
7
8
9
10
11
12
13
14
15
16
17
81,6
71,5
70,6
23
15
7
6
4
2
4
1
2
0
5
1
1
7
0
0
0
250
350
350
600
600
600
600
600
600
-
600
600
600
600
600
600
600
SS
SS
SS
SS
SS
SS
SS
SS
SS
SS
SS
VNVN
SS
VNVN
SS
SS
SS
VNVN
SS
VNVN
SS
VNVN
81,84
W
DATES: BORING
OR
RQ
D
50 100 150 200
City of Clarence-Rockland
DATUM
DE
PT
H (
m)
ELE
VA
TIO
N (
m)
ST
RA
TA
PLO
T
NU
MB
ER
RE
CO
VE
RY
(mm
)
N-V
ALU
E
BH17-1
121620526
12.2 m (May 29)May 24, 2017
N: 5 040 021 E: 479 640
CLIENT
Inferred Groundwater Level
SAMPLES
Remoulded Vane Test, kPaPocket Penetrometer Test, kPa
10 20 30 40 50 60 70 80 90
LSOIL DESCRIPTION
TY
PE
Date
WATER CONTENT & ATTERBERG LIMITSW
1 of 2
DYNAMIC PENETRATION TEST, BLOWS/0.3m
Lacasse Road
Geodetic
BOREHOLE No.
0
1
2
3
4
5
6
7
8
9
10
11
12
13
14
15
UNDRAINED SHEAR STRENGTH - kPa
Field Vane Test, kPa
STANDARD PENETRATION TEST, BLOWS/0.3m
App'd
WATER LEVEL
WA
TE
R L
EV
EL
Groundwater Level Measured in Standpipe
PW
LOCATION PROJECT No.
BOREHOLE RECORD BH17-1
ST
N13
-ST
AN
-GE
O 1
216
2052
6 L
AC
CA
SE
RO
AD
SLO
PE
ST
AB
ILIT
Y.G
PJ
SM
AR
T.G
DT
6/1
5/17
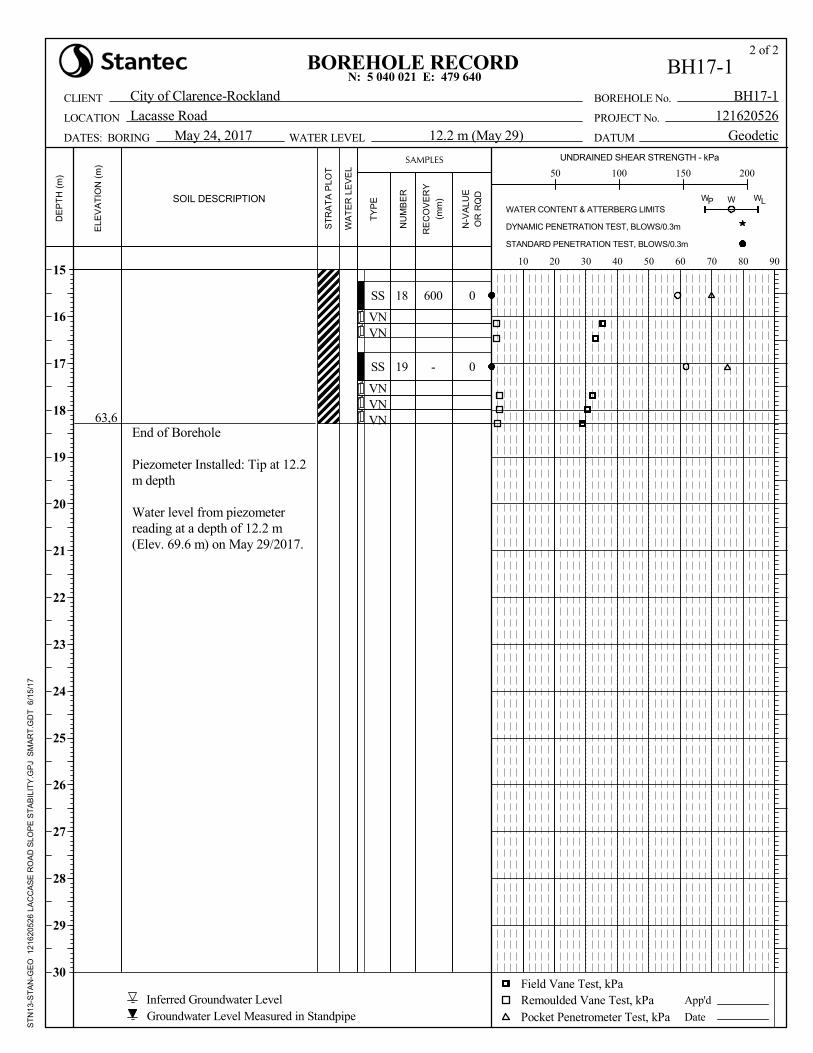
End of Borehole
Piezometer Installed: Tip at 12.2m depth
Water level from piezometerreading at a depth of 12.2 m(Elev. 69.6 m) on May 29/2017.
18
19
63,6
0
0
600
-
SS
VNVN
SS
VNVNVN
W
DATES: BORING
OR
RQ
D
50 100 150 200
City of Clarence-Rockland
DATUM
DE
PT
H (
m)
ELE
VA
TIO
N (
m)
ST
RA
TA
PLO
T
NU
MB
ER
RE
CO
VE
RY
(mm
)
N-V
ALU
E
BH17-1
121620526
12.2 m (May 29)May 24, 2017
N: 5 040 021 E: 479 640
CLIENT
Inferred Groundwater Level
SAMPLES
Remoulded Vane Test, kPaPocket Penetrometer Test, kPa
10 20 30 40 50 60 70 80 90
LSOIL DESCRIPTION
TY
PE
Date
WATER CONTENT & ATTERBERG LIMITSW
2 of 2
DYNAMIC PENETRATION TEST, BLOWS/0.3m
Lacasse Road
Geodetic
BOREHOLE No.
15
16
17
18
19
20
21
22
23
24
25
26
27
28
29
30
UNDRAINED SHEAR STRENGTH - kPa
Field Vane Test, kPa
STANDARD PENETRATION TEST, BLOWS/0.3m
App'd
WATER LEVEL
WA
TE
R L
EV
EL
Groundwater Level Measured in Standpipe
PW
LOCATION PROJECT No.
BOREHOLE RECORD BH17-1
ST
N13
-ST
AN
-GE
O 1
216
2052
6 L
AC
CA
SE
RO
AD
SLO
PE
ST
AB
ILIT
Y.G
PJ
SM
AR
T.G
DT
6/1
5/17
Firm to stiff, reddish-brown fatCLAY (CH)
- Moist
Silt seams between 1.3 and 2.6 mdepth
Firm to stiff, grey, fat CLAY(CH)
End of Borehole
Piezometer Installed: Tip at 5.9m depth
Water level from piezometerreading at a depth of 5.3 m (Elev.69.6 m) on May 29/2017.
1
2
3
4
5
6
7
8
9
10
11
72,9
71,6
65,3
6
12
8
12
5
2
3
2
3
3
4
350
560
500
380
500
600
600
600
600
600
-
SS
SS
SS
SS
SS
SS
SS
SS
VN
SS
VNVN
SSVN
VN
SS
VNVN
74,26
W
DATES: BORING
OR
RQ
D
50 100 150 200
City of Clarence-Rockland
DATUM
DE
PT
H (
m)
ELE
VA
TIO
N (
m)
ST
RA
TA
PLO
T
NU
MB
ER
RE
CO
VE
RY
(mm
)
N-V
ALU
E
BH17-2
121620526
5.3 m (May 29)May 9, 2017
N: 5 040 027 E: 479 661
CLIENT
Inferred Groundwater Level
SAMPLES
Remoulded Vane Test, kPaPocket Penetrometer Test, kPa
10 20 30 40 50 60 70 80 90
LSOIL DESCRIPTION
TY
PE
Date
WATER CONTENT & ATTERBERG LIMITSW
1 of 1
DYNAMIC PENETRATION TEST, BLOWS/0.3m
Lacasse Road
Geodetic
BOREHOLE No.
0
1
2
3
4
5
6
7
8
9
10
11
12
13
14
15
UNDRAINED SHEAR STRENGTH - kPa
Field Vane Test, kPa
STANDARD PENETRATION TEST, BLOWS/0.3m
App'd
WATER LEVEL
WA
TE
R L
EV
EL
Groundwater Level Measured in Standpipe
PW
LOCATION PROJECT No.
BOREHOLE RECORD BH17-2
ST
N13
-ST
AN
-GE
O 1
216
2052
6 L
AC
CA
SE
RO
AD
SLO
PE
ST
AB
ILIT
Y.G
PJ
SM
AR
T.G
DT
6/1
5/17

100 mm FILL: reddish brownclay
200 mm FILL: brown silty sand,trace gravel, with wood pieces
Very stiff, brown to reddishbrown fat CLAY (CH)
End of Borehole
1
2
3
80,880,6
79,0
8
13
27
200
300
450
SS
SS
SS
80,86
W
DATES: BORING
OR
RQ
D
50 100 150 200
City of Clarence-Rockland
DATUM
DE
PT
H (
m)
ELE
VA
TIO
N (
m)
ST
RA
TA
PLO
T
NU
MB
ER
RE
CO
VE
RY
(mm
)
N-V
ALU
E
BH17-3
121620526
May 24, 2017
N: 5 040 022 E: 479 648
CLIENT
Inferred Groundwater Level
SAMPLES
Remoulded Vane Test, kPaPocket Penetrometer Test, kPa
10 20 30 40 50 60 70 80 90
LSOIL DESCRIPTION
TY
PE
Date
WATER CONTENT & ATTERBERG LIMITSW
1 of 1
DYNAMIC PENETRATION TEST, BLOWS/0.3m
Lacasse Road
Geodetic
BOREHOLE No.
0
1
2
3
4
5
6
7
8
9
10
11
12
13
14
15
UNDRAINED SHEAR STRENGTH - kPa
Field Vane Test, kPa
STANDARD PENETRATION TEST, BLOWS/0.3m
App'd
WATER LEVEL
WA
TE
R L
EV
EL
Groundwater Level Measured in Standpipe
PW
LOCATION PROJECT No.
BOREHOLE RECORD BH17-3
ST
N13
-ST
AN
-GE
O 1
216
2052
6 L
AC
CA
SE
RO
AD
SLO
PE
ST
AB
ILIT
Y.G
PJ
SM
AR
T.G
DT
6/1
5/17
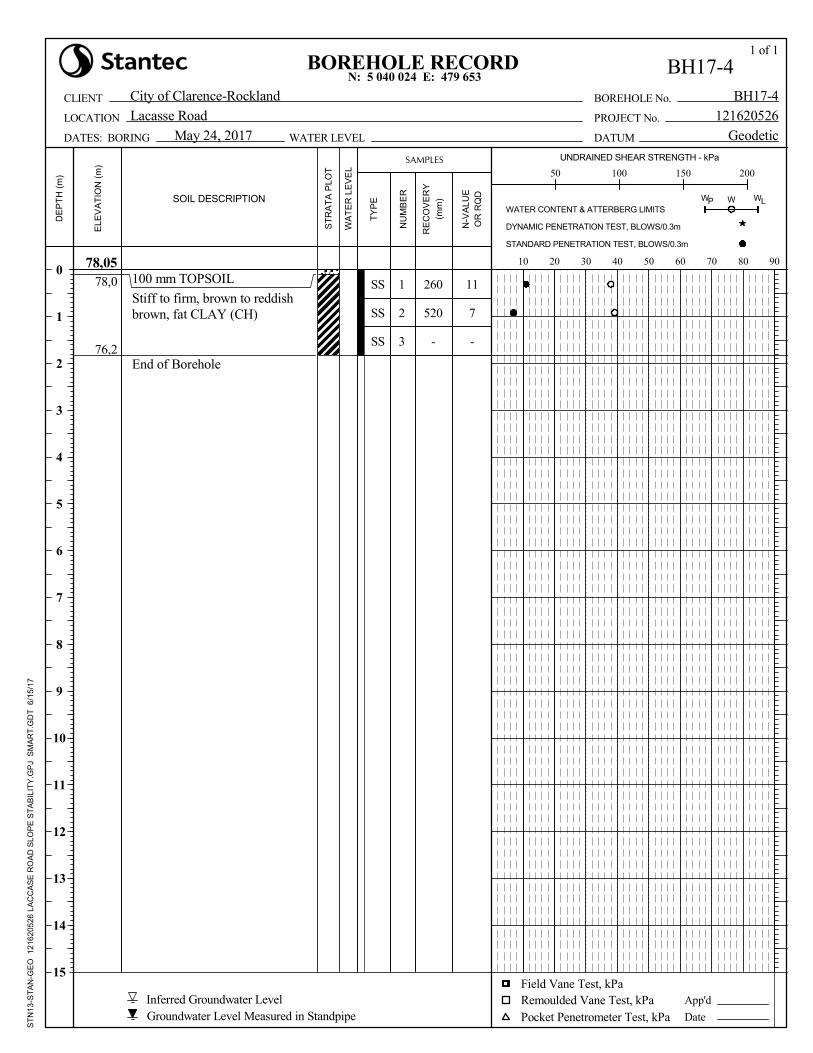
100 mm TOPSOIL
Stiff to firm, brown to reddishbrown, fat CLAY (CH)
End of Borehole
1
2
3
78,0
76,2
11
7
-
260
520
-
SS
SS
SS
78,05
W
DATES: BORING
OR
RQ
D
50 100 150 200
City of Clarence-Rockland
DATUM
DE
PT
H (
m)
ELE
VA
TIO
N (
m)
ST
RA
TA
PLO
T
NU
MB
ER
RE
CO
VE
RY
(mm
)
N-V
ALU
E
BH17-4
121620526
May 24, 2017
N: 5 040 024 E: 479 653
CLIENT
Inferred Groundwater Level
SAMPLES
Remoulded Vane Test, kPaPocket Penetrometer Test, kPa
10 20 30 40 50 60 70 80 90
LSOIL DESCRIPTION
TY
PE
Date
WATER CONTENT & ATTERBERG LIMITSW
1 of 1
DYNAMIC PENETRATION TEST, BLOWS/0.3m
Lacasse Road
Geodetic
BOREHOLE No.
0
1
2
3
4
5
6
7
8
9
10
11
12
13
14
15
UNDRAINED SHEAR STRENGTH - kPa
Field Vane Test, kPa
STANDARD PENETRATION TEST, BLOWS/0.3m
App'd
WATER LEVEL
WA
TE
R L
EV
EL
Groundwater Level Measured in Standpipe
PW
LOCATION PROJECT No.
BOREHOLE RECORD BH17-4
ST
N13
-ST
AN
-GE
O 1
216
2052
6 L
AC
CA
SE
RO
AD
SLO
PE
ST
AB
ILIT
Y.G
PJ
SM
AR
T.G
DT
6/1
5/17
Page 1 Page 1 Project No. 121620526
Photo No. 1: Groundwater seepage and sloughing located on the west side of Lacasse Road (Google street view 2015)
Page 2 Project No. 121620526
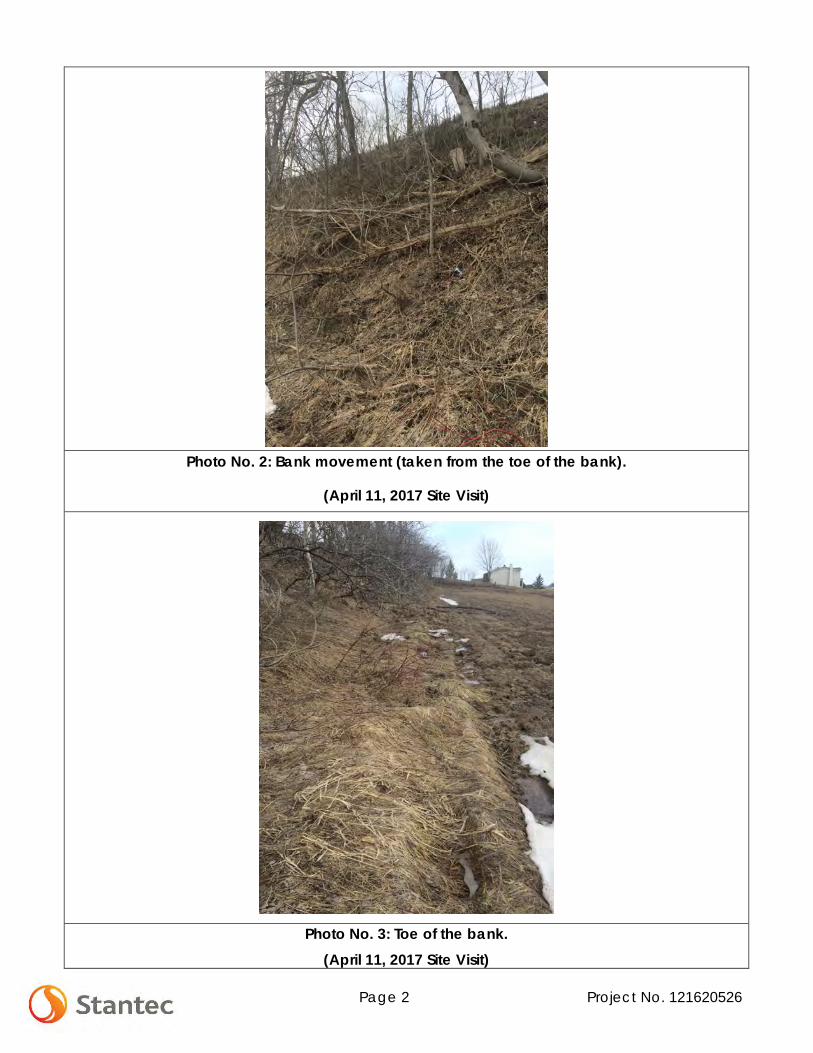
Photo No. 2: Bank movement (taken from the toe of the bank).
(April 11, 2017 Site Visit)
Photo No. 3: Toe of the bank. (April 11, 2017 Site Visit)
Page 3 Project No. 121620526
Photo No. 4: Settlement in the east gravel shoulder.
(April 11, 2017 Site Visit)
Photo No. 5: Severe longitudinal cracks in the east edge of the paved road and on the east
gravel shoulder. (April 11, 2017 Site Visit)
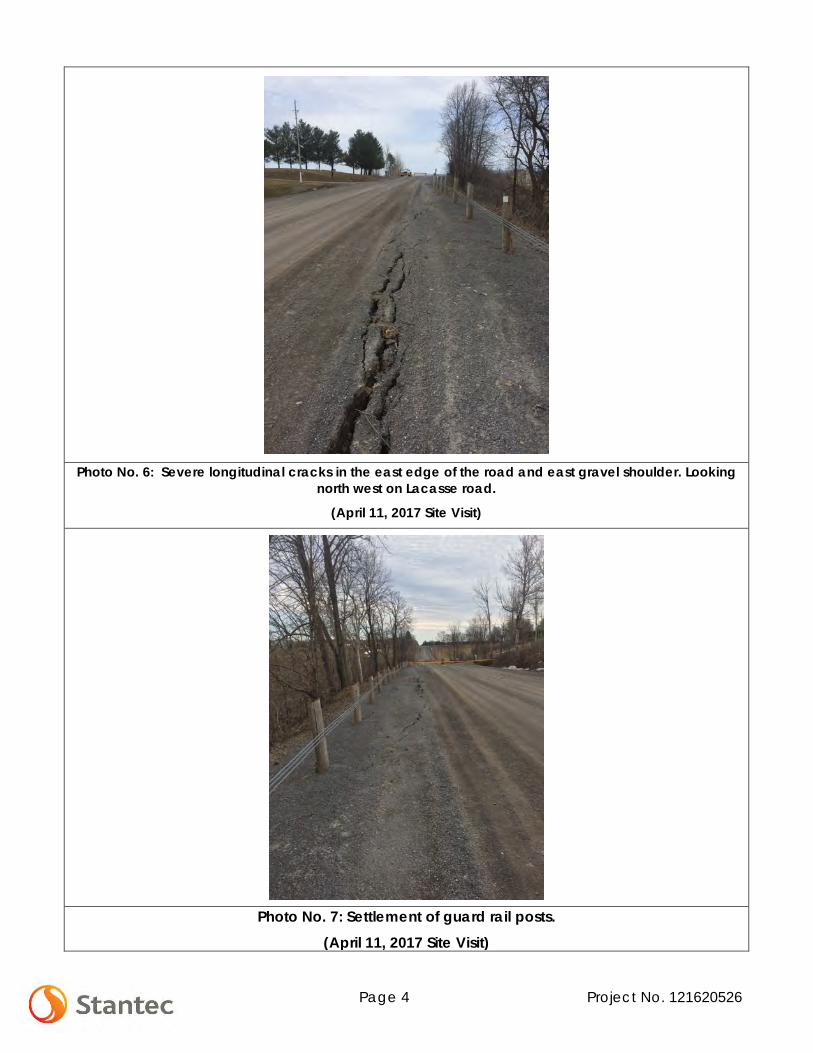
Page 4 Project No. 121620526
Photo No. 6: Severe longitudinal cracks in the east edge of the road and east gravel shoulder. Looking
north west on Lacasse road.
(April 11, 2017 Site Visit)
Photo No. 7: Settlement of guard rail posts.
(April 11, 2017 Site Visit)

Page 5 Project No. 121620526
Photo No.8: Semi-circular cracking on the east gravel shoulder.
(April 11, 2017 Site Visit)
Photo No. 9: Increased width of longitudinal cracks on east gravel shoulder since April 11, 2017.
(April 26, 2017 Site Visit)

Page 6 Project No. 121620526
Photo No. 10: Increased bank movement of east gravel shoulder since April 11, 2017.
(May 8, 2017 Site Visit)
Photo No. 11: Increased settlement and tilting of the guard rail posts since April 11, 2017.
(May 8, 2017 Site Visit)
Page 7 Project No. 121620526
Photo No.12: Large settlement of east gravel shoulder.
(May 8, 2017 Site Visit)
Photo No. 13: Large bank movement of east gravel shoulder and east side of road.
(May 29, 2017 Site Visit)
LACASSE ROAD SLOPE STABILITY ASSESSMENT September 2017
APPENDIX D Laboratory Test Results

Unified Soil Classification System
Figure No. 1
Project No. 121620526Fat CLAY (CH) (Native)
Lacasse Road Slope Stability
Fine Medium Coarse Coarse
SAND Gravel
CLAY & SILT Fine
0
10
20
30
40
50
60
70
80
90
1000
10
20
30
40
50
60
70
80
90
100
0.001 0.01 0.1 1 10 100
Perc
ent R
etai
ned
Perc
ent P
assi
ng
Grain Size in Millimetres
Sample ID
17-1 SS-6
17-1 SS-13
17-3 SS-3
8163050100200U.S. Std. Sieve No. 4
GRAIN SIZE DISTRIBUTION

Project No. 121620526
Figure No. 2Fat CLAY (CH) (Native) Lacasse Road Slope Stability
0
10
20
30
40
50
60
0 10 20 30 40 50 60 70 80 90 100
Plas
ticity
Inde
x
Liquid Limit
Sample ID
17-2 SS-2
17-2 SS-6
17-2 SS-10
17-1 SS-6
17-1 SS-13
17-3 SS-3
CL
CI
CH
CL-MLML
MI OI
MH OH
OLML
PLASTICITY CHART

Unified Soil Classification System
Figure No. 3
Project No. 121620526Sample mix of Silt layers within Fat CLAY
Lacasse Road Slope Stability
Fine Medium Coarse Coarse
SAND Gravel
CLAY & SILT Fine
0
10
20
30
40
50
60
70
80
90
1000
10
20
30
40
50
60
70
80
90
100
0.001 0.01 0.1 1 10 100
Perc
ent R
etai
ned
Perc
ent P
assi
ng
Grain Size in Millimetres
Sample ID
17-2 SS-4
8163050100200U.S. Std. Sieve No. 4
GRAIN SIZE DISTRIBUTION
LACASSE ROAD SLOPE STABILITY ASSESSMENT September 2017
APPENDIX E Drawing E1 – Geotechnical Model
Drawing E2 – Geotechnical Model
Output from Slope Stability Analyses
Stantec Consulting Ltd.
60
62
64
66
68
70
72
74
76
78
80
82
840 10 20 30 40 50 60 70 80
Geo
detic
Ele
vatio
n (m
)
BH17-1
BH17-2
BH17-3
BH17-4
Liquid Limit
Plastic Limit
15 17 19 21 23 25
BH17-1
BH17-2
BH17-3
BH17-4
DesignLine
0 20 40 60 80 100
BH17-1 (In-situ)
BH17-2 (In-situ)
Design Line
Firm to stiff, grey, fat CLAY (CH)γ = 17 kN/m3, Su = 55 kPa, E = 15 MPa, φ’ = 28°
*Silt seams
Moisture Content(%)
Undrained Shear Strength (kN/m2)
Total Unit Weight (kN/m )3
Silty sand and gravel mixture (FILL)γ = 21 kN/m3, Su = 0 kPa, E = 20 MPa, φ’ = 30 °
Firm to stiff, brownish grey, fat CLAY (CH)γ = 17 kN/m3, Su = 50 kPa, E = 15 MPa, φ’ = 28°
0 10 20 30
SPT 'N' Values
BH17-1
BH17-2
BH17-3
BH17-4
Stratigraphy and Design Parameters
Geotechnical ModelLacasse Road Slope Stability, Clarence-Rockland
Drawing No E-1 Project No. 121620526
*Note: Silt seams taken asa silt layer with parameters: γ = 20 kN/m3, φ’ = 28°
Stantec Consulting Ltd.
60
62
64
66
68
70
72
74
76
78
80
82
840
0.2
0.4
0.6
0.8 1
Geo
detic
Ele
vatio
n (m
)
BH17-1
BH17-2
BH17-3
0 1 2 3 4
BH17-1
BH17-2
0 5 10 15 20 25 30
BH17-1
BH17-2
Firm to stiff, grey, fat CLAY (CH)γ = 17 kN/m3, Su = 55 kPa, E = 15 MPa, φ’ = 28°
*Silt seams
*Note: Silt seams taken asa silt layer with parameters: γ = 20 kN/m3, φ’ = 28°
Liquidity Index Soil SensitivistyStability Number
Silty sand and gravel mixture (FILL)γ = 21 kN/m3, Su = 0 kPa, E = 20 MPa, φ’ = 30 °
Firm to stiff, brownish grey, fat CLAY (CH)γ = 17 kN/m3, Su = 50 kPa, E = 15 MPa, φ’ = 28°
Stratigraphy and Design Parameters
Geotechnical ModelLacasse Road Slope Stability, Clarence-Rockland
Drawing No E-2 Project No. 121620526

Cross Section A-A’ Static Drained Analysis
Figure No. 1a
Project No. 121620526
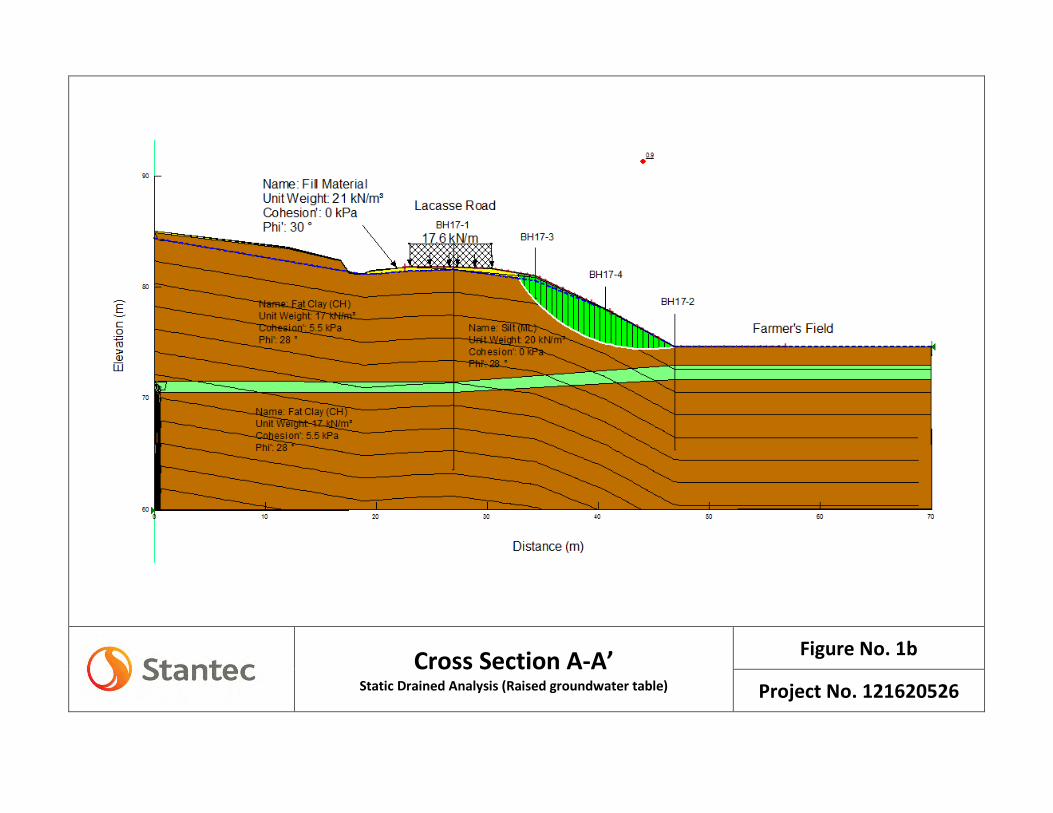
Cross Section A-A’ Static Drained Analysis (Raised groundwater table)
Figure No. 1b
Project No. 121620526

Cross Section A-A’ Static Undrained Analysis
Figure No. 1c
Project No. 121620526
17.6
Cross Section A-A’ Static Undrained Analysis (Raised groundwater table)
Figure No. 1d
Project No. 121620526
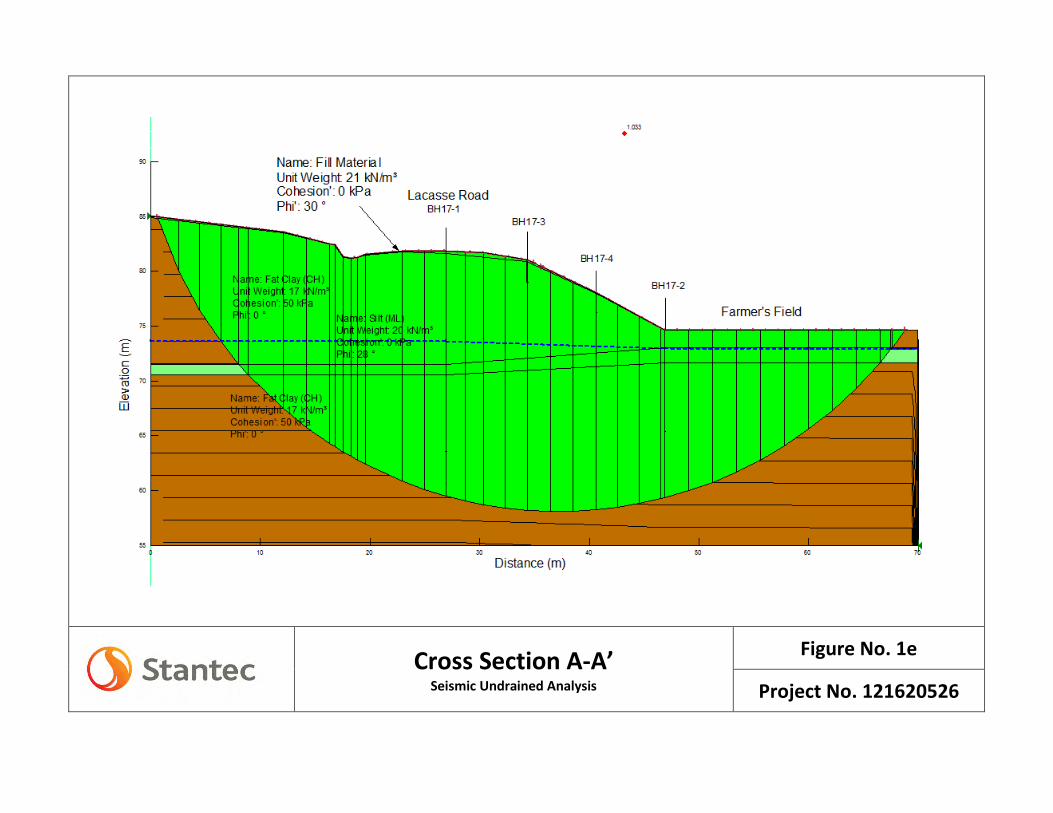
Cross Section A-A’ Seismic Undrained Analysis
Figure No. 1e
Project No. 121620526
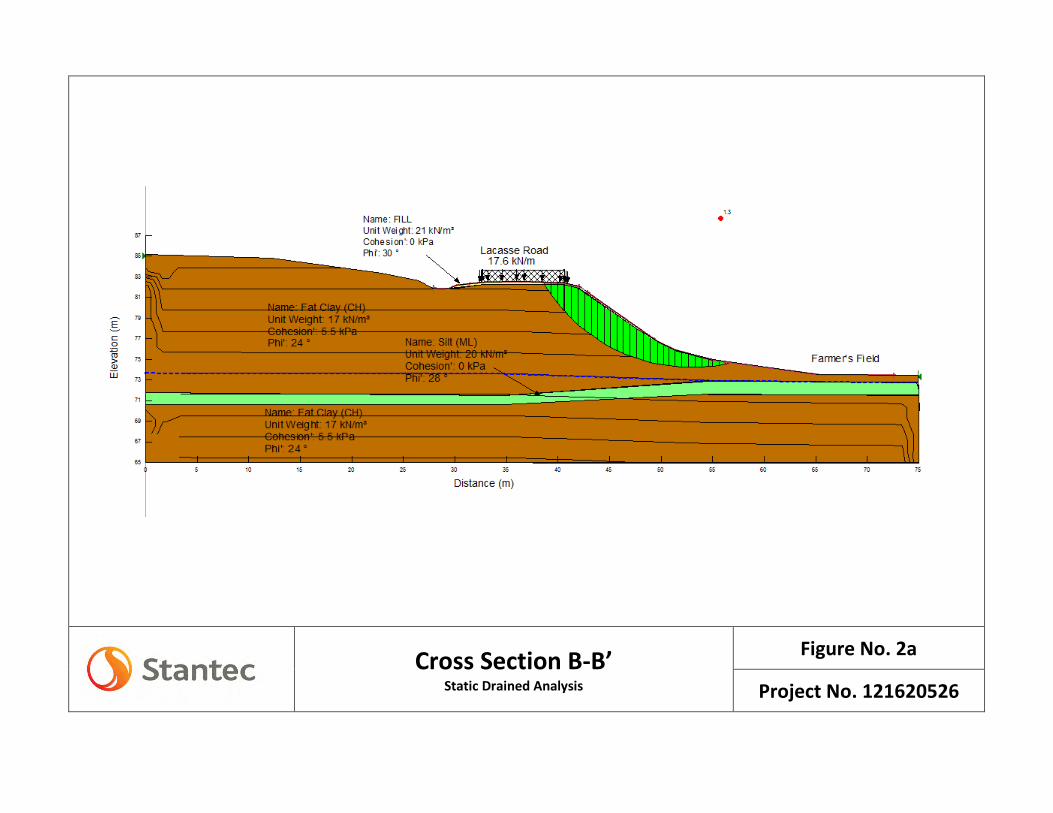
Cross Section B-B’ Static Drained Analysis
Figure No. 2a
Project No. 121620526
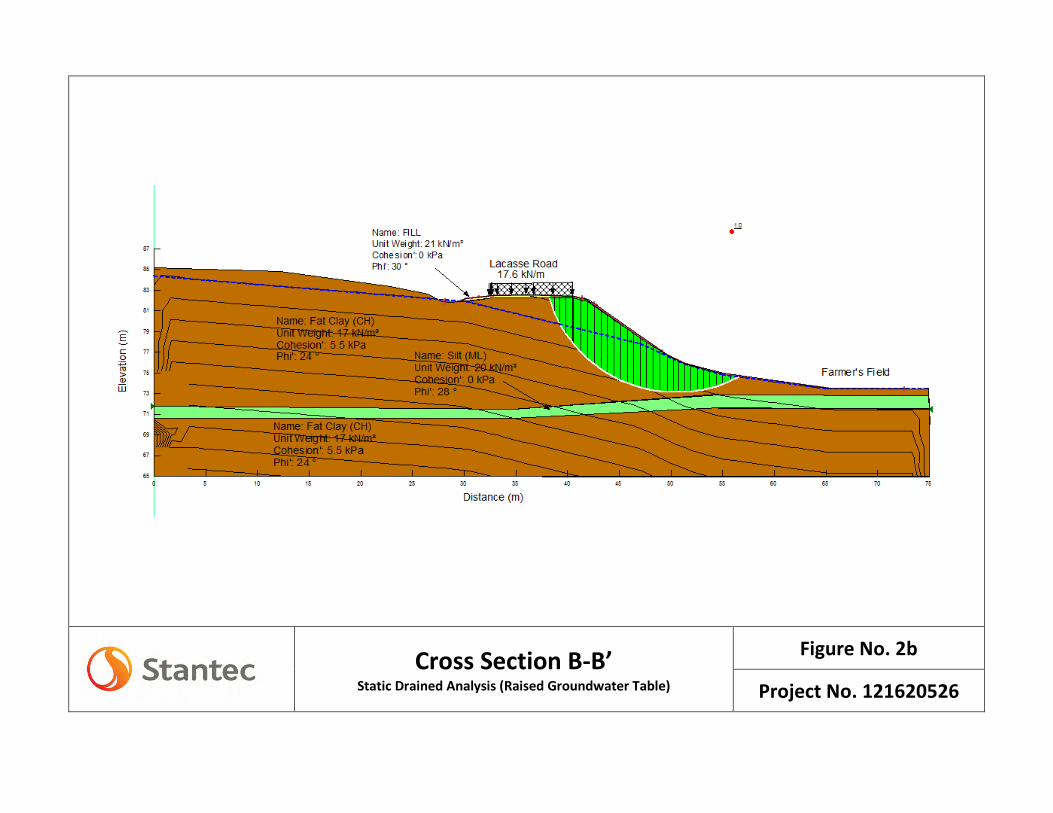
Cross Section B-B’ Static Drained Analysis (Raised Groundwater Table)
Figure No. 2b
Project No. 121620526
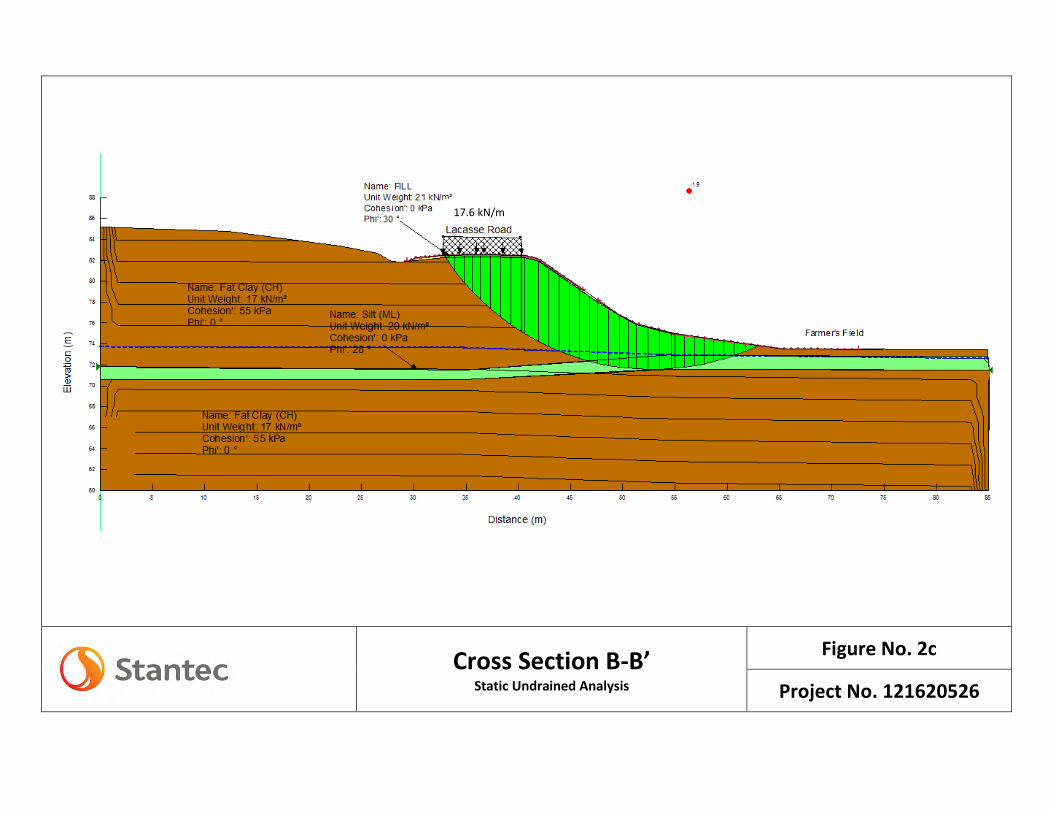
Cross Section B-B’ Static Undrained Analysis
Figure No. 2c
Project No. 121620526
17.6 kN/m
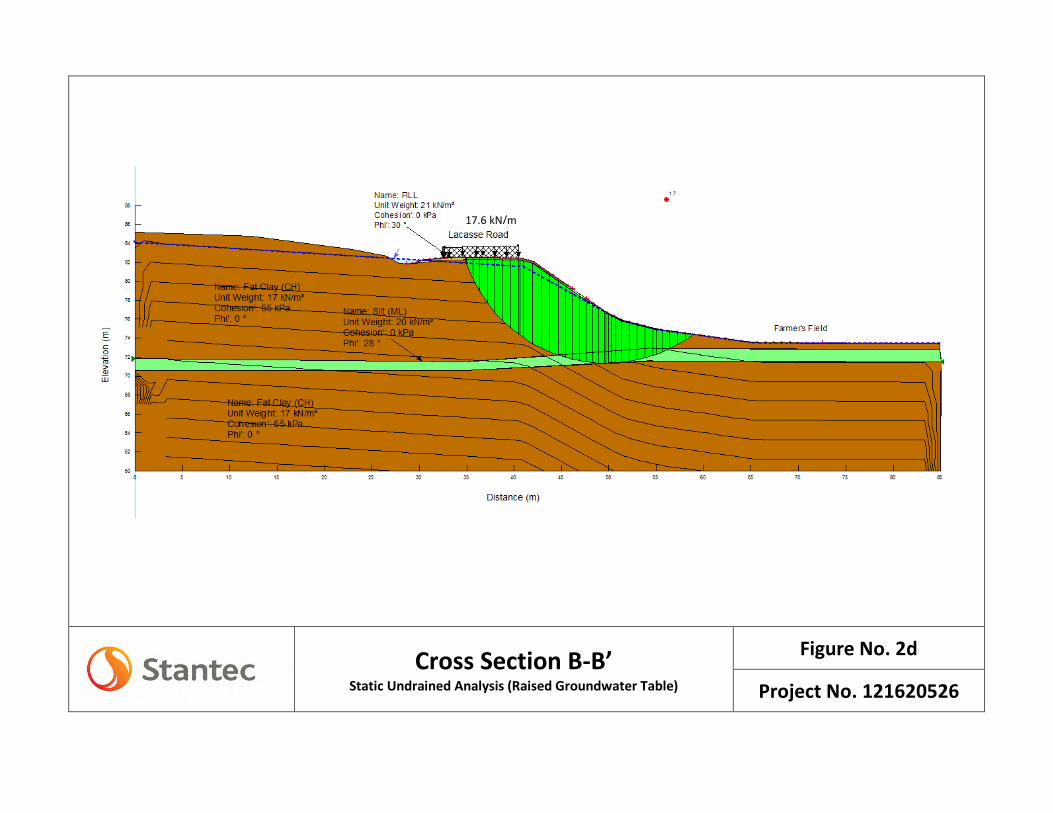
Cross Section B-B’ Static Undrained Analysis (Raised Groundwater Table)
Figure No. 2d
Project No. 121620526
17.6 kN/m

Cross Section B-B’ Seismic Undrained Analysis
Figure No. 2e
Project No. 121620526
17.6 kN/m

Cross Section A-A’ Berm – Static Drained Analysis (Raised Groundwater Table)
Figure No. 3a
Project No. 121620526
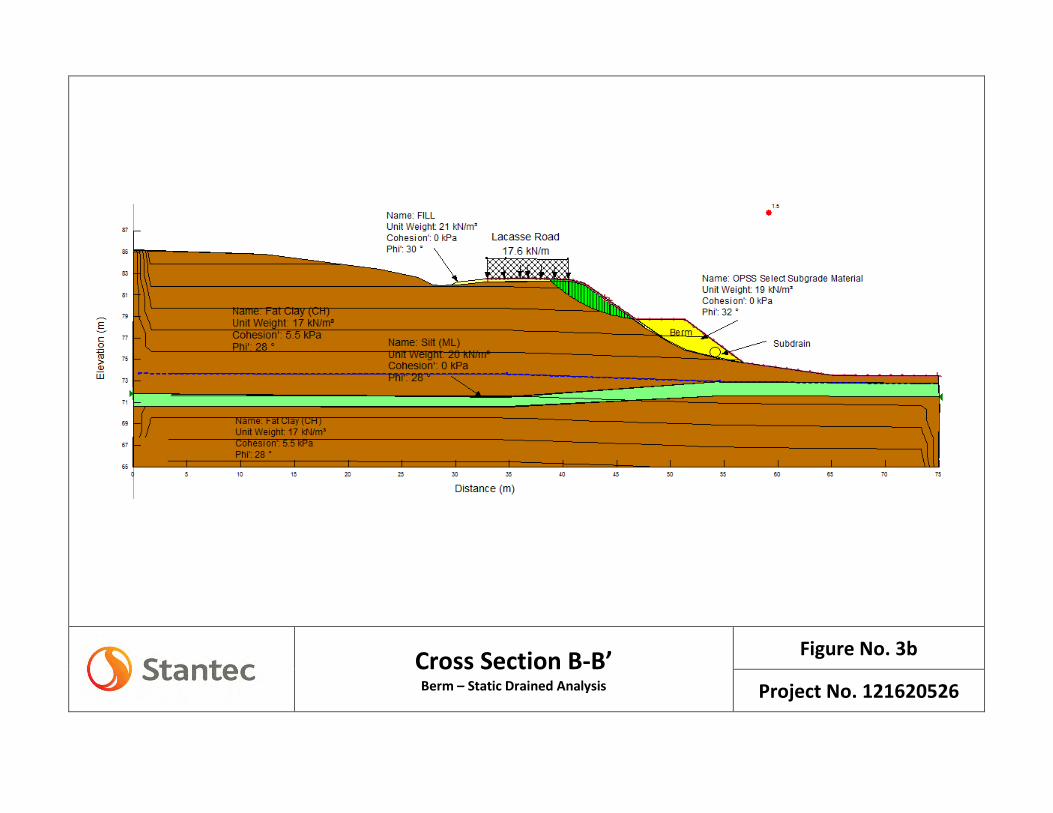
Cross Section B-B’ Berm – Static Drained Analysis
Figure No. 3b
Project No. 121620526
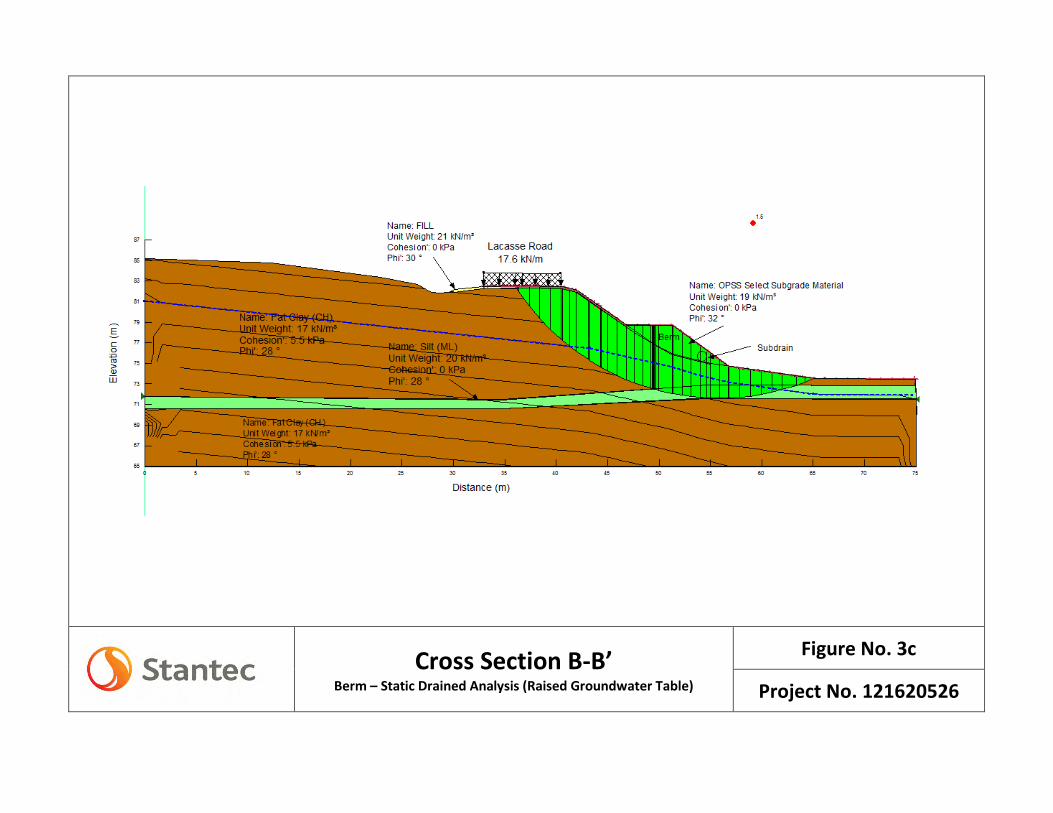
Cross Section B-B’ Berm – Static Drained Analysis (Raised Groundwater Table)
Figure No. 3c
Project No. 121620526

Cross Section B-B’ Berm – Seismic Undrained Analysis
Figure No. 3d
Project No. 121620526
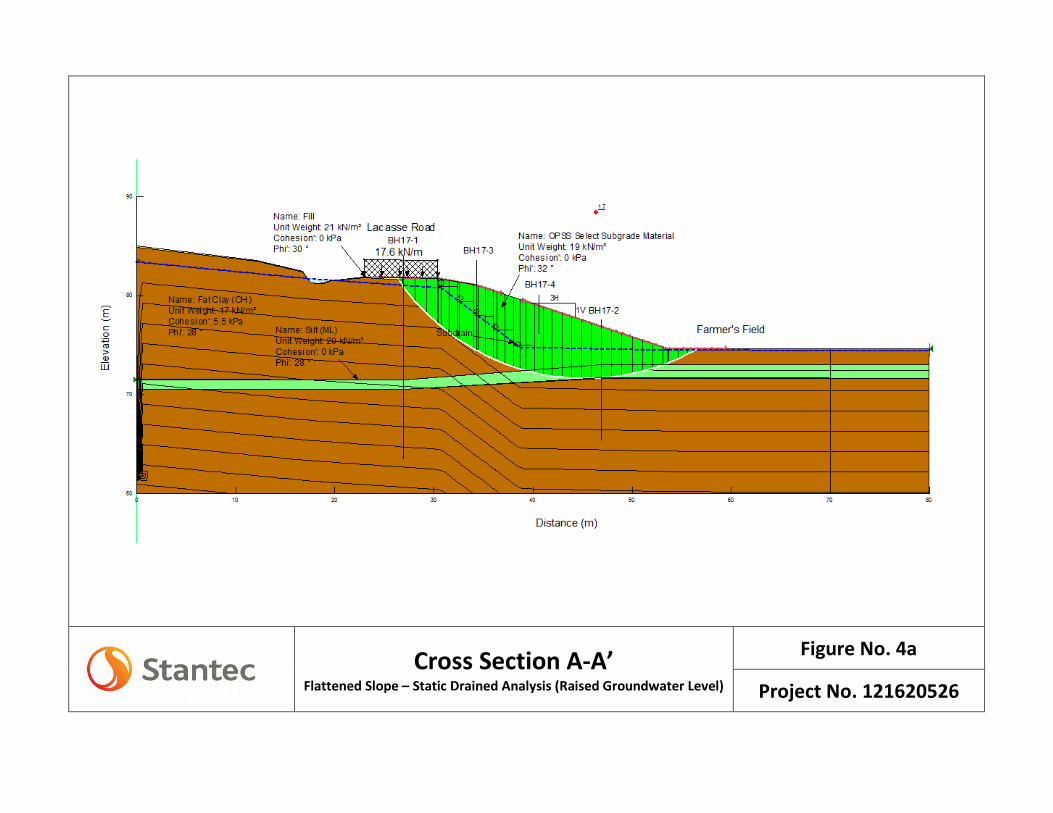
Cross Section A-A’ Flattened Slope – Static Drained Analysis (Raised Groundwater Level)
Figure No. 4a
Project No. 121620526

Cross Section B-B’ Flattened Slope – Static Drained Analysis
Figure No. 4b
Project No. 121620526

Cross Section B-B’ Flattened Slope – Static Drained Analysis (Raised Groundwater Level)
Figure No. 4c
Project No. 121620526
Cross Section B-B’ Flattened Slope – Seismic Undrained Analysis
Figure No. 4d
Project No. 121620526
LACASSE ROAD SLOPE STABILITY ASSESSMENT September 2017
APPENDIX F NBC Seismic Hazard Calculation
2015 National Building Code Seismic Hazard CalculationINFORMATION: Eastern Canada English (613) 995-5548 francais (613) 995-0600 Facsimile (613) 992-8836
Western Canada English (250) 363-6500 Facsimile (250) 363-6565
Site: 45.5134 N, 75.2606 W User File Reference: Lacasse Road
Requested by: SR, Stantec
May 30, 2017
National Building Code ground motions: 2% probability of exceedance in 50 years (0.000404 per annum)
Sa(0.05) Sa(0.1) Sa(0.2) Sa(0.3) Sa(0.5) Sa(1.0) Sa(2.0) Sa(5.0) Sa(10.0) PGA (g) PGV (m/s)
Ground motions for other probabilities:
Probability of exceedance per annum
Probability of exceedance in 50 years
Sa(0.05)
Sa(0.1)
Sa(0.2)
Sa(0.3)
Sa(0.5)
Sa(1.0)
Sa(2.0)
Sa(5.0)
Sa(10.0)
PGA
PGV
0.010
40%
0.0021
10%
0.001
5%
0.549 0.632 0.518 0.388 0.270 0.130 0.061 0.016 0.0057 0.333 0.224
0.052
0.070
0.062
0.048
0.034
0.016
0.0065
0.0013
0.0006
0.037
0.024
0.181
0.223
0.189
0.143
0.099
0.048
0.022
0.0050
0.0020
0.121
0.077
0.305
0.362
0.302
0.227
0.157
0.076
0.035
0.0087
0.0033
0.195
0.126
Notes. Spectral (Sa(T), where T is the period in seconds) and peak ground acceleration (PGA) values aregiven in units of g (9.81 m/s2). Peak ground velocity is given in m/s. Values are for "firm ground" (NBCC2015 Site Class C, average shear wave velocity 450 m/s). NBCC2015 and CSAS6-14 values are specified inbold font. Three additional periods are provided - their use is discussed in the NBCC2015 Commentary.Only 2 significant figures are to be used. These values have been interpolated from a 10-km-spaced gridof points. Depending on the gradient of the nearby points, values at this location calculated directlyfrom the hazard program may vary. More than 95 percent of interpolated values are within 2 percentof the directly calculated values.
References
National Building Code of Canada 2015 NRCC no. 56190;Appendix C: Table C-3, Seismic Design Data for Selected Locations inCanada
User’s Guide - NBC 2015, Structural Commentaries NRCC no.xxxxxx (in preparation)Commentary J: Design for Seismic Effects
Geological Survey of Canada Open File 7893 Fifth GenerationSeismic Hazard Model for Canada: Grid values of mean hazard to beused with the 2015 National Building Code of Canada
See the websites www.EarthquakesCanada.caand www.nationalcodes.ca for more information
Aussi disponible en francais
Natural ResourcesCanada
Ressources naturellesCanada CanadaCanada
75.5˚W 75˚W
45.5˚N
0 10 20 30
km