laclede county economic analysis and baseline 2001-2011 anna kovalyova program coordinator...
Post on 21-Dec-2015
216 views
TRANSCRIPT

Laclede County Economic Analysis and Baseline
2001-2011
Anna Kovalyova
Program Coordinator
University of Missouri, Columbia
This report describes a set of annual baseline forecasts on demographic, economic, and fiscal conditions through 2011 for Laclede County, Missouri.
Findings are based on a comprehensive statistical analysis of the most recent secondary data available, as well as important input provided by the Community Advisory Panel. 2001 serves as a base year for the forecasts, since the majority of available data is for 2001.
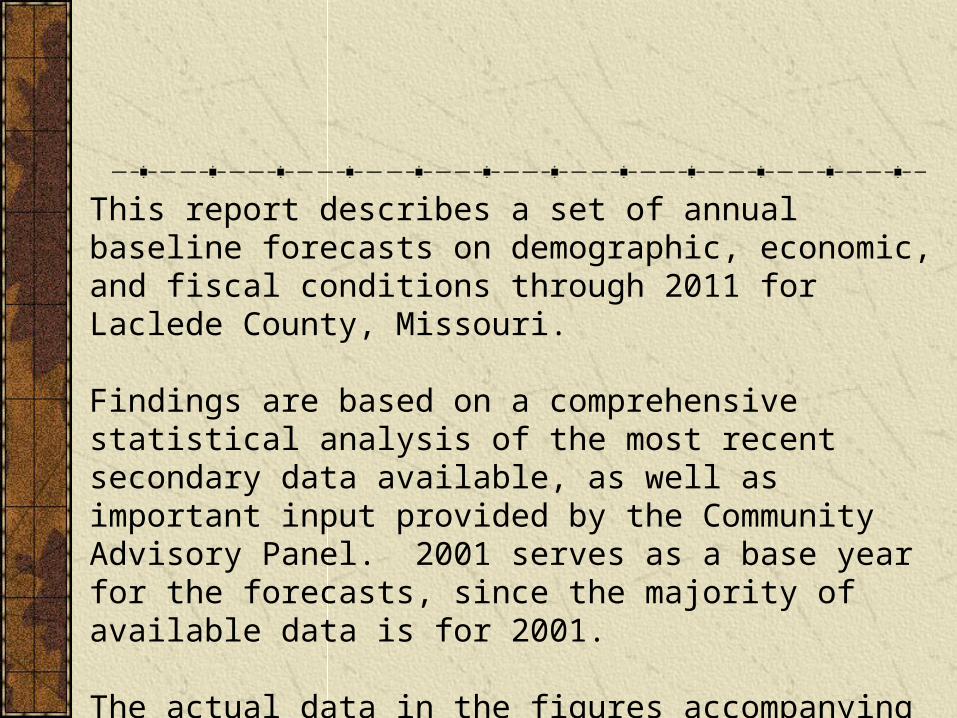
The actual data in the figures accompanying the report are separated from their forecasted counterparts by the dotted line.

Findings
Over the next ten years, Laclede County population is expected to increase from 32,868 to about 41,300 - an annual growth rate of 2.6 percent. This rate of growth is similar to the historical trends in the County.
For comparison, the average annual population growth rate for the State of Missouri between 1990 and 2000 was 1.01 percent.

Population and employment growth will lead to approximately 1,470 new students in Laclede County public schools over the next ten years.
Growth over the baseline period will also stimulate demand for approximately 3,380 additional housing units.
Manufacturing sector provides the largest number of jobs in the County, followed by non-farm proprietors, retail sales and service sectors. Nationally, employment is now growing the fastest in the services and retail trade sectors.
Findings

Per capita income in the County comprises approximately 72 percent of the State level. Real per capita income (expressed in 2001 Dollars) is projected to grow by 0.9 percent annually through 2011.
Total personal income is expected to grow from almost $670 million to $917 million (in 2001 Dollars) over the baseline period – a real growth rate of 3.7 percent per year.
Findings

Between the years 1990 and 2000, transfer payments to County’s retirees ranged from 49 to 40 percent of total transfer payments and around 8 percent of total personal income in the County.
Supplemental Security Income ranged between 37 and 29 percent of income maintenance benefit payments for the same years.
Total transfer payments comprised about 19 percent of the total personal income in the County for the years 1991 – 2000. This is somewhat higher than the corresponding 13 - 15 percent for the State of Missouri as a whole.
Findings

The unemployment rate in the County is volatile: it tends to be the highest in January and the lowest in October. In 2001, Laclede County annual unemployment rate was 6.5 percent, vs. 4.7 percent statewide.
According to CPAC projections, the number of unemployed in the County is expected to increase by a mere of 70 persons over the 10-year projection period, which amounts to the average annual growth rate of 0.6 percent.
Findings

Increased County income and employment will fuel the strong growth in taxable retail sales – from $301.6 million in 2001 to almost $427 million in 2011 (2001 Dollars).
As a percent of total county retail sales, Lebanon retail sales ranged from 88 percent in 1990 to 81 percent in 2001.
Findings

Over the baseline period, county revenues are projected to fall below the demand for county services by over a million dollars.
The rapid growth in demand for services (at a projected 4.8 percent per year) suggests that county government will be challenged in the future to deliver public services even more efficiently, and/or search for new sources of revenues.
Findings

The County relies heavily on sales tax revenues. Between 1996 and 2001, sales taxes as a percentage of total County revenues fluctuated anywhere between 47 and 51 percent.
Due to the volatility of retail sales, heavy reliance on sales taxes might represent a challenge for the local governments in balancing their budgets during economic downturns.
Findings

Figure 1. Population, 1990-2011 Laclede County and Lebanon City
-
5,000
10,000
15,000
20,000
25,000
30,000
35,000
40,000
45,000
1990 1991 1992 1993 1994 1995 1996 1997 1998 1999 2000 2001 2002 2003 2004 2005 2006 2007 2008 2009 2010 2011
Year
Po
pul
atio
n
Laclede County City of Lebanon
Source: US Census Bureau, Time Series of Missouri Intercensal Population Estimates by County Analysis by CPAC
Socio-Demographic Characteristics

Figure 2. Persons 17 and Younger, 1990-2011 Laclede County
-
2,000
4,000
6,000
8,000
10,000
12,000
1990 1991 1992 1993 1994 1995 1996 1997 1998 1999 2000 2001 2002 2003 2004 2005 2006 2007 2008 2009 2010 2011 Year
Per
son
s
Source: US Census Bureau Analysis by CPAC

Figure 3. Persons 65 and Over, 1990-2011 Laclede County
-
1,000
2,000
3,000
4,000
5,000
6,000
7,000
1990 1991 1992 1993 1994 1995 1996 1997 1998 1999 2000 2001 2002 2003 2004 2005 2006 2007 2008 2009 2010 2011 Year
Per
son
s
Source: US Census Bureau Analysis by CPAC

Figure 4. Population, 2000 Lebanon City vs. Other Cities in the Region
-
2,000
4,000
6,000
8,000
10,000
12,000
14,000
16,000
18,000
Lebanon Carthage Chillicothe Monett Rolla West Plains
Per
son
s
total population young (17 and under) "old" (65 and over)
Source: US Census Bureau Analysis by CPAC

Figure 5. Age Distribution, 2000 Laclede County vs. State
0%
5%
10%
15%
20%
25%
30%
Less than 5 5-17 18-24 25-34 35-54 55-64 65-84 85 and above Age
Laclede County Missouri
Source: Census 2000 Analysis by CPAC

Figure 6. Age Distribution, 1990, 2000 Laclede County
0%
5%
10%
15%
20%
25%
30%
Less than 5 5-17 18-24 25-34 35-54 55-64 65-84 85 and above
Age
1990 2000
Source: US Census Bureau Analysis by CPAC

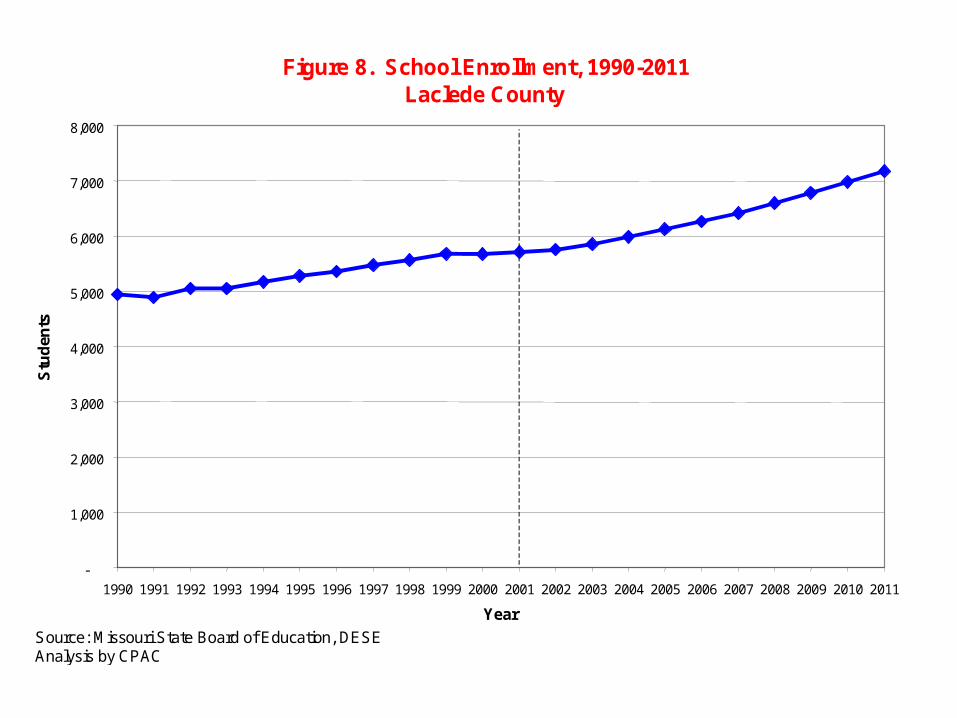
Figure 8. School Enrollment, 1990-2011 Laclede County
-
1,000
2,000
3,000
4,000
5,000
6,000
7,000
8,000
1990 1991 1992 1993 1994 1995 1996 1997 1998 1999 2000 2001 2002 2003 2004 2005 2006 2007 2008 2009 2010 2011 Year
Stu
den
ts
Source: Missouri State Board of Education, DESE Analysis by CPAC

Figure 9. Public Enrollment by School District
Laclede County, 1990-2001
0
500
1000
1500
2000
2500
3000
3500
4000
4500
1990 1991 1992 1993 1994 1995 1996 1997 1998 1999 2000 2001 Year
Stu
den
ts
Laclede County R-I Gasconade C-4 Lebanon R-III Laclede County C-5
Source: Missouri State Board of Education, DESE Analysis by CPAC

Figure 10. Housing Demand, 2001-2011 Laclede County
0
2,000
4,000
6,000
8,000
10,000
12,000
14,000
16,000
18,000
2001 2002 2003 2004 2005 2006 2007 2008 2009 2010 2011 Year
Nu
mb
er o
f H
ou
sin
g U
nit
s D
eman
ded
Analysis by CPAC

Figure 11. Civilian Labor Force, 1990-2011 Laclede County
-
5,000
10,000
15,000
20,000
25,000
1990 1991 1992 1993 1994 1995 1996 1997 1998 1999 2000 2001 2002 2003 2004 2005 2006 2007 2008 2009 2010 2011 Year
Lab
or
Fo
rce
Source: Missouri Department of Labor and Industrial Relations Analysis by CPAC
Labor Market Characteristics
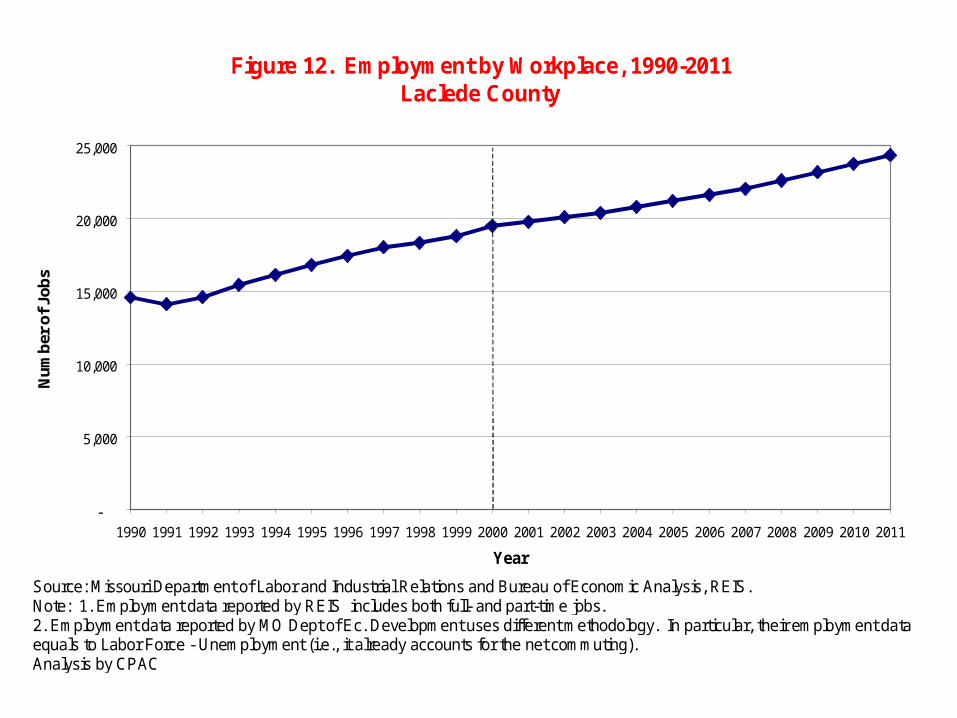
Figure 12. Employment by Workplace, 1990-2011
Laclede County
-
5,000
10,000
15,000
20,000
25,000
1990 1991 1992 1993 1994 1995 1996 1997 1998 1999 2000 2001 2002 2003 2004 2005 2006 2007 2008 2009 2010 2011 Year
Nu
mb
er o
f Jo
bs
Source: Missouri Department of Labor and Industrial Relations and Bureau of Economic Analysis, REIS. Note: 1. Employment data reported by REIS includes both full- and part-time jobs. 2. Employment data reported by MO Dept of Ec. Development uses different methodology. In particular, their employment data equals to Labor Force - Unemployment (i.e., it already accounts for the net commuting). Analysis by CPAC

Figure 13. Employment by Workplace, 2000 Laclede vs. Adjacent Counties
-
5,000
10,000
15,000
20,000
25,000
30,000
Laclede Camden Dallas Pulaski Texas Webster Wright
Nu
mb
er o
f Jo
bs
Source: Bureau of Economic Analysis REIS Analysis by CPAC

Figure 14. Employment by residence, 1990 and 2000 Lebanon City vs. Other Cities in the Region
-
1,000
2,000
3,000
4,000
5,000
6,000
7,000
8,000
Lebanon Carthage Chillicothe Monett Rolla West Plains
Em
plo
ymen
t b
y R
esid
ence
1990 2000
Source: US Bureau of Census Analysis by CPAC

Figure 16. Unemployment, 1990-2011
Laclede County
-
200
400
600
800
1,000
1,200
1,400
1,600
1990 1991 1992 1993 1994 1995 1996 1997 1998 1999 2000 2001 2002 2003 2004 2005 2006 2007 2008 2009 2010 2011 Year
Un
empl
oye
d P
erso
ns
Source: Missouri Department of Labor and Industrial Relations Analysis by CPAC

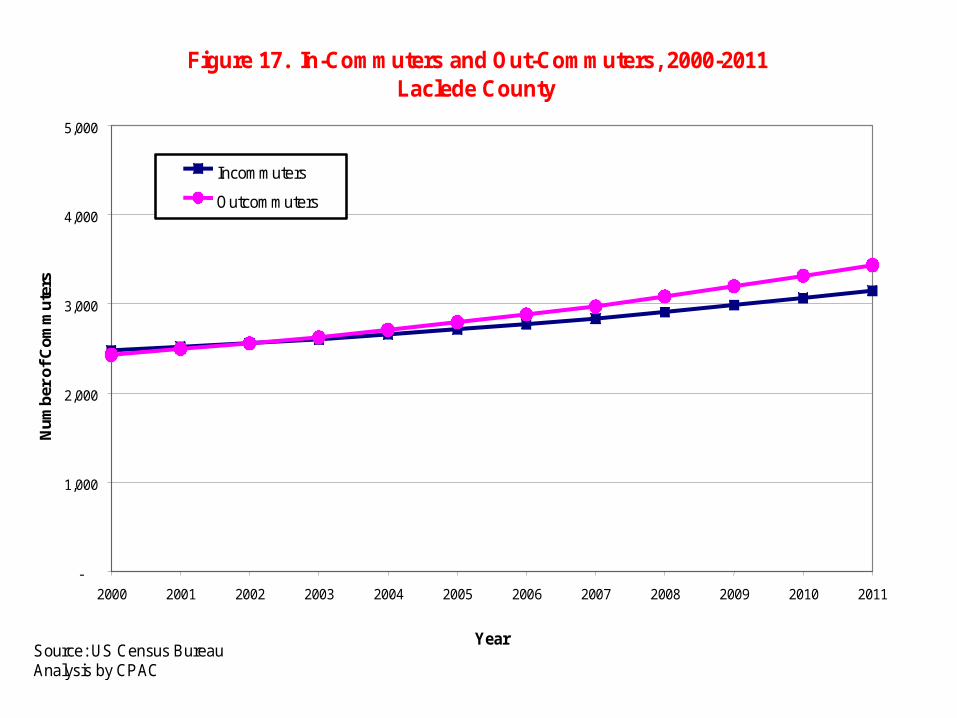
Figure 17. In-Commuters and Out-Commuters, 2000-2011 Laclede County
-
1,000
2,000
3,000
4,000
5,000
2000 2001 2002 2003 2004 2005 2006 2007 2008 2009 2010 2011
Year
Nu
mb
er o
f C
omm
ute
rs
Incommuters Outcommuters
Source: US Census Bureau Analysis by CPAC

Figure 18. Real Per Capita Income, 1990-2011 Laclede County vs. Missouri (real 2001 dollars)
$-
$5,000
$10,000
$15,000
$20,000
$25,000
$30,000
$35,000
1990 1991 1992 1993 1994 1995 1996 1997 1998 1999 2000 2001 2002 2003 2004 2005 2006 2007 2008 2009 2010 2011 Year
Rea
l Per
Cap
ita
Inco
me
Laclede County Missouri
Source: Bureau of Economic Analysis REIS Analysis by CPAC
Economic Characteristics
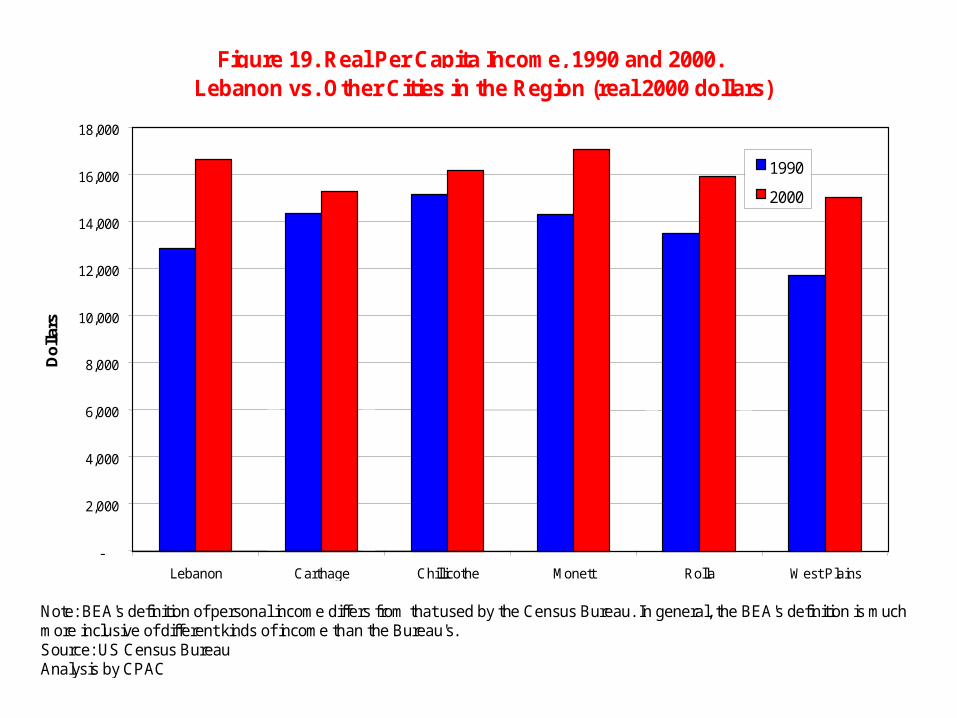
Figure 19. Real Per Capita Income, 1990 and 2000. Lebanon vs. Other Cities in the Region (real 2000 dollars)
-
2,000
4,000
6,000
8,000
10,000
12,000
14,000
16,000
18,000
Lebanon Carthage Chillicothe Monett Rolla West Plains
Do
llars
1990 2000
Note: BEA's definition of personal income differs from that used by the Census Bureau. In general, the BEA's definition is much more inclusive of different kinds of income than the Bureau's. Source: US Census Bureau Analysis by CPAC

Figure 20. Total Personal Income, 1990-2011 Laclede County (2001 Dollars)
$-
$100,000
$200,000
$300,000
$400,000
$500,000
$600,000
$700,000
$800,000
$900,000
$1,000,000
1990 1991 1992 1993 1994 1995 1996 1997 1998 1999 2000 2001 2002 2003 2004 2005 2006 2007 2008 2009 2010 2011 Year
To
tal P
erso
nal
Inco
me
($1,
000)
Source: Bureau of Economic Analysis REIS Analysis by CPAC

Figure 21. Transfer Payments, 1990-2000 Laclede County (2000 Dollars)
-
20,000
40,000
60,000
80,000
100,000
120,000
140,000
1990 1991 1992 1993 1994 1995 1996 1997 1998 1999 2000 Year
Th
ou
san
ds
of
Do
llars
Supplemental security income (SSI) payments
Ret. & Disab. Insurance Benefit Payments
Total Transfer Payments
Source: Bureau of Economic Analysis REIS Analysis by CPAC

Figure 22. Assessed Property Values, 1990-2011 Laclede County (2001 Dollars)
$-
$50,000,000
$100,000,000
$150,000,000
$200,000,000
$250,000,000
$300,000,000
$350,000,000
$400,000,000
$450,000,000
1990 1991 1992 1993 1994 1995 1996 1997 1998 1999 2000 2001 2002 2003 2004 2005 2006 2007 2008 2009 2010 2011 Year
Ass
esse
d P
rop
erty
Val
ue
Laclede County Lebanon City
Source: MU Economic and Policy Analysis Research Center, Missouri State Tax Commission and Missouri State Auditor’s Office Note: Data for Property Values include real and personal property, and utilities. Analysis by CPAC
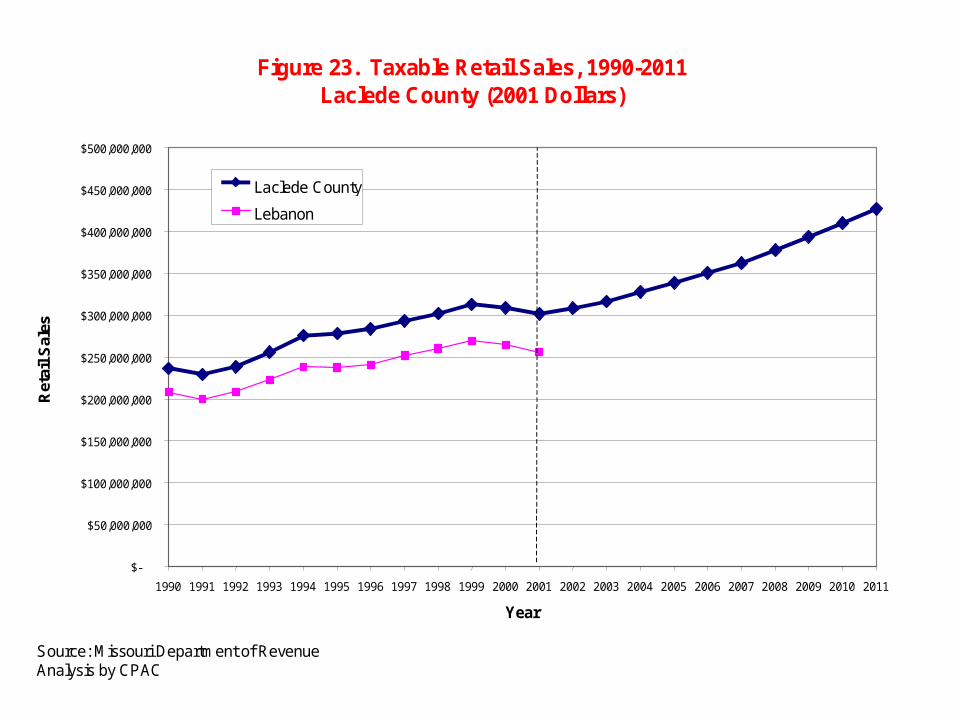
Figure 23. Taxable Retail Sales, 1990-2011 Laclede County (2001 Dollars)
$-
$50,000,000
$100,000,000
$150,000,000
$200,000,000
$250,000,000
$300,000,000
$350,000,000
$400,000,000
$450,000,000
$500,000,000
1990 1991 1992 1993 1994 1995 1996 1997 1998 1999 2000 2001 2002 2003 2004 2005 2006 2007 2008 2009 2010 2011 Year
Ret
ail S
ales
Laclede County Lebanon
Source: Missouri Department of Revenue Analysis by CPAC
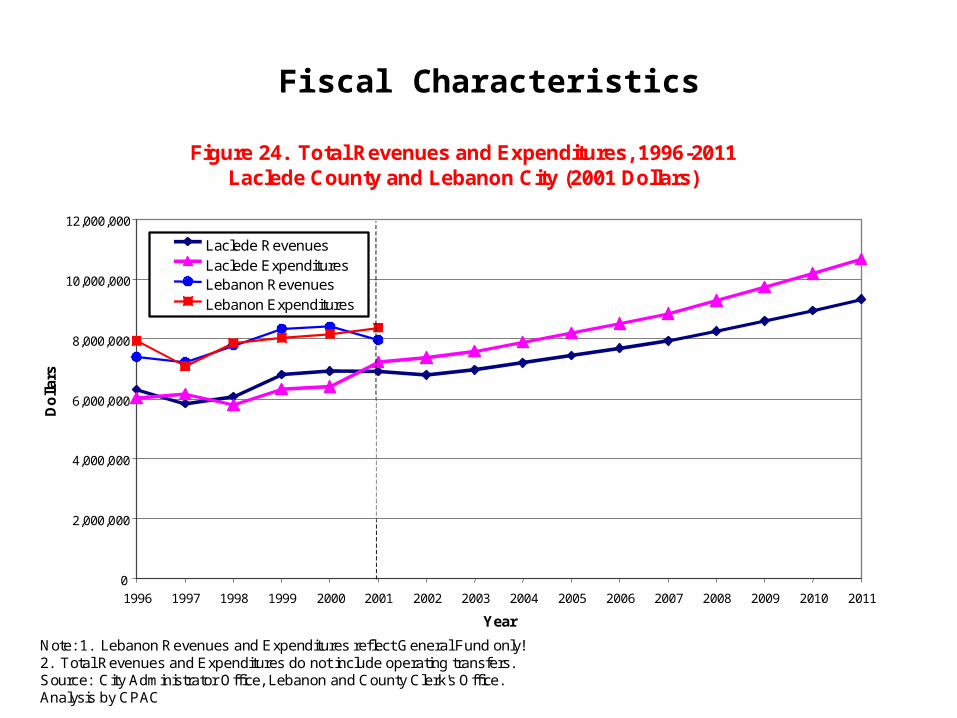
Figure 24. Total Revenues and Expenditures, 1996-2011 Laclede County and Lebanon City (2001 Dollars)
0
2,000,000
4,000,000
6,000,000
8,000,000
10,000,000
12,000,000
1996 1997 1998 1999 2000 2001 2002 2003 2004 2005 2006 2007 2008 2009 2010 2011 Year
Do
llars
Laclede Revenues Laclede Expenditures Lebanon Revenues Lebanon Expenditures
Note: 1. Lebanon Revenues and Expenditures reflect General Fund only! 2. Total Revenues and Expenditures do not include operating transfers. Source: City Administrator Office, Lebanon and County Clerk's Office. Analysis by CPAC
Fiscal Characteristics
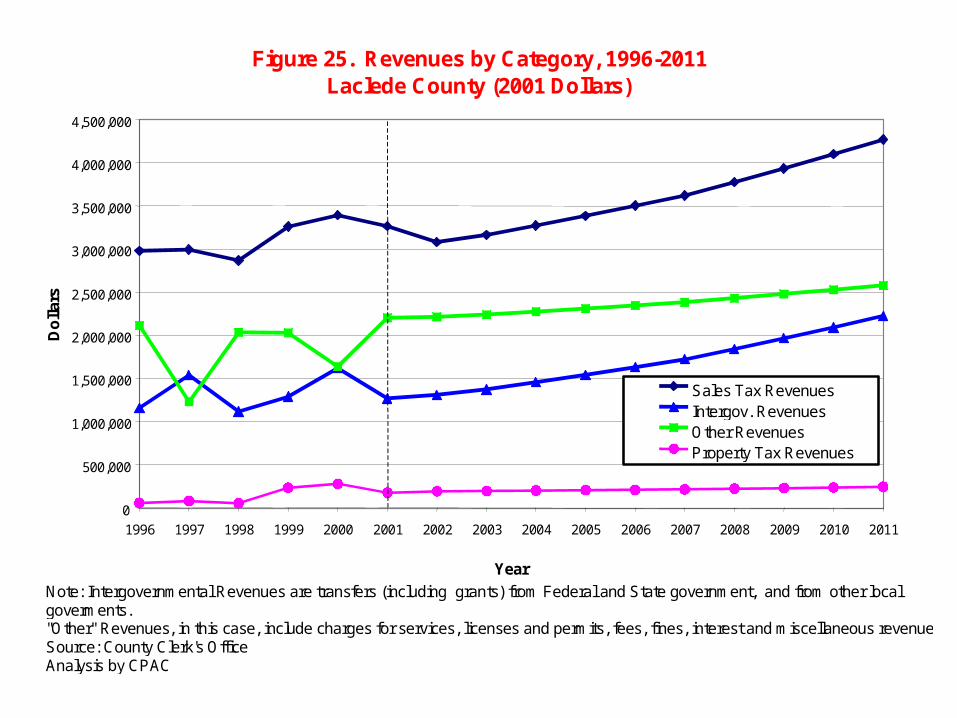
Figure 25. Revenues by Category, 1996-2011 Laclede County (2001 Dollars)
0
500,000
1,000,000
1,500,000
2,000,000
2,500,000
3,000,000
3,500,000
4,000,000
4,500,000
1996 1997 1998 1999 2000 2001 2002 2003 2004 2005 2006 2007 2008 2009 2010 2011
Year
Do
llars
Sales Tax Revenues Intergov. Revenues Other Revenues Property Tax Revenues
Note: Intergovernmental Revenues are transfers (including grants) from Federal and State government, and from other local goverments. "Other" Revenues, in this case, include charges for services, licenses and permits, fees, fines, interest and miscellaneous revenues. Source: County Clerk's Office Analysis by CPAC

Conclusions
Baseline projections will be as described above, if the current conditions in the County prevail.
Laclede County has experienced steady growth throughout the 1990s, even though it did feel the effects of the nation-wide recession in a number of variables in 2000.
That growth is expected to continue, bringing with it opportunities and challenges that must be addressed and that will affect the quality of life for all county residents.