lebanon and laclede county retail sales analysis anna kovalyova program coordinator lucy zakharova...
Post on 21-Dec-2015
216 views
TRANSCRIPT

Lebanon and Laclede CountyRetail Sales Analysis
http://www.cpac.missouri.edu/lebanon/
Anna KovalyovaProgram CoordinatorLucy ZakharovaResearch Assistant
University of Missouri, Columbia

Importance of Retail Sales Analysis
Shift from dependence on property to sales taxes
In an evolving world, counties are under pressure to satisfy demand for public goods and services
Increasing sales tax avoidance in the form of catalog and internet sales contributed to decline of the total taxable retail sales in Laclede County

Retail Sales
Merchandise sold for cash or credit at retail and wholesale by establishments primarily engaged in retail trade
Amounts received from customers for layaway purchases
Receipts from rental or leasing of vehicles, equipment, instruments, tools, etc.
Receipts for delivery, installation, maintenance, repair, alteration, storage, and other services
The total value of service contracts
Gasoline, liquor, tobacco, and other excise taxes which are paid by the manufacturer or wholesaler and passed on to the retailer

Figure 19. Laclede Total Retail Sales and Total Personal Income Growth, 1991-2001 (in 2001 dollars)
-10.00
-8.00
-6.00
-4.00
-2.00
0.00
2.00
4.00
6.00
8.00
10.00
1991 1992 1993 1994 1995 1996 1997 1998 1999 2000 2001
Year
Per
cent
Total Retail Sales Growth
Total Personal Income Growth
Data Source: Missouri Department of Revenue, U.S. Bureau of Census, Bureau of Economic Analysis, Tax Administration BureauAnalysis by CPAC

Figure 1. Laclede County and Lebanon City vs. State Total Retail Sales 1990-2001 (2001 dollars)
-
10,000,000
20,000,000
30,000,000
40,000,000
50,000,000
60,000,000
70,000,000
1990 1991 1992 1993 1994 1995 1996 1997 1998 1999 2000 2001 Year
Sta
te S
ales
(th
ou
san
ds)
-
50,000
100,000
150,000
200,000
250,000
300,000
350,000
Co
un
ty a
nd
Cit
y
Sal
es (
tho
usa
nd
s)
Missouri Laclede Lebanon
Data Source: Missouri Department of Revenue, Tax Administration Bureau Analysis by CPAC

Figure 3. Laclede County and Lebanon City vs. State Per Capita Retail Sales, 1990-2001 (2001 dollars)
$0
$5,000
$10,000
$15,000
$20,000
$25,000
1990 1991 1992 1993 1994 1995 1996 1997 1998 1999 2000 2001
Year
Per
Cap
ita
Ret
ail S
ales
Missouri
Laclede
Lebanon
Data Source: Missouri Department of Revenue, Tax Administration Bureau, U.S. Bureau of CensusAnalysis by CPAC

Figure 3. Laclede County and Adjacent Counties Total Retail Sales
1990, 1995 and 2001 (2001 dollars)
$0
$100,000
$200,000
$300,000
$400,000
$500,000
$600,000
$700,000
Laclede Camden Dallas Pulaski Texas Webster Wright
Year
Thou
sand
s
1990
1995
2001
Data Source: Missouri Department of Revenue, Tax Administration BureauAnalysis by CPAC

Figure 4. Laclede County and Adjacent Counties Per Capita Retail Sales 1990, 1995 and 2001 (2001 dollars)
$0
$2,000
$4,000
$6,000
$8,000
$10,000
$12,000
$14,000
$16,000
$18,000
$20,000
Laclede Camden Dallas Pulaski Texas Webster Wright
County
Pe
r C
ap
ita
Re
tail
Sa
les
1990
1995
2001
Data Source: Missouri Department of Revenue, U.S. Bureau of CensusTax Administration BureauAnalysis by CPAC

Figure 21. Lebanon and Adjacent CitiesTotal Retail Sales 1990-2001 (in 2001 dollars)
$0
$50,000
$100,000
$150,000
$200,000
$250,000
$300,000
$350,000
Carthage Chillicothe Lebanon Monett Rolla West Plains
Do
llars
(th
ou
san
ds)
1990
1995
2001
Data Source: Missouri Department of Revenue, Tax Administration Bureau, U.S. Bureau of CensusAnalysis by CPAC

Figure 20. Lebanon and Adjacent Cities Per Capita Retail Sales1990 and 2000 (in 2001 dollars)
-
5,000
10,000
15,000
20,000
25,000
Carthage Chillicothe Lebanon Monett Rolla West Plains
Do
llars
PC Retail sales 1990
PC Retail sales 2000
Data Source: Missouri Department of Revenue, Tax Administration Bureau, U.S. Bureau of CensusAnalysis by CPAC

Trade Area Analysis
Trade Area Capture
Purpose: To estimate the number of customers
drawn to a particular community or county to
purchase a product or service at any given time

Trade Area Capture
Income CapitaPer County
Income CapitaPer State
Subsector for
Sales Retail
CapitaPer State
Subsector for
Sales Retail
County
Subsector for TACCounty
i
ii
Calculation

What Does Trade Area Analysis Tell Us?
Trade Area CaptureIf Trade Area Capture is Larger than Population:
The community is attracting consumers from outside its boundaries, or
Local residents are spending more for the selected commercial item than the state average
If Trade are Capture is Less than Population:
The community is not capturing the commercial purchases of its own residents, or
Local Residents are spending relatively less for the commercial item than the state average

Pull Factor
Purpose: To estimate the portion of customers a community draws from outside its borders
Calculation:
Pull Factor = Trade Area Capture estimate
County population
Trade Area Analysis
Pull Factor
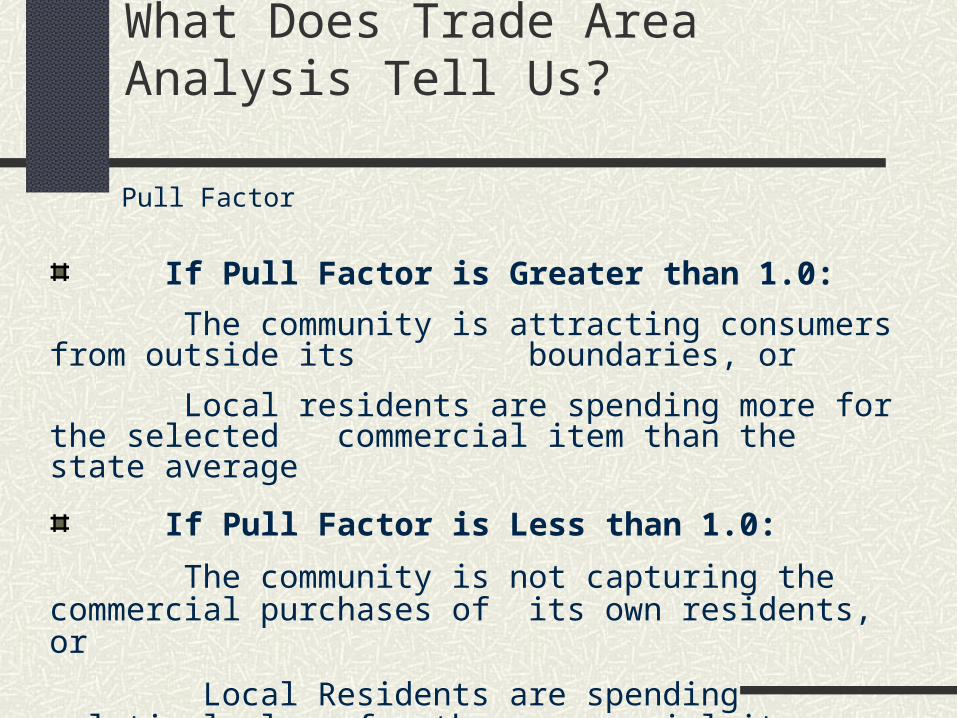
What Does Trade Area Analysis Tell Us?
If Pull Factor is Greater than 1.0:
The community is attracting consumers from outside its boundaries, or
Local residents are spending more for the selected commercial item than the state average
If Pull Factor is Less than 1.0:
The community is not capturing the commercial purchases of its own residents, or
Local Residents are spending relatively less for the commercial item than the state average

Purpose: To estimate possible retail sales that could be achieved if each retail subsector captured 100 percent of the local market
Calculation:
Potential Sales = Actual Retail Sales of merchandise j in county l
Pull Factor for this type of merchandise in county l
Potential Sales

If Potential Sales fall behind the actual sales:There is a surplus in this subsector and the subsector is considered an exporter.
If Potential Sales exceed the actual sales:There is a leakage in this subsector and the subsector is considered an importer.
In this case, the subsector is losing money because people are going outside of the locality to purchase some of the goods and services provided by the subsector.
Potential Sales

The data are from 1990 with fiscal data adjusted for inflation (2001 dollars). This example is for the Total Retail Sales and Food category.
Data for Laclede CountyPopulation 27,228Per Capita Income $17,167Total Retail Sales $236,549,645Food Stores’ Sales $40,453,349
Data for MissouriPopulation 5,128,880Per Capita Income $24,042Total Retail Sales $54,293,947,976Food Stores' Sales $7,875,626,391State Per Capita Food Sales $1,536State Per Capita Total Sales $10,586
Example For Laclede County

Example For Laclede County
Trade Area Capture (TAC) calculation:
TAC = 31,295 (persons) TAC for Food Subsector = 36,884 (persons)
County TAC for Total Retail Sales
167,17$
042,24$*
586,10$
645,549,236$=

Pull Factor (PF) calculation
PF for Total Retail Sales = 1.15 PF for Food Subsector = 1.36
County PF for Total Retail Sales 228,27
295,31=
Example For Laclede County

Potential Sales (PS) calculation:
County PS for Total Retail Sales 1.15
45$236,549,6=
PS for Total Retail Sales = $205,695,343.48 (actual $236,549,645)
PS for Food Subsector = $29,745,109.55 (actual $40,453,349)
Example For Laclede County
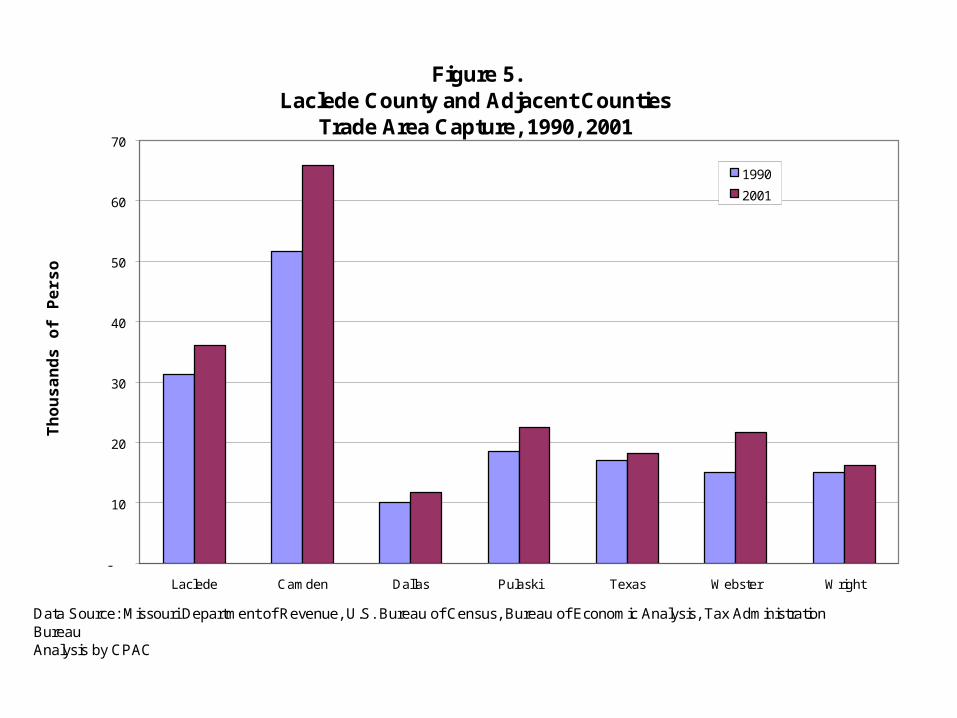
Figure 5. Laclede County and Adjacent Counties
Trade Area Capture, 1990, 2001
-
10
20
30
40
50
60
70
Laclede Camden Dallas Pulaski Texas Webster Wright
Th
ou
san
ds
of
Per
son
s
1990
2001
Data Source: Missouri Department of Revenue, U.S. Bureau of Census, Bureau of Economic Analysis, Tax Administration BureauAnalysis by CPAC

Figure 7. Laclede County Trade Area Capture 1990, 2001
0
10
20
30
40
50
60
70
80
90
Buildin
g
Gen
eral
Mer
chan
dise
Food
Store
Autom
otive G
as
Appar
el
Furnit
ure
Eating
Misc
ellan
eous
Hotels
and
Mot
els
Auto
Repair
s
Retail Category
Th
ou
san
ds
of
Per
son
s
1990
2001
Data Source: Missouri Department of Revenue, Tax Administration Bureau, U.S. Bureau of Census, Bureau of Economic AnalysisAnalysis by CPAC

Figure 10. Laclede County and Adjacent CountiesGeneral Merchandise Stores
Trade Area Capture, 1990, 2001
-
2
4
6
8
10
12
14
16
Laclede Camden Dallas Pulaski Texas Webster Wright
Thou
sand
s of
Per
sons
1990
2001
Data Source: Missouri Department of Revenue, Tax Administration Bureau, U.S. Bureau of Census, Bureau of Economic AnalysisAnalysis by CPAC

Figure 6. Laclede County and Adjacent Counties
Pull Factor 1990, 2001
0.00
0.20
0.40
0.60
0.80
1.00
1.20
1.40
1.60
1.80
2.00
Laclede Camden Dallas Pulaski Texas Webster Wright
Pu
ll F
acto
r
1990
2001
Data Source: Missouri Department of Revenue, U.S. Bureau of Census, Bureau of Economic Analysis, Tax Administration BureauAnalysis by CPAC

Figure 8. Laclede County Pull Factor1990, 2001
-
0.50
1.00
1.50
2.00
2.50
3.00
Buildin
g
Gen
eral
Mer
chan
dise
Food
Store
Autom
otive G
as
Appar
el
Furnit
ure
Eating
Misc
ellan
eous
Hotels
and
Mot
els
Auto
Repair
s
Retail Category
Pu
ll F
ac
tor
1990
2001
Data Source: Missouri Department of Revenue, Tax Administration Bureau, U.S. Bureau of Census, Bureau of Economic AnalysisAnalysis by CPAC

Figure C9. Laclede County and Adjacent CountiesBuilding Material, Hardware and Garden Supplies
Pull Factor, 1990, 2001
-
0.50
1.00
1.50
2.00
2.50
3.00
Laclede Camden Dallas Pulaski Texas Webster Wright
Pu
ll F
ac
tor
1990
2001
Data Source: Missouri Department of Revenue, Tax Administration Bureau, U.S. Bureau of Census, Bureau of Economic AnalysisAnalysis by CPAC
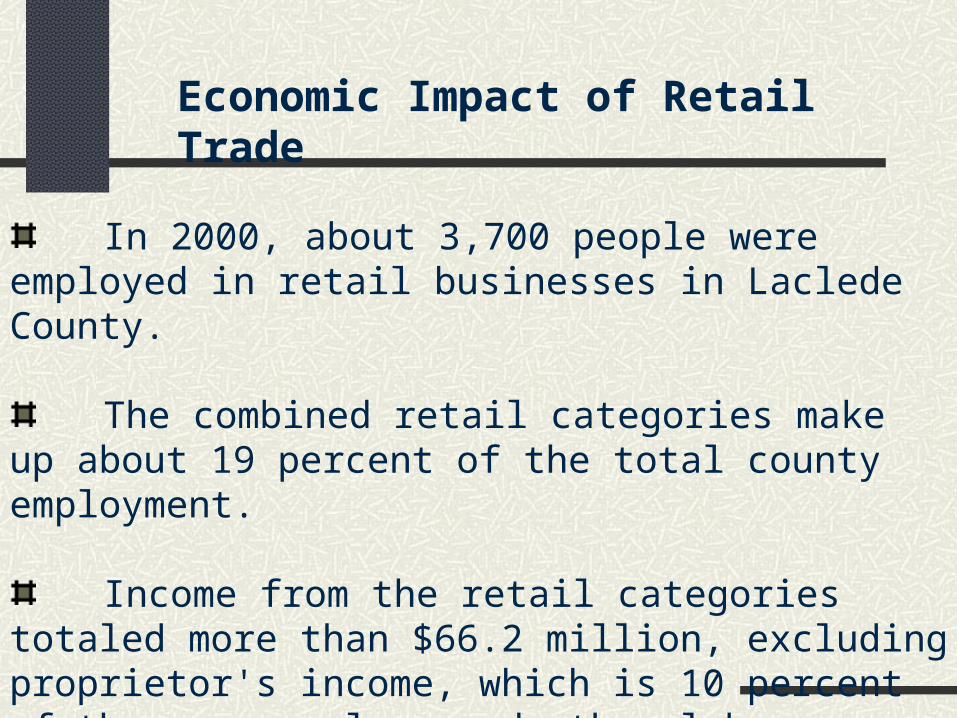
Economic Impact of Retail Trade
In 2000, about 3,700 people were employed in retail businesses in Laclede County.
The combined retail categories make up about 19 percent of the total county employment.
Income from the retail categories totaled more than $66.2 million, excluding proprietor's income, which is 10 percent of the wage, salary and other labor earnings of Laclede County residents.

Retail Sector
County Employment *
Employment Multiplier
Total Employment
Impact
Earnings (1,000)
Income multiplier
Total Income Impact (1,000)
Average Wage per Employee
Building Materials 162 1.23 199 $2,956 1.19 $3,531 $17,760General Merchandise 627 1.16 (D) (D) 1.25 (D) (D)Food Stores 242 1.18 285 $4,305 1.19 $5,113 $17,965Automotive and Gas 738 1.20 886 $12,759 1.22 $15,585 $17,589Apparel 109 1.16 (D) (D) 1.30 (D) (D)Furniture 228 1.25 284 $4,740 1.24 $5,870 $20,661Eating 898 1.20 1,076 $8,877 1.38 $12,209 $11,344Miscellaneous 429 1.15 494 $15,963 1.21 $19,248 $38,943Hotels and Motels 190 1.28 243 $3,081 1.46 $4,506 $18,543Auto Repair 79 1.44 114 $3,584 1.49 $5,335 $46,758
Total 3,702 1.33 4,933 $66,232 1.41 $93,187 $18,891* The employment for Building Materials through Miscellaneous Categories are estimates based on ES-202 data from MO Works! and
the 1-digit employment SIC for retail sales.
Laclede County Retail Trade Impact on Employment and Income, 2000
Table 1.
Source: Minnesota IMPLAN GroupU.S. Bureau of the Census, Bureau of Economic Analysis, REIS;MO Works! http://mo.works.state.mo.us; andU.S. Department of Labor, Bureau of Labor Statistics, http://stats.bls.gov/data/home.htm
Analysis by CPAC

Table 2.
Source: Minnesota IMPLAN GroupU.S. Bureau of the Census, Bureau of Economic Analysis, REIS;U.S. Department of Labor, Bureau of Labor Statistics, http://stats.bls.gov/data/home.htm
Analysis by CPAC

Shift-Share Analysis
Aggregate State Effect: the expected growth of a retail sector i in a county j given the overall average state retail sales growth.
Category/Sector Effect: county's growth due to the differences in the business structure of a county and that of a state.
Competitive Effect: differences between the rates of growth for a county and those for a state in individual retail sectors.

Figure 22. Laclede County Decomposition of Shift-Share Analysis
1990-2001 (in $1,000)
-20,000 -10,000 10,000 20,000 30,000 40,000 50,000 60,000 70,000 80,000
Building
Merchandise
Food
Auto
Gas
Apparel
Furniture
Eating
Miscellaneous
Hotels
Auto Repair
Cat
ego
ry
Total Change
Aggregate State Effect
Category/Sector Effect
Competitive/Local Effect
Data Source: Missouri Department of Revenue, Tax Administration BureauAnalysis by CPAC

Retail Aggregate State Category/Sector Competitive/Local Total ChangeCategory Effect Effect Effect Over Time
1990-95 1995-20011990-20011990-95 1995-20011990-2001 1990-95 1995-2001 1990-2001 1990-95 1995-2001 1990-2001Building 1,625 1,725 3,378 -330 -4,932 -5,273 83 -47 19 1,378 -3,254 -1,876Merchandise 623 741 1,296 306 -3,641 -3,134 295 1,678 1,841 1,225 -1,222 3Food 4,789 3,729 9,954 -9,330 -3,816 -14,592 -3,255 -1,307 -4,552 -7,796 -1,394 -9,190
Auto 407 729 846 383 -1,054 -272 2,154 319 2,363 2,944 -7 2,937Gas 489 455 1,016 -494 -333 -895 -140 -2,072 -2,217 -145 -1,950 -2,095Apparel* 2,189 1,175 4,550 -1,474 -1,820 -5,038 -8,911 -9,651 -18,004 -8,196 -10,295 -18,491Furniture 807 1,046 1,677 2,540 -1,113 1,595 -1,002 1,276 282 2,345 1,209 3,554Eating 2,572 2,747 5,346 -454 -1,110 -1,607 211 -2,634 -2,409 2,328 -998 1,331Miscellaneous 2,597 3,986 5,399 2,896 36,722 32,084 7,478 29,452 45,649 12,971 70,160 83,131Hotels 533 515 1,107 1 -966 -1,076 -520 1,690 1,222 14 1,240 1,253Auto Repair 170 148 353 200 77 330 -506 -68 -663 -137 157 20
Total Effect 34,922 2,123 23,532 60,577* 2001 data for Apparel w as treated as true zero.
Retail Sales Shift-Share Decomposition Analysis Laclede County, 1990-2001 ($1,000)
Table 3
Data Source: Missouri Department of Revenue, Tax Administration BureauAnalysis by CPAC

Figure 23. Laclede County Decomposition of Shift-Share Analysis
1990-2001 (in %)
-100.00 -50.00 0.00 50.00 100.00 150.00 200.00 250.00 300.00 350.00 400.00
Building
Merchandise
Food
Auto
Gas
Apparel
Furniture
Eating
Miscellanous
Hotels
Auto Repair
Cat
ego
ry
Total Change
Aggregate State Effect
Category/Sector Effect
Competitive/Local Effect
Data Source: Missouri Department of Revenue, Tax Administration BureauAnalysis by CPAC

Table 4
Data Source: Missouri Department of Revenue, Tax Administration BureauAnalysis by CPAC

Key Findings
After adjusting for inflation, Laclede County’s retail sales increased from $237 million in 1990 to $302 million in 2001 -- a growth of 27.48 percent. This is compared to a growth of 19.83 percent in retail sales for the state over the same time period.
County retail sales have declined in real terms
between 1999 and 2001 -- from $313 million to $302 million (2001 dollars).
The number of retail firms in Laclede County increased from 800 in 1990 to 900 in 2000.

Laclede County’s pull factor decreased from 1.15 in 1990 to 1.09 in 2001. The county is drawing customers from outside its borders or its residents are spending more on retail sales than the state average
Miscellaneous Retail appears to be the fastest growing category with respect to maintaining or capturing customers within its trade area.
Several retail categories show promise for expansion in Laclede County. These include Miscellaneous Retail, Hotels and Motels, and Automotive.
Key Findings

In 2000, over 3,700 people were employed in retail businesses in Laclede County – 19 percent of total county employment.
Payroll from the retail sectors totaled more than $66,232,000 -- 10 percent of the wage, salary and other labor earnings of Laclede County residents.
Key Findings
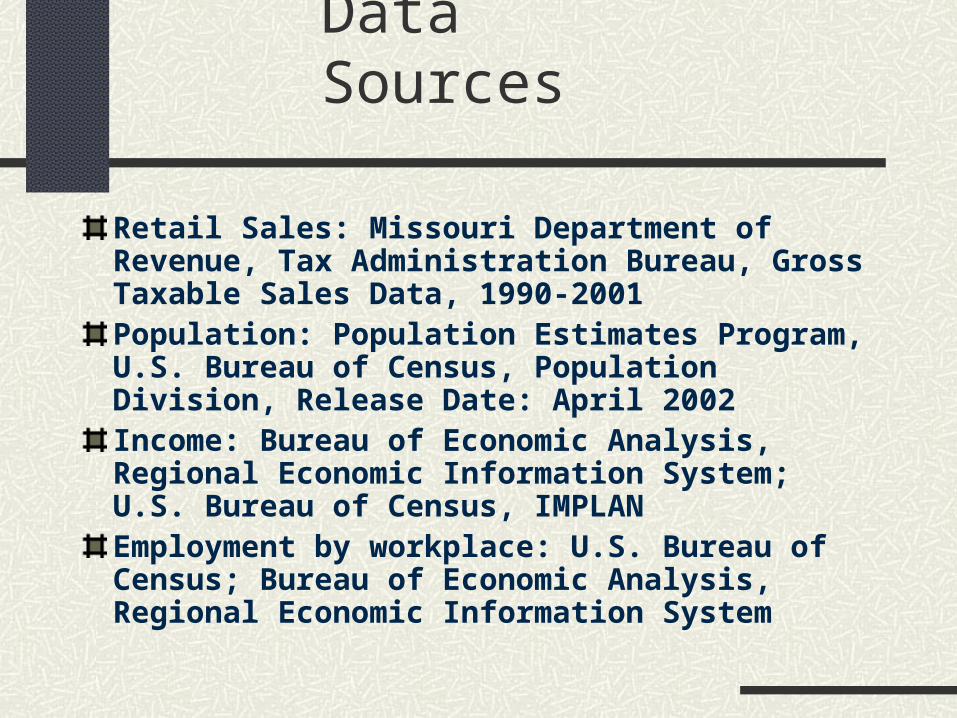
Data Sources
Retail Sales: Missouri Department of Revenue, Tax Administration Bureau, Gross Taxable Sales Data, 1990-2001Population: Population Estimates Program, U.S. Bureau of Census, Population Division, Release Date: April 2002Income: Bureau of Economic Analysis, Regional Economic Information System; U.S. Bureau of Census, IMPLANEmployment by workplace: U.S. Bureau of Census; Bureau of Economic Analysis, Regional Economic Information System