the impacts of the h.d. lee plant closure in laclede county: 2001-2011 anna e. kovalyova morgan m....
TRANSCRIPT
The Impacts of the H.D. Lee Plant Closure in Laclede County:
2001-2011 Anna E. Kovalyova
Morgan M. Mundell
University of Missouri, Columbia

The Laclede County Scenario Project analyzes the overall impact of the H.D. Lee plant closure on a county economy. The project has been a collaborative effort between the County and the Community Policy Analysis Center, University of Missouri.
The initial impact of the laid-off workers is introduced in year 2003, and is examined through 2011. The report compares the forecasts prior to and after the plant closure.

Laclede County is expected to continue its growth in a number of socio-demographic, economic and fiscal variables over the next ten years. However, this growth is smaller than it could have been if the County did not experience the loss of 750 jobs in 2003 due to the closure of H.D. Lee Company, Inc.
Findings

This closure is expected to have the following adverse effects on the County:
Growth over the baseline period would have stimulated demand for approximately 3,380 additional housing units.
When considering the effect of plant closure, the demand for housing in Laclede County is expected to increase by 2,470 housing units over the 10 years of the projection which is just over 900 units less than in the baseline.

In the baseline (i.e., prior to the plant closure), employment by workplace is projected to increase at a rate of 2.3 percent per year through 2011. This growth would have added almost 4,600 jobs to the local economy over the next decade.
However, with the closure of the H.D. Lee plant, the forecasted employment is projected to increase at a smaller rate of 1.7 percent per year through 2011. This means 1,200 less jobs than was expected without the plant closure.

The total decrease of 1,007 jobs in County employment in 2003 reflects both the direct loss of 750 jobs at the H.D. Lee plant and the additional 257 jobs through multiplier effects.
With the plant closure, the number of unemployed in the County in 2003 increased by 90 percent over its baseline figure.

In the next two years, most of the laid-off people are expected to find another job or go though additional training. Still, some will remain unemployed, whereas others will retire, thus, leaving the labor force. Therefore, in the scenario the number of unemployed in Laclede County is expected to virtually return to its 2001 level by 2011.

In the baseline, the Laclede County total personal income was expected to grow at a real growth rate of 3.7 percent per year.
When considering the effect of plant closure, total personal income is expected to grow at an annual rate of 3.0 percent leading to a growth of almost $50.3 million less than in the original baseline.

In the baseline, increased County income and employment were to fuel the strong growth in taxable retail sales – from $301.6 million in 2001 to almost $427 million in 2011 (in 2001 dollars).
With the closure of the H.D. Lee plant, the County retail sales are expected to increase by about $95 million – $30 million less than is expected without the plant closure.

In the baseline, County property taxes and sales taxes were anticipated to grow at the respective annual rates of 3.8 and 3.1 percent over the next decade. This would have led to an increase of approximately $68,000 and $1 million for County property taxes and sales taxes, respectively over the baseline period.

After the plant closure, the forecasted tax revenues are projected to increase at slower rates of 3.1 and 2.1 percent per year through 2011 for property and sales taxes, respectively. This growth will lead to a cumulative loss of about $97K in property and approximately $2.4 million in sales tax revenues between 2001 and 2011.
The increase in unemployment in the first 2 years after the H.D. Lee plant closure occurs could be used by the County as an excellent time in attracting new jobs.

Figure 1. Population, 1990-2011 Laclede County and Lebanon City
-
5,000
10,000
15,000
20,000
25,000
30,000
35,000
40,000
45,000
1990 1991 1992 1993 1994 1995 1996 1997 1998 1999 2000 2001 2002 2003 2004 2005 2006 2007 2008 2009 2010 2011
Year
Po
pu
lati
on
Laclede-Baseline Laclede-Scenario City of Lebanon
Source: US Census Bureau, Time Series of Missouri Intercensal Population Estimates by County Analysis by CPAC

Figure 2. Persons 17 and Younger, 1990-2011 Laclede County
-
2,000
4,000
6,000
8,000
10,000
12,000
1990 1991 1992 1993 1994 1995 1996 1997 1998 1999 2000 2001 2002 2003 2004 2005 2006 2007 2008 2009 2010 2011 Year
Per
son
s
Baseline Scenario
Source: US Census Bureau Analysis by CPAC

Figure 3. Persons 65 and Over, 1990-2011 Laclede County
-
1,000
2,000
3,000
4,000
5,000
6,000
7,000
1990 1991 1992 1993 1994 1995 1996 1997 1998 1999 2000 2001 2002 2003 2004 2005 2006 2007 2008 2009 2010 2011 Year
Pers
on
s
Baseline Scenario
Source: US Census Bureau Analysis by CPAC

Figure 4. School Enrollment, 1990-2011 Laclede County
-
1,000
2,000
3,000
4,000
5,000
6,000
7,000
8,000
1990 1991 1992 1993 1994 1995 1996 1997 1998 1999 2000 2001 2002 2003 2004 2005 2006 2007 2008 2009 2010 2011 Year
Stu
den
ts
Baseline Scenario
Source: Missouri State Board of Education, DESE Analysis by CPAC
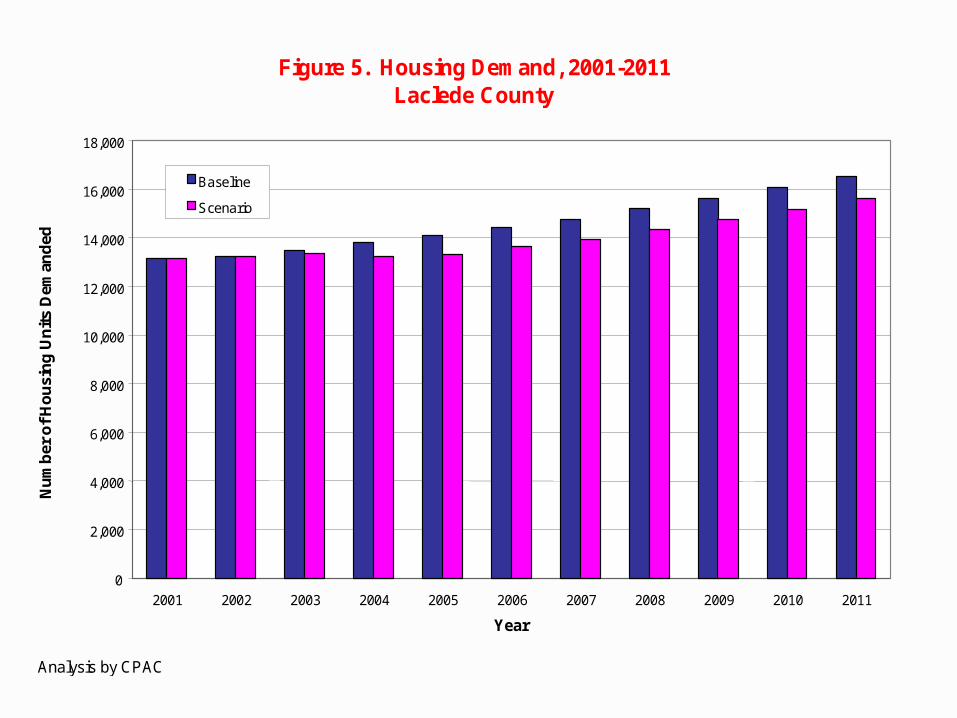
Figure 5. Housing Demand, 2001-2011 Laclede County
0
2,000
4,000
6,000
8,000
10,000
12,000
14,000
16,000
18,000
2001 2002 2003 2004 2005 2006 2007 2008 2009 2010 2011 Year
Nu
mb
er o
f H
ou
sin
g U
nit
s D
eman
ded
Baseline Scenario
Analysis by CPAC

Figure 6. Civilian Labor Force, 1990-2011 Laclede County
-
5,000
10,000
15,000
20,000
25,000
1990 1991 1992 1993 1994 1995 1996 1997 1998 1999 2000 2001 2002 2003 2004 2005 2006 2007 2008 2009 2010 2011
Year
Lab
or
Fo
rce
Baseline Scenario
Source: Missouri Department of Labor and Industrial Relations Analysis by CPAC

Figure 7. Employment by Workplace, 1990-2011Laclede County
-
5,000
10,000
15,000
20,000
25,000
1990 1991 1992 1993 1994 1995 1996 1997 1998 1999 2000 2001 2002 2003 2004 2005 2006 2007 2008 2009 2010 2011
Year
Nu
mb
er o
f Jo
bs
Baseline
Scenario
Source: Missouri Department of Labor and Industrial Relations and Bureau of Economic Analysis, REIS.Note: 1. Employment data reported by REIS includes both full- and part-time jobs.2. Employment data reported by MO Dept of Ec. Development uses different methodology. In particular, their employment data equals to Labor Force - Unemployment (i.e., it already accounts for the net commuting).Analysis by CPAC

Figure 8. Unemployment, 1990-2011
Laclede County
-
200
400
600
800
1,000
1,200
1,400
1,600
1,800
2,000
1990 1991 1992 1993 1994 1995 1996 1997 1998 1999 2000 2001 2002 2003 2004 2005 2006 2007 2008 2009 2010 2011 Year
Un
emp
loye
d P
erso
ns
Baseline Scenario
Source: Missouri Department of Labor and Industrial Relations Analysis by CPAC

Figure 9. In-Commuters and Out-Commuters, 2000-2011 Laclede County
-
1,000
2,000
3,000
4,000
5,000
2000 2001 2002 2003 2004 2005 2006 2007 2008 2009 2010 2011
Year
Nu
mb
er o
f C
om
mu
ters
Incommuters Outcommuters
Source: US Census Bureau Analysis by CPAC
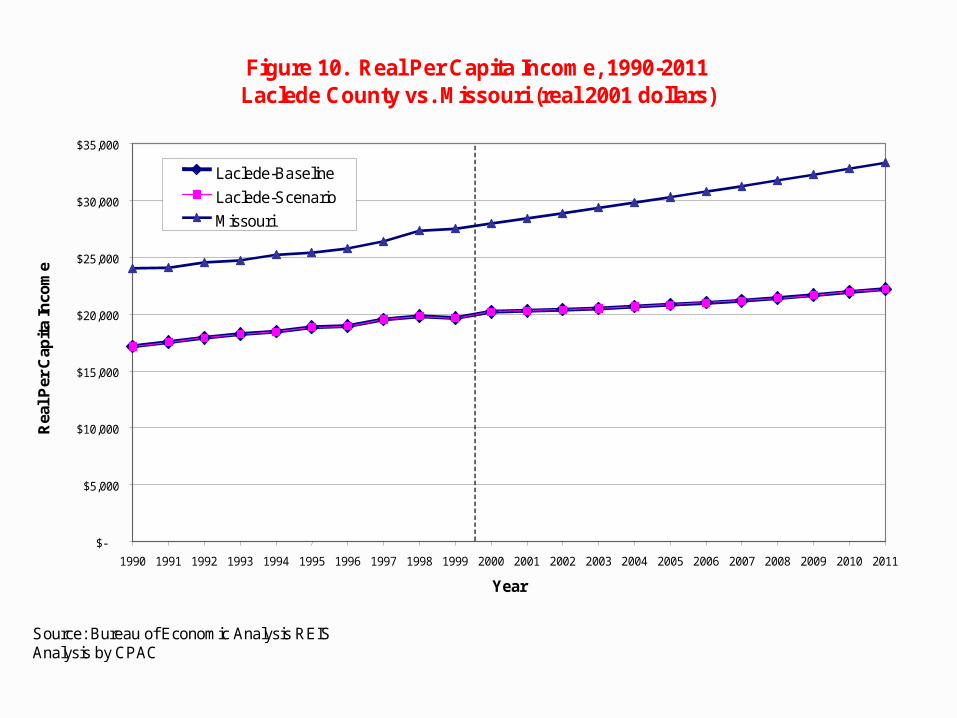
Figure 10. Real Per Capita Income, 1990-2011 Laclede County vs. Missouri (real 2001 dollars)
$-
$5,000
$10,000
$15,000
$20,000
$25,000
$30,000
$35,000
1990 1991 1992 1993 1994 1995 1996 1997 1998 1999 2000 2001 2002 2003 2004 2005 2006 2007 2008 2009 2010 2011 Year
Rea
l Per
Cap
ita
Inco
me
Laclede-Baseline Laclede-Scenario Missouri
Source: Bureau of Economic Analysis REIS Analysis by CPAC

Figure 11. Total Personal Income, 1990-2011 Laclede County (2001 Dollars)
$
$100
$200
$300
$400
$500
$600
$700
$800
$900
$1,000
1990 1991 1992 1993 1994 1995 1996 1997 1998 1999 2000 2001 2002 2003 2004 2005 2006 2007 2008 2009 2010 2011 Year
To
tal P
erso
nal
Inco
me
($1,
000)
Baseline Scenario
Source: Bureau of Economic Analysis REIS Analysis by CPAC

Figure 12. Assessed Property Values, 1990-2011 Laclede County (2001 Dollars)
$-
$50,000,000
$100,000,000
$150,000,000
$200,000,000
$250,000,000
$300,000,000
$350,000,000
$400,000,000
$450,000,000
1990 1991 1992 1993 1994 1995 1996 1997 1998 1999 2000 2001 2002 2003 2004 2005 2006 2007 2008 2009 2010 2011 Year
Ass
esse
d P
rop
erty
Val
ue
Laclede-Baseline Laclede-Scenario Lebanon City
Source: MU Economic and Policy Analysis Research Center, Missouri State Tax Commission and Missouri State Auditor's Office Note: Data for Property Values include real and personal property, and utilities. Analysis by CPAC
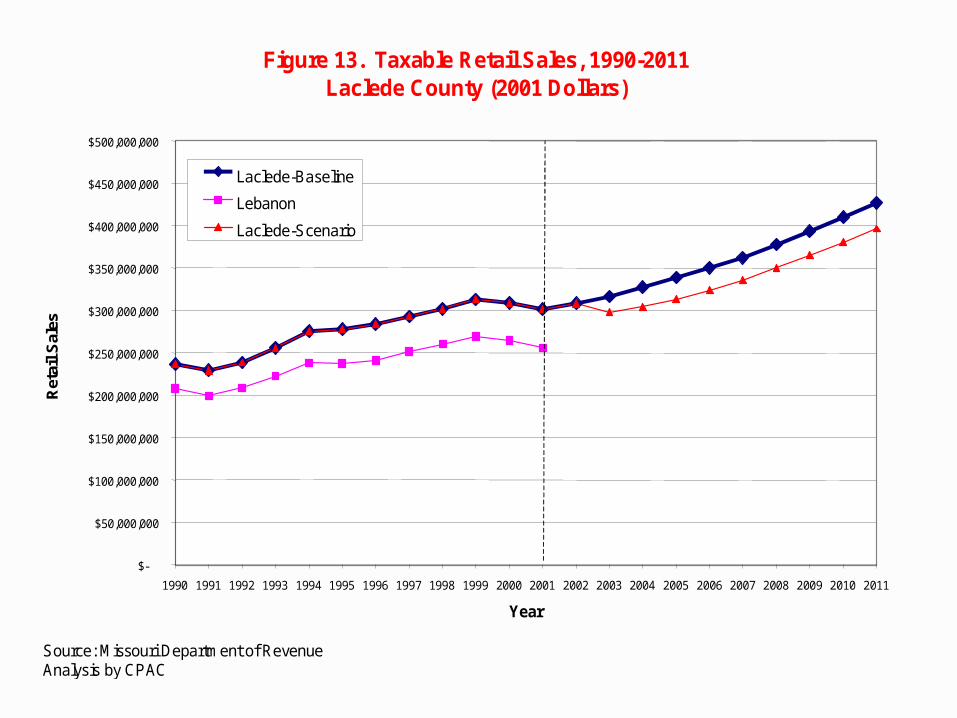
Figure 13. Taxable Retail Sales, 1990-2011 Laclede County (2001 Dollars)
$-
$50,000,000
$100,000,000
$150,000,000
$200,000,000
$250,000,000
$300,000,000
$350,000,000
$400,000,000
$450,000,000
$500,000,000
1990 1991 1992 1993 1994 1995 1996 1997 1998 1999 2000 2001 2002 2003 2004 2005 2006 2007 2008 2009 2010 2011 Year
Ret
ail S
ales
Laclede-Baseline Lebanon Laclede-Scenario
Source: Missouri Department of Revenue Analysis by CPAC

Figure 14. Total Revenues and Expenditures, 1996-2011 Laclede County and Lebanon City (2001 Dollars)
0
2,000,000
4,000,000
6,000,000
8,000,000
10,000,000
12,000,000
1996 1997 1998 1999 2000 2001 2002 2003 2004 2005 2006 2007 2008 2009 2010 2011
Year
Do
llars
Laclede Revenues-Baseline Laclede Expenditures-Baseline Lebanon Revenues Lebanon Expenditures Laclede Revenues-Scenario Laclede Expenditures-Scenario
Note: Total Revenues and Expenditures do not include operating transfers. Source: City Administrator Office, Lebanon and County Clerk's Office. Analysis by CPAC

Figure 15. Revenues by Category, 1996-2011 Laclede County (2001 Dollars)
0
500,000
1,000,000
1,500,000
2,000,000
2,500,000
3,000,000
3,500,000
4,000,000
4,500,000
1996 1997 1998 1999 2000 2001 2002 2003 2004 2005 2006 2007 2008 2009 2010 2011
Year
Do
llars
Sales Tax Revenues Intergov. Revenues Other Revenues Property Tax Revenues
Note: Intergovernmental Revenues are transfers (including grants) from Federal and State government, and from other local goverments. "Other" Revenues, in this case, include charges for services, licenses and permits, fees, fines, interest and miscellaneous revenues. Source: County Clerk's Office Analysis by CPAC

This report examines current and future potential socio-demographic and economic conditions in Laclede County in two settings: if the H.D. Lee plant closure had not occurred in the county, vs. the consequences of the plant closure.
The increase in unemployment in the first 2 years after the impact of the H.D. Lee plant closure occurs gives the County a great resource in attracting new jobs.
Conclusions