lagoon: an experimental database - tu/e · solutions (propagation) or ... anechoic, silent,...
TRANSCRIPT


LAGOON: An Experimental Database for the Validation of Landing Gear
Noise Prediction Methods
Eric Manoha, Jean Bulté (ONERA)Vlad Ciobaca (DLR)
Bastien Caruelle (Airbus-France)
13th CEAS-ASC Workshop & 4th Scientific Workshop of X3-Noise Resolving Uncertainties in Airframe Noise Testing and CAA Code Validation
1-2 October 2009, Bucharest

3
Outline
• Context• LAGOON : objectives and overview• The LAGOON model• Experimental set-ups and programmes
• F2• CEPRA19
• Mean flow identification F2/CEPRA19 (3D RANS CFD by DLR)• Steady/unsteady aerodynamic measurements
• Overview of F2 measurements• Limited comparison F2/CEPRA19 (on-board sensors, 5-hole probe)
• Acoustic measurements• « Signal-to-noise ratio » in CEPRA19 – F2• Early use of microphone antenna in both facilities
• Conclusions
4
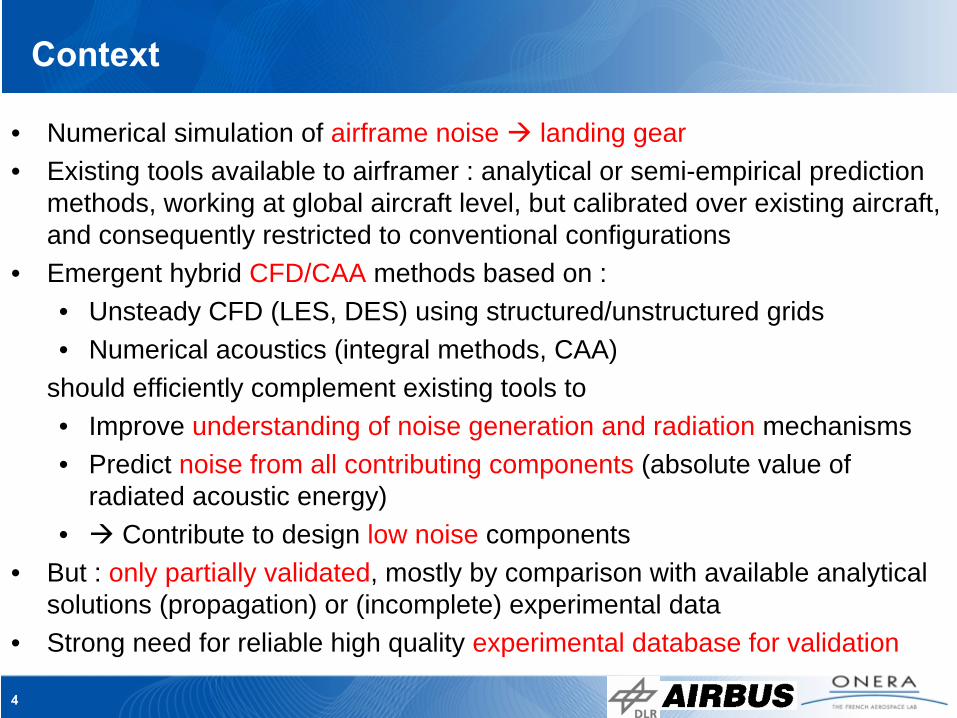
Context
• Numerical simulation of airframe noise landing gear• Existing tools available to airframer : analytical or semi-empirical prediction
methods, working at global aircraft level, but calibrated over existing aircraft, and consequently restricted to conventional configurations
• Emergent hybrid CFD/CAA methods based on :• Unsteady CFD (LES, DES) using structured/unstructured grids• Numerical acoustics (integral methods, CAA)
should efficiently complement existing tools to• Improve understanding of noise generation and radiation mechanisms• Predict noise from all contributing components (absolute value of
radiated acoustic energy)• Contribute to design low noise components
• But : only partially validated, mostly by comparison with available analytical solutions (propagation) or (incomplete) experimental data
• Strong need for reliable high quality experimental database for validation

5
Objectives of the LAGOON project
Objectives/approach• Design / manufacture a dedicated two-wheel landing
gear model• Simple generic shape (adapted to large range of modelling techniques)• Modular structure (for further increasing complexity using add-on parts)
• Achieve a two-step experimental program :• Unsteady / steady aerodynamic measurements in ONERA’s F2 closed section,
aerodynamic windtunnel for CFD validation (noise source generation)• Aeroacoustic measurements in ONERA’s CEPRA19 anechoic, silent, open-jet
windtunnel for CAA validation (noise propagation in non-uniform flow)• Checking that flows in both WTs are rather identifical (steady CFD computations by
DLR, on-board static pressure taps)
• Perform computations with available CFD/CAA, then compare and assess the results with experimental data
Airbus answers to this need by funding the LAGOON
projectLAnding Gear nOise database and CAA validatiON

6
Overview of the LAGOON project
• Partnership• Airbus-France (Project Funding and Manager – B. Caruelle)• ONERA (experimental program, CFD/CAA activities)• DLR (CFD in support of experimental program, CFD/CAA activities)• Southampton University (CFD/CAA activities)• Airbus-UK (technical advisor)
• Planning and main milestones (2006-2010) • Model design and manufacture (2006)• CFD in support of experimental program (2006-2007)• Aerodynamic tests (june 2007) AIAA-2008-2816• Aeroacoustic tests (april 2009) AIAA-2009-3293 • CFD/CAA activities (2008-2010)
7
The LAGOON model• General shape• Onboard instrumentation

8
300
LAGOON simplified nose landing gear model
Wheel diameter : 300 mmScale : 40 % of Airbus A320 NLGBlockage coefficient < 6 % in F2Yaw angle range : ± 15°
Wheel sectionCAD views

9
Onboard instrumentation
Left wheel Right wheel
Axle
Main leg
64 static pressure taps27 Kulite unsteady pressure transducers2 microphones (¼’’)

10
Experimental set-ups and programmes• F2 closed section
aerodynamic WT
• CEPRA19 open-jet aeroacoustic WT

11
F2 aerodynamic windtunnel
• Research facility
- large size models • Test section dimensions : Length = 5 m,
Width = 1.4, Height = 1.8 m• 12 bladed fan (680 kW)• Velocity from 0 to 100 m/s• Total temperature control by a water
cooler ( ± 1°C )• Low level of turbulence
in the test section (less than 0,05 %)
• Built-in optical device support system• LDV : 3 velocity components• Mobile frame : whole test section
accessible in a volume of X = 0.5 m, Y = 0.6 m, Z = 1 m
• Seeding of the flow by incense smoke• Special treatments for unsteady
measurements• Wall support for probes
(DS4) with four degrees of freedom

12
LAGOON experimental program in F2
Preliminary testsBoundary layer transition artificial trippingVibration tests
Flow conditionsMach numbers 0.10, 0.13, 0.15, 0.18, 0.20, 0.23, 0.25, 0.28Yaw angles -12.5° to +12.5° every 2.5°
Mean flow survey (Yaw 0° & 5° only)Static pressure taps2D PIV2D and 3D LDV5-hole probe (for comparison with CEPRA19)
PIV-LDV only at
M = 0.18 and 0.23 Yaw = 0°
and 5°
Model mounted in F2 windtunnel
Unsteady flow surveyUnsteady wall pressure transducers2D and 3D LDVCross Hot Wire probe (XHW) combined with unsteady 2D LDV (2-point measurement)
Acoustic measurements using a wall-mounted acoustic antenna

13
Boundary layers transition artificial tripping Visualizations using acenaphten in F2
• Motivation : CFD validation requires to know the exact position of transitiontripping device required on wheels, axle, main leg
• 4 successive acenaphen visualizations to adjust position and nature of device• Combination of « Zig-Zag » (on wheels) and « CAD-CUT » (on cylinders) device

14
CEPRA 19 aeroacoustic windtunnel

15
LAGOON set-up in CEPRA 19

16
LAGOON set-up in CEPRA 19 Acoustic instrumentation : total 156 channels
FLYOVER ARC
SIDELINE ARC
View from rear showing fly-over and side line arraysrelative positions
LAGOON model
Sideline 58-microphone antenna
Flyover 41-microphone
antennaTwo (flyover/sideline)
arcs of 12 farfield microphones at
distance 6 mDistance 2 m

17
LAGOON CEPRA19 experimental program : tested configurations
Model geometriesFull modelMain leg onlyEmpty WT (background noise)
Yaw angles +5°, 0°, -5°
Wind velocitiesMach numbers 0.10, 0.13, 0.15, 0.18, 0.20, 0.23, 0.25, 0.28
Note : bold values
: flow conditions1) for detailed aerodynamic measurements in F22) to be computed with unsteady / CAA in the project

18
Flow identification F2 / CEPRA19• RANS CFD including installation effects

19
Flow identification (CEPRA19 / F2) using CFD Objective, numerical approach, grids, computations
ObjectiveTo compute the F2/CEPRA19 mean flows including all aerodynamic installation effectCFD approach
Code : TAU (DLR)Numerical method : RANSModel turbulence : two-equation Menter SST k-ωGrid : unstructured
Grids sizeLanding gear : 4.5 MpointsF2 (closed) WT : 4 MpointsCEPRA19 (open) WT : 8 Mpoints
ComputationsMach number : 0.25Reynolds number : 1.75M (based on wheel dimeter)Free field / F2 / CEPRA19
CEPRA19 F2

20
Turbulent kinetic energy k
Flow
identification (CEPRA19 / F2) using
CFD Results
CEPRA19 empty
sectionOpen jet flow Profiles for V = 90 m/s2 m downstream the nozzle
Mean velocity
CEPRA19
/ F2
/ FreefieldVariation of static pressure coefficients and friction coefficients around the (mid-wheel) circumference of the left wheel (median plane)
Static pressure coefficient Friction coefficient

21
Levels45 m/s
(blue)
90 m/s
(red)
Flow
identification (CEPRA19 / F2) using
CFD Results
: mean velocity isocontours
CEPRA19 (open jet)Freefield F2 (closed)
Median plane
Horizontal plane

22
Mean
flow
measurements
in F2• 2D PIV• 2D & 3D LDV
23
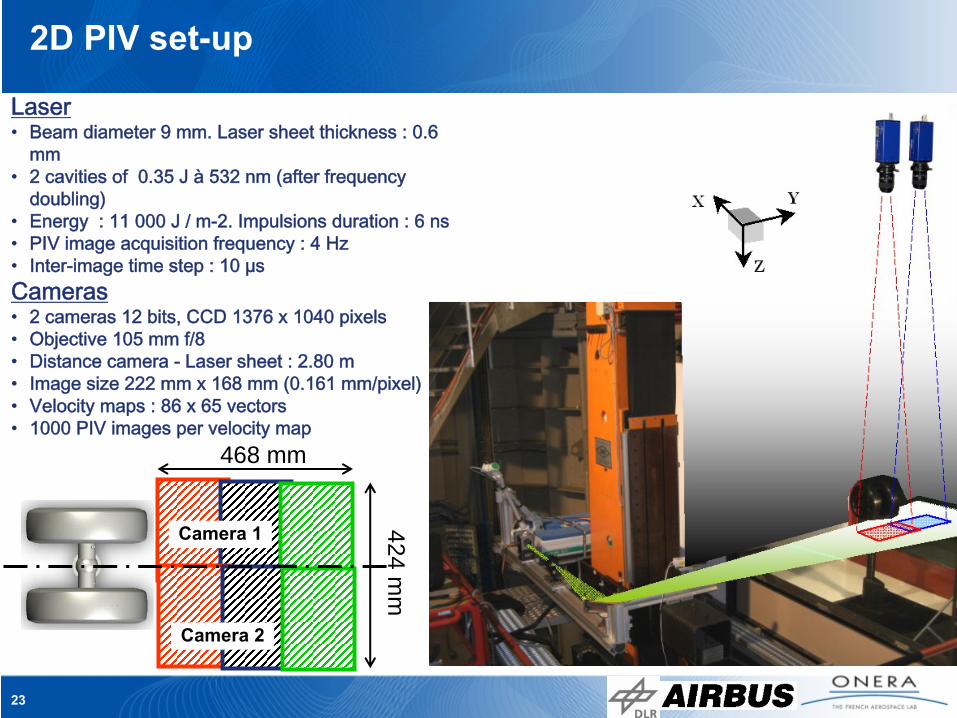
2D PIV set-up
Camera 1
Camera 2
468 mm
424 mm
Laser•
Beam diameter 9 mm. Laser sheet thickness : 0.6 mm
•
2 cavities of 0.35 J à
532 nm (after frequency doubling)
•
Energy
: 11 000 J / m-2. Impulsions duration : 6 ns•
PIV image acquisition frequency : 4 Hz•
Inter-image time step : 10 µsCameras•
2 cameras 12 bits, CCD 1376 x 1040 pixels•
Objective 105 mm f/8 •
Distance camera -
Laser sheet : 2.80 m•
Image size 222 mm x 168 mm (0.161 mm/pixel)•
Velocity maps : 86 x 65 vectors•
1000 PIV images per velocity map
24
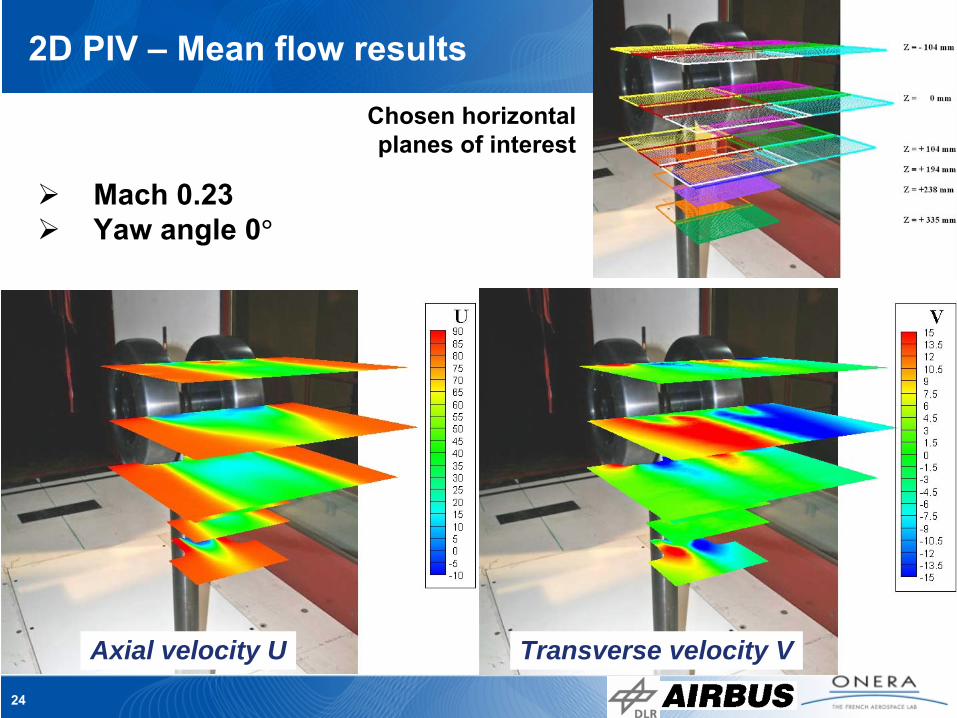
Axial velocity U Transverse velocity V
Mach 0.23Yaw angle 0°
2D PIV –
Mean flow results
Chosen horizontal planes of interest

25
2D PIV –
Mean flow results at Z = 0Influence of yaw angle 5°M = 0.23 - α = 0° M = 0.23 - α = 5°

26
2D LDV and
3D LDV set-up
V0
V0
2D LDV set-upMeasured
velocity
components : U, W
3D LDV set-upMeasured
velocity
components : U, V, W

27
LDV3Dsurvey
X = - 180Z = 0
Comparison
LDV (2D & 3D) vs. 2D PIV along
Y at
X = -
180 and Z = 0
Umean
2D PIV
Vmean
2D LDV3D LDV
Wmean
V not measured by LDV2D
W not measured by PIV2D
Flow
2D PIV3D LDV
2D LDV3D LDV

28
Mean flow identification F2 / CEPRA19• Limited measurements in both WTs with a 5-hole probe• Static pressure taps on wheels

29
F2 / CEPRA 19 flow identification using 5-hole probe Survey in X direction at M = 0.23
0
10
20
30
40
50
60
-450 -350 -250 -150 -50
U-C19-M0.23 U-F2-M0.23
-20
-15
-10
-5
0
5
10
15
20
-450 -350 -250 -150 -50
V-C19-M0.23 V-F2-M0.23
-50
-40
-30
-20
-10
0
10
20
30
40
-450 -350 -250 -150 -50
W-C19-M0.23 W-F2-M0.23
Flow
X = -
70
X = -
450U V
W
U V
W

30
F2 / CEPRA 19 flow identification using 5-hole probe Survey in Y direction at M = 0.23
10
20
30
40
50
60
70
80
90
-210 -140 -70 0 70 140 210
U-C19 U-F2
-30
-20
-10
0
10
20
30
40
-210 -140 -70 0 70 140 210
V-C19 V-F2
-20
-15
-10
-5
0
5
10
-210 -140 -70 0 70 140 210
W-C19 W-F2
Flow
X = -
318
Y= -
220
Y= + 220U V
W
U V
W

31
F2 / CEPRA 19 flow identification using onboard static pressure taps
-1.1-1
-0.9-0.8-0.7-0.6-0.5-0.4-0.3-0.2-0.1
00.10.20.30.40.50.60.70.80.9
11.1
-130 -110 -90 -70 -50 -30 -10 10 30 50 70 90 110 130
M0.28 - F2 M0.25 - F2 M0.23 - F2 M0.20 - F2 M0.18 - F2 M0.15 - F2 M0.13 - F2 M0.10 - F2 M0.28 - C19 M0.25 - C19 M0.23 - C19 M0.20 - C19 M0.18 - C19 M0.15 - C19 M0.13 - C19 M0.10 - C19
Static pressure taps distribution
on left wheel
Measured
static pressure coefficients for Mach numbers 0.10 –
0.28 at F2 / CEPRA19
F2
CEPRA19
Computed
static pressure coefficients for Mach number 0.25 : CEPRA19
/ F2
/ Freefield

32
Unsteady flow measurements in F2• LDV 2D & 3D• Combined (2-point) X-hot-wire probe / LDV2D

33
Unsteady flow measurements using LDV
Velocity components are not in the WT referenceAcquisition modes
Coincidence mode (low data rate)Random mode (higher data rate)
LDV data sampling is random in time : classic Fourier analysis (FFT) not adaptedSpectral analysis techniques
ResamplingSlotting (histogram)
Slotting Histogram
x
xx
xxx
xxxx
xxxx
xxxxxx
xx
xxxx
xxxxxx
xxxx
xxx
x
x
Resampling

34
0
z
-150
+150
-180
-220
Autocorrelations
Autospectra
Unsteady
flow
measurements
using
LDV 2D
Best results
obtained
with
random acquisition and
slotting
technique

35
X (mm)
U(m
s-1)
0 50 100 150 200 250 3000
10
20
30
40
50
60
70
80
90 Fil chaud -dep. valeurs moyennesFil chaud -dep. valeurs moyennes corrigeesFil chaud -dep. valeurs inst.LDV
Rotation 8068
X (mm)
W(m
s-1)
0 50 100 150 200 250 300-25
-20
-15
-10
-5
0
5
10
15 Fil chaud -dep. valeurs moyennesFil chaud -dep. valeurs moyennes corrigeesFil chaud -dep. valeurs inst.LDV
Unsteady
flow
measurements
using
cross-hotwire
probe
X-wire probe
ObjectivesVelocity measurements in locations with no possible access to LDV or PIV2-point velocity fluctuations measurements in combination with LDV
Z = 0Y = 0
Umean Wmean
Calibration process
assumes that1) velocity
component normal to wires
is
zero
2) velocity
vector
falls
intside
a given
acceptance
angular
sectorConditions difficult to meet in 3D highly turbulent flows !

36
2-Point velocity correlations 2D LDV –
XHW
Objectives :
cross-correlations, cross-spectra and integral length scales of unsteady velocity components U, W in directions x, y, zExamples of intercorrelations
: XHW fixed at
given position, 2D LDV moved in x, y, z directions. Slotting technique in coincidence
0
x
y
-150
+99
2D LDV moved in upstream x direction
-260
XHW U_LDV / U_HW
FLO
W
37
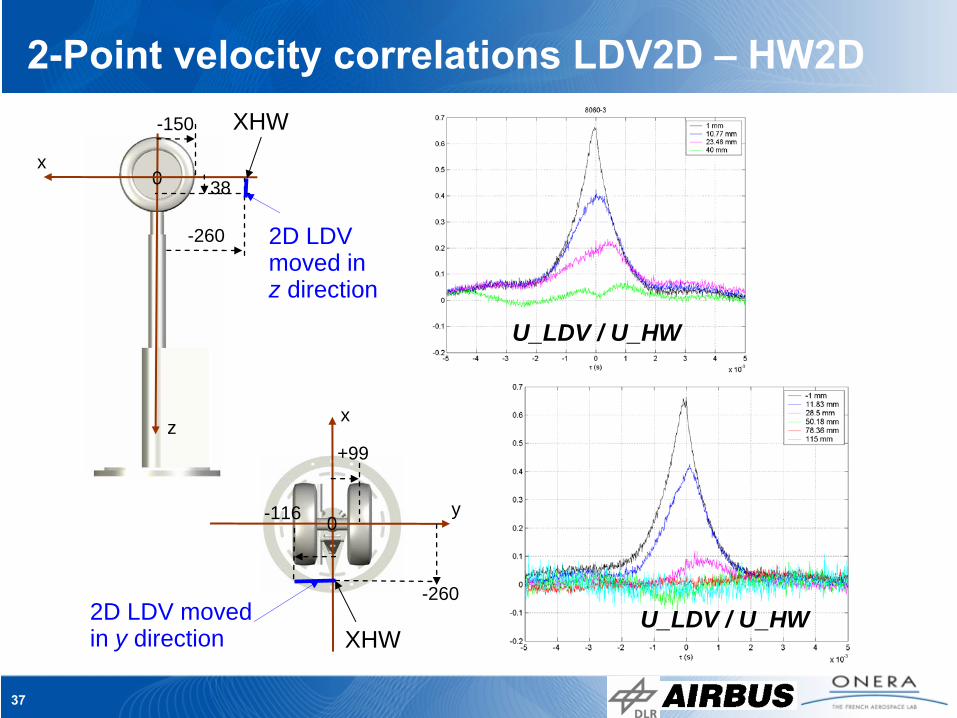
2-Point velocity correlations LDV2D –
HW2D
U_LDV / U_HW
0
x
y-116
+99
XHW
-260
x0
z
-150
-260
XHW
38
2D LDV moved in y direction
2D LDV moved in z direction
U_LDV / U_HW
U_LDV / U_HW

38
Unsteady
wall
pressure measurements1) Some F2 results

39
Unsteady
pressure Kulite
transducers Measurements
in F2 (1/2) : at
the
wheels
periphery
Kulite n°
5
Kulite n°
9
Power Spectral Densities at Mach numbers : 0.10, 0.13, 0.15, 0.18, 0.20, 0.23, 0.25, 0.28

40
Unsteady
pressure Kulite
transducers Measurements
in F2 (/2) : between
the
wheels
Kulite n°
15Kulite n°
23
Axle
Resonant frequencies that could be linked to the dimensions of the inter-wheel “cavity” :
0,198 m
0,110 m
0,16
2 m
,...2,12
0
=
=
kL
ckfk
1000 Hz1500 Hz

41
Unsteady
wall
pressure measurements2) Comparison F2/CEPRA19

42
Unsteady
pressure Kulite
transducers Comparison
F2 / CEPRA 19 (at
the
wheel
periphery)
Kulite
unsteady pressure sensors distribution on the right wheel
Power spectral density Overall sound pressure levels
PSD
Kulite
sensor at -140°
F2 (solid)CEPRA19 (dashed)
Mach numbers 0.10 –
0.28
M = 0.23
M6

43
• Acoustic
measurements• Acoustic
instrumentation
• «
Signal-to-noise
»
ratio in both
facilities• Early
use of
microphone antenna
in both
facilities

44
Two arcs of 12 ¼” microphones in CEPRA19 (flyover/sideline)Flyover antenna with 41 ½” microphones in CEPRA19 onlySideline antenna with 48 ¼” microphones
Mounted in F2 hard-side wall in an anechoiccavity behind a Kevlar membraneAlso mounted in CEPRA 19
Acoustic
instrumentation in CEPRA19 / F2

45
30° 140°
90°
“Signal-to-noise”
ratio in CEPRA19Flyover plane (1/2) : PSD at directivity angle 90°
and M = 0.23
D = 2 mD = 6 m
D = 2 mD = 6 m
Background noise
Power Spectral Density at M = 0.23LAGOON modelNo model (background noise)
LAGOON model aerodynamic noise
corrected to 6 mMicrophone (1/2 inch)
of flyover antenna
D = 2 m
D = 6 m
Microphone (1/4 inch) of flyover arc

46
“Signal-to-noise”
ratio in CEPRA19Flyover plane (1/2) : OASPL directivities
LAGOON model aerodynamic noise OASPL normalized by M6
Mach number 0.10, 0.13, 0.15, 0.18, 0.20, 0.23,
0.25, 0.28
LAGOON model aerodynamic noise OASPL normalized by background noise
30° 140°
90°
3
5
7
9
11
13
30 50 70 90 110 130
S/N-M0.28 S/N-M0.25 S/N-M0.23 S/N-M0.2S/N-M0.18 S/N-M0.15 S/N-M0.13 S/N-M0.1
OASPL (LG noise) -OASPL (BKG noise)
Directivity angle
2 dB
120
122
124
126
128
130
30 50 70 90 110 130M0.28 M0.25 M0.23 M0.2M0.18 M0.15 M0.13 M0.1
OASPL (LG noise) -60 log M
2 dB
Directivity angle
OASPL (LG noise) –
60 log M OASPL (LG noise) –
OASPL (BCKG noise)

47
Comparison of “signal-to-noise”
ratio in both facilitiesCentral microphone of sideline
antenna
Lagoon model in F2F2 background
Lagoon model in CEPRA19 CEPRA19 background
F2 Lagoon model
CEPRA19 Lagoon model
Signal-to-noise ratio (no corrections) :CEPRA19 : 15 to 20 dBF2 : 5 to 10 dB PSD of LAGOON model aerodynamic noise
corrected from :Model / microphone distanceBackground noise

48
Noise maps
using
sideline
acoustic
antenna
in F2 / CEPRA19 Classical beamforming
maps
Noise peaks, independent of velocity, detected by Kulite
sensors in the inner wheel cavity
1030 Hz
1540 Hz
F2 CEPRA19
1030 Hz
1540 Hz
CEPRA19 vs. F2 :
⇒ lower spatial resolution (larger distance from the model)⇒ higher level of cohererence
(lower background noise)

49
Conclusions
LAGOON : a unique experimental effort combiningLG with simplified shape (applicable to large range of modelling methods)Several aerodynamic device (large measurement area / cross checking)Large amount of aerodynamic / acoustic data (formatting under progress)
Aerodynamics : main trends of LG steady/unsteady flowStrong three-dimensionality and turbulence levels consequences on all measurements deviceReasonable identification of mean flows in both facilities slight differences, but considered to have little effects on acousticsWill give more insights in physics of LG aerodynamic noise generation
AcousticsEvaluation of signal-to-noise ratio in both facilitiesAbsolute acoustic levels considered as reliable in CEPRA19
Perspectives : LAGOON will provide an extensive aeroacoustic database for the validation of various unsteady CFD and CAA activities,
to the LAGOON partners (DLR, SoU, ONERA, Airbus)to others via contribution to benchmark activities …

50
Proposal
of
contribution to the
on-going
Benchmark on Airframe
Noise Prediction
organized
by NASA
Airbus recently decided to make the LAGOON database available to the aeroacoustics community, including :
Model shape (CAD)Measurements results (steady/unsteady aerodynamics, acoustics exact nature of data to be defined with Airbus and workshop organizers)
On behalf of Airbus, ONERA will take over the contacts with the organizers and any interested contributor
Unformal agreement by organizers (M. Khorrami, M. Choudhari, D. Lockard)Brings balance between two other (already proposed) LG test cases : (realistic Gulfstream LG and simplified Boeing 4-wheel LG)
Possible agendaSomewhat late for immediate proposal with a view to presentation of results in May 2010 (16th AIAA Aeroacoustics in Stockholm)More likely : present and propose the test-case in May 2010 to allow contributors to show results in 2011 (17th AIAA Aeroacoustics ?)