lall - sophistication of exports (2005).pdf
TRANSCRIPT
7/27/2019 Lall - sophistication of exports (2005).pdf
http://slidepdf.com/reader/full/lall-sophistication-of-exports-2005pdf 1/39
QEH Working Paper Series – QEHWPS 123 Page 1
Working Paper Number 123
The ‘Sophistication’ Of Exports: A New Measure Of Product
Characteristics
Sanjaya Lall*, John Weiss and Jinkang Zhang1
Trade data are often classified by product characteristics in the trade, technology and
development literature to analyze trade patterns, competitive performance and structural change. However, existing classifications are constrained in that trade data are far more
detailed than the industry data on which categories are based (e.g. current classifications
only have 4-5 technology groups). We propose a new classification - ‘sophistication’ - as ameans of analyzing product characteristics in great detail, based on the average income of
exporting economies. Sophistication captures more than technical characteristics; it includes product differentiation, production fragmentation, resource availability and other factors.
However, it has the advantage of providing unique continuous scores for each product at anylevel of detail. We calculate sophistication scores for 237 exports at the 3-digit SITC level and 766 exports at the 4-digit level for 1990 and 2000 (detailed values can be provided on
request). We show sophistication scores for exports by selected countries, technology groups
and industries Our intention is to provide a database for further empirical analysis
7/27/2019 Lall - sophistication of exports (2005).pdf
http://slidepdf.com/reader/full/lall-sophistication-of-exports-2005pdf 2/39
QEH Working Paper Series – QEHWPS 123 Page 2
1. INTRODUCTION
Economists classify products by various characteristics to apply and test theories of trade,
location, industrial structure, foreign investment and so on. In trade theory, for instance, testsof the Heckscher-Ohlin theory involve grouping products by factor content (capital or skillintensity) and relating countries’ trade patterns to their possession of these factors. Location
models in economic geography focus on features like weight, transportability and linkageintensity to assess where products will be produced and if they will be traded. 2 Theories of
trade fragmentation, analyzing ‘vertically specialized’ trade (subdivision of processes for agiven product across countries to exploit differences in wages, logistics and other costs) usesuch characteristics as process divisibility and weight-to-value ratios. 3 Analyses of technical
change, and accompanying applications to industrial structure and performance, distinguish products by technology intensity (research and development spending, use of scientists and
engineers or patenting). FDI theory uses firm-specific assets like technology or brand namesto explain the propensity of industries to engage in direct investment. And so on: empiricaleconomics relies heavily on product classification.
Product characteristics are also useful in development analysis. As development generallyentails structural change (a shift of production towards greater capital, skill and technology
intensity), it is important to analyze and trace changes in the production, trade, industrial andother structures, both within and across countries. With liberalization and globalization, the
pattern and evolution of exports is attracting greater interest in developing countries. Primary
products are steadily losing their shares of world trade, and within manufactures, technology-intensive products are growing faster than others (Lall, 2000). In addition, it is widelyb li d th t t h l i t i t i l t d l t b fit t ti
7/27/2019 Lall - sophistication of exports (2005).pdf
http://slidepdf.com/reader/full/lall-sophistication-of-exports-2005pdf 3/39
QEH Working Paper Series – QEHWPS 123 Page 3
exporting countries. We calculate sophistication scores for 1990 and 2000 for 237 products at
the 3-digit level (of SITC Revision 2), and for 766 products at the 4-digit level. We showexport sophistication patterns for the main developing regions and leading developing and
industrialized countries, and analyze export sophistication in a few selected industries.
Section 2 discusses problems with existing taxonomies, focusing on those dealing with
technology intensity. Section 3 describes the export sophistication technique. Section 4 presents sophistication scores for 181 manufactured exports and relates them to thetechnological features of exports (as given by other classifications). Section 5 shows export
sophistication by region and country. Section 6 deals with sophistication at the four-digitlevel and applies the measure to four selected industries. Section 7 concludes.
2. CLASSIFYING TRADED PRODUCTS: SOME PROBLEMS
Most product taxonomies are based on data on respective ‘parent’ industries: for instance, a
product is deemed technology-intensive if the industry under which it is classified has greater technological inputs or outputs than the average for industry. Factor content, in other words,is assessed by the average intensity of factor use by the parent industry. As the most
commonly used classifications today relate to technology, we use this as the main examplefor our discussion.
Industry criteria to classify technology-intensity consist of ‘input’ or ‘output’ measures of innovation in the relevant product (used singly or in combination). On the ‘input’ side, thenormal measures are research and development (R&D) as a share of sales and the
l t h f i ti t d i i t t l R&D l t O th
7/27/2019 Lall - sophistication of exports (2005).pdf
http://slidepdf.com/reader/full/lall-sophistication-of-exports-2005pdf 4/39
QEH Working Paper Series – QEHWPS 123 Page 4
2002). The OECD Science, Technology and Industry Scoreboard provides cross-country
R&D data for 19 industries.
Matching these to trade data to obtain technology classifications involves considerable
aggregation, lumping together products from the same industrial category but with verydifferent technological features. Thus, telecommunications equipment is a ‘high technology’
activity, but has products that are mature, do not involve intense R&D, or have simple production processes. Similarly, a ‘low technology’ industry like textiles has innovative products, while a ‘medium technology’ industry like machinery comprises the broad range of
both innovative and non-innovative products. Moreover, the technological characteristics of activities can change rapidly over time, as innovations transform the product and process
technologies of particular segments. Most aggregations are based on somewhat outdatedinformation, and so may conceal important technological differences. 9
These problems may be reduced by using qualitative information or expert judgment to
classify products at finer levels of detail and to update classifications. However, muchdepends on the ability of researchers to obtain comprehensive and reliable information. It
would be expensive to obtain expert opinion on innovation-intensity spanning a broad rangeof technical disciplines, and experts may differ in their assessment of innovativeness.Building a consensus and updating expert opinions would be an even more daunting task.
Thus, while qualitative judgment can play a useful role – in the end, technologicaltaxonomies remain an art rather than a science – they do not lead to rigorous and practical
solutions.
Th i th bl i i i d t b d t i t l t d f
7/27/2019 Lall - sophistication of exports (2005).pdf
http://slidepdf.com/reader/full/lall-sophistication-of-exports-2005pdf 5/39
QEH Working Paper Series – QEHWPS 123 Page 5
paper attempts to overcome the problem by a different route: Kaplinsky and Santos Paulino
(2004) measure product innovativeness by unit price changes over time, hypothesizing thatinnovative products have rising prices while non-innovative ones have declining prices. 11
They calculate unit price changes for over 12 thousand products imported by the EU from1988/9 to 2000/1 and use their results to assess existing technology classifications. 12 They
also promise a detailed technology classification of their own in the near future. There are,however, two important deficiencies in this measure, which the authors note: it assumes awaycost-reducing process innovation (or assumes it to be the same across activities) and it does
not take into account the impact of different degrees of fragmentation between products (or,
again, assumes it to be similar).
This technique gives interesting and plausible results and the promised technologyclassification should be very useful. However, its validity depends on the assumption thatunit price changes reflect innovation rather than other factors like demand changes, non-
technological barriers to entry, process innovation, fragmentation of the value chain, or policy-based trade distortions (or that the influence of these other factors is equal across
activities). It is not clear that this assumption is always justified; where it is not, measuringtechnology levels by unit price changes may capture the impact of several factors apart frominnovation.
3. EXPORT ‘SOPHISTICATION’: RATIONALE ANDMETHODOLOGY
We propose a way of classifying traded products which, as with Kaplinsky and Santos
P li d t i i d t d t It i f d t h t i ti f th
7/27/2019 Lall - sophistication of exports (2005).pdf
http://slidepdf.com/reader/full/lall-sophistication-of-exports-2005pdf 6/39
QEH Working Paper Series – QEHWPS 123 Page 6
and technology institutions). Thus, high sophistication will tend to reflect technological
complexity, in turn capturing technical effort, skills, supply chains and innovationsystems.13
• Marketing : Advanced design and packaging, strong product branding, customization of products to demands of customers, control over distribution channels. Highly
differentiated products will tend to be exported by rich countries, though increasingly if production is not technology- intensive it will tend to be relocated in lower wage areas
while design and marketing remain in rich ones.
• Logistics and proximity: Transport costs significantly affect the location of export
production for products with high weight-to-value ratios or rapid delivery requirements.Since rich countries are the main markets for most exports, the location of production canreflect proximity advantages.
• Fragmentability: In activities where production processes are divisible (and logisticssuitable) the location of export production can reflect the technical possibilities of
separating segments and placing them in low wage countries. Thus, high sophisticationscores can reflect the low fragmentability of particular products and low sophistication ahigh degree of fragmentability.
• Information and familiarity: The location of sourcing of products by major markets mayreflect information on the production capabilities of particular countries, familiarity with
their business systems and procedures, language, legal systems and so on.
7/27/2019 Lall - sophistication of exports (2005).pdf
http://slidepdf.com/reader/full/lall-sophistication-of-exports-2005pdf 7/39
QEH Working Paper Series – QEHWPS 123 Page 7
has held back exports by developing countries, trade blocs like NAFTA have affected the
location of export activity in Latin America; preferences to banana and sugar exporters by theEU have supported inefficient producers in former colonies, and so on.
The sophistication index is thus an amalgam of these influences and not a specifictechnological measure. Technology is clearly a major factor in the index, but its role cannot
be separated from that of other factors (at least without product-level data on each factor).While this is a drawback as a technological taxonomy, it is often possible to dis cernqualitatively how technology interacts with other determinants of export location. It is
therefore possible to draw interesting insights from the index.
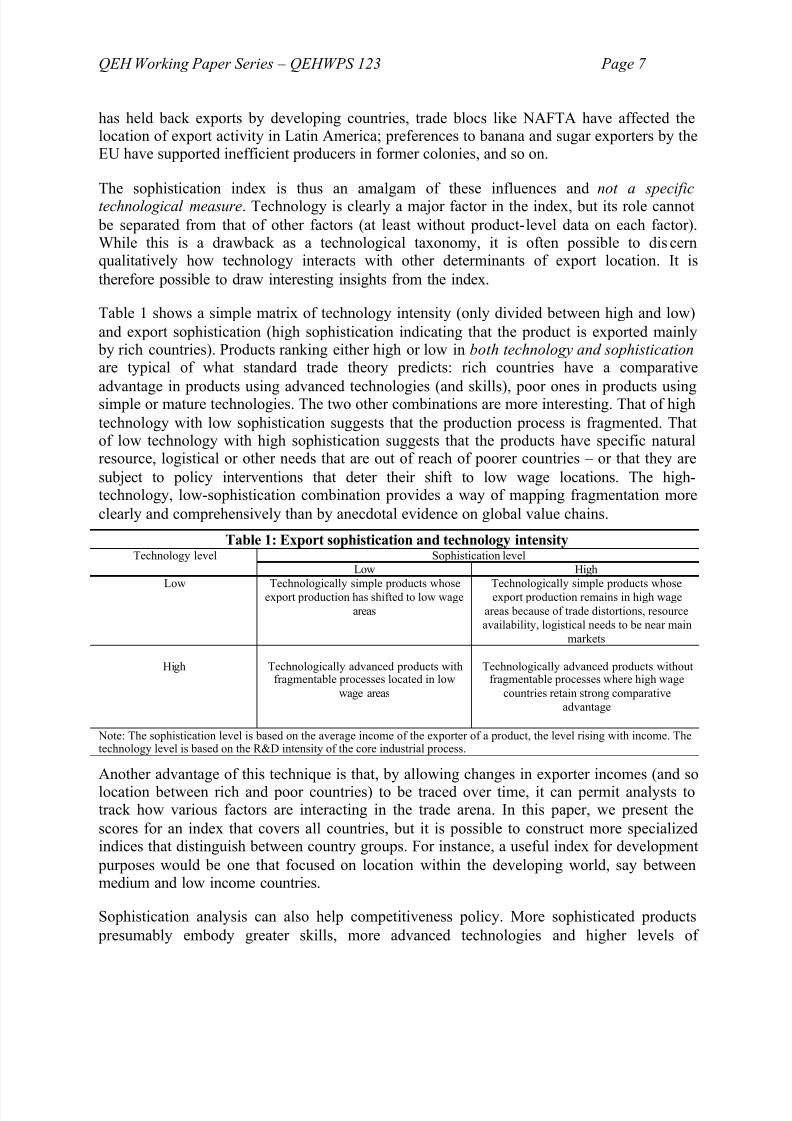
Table 1 shows a simple matrix of technology intensity (only divided between high and low)
and export sophistication (high sophistication indicating that the product is exported mainly by rich countries). Products ranking either high or low in both technology and sophistication are typical of what standard trade theory predicts: rich countries have a comparative
advantage in products using advanced technologies (and skills), poor ones in products usingsimple or mature technologies. The two other combinations are more interesting. That of high
technology with low sophistication suggests that the production process is fragmented. Thatof low technology with high sophistication suggests that the products have specific naturalresource, logistical or other needs that are out of reach of poorer countries – or that they are
subject to policy interventions that deter their shift to low wage locations. The high-technology, low-sophistication combination provides a way of mapping fragmentation more
clearly and comprehensively than by anecdotal evidence on global value chains.
Table 1: Export sophistication and technology intensity
S hi ti ti l lT h l l l
7/27/2019 Lall - sophistication of exports (2005).pdf
http://slidepdf.com/reader/full/lall-sophistication-of-exports-2005pdf 8/39
QEH Working Paper Series – QEHWPS 123 Page 8
processing in the value chain than less sophisticated ones. 16 It is thus desirable for countries to
move up the sophistication ladder as they grow and the mapping of sophistication at detailedlevels within industries may point to desirable patterns of upgrading. To the extent that such
upgrading does not happen automatically with rising wages because of skill, technology,marketing or other deficiencies, there may be useful pointers to the need for policy support.
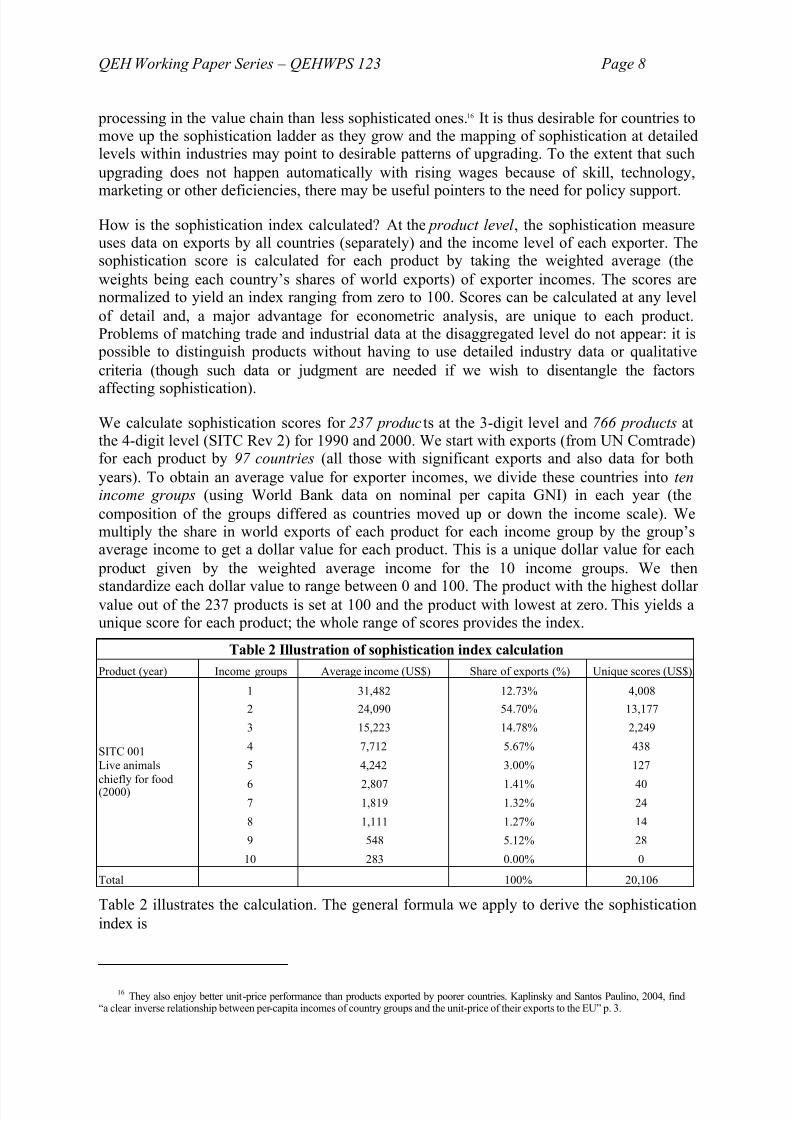
How is the sophistication index calculated? At the product level , the sophistication measureuses data on exports by all countries (separately) and the income level of each exporter. Thesophistication score is calculated for each product by taking the weighted average (the
weights being each country’s shares of world exports) of exporter incomes. The scores arenormalized to yield an index ranging from zero to 100. Scores can be calculated at any level
of detail and, a major advantage for econometric analysis, are unique to each product.Problems of matching trade and industrial data at the disaggregated level do not appear: it is
possible to distinguish products without having to use detailed industry data or qualitative
criteria (though such data or judgment are needed if we wish to disentangle the factorsaffecting sophistication).
We calculate sophistication scores for 237 products at the 3-digit level and 766 products atthe 4-digit level (SITC Rev 2) for 1990 and 2000. We start with exports (from UN Comtrade)for each product by 97 countries (all those with significant exports and also data for both
years). To obtain an average value for exporter incomes, we divide these countries into tenincome groups (using World Bank data on nominal per capita GNI) in each year (the
composition of the groups differed as countries moved up or down the income scale). Wemultiply the share in world exports of each product for each income group by the group’s
i d ll l f h d Thi i i d ll l f h
7/27/2019 Lall - sophistication of exports (2005).pdf
http://slidepdf.com/reader/full/lall-sophistication-of-exports-2005pdf 9/39
QEH Working Paper Series – QEHWPS 123 Page 9
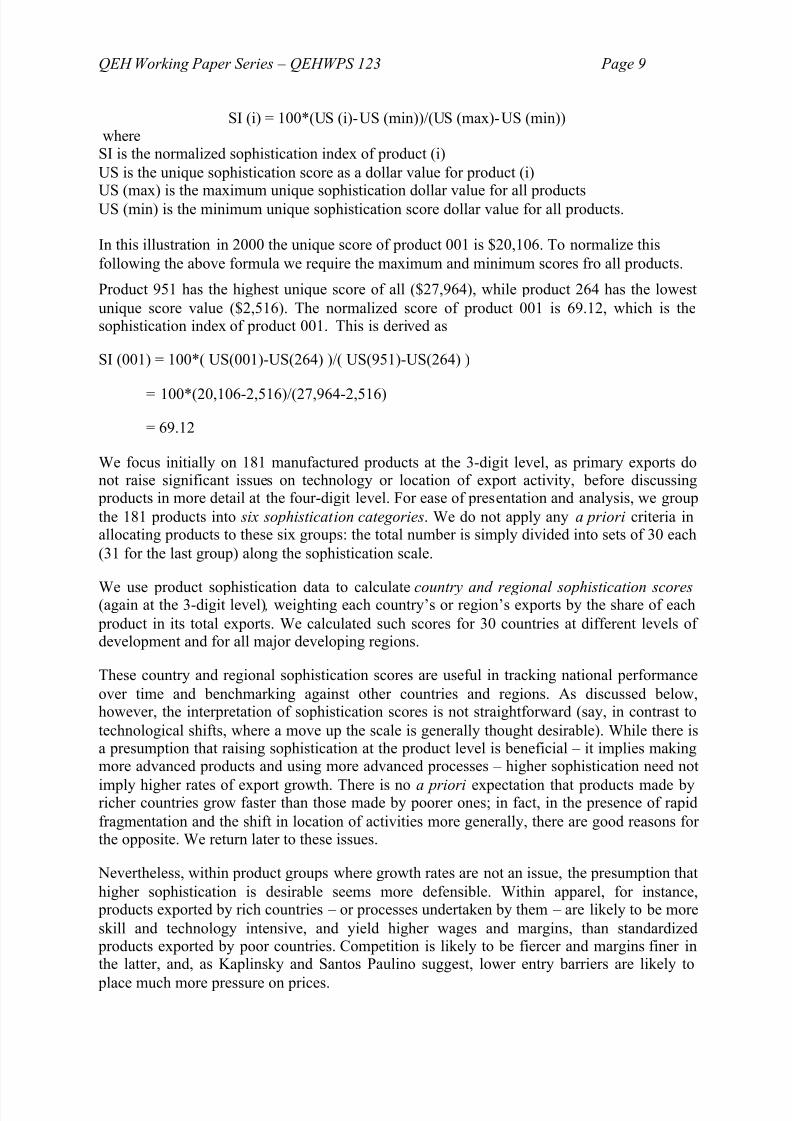
SI (i) = 100*(US (i)-US (min))/(US (max)-US (min))
whereSI is the normalized sophistication index of product (i)
US is the unique sophistication score as a dollar value for product (i)US (max) is the maximum unique sophistication dollar value for all products
US (min) is the minimum unique sophistication score dollar value for all products.
In this illustration in 2000 the unique score of product 001 is $20,106. To normalize this
following the above formula we require the maximum and minimum scores fro all products.
Product 951 has the highest unique score of all ($27,964), while product 264 has the lowest
unique score value ($2,516). The normalized score of product 001 is 69.12, which is thesophistication index of product 001. This is derived as
SI (001) = 100*( US(001)-US(264) )/( US(951)-US(264) )
= 100*(20,106-2,516)/(27,964-2,516)
= 69.12
We focus initially on 181 manufactured products at the 3-digit level, as primary exports donot raise significant issues on technology or location of export activity, before discussing
products in more detail at the four-digit level. For ease of presentation and analysis, we group
the 181 products into six sophistication categories. We do not apply any a priori criteria inallocating products to these six groups: the total number is simply divided into sets of 30 each
(31 f h l ) l h hi i i l
7/27/2019 Lall - sophistication of exports (2005).pdf
http://slidepdf.com/reader/full/lall-sophistication-of-exports-2005pdf 10/39
QEH Working Paper Series – QEHWPS 123 Page 10
4. PRODUCT SOPHISTICATION SCORES
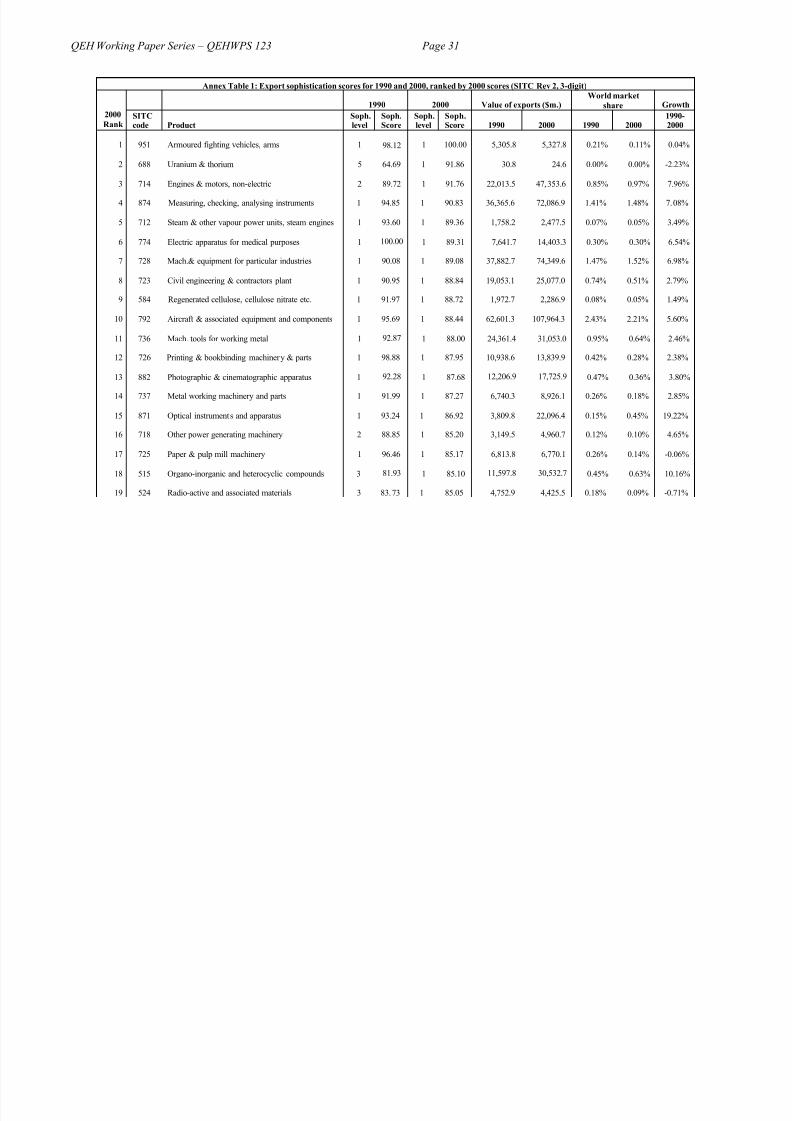
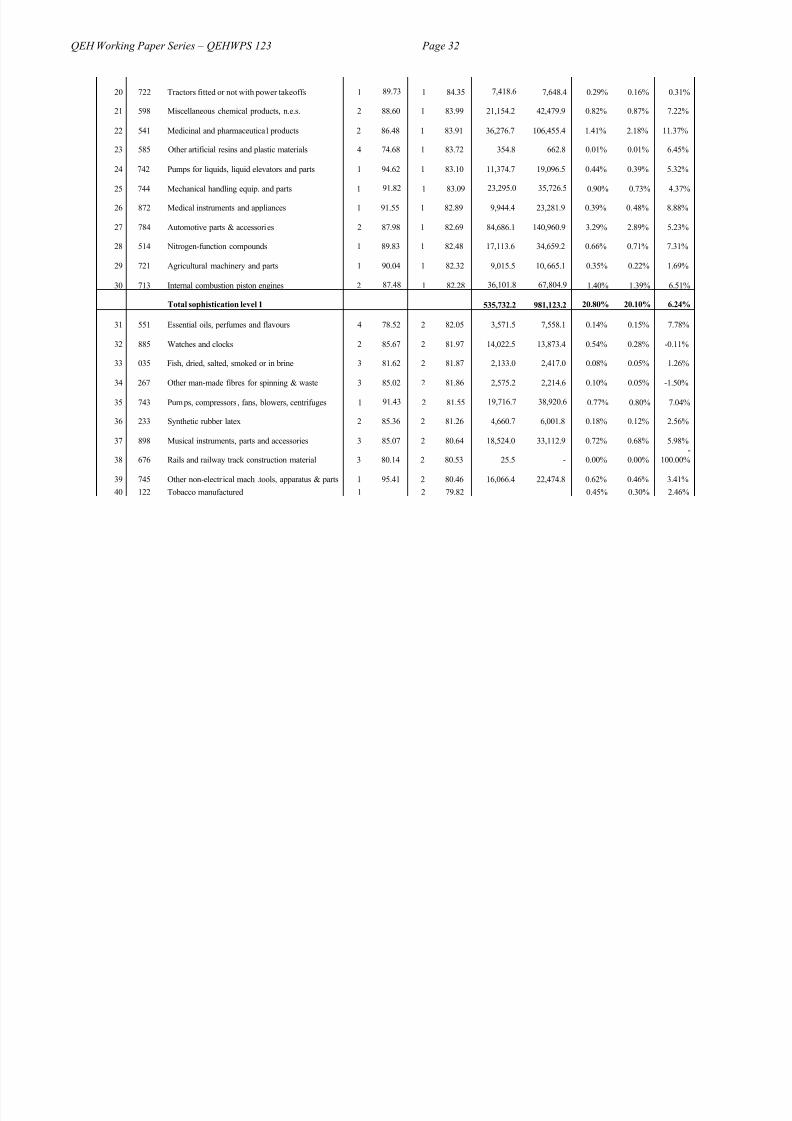
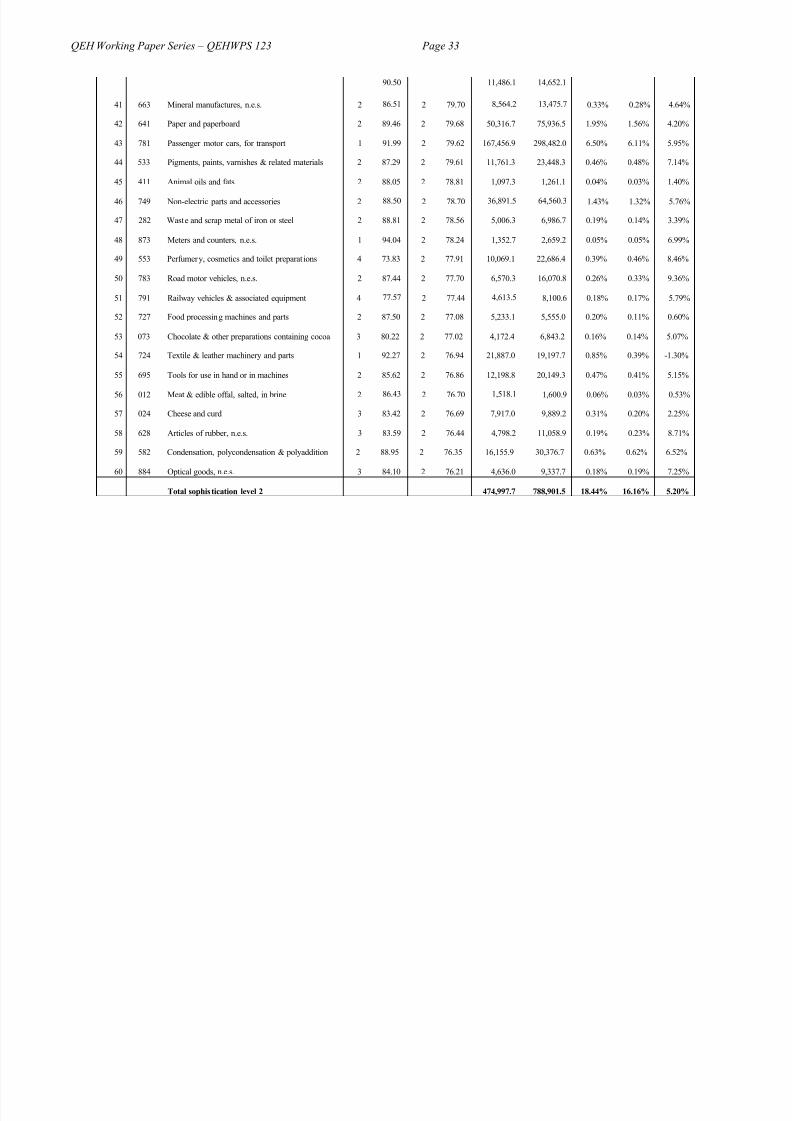
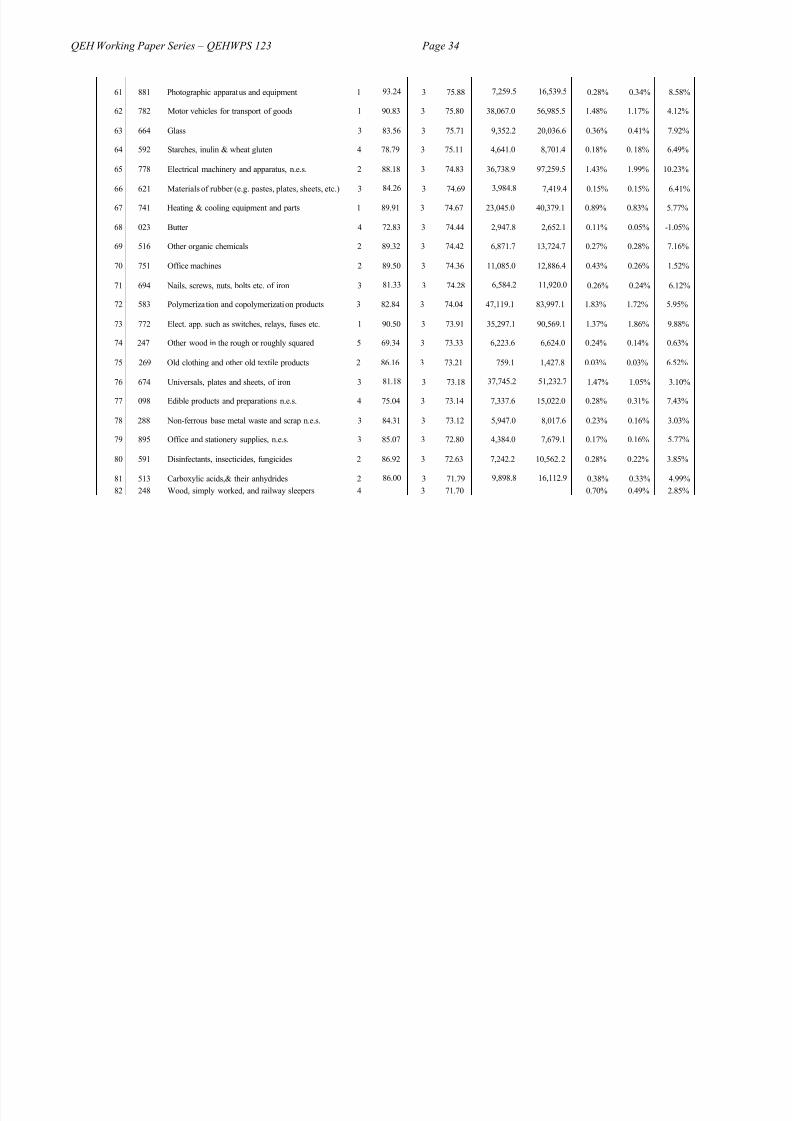
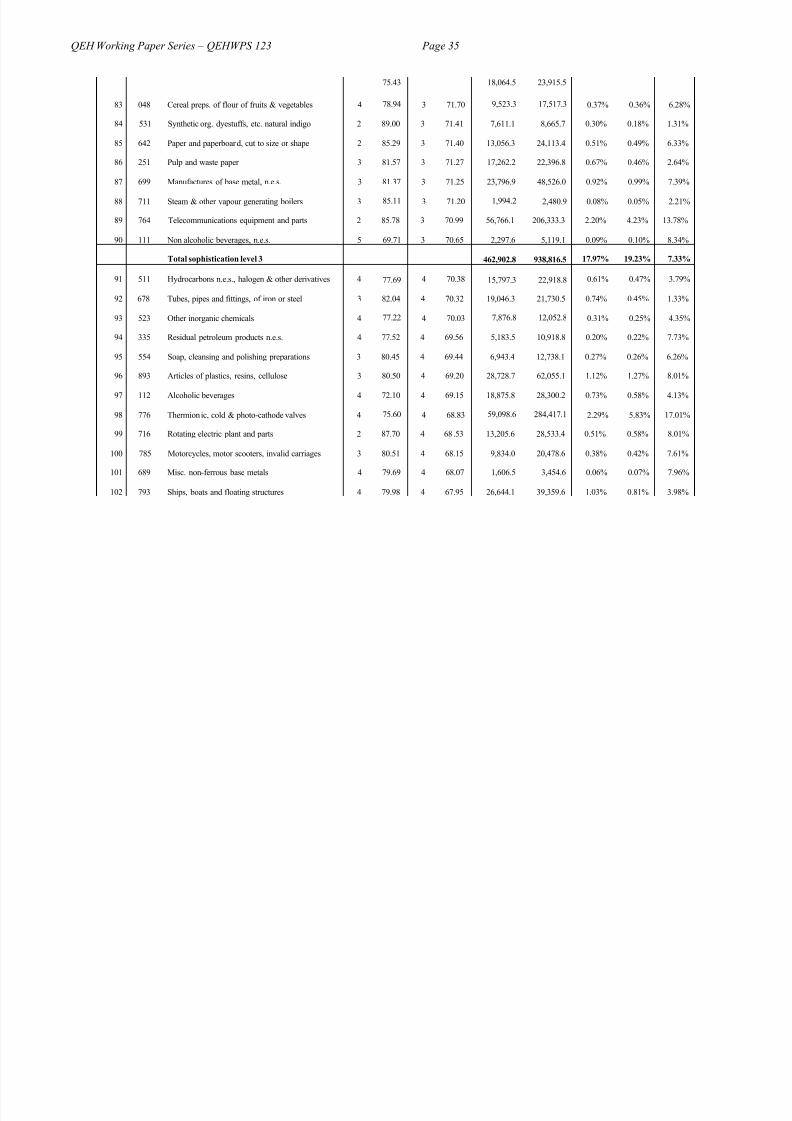
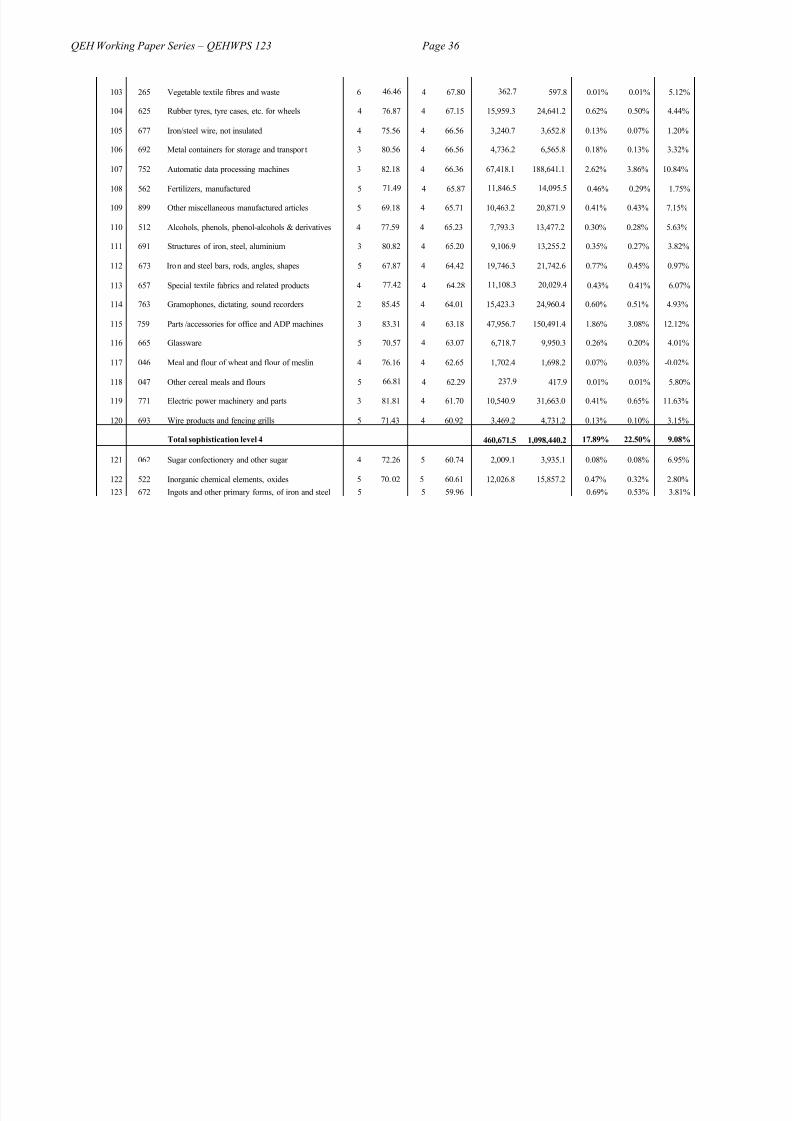
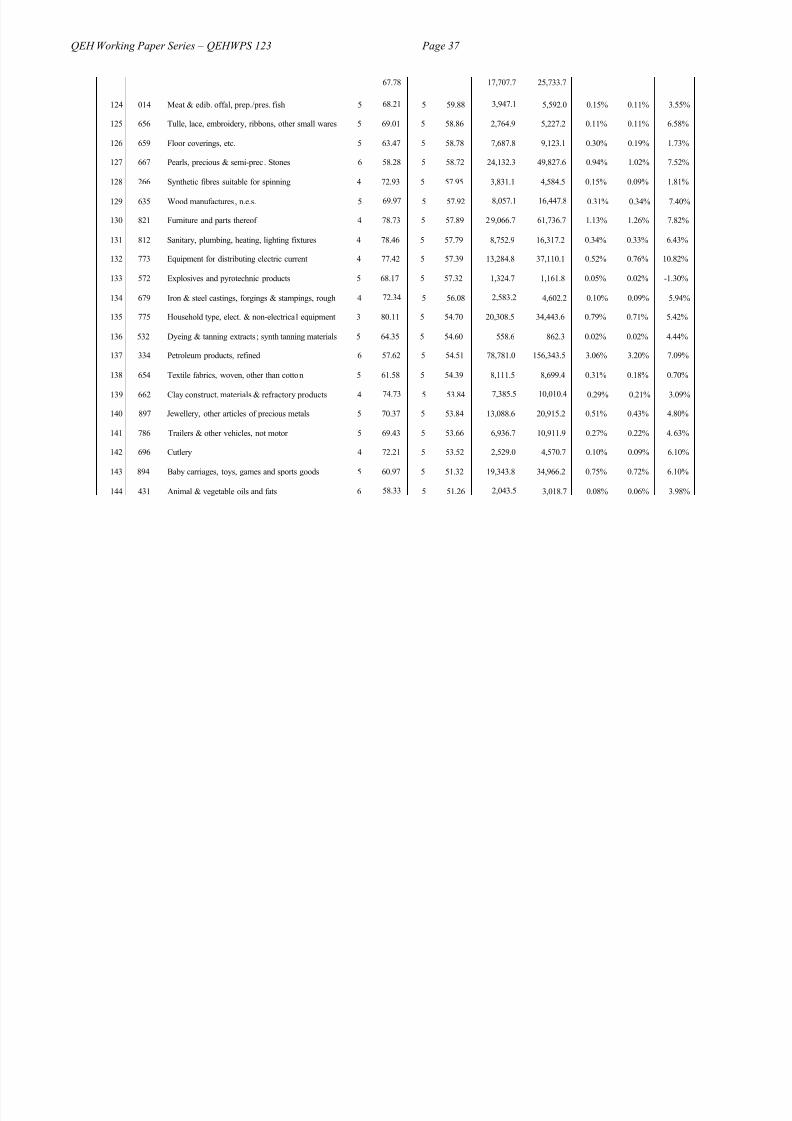
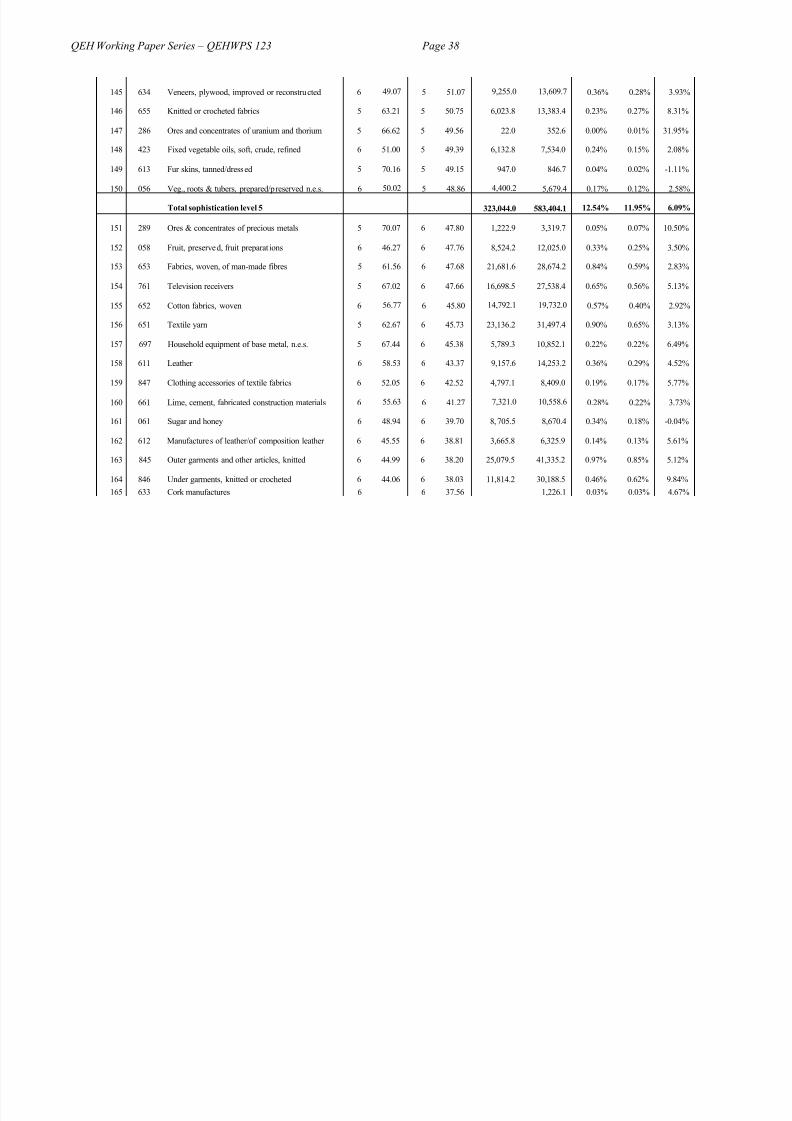
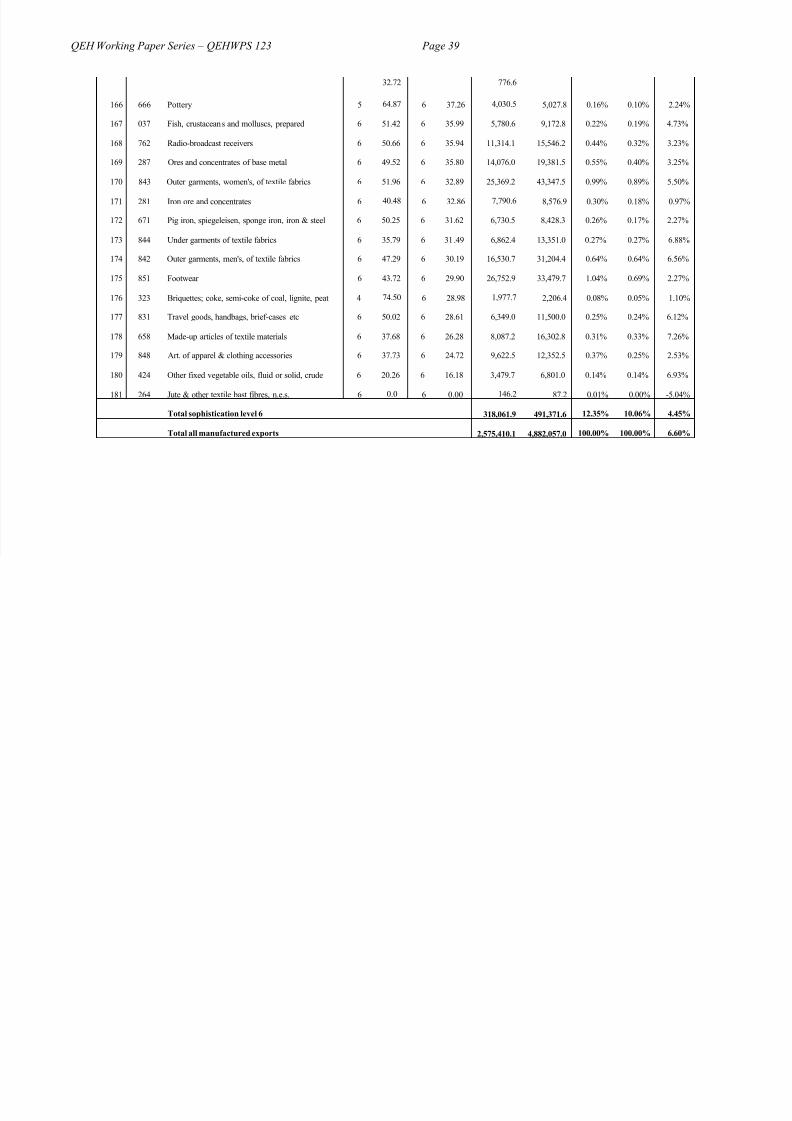
Annex Table 1 shows the sophistication scores for 181 manufactured exports at the 3-digit
level in 1990 and 2000, ranked by the 2000 score. It also shows export values, world marketshares and growth rates. Scores at the 4-digit level would take too much space to show here
but are available from the authors on request (some findings are discussed in Section 6). 17
There is a general decline in sophistication scores over time as developing countries raisetheir share of world exports (for manufactures as whole, their share goes from 13% in 1980 to
16.6% in 1990 and 26.8% in 2000 (UNIDO, 2004)). 18 Only 18 products show a rise insophistication. This decline does not have any technological connotations: it does not mean,for example, that production processes are becoming less technology or skill-intensive or that
technical progress is slowing. In fact, it is likely that with technical change, most processesare becoming more complex and have higher entry levels for competitive production. The
decline in sophistication simply reflects the growth of industrial capabilities in latecomer (lower income) countries that allows them capture market shares in gradually more complexactivities, as well as the fragmentation of simpler processes in very advanced activities.
While export production is shifting to lower income sites, not all developing countries, particularly the lowest wage economies, are gaining. On the contrary, export success is
accompanied by increasing concentration in the developing world: the share of the top 15exporters in total manufactured exports by developing countries, for instance, has risen from91% in 1990 to 94% in 2001. 19 Most dynamic exporters are middle-income countries (China
is the only low income country in the dynamic group) and most are in East Asia (Mexico is
h id f h f i f NAFTA) M l i i i i l

7/27/2019 Lall - sophistication of exports (2005).pdf
http://slidepdf.com/reader/full/lall-sophistication-of-exports-2005pdf 11/39
QEH Working Paper Series – QEHWPS 123 Page 11
However, many products do not conform to a priori expectations, and we may speculate
about their location determinants. For instance, manufactured tobacco is in group 1 in 1990(though it declines to group 2 by 2000): a product with mature and stable technology, and
with most raw materials coming from poor countries, it is exported mainly by rich countries presumably because of its continuous and capital- intensive processes, the importance of
marketing (cigarette branding) and perhaps trade barriers. ‘Essential oils, perfumes andflavours’ also appear fairly high (in group 2 in 2000, having moved up from group 4) andincrease their sophistication, not because of technological innovation but the significance of
marketing and perhaps specialized skills. Chocolates, though based on raw materials from
poor countries, are in group 1 (and rising in sophistication) probably for similar marketingand skill needs. Some resource-based products like paper, salted fish, animal fats or cheesehave high sophistication because their raw materials are located in rich countries, or becausethese countries are exceptionally efficient at producing them (cereals). Some, like milk or
butter, reflect distortions caused by government subsidies to and protection of the agriculturalsector.
Among low technology products, the ‘fashion cluster’ segment (textiles, clothing andfootwear) starts low in the index but spans a wide range. The most sophisticated product isspecial textile fabrics (at rank 113), presumably industrial fabrics with advanced
technological needs, followed by lace and embroidery (at 125), requiring a long accumulationof special skills. Standard textile and apparel exports like woven cotton fabrics,
undergarments or non-knitted outerwear figure in the bottom 30 in the ranks. Some mediumtechnology engineering products like radio receivers are very low in the sophistication ranks
because their technologies are mature and standardized, allowing production to be located
h l i l i l i
7/27/2019 Lall - sophistication of exports (2005).pdf
http://slidepdf.com/reader/full/lall-sophistication-of-exports-2005pdf 12/39
QEH Working Paper Series – QEHWPS 123 Page 12
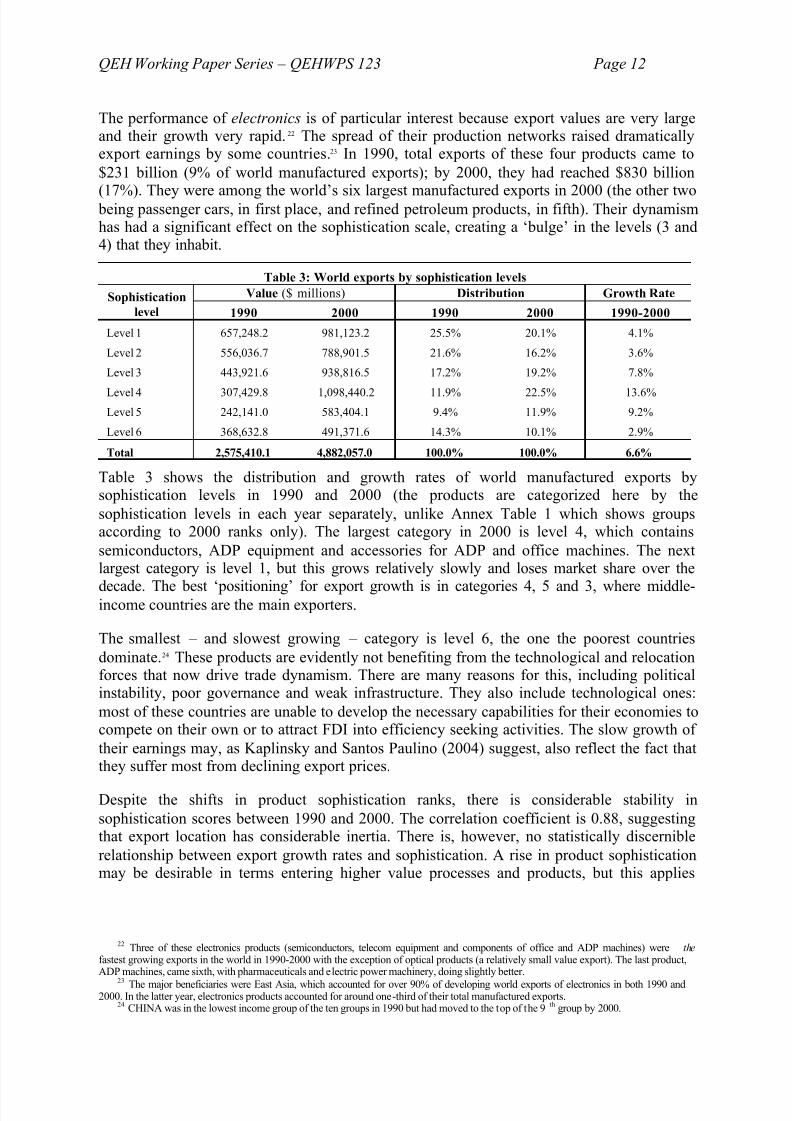
The performance of electronics is of particular interest because export values are very large
and their growth very rapid.22
The spread of their production networks raised dramaticallyexport earnings by some countries. 23 In 1990, total exports of these four products came to
$231 billion (9% of world manufactured exports); by 2000, they had reached $830 billion(17%). They were among the world’s six largest manufactured exports in 2000 (the other two
being passenger cars, in first place, and refined petroleum products, in fifth). Their dynamismhas had a significant effect on the sophistication scale, creating a ‘bulge’ in the levels (3 and4) that they inhabit.
Table 3: World exports by sophistication levelsValue ($ millions) Distribution Growth RateSophistication
level 1990 2000 1990 2000 1990-2000
Level 1 657,248.2 981,123.2 25.5% 20.1% 4.1%
Level 2 556,036.7 788,901.5 21.6% 16.2% 3.6%
Level 3 443,921.6 938,816.5 17.2% 19.2% 7.8%
Level 4 307,429.8 1,098,440.2 11.9% 22.5% 13.6%
Level 5 242,141.0 583,404.1 9.4% 11.9% 9.2%Level 6 368,632.8 491,371.6 14.3% 10.1% 2.9%
Total 2,575,410.1 4,882,057.0 100.0% 100.0% 6.6%
Table 3 shows the distribution and growth rates of world manufactured exports bysophistication levels in 1990 and 2000 (the products are categorized here by the
sophistication levels in each year separately, unlike Annex Table 1 which shows groupsaccording to 2000 ranks only). The largest category in 2000 is level 4, which contains
i d i d i f d ffi hi h
7/27/2019 Lall - sophistication of exports (2005).pdf
http://slidepdf.com/reader/full/lall-sophistication-of-exports-2005pdf 13/39
QEH Working Paper Series – QEHWPS 123 Page 13
within given activities or products. When considered across products, there is no effect of a
rise in sophistication on export growth.
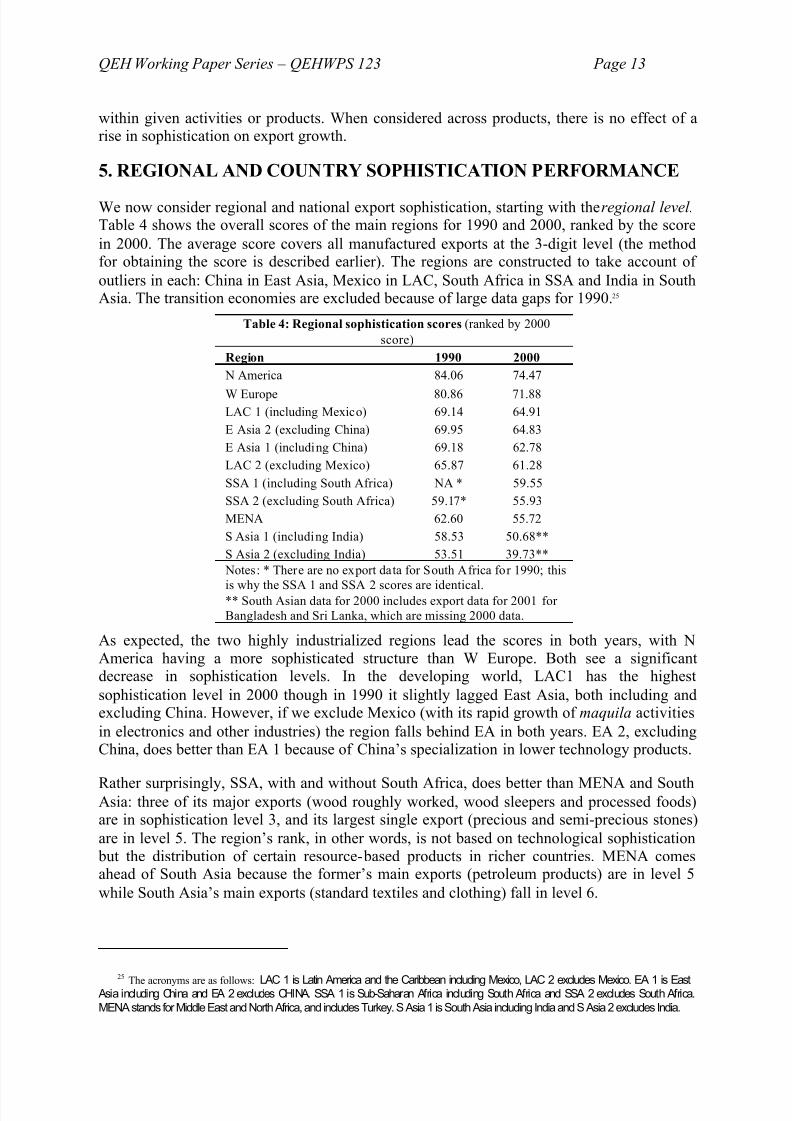
5. REGIONAL AND COUNTRY SOPHISTICATION PERFORMANCE
We now consider regional and national export sophistication, starting with the regional level. Table 4 shows the overall scores of the main regions for 1990 and 2000, ranked by the score
in 2000. The average score covers all manufactured exports at the 3-digit level (the methodfor obtaining the score is described earlier). The regions are constructed to take account of
outliers in each: China in East Asia, Mexico in LAC, South Africa in SSA and India in SouthAsia. The transition economies are excluded because of large data gaps for 1990. 25
Table 4: Regional sophistication scores (ranked by 2000
score)
Region 1990 2000
N America 84.06 74.47
W Europe 80.86 71.88
LAC 1 (including Mexico) 69.14 64.91E Asia 2 (excluding China) 69.95 64.83
E Asia 1 (including China) 69.18 62.78
LAC 2 (excluding Mexico) 65.87 61.28
SSA 1 (including South Africa) NA * 59.55
SSA 2 (excluding South Africa) 59.17* 55.93
MENA 62.60 55.72
S Asia 1 (including India) 58.53 50.68**

7/27/2019 Lall - sophistication of exports (2005).pdf
http://slidepdf.com/reader/full/lall-sophistication-of-exports-2005pdf 14/39
QEH Working Paper Series – QEHWPS 123 Page 14
All developing regions see a decline in sophistication levels, with the most marked decline in
South Asia 2: Pakistan, Bangladesh and Sri Lanka are even more dependent on textile andclothing exports than India. While Bangladesh and Sri Lanka have done relatively well in
terms of export earnings from these products, the sophistication group as a whole is growingslowly. Moreover, the impending abolition of the Multi-Fibre Arrangement (which drove
buyers to source in these countries) may affect adversely their export growth prospects.
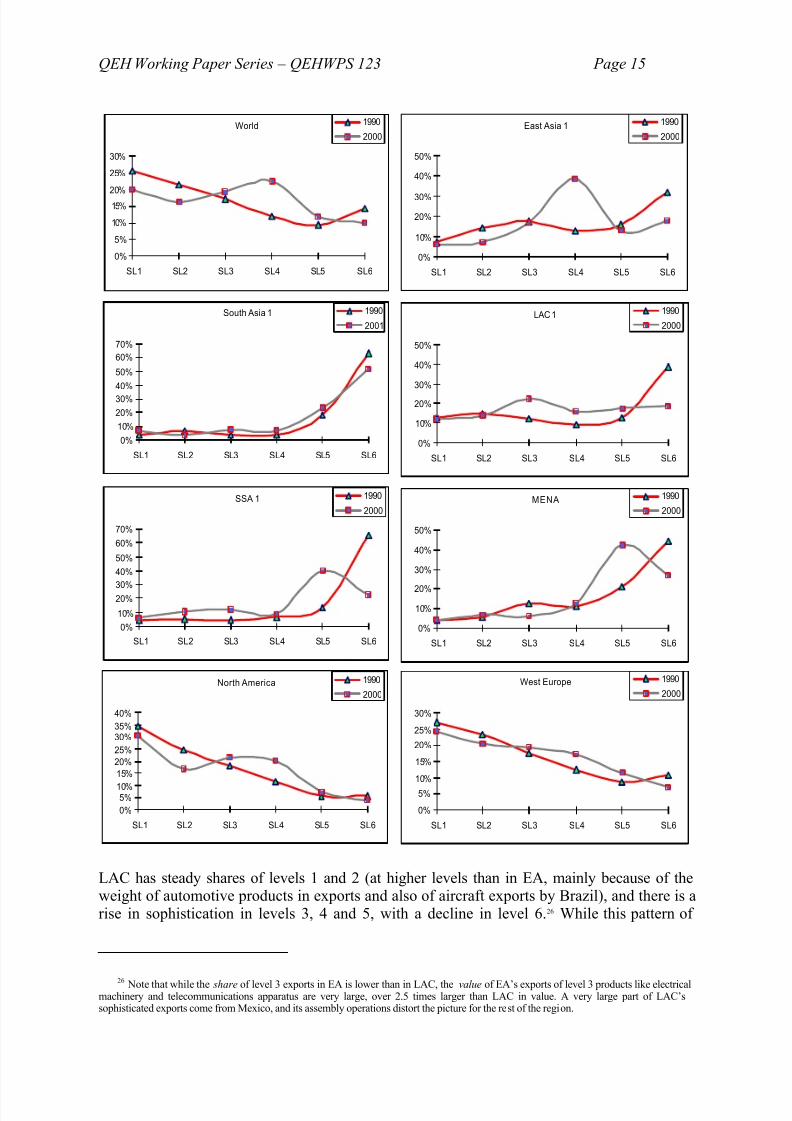
Figure 1: Evolution of regional exports by sophistication levels
7/27/2019 Lall - sophistication of exports (2005).pdf
http://slidepdf.com/reader/full/lall-sophistication-of-exports-2005pdf 15/39
QEH Working Paper Series – QEHWPS 123 Page 15
World
0%
5%
10%
15%
20%
25%
30%
SL1 SL2 SL3 SL4 SL5 SL6
1990
2000
South Asia 1
0%
10%
20%
30%
40%
50%
60%
70%
SL1 SL2 SL3 SL4 SL5 SL6
1990
2001
East Asia 1
0%
10%
20%
30%
40%
50%
SL1 SL2 SL3 SL4 SL5 SL6
1990
2000
MENA
40%
50%
1990
2000
SSA 1
60%
70%
1990
2000
LAC 1
0%
10%
20%
30%
40%
50%
SL1 SL2 SL3 SL4 SL5 SL6
1990
2000
7/27/2019 Lall - sophistication of exports (2005).pdf
http://slidepdf.com/reader/full/lall-sophistication-of-exports-2005pdf 16/39
QEH Working Paper Series – QEHWPS 123 Page 16
export evolution seems very desirable, it goes hand in hand with relatively low rates of
growth and, more important, with little progress in level 4 that contains the main dynamo of recent export growth. We should also reiterate that the picture for LAC is strongly influenced
by Mexican performance. 27
South Asia’s very low sophistication and the stagnation in its export structure over time are
evident in the figure. SSA and MENA have similar bulges in level 5 exports because of therise in processed petroleum and gem exports, while the rest of its export structure remainsstagnant.
Table 5 shows world market shares (WMS) of manufactured exports for the main regions bysophistication levels. East Asia (including China) has a significant global presence in all
sophistication categories, with around one-third world market share in levels 4 and 6 and one-fifth in level 5. South Asia has a very low presence in levels 1 to 4, with slightly higher shares in 5 and particularly 6. LAC’s market presence is spread relatively evenly, with a
focus on levels 6, 5 and 3. MENA has a slightly larger overall market presence than SouthAsia, with its main focus on level 5. SSA is the smallest player, but its pattern is rather
similar to that of MENA.
Table 5: World market shares of manufactured exports by sophistication
levels, 1990-2000
SL1 SL2 SL3 SL4 SL5 SL6 Total
1990
E Asia 1 3.4% 7.9% 12.0% 13.1% 20.6% 26.6% 12.0%
S Asia 1 0.1% 0.3% 0.2% 0.3% 1.6% 3.6% 0.8%

7/27/2019 Lall - sophistication of exports (2005).pdf
http://slidepdf.com/reader/full/lall-sophistication-of-exports-2005pdf 17/39
QEH Working Paper Series – QEHWPS 123 Page 17
At the bottom of the list are South Asian countries with their overwhelming reliance on
clothing exports.Table 6: Country export sophistication (ranked by
2000 scores)
Score 1990 2000
1 USA 84.44 74.83
2 Japan 85.14 74.62
3 Germany 83.87 74.57
4 Ireland 79.89 73.88
5 UK 81.82 73.59
6 Finland 82.84 72.97
7 Singapore 74.59 68.11
8 Mexico 80.38 67.42
9 Taiwan 73.37 67.05
10 Korea 69.21 66.52
11 Argentina 66.90 64.64
12 Brazil 67.69 64.22
13 Philippines 60.53 64.08
14 Malaysia 68.08 63.43
15 South Africa 68.46 62.59
16 Costa Rica 69.26 62.51
17 Thailand 65.12 61.88
18 Saudi Arabia 65.79 59.70
19 Chile 65.16 57.16
7/27/2019 Lall - sophistication of exports (2005).pdf
http://slidepdf.com/reader/full/lall-sophistication-of-exports-2005pdf 18/39
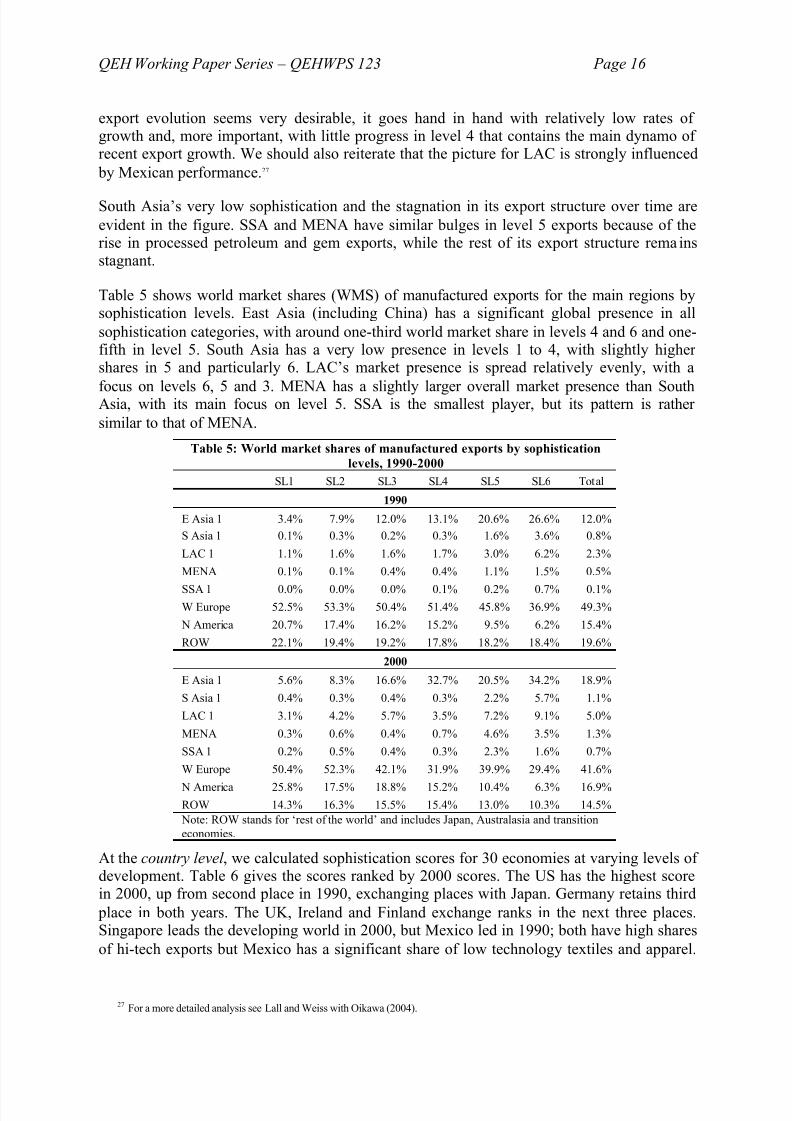
QEH Working Paper Series – QEHWPS 123 Page 18
simple labour-intensive manufactures (and its exports have been declining, see below),
clearly out of line with its income levels. Lall (1996) argues that this is largely the result of itsfailure to upgrade industrial technologies as its wages rose, in turn due to a laissez faire
industrial policy. However, it has been able to sustain high incomes because of the growth of services aimed at China.
Figure 2: Difference between actual and predicted sophistication scores
China
Indonesia
S Arabia
India
Egypt
Chile
USA
Turkey
Singapore
Japan
Syria
Morocco
Pakistan
Sri Lanka
H Kong
Bangladesh
1990 2000
7/27/2019 Lall - sophistication of exports (2005).pdf
http://slidepdf.com/reader/full/lall-sophistication-of-exports-2005pdf 19/39
QEH Working Paper Series – QEHWPS 123 Page 19
way, because at its relatively high income level a heavy specialization in electronics pulls
down its sophistication level.
In the industrialized world, Finland switches from lower to higher than predicted export
sophistication because of its strong performance in telecom equipment (in sophistication level3). The USA and Japan have lower than predicted sophistication in both years due to the
large share in their exports of fragmenting products like electronics. The UK and Germany,with stronger specialization in less fragmented products pharmaceuticals, machinery andautomotives, have more sophisticated exports than predicted by their incomes.
Table 7: World market shares for manufactured exports by sophistication
level
1990 2000 1990 2000 1990 2000 1990 2000
China Korea Taiwan Singapore
Level 1 0.41% 1.30% 0.71% 1.04% 0.87% 1.08% 0.78% 1.23%
Level 2 1.52% 1.36% 1.28% 2.71% 1.71% 1.52% 1.45% 1.22%
Level 3 0.83% 3.88% 2.20% 3.15% 3.79% 3.15% 2.92% 1.99%
Level 4 0.98% 4.68% 3.78% 6.10% 2.54% 6.01% 1.97% 6.57%
Level 5 4.15% 7.18% 4.91% 3.52% 5.33% 2.36% 1.27% 2.65%
Level 6 5.47% 15.49% 4.70% 3.62% 3.03% 2.66% 3.70% 0.95%
Total 1.87% 4.70% 2.42% 3.41% 2.48% 2.97% 1.90% 2.72%
Hong Kong Malaysia Thailand Indonesia
Level 1 0.26% 0.16% 0.23% 0.33% 0.08% 0.23% 0.03% 0.12%
Level 2 1.03% 0.16% 0.45% 0.36% 0.31% 0.45% 0.08% 0.47%
Level 3 1.08% 0.28% 0.40% 1.72% 0.64% 1.35% 0.10% 0.66%
7/27/2019 Lall - sophistication of exports (2005).pdf
http://slidepdf.com/reader/full/lall-sophistication-of-exports-2005pdf 20/39
QEH Working Paper Series – QEHWPS 123 Page 20
o Korea makes the largest improvement of the mature Tigers in highly sophisticated
products (levels 1 and 2), Taiwan the least. Hong Kong loses ground in all segments.
o China has a sophistication profile matching its low income: in 2000, its highest WMS is
in level 6 and its WMS declines steadily at progressively higher levels of sophistication.However, its largest percentage gains are in levels 3 and 4, driven not just by electronics
products but also a vast range of other engineering products that denote high industrialcapabilities.
o
Malaysia and the Philippines show a profile similar to the three mature Tigers in terms of a bulge in level 4, but both retain relatively large level 6 exports. Both show significantrises in level 3 because of telecom exports (the dramatic percentage rises in Philippines’
level 1 exports are due to booming auto components, but should be discounted because of the small initial base).
o Indonesia, the most resource-rich economy in East Asia and also the poorest (its GNI per
capita is lower than in China by 2000 in dollar terms), is concentrated in sophistication
levels 5 and 6. It has large increases in levels 1 to 3, but the small base exaggerates itsreal gains.
o Mexico has the largest percentage increases in WMS over the decade, turning from atypical Latin American economy with modest export growth into a Tiger in the Asian
mould with rapid export growth (Lall, Weiss and Oikawa, 2004). However, Mexico hasinteresting differences from the typical East Asian Tiger. Its WMS structure is evenly
spread over all sophistication levels in both years and sees large rises in all levels. Unlike
7/27/2019 Lall - sophistication of exports (2005).pdf
http://slidepdf.com/reader/full/lall-sophistication-of-exports-2005pdf 21/39
QEH Working Paper Series – QEHWPS 123 Page 21
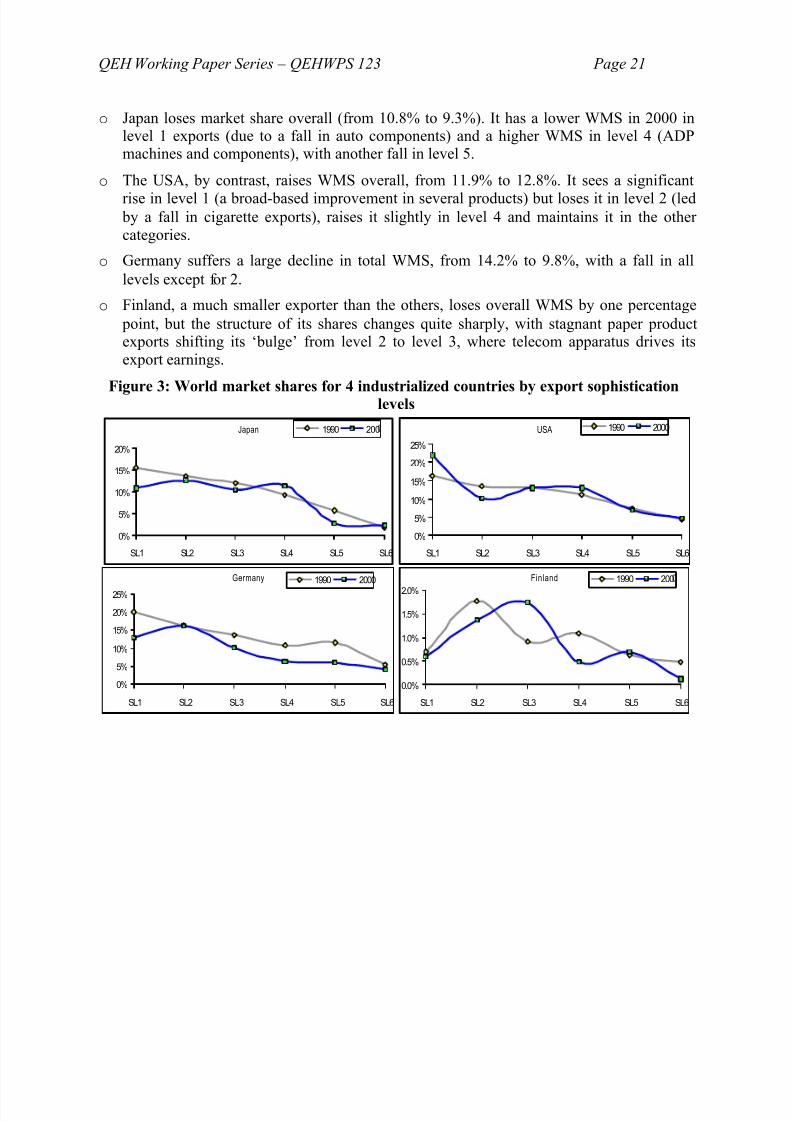
o Japan loses market share overall (from 10.8% to 9.3%). It has a lower WMS in 2000 inlevel 1 exports (due to a fall in auto components) and a higher WMS in level 4 (ADPmachines and components), with another fall in level 5.
o The USA, by contrast, raises WMS overall, from 11.9% to 12.8%. It sees a significantrise in level 1 (a broad-based improvement in several products) but loses it in level 2 (led
by a fall in cigarette exports), raises it slightly in level 4 and maintains it in the other categories.
o Germany suffers a large decline in total WMS, from 14.2% to 9.8%, with a fall in all
levels except for 2.o Finland, a much smaller exporter than the others, loses overall WMS by one percentage
point, but the structure of its shares changes quite sharply, with stagnant paper productexports shifting its ‘bulge’ from level 2 to level 3, where telecom apparatus drives itsexport earnings.
Figure 3: World market shares for 4 industrialized countries by export sophisticationlevels
Japan
0%
5%
10%
15%
20%
SL1 SL2 SL3 SL4 SL5 SL6
1990 200 USA
0%
5%
10%
15%
20%
25%
SL1 SL2 SL3 SL4 SL5 SL6
1990 2000
7/27/2019 Lall - sophistication of exports (2005).pdf
http://slidepdf.com/reader/full/lall-sophistication-of-exports-2005pdf 22/39
QEH Working Paper Series – QEHWPS 123 Page 22
6. SOPHISTICATION AT THE FOUR-DIGIT LEVEL
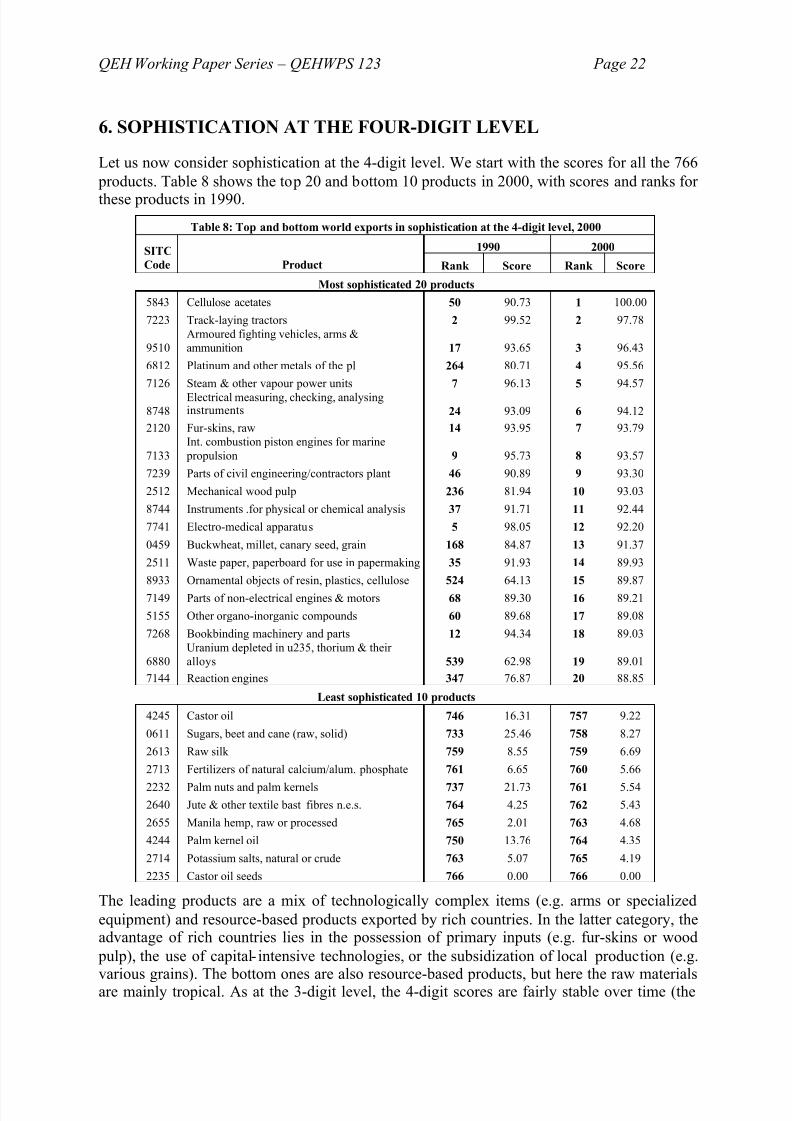
Let us now consider sophistication at the 4-digit level. We start with the scores for all the 766
products. Table 8 shows the top 20 and bottom 10 products in 2000, with scores and ranks for these products in 1990.
Table 8: Top and bottom world exports in sophistication at the 4-digit level, 2000
1990 2000SITC
Code Product Rank Score Rank Score
Most sophisticated 20 products
5843 Cellulose acetates 50 90.73 1 100.00
7223 Track-laying tractors 2 99.52 2 97.78
9510Armoured fighting vehicles, arms &ammunition 17 93.65 3 96.43
6812 Platinum and other metals of the pl 264 80.71 4 95.56
7126 Steam & other vapour power units 7 96.13 5 94.57
8748Electrical measuring, checking, analysinginstruments 24 93.09 6 94.12
2120 Fur-skins, raw 14 93.95 7 93.79
7133
Int. combustion piston engines for marine
propulsion 9 95.73 8 93.57
7239 Parts of civil engineering/contractors plant 46 90.89 9 93.30
2512 Mechanical wood pulp 236 81.94 10 93.03
8744 Instruments .for physical or chemical analysis 37 91.71 11 92.44
7741 Electro-medical apparatus 5 98.05 12 92.20
0459 Buckwheat, millet, canary seed, grain 168 84.87 13 91.37
7/27/2019 Lall - sophistication of exports (2005).pdf
http://slidepdf.com/reader/full/lall-sophistication-of-exports-2005pdf 23/39
QEH Working Paper Series – QEHWPS 123 Page 23
correlation coefficient of the 1990 and 2000 scores is 0.88), but some products change rankssignificantly. The most sophisticated product in 2000, cellulose acetates, moves up from 50th
place in 1990, while the most sophisticated product in 1990, ‘ships, boats, other vessels for
breaking up’, falls to 567th place in 2000.
6.1 SOPHISTI CATION BY TECHNOLOGY CATEGORY
The sophistication index can be used, not only to compare products in general but also toassess how products at fine levels of disaggregation perform within technological categories
or industries. The methodology is similar in both cases. The values for each product in eachtechnological or industry category are calculated as before. However, we now standardize thevalues relative to the technology or industry norm. Hence within each category the product
with the highest dollar value is normalized at 100 and the least at zero. Sophistication scoresare now calculated separately for each category (or industry) at the four-digit level. They arenot comparable across categories (or industries) but they are comparable across countries
and regions. This set of scores does not match the scores for all the products together, thoughthe order of activities according to sophistication within each category (or industry) is of
course identical to that in the general score.
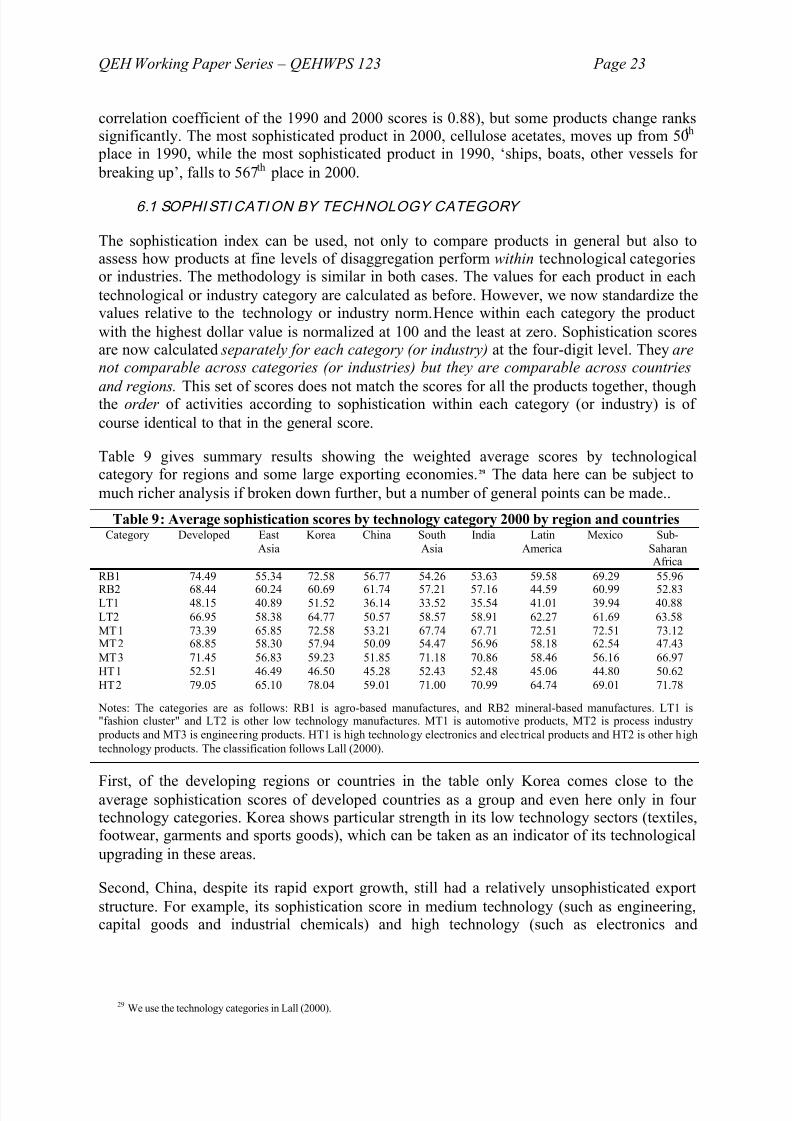
Table 9 gives summary results showing the weighted average scores by technologicalcategory for regions and some large exporting economies. 29 The data here can be subject to
much richer analysis if broken down further, but a number of general points can be made..
Table 9: Average sophistication scores by technology category 2000 by region and countriesCategory Developed East
AsiaKorea China South
AsiaIndia Latin
AmericaMexico Sub-
Saharan
7/27/2019 Lall - sophistication of exports (2005).pdf
http://slidepdf.com/reader/full/lall-sophistication-of-exports-2005pdf 24/39
QEH Working Paper Series – QEHWPS 123 Page 24
electricals) is lower than that of India (but see point four below). It is also below LatinAmerica in low technology and some medium and high technology goods.
Third, some resource-based manufactured exports are, not surprisingly, location specific due
to the availability of natural resources. This may explain the relatively low sophisticationscores for resource-based manufactures from Latin America: exporters may be specializing in
goods using resources not widely available in developed economies.
Fourth, these scores take no account of export volume in each category. Hence there is the
apparently anomalous result that Sub Saharan Africa and South Asia have relatively highscores in high technology goods, despite their relatively small exports. The explanation lies partly in the much narrower range of products exported by smaller players, and perhaps
partly in that global networks have by-passed them, leading to little specialization in labour-intensive segments. Hence the small volumes of exports tend to be similar to goods fromdeveloped economies. China, on the other hand, has lower scores in these categories precisely
because of its success in goods not exported by developed economies.
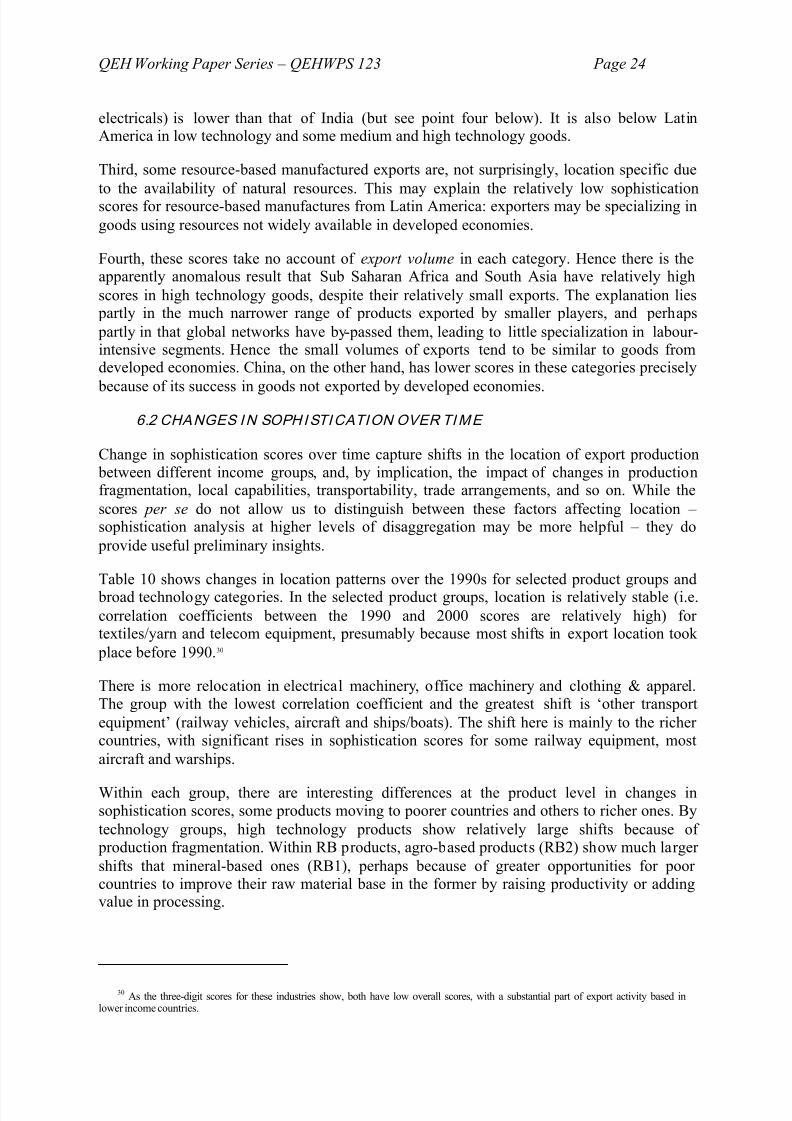
6.2 CHANGES IN SOPHISTICATION OVER TIME
Change in sophistication scores over time capture shifts in the location of export production between different income groups, and, by implication, the impact of changes in productionfragmentation, local capabilities, transportability, trade arrangements, and so on. While the
scores per se do not allow us to distinguish between these factors affecting location – sophistication analysis at higher levels of disaggregation may be more helpful – they do
provide useful preliminary insights.
7/27/2019 Lall - sophistication of exports (2005).pdf
http://slidepdf.com/reader/full/lall-sophistication-of-exports-2005pdf 25/39
QEH Working Paper Series – QEHWPS 123 Page 25
Table 10: Stability of sophistication scores by selected product and technology category (4-digit level)
Product group (SITC 2 digit group) Number of 4 digit
products
Correlation coefficients, 1990 & 2000
Iron and steel (67) 22 0.86
Textiles and yarn (65) 45 0.91
General industrial machinery (74) 25 0.66
Office machinery (75)* 11 0.55
Telecommunications (76) 12 0.91
Electrical machinery (77) 25 0.60
Other transport equipment (79)** 16 0.18
Clothing and apparel (84) 26 0.59
Technology category Number of 4 digit
products
Correlation coefficients, 1990 & 2000
RB1 104 0.92
RB2 89 0.76
LT1 77 0.88
LT2 78 0.80
MT1 16 0.93
MT2 84 0.85
MT3 104 0.81
HT1 38 0.70
HT2 28 0.68
* SITC 75 includes office machines and automatic data processing equipment
** Other transport equipment comprises railway vehicles, aircraft and ships & boats
7/27/2019 Lall - sophistication of exports (2005).pdf
http://slidepdf.com/reader/full/lall-sophistication-of-exports-2005pdf 26/39
QEH Working Paper Series – QEHWPS 123 Page 26
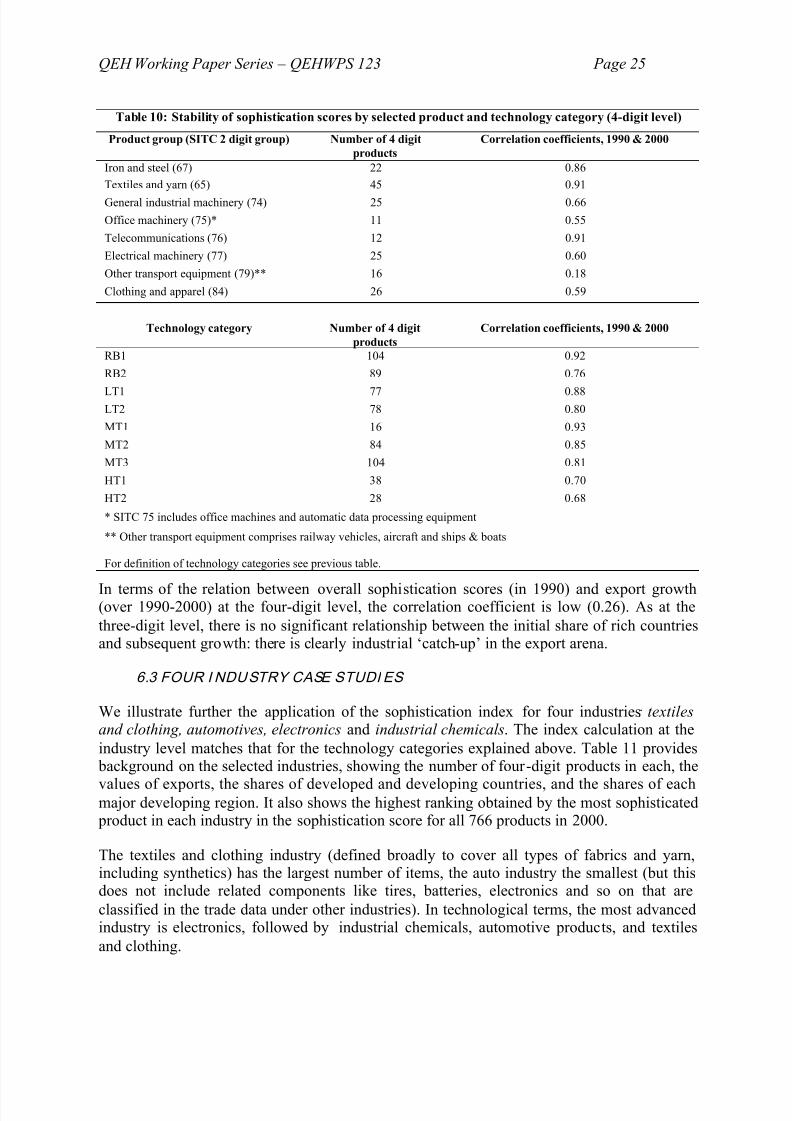
Table 11: Background to industry casesTextiles &
clothing
Automotives Electronics Industrial
chemicals
No. of 4-digit exports 100 10 30 41
Sophistication score of top product+ 133 116 12 17World exports 1990 $219.6 b. $320.6 b. $312.4 b. $109.1 b.World exports 2000 $343.0 b. $570.4 b. $997.2 b. $197.4 b.
Compound growth rate 1990-2000 4.6% 5.9% 12.3% 6.1%Share of developed countries, 2000* 52.2% 89.3% 75.2% 83.8%Share of developing countries, 2000* 42.9% 4.7% 23.4% 11.6%
Regional share of developing world exports (2000)**All developing countries 100% 100% 100% 100%
East Asia 67.7% 34.3% 88.5% 60.9%South Asia 10.8% 1.1% 0.2% 5.9%
LAC 9.1% 58.2% 10.4% 18.0%MENA 10.3% 3.7% 0.4% 0.4%
SSA 1.7% 2.8% 0.1% 0.1% Notes: + Ranking of most sophisticated product in industry group in scores for all 766 four-digit exports, 2000* Shares of developed and developing countries do not sum to 100% because transition economies are excluded here.** Developing regions include the relevant outliers: China in EA, Mexico in LAC, India in S Asia and South Africa in SSA
Within the developing world, East Asia dominates exports in all the industries apart fromautomobiles, in which LAC leads. South Asia is marginal in electronics and autos, but playssome role in the textiles and clothing and to a lesser extent in industrial chemicals. MENA is
close behind South Asia in textiles and clothing (largely because of Turkey) and has someauto exports (Turkey again), but is marginal in the other two industries. SSA is marginal in
all four, but its share is relatively large in autos because of recent South African exports.
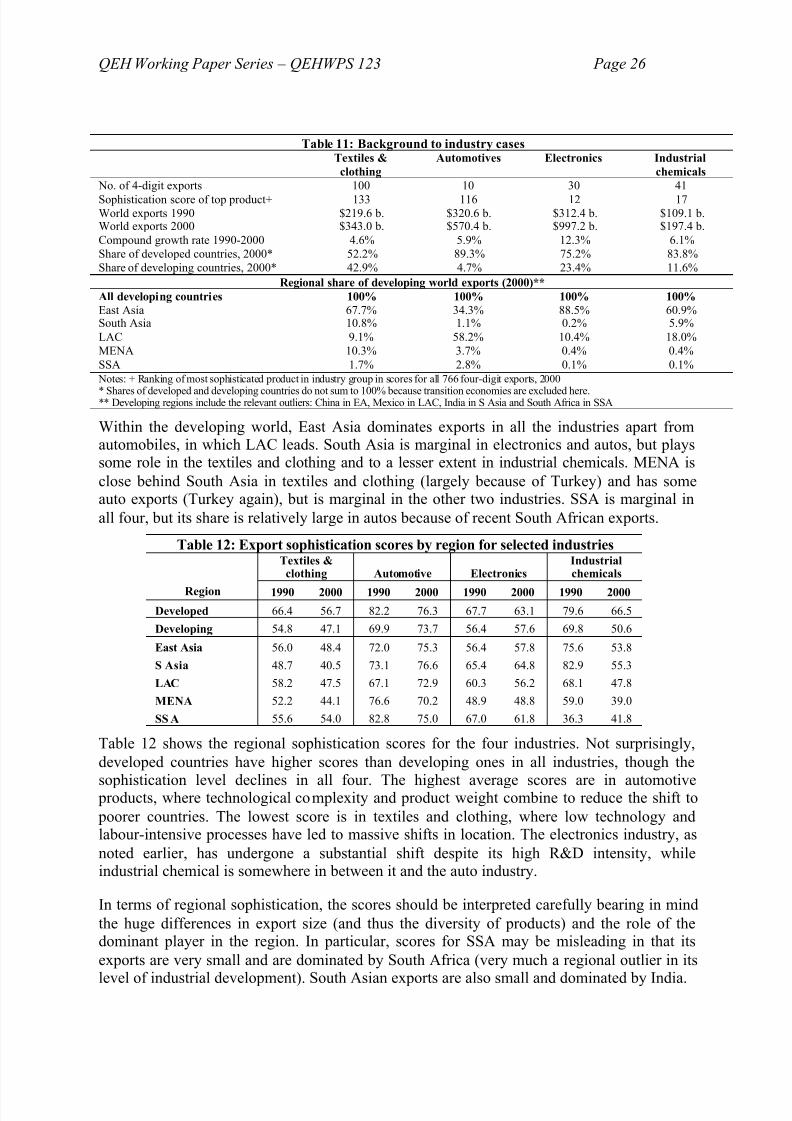
Table 12: Export sophistication scores by region for selected industries
7/27/2019 Lall - sophistication of exports (2005).pdf
http://slidepdf.com/reader/full/lall-sophistication-of-exports-2005pdf 27/39
QEH Working Paper Series – QEHWPS 123 Page 27
East Asia has highest level of sophistication in textile and clothing exports (if SSA isdiscounted), with LAC next and South Asia at the bottom (Annex 1 analyses these exports for some countries Asia). The higher sophistication of EA is likely to reflect the upgrading of
exports in the advanced NIEs like the Republic of Korea and Taiwan, China. The autoindustry shows rather a narrow band of sophistication across the regions, probably reflecting
the narrow range of products and their clustering in the high sophistication levels – there is,in other words, relatively little scope for specialization in different levels of sophistication inthis industry.
The electronics pattern suggests that the three tiny exporters specialize in different segmentsof the industry: South Asia and SSA in high sophistication items and MENA in low
sophistication ones. However, this pattern clearly cannot be taken as representative of national competencies. The two larger exporters, EA and LAC, have very similar sophistication levels, and the relocation of the industry to EA in fact determines the location
pattern in the industry as a whole. If sophistication could be adjusted for local content, it islikely that EA would come out far ahead of LAC, where Mexico, the dominant exporter, has
very low levels of local inputs. By contrast, Asian Tiger economies have made significant
strides in terms of the design, development and production of products at all levels of thevalue chain. The industrial chemicals industry shows a pattern roughly matching levels of
industrial development, with LAC and EA leading, South Asia in the middle, and SSA andMENA lagging.
6.4 SOPHISTICATION RELATION TO INCOME LEVEL
Another way to use sophistication index data by industry is to consider how the standing of
7/27/2019 Lall - sophistication of exports (2005).pdf
http://slidepdf.com/reader/full/lall-sophistication-of-exports-2005pdf 28/39
QEH Working Paper Series – QEHWPS 123 Page 28
For chemicals we find some evidence of downgrading in Korea with a score in 2000 5% below that predicted. India, on the other hand, has a higher than predicted score in both years,although the strength of its positive outlier status has diminished over time.
Such comparisons are only suggestive and it is difficult to draw strong inferences withoutmore specific information on technologies, production capacities and location factors. The
sophistication index cannot, as it stands, cast light on these factors; in combination with moredata, however, it can be a useful tool to analyse competitive performance. We should alsoremember that further disaggregation may be necessary to understand complexity of products
and processes in terms that would clarify if countries are moving up or down the value chain.
7. CONCLUSIONS
‘Sophistication’ provides a new way of analyzing trade and location patterns and trackingcompetitiveness. Its great advantage is that it can be calculated quickly at any level of detail
and for any period of time. In this it has an edge over existing taxonomies that classify products according to parent industry characteristics and cannot provide unique scores for
products at disaggregated levels. Its main disadvantage is that it is not a specific technologymeasure: it captures many other factors affecting export location, and care is needed ininterpreting the results.
In general, however, our initial results are plausible. Let us reiterate some main ones.Sophistication correlates quite well with technology (for non-resource based manufactures)except when its impact is diluted by fragmentation, which allows technology-intensive
activities to locate exports in countries that received theory would not predict. However, all
7/27/2019 Lall - sophistication of exports (2005).pdf
http://slidepdf.com/reader/full/lall-sophistication-of-exports-2005pdf 29/39
QEH Working Paper Series – QEHWPS 123 Page 29
having high per capita incomes is not a guarantee of a sophisticated export structure.Countries may become rich without building advanced industrial skills and capabilities;doing this requires specific strategies. This is clearly illustrated by the contrast between the
low sophistication export structure of Hong Kong China, one of the richest countries in EastAsia, and the more advanced export structures of other mature Tigers in the region.
The ‘de-sophistication’ process is highly skewed, a shift from high to middle incomecountries rather than to the poorest ones. There is a bulge in the middle of the sophisticationscale where the most dynamic exports concentrate. Regional sophistication scores in the
developing world conform broadly to expectations, with Latin America and East Asia at thetop and South Asia and Africa near the bottom.
While this paper is only a first cut at using the sophistication index, it suggests that thetechnique can be useful in several ways. First, the scores carry much information of practicaland analytical value, if interpreted carefully. Second, the scores are product-specific and can
be as detailed as needed. This allows qualitative and econometric analysis in a way thatnormal taxonomies do not. 31 Third, in conjunction with technology and value chain
information, sophistication data can be used to analyze fragmentation and location inertia.Fourth, sophistication can be used for country competitiveness analysis, allowing a rapidmapping of location shifts in exports of interest to a country. Within product segments it
could locate the country in terms of the skill and technology level of its exports. More broadly, it can show if a country’s sophistication structure is in line with its income level. It
could also provide strategic insights on export performance, prospects and strategy. 32
Sophistication is not a complete answer to the taxonomic needs of trade and industrial
7/27/2019 Lall - sophistication of exports (2005).pdf
http://slidepdf.com/reader/full/lall-sophistication-of-exports-2005pdf 30/39
QEH Working Paper Series – QEHWPS 123 Page 30
Gereffi, G., Humphrey, J. and Sturgeon, T. (forthcoming) ‘The governance of global valuechains’, Review of International Political Economy.
Harrigan, J. and A. Venables (2004) “Timeliness, trade and agglo meration”, New York:
NBER , Working Paper no. 10404. http://www.nber.org/papers/w10404.
Hatzichronoglou, T. (1997) ‘Revision of the high-technology sector and product
classification’, Paris: OECD, STI Working Papers, 1997/2.
Hummels, D., Ishii, J. and Yi, K. M. (2001) ‘The nature and growth of vertical specializationin world trade’, Journal of International Economics, 54(1), 75-96.
Kaplinsky, R. and Santos Paulino, A. (2004) ‘Innovation and competitiveness: trends in unit prices in global trade’, draft, Institute of Development Studies, University of Sussex.
Lall, S. (1992) ‘Technological capabilities and industrialization’, World Development , 20(2),165-86.
Lall, S. (1996) Learning from the Asian Tigers, London: Macmillan.
Lall, S. (2000) ‘The technological structure and performance of developing countrymanufactured exports, 1995-1998’, Oxford Development Studies, 28 (3), 337-369.
Lall, S., Albaladejo, M. and Zhang, J. (2004) ‘Mapping fragmentation: electronics andautomobiles in East Asia and Latin America’, Oxford Development Studies, 32 (3), 407-432
7/27/2019 Lall - sophistication of exports (2005).pdf
http://slidepdf.com/reader/full/lall-sophistication-of-exports-2005pdf 31/39
QEH Working Paper Series – QEHWPS 123 Page 31
Annex Table 1: Export sophistication scores for 1990 and 2000, ranked by 2000 scores (SITC Rev 2, 3-digit)
1990 2000 Value of exports ($m.)World market
share Growth
2000
Rank SITCcode Product
Soph.level
Soph.Score
Soph.level
Soph.Score 1990 2000 1990 2000
1990-2000
1 951 Armoured fighting vehicles, arms 1 98.12 1 100.00 5,305.8 5,327.8 0.21% 0.11% 0.04%
2 688 Uranium & thorium 5 64.69 1 91.86 30.8 24.6 0.00% 0.00% -2.23%
3 714 Engines & motors, non-electric 2 89.72 1 91.76 22,013.5 47,353.6 0.85% 0.97% 7.96%
4 874 Measuring, checking, analysing instruments 1 94.85 1 90.83 36,365.6 72,086.9 1.41% 1.48% 7.08%
5 712 Steam & other vapour power units, steam engines 1 93.60 1 89.36 1,758.2 2,477.5 0.07% 0.05% 3.49%
6 774 Electric apparatus for medical purposes 1 100.00 1 89.31 7,641.7 14,403.3 0.30% 0.30% 6.54%
7 728 Mach.& equipment for particular industries 1 90.08 1 89.08 37,882.7 74,349.6 1.47% 1.52% 6.98%
8 723 Civil engineering & contractors plant 1 90.95 1 88.84 19,053.1 25,077.0 0.74% 0.51% 2.79%
9 584 Regenerated cellulose, cellulose nitrate etc. 1 91.97 1 88.72 1,972.7 2,286.9 0.08% 0.05% 1.49%
10 792 Aircraft & associated equipment and components 1 95.69 1 88.44 62,601.3 107,964.3 2.43% 2.21% 5.60%
11 736 Mach. tools for working metal 1 92.87 1 88.00 24,361.4 31,053.0 0.95% 0.64% 2.46%
12 726 Printing & bookbinding machinery & parts 1 98.88 1 87.95 10,938.6 13,839.9 0.42% 0.28% 2.38%
13 882 Photographic & cinematographic apparatus 1 92.28 1 87.68 12,206.9 17,725.9 0.47% 0.36% 3.80%
14 737 Metal working machinery and parts 1 91.99 1 87.27 6,740.3 8,926.1 0.26% 0.18% 2.85%
15 871 Optical instruments and apparatus 1 93.24 1 86.92 3,809.8 22,096.4 0.15% 0.45% 19.22%
16 718 Other power generating machinery 2 88.85 1 85.20 3,149.5 4,960.7 0.12% 0.10% 4.65%
17 725 Paper & pulp mill machinery 1 96.46 1 85.17 6,813.8 6,770.1 0.26% 0.14% -0.06%
18 515 Organo-inorganic and heterocyclic compounds 3 81.93 1 85.10 11,597.8 30,532.7 0.45% 0.63% 10.16%
19 524 Radio-active and associated materials 3 83.73 1 85.05 4,752.9 4,425.5 0.18% 0.09% -0.71%
QEH W k P S QEHWPS 123 P 32
7/27/2019 Lall - sophistication of exports (2005).pdf
http://slidepdf.com/reader/full/lall-sophistication-of-exports-2005pdf 32/39
QEH Working Paper Series – QEHWPS 123 Page 32
20 722 Tractors fitted or not with power takeoffs 1 89.73 1 84.35 7,418.6 7,648.4 0.29% 0.16% 0.31%
21 598 Miscellaneous chemical products, n.e.s. 2 88.60 1 83.99 21,154.2 42,479.9 0.82% 0.87% 7.22%
22 541 Medicinal and pharmaceutica l products 2 86.48 1 83.91 36,276.7 106,455.4 1.41% 2.18% 11.37%
23 585 Other artificial resins and plastic materials 4 74.68 1 83.72 354.8 662.8 0.01% 0.01% 6.45%
24 742 Pumps for liquids, liquid elevators and parts 1 94.62 1 83.10 11,374.7 19,096.5 0.44% 0.39% 5.32%
25 744 Mechanical handling equip. and parts 1 91.82 1 83.09 23,295.0 35,726.5 0.90% 0.73% 4.37%
26 872 Medical instruments and appliances 1 91.55 1 82.89 9,944.4 23,281.9 0.39% 0.48% 8.88%
27 784 Automotive parts & accessories 2 87.98 1 82.69 84,686.1 140,960.9 3.29% 2.89% 5.23%
28 514 Nitrogen-function compounds 1 89.83 1 82.48 17,113.6 34,659.2 0.66% 0.71% 7.31%
29 721 Agricultural machinery and parts 1 90.04 1 82.32 9,015.5 10,665.1 0.35% 0.22% 1.69%
30 713 Internal combustion piston engines 2 87.48 1 82.28 36,101.8 67,804.9 1.40% 1.39% 6.51%
Total sophistication level 1 535,732.2 981,123.2 20.80% 20.10% 6.24%
31 551 Essential oils, perfumes and flavours 4 78.52 2 82.05 3,571.5 7,558.1 0.14% 0.15% 7.78%
32 885 Watches and clocks 2 85.67 2 81.97 14,022.5 13,873.4 0.54% 0.28% -0.11%
33 035 Fish, dried, salted, smoked or in brine 3 81.62 2 81.87 2,133.0 2,417.0 0.08% 0.05% 1.26%
34 267 Other man-made fibres for spinning & waste 3 85.02 2 81.86 2,575.2 2,214.6 0.10% 0.05% -1.50%
35 743 Pumps, compressors , fans, blowers, centrifuges 1 91.43 2 81.55 19,716.7 38,920.6 0.77% 0.80% 7.04%
36 233 Synthetic rubber latex 2 85.36 2 81.26 4,660.7 6,001.8 0.18% 0.12% 2.56%
37 898 Musical instruments, parts and accessories 3 85.07 2 80.64 18,524.0 33,112.9 0.72% 0.68% 5.98%
38 676 Rails and railway track construction material 3 80.14 2 80.53 25.5 - 0.00% 0.00%-
100.00%
39 745 Other non-electr ical mach .tools, apparatus & parts 1 95.41 2 80.46 16,066.4 22,474.8 0.62% 0.46% 3.41%
40 122 Tobacco manufactured 1 2 79.82 0.45% 0.30% 2.46%
QEH W ki P S i QEHWPS 123 P 33
7/27/2019 Lall - sophistication of exports (2005).pdf
http://slidepdf.com/reader/full/lall-sophistication-of-exports-2005pdf 33/39
QEH Working Paper Series – QEHWPS 123 Page 33
90.50 11,486.1 14,652.1
41 663 Mineral manufactures, n.e.s. 2 86.51 2 79.70 8,564.2 13,475.7 0.33% 0.28% 4.64%
42 641 Paper and paperboard 2 89.46 2 79.68 50,316.7 75,936.5 1.95% 1.56% 4.20%
43 781 Passenger motor cars, for transport 1 91.99 2 79.62 167,456.9 298,482.0 6.50% 6.11% 5.95%
44 533 Pigments, paints, varnishes & related materials 2 87.29 2 79.61 11,761.3 23,448.3 0.46% 0.48% 7.14%
45 411 Animal oils and fats 2 88.05 2 78.81 1,097.3 1,261.1 0.04% 0.03% 1.40%
46 749 Non-electric parts and accessories 2 88.50 2 78.70 36,891.5 64,560.3 1.43% 1.32% 5.76%
47 282 Waste and scrap metal of iron or steel 2 88.81 2 78.56 5,006.3 6,986.7 0.19% 0.14% 3.39%
48 873 Meters and counters, n.e.s. 1 94.04 2 78.24 1,352.7 2,659.2 0.05% 0.05% 6.99%
49 553 Perfumery, cosmetics and toilet preparat ions 4 73.83 2 77.91 10,069.1 22,686.4 0.39% 0.46% 8.46%
50 783 Road motor vehicles, n.e.s. 2 87.44 2 77.70 6,570.3 16,070.8 0.26% 0.33% 9.36%
51 791 Railway vehicles & associated equipment 4 77.57 2 77.44 4,613.5 8,100.6 0.18% 0.17% 5.79%
52 727 Food processing machines and parts 2 87.50 2 77.08 5,233.1 5,555.0 0.20% 0.11% 0.60%
53 073 Chocolate & other preparations containing cocoa 3 80.22 2 77.02 4,172.4 6,843.2 0.16% 0.14% 5.07%
54 724 Textile & leather machinery and parts 1 92.27 2 76.94 21,887.0 19,197.7 0.85% 0.39% -1.30%
55 695 Tools for use in hand or in machines 2 85.62 2 76.86 12,198.8 20,149.3 0.47% 0.41% 5.15%
56 012 Meat & edible offal, salted, in brine 2 86.43 2 76.70 1,518.1 1,600.9 0.06% 0.03% 0.53%
57 024 Cheese and curd 3 83.42 2 76.69 7,917.0 9,889.2 0.31% 0.20% 2.25%
58 628 Articles of rubber, n.e.s. 3 83.59 2 76.44 4,798.2 11,058.9 0.19% 0.23% 8.71%
59 582 Condensation, polycondensation & polyaddition 2 88.95 2 76.35 16,155.9 30,376.7 0.63% 0.62% 6.52%
60 884 Optical goods, n.e.s. 3 84.10 2 76.21 4,636.0 9,337.7 0.18% 0.19% 7.25%
Total sophistication level 2 474,997.7 788,901.5 18.44% 16.16% 5.20%
QEH Working Paper Series QEHWPS 123 Page 34
7/27/2019 Lall - sophistication of exports (2005).pdf
http://slidepdf.com/reader/full/lall-sophistication-of-exports-2005pdf 34/39
QEH Working Paper Series – QEHWPS 123 Page 34
61 881 Photographic apparatus and equipment 1 93.24 3 75.88 7,259.5 16,539.5 0.28% 0.34% 8.58%
62 782 Motor vehicles for transport of goods 1 90.83 3 75.80 38,067.0 56,985.5 1.48% 1.17% 4.12%
63 664 Glass 3 83.56 3 75.71 9,352.2 20,036.6 0.36% 0.41% 7.92%
64 592 Starches, inulin & wheat gluten 4 78.79 3 75.11 4,641.0 8,701.4 0.18% 0.18% 6.49%
65 778 Electrical machinery and apparatus, n.e.s. 2 88.18 3 74.83 36,738.9 97,259.5 1.43% 1.99% 10.23%
66 621 Materials of rubber (e.g. pastes, plates, sheets, etc.) 3 84.26 3 74.69 3,984.8 7,419.4 0.15% 0.15% 6.41%
67 741 Heating & cooling equipment and parts 1 89.91 3 74.67 23,045.0 40,379.1 0.89% 0.83% 5.77%
68 023 Butter 4 72.83 3 74.44 2,947.8 2,652.1 0.11% 0.05% -1.05%
69 516 Other organic chemicals 2 89.32 3 74.42 6,871.7 13,724.7 0.27% 0.28% 7.16%
70 751 Office machines 2 89.50 3 74.36 11,085.0 12,886.4 0.43% 0.26% 1.52%
71 694 Nails, screws, nuts, bolts etc. of iron 3 81.33 3 74.28 6,584.2 11,920.0 0.26% 0.24% 6.12%
72 583 Polymeriza tion and copolymerization products 3 82.84 3 74.04 47,119.1 83,997.1 1.83% 1.72% 5.95%
73 772 Elect. app. such as switches, relays, fuses etc. 1 90.50 3 73.91 35,297.1 90,569.1 1.37% 1.86% 9.88%
74 247 Other wood in the rough or roughly squared 5 69.34 3 73.33 6,223.6 6,624.0 0.24% 0.14% 0.63%
75 269 Old clothing and other old textile products 2 86.16 3 73.21 759.1 1,427.8 0.03% 0.03% 6.52%
76 674 Universals, plates and sheets, of iron 3 81.18 3 73.18 37,745.2 51,232.7 1.47% 1.05% 3.10%
77 098 Edible products and preparations n.e.s. 4 75.04 3 73.14 7,337.6 15,022.0 0.28% 0.31% 7.43%
78 288 Non-ferrous base metal waste and scrap n.e.s. 3 84.31 3 73.12 5,947.0 8,017.6 0.23% 0.16% 3.03%
79 895 Office and stationery supplies, n.e.s. 3 85.07 3 72.80 4,384.0 7,679.1 0.17% 0.16% 5.77%
80 591 Disinfectants, insecticides, fungicides 2 86.92 3 72.63 7,242.2 10,562.2 0.28% 0.22% 3.85%
81 513 Carboxylic acids,& their anhydrides 2 86.00 3 71.79 9,898.8 16,112.9 0.38% 0.33% 4.99%
82 248 Wood, simply worked, and railway sleepers 4 3 71.70 0.70% 0.49% 2.85%
QEH Working Paper Series QEHWPS 123 Page 35
7/27/2019 Lall - sophistication of exports (2005).pdf
http://slidepdf.com/reader/full/lall-sophistication-of-exports-2005pdf 35/39
QEH Working Paper Series – QEHWPS 123 Page 35
75.43 18,064.5 23,915.5
83 048 Cereal preps. of flour of fruits & vegetables 4 78.94 3 71.70 9,523.3 17,517.3 0.37% 0.36% 6.28%
84 531 Synthetic org. dyestuffs, etc. natural indigo 2 89.00 3 71.41 7,611.1 8,665.7 0.30% 0.18% 1.31%
85 642 Paper and paperboard, cut to size or shape 2 85.29 3 71.40 13,056.3 24,113.4 0.51% 0.49% 6.33%
86 251 Pulp and waste paper 3 81.57 3 71.27 17,262.2 22,396.8 0.67% 0.46% 2.64%
87 699 Manufactures of base metal, n.e.s. 3 81.37 3 71.25 23,796.9 48,526.0 0.92% 0.99% 7.39%
88 711 Steam & other vapour generating boilers 3 85.11 3 71.20 1,994.2 2,480.9 0.08% 0.05% 2.21%
89 764 Telecommunications equipment and parts 2 85.78 3 70.99 56,766.1 206,333.3 2.20% 4.23% 13.78%
90 111 Non alcoholic beverages, n.e.s. 5 69.71 3 70.65 2,297.6 5,119.1 0.09% 0.10% 8.34%
Total sophistication level 3 462,902.8 938,816.5 17.97% 19.23% 7.33%
91 511 Hydrocarbons n.e.s., halogen & other derivatives 4 77.69 4 70.38 15,797.3 22,918.8 0.61% 0.47% 3.79%
92 678 Tubes, pipes and fittings, of iron or steel 3 82.04 4 70.32 19,046.3 21,730.5 0.74% 0.45% 1.33%
93 523 Other inorganic chemicals 4 77.22 4 70.03 7,876.8 12,052.8 0.31% 0.25% 4.35%
94 335 Residual petroleum products n.e.s. 4 77.52 4 69.56 5,183.5 10,918.8 0.20% 0.22% 7.73%
95 554 Soap, cleansing and polishing preparations 3 80.45 4 69.44 6,943.4 12,738.1 0.27% 0.26% 6.26%
96 893 Articles of plastics, resins, cellulose 3 80.50 4 69.20 28,728.7 62,055.1 1.12% 1.27% 8.01%
97 112 Alcoholic beverages 4 72.10 4 69.15 18,875.8 28,300.2 0.73% 0.58% 4.13%
98 776 Thermionic, cold & photo-cathode valves 4 75.60 4 68.83 59,098.6 284,417.1 2.29% 5.83% 17.01%
99 716 Rotating electric plant and parts 2 87.70 4 68 .53 13,205.6 28,533.4 0.51% 0.58% 8.01%
100 785 Motorcycles, motor scooters, invalid carriages 3 80.51 4 68.15 9,834.0 20,478.6 0.38% 0.42% 7.61%
101 689 Misc. non-ferrous base metals 4 79.69 4 68.07 1,606.5 3,454.6 0.06% 0.07% 7.96%
102 793 Ships, boats and floating structures 4 79.98 4 67.95 26,644.1 39,359.6 1.03% 0.81% 3.98%
QEH Working Paper Series – QEHWPS 123 Page 36
7/27/2019 Lall - sophistication of exports (2005).pdf
http://slidepdf.com/reader/full/lall-sophistication-of-exports-2005pdf 36/39
QEH Working Paper Series QEHWPS 123 Page 36
103 265 Vegetable textile fibres and waste 6 46.46 4 67.80 362.7 597.8 0.01% 0.01% 5.12%
104 625 Rubber tyres, tyre cases, etc. for wheels 4 76.87 4 67.15 15,959.3 24,641.2 0.62% 0.50% 4.44%
105 677 Iron/steel wire, not insulated 4 75.56 4 66.56 3,240.7 3,652.8 0.13% 0.07% 1.20%
106 692 Metal containers for storage and transpor t 3 80.56 4 66.56 4,736.2 6,565.8 0.18% 0.13% 3.32%
107 752 Automatic data processing machines 3 82.18 4 66.36 67,418.1 188,641.1 2.62% 3.86% 10.84%
108 562 Fertilizers, manufactured 5 71.49 4 65.87 11,846.5 14,095.5 0.46% 0.29% 1.75%
109 899 Other miscellaneous manufactured articles 5 69.18 4 65.71 10,463.2 20,871.9 0.41% 0.43% 7.15%
110 512 Alcohols, phenols, phenol-alcohols & derivatives 4 77.59 4 65.23 7,793.3 13,477.2 0.30% 0.28% 5.63%
111 691 Structures of iron, steel, aluminium 3 80.82 4 65.20 9,106.9 13,255.2 0.35% 0.27% 3.82%
112 673 Iron and steel bars, rods, angles, shapes 5 67.87 4 64.42 19,746.3 21,742.6 0.77% 0.45% 0.97%
113 657 Special textile fabrics and related products 4 77.42 4 64.28 11,108.3 20,029.4 0.43% 0.41% 6.07%
114 763 Gramophones, dictating, sound recorders 2 85.45 4 64.01 15,423.3 24,960.4 0.60% 0.51% 4.93%
115 759 Parts /accessories for office and ADP machines 3 83.31 4 63.18 47,956.7 150,491.4 1.86% 3.08% 12.12%
116 665 Glassware 5 70.57 4 63.07 6,718.7 9,950.3 0.26% 0.20% 4.01%
117 046 Meal and flour of wheat and flour of meslin 4 76.16 4 62.65 1,702.4 1,698.2 0.07% 0.03% -0.02%
118 047 Other cereal meals and flours 5 66.81 4 62.29 237.9 417.9 0.01% 0.01% 5.80%
119 771 Electric power machinery and parts 3 81.81 4 61.70 10,540.9 31,663.0 0.41% 0.65% 11.63%
120 693 Wire products and fencing grills 5 71.43 4 60.92 3,469.2 4,731.2 0.13% 0.10% 3.15%
Total sophistication level 4 460,671.5 1,098,440.2 17.89% 22.50% 9.08%
121 062 Sugar confectionery and other sugar 4 72.26 5 60.74 2,009.1 3,935.1 0.08% 0.08% 6.95%
122 522 Inorganic chemical elements, oxides 5 70.02 5 60.61 12,026.8 15,857.2 0.47% 0.32% 2.80%
123 672 Ingots and other primary forms, of iron and steel 5 5 59.96 0.69% 0.53% 3.81%
QEH Working Paper Series – QEHWPS 123 Page 37
7/27/2019 Lall - sophistication of exports (2005).pdf
http://slidepdf.com/reader/full/lall-sophistication-of-exports-2005pdf 37/39
QEH Working Paper Series QEHWPS 123 Page 37
67.78 17,707.7 25,733.7
124 014 Meat & edib. offal, prep./pres. fish 5 68.21 5 59.88 3,947.1 5,592.0 0.15% 0.11% 3.55%
125 656 Tulle, lace, embroidery, ribbons, other small wares 5 69.01 5 58.86 2,764.9 5,227.2 0.11% 0.11% 6.58%
126 659 Floor coverings, etc. 5 63.47 5 58.78 7,687.8 9,123.1 0.30% 0.19% 1.73%
127 667 Pearls, precious & semi-prec . Stones 6 58.28 5 58.72 24,132.3 49,827.6 0.94% 1.02% 7.52%
128 266 Synthetic fibres suitable for spinning 4 72.93 5 57.95 3,831.1 4,584.5 0.15% 0.09% 1.81%
129 635 Wood manufactures , n.e.s. 5 69.97 5 57.92 8,057.1 16,447.8 0.31% 0.34% 7.40%
130 821 Furniture and parts thereof 4 78.73 5 57.89 29,066.7 61,736.7 1.13% 1.26% 7.82%
131 812 Sanitary, plumbing, heating, lighting fixtures 4 78.46 5 57.79 8,752.9 16,317.2 0.34% 0.33% 6.43%
132 773 Equipment for distributing electric current 4 77.42 5 57.39 13,284.8 37,110.1 0.52% 0.76% 10.82%
133 572 Explosives and pyrotechnic products 5 68.17 5 57.32 1,324.7 1,161.8 0.05% 0.02% -1.30%
134 679 Iron & steel castings, forgings & stampings, rough 4 72.34 5 56.08 2,583.2 4,602.2 0.10% 0.09% 5.94%
135 775 Household type, elect. & non-electrica l equipment 3 80.11 5 54.70 20,308.5 34,443.6 0.79% 0.71% 5.42%
136 532 Dyeing & tanning extracts ; synth tanning materials 5 64.35 5 54.60 558.6 862.3 0.02% 0.02% 4.44%
137 334 Petroleum products, refined 6 57.62 5 54.51 78,781.0 156,343.5 3.06% 3.20% 7.09%
138 654 Textile fabrics, woven, other than cotton 5 61.58 5 54.39 8,111.5 8,699.4 0.31% 0.18% 0.70%
139 662 Clay construct. materials & refractory products 4 74.73 5 53.84 7,385.5 10,010.4 0.29% 0.21% 3.09%
140 897 Jewellery, other articles of precious metals 5 70.37 5 53.84 13,088.6 20,915.2 0.51% 0.43% 4.80%
141 786 Trailers & other vehicles, not motor 5 69.43 5 53.66 6,936.7 10,911.9 0.27% 0.22% 4.63%
142 696 Cutlery 4 72.21 5 53.52 2,529.0 4,570.7 0.10% 0.09% 6.10%
143 894 Baby carriages, toys, games and sports goods 5 60.97 5 51.32 19,343.8 34,966.2 0.75% 0.72% 6.10%
144 431 Animal & vegetable oils and fats 6 58.33 5 51.26 2,043.5 3,018.7 0.08% 0.06% 3.98%
QEH Working Paper Series – QEHWPS 123 Page 38
7/27/2019 Lall - sophistication of exports (2005).pdf
http://slidepdf.com/reader/full/lall-sophistication-of-exports-2005pdf 38/39
Q g p Q g
145 634 Veneers, plywood, improved or reconstructed 6 49.07 5 51.07 9,255.0 13,609.7 0.36% 0.28% 3.93%
146 655 Knitted or crocheted fabrics 5 63.21 5 50.75 6,023.8 13,383.4 0.23% 0.27% 8.31%
147 286 Ores and concentrates of uranium and thorium 5 66.62 5 49.56 22.0 352.6 0.00% 0.01% 31.95%
148 423 Fixed vegetable oils, soft, crude, refined 6 51.00 5 49.39 6,132.8 7,534.0 0.24% 0.15% 2.08%
149 613 Fur skins, tanned/dressed 5 70.16 5 49.15 947.0 846.7 0.04% 0.02% -1.11%
150 056 Veg., roots & tubers, prepared/preserved n.e.s. 6 50.02 5 48.86 4,400.2 5,679.4 0.17% 0.12% 2.58%
Total sophistication level 5 323,044.0 583,404.1 12.54% 11.95% 6.09%
151 289 Ores & concentrates of precious metals 5 70.07 6 47.80 1,222.9 3,319.7 0.05% 0.07% 10.50%
152 058 Fruit, preserved, fruit preparat ions 6 46.27 6 47.76 8,524.2 12,025.0 0.33% 0.25% 3.50%
153 653 Fabrics, woven, of man-made fibres 5 61.56 6 47.68 21,681.6 28,674.2 0.84% 0.59% 2.83%
154 761 Television receivers 5 67.02 6 47.66 16,698.5 27,538.4 0.65% 0.56% 5.13%
155 652 Cotton fabrics, woven 6 56.77 6 45.80 14,792.1 19,732.0 0.57% 0.40% 2.92%
156 651 Textile yarn 5 62.67 6 45.73 23,136.2 31,497.4 0.90% 0.65% 3.13%
157 697 Household equipment of base metal, n.e.s. 5 67.44 6 45.38 5,789.3 10,852.1 0.22% 0.22% 6.49%
158 611 Leather 6 58.53 6 43.37 9,157.6 14,253.2 0.36% 0.29% 4.52%
159 847 Clothing accessories of textile fabrics 6 52.05 6 42.52 4,797.1 8,409.0 0.19% 0.17% 5.77%
160 661 Lime, cement, fabricated construction materials 6 55.63 6 41.27 7,321.0 10,558.6 0.28% 0.22% 3.73%
161 061 Sugar and honey 6 48.94 6 39.70 8,705.5 8,670.4 0.34% 0.18% -0.04%
162 612 Manufactures of leather/of composition leather 6 45.55 6 38.81 3,665.8 6,325.9 0.14% 0.13% 5.61%
163 845 Outer garments and other articles, knitted 6 44.99 6 38.20 25,079.5 41,335.2 0.97% 0.85% 5.12%
164 846 Under garments, knitted or crocheted 6 44.06 6 38.03 11,814.2 30,188.5 0.46% 0.62% 9.84%
165 633 Cork manufactures 6 6 37.56 1,226.1 0.03% 0.03% 4.67%
QEH Working Paper Series – QEHWPS 123 Page 39
7/27/2019 Lall - sophistication of exports (2005).pdf
http://slidepdf.com/reader/full/lall-sophistication-of-exports-2005pdf 39/39
32.72 776.6
166 666 Pottery 5 64.87 6 37.26 4,030.5 5,027.8 0.16% 0.10% 2.24%
167 037 Fish, crustaceans and molluscs, prepared 6 51.42 6 35.99 5,780.6 9,172.8 0.22% 0.19% 4.73%
168 762 Radio-broadcast receivers 6 50.66 6 35.94 11,314.1 15,546.2 0.44% 0.32% 3.23%
169 287 Ores and concentrates of base metal 6 49.52 6 35.80 14,076.0 19,381.5 0.55% 0.40% 3.25%
170 843 Outer garments, women's, of textile fabrics 6 51.96 6 32.89 25,369.2 43,347.5 0.99% 0.89% 5.50%
171 281 Iron ore and concentrates 6 40.48 6 32.86 7,790.6 8,576.9 0.30% 0.18% 0.97%
172 671 Pig iron, spiegeleisen, sponge iron, iron & steel 6 50.25 6 31.62 6,730.5 8,428.3 0.26% 0.17% 2.27%
173 844 Under garments of textile fabrics 6 35.79 6 31 .49 6,862.4 13,351.0 0.27% 0.27% 6.88%
174 842 Outer garments, men's, of textile fabrics 6 47.29 6 30.19 16,530.7 31,204.4 0.64% 0.64% 6.56%
175 851 Footwear 6 43.72 6 29.90 26,752.9 33,479.7 1.04% 0.69% 2.27%
176 323 Briquettes; coke, semi-coke of coal, lignite, peat 4 74.50 6 28.98 1,977.7 2,206.4 0.08% 0.05% 1.10%
177 831 Travel goods, handbags, brief-cases etc 6 50.02 6 28.61 6,349.0 11,500.0 0.25% 0.24% 6.12%
178 658 Made-up articles of textile materials 6 37.68 6 26.28 8,087.2 16,302.8 0.31% 0.33% 7.26%
179 848 Art. of apparel & clothing accessories 6 37.73 6 24.72 9,622.5 12,352.5 0.37% 0.25% 2.53%
180 424 Other fixed vegetable oils, fluid or solid, crude 6 20.26 6 16.18 3,479.7 6,801.0 0.14% 0.14% 6.93%
181 264 Jute & other textile bast fibres, n.e.s. 6 0.0 6 0.00 146.2 87.2 0.01% 0.00% -5.04%
Total sophistication level 6 318,061.9 491,371.6 12.35% 10.06% 4.45%
Total all manufactured exports 2,575,410.1 4,882,057.0 100.00% 100.00% 6.60%