laminar burning velocities of hydrogen–air mixtures … · laminar burning velocities of...
TRANSCRIPT
Laminar burning velocities of hydrogen–air mixtures
from closed vessel gas explosions
A.E. Dahoe*
Faculty of Engineering, University of Ulster, FireSERT (Block 27), Co. Antrim, Shore Road, Newtownabbey BT37 0QB, Northern Ireland, UK
Received 31 January 2005; received in revised form 24 March 2005; accepted 29 March 2005
Abstract
The laminar burning velocity of hydrogen–air mixtures was determined from pressure variations in a windowless explosion vessel.
Initially, quiescent hydrogen–air mixtures of an equivalence ratio of 0.5–3.0 were ignited to deflagration in a 169 ml cylindrical vessel at
initial conditions of 1 bar and 293 K. The behavior of the pressure was measured as a function of time and this information was subsequently
exploited by fitting an integral balance model to it. The resulting laminar burning velocities are seen to fall within the band of experimental
data reported by previous researchers and to be close to values computed with a detailed kinetics model. With mixtures of an equivalence
ratio larger than 0.75, it was observed that more advanced methods that take flame stretch effects into account have no significant advantage
over the methodology followed in the present work. At an equivalence ratio of less than 0.75, the laminar burning velocity obtained by the
latter was found to be higher than that produced by the former, but at the same time close enough to the unstretched laminar burning velocity
to be considered as an acceptable conservative estimate for purposes related to fire and explosion safety. It was furthermore observed that the
experimental pressure–time curves of deflagrating hydrogen–air mixtures contained pressure oscillations of a magnitude in the order of
0.25 bar. This phenomenon is explained by considering the velocity of the burnt mixture induced by the expansion of combusting fluid layers
adjacent to the wall.
q 2005 Elsevier Ltd. All rights reserved.
Keywords: Explosion; Burning velocity; Hydrogen
1. Introduction
The present paper describes the determination of the
laminar burning velocity of hydrogen–air mixtures from
closed vessel gas explosions. Available methods to
determine the laminar burning velocity rely on measure-
ments of the flow structure of stabilized flames, the
observation of moving flames in the course of confined
deflagrations in an optically accessible explosion vessel, or
the measurement of pressure variations caused by confined
deflagrations in a windowless explosion chamber. The last
method, which is the one adopted in the present work and
called the traditional approach (Tse, Zhu, & Law, 2000),
allows experimentation at initial conditions of very high
pressure and temperature. It was demonstrated by various
0950-4230/$ - see front matter q 2005 Elsevier Ltd. All rights reserved.
doi:10.1016/j.jlp.2005.03.007
* Tel.: C44 28 9036 6073; fax: C44 28 9036 8700.
E-mail address: [email protected]
authors that laminar burning velocities of air mixed with
hydrogen (Iijima & Takeno, 1986; Milton & Keck, 1984),
methane (Agnew & Graiff, 1961; Iijima & Takeno, 1986),
propane (Agnew & Graiff, 1961; Babkin, Bukharov, &
Molkov, 1989; Metghalchi & Keck, 1980), n-butane
(Clarke, Stone, & Beckwith, 2001), iso-butane (Clarke
et al., 2001), 2-methyl-pentane (Halstead, Pyle, & Quinn,
1974), n-heptane (Babkin, Vyun, & Kozachenko, 1967),
iso-octane (Babkin et al., 1967; Metghalchi & Keck, 1982),
ethylene (Agnew & Graiff, 1961; Halstead et al., 1974),
acetylene (Agnew & Graiff, 1961; Rallis, Garforth, &
Steinz, 1965), benzene (Babkin et al., 1967), toluene
(Agnew & Graiff, 1961; Halstead et al., 1974), indolene
(Metghalchi & Keck, 1982), methanol (Metghalchi & Keck,
1982), and acetone (Molkov & Nekrasov, 1981), could be
determined by this method. In some cases, the initial
conditions were varied up to 50 bar and 700 K.
Because of the growing interest in the use of hydrogen as
an energy carrier, it seemed worthwhile to investigate
whether the same approach could also be applied to
hydrogen–air mixtures. A particular concern was that
Journal of Loss Prevention in the Process Industries 18 (2005) 152–166
www.elsevier.com/locate/jlp

Nomenclature
Latin symbols
KG gas explosion severity index bar (m sK1)
mu mass of unburnt mixture (kg)
n unit normal (m)
n0 moles of gas present before explosion (mol)
ne moles of gas present after explosion (mol)
P macroscopic pressure (Pa)
P0 initial pressure (Pa), reference pressure (Pa)
Pmax maximum explosion pressure (Pa)
rf flame radius (m)
R specific gas constant (J kgK1 KK1)
SuL laminar burning velocity (m sK1)
SouL laminar burning velocity at reference conditions
(m sK1)
S�uL unstretched laminar burning velocity (m sK1)
t time (s)
T temperature (K)
T0 reference temperature (K)
Tu temperature of the unburnt mixture (K)
Tu0 initial temperature of the unburnt mixture (K)
v velocity vector (m sK1)
Vv volume explosion vessel (m3)
Greek symbols
g specific heat ratio (–)
n0i stoichiometric coefficient of the ith species on
the reactant side (–)
n00i stoichiometric coefficient of the ith species on
the product side (–)
r density (kg mK3)
rb density of the burnt mixture (kg mK3)
ru density of the unburnt mixture (kg mK3)
f equivalence ratio (–)
Other symbols
(dP/dt)max maximum rate of pressure rise (Pa sK1)
Lc curvature Markstein length (m)
Ls stretch Markstein length (m)
R radius of curvature (m)
A.E. Dahoe / Journal of Loss Prevention in the Process Industries 18 (2005) 152–166 153
the tendency of laminar hydrogen–air flames to develop into
wrinkled structures (Aung, Hassan, & Faeth, 1997; Aung,
Hassan, & Faeth, 1998; Tse et al., 2000) might render this
methodology useless for the experimental determination of
the laminar burning velocity. This concern stems from the
fact that the use of windowless explosion vessels appears
to be unacceptable to some researchers (Tse et al., 2000)
because influences of stretch intensity and flame shape,
which are inherently coupled to the development of flames
into wrinkled structures, are not taken into account.
Measurements of the laminar burning velocity that do not
take contemporary insights in stretch and curvature effects
into account are even considered to be flawed by other
researchers (Dowdy, Smith, Taylor, & Williams, 1990).
Wu and Law (1984) were the first who measured stretch-
free laminar burning velocities by introducing a method-
ology to subtract stretch effects out from experimental
laminar burning velocities of flames in stagnation flows.
This work inspired the subsequent use of counter-flow
flames for the determination of stretch-free laminar burning
velocities (Law, Zhu, & Yu, 1988; Yu, Law, & Wu, 1986;
Zhu, Egolfopoulos, Cho, & Law, 1989; Zhu, Egolfopoulos,
& Law, 1989) and attempts to compensate stretch effects
on spherically propagating flames in optically accessible
explosion vessels (Aung et al., 1997, 1998; Brown,
McLean, Smith, & Taylor, 1996; Dowdy et al., 1990;
Hassan, Aung, & Faeth, 1997; Hassan, Aung, & Faeth,
1998; Kwon, Tseng, & Faeth, 1992; Tse et al., 2000;
Tseng, Ismail, & Faeth, 1993). However, when stretched
and unstretched laminar burning velocities are plotted
together (see the upper part of Fig. 5), it is seen that
laminar burning velocities of fuel-rich mixtures obtained
from a windowless vessel (e.g. the data of Iijima &
Takeno, 1986) fall within the scatter of the data obtained
by more advanced methods that take stretch effects into
account. It is also seen that laminar burning velocities of
fuel-lean mixtures obtained from a windowless vessel are
consistently larger than stretch-free data. With this being
the case, laminar burning velocities from windowless
explosion vessels are to be considered valuable for the
assessment of accidental combustion hazards, even when
they are unacceptable or flawed in the light of more
advanced methods. Conversely, if the laminar burning
velocities of fuel-lean mixtures had been consistently lower
that the stretch-free values, their use as a quick estimate for
the assessment of accidental combustion hazards would
have been unacceptable.
With the foregoing in mind, it was decided to apply the
methodology by Dahoe and de Goey (2003) and Dahoe,
Zevenbergen, Lemkowitz, and Scarlett (1996) to the
pressure–time curves of hydrogen–air explosions in a
closed vessel. It was demonstrated earlier by Dahoe et al.
(1996) that this methodology could be applied to turbulent
dust explosions in closed vessels to find an estimate of the
turbulent burning velocity of a dust–air mixture. In a later
contribution, Dahoe and de Goey (2003) demonstrated that
it could also be applied to closed vessel gas explosions to
find an estimate of the laminar burning velocity of methane–
air mixtures. Although it is shown further in this paper that
the laminar burning velocities of hydrogen–air mixtures
obtained by this approach fall within the scatter of data
produced by more advanced methods, it is emphasized that
this method should only be applied when the application of
more advanced ones becomes impractical.
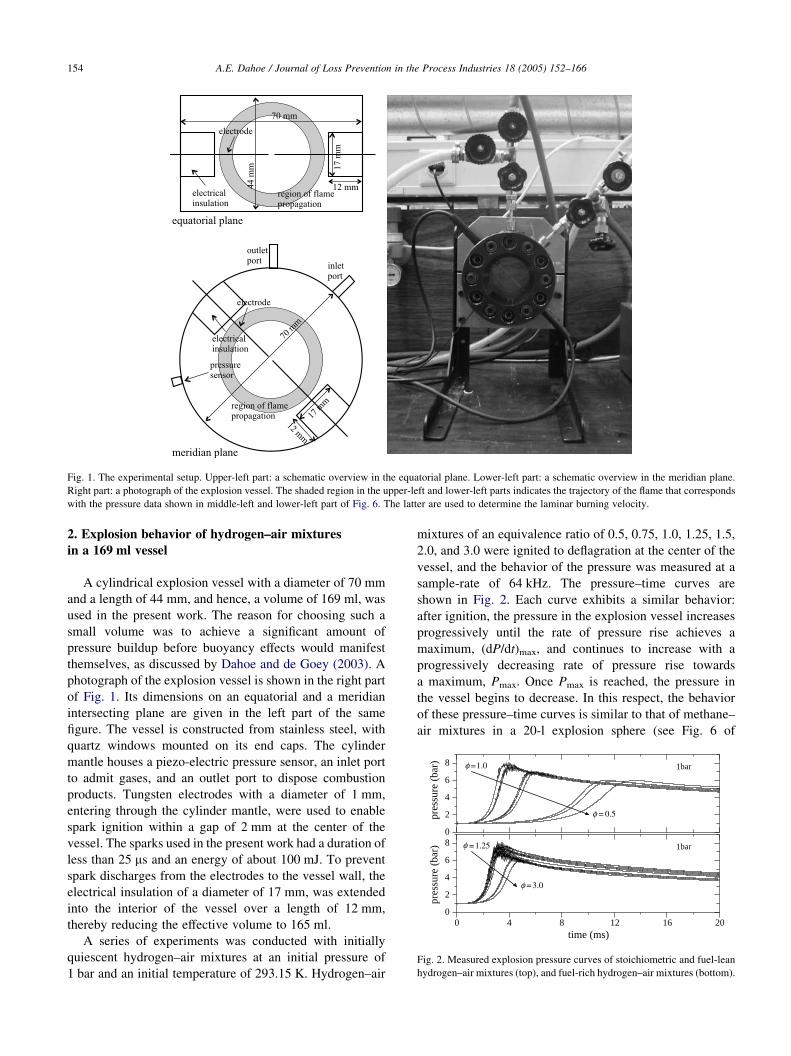
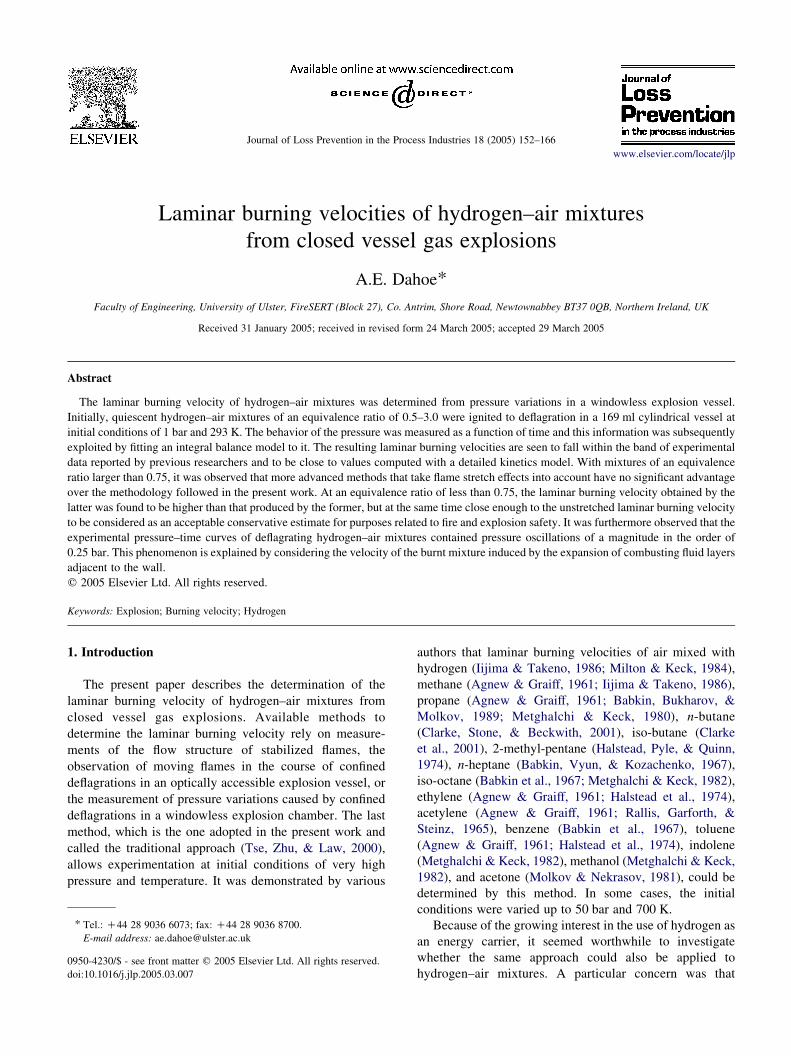
Fig. 1. The experimental setup. Upper-left part: a schematic overview in the equatorial plane. Lower-left part: a schematic overview in the meridian plane.
Right part: a photograph of the explosion vessel. The shaded region in the upper-left and lower-left parts indicates the trajectory of the flame that corresponds
with the pressure data shown in middle-left and lower-left part of Fig. 6. The latter are used to determine the laminar burning velocity.
0
2
4
6
8 1bar
pres
sure
(ba
r)
0 4 8 12 16 200
2
4
6
8 1bar
time (ms)
pres
sure
(ba
r)
Fig. 2. Measured explosion pressure curves of stoichiometric and fuel-lean
hydrogen–air mixtures (top), and fuel-rich hydrogen–air mixtures (bottom).
A.E. Dahoe / Journal of Loss Prevention in the Process Industries 18 (2005) 152–166154
2. Explosion behavior of hydrogen–air mixtures
in a 169 ml vessel
A cylindrical explosion vessel with a diameter of 70 mm
and a length of 44 mm, and hence, a volume of 169 ml, was
used in the present work. The reason for choosing such a
small volume was to achieve a significant amount of
pressure buildup before buoyancy effects would manifest
themselves, as discussed by Dahoe and de Goey (2003). A
photograph of the explosion vessel is shown in the right part
of Fig. 1. Its dimensions on an equatorial and a meridian
intersecting plane are given in the left part of the same
figure. The vessel is constructed from stainless steel, with
quartz windows mounted on its end caps. The cylinder
mantle houses a piezo-electric pressure sensor, an inlet port
to admit gases, and an outlet port to dispose combustion
products. Tungsten electrodes with a diameter of 1 mm,
entering through the cylinder mantle, were used to enable
spark ignition within a gap of 2 mm at the center of the
vessel. The sparks used in the present work had a duration of
less than 25 ms and an energy of about 100 mJ. To prevent
spark discharges from the electrodes to the vessel wall, the
electrical insulation of a diameter of 17 mm, was extended
into the interior of the vessel over a length of 12 mm,
thereby reducing the effective volume to 165 ml.
A series of experiments was conducted with initially
quiescent hydrogen–air mixtures at an initial pressure of
1 bar and an initial temperature of 293.15 K. Hydrogen–air
mixtures of an equivalence ratio of 0.5, 0.75, 1.0, 1.25, 1.5,
2.0, and 3.0 were ignited to deflagration at the center of the
vessel, and the behavior of the pressure was measured at a
sample-rate of 64 kHz. The pressure–time curves are
shown in Fig. 2. Each curve exhibits a similar behavior:
after ignition, the pressure in the explosion vessel increases
progressively until the rate of pressure rise achieves a
maximum, (dP/dt)max, and continues to increase with a
progressively decreasing rate of pressure rise towards
a maximum, Pmax. Once Pmax is reached, the pressure in
the vessel begins to decrease. In this respect, the behavior
of these pressure–time curves is similar to that of methane–
air mixtures in a 20-l explosion sphere (see Fig. 6 of

A.E. Dahoe / Journal of Loss Prevention in the Process Industries 18 (2005) 152–166 155
Dahoe & de Goey, 2003). Despite this similarity the
inflection point occurs for a different reason in the 169 ml
vessel used in the present work. As discussed previously by
Dahoe and de Goey (2003), the duration of an explosion in a
20-l sphere is long enough to allow the flame ball to rise in the
vessel due to buoyancy. As a result, there is still a layer of
unburnt mixture present below the lower hemispherical part
of the flame, after all reactants ahead of the upper
hemispherical part of the flame have been consumed.
Because the surface area of the lower hemispherical part of
the flame decreases progressively during the consumption of
the remaining part of the reactants in the final stage of the
explosion, the accompanying rate of pressure rise also
decreases progressively. Although the role of buoyancy is
negligible in the 169 ml vessel, there is still the effect of a
progressively decreasing flame surface area in the final stage
of the explosion. Initially, the flame ball grows with a
progressively increasing flame surface area, until it reaches
the wall of the vessel. From that moment onwards, the flame
Fig. 3. An illustration of the determination of the maximum explosion pressure,
explosion curve (top), theoretical values of the maximum explosion pressure (midd
rate of pressure rise as a function of the equivalence ratio (bottom).
surface area, and hence the rate of pressure rise, decreases
progressively as the reactants in the corners of the vessel are
being consumed.
It may also be observed from Fig. 2 that, unlike with
methane–air mixtures, the pressure–time curves of hydro-
gen–air mixtures exhibit oscillations whose magnitude may
vary up to about 0.25 bar. These oscillations arise with both
fuel-lean and fuel-rich mixtures, and tend to become zero
when the mixture strength approaches the flammability
limits. Their onset occurs before the maximum explosion
pressure is reached, after an initial period of smooth
pressure buildup, and their presence continues after the
explosion has completed. The cause of this phenomenon is
described by Garforth and Rallis (1976) and Lewis and von
Elbe (1961), Chapter 15, and will be discussed in Section 3.
To enable a comparison with results presented by other
researchers, the maximum explosion pressure, Pmax, and the
maximum rate of pressure rise, (dP/dt)max, were determined as
illustrated by the upper part of Fig. 3. Since the experimental
Pmax, and the maximum rate of pressure rise, (dP/dt), from the measured
le), and the behavior of the maximum explosion pressure and the maximum
A.E. Dahoe / Journal of Loss Prevention in the Process Industries 18 (2005) 152–166156
pressure–time curve contained pressure oscillations, the mean
underlying curve and its derivative had to be determined by a
smoothing filter. This was accomplished by means of the
Savitzky–Golay method (Savitzky & Golay, 1964), using the
algorithm savgol by Press, Teukolsky, Vetterling, and
Flannery (1992) with a second degree polynomial and a data
window involving 21 points, namely, 10 on the left, and 10 on
the right of the point where the mean value and its first
derivative are to be evaluated. The dark curve in the upper-left
part of Fig. 3 denotes the filtered pressure–time curve, and the
filtered derivative is denoted by the dark curve in the upper-
right part. The upper-right part of Fig. 3 also shows the
behavior of the time-derivative as obtained from central
differencing. It is seen that the points are so heavily scattered
around the mean underlying value that the determination of
(dP/dt)max becomes meaningless without the application of a
smoothing filter.
The lower part of Fig. 3 shows a comparison between the
values of Pmax and (dP/dt)max obtained with the 169 ml
vessel, and those measured in a 120 l vessel by Cashdollar,
Zlochower, Green, Thomas, and Hertzberg (2000).
Theoretical1 estimates of Pmax, whose numerical values
are tabulated in the middle of the figure, are also plotted in
the lower-left part of Fig. 3. A comparison between the
maximum explosion pressures shows that practically no
difference exists between the values measured by
Cashdollar et al. (2000) and the theoretical values. At the
same time it may be observed that the maximum explosion
pressure in the 169 ml vessel may be up to 10% lower than
the theoretical values. This discrepancy may be attributed,
to the larger surface to volume ratio, and the consequential
larger heat losses in the final stage of the explosion. The
lower-right part of Fig. 3 indicates that the maximum rate of
pressure rise increases by a factor of about 1.4 when the
effective volume of the explosion vessel increases by a
factor of about 700. The scales on the left axis of the figure
indicate that no formal cube-root-law2 agreement exists
between the maximum rates of pressure rise in the two
vessels. The existence of a cube-root-law agreement
between the maximum rates of pressure rise in both vessels
would cause the scales on the left axis to be identical.
1 These calculations were performed with GASEQ for the reaction given in
footnote 3. GASEQ is a program for computation of chemical equilibria for
perfect gasses, written by Chris Morley.2 The KG-value, also known as the gas explosion severity index, is a
quantity which forms the design basis of a great deal of practical safety
measures. It is defined as the product of the maximum rate of pressure
rise and the cube-root of the volume of the explosion vessel, KGZ(dP/dt)maxV1/3, and believed to be a mixture specific explosion severity
index. The KG-value was defined in this way because it was believed that
maximum rates of pressure rise measured in differently sized vessels would
become volume-invariant when multiplied by the cube-root of the volume.
The practical significance of this quantity rests on the assumption that once
it is known for a particular mixture from an experiment in a small
laboratory test vessel, the maximum rate of pressure rise in a larger
industrial vessel is predicted correctly by dividing it by the cube-root of the
larger volume.
3. Oscillations in the pressure–time curve
of hydrogen–air deflagrations
Prior to addressing the mechanism behind the pressure
oscillations, it is helpful to consider the behavior of the gas
contained within a small volume, located around the center
of the vessel. At the moment of ignition, the gas contained
within this volume burns at constant pressure, which is
equal to the initial pressure. After an initial period of
expansion, the gas is subsequently compressed to nearly the
initial volume it occupied before ignition occurred. The size
of a fluid pocket, as well as the temperature of the burnt
gases contained within it during the successive stages of
expansion and compression may be estimated by means of
the adiabatic compression laws:
r
r0
� �Z
P
P0
� �Kð1=gÞ
;
r
r0
� �Z
T
T0
� �Kð1=gK1Þ
; and
T
T0
� �Z
P
P0
� �ðgK1Þ=g
:
(1)
For a stoichiometric hydrogen–air mixture for example,
knowing3 that the constant pressure and constant volume
adiabatic flame temperature are 2386 and 2766 K, and that
the maximum explosion pressure after constant volume
combustion equals 8.011 bar, the third expression in (1)
reveals that the temperature of a fluid pocket at the center
rises from 2386 to 4324 K in the course of the explosion.
This is more than 1500 K above the constant volume
adiabatic flame temperature. At the same time, a fluid
pocket of a radius of 1 mm, located at the center of the
vessel and containing reactants only, initially expands to
spherical region of a radius of 5.7 mm containing only
combustion products, and is subsequently compressed to a
radius of 1.3 mm. Thus, a fluid particle residing at the
boundary of the spherical region undergoes an oscillatory
motion: first it moves 4.7 mm away from the center of the
vessel, and then it travels 4.4 mm back towards the center.
3 These flame temperatures and maximum explosion pressure were
calculated with GASEQ. The initial temperature was 293.15 K and the
chemical reaction
n0H2H2 Cn0O2
O2 Cn0N2N2 /n00H2OH2O Cn00O2
O2 Cn00N2N2 Cn00H2
H2
Cn00HO,HO, Cn
00H,H, Cn
00O,O,;
with n0H2Z0:42, n0O2
Z0:21, and n0N2Z0:79 for the reactants. The
stoichiometric coefficients of the product mixture after combustion at
constant pressure were calculated to be n00H2O Z0:39668, n00O2Z0:00679,
n00N2Z0:79, n00H2
Z0:01772, n00HO, Z0:009, n00H, Z0:00218,
n00O, Z7:227!10K4, and after constant volume combustion, n00H2OZ0:3806, n00O2
Z0:00997, n00N2Z0:79, n00H2
Z0:02824, n00HO, Z0:01764,
n00H, Z0:0047, n00O, Z0:00182. The total number of moles before and after
the reaction, n0 and ne, is not being conserved: the ratio ne/n0 is 0.861.
A.E. Dahoe / Journal of Loss Prevention in the Process Industries 18 (2005) 152–166 157
Similarly, a fluid pocket of a radius of 3 mm, containing
only reactants, expands to a spherical region of a radius of
17.1 mm consisting of combustion products only, and is
subsequently compressed to a radius of 3.9 mm. Moreover,
according to the third expression in (1), a temperature
gradient that establishes itself within the burnt mixture, such
that the temperature is the highest at the point where ignition
occurred, and the lowest at the flame surface. The role of
this oscillatory motion as the cause of the pressure
oscillations may be assessed by considering what happens
to a fluid particle residing between the boundary that
separates the burnt mixture from the unburnt mixture, rb(t),
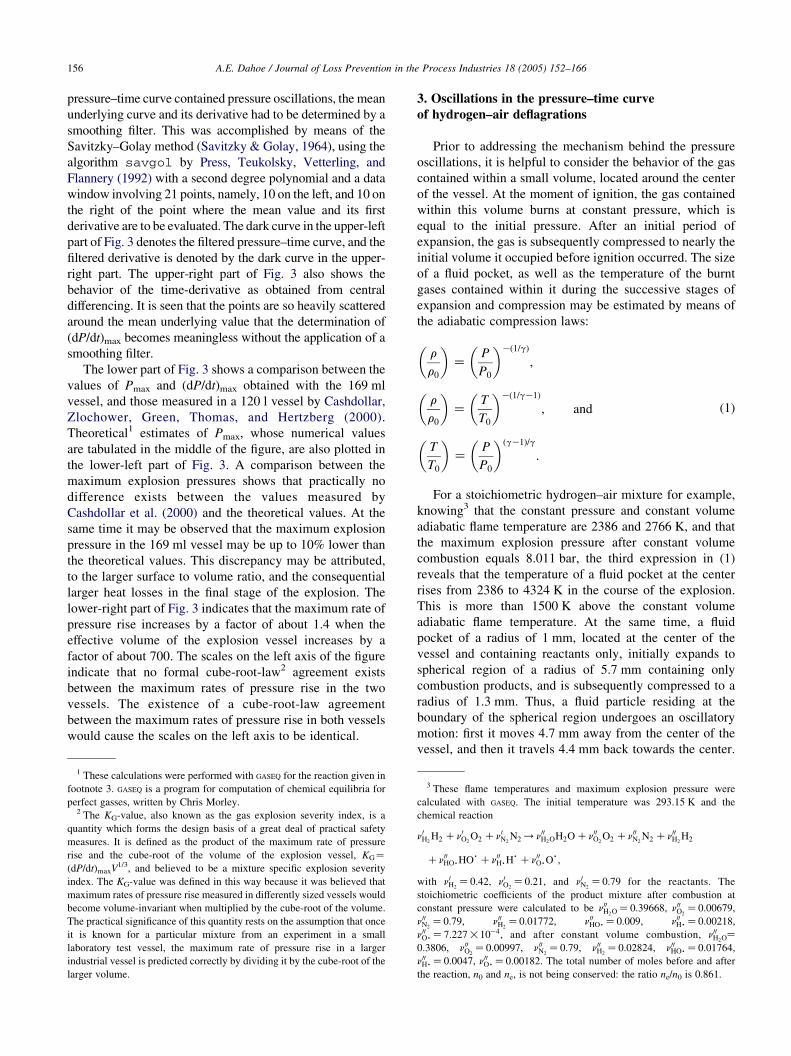
and the vessel wall, Rv (see the upper-left part of Fig. 4).
Initially, the fluid particle is being pushed away from
the center by the expansion flow. This process continues
until it has been consumed by the flame. Next, the fluid
Fig. 4. Effect of compression on the position and velocity of fluid elements. The u
expanding flame. The upper-right part illustrates the compression of the burnt mi
middle part shows the behavior of five fluid particles in the unburnt mixture at initi
r5(0)Z20 mm from the center. The lower part shows the behavior of the velocity o
an expanding layer close to the wall.
particle continues to move away from the center while
being part of the expansion flow until its motion is reversed
by the expansion of combusting layers closer to the vessel
wall. To facilitate the derivation of an expression for its
velocity, the shape of the vessel is idealized to a sphere
(with an effective volume of 165 ml, its radius, Rv,
becomes 34 mm) and the boundary separating the burnt
and unburnt mixture, rb(t), is viewed upon as if it is an
impermeable wall that expands like soap bubble from the
center towards the wall with a velocity _rbðtÞ. When the
location of a fluid particle residing on an arbitrary spherical
surface between rb(t) and the vessel wall is denoted by r(t)
(see the upper-left part of Fig. 4), it becomes evident that
the ratio of the mass contained between rb(t) and r(t), and
the mass contained between rb(t) and the vessel wall
pper-left part illustrates the compression of the unburnt mixture ahead of an
xture caused by the expansion of combusting layers close to the wall. The
al positions, r1(0)Z3 mm, r2(0)Z6 mm, r3(0)Z10 mm, r4(0)Z15 mm, and
f fluid particles within the burnt mixture when they are being compressed by
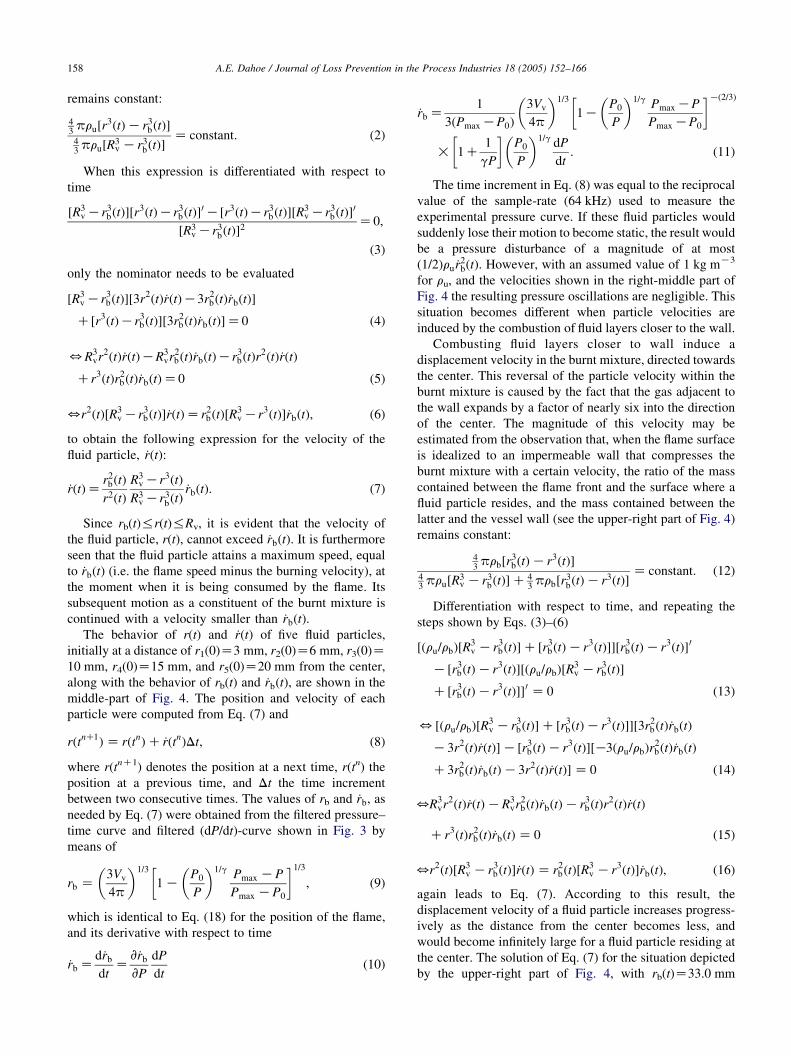
A.E. Dahoe / Journal of Loss Prevention in the Process Industries 18 (2005) 152–166158
remains constant:
43
pru½r3ðtÞKr3
bðtÞ�43
pru½R3v Kr3
bðtÞ�Z constant: (2)
When this expression is differentiated with respect to
time
½R3v Kr3
bðtÞ�½r3ðtÞKr3
bðtÞ�0 K½r3ðtÞKr3
bðtÞ�½R3v Kr3
bðtÞ�0
½R3v Kr3
bðtÞ�2
Z0;
(3)
only the nominator needs to be evaluated
½R3v Kr3
bðtÞ�½3r2ðtÞ_rðtÞK3r2bðtÞ_rbðtÞ�
C½r3ðtÞKr3bðtÞ�½3r2
bðtÞ_rbðtÞ�Z0 ð4Þ
5R3vr2ðtÞ_rðtÞKR3
vr2bðtÞ_rbðtÞKr3
bðtÞr2ðtÞ_rðtÞ
Cr3ðtÞr2bðtÞ_rbðtÞZ0 ð5Þ
5r2ðtÞ½R3v Kr3
bðtÞ�_rðtÞZr2bðtÞ½R
3v Kr3ðtÞ�_rbðtÞ; (6)
to obtain the following expression for the velocity of the
fluid particle, _rðtÞ:
_rðtÞZr2
bðtÞ
r2ðtÞ
R3v Kr3ðtÞ
R3v Kr3
bðtÞ_rbðtÞ: (7)
Since rb(t)%r(t)%Rv, it is evident that the velocity of
the fluid particle, r(t), cannot exceed _rbðtÞ. It is furthermore
seen that the fluid particle attains a maximum speed, equal
to _rbðtÞ (i.e. the flame speed minus the burning velocity), at
the moment when it is being consumed by the flame. Its
subsequent motion as a constituent of the burnt mixture is
continued with a velocity smaller than _rbðtÞ.
The behavior of r(t) and _rðtÞ of five fluid particles,
initially at a distance of r1(0)Z3 mm, r2(0)Z6 mm, r3(0)Z10 mm, r4(0)Z15 mm, and r5(0)Z20 mm from the center,
along with the behavior of rb(t) and _rbðtÞ, are shown in the
middle-part of Fig. 4. The position and velocity of each
particle were computed from Eq. (7) and
rðtnC1Þ Z rðtnÞC _rðtnÞDt; (8)
where r(tnC1) denotes the position at a next time, r(tn) the
position at a previous time, and Dt the time increment
between two consecutive times. The values of rb and _rb, as
needed by Eq. (7) were obtained from the filtered pressure–
time curve and filtered (dP/dt)-curve shown in Fig. 3 by
means of
rb Z3Vv
4p
� �1=3
1 KP0
P
� �1=g Pmax KP
Pmax KP0
� �1=3
; (9)
which is identical to Eq. (18) for the position of the flame,
and its derivative with respect to time
_rb Zd_rb
dtZ
v_rb
vP
dP
dt(10)
_rb Z1
3ðPmax KP0Þ
3Vv
4p
� �1=3
1KP0
P
� �1=g Pmax KP
Pmax KP0
� �Kð2=3Þ
! 1C1
gP
� �P0
P
� �1=g dP
dt: ð11Þ
The time increment in Eq. (8) was equal to the reciprocal
value of the sample-rate (64 kHz) used to measure the
experimental pressure curve. If these fluid particles would
suddenly lose their motion to become static, the result would
be a pressure disturbance of a magnitude of at most
ð1=2Þru _r2bðtÞ. However, with an assumed value of 1 kg mK3
for ru, and the velocities shown in the right-middle part of
Fig. 4 the resulting pressure oscillations are negligible. This
situation becomes different when particle velocities are
induced by the combustion of fluid layers closer to the wall.
Combusting fluid layers closer to wall induce a
displacement velocity in the burnt mixture, directed towards
the center. This reversal of the particle velocity within the
burnt mixture is caused by the fact that the gas adjacent to
the wall expands by a factor of nearly six into the direction
of the center. The magnitude of this velocity may be
estimated from the observation that, when the flame surface
is idealized to an impermeable wall that compresses the
burnt mixture with a certain velocity, the ratio of the mass
contained between the flame front and the surface where a
fluid particle resides, and the mass contained between the
latter and the vessel wall (see the upper-right part of Fig. 4)
remains constant:
43
prb½r3bðtÞKr3ðtÞ�
43
pru½R3v Kr3
bðtÞ�C 43
prb½r3bðtÞKr3ðtÞ�
Z constant: (12)
Differentiation with respect to time, and repeating the
steps shown by Eqs. (3)–(6)
½ðru=rbÞ½R3v Kr3
bðtÞ�C ½r3bðtÞKr3ðtÞ��½r3
bðtÞKr3ðtÞ�0
K ½r3bðtÞKr3ðtÞ�½ðru=rbÞ½R
3v Kr3
bðtÞ�
C ½r3bðtÞKr3ðtÞ��0 Z 0 ð13Þ
5 ½ðru=rbÞ½R3v Kr3
bðtÞ�C ½r3bðtÞKr3ðtÞ��½3r2
bðtÞ_rbðtÞ
K3r2ðtÞ_rðtÞ�K ½r3bðtÞKr3ðtÞ�½K3ðru=rbÞr
2bðtÞ_rbðtÞ
C3r2bðtÞ_rbðtÞK3r2ðtÞ_rðtÞ� Z 0 ð14Þ
5R3vr2ðtÞ_rðtÞKR3
vr2bðtÞ_rbðtÞKr3
bðtÞr2ðtÞ_rðtÞ
Cr3ðtÞr2bðtÞ_rbðtÞ Z 0 (15)
5r2ðtÞ½R3v Kr3
bðtÞ�_rðtÞ Z r2bðtÞ½R
3v Kr3ðtÞ�_rbðtÞ; (16)
again leads to Eq. (7). According to this result, the
displacement velocity of a fluid particle increases progress-
ively as the distance from the center becomes less, and
would become infinitely large for a fluid particle residing at
the center. The solution of Eq. (7) for the situation depicted
by the upper-right part of Fig. 4, with rb(t)Z33.0 mm
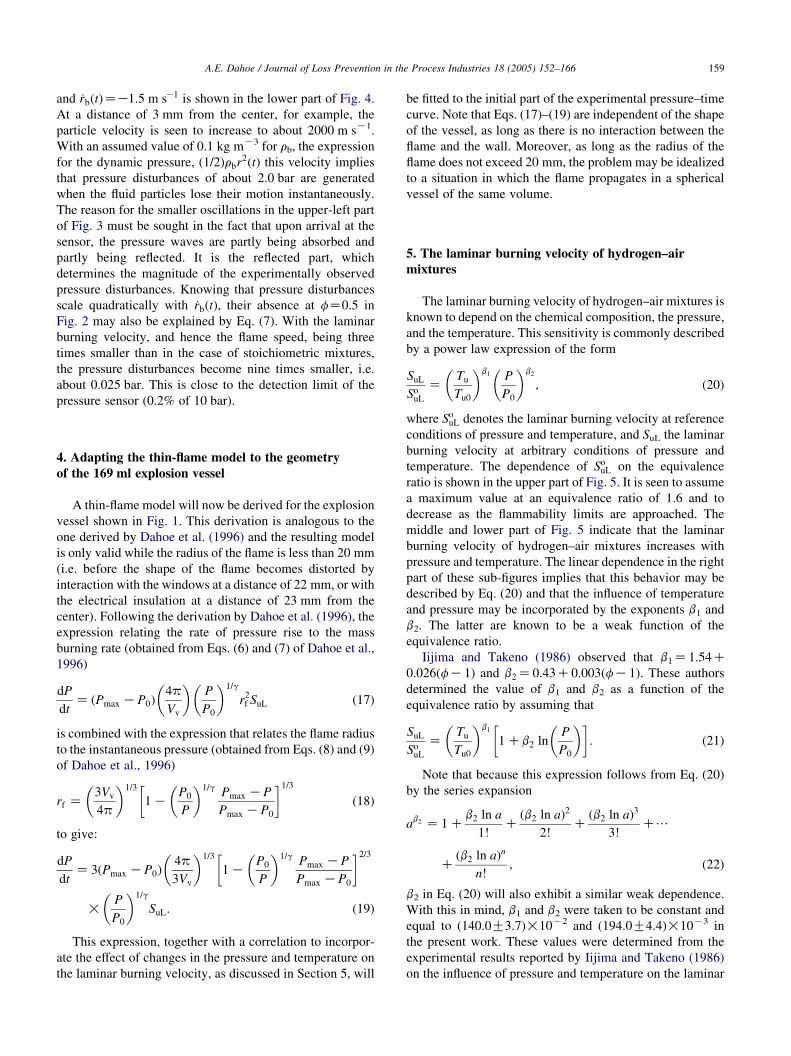
A.E. Dahoe / Journal of Loss Prevention in the Process Industries 18 (2005) 152–166 159
and _rbðtÞZK1:5 m sK1 is shown in the lower part of Fig. 4.
At a distance of 3 mm from the center, for example, the
particle velocity is seen to increase to about 2000 m sK1.
With an assumed value of 0.1 kg mK3 for rb, the expression
for the dynamic pressure, ð1=2Þrbr2ðtÞ this velocity implies
that pressure disturbances of about 2.0 bar are generated
when the fluid particles lose their motion instantaneously.
The reason for the smaller oscillations in the upper-left part
of Fig. 3 must be sought in the fact that upon arrival at the
sensor, the pressure waves are partly being absorbed and
partly being reflected. It is the reflected part, which
determines the magnitude of the experimentally observed
pressure disturbances. Knowing that pressure disturbances
scale quadratically with _rbðtÞ, their absence at fZ0.5 in
Fig. 2 may also be explained by Eq. (7). With the laminar
burning velocity, and hence the flame speed, being three
times smaller than in the case of stoichiometric mixtures,
the pressure disturbances become nine times smaller, i.e.
about 0.025 bar. This is close to the detection limit of the
pressure sensor (0.2% of 10 bar).
4. Adapting the thin-flame model to the geometry
of the 169 ml explosion vessel
A thin-flame model will now be derived for the explosion
vessel shown in Fig. 1. This derivation is analogous to the
one derived by Dahoe et al. (1996) and the resulting model
is only valid while the radius of the flame is less than 20 mm
(i.e. before the shape of the flame becomes distorted by
interaction with the windows at a distance of 22 mm, or with
the electrical insulation at a distance of 23 mm from the
center). Following the derivation by Dahoe et al. (1996), the
expression relating the rate of pressure rise to the mass
burning rate (obtained from Eqs. (6) and (7) of Dahoe et al.,
1996)
dP
dtZ ðPmax KP0Þ
4p
Vv
� �P
P0
� �1=g
r2f SuL (17)
is combined with the expression that relates the flame radius
to the instantaneous pressure (obtained from Eqs. (8) and (9)
of Dahoe et al., 1996)
rf Z3Vv
4p
� �1=3
1 KP0
P
� �1=g Pmax KP
Pmax KP0
� �1=3
(18)
to give:
dP
dtZ 3ðPmax KP0Þ
4p
3Vv
� �1=3
1 KP0
P
� �1=g Pmax KP
Pmax KP0
� �2=3
!P
P0
� �1=g
SuL: ð19Þ
This expression, together with a correlation to incorpor-
ate the effect of changes in the pressure and temperature on
the laminar burning velocity, as discussed in Section 5, will
be fitted to the initial part of the experimental pressure–time
curve. Note that Eqs. (17)–(19) are independent of the shape
of the vessel, as long as there is no interaction between the
flame and the wall. Moreover, as long as the radius of the
flame does not exceed 20 mm, the problem may be idealized
to a situation in which the flame propagates in a spherical
vessel of the same volume.
5. The laminar burning velocity of hydrogen–airmixtures
The laminar burning velocity of hydrogen–air mixtures is
known to depend on the chemical composition, the pressure,
and the temperature. This sensitivity is commonly described
by a power law expression of the form
SuL
SouL
ZTu
Tu0
� �b1 P
P0
� �b2
; (20)
where SouL denotes the laminar burning velocity at reference
conditions of pressure and temperature, and SuL the laminar
burning velocity at arbitrary conditions of pressure and
temperature. The dependence of SouL on the equivalence
ratio is shown in the upper part of Fig. 5. It is seen to assume
a maximum value at an equivalence ratio of 1.6 and to
decrease as the flammability limits are approached. The
middle and lower part of Fig. 5 indicate that the laminar
burning velocity of hydrogen–air mixtures increases with
pressure and temperature. The linear dependence in the right
part of these sub-figures implies that this behavior may be
described by Eq. (20) and that the influence of temperature
and pressure may be incorporated by the exponents b1 and
b2. The latter are known to be a weak function of the
equivalence ratio.
Iijima and Takeno (1986) observed that b1Z1:54C0:026ðfK1Þ and b2Z0:43C0:003ðfK1Þ. These authors
determined the value of b1 and b2 as a function of the
equivalence ratio by assuming that
SuL
SouL
ZTu
Tu0
� �b1
1 Cb2 lnP
P0
� �� �: (21)
Note that because this expression follows from Eq. (20)
by the series expansion
ab2 Z 1 Cb2 ln a
1!C
ðb2 ln aÞ2
2!C
ðb2 ln aÞ3
3!C/
Cðb2 ln aÞn
n!; (22)
b2 in Eq. (20) will also exhibit a similar weak dependence.
With this in mind, b1 and b2 were taken to be constant and
equal to (140.0G3.7)!10K2 and (194.0G4.4)!10K3 in
the present work. These values were determined from the
experimental results reported by Iijima and Takeno (1986)
on the influence of pressure and temperature on the laminar
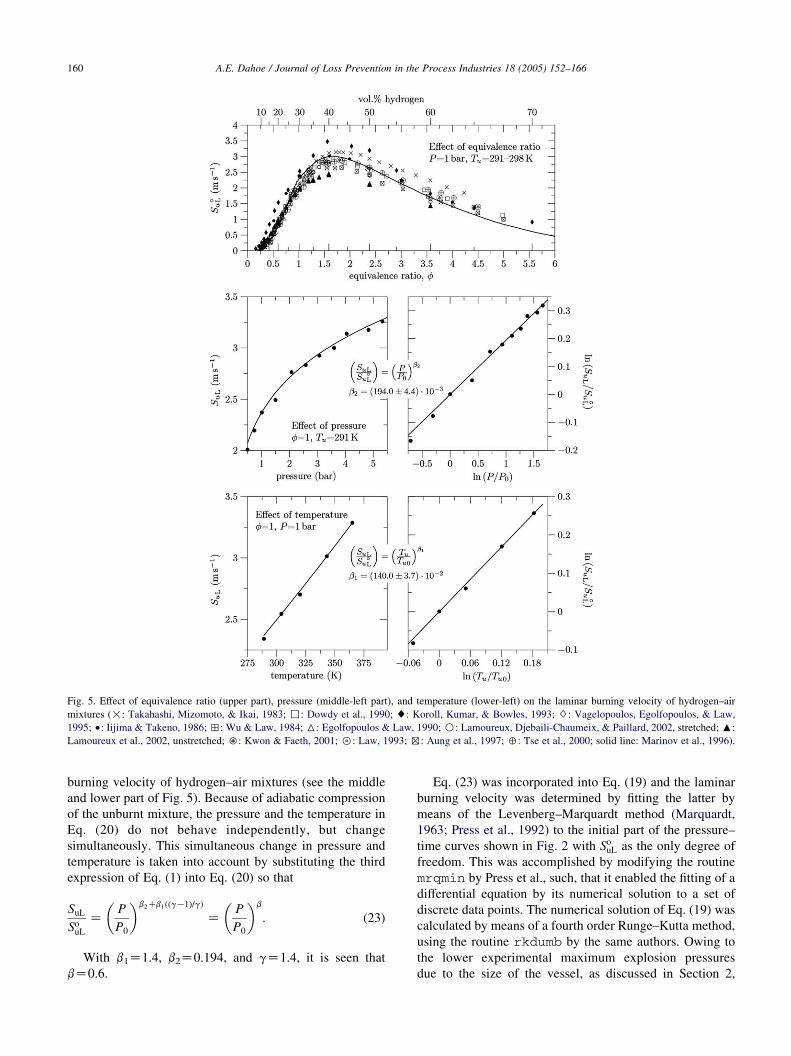
Fig. 5. Effect of equivalence ratio (upper part), pressure (middle-left part), and temperature (lower-left) on the laminar burning velocity of hydrogen–air
mixtures (!: Takahashi, Mizomoto, & Ikai, 1983; ,: Dowdy et al., 1990; %: Koroll, Kumar, & Bowles, 1993; $: Vagelopoulos, Egolfopoulos, & Law,
1995; †: Iijima & Takeno, 1986; ?: Wu & Law, 1984; 6: Egolfopoulos & Law, 1990; B: Lamoureux, Djebaili-Chaumeix, & Paillard, 2002, stretched; ::
Lamoureux et al., 2002, unstretched; ;: Kwon & Faeth, 2001; 0: Law, 1993; @: Aung et al., 1997; 4: Tse et al., 2000; solid line: Marinov et al., 1996).
A.E. Dahoe / Journal of Loss Prevention in the Process Industries 18 (2005) 152–166160
burning velocity of hydrogen–air mixtures (see the middle
and lower part of Fig. 5). Because of adiabatic compression
of the unburnt mixture, the pressure and the temperature in
Eq. (20) do not behave independently, but change
simultaneously. This simultaneous change in pressure and
temperature is taken into account by substituting the third
expression of Eq. (1) into Eq. (20) so that
SuL
SouL
ZP
P0
� �b2Cb1ððgK1Þ=gÞ
ZP
P0
� �b
: (23)
With b1Z1.4, b2Z0.194, and gZ1.4, it is seen that
bZ0.6.
Eq. (23) was incorporated into Eq. (19) and the laminar
burning velocity was determined by fitting the latter by
means of the Levenberg–Marquardt method (Marquardt,
1963; Press et al., 1992) to the initial part of the pressure–
time curves shown in Fig. 2 with SouL as the only degree of
freedom. This was accomplished by modifying the routine
mrqmin by Press et al., such, that it enabled the fitting of a
differential equation by its numerical solution to a set of
discrete data points. The numerical solution of Eq. (19) was
calculated by means of a fourth order Runge–Kutta method,
using the routine rkdumb by the same authors. Owing to
the lower experimental maximum explosion pressures
due to the size of the vessel, as discussed in Section 2,
A.E. Dahoe / Journal of Loss Prevention in the Process Industries 18 (2005) 152–166 161
and the uncertainty introduced by the oscillations in the
experimental pressure–time curve, the theoretical values
shown in the middle of Fig. 2 have been used for Pmax in
Eq. (19). To minimize modification of the laminar burning
velocity by flame curvature and flame acceleration due to
excessive spark ignition energies in the initial stage of the
explosions, and to avoid flame–wall interaction, Eq. (19)
was fitted to the early part of the pressure–time curves where
the pressure changed from 1.15 to 1.3 bar. It may be verified
by means of Eq. (18) that with all equivalence ratios, the
flame radius varies between 15 and 20 mm when the
pressure changes between 1.15 and 1.3 bar. This is indicated
by the shaded region in the left part of Fig. 1. The
correspondence between the solution of Eq. (19) and the
experimental data is illustrated by the middle-left and
lower-left part of Fig. 6.
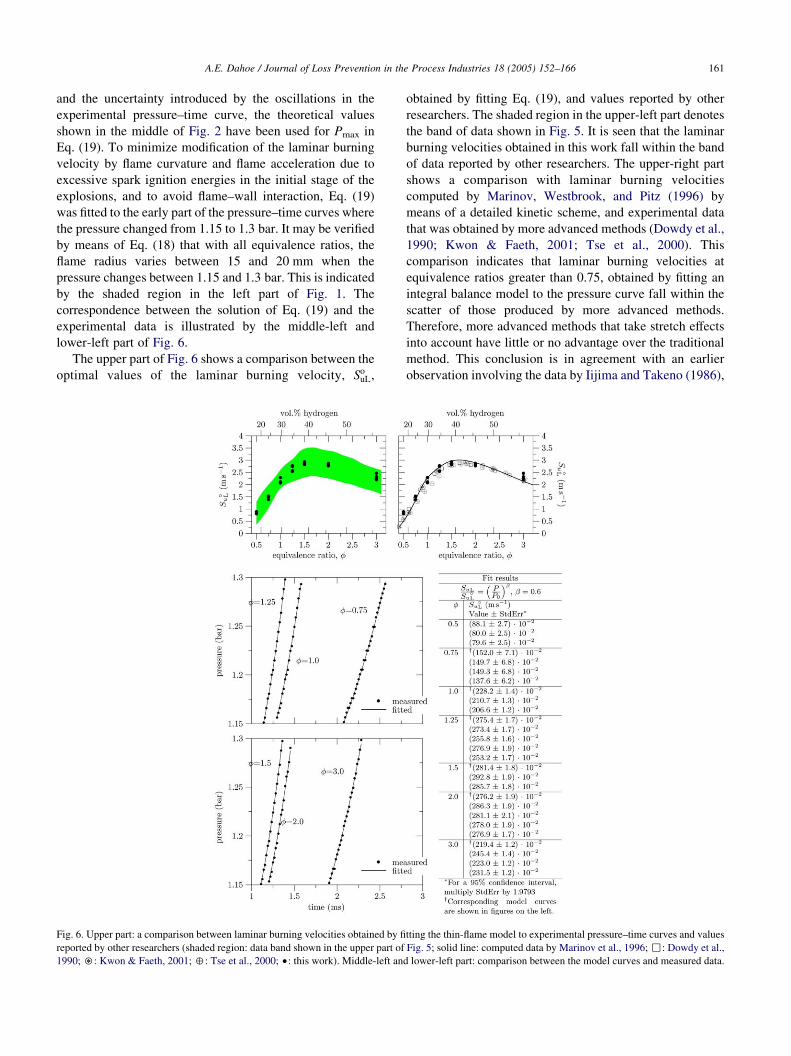
The upper part of Fig. 6 shows a comparison between the
optimal values of the laminar burning velocity, SouL,
Fig. 6. Upper part: a comparison between laminar burning velocities obtained by fi
reported by other researchers (shaded region: data band shown in the upper part of
1990; ;: Kwon & Faeth, 2001; 4: Tse et al., 2000; †: this work). Middle-left an
obtained by fitting Eq. (19), and values reported by other
researchers. The shaded region in the upper-left part denotes
the band of data shown in Fig. 5. It is seen that the laminar
burning velocities obtained in this work fall within the band
of data reported by other researchers. The upper-right part
shows a comparison with laminar burning velocities
computed by Marinov, Westbrook, and Pitz (1996) by
means of a detailed kinetic scheme, and experimental data
that was obtained by more advanced methods (Dowdy et al.,
1990; Kwon & Faeth, 2001; Tse et al., 2000). This
comparison indicates that laminar burning velocities at
equivalence ratios greater than 0.75, obtained by fitting an
integral balance model to the pressure curve fall within the
scatter of those produced by more advanced methods.
Therefore, more advanced methods that take stretch effects
into account have little or no advantage over the traditional
method. This conclusion is in agreement with an earlier
observation involving the data by Iijima and Takeno (1986),
tting the thin-flame model to experimental pressure–time curves and values
Fig. 5; solid line: computed data by Marinov et al., 1996; ,: Dowdy et al.,
d lower-left part: comparison between the model curves and measured data.

A.E. Dahoe / Journal of Loss Prevention in the Process Industries 18 (2005) 152–166162
as discussed in Section 1. The laminar burning velocity at an
equivalence ratio of 0.5 is larger than the stretch-corrected
ones, but still close enough to the latter to be suitable as a
conservative input for the assessment of accidental
combustion hazards.
The absence of a significant advantage by more advanced
methods that take flame stretch into account over the
traditional method employed in the present work with fuel-
rich mixtures, and the consistently higher laminar burning
velocities produced by the latter with fuel-lean mixtures,
deserve some further clarification. It has been observed
experimentally that flames develop into wrinkled structures
when the limiting reactant in a combustible mixture is also
the more mobile constituent. This phenomenon is known to
begin with flame cracking, followed by a further develop-
ment into a cellular structure (Bradley, 1999; Bradley,
Cresswell, & Puttock, 2001; Bradley & Harper, 1994;
Bradley, Hicks, Lawes, Sheppard, & Woolley, 1998;
Bradley, Sheppard, Woolley, Greenhalgh, & Lockett,
2000; Groff, 1982; Gu, Haq, Lawes, & Woolley, 2000;
Haq, Sheppard, Woolley, Greenhalgh, & Lockett, 2002).
The role of the limiting reactant in cell formation is clearly
demonstrated by the work of Tse et al. (2000). These authors
presented Schlieren photographs of spark ignited spheri-
cally propagating flames in H2/O2/N2- and H2/O2/He-
mixtures, at initial conditions of 298 K and 3, 5, 20, 40,
and 60 atm. Some of these photographs are included in the
upper part of Fig. 7 to support the present discussion.
Pictures of H2/O2/N2-flames at equivalence ratios of 0.70
and 2.25 (ignited at 3 and 5 atm), 0.85 and 1.50 (ignited at
20 atm), and 3.5 (ignited at 40 and 60 atm), and of H2/O2/
He-flames, at equivalence ratios of 0.70 and 2.25 (ignited at
3 and 5 atm), 0.85 and 1.50 (ignited at 20 atm), and 0.70
(ignited at 40 and 60 atm), were presented. With H2/O2/
N2-flames, it may be observed that, when the equivalence
ratio is less than unity, and hence the more mobile
constituent becomes the limiting reactant, the flame surface
is initially distorted by large-scale wrinkles that originate
from system perturbations, and subsequently by wrinkles
of an ever decreasing size, down to a magnitude in the order
of the laminar flame thickness (see the lower-right part of
Fig. 7). When the equivalence ratio is greater than unity, H2/
O2/N2-flames appear to be free of wrinkles at low pressure
(e.g. at 3 atm), and contain only large-scale wrinkles arising
from system perturbations at higher pressures (e.g. 5, 20, 40,
and 60 atm). No cascade of wrinkles from large to small-
scale appears to be present during the growth of the flame.
With H2/O2/He-flames (i.e. with N2 being replaced by He,
the limiting reactant can no longer be the more mobile one),
this cascade of wrinkles turns out to be absent for all
equivalence ratios and only large-scale wrinkles are seen to
evolve at higher pressures (e.g. 20, 40, and 60 atm).
The development of a flame surface into a wrinkled
structure causes the true laminar burning velocity, SuL, to
deviate from the unstretched laminar burning velocity, S*uL,
i.e. the magnitude it would have if the flame were planar.
This modification is caused by two distinct, but invariably
coupled effects, namely, the effect of flame curvature
(see the middle-right part of Fig. 7) and the effect of flame
stretch (see the lower-left part of Fig. 7). When a flame is
bulged into concavity with respect to the unburnt mixture,
heat which is initially conducted into the unburnt mixture, is
subsequently convected to parts of the flame closer to the
center. This process enhances the laminar burning velocity
at the center and reduces the laminar burning velocity at the
lateral parts of the flame. When the flame is convex with
respect to the unburnt mixture, the opposite happens: heat is
conducted into the unburnt mixture and convected away
from the center. This reduces the laminar burning velocity at
the center and increases the laminar burning velocity of the
lateral parts. The presence of a wrinkled flame causes the
flow-field of the approaching unburnt mixture to become
non-uniform. Because of the non-zero velocity gradients in
the unburnt mixture, fluid elements approaching a wrinkled
flame are no longer the same as those approaching a planar
flame. As illustrated by lower-left part of Fig. 5, fluid
elements, respectively, undergo compression or stretch,
prior to being consumed by a concave or convex flame
surface. The compression of fluid elements enhances the
laminar burning velocity due to the increase in the mass
flow of reactants entering the flame per unit area. The
stretching of fluid elements reduces the mass flow of
reactants into the flame, and hence the laminar burning
velocity. To cope with this situation, various researchers
have attempted to establish relationships between the true
laminar burning velocity of a wrinkled flame and the
unstretched laminar burning velocity. To support the present
discussion, Eq. (13) by Dahoe, Hanjalic, and Scarlett (2002)
is quoted here as an example:
SuL Z Ls½nn : Vv KV$v�C ½1 KLcV$n�S*uL
Z Ls½nn : Vv KV,v�C 1 CLc
R
� �S*
uL (24)
The reader may consult Dahoe et al. (2002) and
references cited therein for further information on its origin
and motivation. In this equation, nn: VvKV$v denotes the
stretch intensity, R the local radius of curvature, Ls the
stretch Markstein length and Lc the curvature Markstein
length. The latter are proportionality constants between the
laminar burning velocity and effects due to stretch and
curvature.
Eq. (24) may be used to compare the laminar burning
velocities obtained by the traditional method, with those
obtained by more advanced methods shown in the upper-
right part of Fig. 6. When fR1.0, the more mobile
constituent of the mixture is no longer the limiting reactant,
and the flame surface remains smooth. With stretch effects
due to velocity gradients being small, and the radius of
curvature (i.e. 15 mm%R%20 mm) being much larger than
the curvature Markstein length (this is known to be in
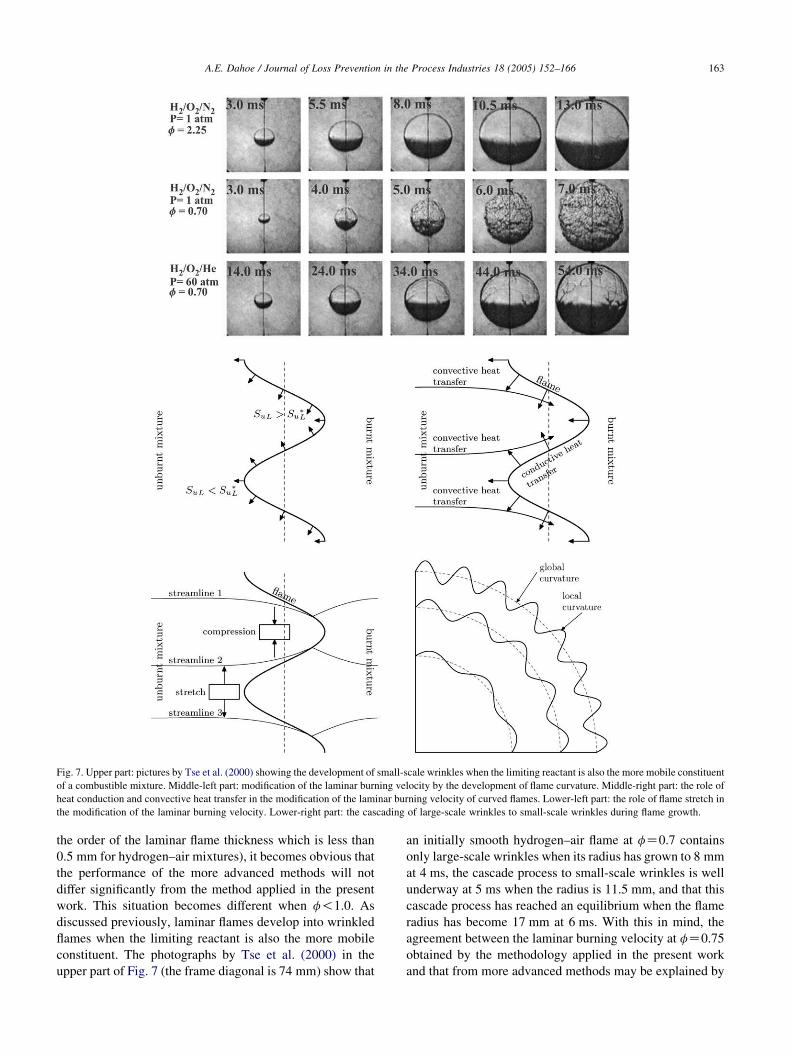
Fig. 7. Upper part: pictures by Tse et al. (2000) showing the development of small-scale wrinkles when the limiting reactant is also the more mobile constituent
of a combustible mixture. Middle-left part: modification of the laminar burning velocity by the development of flame curvature. Middle-right part: the role of
heat conduction and convective heat transfer in the modification of the laminar burning velocity of curved flames. Lower-left part: the role of flame stretch in
the modification of the laminar burning velocity. Lower-right part: the cascading of large-scale wrinkles to small-scale wrinkles during flame growth.
A.E. Dahoe / Journal of Loss Prevention in the Process Industries 18 (2005) 152–166 163
the order of the laminar flame thickness which is less than
0.5 mm for hydrogen–air mixtures), it becomes obvious that
the performance of the more advanced methods will not
differ significantly from the method applied in the present
work. This situation becomes different when f!1.0. As
discussed previously, laminar flames develop into wrinkled
flames when the limiting reactant is also the more mobile
constituent. The photographs by Tse et al. (2000) in the
upper part of Fig. 7 (the frame diagonal is 74 mm) show that
an initially smooth hydrogen–air flame at fZ0.7 contains
only large-scale wrinkles when its radius has grown to 8 mm
at 4 ms, the cascade process to small-scale wrinkles is well
underway at 5 ms when the radius is 11.5 mm, and that this
cascade process has reached an equilibrium when the flame
radius has become 17 mm at 6 ms. With this in mind, the
agreement between the laminar burning velocity at fZ0.75
obtained by the methodology applied in the present work
and that from more advanced methods may be explained by
A.E. Dahoe / Journal of Loss Prevention in the Process Industries 18 (2005) 152–166164
arguing that the flame surface does not contain sufficient
small-scale wrinkles when the flame radius is between 15
and 20 mm. It is emphasized, however, that photographs of
the flame morphology at fZ0.75 are needed to verify this
argument. Following the same reasoning, the higher laminar
burning velocity at fZ0.5 is easily explained. Based on the
observations by Tse et al. (2000), it is obvious that the flame
surface at fZ0.5 consists of small-scale wrinkles when the
flame radius is between 15 and 20 mm. In this situation, the
application of Eq. (19) boils down to evaluating the product
of a wrinkled flame surface and the true laminar burning
velocity as the product of a smooth spherical flame surface
area coinciding with the global flame curvature (see the
lower-right part of Fig. 7) and a surface averaged laminar
burning velocity. While a surface averaged laminar burning
velocity would make sense because crests in the flame
surface are compensated by troughs, this idealization does
not take the increase in flame surface area due to flame
wrinkling into account. This deficiency leads to a higher
laminar burning velocity.
6. Conclusions
Laminar burning velocities of hydrogen–air mixtures
were determined from closed vessel gas explosions. Initially
quiescent mixtures were ignited in a 169 ml vessel, the
pressure was measured as a function of time, and an integral
balance model (i.e. Eq. (19)) was fitted to the experimental
pressure–time curve to extract the laminar burning velocity.
The equivalence ratio varied from 0.5 to 3.0, and all
experiments were conducted at initial conditions of 1 bar
and 293 K. Inaccuracies due to the flame curvature and
flame acceleration caused by excessive spark ignition
energies in the initial stage of the explosions, as well as
those arising from flame–wall interaction, were avoided by
using only the part of the pressure–time curves between 1.15
and 1.3 bar (see the middle-left and lower-left part of
Fig. 6). A correlation for the effect of pressure and
temperature on the laminar burning velocity (i.e. Eq. (20))
was incorporated into the integral balance model to avoid
further inaccuracies caused by changes in the thermodyn-
amic of the unburnt mixture in the course of the explosions.
The resulting laminar burning velocities were subsequently
compared with those reported in the literature. The
conclusions arising from this comparison are as follows:
†
Laminar burning velocities of fuel-rich mixturesobtained by the methodology followed in the present
paper are seen to fall within the scatter of data obtained
by more advanced methods that take the influence of
flame stretch into account (see the upper-right part of
Fig. 6. This observation implies that, with fuel-rich
mixtures, more advanced methods have no significant
advantage over methodologies that rely only on pressure
variations from windowless explosion vessels for the
determination of the laminar burning velocity. Moreover,
with fuel-rich mixtures, the cost-benefit balance is in
favor of the latter.
†
Laminar burning velocities of fuel-lean mixtures are seento be consistently higher, but at the same time close
enough to the ones obtained by more advanced methods.
Because of this, they may be considered as acceptable
conservative estimates of the laminar burning velocity
for engineering calculations that form the design basis
for fire and explosion safety.
The pressure–time curves of hydrogen–air mixtures are
seen to exhibit pressure oscillations (see Fig. 2), which are
absent when methane–air mixtures for example (see Fig. 6
by Dahoe & de Goey, 2003), are ignited to deflagration at
the same initial conditions. These oscillations were
considered in Section 3, and an Eq. (7) was derived to
describe their cause. The implications of this equation are
that combusting fluid layers adjacent to the wall are
inducing particle velocities in the order of kilometers per
second which in turn give rise to pressure spikes. The
magnitude of these particle velocities is directly pro-
portional to the flame speed, quadratically proportional to
rb(t) the vessel radius, and inversely proportional to the
distance from the wall where flow reversal occurs
R3nðtÞKr3
bðtÞ. Of these three proportionalities, the last one
is the subject of most concern. For combustible mixtures
such as hydrogen–air and hydrogen–oxygen mixtures, this
last proportionality may give rise to high-pressure spikes
because of the small flame thickness. It is easy to see that the
distance from the vessel wall where flow reversal occurs,
and hence R3nðtÞKr3
bðtÞ, decreases when the flame thickness
becomes smaller. As a result, the handling of such mixtures
involves an additional safety problem which is absent with
hydrocarbon–air mixtures. This may impose a limitation on
the use of hydrogen as an energy carrier with at least the
same level of safety and comfort as with today’s fossil fuel
energy carriers.
Acknowledgements
The experiments described in this paper were conducted
by a group of undergraduate students at the Department of
Mechanical Engineering of Eindhoven University of
Technology, namely, Bram van Benthum, Jean-Pierre
Thoolen, Harrie Smetsers and Joris Wismans. The contri-
bution and the support of Philip de Goey to this work are
gratefully acknowledged.
References
Agnew, J. T., & Graiff, L. B. (1961). The pressure dependence of laminar
burning velocity by the spherical bomb method. Combustion and
Flame, 5, 209–219.
A.E. Dahoe / Journal of Loss Prevention in the Process Industries 18 (2005) 152–166 165
Aung, K. T., Hassan, M. I., & Faeth, G. M. (1997). Flame
stretch interactions of laminar premixed hydrogen/air
flames at normal temperature and pressure. Combustion and Flame,
109, 1–24.
Aung, K. T., Hassan, M. I., & Faeth, G. M. (1998). Effects of pressure and
nitrogen dilution on flame/stretch interactions of laminar premixed
H2/O2/N2 flames. Combustion and Flame, 112, 1–15.
Babkin, V. S., Bukharov, V. N., & Molkov, V. V. (1989). Normal flame
velocity of propane–air mixtures at high pressures and temperatures.
Fizaka Goreniya i Vzryva, 25, 57–63 (English translation in Combus-
tion, Explosion and Shock Waves).
Babkin, V. S., Vyun, A. V., & Kozachenko, L. S. (1967). The determination
of burning velocity in a constant volume bomb by pressure recording.
Fizaka Goreniya i Vzryva, 3, 362–370 (English translation in
Combustion, Explosion and Shock Waves).
Bradley, D. (1999). Instabilities and flame speeds in large-scale premixed
gaseous explosions. Philosophical Transactions of the Royal Society of
London, Series A, 357, 3567–3581.
Bradley, D., Cresswell, T. M., & Puttock, J. S. (2001). Flame acceleration
due to flame-induced instabilities in large-scale explosions. Combustion
and Flame, 124, 551–559.
Bradley, D., & Harper, C. M. (1994). The development of instabilities in
laminar explosion flames. Combustion and Flame, 99, 562–572.
Bradley, D., Hicks, R. A., Lawes, M., Sheppard, C. G. W., & Woolley, R.
(1998). The measurement of laminar burning velocities and Markstein
numbers for iso-octane air and iso-octanen–heptane air mixtures at
elevated temperatures and pressures in an explosion bomb. Combustion
and Flame, 115, 126–144.
Bradley, D., Sheppard, C. G. W., Woolley, R., Greenhalgh, D. A., &
Lockett, R. D. (2000). The development and structure of flame
instabilities and cellularity at low Markstein numbers in explosions.
Combustion and Flame, 122, 195–209.
Brown, M. J., McLean, I. C., Smith, D. B., & Taylor, S. C. (1996).
Markstein lengths of CO/H2/air flames using expanding spherical
flames. Twenty-sixth symposium (international) on combustion. (pp.
875–881). Pittsburgh, PA: The Combustion Institute.
Cashdollar, K. L., Zlochower, I. A., Green, G. M., Thomas, R. A., &
Hertzberg, M. (2000). Flammability of methane, propane, and hydrogen
gases. Journal of Loss Prevention in the Process Industries, 13, 327–
340.
Clarke, A., Stone, R., & Beckwith, P. (2001). Measurement of the laminar
burning velocity of n-butane and isobutane mixtures under micro-
gravity conditions in a constant volume vessel. Journal of the Institute
of Energy, 74, 70–76.
Dahoe, A. E., & de Goey, L. P. H. (2003). On the determination of the
laminar burning velocity from closed vessel gas explosions. Journal of
Loss Prevention in the Process Industries, 16, 457–478.
Dahoe, A. E., Hanjalic, K., & Scarlett, B. (2002). Determination of the
laminar burning velocity and the Markstein length of powder-air flames.
Powder Technology, 22, 222–238.
Dahoe, A. E., Zevenbergen, J. F., Lemkowitz, S. M., & Scarlett, B. (1996).
Dust explosions in spherical vessels: The role of flame thickness in the
validity of the ‘cube-root-law’. Journal of Loss Prevention in the
Process Industries, 9, 33–44.
Dowdy, D. R., Smith, D. B., Taylor, S. C., & Williams, A. (1990). The use
of expanding spherical flames to determine burning velocities and
stretch effects in hydrogen–air mixtures. Twenty-third symposium
(international) on combustion. (pp. 325–332). Pittsburgh, PA: The
Combustion Institute.
Egolfopoulos, F. N., & Law, C. K. (1990). An experimental and
computational study of the burning rates of ultra-lean to moderately
rich H2/O2/N2 laminar flames with pressure variations. Twenty-third
symposium (international) on combustion. (pp. 333–346). Pittsburgh,
PA: The Combustion Institute.
Garforth, A. M., & Rallis, C. J. (1976). Gas movement during flame
propagation in a constant volume bomb. Acta Astronautica, 3, 879–888.
Groff, E. G. (1982). The cellular nature of confined spherical propane–air
flames. Combustion and Flame, 48, 51–62.
Gu, X. J., Haq, M. Z., Lawes, M., & Woolley, R. (2000). Laminar burning
velocities and Markstein lengths of methane–air mixtures. Combustion
and Flame, 121, 41–58.
Halstead, M. P., Pye, D. B., & Quinn, C. P. (1974). Laminar burning
velocities and weak flammability limits under engine-like conditions.
Combustion and Flame, 22, 89–97.
Haq, M. Z., Sheppard, C. G. W., Woolley, R., Greenhalgh, D. A., &
Lockett, R. D. (2002). Wrinkling and curvature of laminar and turbulent
premixed flames. Combustion and Flame, 131, 1–15.
Hassan, M. I., Aung, K. T., & Faeth, G. M. (1997). Properties of laminar
premixed CO/H2/air flames at various pressures. Journal of Propulsion
and Power, 13, 239–245.
Hassan, M. I., Aung, K. T., & Faeth, G. M. (1998). Measured and predicted
properties of laminar premixed methane/air flames at various pressures.
Combustion and Flame, 115, 539–550.
Iijima, T., & Takeno, T. (1986). Effects of temperature and pressure on
burning velocity. Combustion and Flame, 12, 445–452.
Koroll, G. W., Kumar, R. K., & Bowles, E. M. (1993). Burning
velocities of hydrogen–air mixtures. Combustion and Flame, 94,
330–340.
Kwon, O. C., & Faeth, G. M. (2001). Flame/stretch interactions of
premixed hydrogen-fueled flames: Measurements and predictions.
Combustion and Flame, 124, 590–610.
Kwon, O. C., Tseng, L.-K., & Faeth, G. M. (1992).
Laminar burning velocities and transition to unstable flames in
H2/O2/N2 and C2H8/O2/N2 mixtures. Combustion and Flame, 90,
230–246.
Lamoureux, N., Djebaili-Chaumeix, N., & Paillard, C. E. (2002). Laminar
flame velocity determination for H2–air–steam mixtures using the
spherical bomb method. Journal de Physique de France IV, 12, 445–
452.
Law, C. K. (1993). A compilation of experimental data on laminar burning
velocities. In N. Peters, & B. Rogg (Eds.), Reduced kinetic mechanisms
for applications in combustion systems (pp. 15–26). Berlin: Springer,
15–26.
Law, C. K., Zhu, D. L., & Yu, G. (1988). Propagation and extinction of
stretched premixed flames. Proceedings of the 21st symposium
(international) on combustion. (pp. 1419–1426). Pittsburgh, PA: The
Combustion Institute.
Lewis, B., & von Elbe, G. (1961). Combustion, flames and explosions of
gases (2nd ed). New York: Academic Press.
Marinov, N. M., Westbrook, C. K., & Pitz, W. J. (1996). Detailed and
global chemical kinetics model for hydrogen. In S. H. Chan, Transport
phenomena in combustion (Vol. 1) (pp. 118–129). Washington, DC:
Taylor & Francis.
Marquardt, D.W. (1963). An algorithm for least squares estimation
of nonlinear parameters. SIAM Journal on Applied Mathematics, 11,
431–441.
Metghalchi, M., & Keck, J. C. (1980). Laminar burning velocity of
propane–air mixtures at high temperature and pressure. Combustion
and Flame, 38, 143–154.
Metghalchi, M., & Keck, J. C. (1982). Burning velocities of mixtures of air
with methanol, isooctane, and indolene at high pressure and
temperature. Combustion and Flame, 48, 191–210.
Milton, B. E., & Keck, J. C. (1984). Laminar burning velocities in
stoichiometric hydrogen and hydrogen–hydrocarbon gas mixtures.
Combustion and Flame, 58, 13–22.
Molkov, V. V., & Nekrasov, V. P. (1981). Normal propagation velocity of
acetone–air flames versus pressure and temperature. Fizaka Goreniya i
Vzryva, 17, 45–49 (English translation in Combustion, Explosion and
Shock Waves).
Press, W. H., Teukolsky, S. A., Vetterling, W. T., & Flannery, B. P. (1992).
Numerical recipes in PASCAL. The art of scientific computing (2nd
ed.). Cambridge: Cambridge University Press.
A.E. Dahoe / Journal of Loss Prevention in the Process Industries 18 (2005) 152–166166
Rallis, J. C., Garforth, A. M., & Steinz, J. A. (1965). Laminar burning
velocity of acetylene–air mixtures by the constant-volume method.
Combustion and Flame, 9, 345–356.
Savitzky, A., & Golay, M. J. E. (1964). Smoothing and differentiation of
data by simplified least squares procedures. Analytical Chemistry, 36,
1627–1639.
Takahashi, F., Mizomoto, M., & Ikai, S. (1983). Alternative energy sources
III. In T. Nejat Veziroglu, Nuclear energy/synthetic fuels (Vol. 5) (pp.
447–457). New York: McGraw-Hill.
Tse, S. D., Zhu, D. L., & Law, C. K. (2000). Morphology and burning rates
of expanding spherical flames in H2/O2/inert mixtures up to 60
atmospheres. Proceedings of the 28th symposium (international) on
combustion. (pp. 1793–1800). Pittsburgh, PA: The Combustion
Institute.
Tseng, L.-K., Ismail, M. A., & Faeth, G. M. (1993). Laminar burning
velocities and Markstein numbers of hydrocarbon/air flames. Combus-
tion and Flame, 95, 410–426.
Vagelopoulos, C. M., Egolfopoulos, F. N., & Law, C. K. (1995). Further
considerations on the determination of laminar flame speeds from
stretched flames. Proceedings of the 25th symposium (international) on
combustion. (pp. 1341–1347). Pittsburgh, PA: The Combustion Institute.
Wu, C. K., & Law, C. K. (1984). On the determination of laminar flame
speeds from stretched flames. Proceedings of the 20th symposium
(international) on combustion. (pp. 1941–1949). Pittsburgh, PA: The
Combustion Institute.
Yu, G., Law, C. K., & Wu, C. K. (1986). Laminar flame speeds of
hydrocarbonCair mixtures with hydrogen addition. Combustion and
Flame, 63, 339–347.
Zhu, D. L., Egolfopoulos, F. N., & Law, C. K. (1989). Experimental
and numerical determination of laminar flame speeds of methane/(Ar, N2,
CO2)–air mixtures as function of stoichiometry, pressure, and
flame temperature. Proceedings of the 22nd symposium (international)
on combustion. (pp. 1537–1545). Pittsburgh, PA: The Combustion
Institute.