lamond phdthesis
DESCRIPTION
Uploaded from Google DocsTRANSCRIPT

THE IMPACT OF FLOODING ON THE VALUE OF RESIDENTIAL PROPERTY IN THE UK
by Jessica Elizabeth Lamond
A thesis submitted in partial fulfilment of the requirements of the University
of Wolverhampton for the degree of Doctor of Philosophy (PhD)
January 2008
This work or any part thereof has not previously been submitted in any form to the University or to any other body whether for the purpose of assessment,
publication or for any other purpose. Save for any express acknowledgements, references and/or bibliographies cited in the work, I confirm that the intellectual
content of the work is the result of my own efforts and no other person.
The right of Jessica Elizabeth Lamond to be identified as author of this work is asserted in accordance with ss. 77 and 78 of Copyright, Designs and Patents Act
1988. At this date copyright is owned by the author.
Signature…………………………………… Date………………………………………….

ii
ABSTRACT
Flooding of residential property is a real and growing phenomenon in the UK causing
short and long-term detriment of various kinds to its victims. The issue of potential
decrease in value of those properties which are located on the floodplain, though much
discussed in the media, has received scant attention in the UK research literature. An
extensive literature survey has revealed a need for methodological innovation in the
field of temporal impact of flooding and the inadequacy of the current paradigms for
inclusion of insurance into flood modelling. A wide-ranging review of data sources,
including discussion with industry experts, has identified the requirement to generate
primary data on the availability and cost of flood insurance.
A novel framework has been developed for this research. This framework is an
extension of the recent research in flood modelling and incorporates ideas from the
wider house price analysis literature. Data collected via a questionnaire survey of
householders has been combined with secondary data on property prices and flood
designation in order to attribute any loss in property value to the correct vector of
underlying flood status.
The output from this study makes a contribution to the understanding of the impact of
flooding on house prices, allowing for better valuation advice. Empirical findings are
that the understandable concerns of residential property owners at risk of flooding
regarding long term loss of property value are largely unfounded. Price discounts are
observed for some recently flooded areas but they are temporary Improved
appreciation of the impact of claims and flood risk on the cost of insurance has also
emerged. The insurance market was not found to be instrumental in reducing the price
of property.
The output from the study also makes a methodological contribution in extending
concepts relating to the relationship between flooding, insurance and house prices.
This development is anticipated to facilitate refinement and updating of the empirical
findings with reduced effort in the light of future events.

iii
ACKNOWLEDGEMENTS
I am grateful to my supervisory team particularly my Director of Studies, Prof. David
Proverbs who instigated this research and believed in my ability to tackle it. He has
provided invaluable feedback on my efforts and been unfailingly positive and
supportive. I would also like to thank Dr. Adarkwah Antwi whose thoughtful input in
the early phases of the research helped shape its direction. To Dr. Felix Hammond
who stepped in to replace Dr Antwi on the latter’s departure to Ghana I am indebted
for his fresh critical perspective which has greatly improved the presentation of the
arguments.
I acknowledge the financial support of the School of Engineering and the Built
Environment, University of Wolverhampton. I am grateful to colleagues within the
school who have assisted me and asked challenging questions.
I am indebted to family and friends for their moral support and practical assistance. In
particular I am grateful to Dr. Francesca Bumpus for patiently reading every chapter,
and her advice on writing style.
I would also like to express my gratitude to those victims of flooding and other home
owners who took the time to respond to the questionnaire survey. I acknowledge the
assistance of many individuals within the Land Registry and Environment Agency who
supplied data for the research.
iv
TABLE OF CONTENTS
ABSTRACT...........................................................................................................................................II
ACKNOWLEDGEMENTS............................................................................................................... III
TABLE OF CONTENTS ................................................................................................................... IV
LIST OF FIGURES......................................................................................................................... XIII
LIST OF TABLES........................................................................................................................... XVI
CHAPTER 1 : INTRODUCTION.......................................................................................................1
1.1 INTRODUCTION ..............................................................................................................................1
1.2 RESEARCH CONTEXT AND JUSTIFICATION.....................................................................................4
1.3 STUDY AIMS ...................................................................................................................................6
1.4 RESEARCH PHILOSOPHY ................................................................................................................7
1.5 INITIAL RESEARCH STRATEGY ......................................................................................................7
1.6 OBJECTIVES OF THE STUDY............................................................................................................8
1.7 DELIMITATION OF THE STUDY .......................................................................................................9
1.8 ANTICIPATED BENEFITS OF THE STUDY .........................................................................................9
1.8.1 Methodological contribution ..............................................................................................10
1.8.2 Contribution to understanding ...........................................................................................10
1.9 ORGANISATION OF THE THESIS.....................................................................................................12
1.10 SUMMARY..................................................................................................................................13
CHAPTER 2 : FLOODING AND THE PERCEPTION OF RISK ..............................................14
2.1 INTRODUCTION ............................................................................................................................14
2.2 TYPES OF FLOODING ....................................................................................................................16
2.2.1 Coastal and estuarine flooding...........................................................................................18
2.2.2 Fluvial flooding...................................................................................................................18
2.2.3 Overland flooding ...............................................................................................................19

v
2.2.4 Failure of artificial water systems......................................................................................20
2.3 CLIMATE CHANGE AND THE INCREASE IN FLOOD RISK................................................................20
2.3.1 Climate change predictions ................................................................................................21
2.3.2 Development in the floodplain............................................................................................23
2.3.3 The role of flood defence.....................................................................................................27
2.3.4 Lifestyle factors ...................................................................................................................29
2.4 THE IMPACT OF FLOODING IN THE BUILT ENVIRONMENT...........................................................30
2.4.1 Damage to buildings ...........................................................................................................31
2.4.2 Damage repair ....................................................................................................................34
2.4.3 Indirect losses......................................................................................................................36
2.4.4 Intangible effects .................................................................................................................39
2.5 SCIENTIFIC MEASUREMENT AND PREDICTION OF FLOOD HAZARD...............................................42
2.5.1 Flood measurement.............................................................................................................42
2.5.2 Flood prediction..................................................................................................................44
2.5.3 Floodplain mapping............................................................................................................46
2.5.4 Prediction of flood impact ..................................................................................................47
2.6 PUBLIC PERCEPTION OF RISK........................................................................................................49
2.6.1 Awareness of risk ................................................................................................................49
2.6.2 Sources of information........................................................................................................50
2.6.3 Perception of risk ................................................................................................................51
2.7 ACTION OF PROPERTY OWNERS IN THE PRESENCE OF FLOOD RISK ..............................................53
2.7.1 Propensity to insure ............................................................................................................53
2.7.2 Damage avoidance strategies.............................................................................................55
2.7.3 Demands on government ....................................................................................................56
2.7.4 Buying and selling in the floodplain...................................................................................57
2.8 SUMMARY....................................................................................................................................59
CHAPTER 3 : THEORETICAL MODELS OF HOUSE PRICES ..............................................61
3.1 INTRODUCTION ............................................................................................................................61
3.2 PRICE THEORY RELATING TO HOUSING ......................................................................................62

vi
3.3 THE HOUSING MARKET WITHIN ENGLAND AND WALES..............................................................67
3.4 THE NATURE OF THE HOUSING PRODUCT ...................................................................................72
3.5 HEDONIC MODELS ........................................................................................................................76
3.6 EXPERIMENTAL OR DIRECT MARKET COMPARISON METHOD....................................................80
3.7 REPEAT SALES METHODS.............................................................................................................81
3.8 CONTINGENT VALUATION METHODS..........................................................................................84
3.9 SUMMARY....................................................................................................................................87
CHAPTER 4 : LESSONS AND FINDINGS FROM ANALYSIS OF EXTANT STUDIES......90
4.1 INTRODUCTION ......................................................................................................................90
4.2 RESULTS OF INTERNATIONAL FLOODING STUDIES.......................................................................91
4.2.1 UK findings ........................................................................................................................92
4.2.2 French study........................................................................................................................93
4.2.3 Australian findings.............................................................................................................93
4.2.4 New Zealand findings ........................................................................................................94
4.2.5 US studies...........................................................................................................................94
4.2.6 Canadian findings..............................................................................................................96
4.3 UK STUDIES OF OTHER AMENITIES AND DISAMENITIES...............................................................97
4.4 METHODOLOGICAL REVIEW OF INTERNATIONAL HOUSING STUDIES ........................................100
4.5 LESSONS DRAWN FROM PAST STUDIES.......................................................................................106
4.5.1 The time varying nature of flood response.......................................................................107
4.5.2 The impact of age of property...........................................................................................109
4.5.3 Data requirements ............................................................................................................110
4.5.4 Dealing with market inflation..........................................................................................111
4.5.5 Choice of functional form .................................................................................................112
4.5.6 Homogeneity of floodplain markets..................................................................................112
4.5.7 Collinearity .......................................................................................................................113
4.6 SUMMARY..................................................................................................................................114
CHAPTER 5 : FLOOD INSURANCE AND ITS IMPACT ON HOUSING VALUE..............117
vii
5.1 INTRODUCTION ..........................................................................................................................117
5.2 FLOOD INSURANCE REGIMES .....................................................................................................118
5.2.1 The UK regime..................................................................................................................119
5.2.2 International practices......................................................................................................120
5.3 THE UK FLOOD INSURANCE MARKET ........................................................................................121
5.3.1 The “Gentlemen’s Agreement” ........................................................................................122
5.3.2 The structure of the UK property insurance market ........................................................123
5.4 RECENT DEVELOPMENTS IN THE MARKET ................................................................................126
5.4.1 The impact of climate change...........................................................................................126
5.4.2 ABI “Statement of Principles” .........................................................................................127
5.4.3 The move to direct distribution channels .........................................................................128
5.4.4 Flood risk mapping...........................................................................................................130
5.4.5 Implications for flood risk properties...............................................................................131
5.5 INSURANCE LITERATURE RELATING TO FLOOD INSURANCE AND ITS IMPACT ON PROPERTY
VALUE ..............................................................................................................................................132
5.5.1 Arguments from utility theory...........................................................................................133
5.5.2 Decisions under uncertainty .............................................................................................134
5.5.3 Empirical studies...............................................................................................................136
5.6 PROBLEMS IN APPLYING MODELS WITHIN THE UK MARKET .....................................................138
5.6.1 Theoretical difficulties ......................................................................................................138
5.6.2 Availability of data............................................................................................................140
5.7 SUMMARY..................................................................................................................................142
CHAPTER 6 CONCEPTUAL MODEL DEVELOPMENT........................................................144
6.1 INTRODUCTION ..........................................................................................................................144
6.2 HEDONIC MODEL FOR THE UK MARKET....................................................................................145
6.3 THE REPEAT SALES SPECIFICATION FOR THE UK MARKET ........................................................147
6.4 THEORETICAL PROFILES OF FLOOD IMPACT ON PROPERTY VALUE..........................................149
6.5 HYPOTHETICAL CAUSES OF DISCOUNT DUE TO FLOOD INSURANCE PROBLEMS IN THE UK
HOUSING MARKET............................................................................................................................153

viii
6.6 THE THREE DIMENSIONAL NATURE OF FLOOD STATUS..............................................................157
6.7 DATA ISSUES FOR THE UK MARKET ..........................................................................................158
6.7.1 House price data ...............................................................................................................158
6.7.2 Descriptive housing data ..................................................................................................159
6.7.3 Insurance premium data ...................................................................................................160
6.7.4 Flood history information.................................................................................................160
6.7.5 Flood designation .............................................................................................................161
6.8 METHODOLOGICAL DEVELOPMENT ..........................................................................................162
6.8.1 A time varying specification .............................................................................................162
6.8.2 Novel framework for small sample size............................................................................165
6.8.3 Methods for dealing with three dimensional nature of flood status ................................167
6.9 SUMMARY..................................................................................................................................168
CHAPTER 7 : EMPIRICAL RESEARCH DESIGN AND METHODS ...................................170
7.1 INTRODUCTION ..........................................................................................................................170
7.2 RESEARCH STRATEGY................................................................................................................171
7.2.1 Quantitative transaction based analysis ..........................................................................171
7.2.2 Inclusion of questionnaire survey.....................................................................................172
7.2.3 Bottom-up approach .........................................................................................................172
7.2.4 Triangulation.....................................................................................................................172
7.3 THE 2000 FLOOD EVENT ............................................................................................................173
7.4 CASE STUDY SITE SELECTION ....................................................................................................175
7.5 SECONDARY DATA CAPTURE .....................................................................................................176
7.5.1 Land Registry data............................................................................................................176
7.5.2 Environment Agency data.................................................................................................179
7.5.3 Flood history information.................................................................................................180
7.6 SURVEY DESIGN ........................................................................................................................180
7.6.1 Initial design......................................................................................................................182
7.6.2 Pilot study..........................................................................................................................185
7.6.3 Revised design...................................................................................................................188

ix
7.6.4 Implementation of full study .............................................................................................190
7.7 DATA ANALYSIS AND MODEL BUILDING...........................................................................191
7.7.1 Individual site repeat sales analysis .................................................................................192
7.7.2 Insurance questionnaire analysis .....................................................................................192
7.7.3 Combined site repeat sales model ....................................................................................193
7.7.4 Truncated hedonic model..................................................................................................193
7.7.5 Analysis of variance..........................................................................................................193
7.7.6 Analysis of insurance problems at purchase....................................................................194
7.8 MODEL COMPARISON.................................................................................................................194
7.9 SUMMARY..................................................................................................................................195
CHAPTER 8 : FLOOD HISTORY AND PRICE INDEX ANALYSIS OF THE CASE STUDY
SITES...................................................................................................................................................196
8.1 INTRODUCTION ..........................................................................................................................196
8.2 MALTON AND NORTON..............................................................................................................197
8.3 WOKING.....................................................................................................................................199
8.4 SHREWSBURY.............................................................................................................................202
8.5 BEWDLEY...................................................................................................................................205
8.6 SELBY AND BARLBY ..................................................................................................................207
8.7 LEWES........................................................................................................................................210
8.8 HATTON .....................................................................................................................................214
8.9 RUTHIN ......................................................................................................................................217
8.10 MOLD.......................................................................................................................................219
8.11 NEWPORT.................................................................................................................................221
8.12 SOUTHSEA................................................................................................................................224
8.13 WEST BRIDGFORD ...................................................................................................................226
8.14 WAKEFIELD .............................................................................................................................228
8.15 SUMMARY................................................................................................................................230
CHAPTER 9 : QUESTIONNAIRE ANALYSIS ...........................................................................235

x
9.1 INTRODUCTION ..........................................................................................................................235
9.2 RESPONSE RATE AND DATA DISTRIBUTION ..............................................................................237
9.2.1 Distribution within sample locations................................................................................237
9.2.2 Comparison with national statistics .................................................................................240
9.2.3 Flood experience...............................................................................................................244
9.3 DIFFICULTY IN OBTAINING INSURANCE AND CHOICE MECHANISMS..........................................247
9.3.1 Difficulties reported on renewal or shopping around......................................................248
9.3.2 Difficulties for new residents ............................................................................................251
9.3.3 Choice of company............................................................................................................254
9.3.4 Selection mechanism.........................................................................................................255
9.4 ANALYSIS OF INABILITY TO GAIN INSURANCE...........................................................................256
9.4.1 Respondents without insurance ........................................................................................257
9.4.2 Exclusion of flood risk ......................................................................................................257
9.5 COST OF INSURANCE WITHIN THE FLOODPLAIN.........................................................................259
9.6 PERCEPTION OF RISK AND MITIGATION UNDERTAKEN BY HOMEOWNERS.................................260
9.7 CATEGORISATION OF INSURED ..................................................................................................263
9.8 SUMMARY..................................................................................................................................264
CHAPTER 10 : MODEL ESTIMATION.......................................................................................266
10.1 INTRODUCTION ........................................................................................................................266
10.2 COMBINED SITE REPEAT SALES MODEL ...................................................................................266
10.2.1 Impacts in all flood locations..........................................................................................267
10.2.2 Impacts in flooded locations...........................................................................................267
10.2.3 Effect of flood frequency .................................................................................................268
10.2.4 Impact of flood history ....................................................................................................271
10.2.5 Impact of change in designation maps ...........................................................................273
10.3 TRUNCATED HEDONIC MODEL INCLUDING INSURANCE...........................................................273
10.4 ANALYSIS OF VARIANCE INCLUDING INSURANCE ..................................................................279
10.5 ANALYSIS OF INSURANCE PROBLEMS AT PURCHASE ...............................................................281
10.6 SELECTION OF MODEL FOR PREDICTION ..................................................................................283

xi
10.7 MODEL VALIDATION................................................................................................................285
10.7.1 External Validation.........................................................................................................285
10.7.2 Internal Validation..........................................................................................................286
10.8 SUMMARY................................................................................................................................287
CHAPTER 11 : CONCLUSIONS AND RECOMMENDATIONS.............................................289
11.1 INTRODUCTION ........................................................................................................................289
11.2 RESEARCH FINDINGS ...............................................................................................................291
11.2.1 Findings from the literature review................................................................................291
11.2.2 Findings from the insurance questionnaire....................................................................292
11.2.3 Findings from the flood price impact modelling............................................................293
11.3 CONTRIBUTION.........................................................................................................................294
11.3.1 Contribution to methodology..........................................................................................294
11.3.2 Contribution to understanding .......................................................................................295
11.3.3 Dissemination..................................................................................................................296
11.4 LIMITATIONS ............................................................................................................................297
11.5 IMPLICATIONS AND RECOMMENDATIONS ................................................................................299
11.6 SCOPE FOR FUTURE RESEARCH ................................................................................................301
11.7 CONCLUDING REMARKS...........................................................................................................303
LIST OF REFERENCES..................................................................................................................304
BIBLIOGRAPHY..............................................................................................................................318
APPENDIX A : INSURANCE QUESTIONNAIRE AND COVERING LETTER ..................328
APPENDIX B: EXAMPLE OF DATA EXPLORATION AND MODEL DIAGNOSTICS FOR
INDIVIDUAL SITE INDEX MODELS – BEWDLEY.................................................................333
APPENDIX C : CORRELATION OF QUESTIONNAIRE RESPONSES ...............................338
APPENDIX D : GLOBAL MODEL STATISTICS ALL LOCATIONS ...................................341
APPENDIX E : ANNUAL AVERAGES FOR TEST OF CHANGE IN FLOODPLAIN
DESIGNATION IN 2004 ..................................................................................................................344

xii
APPENDIX F : EXPLORATORY DATA ANALYSIS AND MODEL DIAGNOSTICS FOR
TRUNCATED HEDONIC MODEL ...............................................................................................345
APPENDIX G : KRUSKAL-WALLIS RANK TESTS.................................................................353
APPENDIX H : MEDIAN POLISH ANALYSIS ..........................................................................356
APPENDIX I : LIST OF PUBLICATIONS...................................................................................359
xiii
LIST OF FIGURES
Figure 2-1 : Source Pathway Receptor model, (after Fleming, 2001b) ...........................................17
Figure 3-1 : Land registry price index (source Land Registry (2007)) ............................................68
Figure 5-1 : AA premium index........................................................................................................... 124
Figure 6-1 : Hedonic specification for the UK market including flood variables...................... 146
Figure 6-2 : Repeat sales specification for the UK market............................................................. 148
Figure 6-3 : Theoretical impact profile 1 - One off or infrequent flood ..................................... 149
Figure 6-4 : Theoretical impact profile 2 - Flood effect permanently capitalised ...................... 150
Figure 6-5 : Theoretical impact profile 3 - Flood effect becoming capitalised........................... 151
Figure 6-6 : Theoretical impact profile 4 -Betterment..................................................................... 152
Figure 6-7 : The three dimensional nature of flood status ............................................................. 157
Figure 7-1 : Map of sites affected during the 2000 flood event (copyright Environment
Agency) ...................................................................................................................................... 174
Figure 7-2 : Map of study sites............................................................................................................. 177
Figure 7-3 : Summary of data analysis and modelling phases ........................................................ 191
Figure 8-1 : Indicative floodplain map for Malton and Norton.................................................... 198
Figure 8-2 : Repeat sales indices for Malton and Norton............................................................... 199
Figure 8-3 : Indicative floodplain map for Woking ......................................................................... 200
Figure 8-4 : Repeat sales indices for Woking .................................................................................... 201
Figure 8-5 : Indicative floodplain map for Shrewsbury .................................................................. 203
Figure 8-6 : Repeat sales indices for Shrewsbury ............................................................................. 204
Figure 8-7 : Disaggregated price indices for Shrewsbury................................................................ 205
Figure 8-8 : Indicative floodplan map for Bewdley ......................................................................... 206

xiv
Figure 8-9 : Repeat sales indices for Bewdley ................................................................................... 207
Figure 8-10 : Indicative floodplain map for Selby and Barlby ....................................................... 209
Figure 8-11 : Repeat sales indices for Selby and Barlby .................................................................. 210
Figure 8-12 : Flood outline for the 2000 event (after Black and Veatch, 2001) ......................... 211
Figure 8-13 : Indicative floodplain map for Lewes.......................................................................... 212
Figure 8-14 : Repeat sales indices for Lewes..................................................................................... 214
Figure 8-15 : Indicative floodplain map for Hatton ........................................................................ 215
Figure 8-16 : Repeat sales indices for Hatton. .................................................................................. 216
Figure 8-17 : Indicative floodplain map for Ruthin......................................................................... 218
Figure 8-18 : Repeat sales indices for Ruthin.................................................................................... 219
Figure 8-19 : Indicative floodplain map for Mold............................................................................ 220
Figure 8-20 : Repeat sales indices for Mold....................................................................................... 221
Figure 8-21 : Indicative floodplain map for Newport..................................................................... 222
Figure 8-22 : Malpas Brook area flood map...................................................................................... 223
Figure 8-23 : Repeat sales indices for Newport................................................................................ 223
Figure 8-24 : Indicative floodplain map for Southsea ..................................................................... 225
Figure 8-25 : Repeat sales indices for Southsea ................................................................................ 226
Figure 8-26 : Indicative floodplain map for West Bridgford ......................................................... 227
Figure 8-27 : Repeat sales indices for West Bridgford .................................................................... 228
Figure 8-28 : Indicative floodplain map for Wakefield ................................................................... 229
Figure 8-29 : Repeat sales indices for Wakefield .............................................................................. 230
Figure 9-1 : Distribution of ownership of property......................................................................... 241
Figure 9-2 : Distribution of age of respondents ............................................................................... 241
Figure 9-3 : Distribution of property type of survey. ...................................................................... 242
Figure 9-4 : Distribution of age of property...................................................................................... 243

xv
Figure 9-5 : Frequency of flooding amongst flooded residents..................................................... 245
Figure 9-6 : Depth of flooding among flooded residents............................................................... 245
Figure 9-7 : Duration of flooding among flooded residents.......................................................... 246
Figure 9-8 : Actions taken in advance of flooding ........................................................................... 246
Figure 9-9 : Condition after reinstatement ........................................................................................ 247
Figure 9-10 : Difficulties experienced when requesting quotes for insurance by flood
designation................................................................................................................................. 250
Figure 9-11 : Difficulties experienced when requesting quotes for insurance by flood
history categories...................................................................................................................... 251
Figure 9-12 : Awareness of flood risk at property purchase .......................................................... 252
Figure 9-13 : Spread of policyholders by company.......................................................................... 254
Figure 9-14 : Comparison of primary choice mechanism floodplain and non floodplain
residents ..................................................................................................................................... 255
Figure 9-15 : Mitigation measures taken by residents perceiving a flood risk ............................ 262
Figure 10-1 : Discounted growth rate, flooded locations, by designated risk category ............ 269
Figure 10-2 : Discounted growth rate, frequently flooded locations, by designated risk
category ...................................................................................................................................... 270
Figure 10-3 : Discounted growth rate, frequently flooded locations, by flood history............. 272
Figure 10-4 : Distribution of prediction errors for those experiencing insurance
problems at purchase............................................................................................................... 282
Figure 10-5 : Distribution of prediction errors for those required to pay more ........................ 283
xvi
LIST OF TABLES
Table 2-1 : Forms of loss (after Penning Rowsell et al, 2005) ..........................................................31
Table 2-2 : Homeowners experience after flood damage to their property (after
Samwinga et al, 2004) .................................................................................................................41
Table 3-1 : Commonly listed housing attributes in the UK ..............................................................74
Table 4-1 : Summary of findings from US flooding studies .............................................................96
Table 4-2 : The twenty characteristics appearing most often in hedonic pricing model
studies (after Sirmans et al 2005)........................................................................................... 102
Table 4-3 : Top ten variables included in UK hedonic studies...................................................... 103
Table 4-4 : Top four characteristics in the environmental/natural category from
hedonic pricing model studies (after Sirmans et al, 2005) ................................................ 104
Table 7-1 : Selected locations for empirical analysis ........................................................................ 175
Table 7-2 : Land Registry price paid dataset...................................................................................... 178
Table 7-3 : Number of property transactions at each study location ........................................... 179
Table 7-4 : Information sources .......................................................................................................... 184
Table 7-5 : Wave analysis of pilot responses..................................................................................... 187
Table 8-1 : Flood risk and flooded properties in Lewes ................................................................. 213
Table 8-2 : Summary of flood status for selected locations ........................................................... 233
Table 9-1 : Questionnaire response rates........................................................................................... 237
Table 9-2 : Distribution of responses across flood status categories including Bewdley ......... 238
Table 9-3 : Comparison of survey property type with English house condition survey .......... 243
Table 9-4 : Age of housing stock comparison .................................................................................. 244
Table 9-5 : Difficulties experienced by respondents on requesting quotes for insurance........ 249

xvii
Table 9-6 : Difficulty in obtaining insurance for a new residence ................................................ 253
Table 9-7 : Increases in premiums and exclusions accepted by new residents........................... 253
Table 9-8 : Tendency to switch insurance based on flood history................................................ 256
Table 9-9 : Median insurance rate by EA risk category (£per £000 insured) ............................. 259
Table 9-10 : Correlation between flood risk status variables ......................................................... 261
Table 10-1 : Mean discounted growth rate for properties inside and outside the
extreme flood outline .............................................................................................................. 268
Table 10-2 : Mean rank of growth rates by flood designation category....................................... 268
Table 10-3 : Distribution of property sales across locations.......................................................... 274
Table 10-4 : Candidate variables for the hedonic regression model............................................. 275
Table 10-5 : Truncated hedonic model .............................................................................................. 276
Table 10-6 : Kendal’s Tau Correlations between the vectors of flood status............................. 278
Table 10-7 : Distribution of sold properties across flood status categories ................................ 279
Table 10-8 : Factor effects from median polish analysis................................................................. 280
Table 10-9 : Median discounted price by flood status categories.................................................. 281
Table 10-10 : Predictive framework for categories of flooded property ..................................... 284
Introduction
1
Chapter 1 : INTRODUCTION
1.1 INTRODUCTION
Flooding is the most common natural hazard faced by populations worldwide causing
the most fatalities and coming second only to windstorms in the cost of damage
caused (Munich Re, 2004b). Floods can devastate communities and have a range of
impacts short and long term upon their victims. Over £200 billion worth of assets are
estimated to be at risk of flooding in the UK (Office of Science and Technology,
2003). The worldwide increase in frequency of extreme weather events has been
reflected in the UK where, since 1998, there have been several severe flood events.
The flood event of Easter 1998, coming as it did after a relatively dry period, sparked a
renewed interest in the management of flood risk (Bye and Horner, 1998) which was
reinforced by further flooding in 1999 and the widespread 2000 floods (EA, 2001,
NAO, 2001, Clark et al., 2002). Forecasts of increased flooding due to climate change
(Office of Science and Technology, 2003, Evans et al., 2004) and subsequent flood
events in Boscastle in 2004, Carlisle and North Yorkshire in 2005 and the most recent
summer flooding of 2007 have kept the flood issue high upon the political agenda.
The immediate effect of flooding on its victims in terms of loss of property and
displacement from their homes is readily apparent. Dramatic coverage of emergency
evacuations and the destruction of property are presented in the media (Pook, 2000,
Thompson and Fitzwilliams, 2005, Humphreys, 2005). Surveys of flood victims
document the wider impacts (Welsh Consumer Council, 1992, Ketteridge and
Fordham, 1998, Samwinga et al., 2004). Less apparent but equally distressing to the

Introduction
2
victims are the longer term detrimental impacts such as health problems (Bennet, 1970,
Welsh Consumer Council, 1992, Hajat et al., 2003, Reacher et al., 2004, EA/DEFRA,
2005). A key worry expressed by homeowners is that they may experience insurance
problems and that enhanced awareness of flood risk due to media coverage, recent
changes in disclosure and insurance regimes may cause depression in the price of
flood-prone property (Welsh Consumer Council, 1992, Clark et al., 2002, Samwinga et
al., 2004, EA/DEFRA, 2005).
The maintenance of property value is a key element in the sustainability of local
communities (Bramley et al., 2004). It is of importance not only to property owners
and their agents but also to local and national governments. If devaluation due to
floodplain status leads to vacant and derelict property then local blight could ensue. In
extreme examples the case could be made for clearing entire swathes of housing.
However abandonment of existing localities to the elements is a policy matter and the
increased pressure on building land due to housing demand makes such an event
undesirable.
Knowledge of the extent and scale of the price effect of flooding will therefore be
valuable for a number of purposes. Valuation professionals need to know what
magnitude of discount to apply to previously flooded and at-risk properties when they
come up for sale (Kenney et al., 2006). Furthermore the financial impact on the
residential sector through the reluctance of consumers to purchase properties in
floodplains is a concern to house builders (Hertin et al., 2003, Kenney et al., 2006).
Mortgage lenders and insurance companies can make a more realistic estimate of
capital at stake in flood risk property. Governments, national and local and their
Introduction
3
associated agencies with responsibility for flood defence policy and implementation
need to understand the full financial implications of their decisions (Clark et al., 2002).
Among the most distressing of post-flood impacts is the physical displacement from
home and community during reinstatement particularly if alternative accommodation is
far removed from the home (Samwinga et al., 2004). Factors facilitating a quick
reinstatement of flooded property will therefore assist victims in their recovery and can
also help in maintaining community cohesion. In the ideal scenario flood victims
would welcome secure and timely financial support for the recovery work as well as
ready access to professionals experienced in the restoration of flood damaged
buildings. An effective insurance market can provide both of these things. Insurance
against flood damage can also provide benefit to the wider community in preventing
blight and sustaining the local community.
Knowledge of the impact of flooding on the cost and availability of insurance and the
way that this affects the value of property will be useful to property owners and their
agents. Strategies to maintain insurance cover in the presence of flood risk will be
valuable not only during their residence but also in the property transfer process.
Commercial investors in property have also identified the non-availability of flood risk
insurance as a key deterrent in property purchase (Kenney et al., 2006). However the
debate about the role of insurance in flood risk management involves a much wider
community. The presence of insurance is not an unalloyed good as has been
extensively described by Kunreuther (1974), Clark (2002) and Crichton (2005), among
others. Insurance can induce moral hazards in those able to prevent flood damage if it
removes the incentive to do so. Recently authors have argued that, if this danger is

Introduction
4
recognized, it may be possible for insurers to take steps to prevent complacency
amongst property stakeholders (Huber, 2004, Green and Penning-Rowsell, 2004).
1.2 RESEARCH CONTEXT AND JUSTIFICATION
Flood related research is a multidisciplinary field which ranges from the purely physical
sciences aspect of short term flood prediction to the social science considerations such
as studies of vulnerability. The current investigation is located broadly within the area
of flood risk management but more specifically within flood impact measurement. The
research area of flood risk management in the UK context has quite naturally
prioritised the preservation of life, flood defence and emergency response (Fordham
and Ketteridge, 1995, Penning-Rowsell and Wilson, 2006). Flood prevention and flood
damage prevention are also a primary focus (EA, 2001, Hall et al., 2003, Entec, 2005).
A deep understanding of the full impacts of flooding is necessary in order to
implement flood management policies in the best interests of all (Green et al., 1994).
Research into the impact of flooding in the UK has focused mostly upon the costs to
the insurer, government and society in general (Clark et al., 2002, Office of Science and
Technology, 2003, Dlugolecki, 2004, EA/DEFRA, 2005). The damage to property,
infrastructure and business has been studied in some detail by Penning-Rowsell and
others (Green et al., 1994, Penning-Rowsell and Green, 2000, Penning-Rowsell and
Wilson, 2006) in order to evaluate the cost benefits of flood management programmes.
Some insurance industry funded research has been undertaken to examine the effect of
flooding on the cost of repairing individual properties (Black and Evans, 1999a,
Soetanto et al., 2002). Such research is designed to allow insurers to mediate claims

Introduction
5
and to assess their ultimate financial exposure to flood risk. An additional thread of
research has been the longer term stress and health impacts on the flooded household
(Bennet, 1970, Fordham and Ketteridge, 1995, Reacher et al., 2004, EA/DEFRA,
2005). Long term financial impacts of flooding upon the victims in respect of loss of
capital value in their property and increase in insurance premiums, though much
discussed in the media (Hughes, 2000, Stevenson, 2002, Brown, 2004) has received
rather less attention in academic research.
The assumption that flooding will have an impact on property value is commonly held
and makes intuitive sense but not yet proven for the UK (Clark et al., 2002).
Conflicting theories suggest that a measurable impact of flooding on property value is
not a foregone conclusion. Price theory predicts that the willingness to pay to avoid the
disutility of flood risk should be reflected in property price discount, however
behavioural decision theory suggests that consumers may ignore the risk of flooding
during property purchase (Slovic, 1987) unless forced to do so. There have been two
surveys of expert opinion on the impact that flooding may have on value of residential
property in the UK (Building Flood Research Group (BFRG), 2004, Eves, 2004). The
huge variation in responses, even from professionals working in the same market, is a
remarkable feature of both studies. A further survey on the attitude of property
stakeholders to commercial and residential development also found opinions varied
widely (Kenney et al., 2006). The research highlights the lack of analysis of value
implications of flood risk and reinforces the need to examine the relationship using
actual transaction data.

Introduction
6
Studies of the effect of flooding on property value and insurance exist for the US,
Canada, Australia, New Zealand and France. These studies demonstrate widely
different measured effects but agree on the importance of insurance in determining
value loss. Different insurance regimes exist across countries with the UK being unique
in the inclusion of flood cover under standard household policies (Gaschen et al.,
1998). In general where insurance is studied the analysis is based on published state
insurance rates and takes no account of the fact that the majority of homeowners fail
to insure unless forced to do so (Babcock and Mitchell, 1980, Harrison et al., 2001).
There is a division in the literature between studies of a particular flood event, for
example Tobin and Montz (1997) and studies of designated floodplain location, for
example Shilling et al (1989). The temporal nature of the value effect of flood differs
depending on which approach is taken. Impact of a flooding incident is seen to
decrease with elapsed time after the event, designation, conversely, leads to permanent
effects.
In relation to the aims of this investigation there is an absence in the existing research
of a consensus view on the likely impact of flooding on house prices in the UK. There
are also gaps in the dearth of transaction based research into the effect of flooding on
house prices in the UK, and in the lack of a theoretical framework to include the
influence of insurance costs on the value of houses.
1.3 STUDY AIMS
The main aim of this research is to investigate and measure the impact of flooding and
the risk of flooding on the value of residential property in the UK.

Introduction
7
A subsidiary aim of this research is to investigate the impact of flooding and flood risk
on the cost and availability of insurance and whether insurance issues are a determining
factor in any loss of property value.
1.4 RESEARCH PHILOSOPHY
This study touches upon multiple fields of study including natural environment, built
environment, risk management, economics and finance. Even a cursory glance at the
literature reveals that practitioners from all these fields have studied the impact of
flooding on property. The motives and methods have varied accordingly and from a
problem centred perspective all bring valuable insights to bear. However, competing
and complementary theories of behaviour have failed to provide guidance to valuation
professionals and property managers for their practical purposes. In specifying a
particular national market for this research the objective is to place the research in an
evidence based real world context and to generate concrete estimates of market
reactions. The philosophy of this thesis is therefore pragmatically pluralistic and will
incorporate a broad literature review.
1.5 INITIAL RESEARCH STRATEGY
Achievement of the stated aim of measuring flood impacts clearly demanded a
quantitative element within the research strategy. Simply to build a conceptual model
would not fulfil the research aims. However, within the research there was a tendency
to mix in other methods in accordance with the pragmatic research philosophy.

Introduction
8
Incorporating expert opinion, questionnaire comments and textual analysis into the
design and interpretation of quantitative data provides a deeper understanding of the
problem than statistical analysis alone. The initial research strategy was therefore to
investigate the wider context of flooding, house price and insurance literature via a
survey of the published research. In this way a conceptual model of the impact of
flooding on the value of property could be developed. The strategy then involved
estimation of the model parameters using UK data. Throughout the development
phases of the research the availability of data to test conceptual models was therefore
considered of crucial importance. A bias towards a quantitative approach was present
from the outset and purely theoretical or qualitative approaches were eschewed.
1.6 OBJECTIVES OF THE STUDY
To achieve the aims of this research the objectives will seek to address the identified
gaps in the current research in the following way.
1. A comprehensive review of relevant literature will be undertaken to identify any
consensus in the previous analysis of the impact of flooding upon property value and
the relationship between flooding, insurance and property value. The review will also
encompass methodological approaches with the intention of identifying appropriate
methodologies for measuring the impact of flooding on property value and insurance
cost.
Introduction
9
2. A conceptual model will be developed, specific to the UK, of the impact of flooding
upon property value. This conceptual model will incorporate the cost and availability
of flood insurance.
3. Models of the impact of flooding on property value will be estimated. Data on
property insurance will be collected and combined with the price models to explore the
relationship between flooding, insurance and property value.
1.7 DELIMITATION OF THE STUDY
The study will concentrate on fluvial flooding, examples involving coastal flood risk,
overland flow and water system failure are considered briefly during the empirical
stage. The UK will form the context for the study during the literature review stage.
However, because of the differing disclosure, regulatory regimes and property transfer
process, during the empirical model building stage the study will focus on England and
Wales. Domestic residential property only will be considered. For the purposes of the
empirical analysis only transacted property will be included. Data for the study will be
taken from the Land Registry price paid dataset, the Environment Agency web-based
indicative flood plain map and a survey of homeowners. The further implications and
limitations of these data sources will be discussed in Chapter 6.
1.8 ANTICIPATED BENEFITS OF THE STUDY
The financial effect of flooding and flood risk on property value in the UK has been a
topic much loved by the media but neglected in academic research. This project aims
Introduction
10
to make a contribution within this clear gap in understanding. In order to increase
understanding it has been necessary to develop a novel framework for analysis because
the existing literature is not directly applicable to the UK market. The research will
therefore make contributions in methodology and understanding as detailed below.
1.8.1 Methodological contribution
As detailed in Chapter 6, it has been necessary to take steps in model development in
order to deal with the temporal variability in flood impact on property value, the data
issues specific to the UK and the unique insurance regime in the UK. The temporal
formulation can be applied in future research into the impact of flooding, or other
natural hazards on the property market. Although the broader analysis framework was
designed of necessity to address country specific problems the insight gained during
development of the conceptual model into the potential actions of insurance in the
property market may be relevant in other insurance markets.
A major advantage to the proposed methodology is that, in using repeat sales analysis,
the costs of data collection are minimised, this makes it possible to revisit and extend
the analysis with minimal cost. In a changing regulatory regime which may provide
increasingly accurate and timely flood risk information, house buyers’ perceptions of
risk may well change. The ability to continue to track the impact of flooding is a
desirable facility.
1.8.2 Contribution to understanding
The understanding of the effect of flood on property value will be improved in four
ways by the study:

Introduction
11
i) The spread of the effect of flooding on property value over time will be better
understood. Valuation practitioners express the opinion that people forget about the
risk of flood but have no firm grasp of the length of time that might take. In the
proposed research several locations will be analysed and it may be possible to detect
differences in recovery time depending on previous flood experience.
ii) The magnitude of the effect will be estimated from actual sales data. All previous
estimates of sales impact in the UK have been based on expert opinion (Building
Flood Research Group (BFRG), 2004, Eves, 2004). In the aftermath of a flood this can
be highly coloured by media hype and in the context of relatively rare events such as
flooding, the experience of the experts may be low.
iii) The impact of flooding on the cost of insurance for floodplain residents will be
measured in a new way. Use of published rates or blind customer surveys in the
specialist field of flood insurance is unlikely to reflect the true impact of living on a
floodplain for the majority of customers. Floodplain residents have an incentive to
shop around and can make personal negotiations with insurance companies to reduce
costs (Which?, 2005). The questionnaire survey will give a unique insight into this issue.
iv) In the light of the output from the questionnaire survey it will be possible to
investigate the impact of insurance cost on sales value for the UK market. The
hypothesis that increased insurance cost for floodplain properties is having an impact
on the value of property in the floodplain will be tested using transaction data.

Introduction
12
1.9 ORGANISATION OF THE THESIS
The thesis will cover in detail the literature reviewed during this study. This literature
was broadly sectioned into four strands each forming a chapter. The literature on
flooding and its impact on the built environment is covered in chapter 2. In chapter 3
price theory and house price models are considered. In chapter 4 the lessons from the
specific work on flood impact on property value are detailed. The property insurance
market in the UK and the way in which insurance can be incorporated into house price
modelling are the topics of chapter 5. This chapter draws on flood pricing literature as
well as UK insurance literature.
Following from the extensive review chapters, conceptual model development is
described in chapter 6. Chapter 7 lays out the practical steps necessary in the empirical
analysis phase of the research based on transaction data from the UK property market.
In chapter 7 the rationale behind the approach taken is summarised and the way in
which the research aims will be addressed by the empirical research is explained.
Chapter eight presents a large collection of textual data about the study sites and the
preliminary data analyses to obtain local price indices for each site. The remainder of
the detailed analyses is split between two chapters. The analysis of questionnaire
responses forming the bulk of chapter 9 whilst chapter 10 deals with the house price
analyses and the combined model. Choice of model and model validation is also
contained within chapter 10.
Introduction
13
Chapter 11 presents the conclusions and recommendations of the study and suggests
ways in which this research in its completed form will contribute to knowledge and
where the strand of research might most profitably be developed.
1.10 SUMMARY
It has been shown within this chapter that flooding is an important issue, not just for
the UK but worldwide. Flooding is an increasing phenomenon and the importance of
increased research into the area of flooding will grow commensurately. Flood related
research has included a substantial body of work relating to flood risk management and
the measurement of flood impacts. Within this broad area the longer term financial
implications of flooding for the UK homeowner are seen to be under researched.
Better understanding of these long term impacts is argued to be useful for a wide range
of property stakeholders but the gap in understanding cannot be completely addressed
by a single research project. The clearly stated aims and objectives for this investigation
are therefore designed to move towards a fuller understanding of the impact of
flooding on insurance cost and property value for a limited range of flood types. The
limits of the study and its context within flooding research have also been clarified. As
described in section 1.8 the ongoing thesis will encompass an extensive literature
review, conceptual model development and empirical analysis. The following four
chapters constitute the review section commencing with a contextualising of the
flooding literature concentrating on flood impacts in the built environment in the
subsequent chapter.
Flooding and the Perception of Risk
14
Chapter 2 : FLOODING AND THE PERCEPTION OF
RISK
2.1 INTRODUCTION
The inundation of water across areas that are normally dry constitutes a flood and has
a wide variety of impacts (Gruntfest, 1995, Fleming, 2001b, Reacher et al., 2004,
EA/DEFRA, 2005). As an extreme example, a tsunami may result in massive loss of
life, land and possessions. At the other extreme, poor functioning of the internal
plumbing system within a dwelling may result in an escape of water and minor damage
to contents. Flood events differ in their severity and duration. In the UK for example
tsunamis are not usually considered a likely threat but river flooding occurs regularly
and coastal flooding can occasionally cause great devastation (Fleming, 2001b). It is
also important to distinguish between the severity of a weather event and the severity
of its impact on the human and built environment (Clark et al., 2002).
In the UK the incidence of severe weather events has increased in recent years
(Munich Re, 2004a). The increase has been attributed to climate change and on this
basis the intensity of events is projected to continue to accelerate (Office of Science
and Technology, 2003). However, even without the increase in weather events the
financial risk to property in the UK has increased due to the action of man. As
discussed in Clark et al (2002) the vulnerability of the population has increased due to
increased development in the floodplain and the neglect of flood defences. The impact
of flooding in financial terms has also increased because of the increasing value of
buildings and their contents (Penning-Rowsell and Green, 2000).

Flooding and the Perception of Risk
15
To some extent therefore the increased flooding problem is man made and mankind
can take action to reduce its impact. The primary function of scientific forecasting of
weather events is to enable society to take avoiding actions and to minimise the risk to
persons and property (Arnell et al., 1984, Spence, 2004). The success or otherwise of
such measures is crucial in determining the public perception of risk and the extent to
which populations at risk of flooding will modify their behaviour (Ryland, 2000, Bruen
and Gebre, 2001, Fleming, 2001a, Spence, 2004). In the UK flood defence policy has
shifted from total reliance on hard engineering solutions to increased use of planning
restrictions, resilient construction and adaptive behaviour (Fleming, 2001b, NAO,
2001, Oliver, 2007).
Whatever future construction practices may bring, the reality remains that for the
foreseeable future, due to historical settlement patterns, a large population will remain
at risk of flooding. The maintenance of those communities is in the interest of the
wider population except in the extreme cases where frequent and severe flooding
renders maintenance impractical. Understanding the economics of floodplain property
involves an appreciation of global economic losses but also financial ones affecting
individuals resident in the floodplain such as the increased cost of insurance and loss of
property value.
The empirical stage of this research focuses on one type of flooding in one national
housing market. It is clear from the literature described in this chapter but also later in
chapters 4 and 5 that the differences between types of events and the differing actions
of governments in protecting and informing their populations renders specialisation in

Flooding and the Perception of Risk
16
the measurement of the financial impacts of flooding necessary. However human
response to hazard will have some common features and understanding these features,
and the flood hazard in general will be crucial in interpreting the results of the
empirical analysis and in determining the general applicability of the conclusions.
Section 2.2 describes the various types of flooding. Section 2.3 considers the likely
increase in future flood risk. The impact of flooding in the built environment is
described in section 2.4. Sections 2.5 and 2.6 consider the prediction of flooding from
a scientific and public perception perspective. Section 2.7 examines the actions which
property owners and other stakeholders can take in the knowledge of flood risk.
2.2 TYPES OF FLOODING
A flood is a great flow of water; an inundation; a deluge; a condition of abnormally
great flow in a river (Chambers, 1993). But to an insurance company, to a farmer or to
a householder the term flood may carry different meanings. In the flooding literature
there are also many ways of categorising floods. Figure 2-1 shows Flemings source-
pathway receptor model (Fleming, 2001b), an example of a useful representation for
visualising the elements which distinguish between different flood incidents. A source
might be heavy rainfall or high tides, a pathway might be a river or overland flood and
a receptor could be a house, field or factory. In their guidance to the construction
industry the Construction Industry Research and Information Association (CIRIA)
have seven flood mechanisms which encapsulate the way in which flood water can
affect development sites (Lancaster et al., 2004).

Flooding and the Perception of Risk
17
In the UK, for residential property, all types of flood are normally covered by domestic
house insurance. Therefore the flood type and so the distinction between types is not
of critical importance to the householder as it might be were their insurance cover
dependent upon it. However, for the researcher, it is important to be aware of the
differences in definition of flooding when comparing estimates of the cost of floods
because some types of flooding are more controllable or preventable than others. For
the purposes of this research a much simplified grouping of flood types is practical
while recognising that many flood events may combine more than one type. The
categorisation used below encapsulates the CIRIA mechanisms and is consistent with
the Environment Agency (EA) definitions of the flood events of 2000 cited in
National Audit Office (2001).
SOURCE ------------ PATHWAY ----------- RECEPTOR
Source - The initial condition that can lead to a hazard and subsequent risk being
realised.
Pathway - The means by which the source can impact a receptor.
Receptor - The target which will be threatened by harm from the hazard.
Figure 2-1 : Source Pathway Receptor model, (after Fleming, 2001b)

Flooding and the Perception of Risk
18
2.2.1 Coastal and estuarine flooding
Flooding from the sea at the coast is caused by extreme tidal flows which can occur
due to three main mechanisms (Institute of Hydrology, 1999): high cyclical tides due to
the gravitational effects of astral bodies (astronomical tide level); increase in water level
due to low barometric pressure and wind (surge); swelling waves due to the wind speed
and direction (wave action). Sea defences are often in place to defend against the
normal level of such mechanisms but flooding may often occur when several of the
mechanisms combine, an individual extreme occurs in an individual mechanism or the
defences fail.
In the UK widespread coastal flooding occurred in 1953. It derived from a
combination of a high spring tide, a deep atmospheric low over the North Sea and
northerly gales. Three hundred people lost their lives and twenty four thousand homes
were flooded (EA, 2003b).
The extension of this coastal flooding inland via estuaries is mainly dependent on the
tidal flow factors above but may be further complicated by high river levels. A
phenomenon known as tidelocking may occur if, due to high tides, the estuarine
defences do not allow for draining of high river flows into the sea. Flooding may then
occur behind sea defences even though they have not been overtopped.
2.2.2 Fluvial flooding
Flooding from rivers and streams is usually caused by heavy or prolonged rainfall. The
resultant runoff overwhelms the natural water courses and exceeds their capacity for
transmitting water downstream. Rapid snow melt may also generate the runoff levels
which cause fluvial flooding but in the UK this is less common. The state of the so
Flooding and the Perception of Risk
19
called natural water course may also be a contributing factor to this type of flooding as
may upstream defence strategies. Managing the flow of water through the river
network and floodplains can be a central and strategic government role.
Fluvial flooding is often predictable during periods of prolonged rainfall but if intense
rainfall for a wide catchment is directed into a narrow watercourse as occurred in
Boscastle in August 2004 (Doe, 2004) flash flooding may occur too fast for monitoring
systems to generate warnings. Groundwater saturation also has a part to play during
very prolonged rainfall. The ability of the surrounding countryside to allow soak-away
to the water table is compromised and so the majority of the water must be discharged
through the water courses.
The 2000 flood event was mainly due to prolonged heavy rainfall saturating the ground
and overwhelming the watercourses. More than 10,000 properties were flooded some
up to five times (NAO, 2001).
2.2.3 Overland flooding
Overland flow (sometimes known as pluvial flooding) is water flowing over the surface
of the ground that has not entered a natural drainage channel. It can occur almost
anywhere but is most likely to be of particular concern in topographical low spots
(Lancaster et al., 2004). Most commonly, overland flow is the result of intense rainfall
exceeding the infiltration capacity of the surface onto which it falls. This could be
because the surface is impermeable due to it being man made or due to drying out
during a summer drought. Surfaces can also become impermeable because of
saturation due to a prolonged wet period. Overland flow is most common in areas with
Flooding and the Perception of Risk
20
steep terrain or in substantially urbanised environments where it can often be linked to
failure of drainage systems.
2.2.4 Failure of artificial water systems
Flooding can result from the failure of artificial water systems because the systems are
poorly designed and flow exceeds the design capacity or because they are poorly
maintained and become blocked or compromised in some other way. Flooding of this
type may contain high levels of debris as sewers are often involved or affected.
Flooding can also occur from pump failure, from reservoirs or canals. Water system
failure is a large problem in the UK as described in Crichton (2005), and because of the
likelihood of foul water is particularly unpleasant and costly. Internally or externally
flooding can be caused by domestic supply failure such as burst pipes but these
incidents are fairly circumscribed in scope.
Most of the flood prone sites studied in the empirical phase of this research suffered
their last inundation in the autumn 2000 floods or are typically at risk of fluvial
flooding. One site is at risk of coastal flooding but the 2000 incident was due to failure
of a pumping station. This site was included to provide a contrast to the main body of
data.
2.3 CLIMATE CHANGE AND THE INCREASE IN FLOOD RISK
As mentioned above, flood frequency and the frequency of other severe weather
events have increased in the preceding decade. There have been periods in the past
when flood frequency has accelerated, which have prompted government intervention
Flooding and the Perception of Risk
21
in the flood insurance market (Arnell et al., 1984). The distinguishing feature of the
present wet period is that flood frequency is predicted to continue to increase over the
foreseeable future due to climate change (Office of Science and Technology, 2003,
Stern, 2006). This presents new challenges for the built environment as the hazard
frequency increases. However even without increased frequency of flooding the
impact of flood is set to rise because of human actions: Recent development within
floodplains has ensured that increasing numbers of properties are put at risk of
flooding (Crichton, 2005); flood defence effectiveness had declined during the
relatively dry decades of the 1970s and 1980 (Clark et al., 2002); lifestyle changes have
increased the financial amount at risk from the same flooding scenario as householders
invest more heavily in their homes (Chagnon et al., 2000).
2.3.1 Climate change predictions
Climate change is a global phenomenon. Increasingly, changing weather patterns are
convincing researchers that human behaviour is having an impact on the temperature
of the planet. Over the last 100 years, for example, the temperature in the UK has risen
by 0.6 degrees Celsius (IPCC, 2001). International symposia and summits thrash out
solutions to this perceived threat to our environment because it is widely recognised
that this is a global problem requiring international cooperation for the development of
robust solutions (Stern, 2006).
Predictions of future climate change depend crucially upon assumptions of future
economic activity. The Intergovernmental Panel on Climate Change (IPCC) third
assessment report (IPCC, 2001) has produced scenarios on future carbon emissions
which range from 980-2190 giga tonnes of carbon per year. This translates into

Flooding and the Perception of Risk
22
temperature increases of 2-4.5 degrees Celsius over the next century (Hadley Centre,
2003). Global precipitation levels are predicted to rise at the same rate, with every
degree of temperature resulting in a percentage rise in rainfall (Hadley Centre, 2003).
The recently published Stern report (Stern, 2006) concluded that action to offset the
impacts of climate change is an international imperative and outlines ways this might
be achieved. The Met. Office (Hadley Centre, 2003) estimates suggest that whatever
action is taken some warming is inevitable due to current carbon dioxide levels.
Climate change has implications for the frequency and severity of flooding incidents.
Forecasts for the UK (UK Climate Impacts Programme (UKCIP), 2007) suggest that
the country will suffer wetter winters and increasing numbers of intense rainfall events.
Higher rainfall will lead to prior wetness and a higher temperature will lead to higher
mean sea levels and faster snow melt (Fleming, 2001b). For other regions of the world
the rise in temperature is projected to result in increased drought and water shortages.
Coupled with these climate shifts there is an expectation that the worldwide incidence
of severe weather incidents such as hurricanes will rise (Stern, 2006). The consensus
among climate models appears to be that there will be an increase in flooding incidents
in the future.
When the increase in rainfall is coupled with lifestyle factors the expected growth in
people at risk of flooding will grow from 1.6 million to 3.5 million in the 2080s.
Estimated annual damages rising from £1 bn to £21 bn (Evans et al., 2004). Estimates
of people and households affected by the increased flooding are crucially affected by
assumptions about the population under threat. Assumptions about population
growth, spread of development within and outside the floodplain and the building and

Flooding and the Perception of Risk
23
maintenance of flood defences are necessary. Governments can influence the spread of
development and the construction of flood defences thereby reducing future flood
development. For individuals, the problems with using climate change predictions lies
in their uncertainty. As pointed out by Nielsen (2006) the extent to which adaptation to
climate change should be undertaken depends on the cost of adaptation and the
certainty of the projections of climate change. What is lacking from the literature
however, are detailed predictions of weather behaviour on the scale that can allow
individuals to make decisions about the construction of their immediate environment
(Nielsen, 2006).
From the existing models of climate change we can conclude that there is likely to be
an increase in flooding incidents worldwide and particularly in the UK. While the scale
and timing of this increase is unclear, however, the detailed implications of climate
change are not quantifiable. This has implications for the behaviour of property
stakeholders as will be discussed further in the next sections. However, as described
below, the case for studying flood impact does not depend on the acceptance of the
growth in flood risk. The distress, disruption and expense incurred at the current
frequency of events is sufficient justification.
2.3.2 Development in the floodplain
Populations have traditionally settled next to rivers. For an agrarian economy it makes
sense to cultivate the fertile floodplain and to utilise natural watercourses for irrigation,
water supply and transport. In the industrial society the advantages of riverside living
still outweigh the risk of flooding. In the developed world during the current
technological age with widespread infrastructure there is not a compelling need to

Flooding and the Perception of Risk
24
select a floodplain for development. Equally it is within the ability of mankind to build
flood impervious homes or to defend homes to a very high standard. The decision to
build on the floodplain or not becomes a response to government policy and financial
considerations versus lifestyle factors.
Smith and Tobin (1979) illustrated the increased concentration of urban populations
on previously flooded land and regarded floodplain invasion as the most significant
factor in growing flood risk at that time. Crichton (2005) contends that the
Association of British Insurers (ABI) agreement to cover flood risk for all domestic
dwellings in the UK has led to increased development in the floodplain, greatly
exacerbating the flood risk. This is considered an undesirable outcome especially as the
reduced price of floodplain land often leads to it being used for low cost social
housing, putting at risk those least able to stand the financial burden of flood risk. The
Environment Agency (EA, 2001) view is that development on the floodplain is
undesirable for several reasons. Clearly siting more buildings in the floodplain increases
the population in the floodplain and places the new residents at risk. The development
may also increase flood risk for the whole floodplain by decreasing the soak-away
potential for the developed land. Furthermore actions taken to offset increased flood
risk at the development site such as construction of flood banks may have impacts
upstream or downstream of the development, thereby increasing the risk of flood
elsewhere.
Alternatively there are factors which mitigate against the siting of all new development
away from the floodplain. The government communities plan identified targets for the
redevelopment of previously developed, brownfield sites rather than new land.

Flooding and the Perception of Risk
25
Planning Policy Guidance (PPG) 3 means that many proposed redevelopment sites are
situated in the floodplain (Entec, 2005). It is also desirable to locate new development
close to existing ones in order to increase housing density, a government target from
PPG3. The price of land on the floodplain may also be a factor in favour of floodplain
development. The proposed Thames Gateway project is a case in point: high density
housing is planned close to the Thames. An estimated 86,000 new dwellings could be
built in the Thames floodplain by 2015 (Crichton, 2005, Entec, 2005).
In the UK domestic building development is subject to planning constraints
administered by local authorities. Systems within England, Wales, Scotland and
Northern Ireland vary in detail because of differing local arrangements and legislation.
The relevant guidelines relating to flood risk in England is Planning Policy Statement
(PPS) 25 (Department of Communities and Local Government, 2006), in Wales the
relevant guidance is contained in Technical Advice Note (TAN) 15, in Scotland SSP 7
and in Northern Ireland PPS15. These guidelines differ in detail but all dictate that
development is subjected to flood risk assessment and that planning permission can be
refused on the basis of unacceptable flood risk. The Environment Agency fulfils the
role of advising on the flood status of a proposed development site in England and
Wales (Wynn, 2005). This in effects limits the development on floodplains but does
not prevent it. Local authorities can ignore the advice from the Environment Agency
as they have done in 1 in 4 cases (Wynn, 2005, ABI, 2005c).
It has been estimated by the ABI (2005c) that over 1,000 planning applications for new
developments have been approved against EA advice in the three years up to October
2005. However this is a great improvement on the situation in 2000, when, according

Flooding and the Perception of Risk
26
to Crichton (2005), there were over 3,000 cases where Environment Agency advice
was ignored. The most recent estimate by the Environment agency (EA, 2007) is that
96% of planning decisions of which they are informed about the outcome were
decided in line with their advice. This still resulted in 110 known developments being
approved against their advice. Other developments were permitted with appropriate
mitigation measures being adopted. Wynn (2005) in a survey of planners and
developers concluded that planners and developers were aware of and sympathetic to
the aims of the planning guidelines. However in practice, the perception that slow
Environment Agency advice will delay developments deters planners and developers
from entering into consultation. Late response from the agency was also given as a
primary reason for decisions running contrary to Environment Agency advice.
In short, despite regulations limiting the amount of development on the floodplain, it
is perceived to be necessary to permit a certain amount of floodplain development. It
is for the built environment professional to seek to minimise the increase in flood risk
posed by a new development and to ensure that key infrastructure and vulnerable
groups are not put at increased risk. Development on the floodplain should be planned
to be sustainable and should take account of the “precautionary principle” that cost
effective planning against the risk of flood should not be postponed because of
uncertainty about the risk (Entec, 2004). Financial considerations which should not be
ignored in this context are: first that the risk to their new properties is within the
acceptable level set by the ABI as insurable or they will create insurance problems for
any future residents; second, in the event of a flood whether the value of the properties
will be damaged to such an extent as to leave purchasers unable to move because of
negative equity.

Flooding and the Perception of Risk
27
2.3.3 The role of flood defence
The purpose of flood defence is to reduce the risk of flooding, to protect property and
safeguard life (NAO, 2001). To many minds the natural response to increasing flood
risk is to improve and increase the structural flood barriers protecting valuable
property. During the 2000 flood event, although an estimated 10,000 properties were
flooded, 280,000 were seen to be protected against flooding by existing defences (EA,
2001). However, it is clear that defences may be overtopped by an extreme event
exceeding the design specification of the defence (Fleming, 2001b). Clark et al (2002)
suggest that before the 1998 floods, funding for flood defences had been neglected and
many were performing to below specified protection levels. Pressure from flood
groups and the insurance industry has led to an increase in the budgets for flood
defence in recent years.
Flood defences can be permanent, for example sandbanks or flood walls, but they can
also be temporary barriers, put up when forecasts predict flooding is imminent.
Demountable defences are used to defend the Frankwell area of Shrewsbury
(Shropshire County Council, 2004) and pallet barriers have proved successful in
Ironbridge and elsewhere (Worrall, 2004). Personal defences systems such as sand
bags, door and window guards and skirts can be used on individual properties
(Bowker, 2007).
Fleming (2001b) refers to flood management rather than flood defence. Strategies such
as introducing storage areas into the system, for example the Lincoln washlands,
channel enlargement or flood diversion channels. These methods require greater

Flooding and the Perception of Risk
28
accuracy of flow volume prediction and continuous investment in monitoring (Smith
and Tobin, 1979), and become more feasible as understanding of flood sequences
increases. Finally flood warnings and evacuation plans can reduce significantly the risk
to life and property (NAO, 2001).
Within England and Wales, the body responsible for overseeing matters relating to
flood defences is the Environment Agency. Included in this role are advisory roles to
planning authorities, surveys of flood defences, monitoring flood risk and assessing
ways in which risk may be reduced. The Environment Agency controls the deployment
of the bulk of the total expenditure on flood defences in England and Wales. In
Scotland the body shouldering the responsibility is the Scottish Environment
Protection Agency. The official position of the Environment Agency is that flooding
can never be prevented entirely (Oliver, 2007). We must make space for it in urban
design. The floodplain is the natural space for such storage because inherent in its use
are additional leisure, ecological and aesthetic advantages which are not present in
underground tanking.
It might be thought that the construction of flood defences would always reduce the
losses due to flooding. Smith and Tobin (1979) however point out that often the
construction of defences allows development in what are now regarded as safe areas.
The result of a catastrophic flood will consequently affect far more property and can
more than offset the gains made by protecting the original settlement. This effect,
known as the levee effect, means that flood defences reduce the costs due to regular
anticipated flooding but increases the flood loss burden overall unless development is
prevented behind the flood defence.

Flooding and the Perception of Risk
29
If defences are built and then poorly maintained as has been suggested to be the case
in the UK then the impact of the levee effect is further heightened. The increased
development behind defences coupled with defences not performing to design
standards will increase the impact of all flood events. Analysis by Smith and Tobin
(1979) suggests that the avoidance of the levee effect could be a driving principle
behind current flood alleviation schemes which concentrate more on warnings and
temporary defence systems rather than permanent engineered structures.
2.3.4 Lifestyle factors
Exposure to flood hazard is a key element in the assessment of flood impact. Flooding
in an uninhabited area is not a disaster for homeowners or their insurers. In analysing
the trends in disaster losses, Pielke (2006) concluded that the overwhelming driver in
increased disaster losses in the US was societal change and development. Also in the
US, Changnon et al (2000) observed that the increase in insurance claims following
severe weather events was largely driven by societal changes, increase in wealth and
increased concentration in hazard prone areas. Similar conclusions have been reached
elsewhere, for example by Crompton et al for Australia (2006), for Cuba (Muir Wood
et al., 2006) and for China (Qian, 2006). For the UK, Cowley et al (2002) observed that
while the UK Retail Price Index has run at 2-3% in recent years, the consumption of
household goods index has outrun it at 6%. People own much more and their goods
are more expensive to replace. Carpets have replaced hard flooring and electronic and
electrical appliances abound, mainly concentrated on the ground flood of dwellings.

Flooding and the Perception of Risk
30
The increased costs of flooding observed in recent flood events in the UK and the
projections of further cost increases can therefore be seen to be a combination of
increased risk, exposure and vulnerability. Within the context of present flood risk
management policies the likelihood is that, despite increased spending on flood
defence and planning guidelines designed to reduce floodplain development a
significant proportion of residential property will remain at risk from flooding. The
next section examines the various impacts of flooding within the built environment,
describing many of the costs associated with these impacts.
2.4 THE IMPACT OF FLOODING IN THE BUILT ENVIRONMENT
As discussed above, flood risk is comprised of hazard, exposure and vulnerability.
Damage occurs when hazard and exposure combine and a flood event impinges on
urban areas. The amount of damage suffered by that built environment is then a
function of its vulnerability. In understanding flood risk, therefore, the ways in which
floods can damage buildings and, equally, the way this damage can be minimised is
central.
Flooding can cause damage in several ways within an urban setting. There is a threat to
personal safety in the ingress of water to normally dry areas, where escape from
buildings via boats, helicopters or other emergency vehicle is often necessary. In a high
velocity flood, people may be swept away or drowned before emergency services can
reach them. Physical damage to buildings and their contents is another primary impact.
Flood waters also impede transport, covering roads and railways. This causes
disruption to commercial and domestic life. Essential services such as electricity and

Flooding and the Perception of Risk
31
water supplies can also be cut off causing discomfort in addition to health and safety
hazards. In the years following a flood there are many longer term, more intangible
impacts of flooding such as financial hardship for flood victims and stress related
problems. The various forms of damage are summarised in Table 2-1.
Table 2-1 : Forms of loss (after Penning Rowsell et al, 2005)
Form of loss Tangible Intangible Direct Damage to buildings Loss of archaeological
merit. Loss of treasured possessions.
Indirect Loss of productivity. Increase in travel expenses
Inconvenience, Health impacts
Losses can also be categorised as economic losses from the standpoint of national or
regional government or financial losses from the perspective of direct stakeholders in
property. This section focuses on the direct and indirect impacts on buildings and their
stakeholders in keeping with the theme of the current investigation.
2.4.1 Damage to buildings
It is a widely expressed truism that the type, depth, velocity and duration of a flood will
have a large effect on the damage suffered by a building and its contents. Kelman and
Spence (2004) describe in detail possible actions of floods on buildings categorising the
effects into: hydrostatic actions, such as lateral pressure from flood depth differential
between inside and outside a building; water damage to non-resistant materials and
capillary rise; hydrodynamic actions including velocity of flow causing turbulence or
wave action; erosion, movement of soil for example undermining foundations;
buoyancy, uplift due to buoyancy reduces the lateral force required to move a building;
Flooding and the Perception of Risk
32
debris and non-physical actions such as contamination with chemicals, nuclear or
biological agents. Kelman and Spence (2004) argue that many of these actions will vary
greatly within a given flood and between neighbouring properties, as for example the
impact of large debris such as oil tanks and cars may have catastrophic impacts on one
property leaving others unscathed.
There is a general consensus that different types of flooding will result in different
forms of damage. For example flash flooding such as occurred in Boscastle in Autumn
2004 or in North Yorkshire in summer 2005 tends to be associated with high velocity
and debris content (Doe, 2004). This leads to a high level of structural damage to
buildings affected by the flood. In contrast the regular slow rise flooding such as is
suffered by residents of Shrewsbury and York has a much lower velocity of flow.
Preparedness of the occupants for a flood can also dramatically affect the damage
caused by a flood (Thieken et al., 2006). Research evidence to back up these widely
held views is somewhat sketchy however. There is a lack of understanding of flood
damage which leads to a great deal of uncertainty in estimates of future flood damages
(Kelman and Spence, 2004).
In the UK, for cost benefit study purposes, economic damage can be calculated via the
manual of assessment techniques (Penning-Rowsell et al., 2005). These manuals are
based on depth of flooding and building type. Green et al (1994) concludes that
international studies demonstrate that depth of flooding is the most critical variable for
urban flooding. Comparisons across developed countries have shown that the unit loss
curves are very similar for shallow floods affecting residential property. In a survey of
loss adjusters and surveyors Soetanto et al (2002) discovered that amongst those

Flooding and the Perception of Risk
33
dealing with the problem of flooding on a regular basis the contamination and depth of
water were considered the most important factors affecting damage.
However the focus upon flood depth may simply be a reflection of the fact that depth
of flooding is the most easily measured aspect of a flood as Soetanto et al (2002)
observed. Assessments of flood damage are usually made after the flood and to
determine the velocity or contaminant in the flood water is more problematic once the
flood water has receded. Recent work by Black and Evans (1999b), by Merz et al
(2004) and by Kreibich et al (2005) attempt to include other variables into the analysis
such as type of construction and flow velocity.
Research into the impact of floods on buildings in the UK has been carried out by the
Buildings Research Establishment (BRE Scottish laboratory, 1996), University of
Wolverhampton (Soetanto et al., 2002), Middlesex University Hazard Research Centre
(Penning-Rowsell and Green, 2000), the National Flood School (Netherton, 2006) and
H R Wallingford (Tagg, 2006). In the USA recent experimental work has been carried
out by Tuskgee University (Aglan et al., 2004) into flood resistance and resilient
materials. Much of the work is directed towards recommendations of suitable material
for flood resilient construction and for effective reinstatement. A summary of findings
can be found in a recent report for the Department of Food and Rural Affairs
(DEFRA) (Bowker, 2007). However the research tends to focus on submersion in
static flood water rather than velocity and debris impacts.
Anticipation of damage, unrecoverable losses and the expense of reinstatement are
thought to be part of the explanation of any discounting in the value of floodplain

Flooding and the Perception of Risk
34
property as discussed in section 3.2. Prediction of the cost of flooding, or research into
reducing this cost could have a dramatic influence on the valuation of flood risk
implied in such discounting.
2.4.2 Damage repair
For the UK, repair of flood damaged domestic dwellings since the 1960s has been
facilitated by the previously universal availability of flood insurance cover (Huber,
2004). This ensures that the majority of home owners will be able to rely on building
professionals to reinstate their houses. Emergency services are clearly a first line of
defence during the flood helping to pump water from dwellings and installing
temporary defences. Teams from many agencies and council operatives will help to
strip out damaged belongings in the immediate aftermath. It has been recognised,
however, that the correct action immediately following a flooding incident may limit
damage (Kelman and Spence, 2004) and so many insurers will attempt to get loss
adjusters into a flooded area the day after a flood (Barham, 2004). Victims of a flood
are not always content with the service they receive from their insurers as evidenced by
reports into the Towyn floods of 1990 (Welsh Consumer Council, 1992), in
Warwickshire Trading Standards (Warwickshire Trading Standards, 1998) and in
Samwinga et al (2004). Advice on what to do when flooded is available from a
multitude of sources for example Office of the Deputy Prime Minister and the
Association of British Insurers.
Research into the needs and demands of flood victims has been carried out by
Samwinga et al (2004) who concluded that these needs and expectations are little

Flooding and the Perception of Risk
35
understood and hardly researched. The divisive impact of aid to the uninsured versus
insurance claims is explored by Fordham and Ketteridge (1995).
For the insurance industry Black and Evans (1999a) estimated the average cost of
reinstatement to be £22,000 for buildings and £13,000 for contents on average. The
process of collating claims information from a variety of insurance companies for this
study focussed the researchers attention on the poor collection of information by
claims handlers and called for a standardised report for flood damage.
Research in the area is ongoing in the UK by the H R Wallingford research
organisation on behalf of the Building Research Establishment (Tagg, 2006), Sheffield
Hallam University (Lambert, 2006), University of Wolverhampton (Samwinga et al.,
2004) and the National Flood School (Netherton, 2006). Achieving excellence in the
sphere of flood repair may contribute to the maintenance of property value and spares
the property owner a great deal of the stress and anxiety attendant on flooding of their
home.
Standardisation of the repair of buildings is a theme of the work of Proverbs and
Soetanto (2004) and of the Flood Repair Forum who have issued guidelines for the
repair of flood damaged buildings (Flood Repairs Forum, 2006). There is much
knowledge available about the impact of flooding on different building materials, and
the best ways to treat the drying and restoration process. This knowledge is held within
several specialist flood repair companies but a large proportion of flood reinstatement
is performed by generalist builders who may have limited understanding even of such
basics as efficient drying of a building and contents. Experience of the Carlisle flood

Flooding and the Perception of Risk
36
victims (Hendy, 2006) has made it clear that in practice there is still great variability
between the best and the worst in terms of reinstatement. Guidelines and standards are
helpful in such cases in disseminating the best practice to a wider group of builders.
One of the more contentious issues in flood repair is the inclusion (or not) of resilience
in the reinstated building. Clark et al (2002) point out that it is not in the interests of
insurance companies to finance resilient repair because customers are not tied in to
long term relationships with their insurer and a rival company may gain lower risk
customers at their expense. Loss adjusters acting in the short term interest of their
insurance companies often recommend the cheapest reinstatement method rather than
the best or most resilient (Proverbs and Soetanto, 2004). Where resilient repair is
offered as an option it is generally not taken up unless the property has been subject to
repeated flooding. Many authors have called for regulation in this matter, Crichton
(2005) observes that the Scottish executive has the powers to force resilient
reinstatement in flood damaged buildings. Resilient reinstatement is perceived to
reduce the cost to insurers and the ABI (2006) have produced guidance as to the
benefit of resilient reinstatement for standard properties. Many of these alterations
would be cost effective after just one flood incident.
2.4.3 Indirect losses
Not all consequences of a flood within a built environment are felt in the physical
damage done to the buildings themselves. Buildings perform a function and during a
flood and in the reinstatement period, they can frequently be prevented from
performing that function. Financial loss arising from the disruption of the normal
activity of a building can be considerable. Green (1994) points out that indirect losses

Flooding and the Perception of Risk
37
from a flood will be dependent upon the severity of the event and are likely to be
correlated with the direct damages for that reason. The duration of the flood event will
also be important, particularly for trading losses or manufacturing disruption.
However, indirect costs may be suffered by businesses and residential properties not
actually flooded (Penning-Rowsell and Wilson, 2006). For example costs may be
incurred in successfully defending against inundation or a business which was not
flooded but which had restricted access during a flood event lost business. For
domestic properties loss of amenities are more likely to be an issue. For example,
interruption of electricity supply may cause hardship and financial loss from the
damaging of freezer contents. These may be small losses for the individual but if
multiplied across a large city such as in Carlisle 2005 or wide areas of the electricity
network as threatened by the 2007 summer floods the totals could be considerable. In
analysing indirect costs therefore a wider population area must be considered than for
direct damage costs.
When considering commercial premises the flow of all losses and counterbalancing
gains which may be experienced by nearby buildings which are not damaged is
complex. The scale at which losses are evaluated, household, local economy, regional
or national will determine how important these indirect losses will appear to be (Green
et al., 1994). Business losses after flooding are under researched and contain far greater
variability than residential losses (Green et al., 1994, Gissing, 2002). Indirect losses for
businesses due to flooding have been considered by Gissing (2002), Penning Rowsell
et al (2005) and by Crichton (2006). In the UK, the average cost of a business
interruption claim was £35,000 in 2005 (Crichton, 2006). On average businesses lost 50

Flooding and the Perception of Risk
38
working days but there was great variability in outcomes (Crichton, 2006). Crichton
(2006) points out that only 8% of businesses received warnings of imminent flooding,
and that after the flood 25% of businesses would consider moving their premises.
Small businesses can take up to two years to recover from floods, many do not have
interruption insurance and some do not survive. The Association of British Insurers
state that having an emergency plan in place is crucial as 80% of businesses without
such a plan do not recover even when insurance is in place (ABI/NFF, 2006). If the
home is used for running a small business then a flood in the home may contribute to
business failure.
Disruption of road transport and essential local services can also be costly involving re-
routing of journeys, the financial implications of which can be addressed via the cost
benefit studies often carried out when roads are constructed (Green et al., 1994). Cost
of deploying the emergency services, cost of damage avoiding action and medical
treatment can also be considerable (Penning-Rowsell and Wilson, 2006).
However, this investigation is concerned with domestic dwellings which primarily
provide shelter and a base for domestic life. Much of the indirect impact of a flood for
a residential property owner will be intangible as it affects their quality of life and will
be covered in section 2.4.3. If it is necessary to relocate during a flood and subsequent
restoration then housing costs can amount to a substantial expense that may often be
covered by insurance. Extra transport costs, and increased living expenses resulting
from the inaccessibility of the normal amenities of home are harder to quantify and will
probably be borne by the flood victim. Loss of house value could be regarded as an
indirect loss from flooding pertaining solely to the home owner and their financial

Flooding and the Perception of Risk
39
backers if the loss was caused by the flood. Increased cost of insurance could also be
regarded as an indirect loss from flooding if it stemmed from making a claim due to
flooding. It is likely that all of these domestic indirect costs will be related to the
severity of the flood and the duration of the recovery or restoration of the family
home. This implies that, as mentioned before, these indirect costs should, in theory, be
correlated to the direct damage costs. Accepted wisdom has been that indirect damage
costs are unlikely to exceed direct damage costs, however from the perspective of the
insured householder the indirect costs of property loss value and insurance cost
increases may be uppermost in their minds as they are uninsurable and therefore borne
by them directly.
2.4.4 Intangible effects
To the victim of flooding the economic damages described above are not always the
most distressing aspect of a flood. There are many other impacts which are hard to
quantify in monetary terms. The most tragic of these, loss of life, is happily an
infrequent occurrence in UK floods. Green et al (1994) considered intangible effects in
order to seek ways to minimise them and also to find methods by which they could be
incorporated into the assessment of flood alleviation schemes. A subsequent theme of
the work of the Flood Hazard Research Group including Tapsell and Tunstall (2003)
has examined the issues surrounding vulnerability of human populations within the
built environment.
Intangible losses can be subdivided into direct, such as loss of life due to drowning or
exposure during the flood and indirect losses such as illness suffered in the aftermath.
Health effects may be further subdivided into physical and psychological. Stress and
Flooding and the Perception of Risk
40
worry can then generate physical problems. Studies of health impacts have been carried
out by Bennett (1970) and by Reacher et al (2004).
A survey of flood victims was carried out by the EA and DEFRA (2005) into the
intangible effects of flooding. They concluded that the degree of physical and
psychological health impact of a flood could be measured using questionnaires. The
impact was related to the depth of flooding and also socio-demographics of the
victims. Post flood events such as difficulties with reinstatement also contributed to
these negative health effects. An average monetary value of £200 per household was
derived from this research.
The tendency of intangible impacts to vary with the flood victim is further explored by
the literature. Long term psychological damage is felt by some victims but not all
(Tapsell and Tunstall, 2003). The difficulties with under insurance are covered by Priest
et al (2005), the tendency of the underprivileged to suffer worse consequences by
Fordham and Ketteridge (1995). Puvachoeran (2003) researched into the social
vulnerability index via a survey of Lewes flood victims. Samwinga et al (2004) held in
depth interviews with flood victims which revealed a variety of concerns summarised
in Table 2-2.
From this table it is clear that a lot of complex fears and stresses affect the flood
victim, four years after the flood many victims were still able to articulate them in great
detail. Particularly germane to this thesis are victims’ expressed concern about loss of
insurance cover or increased insurance cost and also of reduced demand for their
property at resale leading to property devaluation.
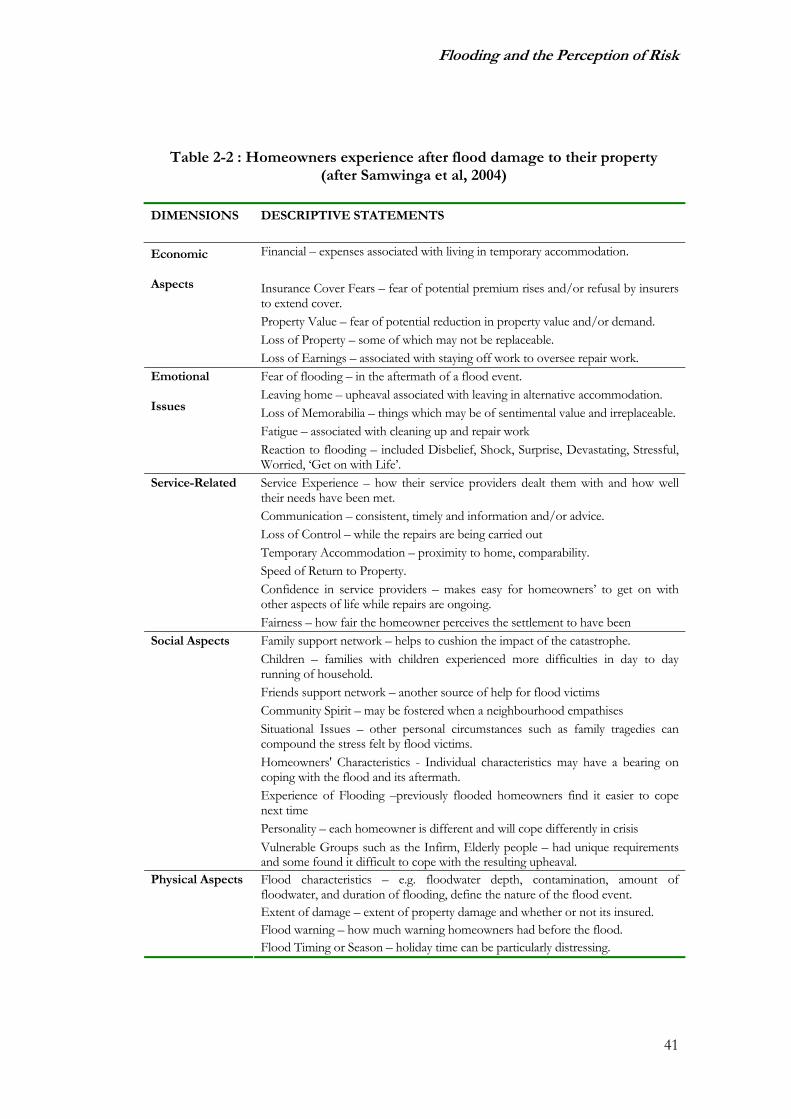
Flooding and the Perception of Risk
41
Table 2-2 : Homeowners experience after flood damage to their property (after Samwinga et al, 2004)
DIMENSIONS DESCRIPTIVE STATEMENTS
Financial – expenses associated with living in temporary accommodation.
Insurance Cover Fears – fear of potential premium rises and/or refusal by insurers to extend cover. Property Value – fear of potential reduction in property value and/or demand. Loss of Property – some of which may not be replaceable.
Economic
Aspects
Loss of Earnings – associated with staying off work to oversee repair work. Fear of flooding – in the aftermath of a flood event. Leaving home – upheaval associated with leaving in alternative accommodation. Loss of Memorabilia – things which may be of sentimental value and irreplaceable. Fatigue – associated with cleaning up and repair work
Emotional
Issues
Reaction to flooding – included Disbelief, Shock, Surprise, Devastating, Stressful, Worried, ‘Get on with Life’. Service Experience – how their service providers dealt them with and how well their needs have been met. Communication – consistent, timely and information and/or advice. Loss of Control – while the repairs are being carried out Temporary Accommodation – proximity to home, comparability. Speed of Return to Property. Confidence in service providers – makes easy for homeowners’ to get on with other aspects of life while repairs are ongoing.
Service-Related
Fairness – how fair the homeowner perceives the settlement to have been Family support network – helps to cushion the impact of the catastrophe. Children – families with children experienced more difficulties in day to day running of household. Friends support network – another source of help for flood victims Community Spirit – may be fostered when a neighbourhood empathises Situational Issues – other personal circumstances such as family tragedies can compound the stress felt by flood victims. Homeowners' Characteristics - Individual characteristics may have a bearing on coping with the flood and its aftermath. Experience of Flooding –previously flooded homeowners find it easier to cope next time Personality – each homeowner is different and will cope differently in crisis
Social Aspects
Vulnerable Groups such as the Infirm, Elderly people – had unique requirements and some found it difficult to cope with the resulting upheaval. Flood characteristics – e.g. floodwater depth, contamination, amount of floodwater, and duration of flooding, define the nature of the flood event. Extent of damage – extent of property damage and whether or not its insured. Flood warning – how much warning homeowners had before the flood.
Physical Aspects
Flood Timing or Season – holiday time can be particularly distressing.
Flooding and the Perception of Risk
42
Loss of property value was also identified as a concern after the Towyn floods (Welsh
Consumer Council, 1992) and in the EA/DEFRA survey (EA/DEFRA, 2005).
Anticipated loss of value is an additional worry for flood victims and may lead to them
feeling physically trapped, because unable to sell and move on, in an environment in
which they no longer feel safe.
2.5 SCIENTIFIC MEASUREMENT AND PREDICTION OF FLOOD
HAZARD
The effective management of flood risk depends on a good understanding of flood
hazard. At a policy level flood prediction can assist in the efficient allocation of funds
for construction and maintenance of defences or flood warnings. Property
stakeholders will use hazard estimates to decide on the siting of property and their
plans with regard to flood management. More crucially, during a flood event, accurate
predictions of the likely peak level of flooding can minimise loss to property and life.
However as described below, in many cases the estimation is problematic and
forecasting lacks the certainty or detail needed by decision makers.
2.5.1 Flood measurement
Flood height markers are a familiar sight; fluvial floods are often described according
to their height above normal river levels. For example: a history of Shrewsbury floods
shows that the 2000 flood event was the worst since 1946 at 5.25 metres above normal
levels according to the gauge board at the Welsh Bridge (Shropshire County Council,
2004). Measurement of the flood peak can be achieved by examination of tidemarks
on these gauge boards.

Flooding and the Perception of Risk
43
The weather systems which cause flooding are also carefully recorded, radar and
satellite imagery, rain gauges and so on track the weather routinely for the
Meteorological office. For example: detailed records of the weather events leading up
to the catastrophic flooding of Boscastle in 2004 are explained in Doe (2004). Flow
within rivers is also measured routinely and is used in flood forecasting as described
below. Hydrological records of flooding for the UK are held in the National Water
Archive hosted by the Centre for Ecology and Hydrology (CEH Wallingford, 2006).
However as noted by the Institute of Hydrology (1999) and described above there is a
lot more to a flood event than the maximum peak at gaugeboards and flow within the
normal river bed. The state of the catchment prior to flooding, the extent of flooding,
velocity, level of contaminants and debris will all contribute to the level of damage
inflicted by a flood. Records of these other aspects of flood events are less consistent
than the records of heights, the level of effort expended probably depending to some
extent on local agencies, the manpower available and the length of pre-warning. In the
case of a major flood, priority is given to rescue and mitigation activities rather than
recording.
Tidemark evidence, verbal accounts, analysis of damage and debris can all play a part in
reconstructing the flood event (Doe, 2004). In recent years in England and Wales the
Environment Agency has collected aerial photographic evidence of the extent of
flooding. Details of historic flood events from textual sources are available from the
Chronology of British Hydrological Events, hosted by the University of Dundee (Black
and Law, 2004). The recording of flood history can therefore best be described as
piecemeal.

Flooding and the Perception of Risk
44
2.5.2 Flood prediction
Prediction of flooding is necessary in order to plan for future flood defence strategies
but also in real time to advise potential victims of likely severity. Real time models are
vital for warning systems and can prompt floodplain residents to take avoiding action,
preventing some losses. For a slow rising fluvial flood, warning systems can be very
effective, although the balance between warning too frequently and not warning
enough can be difficult to manage. For the purposes of this research, however, it is the
long term modelling of future flooding rather than the real time modelling of floods as
they happen that is of most interest. These are more likely to affect a long term
decision such as a house purchase.
Much of the flood estimation and subsequent prediction carried out in the UK has
been based on the 1999 flood estimation handbook (Institute of Hydrology, 1999).
The large volume of data necessary for reliable flood frequency estimation is made very
apparent within this publication. Methods for using data from one site to estimate
returns on a different site are necessary because of the paucity of data available. This
collection of best knowledge and practice has since been modified and improved upon
by subsequent authors.
Common currency among flood frequency prediction is the notion of returns rates.
Return rates for a flood event refer to the average long term interval between floods of
a particular magnitude. For example a 1 in 100 year flood has a 1 percent chance of
occurring in any one year. The construction of a return period for an event can lead to
confusion however especially if practitioners from different disciplines study the same
flood. Doe (2004) describes the autumn 2004 Boscastle event as having three possible
Flooding and the Perception of Risk
45
return cycles depending on which type of analysis is used. The short run of reliable
flood measurements relative to the return period of a serious flood means that accurate
return period assessment can be problematic. To this end much research into the
reconstruction of historic events has been directed (Black and Law, 2004).
An additional complication to the prediction of future flooding is the uncertainty of
future predictions of weather systems. Stationarity of climate conditions is an inherent
assumption in models using historical flow records to predict the future (Werrity et al.,
2002, Green and Penning-Rowsell, 2004). As discussed above, climate change is
expected to impact upon future flooding as rainfall events are predicted to become
more intense. The use of historic records to generate return periods cannot easily take
this anticipated change in weather patterns into account. As rainfall intensifies 1 in 50
return period floods may become 1 in 25 year events.
A detailed analysis of alternative flood prediction methodologies is beyond the scope
of this thesis. Wheater (2002) covers the various types of model and their strengths and
shortcomings. However it is instructive to examine the accuracy and precision
capabilities of commonly used models for the UK. Reed (2002) concludes that flood
frequency estimation is an uncertain business which must be reinforced with the
judgement of the practitioner. In the UK flood frequency predictions are generally
based on event analysis which require gross simplification (Wheater, 2002). Detailed
measurement of catchment and flood areas are not required and therefore predictions
are not detailed enough to predict flood risk for individual properties.

Flooding and the Perception of Risk
46
Fleming (2001b) outlines many areas of improvement needed for the realistic
projection of flood forecasting. In particular the over-reliance of statistical analysis of
past events rather than hydro-dynamic modelling of river catchments is highlighted.
Bradbrook et al (2005) points out the prohibitive cost of widespread river catchment
modelling.
2.5.3 Floodplain mapping
Mapping of the floodplain is the practical outcome of flood frequency prediction
which is most relevant to property stakeholders. Typically the floodplain will be
divided into broad risk categories based on the expected return rate of a flood affecting
that area. Property owners, developers, lenders and insurers can establish the risk to
their investments or make decisions about the areas in which they will live. A major
recent development in the UK has been the publication of indicative floodplain maps
by the Environment Agency (2006a) on the internet. A massive project was undertaken
to make the maps more consistent and reliable. A new digital elevation map was
generated and new software was employed to automate the flood estimation
procedures used in the past (Bradbrook et al., 2005). Inevitably some smoothing and
simplifying assumptions are involved in gaining consistent estimates on a national scale
(Bradbrook et al., 2005).
Public access to the best available information about flood risk could have far reaching
implications for the behaviour of floodplain residents or potential floodplain residents.
However the use of this information for individual properties is not recommended by
the Environment Agency, who suggest contacting the agency to get a full picture of
individual flood risk. In addition the maps only cover coastal and fluvial flooding

Flooding and the Perception of Risk
47
which can lead to false complacency if residents ignore the risk of pluvial and other
flooding. For example it is estimated that 30-50% of flood insurance claims after the
autumn 2000 floods were from properties outside any floodplain (Crichton, 2005).
The reputation of the maps among floodplain residents and the insurance industry is
that they are not accurate enough to determine risk (Munich Re, 2004a). Norwich
Union commissioned their own land survey in an effort to improve on the
Environment Agency estimates (Munich Re, 2004a). However data on flood defence
positions has not been made available from the Environment Agency and so the
majority of insurers use Environment Agency risk categories along with their own
records to determine premium (Crichton, 2005). Green and Penning-Rowsell (2004)
warn against using the Environment Agency floodplain maps for insurance purposes
because there are so few catchments where reliable estimation can be made,
particularly where there is most interest in their accuracy namely urban catchments.
2.5.4 Prediction of flood impact
Separate from the prediction of flood extent and velocity is the further step of
estimating the impact of the flood on the built environment. Top level estimates of the
number of properties within the ambit of a given flood flow are useful in determining
priorities for flood defence spending. In the UK, output from the Environment
Agency flood models are combined with census data and commercial databases of the
location of property (Evans et al., 2004). Economic damage is then estimated from
depth damage functions produced by Penning-Rowsell et al (2005). These damage
curves estimate the economic loss defined as the value of goods lost. These kinds of
estimates may well underestimate the insurance burden of flooding because they do

Flooding and the Perception of Risk
48
not include all costs covered by UK insurance policies. Black et al (1999a) has used
insurance records to estimate equivalent damage curves for the financial impact on
insurance companies.
Research in this area is moving away from simple depth damage curves towards more
complex functions incorporating flow velocity and contaminants (Thieken et al., 2006)
as discussed in section 2.4 or to better understanding of the affected built up area and
the flows within it (Flood risk management research consortium, 2007). Other areas of
sophistication could include the type of properties, construction type and any resilient
features of the properties. As an example: the current global estimation techniques
cannot distinguish between a house with raised construction and one without because
floor levels are not recorded on a routine basis. The difference in cost between a raised
property and a standard one would usually be quite substantial.
In a similar way to the forecasts of flooding these forecasts of the impact of flooding
are based on statistical averages, not suitable for use in estimating costs for a particular
property at risk. An individual will have knowledge about the construction, type and
contents of their own home. To construct an estimate of likely flood damage, however
they would also need to be able to judge the likely depth of flooding. Environment
Agency indicative flood maps do not give this information. An individual property
owner might require a professional impact survey to gain a realistic view of future
expected damage costs. This lack of quality in public information will naturally have an
impact on public perception of risk as discussed in the following section.

Flooding and the Perception of Risk
49
2.6 PUBLIC PERCEPTION OF RISK
In order to take action in respect of flood risk whether in purchasing flood insurance
or deciding against investing in the floodplain it is necessary for an individual to
perceive a risk. How the floodplain population is alerted to the risk of flood, how
much they trust that information and how concerned they become about the risk
should have an impact on the way they behave. Awareness of risk is the first step
towards risk avoidance. The individual may then seek out further information about
the risk and use that knowledge together with underlying personal biases to form a
perception of the danger to themselves and their property. This will of course vary
from individual to individual (Grothmann and Reusswig, 2006). Public perception of
risk has been shown to be a complicated matter, not necessarily predictable from
experts’ assessment of risk or affected by new evidence which contradicts their pre-
conceptions (Slovic, 1987, Barnett and Breakwell, 2001, Brilly and Polic, 2005).
2.6.1 Awareness of risk
The ways in which awareness and preparedness can be raised among at-risk
populations has been much debated in recent years in the UK (Bye and Horner, 1998,
BMRB, 2002, Richardson et al., 2003) as an important part of putting into place
adequate public information campaigns and warning systems. The results of surveys of
both flooded and “at-risk” populations reveals that there is complacency among
floodplain residents. Awareness of flood risk was included in the evaluation of the
intangible costs of flooding (EA/DEFRA, 2005). The report was based on a survey of
properties in locations flooded in 1998 and 2000. Only 24% of residents were aware of
the risk of flooding before the recent events but awareness post flood had risen, just

Flooding and the Perception of Risk
50
three years later when 86% were aware of the risk. In 2002 the Environment Agency
research into the effectiveness of flood awareness campaigns among residents at risk of
flood (but not necessarily recently flooded) found that 95% agreed that flooding is a
serious issue but only 45% thought it affected them (BMRB, 2002).
It is worth considering in which ways the floodplain population become aware of the
risk of flood to their property. For potential purchasers in the UK there is currently no
regulation which forces the disclosure of flood risk information (Building Flood
Research Group (BFRG), 2004). Common sense may indicate the advisability of a
flood risk assessment if the property is located next to a watercourse but many
properties at risk of flood are not so situated. Discovery will be by chance, local
knowledge or due to the thoroughness of their conveyancing professionals or possibly
through insurance problems.
Once resident the householder may become subject to the Environment Agency
awareness campaign. Word of mouth, local knowledge and media campaigns will play a
part. The home owner may have problems getting insurance due to flood risk.
Alternatively the resident may remain in ignorance until they become the victim of a
flood. For Example, in 1998 very many flood victims were completely surprised by the
flood in Bewdley (BBC, 1998).
2.6.2 Sources of information
Once aware of flood risk the most obvious source for information about the nature
and extent of that risk is the Environment Agency. An individual letter detailing the
risk to property is available from the agency at a price. The agency will also give a risk

Flooding and the Perception of Risk
51
category and place a resident on the flood warning register. For some catchments quite
detailed surveys are available, for others information is more sketchy.
When asked about which organisations provide information about flooding 20%
mentioned the Environment Agency (BMRB, 2002) while 29% mentioned local
council/local authority. Local media are cited as the primary warning mechanism in the
event of a flood.
Unless the individual is very determined and willing to search local archives or willing
to fund a professional survey, the most reliable source of alternative information is
word of mouth from local residents (Thrush et al., 2005). This will be particularly true
in areas frequently flooded where the floodplain residents will have a good idea about
depth of flooding and local topography (Richardson et al., 2003).
2.6.3 Perception of risk
Given the same information, however, the interpretation of risk by individuals will vary
widely (Barnett and Breakwell, 2001). Clark et al (2002) point out the ability of
floodplain residents to completely ignore the risk of flood. Bruen and Gebre (2001)
cite many examples of floodplain residents being surprised by flooding and blaming
mis-management of rivers, reservoirs and locks for floods which are, in fact, due to
unprecedented weather systems.
Conceptualising risk can be difficult for the lay population. For the UK, Richardson et
al (2003) describes a program of research including case studies and surveys to
investigate the link between flood awareness, communication and perception of risk.

Flooding and the Perception of Risk
52
They conclude that the use of the language of probability can be a confusing factor.
Return rates are often taken to mean that there will be a specified length of time
between each flood. People also focus on frequency of the event rather than the
potential harm a flood could cause. An additional outcome of the research programme
is the division of at-risk resident by flood experience and attitude to flooding ranging
from the unaware to the fully aware but unconcerned. They recommended the use of
comparisons with other risks for example the risk of fire in order to contextualise the
probability information.
The construction of flood defences can give false confidence to residents (Bollens et
al., 1981, Pynn and Ljung, 1999) given that the designed defence can be lower than
historic high flood levels. When defences are overtopped by events outside the
designed protection they are perceived to have failed (Bruen and Gebre, 2001). It is
very important to remember that once defences are breached or overtopped the water
will revert to its natural pathways and may recede more slowly than before.
People underestimate the damage a flood will do if they have not experienced one
(Pynn and Ljung, 1999, Bruen and Gebre, 2001). The fact that many domestic
insurance claimants prove to be underinsured (Hiscox, 2006) demonstrates that they
may not have a good feel for the cost of replacing their possessions.

Flooding and the Perception of Risk
53
2.7 ACTION OF PROPERTY OWNERS IN THE PRESENCE OF
FLOOD RISK
Given the recent flood history in the UK and worldwide with significant media
attention one might anticipate a behavioural change in those resident in the floodplain.
The hypothesis underlying the current research is that there may be an impact on the
price of domestic property but this is not proven within the UK. The evidence
available about actions of floodplain residents points both ways with contentment
shown by some floodplain residents whilst others, particularly in the immediate
aftermath of flooding are moved to take collective action. Property owners are rightly
concerned about the disruption and stress caused by flooding (EA/DEFRA, 2005) but
also have financial concerns about reinstatement costs, increased insurance premiums
and loss of property value (Welsh Consumer Council, 1992, Samwinga et al., 2004).
2.7.1 Propensity to insure
Where flood insurance is available as a separate policy or an option, the propensity to
buy flood insurance can be seen as a willingness to offset flood risk (Ehrlich and
Becker, 1972, Macdonald et al., 1987) and by extension an expression of the
acceptance that flood risk exists. The picture is not straightforward however, good
understanding of the local insurance market is necessary in interpretation of coverage
levels. Insurance regimes vary internationally as detailed in Gaschen (1998)
affordability may deter purchase or alternatively insurance may be compulsory if
purchase finance is required.
For example, in the US flood insurance is managed under the National Flood
Insurance Program (NFIP) and insurance is mandatory for flood victims who have

Flooding and the Perception of Risk
54
previously claimed disaster relief and also for those requiring government backed
finance. Burby (2001) noted that several studies of flood insurance have estimated
coverage of around 20%. He contrasts this with insurance against fire which is held by
95% of the population. A survey of North Dakota residents examined the reasons
given for not purchasing insurance in advance of a recent flood. Half of respondents
cited three factors as “very important” in their decision not to insure: conservative
flood estimates, belief in dikes and flood control devices and belief that the flood
would not damage the home. Even when obliged to purchase insurance in the wake of
disaster relief payments, Shaw (2004) found that 41% do not purchase cover,
principally because it is too expensive.
In Germany extended elementary all risks cover is included in only 3.5% of domestic
insurance policies (Schwarze and Wagner, 2004). Availability of emergency relief and
private donations are seen to weaken the incentive to insure and to implement
preventative measures. In the area affected by the 2002 Elbe flood the figure was much
higher. Prior to the flood 50% held insurance and after the flood this increased to 70%
(Kreibich et al., 2005). Kreibich suggests this is due to the fact that the former East
German householders had flood insurance bundled into their normal policy.
In the UK, however, flood insurance is bundled into standard household policies
implying that people are insured against flood by default if they are insured at all.
Emergency flood relief in the UK is difficult to obtain since the government has a
policy of not providing funds centrally. Insurance coverage is high in the UK, those
who are uninsured tend to express a desire to have insurance but are prevented by low
incomes (Joseph Rowntree Foundation, 1998). Figures are not available to compare

Flooding and the Perception of Risk
55
the propensity of the floodplain population to insure versus the rest of the population
nor is it clear whether floodplain residents are, in general, willing to accept flood
exclusions from their policy in order to reduce premium costs. However, a British
Market Research Bureau (BMRB) survey of property at risk of flooding (BMRB, 2006)
revealed that one third of people had not taken the trouble to discover whether their
insurance policy covered flood risk.
2.7.2 Damage avoidance strategies
Avoidance of flooding or minimisation of damage due to flood is a sensible reaction to
flood risk. Knowledge about flood hazard has no significant effect on damage
reduction unless knowledge is translated into actions. Damage limitation can be
achieved via permanent measures such as installing pumps, elevated construction,
shielding with barriers, waterproof sealing and resilient furnishings (Kreibich et al.,
2005). Temporary measures can also be employed in cases where sufficient warnings
are likely such as removing belongings to safety and installing temporary barriers.
It has been shown through surveys however that such rational behaviour is not carried
out by a majority of the floodplain population. From the Environment Agency
awareness campaign survey (BMRB, 2002) 57% agree that they will take action to
reduce the impact of flooding but only 5% actually do. BMRB (2006) found that only
26% were even aware of the warning systems. EA latest estimates are that only 20% of
at risk residents are on their flood warning database.
The EA/DEFRA survey (EA/DEFRA, 2005) found that flood protection measures
taken by respondents who had been flooded included keeping alert for flood warnings
Flooding and the Perception of Risk
56
(50%), keeping irreplaceable items above the flood level (36%), keeping sandbags
(25%), provision of flood guards/door boards (10%) and building walls or purchasing
pumps (8%) spending on average £1,750. At risk residents who had not flooded were
less likely to have taken flood protection measures.
In Germany the survey undertaken following the devastating Elbe flood in 2002
(Kreibich et al., 2005) revealed that belief in preventative measures actually declined
following the flood. Perhaps this could be in part due to the destructive nature of the
inundation, velocity and depth were so great that many normally effective measures
would have failed to protect property. After the flood only 20% of households
purchased water barriers. Forty percent had some kind of adapted interior fitting.
In the US Burby (2001) noted that less than 15% of property owners have actually
taken action to improve their property in advance of flooding. In Canada, Babcock and
Mitchell (1980) surveyed property owners in Cambridge, Ontario. They found that few
people had done anything to reduce damage potential from flooding. Most of the
evidence in the UK points to the fact that residents in the floodplain look to the
Government as the prime force in controlling the risk of flooding and insurers to pick
up the damage bill. Only those at risk of frequent flooding have the experience and
knowledge to own the problem themselves.
2.7.3 Demands on government
After the 2000 flood event there was a groundswell of local action groups. These
groups can form a very helpful advice function and can liaise with government and
other bodies on behalf of flood victims in a coordinated way. A national body was set

Flooding and the Perception of Risk
57
up, the National Flood Forum (NFF), to coordinate these flood groups (National
Flood Forum (NFF), 2006). This enabled pressure from flood victims to be focussed
and demands for increased flood defence spending ensued.
Within this forum a widespread perception appears to be that it is, ultimately, the role
of Government to deal with the risk of flood. Engineered flood defences appear to be
the preferred option (Gough, 2000, Bruen and Gebre, 2001). The reduction of flood
risk by hard defences is, as discussed earlier, less popular with Government in the long
term. In the short term, in the aftermath of the 2000 event, pressure from media, flood
action groups and insurers led to increased flood defence spending. It may prove to be
the case that this increase is unsustainable due to competing priorities in government
spending. For example in August 2006 flood defence spending cuts were announced to
roars of protest from the insurers (Dey, 2006) and the National Flood Forum.
2.7.4 Buying and selling in the floodplain
Long term attitudes about the sustainability of floodplain property can be expressed by
the tendency to inhabit floodplain property. A real concern for residents is that the
value of their property will be negatively affected by flood risk. The mechanism for
discounting is not always clear however. One might expect that on the supply side,
desire to vacate the floodplain would lead to an oversupply of property in the flood
plain area. Low demand for this property might then lead to price discounting
behaviour. On the other hand a rational buyer may be perfectly willing to buy in the
floodplain subject to a discount that he considers appropriate to offset the risk of
flood. The theoretical perspective is covered in detail in chapter 3.

Flooding and the Perception of Risk
58
Evidence to back up these theoretical positions is sketchy: A survey of Lewes residents
(Puvacharoen, 2003) found that despite high awareness of flood risk and no plans to
further defend the areas at risk, 91% of respondents were satisfied with their area of
residence. Less than half of flood victims would even consider moving to an area with
a lower risk of flood. Vulnerability surveys of previously flooded households reported
in Green et al (1994) showed that while stress was experienced by some flood victims
the population is remarkably resilient. Forty-five percent reported that they hardly
worry abut future flooding, only 22% had spent money to stop water entering the
property and only 17% of residents said when asked that they would move if they
could. Babcock and Mitchell (1980) in Ontario, Canada studied both the actual and
perceived differences in price between flood-prone and flood-free property. None of
the residents mentioned flood risk as a factor when asked about influences on the
selling price of their property. In Germany, moving to a safe area to avoid flooding was
the least considered option in damage avoidance (5% of residents considering it).
Contradicting this positive picture is the fact that some empirical studies of the prices
realised by floodplain properties reveal that discounting can happen. Many surveyors
and investors believe that flooding can have a impact on value in the UK (Building
Flood Research Group (BFRG), 2004, Eves, 2004, Kenney et al., 2006). Salthouse
(2002) refers to large discounts suffered by flooded and designated at-risk properties
and media attention on the likely impact of flooding on property could be a self-
fulfilling prophecy. Following the 2000 floods, focus groups of new residents in two
flooded locations were formed (Thrush et al., 2005). In Woking residents were angry
that their property searches had not revealed flood risk and they felt that they would
Flooding and the Perception of Risk
59
have chosen not to buy in that area had they known. New residents in Bewdley had
some knowledge of flood risk but had not expected to be severely affected.
2.8 SUMMARY
This chapter summarises some of the copious literature on flooding events and flood
risk globally and especially in the UK. Different types of flooding have been described
and the particular flooding relevant to the current study defined. This study will deal
principally with domestic properties at risk from fluvial flooding within the UK.
It has been shown in section 2.3 that the risk of flooding within the UK has increased
in the past decade and that the scale of financial impact is potentially huge. The risk is
forecast to continue to rise, not only due to climate change but also due to planned
development and to lifestyle changes.
The impact of flooding within the built environment has been explored, three main
types of loss are described, direct, indirect and intangible losses. These are all of
concern to researchers and a brief summary of research into these impacts has been
presented. The demonstrated gaps in the current understanding of flood impacts and
the best way to reduce them may have implications for the behaviour of property
stakeholders.
The scientific measurement and prediction of flooding within the UK is described in
section 2.5. The research in this area has been driven mainly by the need to make
decisions at a national and regional scale about flood defence spending. As a

Flooding and the Perception of Risk
60
consequence there is a lack of the detail necessary for making good decisions about
flood risk for a particular property. This also has implications for the researcher in
estimating features of the at-risk population. In essence this population remains
unknown.
Finally this chapter deals with the awareness of flood risk, perception of that risk and
subsequent behaviour of the floodplain resident. This is a central concept for the
intended research. It can be seen that previous literature advances inconsistent
evidence that therefore cannot predict the behaviour of the floodplain resident in
respect of property transactions. Existing studies produce conflicting evidence of the
ability of floodplain populations to ignore flood risk set against empirical data which
shows discounts experienced by sellers in the floodplain. The following chapter
examines the economic theory underlying possible discounting behaviour in greater
depth.
Theoretical Models of House Prices
61
Chapter 3 : THEORETICAL MODELS OF HOUSE
PRICES
3.1 INTRODUCTION
The central aim of this research is to investigate the impact of flooding on the value of
UK residential property. For the purposes of this thesis the primary measurement of
property value employed will be the transacted price because in a competitive market
economy price is the most common and accessible expression of inherent value. A
consideration of price theory, the underlying economic theory behind market pricing is
therefore germane to the research. To understand the way in which aversion to flood
risk could potentially be expressed through housing price it is necessary to understand
both the theoretical value implications of flooding and the practical mechanism by
which this value impact could be expressed in the market price. The specific market in
this instance is the residential property market for England and Wales. In line with the
underlying research philosophy of an empirical evidence based approach, the
quantification of the potential impact of flooding will require the use of a statistical
estimation methodology. To that end an appreciation of the merits of widely used
modelling methodologies in estimating potential discount due to flood risk will be
critical.
This chapter therefore addresses price theory as it relates to housing and the valuation
of disamenities in section 3.2. The current market for housing in England and Wales is
covered in section 3.3. The heterogenous nature of the housing product is then
considered in section 3.4 and sections 3.5-3.8 describe ways in which the heteregenous

Theoretical Models of House Prices
62
housing product can be dissected into its component parts. In keeping with the
pragmatic approach of this investigation, different approaches will be considered
which have been commonly used in the literature relating to valuation of
environmental amenities. In section 3.9 the strengths and weaknesses of the
approaches are discussed.
3.2 PRICE THEORY RELATING TO HOUSING
The theory of house price movements falls into both the fields of macro and micro
economics (Bourne, 1981). Macro economics deals with the actions of supply, demand
and pricing at a national or international level and considers the action of governments
and global organisations such as banks in influencing the way in which large
populations behave. This theory explains the growth or decline in national house prices
against the cost of borrowing, supply of housing and national demographics.
Microeconomic theory or price theory is more useful in explaining the choices
individuals make in choosing one property against an alternative given the constraints
of income, travel options and family needs. It is within this second sphere of
understanding that the present study mostly fits. The supply of new housing at risk of
flooding is a macroeconomic matter dependent upon the supply of land appropriate
for residential development at a national level and the funds available for installing and
maintaining community flood management. However the price of new and existing
floodplain property relative to property not on a floodplain is driven by the individual
purchase decisions of house buyers and their unique assessment of the relative
amenities and disamenities of living on a floodplain. This study will be comparative,
examining prices within local housing markets rather than attempting to predict the

Theoretical Models of House Prices
63
movement of the housing market as a whole. The results of this study, however, could
be used in a macroeconomic sense in predicting the impact of government action for
example flood defences on local wealth. Therefore the relevant theory for application
in the current investigation is price theory as propounded most notably by Friedman
(1976).
At its most fundamental level price theory is the study of the economic problem of the
allocation of scarce resources among competing interests (Watson and Getz, 1981).
Price theory predicts that individuals or organisations will act in their own best interests
in maximising benefits to themselves according to their perception of costs and
benefits. The price of a good or service is a proxy for the value or utility of that good
or service to an individual, organisation or government. The price placed upon a good
or service can therefore give information about the value of a good and can induce
changes in behaviour when the value of one good or service varies in respect of an
alternative. Price theory can be normative in predicting what should happen when
supply or demand for a good changes or it can be positive, that is it can interpret
changes in prices and the supply and demand and explain the link between them. Price
theory can be expressed in the form of economic models which present a simplified
version of the complex relationships which accompany any economic activity and
predict movements in one aspect of interest based upon movements in another.
Increasingly economists are expressing price models in forms which can be tested via
statistical analysis of real life data thereby testing the power of the theory to predict
market movements.
An underlying concept in price theory and price models is the rational behaviour of

Theoretical Models of House Prices
64
individuals and organisations in evaluating the alternative options open to them and
acting accordingly. The consumer evaluates the utility or want-satisfying power of a
commodity and chooses the option with maximum utility. This assumption is both a
strength and a weakness for price theory, the strength lies in the ability to build
consistent models of behaviour. The weakness lies in the truth or otherwise of the
assumption. Modern psychology predicts that consumers do not behave in a rational
manner and yet models based upon this assumption can often predict markets
behaviour very well (Watson and Getz, 1981) and be simple and elegant. Why this
should be so is a vexed question and beyond the scope of this thesis, presumably,
where the models predict well, sufficient numbers of individuals behave in a manner
which looks rational, perhaps due to convention and usage, to make the models work
for practical purposes. The pragmatic stance adopted herein is to build the model on
the assumption of rational behaviour and to test the models with data. After all, one
role of the statistical estimation of various parameters of theoretical price models is to
subject the simplification to evidence and assess how well the theory predicts reality.
Other simplifying assumptions, not necessarily central to price theory but often used in
economic models of markets as though they were, are the notions of perfect
competition with complete information. In a perfectly competitive market transaction
costs are assumed to be zero, all parties have instant access to the information they
need to make an accurate assessment about value. In this ideal scenario with willing
buyers and sellers, price and value can be regarded as the same but in practice there are
no property markets where this is the case. The following section considers the
residential property market in England and Wales and it can be seen that the operation
of the property transfer impedes the action of competition.

Theoretical Models of House Prices
65
The above riders notwithstanding, economic theory would predict that a possible
discount of the price of residential property due to floodplain location might accrue
from multiple sources stemming from the multiple impacts of flooding on property
described in section 2.4. Four principal sources are listed below:
1. Primary flood damage will reduce the habitable living space making the property
less desirable to live in. The discount a rational consumer will apply for this would be
the expected cost to them of restoring the property to pre flood condition over the
lifetime of their ownership. This cost could simply be the actual cost of restoration but
where insurance or aid is available cost to the homeowner could be less or even more
than actual restoration cost.
2. A prospective buyer may consider discounting for evacuation costs in the
expectation that they may have to relocate whilst repairs are made. A rational discount
will include the tangible expenses of relocation and extra travel expenses. It could also
include the less tangible elements of the disruption of the house as a primary social
space giving access to convenient schooling and leisure activities.
3. Emotional wellbeing can suffer in the event of a flood. Health risks, stress impacts,
loss of irreplaceable items due to flooding or the fear of flooding constitute a further
disutility of floodplain living. The value homeowners place on these quality of life
attributes could also lead to discount in floodplain property.

Theoretical Models of House Prices
66
4. Long term investment and financial security is a very serious issue in the purchase
of homes. For many UK residents the home is the most significant financial
investment they will ever make. Many homeowners anticipate that their property will
appreciate in value allowing them to either move up the property ladder or realise
capital for other ends for example retirement income. The expected long term return
on investment and short term borrowing power may be seen to be reduced by the
impact of climate change. Buyers may place a discount on the value of floodplain
homes due to this perceived investment weakness.
In the UK, as discussed extensively in chapter 2, the lay person can hardly be expected
to evaluate any of these costs: experts struggle to do so. Anticipated damage depends
on expected flood frequency, expected flood depth, structural property details,
reliability of flood warnings and so on. Large uncertainties surround the estimates of
many of these factors. Cost of disruption will be highly dependent on the individual
and their lifestyle and vulnerability and preparedness. Even the cost of insurance is
difficult to determine and subject to change. The less tangible elements such as health
impacts and long term investment potential require highly subjective judgements which
will vary widely across potential purchasers. A normative estimate of the expected
discount in residential property price due to flood risk would be difficult to estimate
and would have very large uncertainty bounds due to the uncertainty and imprecision
surrounding direct damage estimates and the subjective nature of the other factors.
It is therefore important to employ another advantage of the statistical estimation of
parameters of price models that is to establish the average market valuation of an
amenity which cannot be predicted from theory. This function is particularly important

Theoretical Models of House Prices
67
when the amenity has a large emotional or intangible element such as aesthetic appeal
or status reinforcement rather than tangible elements such as number of fireplaces or
presence of heating. The risk of flooding, it has been demonstrated above, falls within
this category of attributes and therefore the empirical approach adopted within this
thesis can be seen to be appropriate for the task.
3.3 THE HOUSING MARKET WITHIN ENGLAND AND WALES
Within the UK, property ownership is aspired to by the majority (Doling, 2006). Much
has been written about the growth in the percentage of UK residents who own their
own property over the 1980s partly due to the right to buy policy enabling council
tenants to buy their homes (Shapiro, 2000, Bramley et al., 2004, Doling, 2006). The
Barker review (Barker, 2004) concluded that pressures on the housing market in the
ten years preceeding the report were due to the increase in the number of households
and an under supply of new housing have resulted in an upward trend in house prices.
To improve the housing market in England Barker (2004) estimated an extra 120,000
new homes per annum, over and above the expected rate of construction, would be
required, almost double the expected level of increase. The tendency of mortgage
lenders to increase the multiples of income available to borrowers has also lent fuel to
this uplift. The official Land Registry price index for the period under study as shown
in Figure 3-1 reveals that prices have more than doubled over the past seven years.
Researchers have argued that the price surges originate in the South East and feed
through into the rest of the country in a ripple effect (Alexander and Barrow, 1994,
Cook, 2003). House price growth is seen to differ between regions and even within
them (Wilson et al., 2002, Fleming and Nellis, 2003) .

Theoretical Models of House Prices
68
Figure 3-1 : Land registry price index (source Land Registry (2007))
Property may be sold as leasehold or freehold, most houses are sold freehold whereas
flats are sold leasehold or commonhold (Communities and local government, 2007).
Leases are usually set for 99 or 125 years and tenants have the right under the 1967
leasehold reform act and the commonhold and leasehold reform act 2002 to have their
lease extended or to purchase the freehold under most circumstances, thus a short
remaining term does not necessarily imply that a property will become unsaleable.
Many leases may have a peppercorn rent but oblige the tenants to contribute towards
the maintenance of common areas. Rights and responsibilities associated with a lease
vary enormously (ODPM, 2007), therefore without detailed knowledge of the
conditions of any lease it is not possible to value the freehold or assess impact upon
the value of the property.

Theoretical Models of House Prices
69
UK housing stock is very varied ranging from historic timber framed housing through
brick and stone to modern modular construction. Properties subject to flood risk will
fall into all categories of construction and age bands. Owning a second hand property
is not generally seen as second rate although new properties which are sold with
fixtures and fittings may suffer a discount on first reselling when those fixtures may not
be included or may be devalued by age. Older properties are often subject to
renovation whereby the condition of the property is raised nearer to modern standards
so that the functional age may be different to the chronological age. For some buyers
‘character’ properties may command a premium price (Shapiro, 2000).
The purchasing process itself differs across the countries of the UK. Within England
and Wales properties are advertised for sale by the vendor, or the vendor’s agent, with
an asking price and offers are invited. A vendor will accept one of the available offers,
not necessarily the highest, and then the conveyancing process ensues. The buyer
conducts searches and surveys and may then renegotiate the price, place conditions on
the sale or withdraw their offer in the light of new information for example the
presence of structural problems (Shapiro, 2000). At this point finance is usually
arranged most often via a mortgage secured on the property. The lender therefore may
also have information demands to ensure the security of their investment. This
gathering of information is costly for the potential buyer, usually a solicitor is employed
and the searches have a fixed cost associated with them, these costs cannot be
recovered if the sale falls through. The mortgage lender will usually require the
purchaser to insure the fabric of their new property and will often provide cover as
part of the mortgage deal.

Theoretical Models of House Prices
70
Critical to the potential discount in property price due to flood risk is the awareness of
flood risk at time of purchase. Flood risk may be discovered at various stages during
the process or not at all. Local knowledge, questioning of the vendor or agent or
searching on the Environment Agency website may raise awareness before offers are
made. At the moment a flood risk assessment may be requested at the search stage but
is not a standard or compulsory search. If the buyer or their legal representative is not
alert to the risks then the lender or the insurer may raise the issue. The percent of
property owners alerted at various phases is unknown.
At the point of writing this system is changing with the introduction of seller’s packs.
These packs were designed in an attempt to shorten the conveyancing process,
although experts disagree about whether they will achieve this aim, by providing more
information in advance of offers and there has been a great deal of debate about the
inclusion of flood risk information in these packs. This new system shifts some of the
expense of information onto the seller and may affect the future relationship between
the parties. At this point it is sufficient to note that there may be implications from any
decision to introduce statutory disclosure of flood risk. These implications will be
explored further in later chapters. None of the empirical data utilised involves seller’s
packs.
The process of price negotiation in the majority of residential property transfers in the
UK involves more parties than the buyer and seller, usually there is involvement of a
property agent, an independent surveyor and a lending institution. The relationship
between the initial asking price, offer price and final contractual price is not clear and
cannot be assumed to be consistent across property types or across sellers. Studies into
Theoretical Models of House Prices
71
the negotiation process are rare, since the necessary information is not collected by the
majority of agents. One such study by Merlo and Ortalo-Magne (2004) based on the
English property market observed that 1 in 5 sales fall through, the average time on the
market is 11 weeks to offer and that the fall through of a sale does not usually result in
a seller having to accept a lower price. Length of time on the market however was seen
to have a bearing on final sales price relative to listing price. The experience of the
agent in valuing similar properties will have a great bearing on the accuracy of their
assessment of price. However, the agent could also be seen as a market maker in some
senses, their opinion swaying the consumer’s valuation of a property. In particular a
property agent could be seen as an expert in the assessment of future potential for area
or property improvement. Conversely, if an agent took the view that a particular risk,
such as the risk of flooding, should depress property prices then his discounted
valuation could become a self fulfilling prophecy or might result in floodplain property
being kept off the market due to a perceived difficulty in selling.
It can be deduced from the above summary of some key features of the housing
market for England and Wales that many of the assumptions inherent in economic
models of choice will be breached. In common with property markets worldwide there
does not exist a condition of perfect competition with complete information. The
three most important features of the market for property in England and Wales as
regards this investigation are the information asymmetry, with buyers not always aware
of the flood risk status of their potential purchase, the involvement of financing
institutions which, it has been suggested, may refuse to lend on properties at risk of
flood and the strong growth in house prices which has the potential to mask the
impact of flooding on the price of property.
Theoretical Models of House Prices
72
3.4 THE NATURE OF THE HOUSING PRODUCT
Housing is a complex product which encompasses much more than the bricks and
mortar and the land upon which a house stands. For the property owner a house
performs a multitude of functions, apart from the primary one of physical shelter. A
house provides an emotional base, a place of safety, storage for one’s most treasured
possessions. Owning ones own property provides financial stability, collateral, a long
term financial investment, loan security. Perhaps even more importantly the location or
neighbourhood in which your dwelling place is located provides a social milieu and
defines an individual as belonging to an income bracket, race or religion, “townie” or
“ruralite”, “city slicker” or provincial. There is a great deal of prejudice surrounding
housing location and property size and type (Shapiro, 2000) which translates into
housing value over and above the rational, measurable attributes such as physical size
and accessibility to necessary services.
Bourne (1981) describes the unique attributes of the housing product as fixed location,
durability, slowness in responding to market pressures, complexity and diversity,
exogenous influences, policy overlay, spatial externalities. These attributes may make
housing markets operate in unexpected ways as they limit the supply side of housing to
a relatively fixed combination of housing units in the short term. The supply side of
the housing market is relatively inelastic to house prices in the short term because the
supply of housing available to purchase from existing stock at any one time is
dependent upon many factors other than the price. Since few consumers have multiple
properties the sale of an existing house usually implies buying or at least renting
another house. There is a circular nature to supply and demand because there are few

Theoretical Models of House Prices
73
substitutes to buying a house that satisfy the attribute of providing a dwelling place.
The supply of new housing to the market is a slow process involving the planning and
construction of dwellings which is a heavily regulated activity.
The complexity of the housing product warrants further consideration and it is the
unique characteristic of the housing product which receives the most attention in the
literature. At the most simple level each residential property consists of a unique
bundle of characteristics, structural, locational and neighbourhood/environmental
which determine its suitability for a particular purchaser. Shapiro (2000) states that the
principal factors for determining the value of a residential property with vacant
possession are: location; accommodation; nature of the unit; state of repair, appearance
and quality of finish; the quality and quantum of the fixtures and fittings; the potential
of the neighbourhood for improvement and the potential for the property to be
improved and modernised and the plot size. These general headings group specific
attributes some of which will only be important for particular styles of dwelling or
buyers. Table 3-1 below lists some attributes taken from the property advertisement
pages of a local property paper (Shrewsbury Chronicle, 2007). This is not an exhaustive
or definitive list but it illustrates the range of attributes. Descriptions always mention
structural features and sometimes mention accessibility to services particularly schools.
Language portraying neighbourhood desirability is often used, usually phrased in a
positive manner, although some descriptions such as ‘convenient’ may been seen as
code for location on a busy road. These attributes are used by potential purchasers to
select a subset of properties to view and should therefore include the most details
which, in the opinion of the property agent, are the most important for buyers.
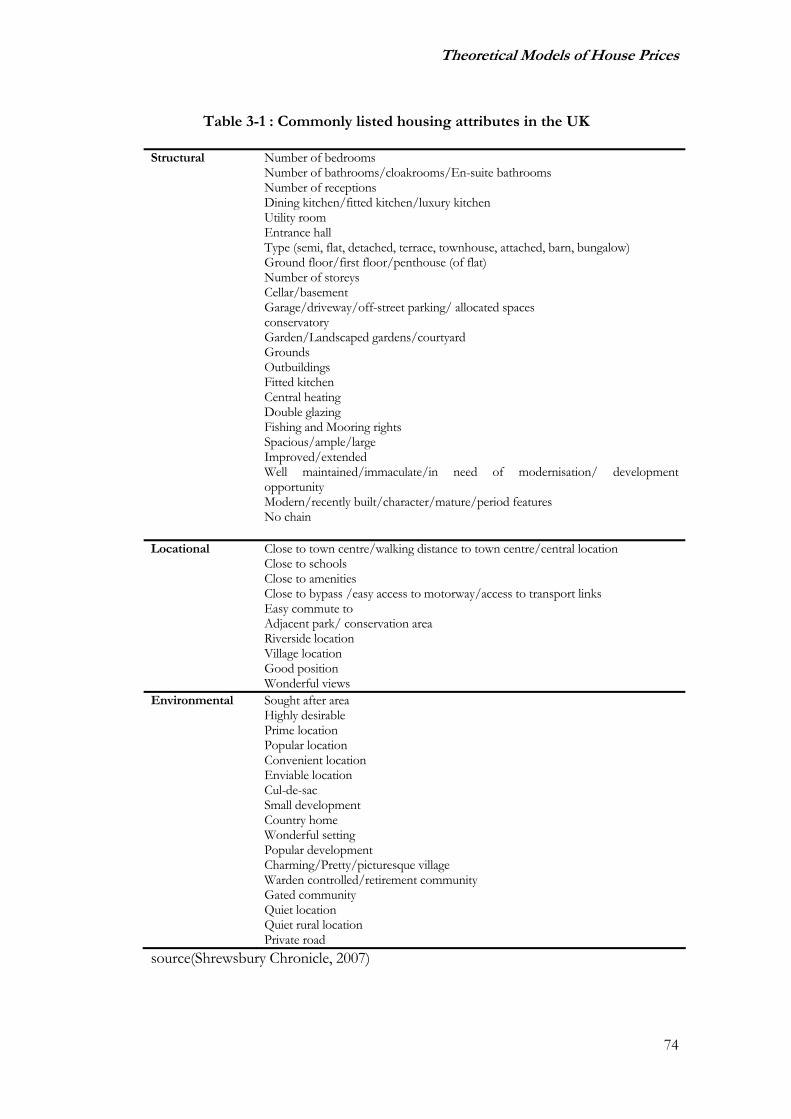
Theoretical Models of House Prices
74
Table 3-1 : Commonly listed housing attributes in the UK
Structural Number of bedrooms Number of bathrooms/cloakrooms/En-suite bathrooms Number of receptions Dining kitchen/fitted kitchen/luxury kitchen Utility room Entrance hall Type (semi, flat, detached, terrace, townhouse, attached, barn, bungalow) Ground floor/first floor/penthouse (of flat) Number of storeys Cellar/basement Garage/driveway/off-street parking/ allocated spaces conservatory Garden/Landscaped gardens/courtyard Grounds Outbuildings Fitted kitchen Central heating Double glazing Fishing and Mooring rights Spacious/ample/large Improved/extended Well maintained/immaculate/in need of modernisation/ development opportunity Modern/recently built/character/mature/period features No chain
Locational Close to town centre/walking distance to town centre/central location Close to schools Close to amenities Close to bypass /easy access to motorway/access to transport links Easy commute to Adjacent park/ conservation area Riverside location Village location Good position Wonderful views
Environmental Sought after area Highly desirable Prime location Popular location Convenient location Enviable location Cul-de-sac Small development Country home Wonderful setting Popular development Charming/Pretty/picturesque village Warden controlled/retirement community Gated community Quiet location Quiet rural location Private road
source(Shrewsbury Chronicle, 2007)

Theoretical Models of House Prices
75
When modelling the price of housing there is a natural inclination to include all of
these attributes which seem important to selling agents but of course some
simplification is necessary to reduce the attributes to measurable variables. In chapter 4
and chapter 6 there will follow further discussion of the attributes used in previous
studies of property value in the UK and elsewhere and the level of success in
measuring them.
Final decisions to purchase, however, are based not only on listed attributes but upon
many other considerations, some objectively quantifiable and others not. Housing is a
classically differentiated good. In practice potential purchasers seek to maximise the
utility of a property within a given budget and make compromises on the various
features of a property such as size, age, condition to meet their specific, but not always
explicitly specified, requirements.
The heterogeneous nature of housing is a major stumbling block in the application of
classical price theory. One might attempt to segment the housing market in order to
reduce the variability between types and quality of dwellings, but two issues render
segmentation problematic. First a housing unit is ultimately unique at the very least in
its physical location. Even within a modern housing estate with a limited pattern of
houses to choose from or a terrace of ostensibly similar property, each property must
nevertheless have a unique location. In most cases this may not change the value
much, but in some instances, particularly when locational disamenities are the focus of
study, locational factors may be crucial. Second even if groups of similar enough
properties could be found and location controlled for, buyers do not segment the
market in such rigid ways. While some buyers may be very specific or clinical in their

Theoretical Models of House Prices
76
specifications of physical characteristics, most will consider a broad range of equivalent
options which will achieve their lifestyle requirements.
Because of these difficulties the use of models which focus on housing as a collection
of attributes rather than as a housing unit has dominated housing literature for the past
thirty years. The most common of these is the hedonic model described below which
uses price data for large numbers of property attribute bundles to reveal the marginal
price of each attribute. Other ways of valuing elements of housing are the experimental
method, repeat sales and the contingent valuation method and are also described
below.
3.5 HEDONIC MODELS
Price theory can be used to estimate the absolute demand for a given good or service
dependent upon the price of that good. It can be extended to operate in competitive
markets where consumers can choose to purchase one of a selection of equivalent
goods or services dependent upon their relative prices and suppliers will provide a
given quantity of the good or service in return for achieving the market price.
Unfortunately for market analysts, in the field of consumer choice theory, perfect
competition, the substitution of freely available equivalent goods dependent upon
price, rarely exists. Competing products are rarely exactly equivalent or homogeneous
except where they are commodities such as electricity. In most consumer markets
companies will seek to differentiate their product in order to add value (even in
commodity markets the notion of customer service can be used to differentiate
suppliers). An extension of demand theory due to Lancaster (Watson and Getz, 1981)

Theoretical Models of House Prices
77
extends the notion of substituting products to the idea of substituting attributes. The
consumption of a good or service contributes many attributes which may also be
contributed by other goods or services not normally considered a direct substitute
(Watson and Getz, 1981). One example of this might be the attribute of physical
warmth which may be achieved by purchasing shelter, improving the insulation of
already existing shelter, consumption of calories, physical activity, burning of fuel or
donning of warm clothing. These purchases would not normally be considered related
unless their common attribute, warmth generation, was identified. The analysis of the
utility of a good or service may be improved by taking account of underlying attributes
and the demand for these attributes over the consideration of the demand for a
product. When a good is viewed as a bundle of these attributes, and if these attributes
can be quantified, then its utility can be decomposed among the attributes by
comparison with the demand for similar products whose bundle differs in some way.
These competing products are known as heterogeneous because they have different
levels of the underlying attributes. This is the basis for the theory of hedonic prices or
implicit prices. Hedonic prices can often be derived normatively as for example the
heat retaining attribute of double glazing could be valued as the cost of the electricity
saved due to its installation. But some attributes can be more difficult to predict
normatively and may require empirical analysis to extract them from the value of a
good, an approach also known as revealed preference. Hedonic price theory has
become dominant in the analysis of housing markets because housing is regarded as a
classically differentiated product.
The hedonic model propounds that a differentiated good can be represented as a
vector of attributes (Z)= (Z1, Z2,…..Zi, ….Zn). Buyers (consumers) and sellers

Theoretical Models of House Prices
78
(producers) hold differing utility functions relating to the vector of attributes. At the
point where the bid functions of the buyers willingness to pay for the vector of
attributes and the offer function of the sellers acceptable minimum price meet the
market clearing price function is determined.
P(Z)=P(Z1,Z2,….Zn).
Rosen (1974) specifies that the functional form for the price function is unknown but
that it is unlikely to be linear over the whole range of attributes. Under assumptions of
market equilibrium and structure the marginal implicit price (MIP) prices are the
expression of economic benefit or loss for small changes in an attribute independent of
the levels of other attributes. The MIP of an attribute can be estimated from the partial
derivative of the price function with respect to that attribute.
ii
ZZPZMIP
∂∂
=)()(
The marginal prices for a particular market may be estimated from observed prices and
attributes drawn from the market. Some form of least squares regression is usually
utilised with functional forms pre-specified. Non-parametric and assumption free
estimations have also been applied.
Hedonic price models have been used within the housing market to quantify structural
characteristics such as the number of bedrooms and presence or absence of a garden.
Implicit prices for softer attributes have also been derived such as the proximity and
ease of access to other goods and service. They have even been used to price the
public good of providing amenities by examining changes in price on the provision of
such goods. Hedonic models had been used for many years and in many markets

Theoretical Models of House Prices
79
before Rosen formalised the theory (Rosen, 1974). Initially it was utilised for mainly
non-spatial goods of variable quality or attributes. Reference is usually made back to
this seminal paper when hedonic studies of the housing market are carried out, but
hedonic studies of the housing market preceded it, for example the Ridker and
Henning study of air pollution (Ridker and Henning, 1967).
Rosen’s paper is subtitled ‘Product differentiation in pure competition’ and, as
discussed above, pure (or perfect) competition does not exist in the housing market.
The paper also goes on to specify many conditions under which the theory is valid
including notably that a state of equilibrium should exist. Housing markets are rarely in
a state of equilibrium and in the current study where a large shock to the system
(flooding) is hypothesised, this condition is likely to be breached. Nevertheless many
authors have carried out hedonic studies and achieved sensible, reproducible and
believable results. Freeman (1979) discusses the validity of the hedonic market for
housing studies and concludes that there are in fact many theoretical objections to
using hedonic models in studies of house prices, particularly studies which value an
environmental good, about which information may be less than usually perfect, as part
of housing attributes or when markets are changing. However, since all economic
models are simplifications and misrepresent reality the judgement should be whether
hedonic models are good enough representations to be useful. Freeman concludes that
hedonic models can be very informative but that care must be taken to avoid
anomalous results due to specification problems. He argues for validity from the
weight of evidence when multiple studies across different locations produce similar
results and urges that biases should be tested for as far as possible.

Theoretical Models of House Prices
80
In respect of this current study the two major drawbacks of the hedonic method are
the large quantities of data necessary to estimate unbiased models and the lack of
temporal equilibrium. The small sample of properties at risk in any location is likely to
make robust estimation of models problematic particularly in the light of the danger
that omitted locational variables may be correlated to the flood risk.
3.6 EXPERIMENTAL OR DIRECT MARKET COMPARISON METHOD
A naturally intuitive approach to the problem of identifying potential discount due to
flood is to directly compare similar properties within and outside the floodplain. This is
the method of valuation most favoured by estate agents, direct market comparison
backed up by gut feel (Clark et al., 1994). What did the last property in this street sell
for? How does it compare with this one? Is there something special about this
property that will command a greater price then the rest in this street. If a very specific
question needs to be answered for a specific location the direct comparison method
can be an efficient and simple approach. However a very good local knowledge is
necessary to identify homogenous properties that differ in only the aspect of interest,
the judgement of the analyst is replacing formal measurement of property attributes.
An extension to this is to identify groups of properties that differ in several aspects and
use experimental design methods to control for variables not of interest and evaluate
variables of interest. An attractive feature of the method is that conclusions can be
drawn fairly rapidly from small samples.
The experimental method will always be open to the criticism that the properties are
not truly homogeneous because of the heavy reliance on the subjective judgement of

Theoretical Models of House Prices
81
the practitioner. The method does not rely on underlying price theory or economic
model, building instead upon empirical observations of differences in realised prices in
a local market at a given time. Extending the results of this kind of analysis to any
other location or time frame is therefore highly risky.
For the purposes of the current investigation, it was recognised that repeat application
of experimental of comparative valuation across multiple sites might build up a picture
of the state of the property market and the discount due to flood risk. An example of
the approach applied to a case study site in the UK can be seen in Lamond and
Proverbs (2006). However, not all flood locations provide conveniently comparable
property, and the level of detailed knowledge necessary to establish comparatives
would preclude the breadth of locations envisaged in this research. Furthermore,
without underlying hypothesis or a structured framework, it would be difficult to
extend the applicability of any findings.
3.7 REPEAT SALES METHODS
Repeat sales models are used when house prices over a longer time period are to be
examined. Serial sales of the same property can be used to measure changes in
neighbourhood or environmental attributes that occurred between these sales. The
repeat sales model has also been proposed as an alternative to price indices constructed
using hedonic methods (Clapp and Giaccotto, 1992, Wang and Zorn, 1997, Leishman
and Watkins, 2002a). This can be regarded as an extension of the hedonic model as
follows :-
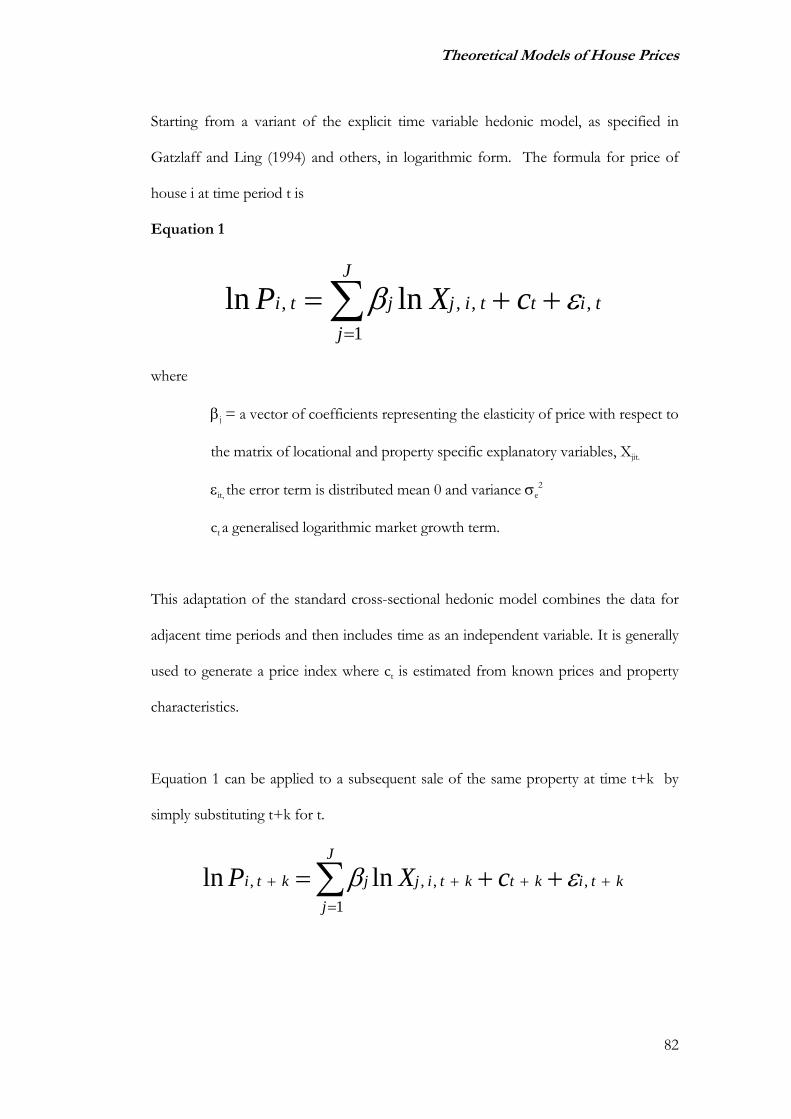
Theoretical Models of House Prices
82
Starting from a variant of the explicit time variable hedonic model, as specified in
Gatzlaff and Ling (1994) and others, in logarithmic form. The formula for price of
house i at time period t is
Equation 1
∑=
++=J
jtittijjti cXP
1,,,, lnln εβ
where
βj = a vector of coefficients representing the elasticity of price with respect to
the matrix of locational and property specific explanatory variables, Xjit.
εit, the error term is distributed mean 0 and variance σe2
ct a generalised logarithmic market growth term.
This adaptation of the standard cross-sectional hedonic model combines the data for
adjacent time periods and then includes time as an independent variable. It is generally
used to generate a price index where ct is estimated from known prices and property
characteristics.
Equation 1 can be applied to a subsequent sale of the same property at time t+k by
simply substituting t+k for t.
∑=
++++ ++=J
jktiktktijjkti cXP
1,,,, lnln εβ
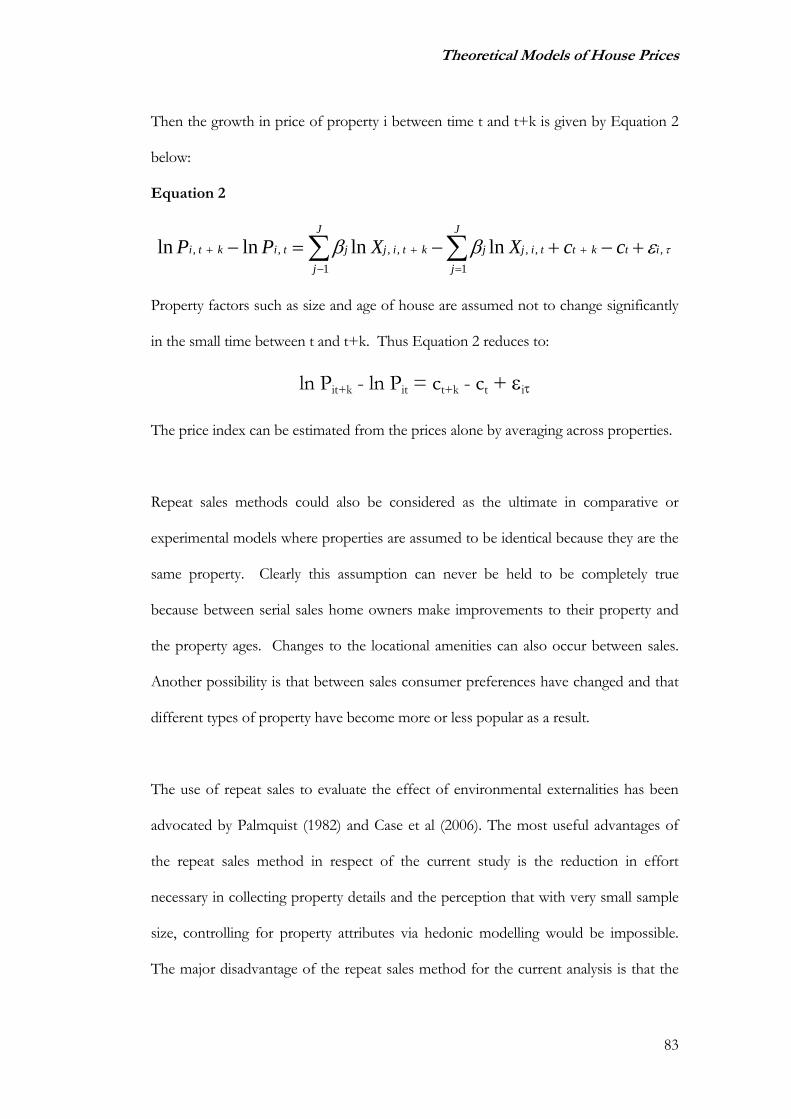
Theoretical Models of House Prices
83
Then the growth in price of property i between time t and t+k is given by Equation 2
below:
Equation 2
∑∑=
+
−
++ +−+−=−J
jitkttijj
J
jktijjtikti ccXXPP
1,,,
1,,,, lnlnlnln τεββ
Property factors such as size and age of house are assumed not to change significantly
in the small time between t and t+k. Thus Equation 2 reduces to:
ln Pit+k - ln Pit = ct+k - ct + εiτ
The price index can be estimated from the prices alone by averaging across properties.
Repeat sales methods could also be considered as the ultimate in comparative or
experimental models where properties are assumed to be identical because they are the
same property. Clearly this assumption can never be held to be completely true
because between serial sales home owners make improvements to their property and
the property ages. Changes to the locational amenities can also occur between sales.
Another possibility is that between sales consumer preferences have changed and that
different types of property have become more or less popular as a result.
The use of repeat sales to evaluate the effect of environmental externalities has been
advocated by Palmquist (1982) and Case et al (2006). The most useful advantages of
the repeat sales method in respect of the current study is the reduction in effort
necessary in collecting property details and the perception that with very small sample
size, controlling for property attributes via hedonic modelling would be impossible.
The major disadvantage of the repeat sales method for the current analysis is that the

Theoretical Models of House Prices
84
repeat sales method can only measure changes in growth patterns over the time period.
Any long term capitalisation of flood risk which predates the analysis cannot be
identified.
3.8 CONTINGENT VALUATION METHODS
Contingent valuation methods are indirect methods in that they do not rely on data
from a market transaction. They are basically a survey of expert or not so expert
opinion relating to the value of a good or service. Market players are asked what they
would be willing to pay for a good or service or how much they would be willing to
accept in payment for a good or service. The contingent valuation method is most
appropriate when the good or service is not traded so no market exists as for example
in the provision of public goods. It can also be used when a part of a good or service is
not traded directly but as part of a package and so may be appropriate in housing
markets. Contingent valuation methods are also useful when the data regarding trades
within a market are not collected or are unreliable and it would be prohibitively
difficult to collect reliable data.
Survey methods for the valuation of environmental goods were initiated by Ciriacy
Wantrup (Cummings et al., 1986) in 1952 and began to be implemented in earnest
during the 1970’s when the seeds of contingent valuation were recognisably sown.
From the outset, however, many issues and doubts about the reliability of contingent
valuation have been expressed.

Theoretical Models of House Prices
85
The problems with bias in estimation inherent in the contingent valuation method are
well documented see, for example, Bishop and Heberlein (1979). Three major
components of bias are gamesmanship, ill informed opinion and the tendency for
respondents to do one thing and say another. Gamesmanship refers to the belief that
responses to the survey may affect the market or public policy and therefore particular
responses may sway things in favour of the respondent regardless of actual truth. Ill
informed opinion refers to the fact that when actual decisions are made a great deal
more thought and research will go into the choice, lack of experience of a situation also
falls into this category. The tendency to do one thing and say another may have many
root causes not least the raising of an issue which would never normally feature in a
respondents thinking, the example of respondents reporting that they would refuse
service to Chinese nationals (Bishop and Heberlein, 1979) when in fact Chinese
nationals had obtained service from these respondents is a case in point. Raising
concern over flood risk could be another. An example of this was seen in the survey
of property owners in Ontario (Babcock and Mitchell, 1980). When asked about
property value few mentioned flood risk but when asked directly about flood risk 90%
indicated that flood risk had a negative effect. No evidence of actual adverse impact
was observable from the sales data. Social pressures and presenting an acceptable
point of view would also lead to respondents reporting a different behaviour to their
actual one
The choice of respondents for a contingent valuation survey will be a crucial factor in
its representation of reality. Brookshire et al (1982) compared contingent valuation to
hedonic methods and did not reject the hypothesis that a bias of up 50% may be seen.
More striking was the asymmetric effect of willingness to pay vis a vis willingness to

Theoretical Models of House Prices
86
accept. Those currently residing in the hazard area were willing to pay far less to move
out of the hazard zone than those living outside the hazard area would expect to
discount. The valuation of zone residents of their willingness to pay to relocate fell
close to the hedonic valuation whilst the valuation by residents outside the zone was
over 5 times as high.
Another interesting comparison was rendered from the cost benefit analysis of a flood
control project in Roanoake, Virginia (Shabman and Stephenson, 1996) where four
choice measuring estimates were available. Contingent Valuation methods were low
when compared with hedonic estimates and with cost based analyses. One quarter of
respondents refused to estimate a willingness to pay, expressing the belief that
someone else should pay and 15% could not put a monetary value of reducing flood
risk. When asked to vote for the project at the expense of increased local taxation in a
referendum, those who expressed most willingness to pay were least likely to vote. It
emerged that the majority of votes for the flood control project came from residents
outside the floodplain and were a mark of civic solidarity with the flood victims.
Due to the expense of conducting house to house surveys, surveys of experts, often
agents, are frequently resorted to. It is not really possible to say how this may impact
upon the various biases inherent in the method although presumably agents should be
better informed about market prices.
For the purposes of the current study the fundamental weakness of the contingent
valuation method is that respondents are likely to be ill informed. There is a lack of
experience in the majority of house purchasers and professional valuers in the UK with

Theoretical Models of House Prices
87
floodplain valuation. Rationalisation of the disamenity of floodplain location when
prompted might result in an overestimate of the impact by the lay person (Babcock
and Mitchell, 1980). They will fail to take into account the amenity value of riverside
location which may in a real life situation outweigh the flood risk. Those with
experience of valuing floodplain property may have a very different perspective. The
timing of any survey in relation to flood events would have a major impact on
estimates of price impact (Shabman and Stephenson, 1996).
3.9 SUMMARY
This chapter has examined the underlying price theory relevant to applications within
the housing market. It has clarified that price is used to give information about the
value or utility of a good or service to an individual or organisation. In this respect if
there is a discount in the price of floodplain property it can be seen as a value put upon
avoidance of the risk of flooding. The theoretical quantification of such a discount is
seen to be impractical in the face of the uncertainty and subjectivity involved in the
evaluation of costs and benefits. Later, in Chapter 5, the comparison of this willingness
to pay to avoid flood risk via price discount and the willingness to pay via insurance
cover will be discussed. This chapter has also outlined some relevant aspects of buying
and selling residential property in England and Wales. It has been demonstrated that a
state of perfect competition does not exist in the property market and that the unit of
housing is not an appropriate entity for measuring the impact of flooding on the value
of residential property. The chapter has therefore dealt with the ways in which the
impact of housing attributes may be measured. All the approaches described above are
seen to have strengths and weaknesses.

Theoretical Models of House Prices
88
For the purposes of the current study the contingent valuation method is seen to have
fundamental weaknesses in the lack of general experience with flood risk. The
contingent valuation method will be excluded from further metholodogical
consideration.
The analysis will therefore be based on market data and some form of revealed
preference method. In choosing this approach, however, the use of data relating to
property which is listed for sale or property which has actually sold will prove a
limitation of the study. The analysis may underestimate the impact of flood risk on
property value because floodplain properties most severely at risk may never come up
for sale in anticipation of large devaluation.
In choosing between market based approaches, no methodology is seen to be wholly
suited to the analysis of a floodplain property market which is geographically diffuse as
is the case in the UK. Invalid assumptions inherent in the use of hedonic models in the
housing market may be an issue particularly as measurement of flood impact will be
attempted over a period when the public perception of that hazard is shifting in the
light of recent flood events. Also the assumption that a continuous spectrum of
housing bundles exist and are available to choose from could well be violated in the
restricted housing markets in the location of a floodplain. The spatial nature of flood
risk and the uniqueness of property locations means that the application of hedonic or
comparative methods will be fraught with difficulties and require much detailed
property level information. Repeat sales methods may offer a more elegant solution.
These issues and the relative merits of alternative market based methods are explored

Theoretical Models of House Prices
89
further in the following chapter which reviews the literature relating to the impact of
flooding on residential property value. It will be seen that all of the above methods and
some novel variations of them have been employed in the past.
Despite the reservations about the invalid assumptions noted above, weight of
evidence may be appealed to if multiple attempts to measure the impact are attempted
and produce comparable findings (Freeman, 1979) Criticisms may be levelled at any
single study of price impact of flooding that, for example a particular floodplain area
grew or declined for reason unrelated to flooding. However the likelihood that multiple
floodplain sites will be affected in the same way relative to non floodplain sites will be
reduced to negligible in the light of multiple analyses of floodplain locations. To that
end the study will attempt to analyse multiple floodplain locations in a structured way
which allows for generalisation of findings.
Having in this chapter examined the theory underlying the use of several house price
modelling techniques and concluded that there are strengths and weaknesses in all
methods the next chapter will deal in detail with past studies. Chapter 4 will assess
studies in flooding, whatever the method employed to assess whether the weight of
evidence regarding the impact of flooding and flood risk on property prices has already
been generated and summarises that evidence. The chapter will go on to assess other
house price models in the hedonic field, and in the area of environmental disamenities,
lessons will be drawn from these previous studies to aid the current research.

Lessons from Extant Studies
90
Chapter 4 : LESSONS AND FINDINGS FROM
ANALYSIS OF EXTANT STUDIES
4.1 INTRODUCTION
Chapter 3 discussed the theoretical basis on which models of house prices may be
constructed but although it drew somewhat from published studies, the results of
extant studies were not considered. This chapter forms a more functional review of the
literature incorporating summaries of results and discussion of the practical
methodological issues.
The weight of evidence argument proposed by Freeman (1979) suggests that some
indication of the impact of flooding on residential house prices might reasonably be
gained via meta- analysis of existing studies. The expectation that populations react in
similar ways to similar risks could lead to the belief that common results might be
found internationally. This practice of using multiple studies in cost benefit analysis is
gaining credence in the environmental field (McComb et al., 2006). To that end,
section 4.2 summarises the findings of existing studies into the impact of flooding and
flood risk on property value.
Section 4.3 considers other housing studies relating to UK housing markets, focussing
on the valuation of amenities and diamenities, in order to develop a model specific to
the UK market. Specific data issues are seen to exist within the UK which are not
present elsewhere. It makes sense for a study within the UK market to concentrate on
aspects of the housing market found relevant by previous UK studies.
Lessons from Extant Studies
91
International studies form the subject of section 4.4, insight may be gained from this
literature into a wider range of investigations and methods. In particular this review
contributes substantially to the understanding of the implications of selection and
omission of key variables. Practical considerations regarding the use of different
methodologies are also considered.
Section 4.5 summarises some of the specific methodological issues emerging from the
literature review which must be addressed in the design of the methodology for
measuring flood impact on residential property in the UK.
4.2 RESULTS OF INTERNATIONAL FLOODING STUDIES
The findings from studies from the developed markets of UK, France, US, Canada
Australia and New Zealand are grouped below by country. Studies from elsewhere in
Europe were sought but proved elusive. When interpreting the results from the
research to date, and particularly its relevance to the UK it must be borne in mind that
different disclosure regimes exist across the world and this seems to be partially
reflected in different observed impacts. Potential purchasers may become aware of
flood risk status at various stages of the buying process. At one extreme personal
experience, or high media coverage, may ensure that all buyers are aware of local flood
issues. At the other extreme sits the normal situation in the UK where there will be ad-
hoc discovery of flood risk.

Lessons from Extant Studies
92
4.2.1 UK findings
Three UK studies (Building Flood Research Group (BFRG), 2004, Eves, 2004,
Kenney et al., 2006) have surveyed experts in the property field regarding their
opinions about the impact of flooding on property value, the property transfer process
and investment decisions. Basically they are contingent valuation type studies with
associated dependence on the experience of practitioners with flood risk valuation. The
importance of the availability of flood risk insurance was highlighted in all three studies
in particular for residential properties if financing was necessary. The findings of the
three studies were broadly consistent but precise estimates of value impact were
lacking. BFRG (2004) found the median discount for residential property to be 12-
15% but the responses indicated a wide range of opinions among valuers even when
working in the same market. Eves was reluctant to fix on an estimate of discount
because of the variability, linking increased discount with increased severity of
flooding. Kenney et al highlighted expectation of effective discounts in capital value of
between 5-15% if insurance were available but stressed the lack of knowledge among
the respondents. There was consensus that property values would recover after a flood
event but there was no consensus on the length of recovery. There was consensus in
that flooded properties may stay on the market longer than other similar properties,
and that a slight discount for floodplain properties not previously flooded may be
expected.
This extant research illustrates both the difficulty of the problem and the need for
some guidance for valuers on the matter. It also follows from these studies that any
consideration of the impact of flooding in the UK must consider the insurance angle.
Another aspect stressed by Eves (2004) in particular is the positive value placed on

Lessons from Extant Studies
93
riverside location, which acts in direct opposition to disincentive posed by the risk of
flood.
4.2.2 French study
A hedonic study of the valley of the Canche, in the region of Nord-pas-de-Calais
incorporating 15 towns and villages carried out by Longuepee and Zuindeau (2001)
found largely insignificant responses to location within the flood zone. The area had
recently been subjected to a major flood in 1995 and data relating to the four following
years were considered. Two interesting aspects of this study were that, first, proximity
to watercourses was tested separately from flood zone status and found to have a
significant positive impact more than equal to the negative impact of being in the flood
zone; and second, multiple flood zones were tested but the only negative impact (11%
not significant) was found to be that of the outline of the actual flood, rather than the
predicted flood zones.
4.2.3 Australian findings
Eves (2002) studied the effects of flooding on the housing market in Sydney. It was
concluded that in periods of flooding there is a discounting effect for flood-prone
property, peaking at about 16%. As the gap between floods increases this discount
ebbs away and flood-prone property catches up with its flood-free equivalent.
Lambley and Cordery (1997) studied floods in Sydney and in Nyngan. In Sydney they
observed some small and temporary impacts. In Nyngan, where the whole town was
deluged, and where again the main effects were temporary, prices were depressed for
about 6 months following the flood. There was some suggestion that a slight
divergence in long-term growth between Nyngan and the control community could

Lessons from Extant Studies
94
have been caused by memories of the flood. An examination of repeat sales of houses
sold immediately following the flood at a depressed price and then resold shortly
afterwards shows the action of opportunist entrepreneurs making gains well above
expected returns, presumably after some investment in reinstatement. Faith in the
long-term recovery in prices seems to be widespread and borne out in reality.
4.2.4 New Zealand findings
Montz (1992) studied the effect of flood events in three New Zealand communities.
No precise estimates of impacts are presented, but the study concluded that all flood
effects are temporary. In Pearoa a temporary dip was observed after the flood followed
by a recovery. In Te Aroha the whole community experienced price decline in the
wake of the flood, not just those properties flooded. Four years after the flood in Te
Aroha the flooded properties had recovered more than the non-flooded. In Thames
while there was no effect for a first flood, a second flood affected the whole market.
Strangely the non-flooded properties seemed to suffer more discount from the second
flood than the flooded properties.
In a further study of two of these communities Montz (1993) demonstrated that
subsequent disclosure of flood risk via planning constraints had no effect on the value
of properties.
4.2.5 US studies
In the US there is great interest in the designation of floodplains because in some areas
of the country, where credit is required, flood insurance is compulsory and is
subsidized by government (Burby, 2001). A summary of results from studies
Lessons from Extant Studies
95
undertaken in the US is presented in Table 4-1. The studies vary between testing
properties actually flooded and properties designated at risk of flooding. This can be a
very important distinction. Actual inundation might be expected to heighten the
concern of potential buyers, if they are made aware of it. Designation on the other
hand may carry with it obligations on the future resident and may not correlate well
with actual flood risk. In many cases the accuracy of categorisation is poor. For
example in Houston, Texas (Skantz and Strickland, 1987) a flood occurred in 1979 and
of the 33 studied properties that were actually flooded only 10 were in the 100-year
floodplain. The research also differs in whether it tests for the temporary effect of
specific events or looks at the long-term static effect of floodplain.
A study by the United States Army Corps of Engineers examined the hedonic studies
previously carried out in the US (Chao et al., 1998) to achieve a confirmation that flood
damage was capitalised into the price of houses in the floodplain. The study concluded
that the case was far from proven. The authors rejected the option of further
investigation using the hedonic method because of the heavy data requirements. Other
results worth highlighting include a study by Tobin and Montz (1994) in Wilkes Barre,
Pennsylvania that found a positive effect of flood in that the prices of flooded
properties were higher after the flood, relative to non-flooded properties. This is
similar to the effects that Montz (1992) discovered in New Zealand. The authors
propose that this may be due to investment in the damaged houses resulting in
improved quality in the flooded sub market. In Wilkes Barre it could also be attributed
to the lack of alternative property. The Skantz and Strickland (1987) study observed no
direct impact following a flood but saw, albeit weak evidence, that later insurance
increases triggered a depression in house prices.

Lessons from Extant Studies
96
Table 4-1 : Summary of findings from US flooding studies
4.2.6 Canadian findings
The Canadian experience is somewhat different; floodplain regulation is weaker than in
the US and is aimed at controlling development on the floodplain. Disclosure is not
widespread and so perhaps it is not surprising that of seven studies quoted by
Schaeffer (1990) only one found any significant discount. The Schaeffer (1990) study
itself, based on a very small sample, produces confusing and inconsistent results.
Three different methodologies are applied and the outcomes are dependent on the
YR AUTHORS PLACE FLOODPLAIN EFFECT
2006 Bin, Crawford, Kruse and Landry
New Hanover County North Carolina (coastal risk)
-11%
2004 Troy and Romm California -4.2% 2003 Bin and Polasky Pitt County North Carolina -8.3% post flood
-3.7% pre flood 2001 Harrison et al Alachua County, Florida -2.9% 2001 Shultz and Fridgen Fargo/Moorhead
NorthDakota/Minnesota -9%
1994 Tobin and Montz Des Plaines, Illinois No effect
1994 Tobin and Montz Linda and Olivehurst California
-30% >10ft flood
-10% 18” flood
1994 Tobin and Montz Wilkes Barre, Pennsylvania Positive effect. 1991 Speyrer and Ragas New Orleans, Urban
Suburban -6.3% -4.2%
1990 Bialaszewski and Newsome
Homeworld Alabama no effect floodplain location
1989 Shilling et al Baton Rouge, Louisiana -8% floodplain location 1989 Donnelly La Crosse, Wisconsin -12% floodplain 1987 Skantz and Strickland Houston, Texas No effect until after an
insurance rate increase 1987 Macdonald et al Monroe Louisiana -8.5% 1979 Zimmerman New Jersey No effect 1976 Shabman and Damianos Alexandria, Virginia -22%

Lessons from Extant Studies
97
methodology. One approach yields no significant effects while the others show
marginal price depression due to floodplain. The effect of subsequent designation is
seen, against expectation, to raise the prices of designated property.
A survey of homeowners by Babcock and Mitchell (1980) seems to show that even in
high-risk areas, and with homeowners, who had suffered flooding in the past,
perception of risk is low and very few had purchased flood insurance. This was
reflected in the house price data where no significant impacts were detected.
4.3 UK STUDIES OF OTHER AMENITIES AND DISAMENITIES
In the UK there have been a number of studies into the effect of locational
externalities on the price of property. One of the main areas studied is that of the
transport infrastructure. Forrest (1996) examined the impact of the MetroLink on
house values around Manchester. Henneberry (1998) looked at the impact of light
railway on the price of property in Sheffield and Gibbons and Machin (2005) used
transport innovations to value rail access in London. Education value is another area of
interest with schools being the subject of study by Cheshire and Sheppard (2004),
Leech and Campos (2003) and Gibbons and Machin (2003). Other studies examining
environmental amenities include Garrod and Willis (1992) studying the effect of
woodland; Orford (2002), Day (2003) and Lake(1998) modelling a whole basket of
influences via Geographical Information Systems including parks, views and noise
pollution; Gibbons (2004) estimating the effect of property crime and Sims and Dent
evaluating the impact of wind farms (Dent and Sims, 2007) and overhead power lines

Lessons from Extant Studies
98
(Sims and Dent, 2005). In most cases a hedonic or adapted hedonic model is used and,
increasingly, large numbers of independent variables are essayed.
The most common included variables are listed in section 4.4 where a comparison is
made with the international literature, they are on the whole structural. The way in
which neighbourhood attributes are measured differs a lot more study to study which
might explain why neighbourhood attributes feature less in the top ten. In UK studies
the concept of neighbourhood is usually treated either with dummy neighbourhood
variables or some variant of socio-economic variables such as census measurements of
housing density or tenure. Derivatives of these census variables are also available in the
form of classifications such as the ACORN neighbourhood categories and are used by
two studies. Some authors, notably Day et al (2003) and Orford (2002) also include
multiple distance measurements at varying levels of detail.
The availability of data is a major issue for housing studies in the UK (Costello and
Watkins, 2002). Listings data such as that available in the US and Australia are not
collected. The situation is slightly different across the countries of the UK with the
register of Sasines in Scotland releasing housing transaction data but the Land Registry
in England and Wales refusing to do so until very recently. Consequently most studies
have used building society data or asking prices. A recent move by the Land Registry
means that transaction value data is available but without associated property details.
Data issues are explored further in chapter 6 but here it is noted that to gain complete
market coverage of transaction information with associated property details would
involve collating data from more than one source.

Lessons from Extant Studies
99
Interesting variations on the hedonic model are the use of repeat sales by Gibbons and
Machin (2005). Use of a difference model removes the need to collect property
characteristic data in the model. Leech and Campos (2003) use a block design to
obviate the necessity of including all locational variables save the one of interest.
These ideas are developed further in the methodology proposed below and were a
valuable outcome of the UK literature survey.
There is a vast literature on the construction of price indices and on forecasting the
property market at an aggregate scale, most of which is not relevant to the modelling
of the small scale problem of flood modelling. Local price indices are of interest
however and there are basically two schools of thought about their construction,
namely the cross sectional hedonic and the repeat sales method. The Halifax building
society is a leading proponent in the hedonic index field (Fleming and Nellis, 1986).
Costello and Watkins (2002), Leishman and Watkins (2002b), Leishman and Watkins
(2002a) and Lima and Pavlou (2007) deal with the estimation of local repeat sales
indices.
Submarkets are considered by many authors, either in their own right (Jones et al.,
2004, Meen, 2005) or as part of a wider study (Day, 2003). These are very interesting
issues but the migration data available in the UK is not of sufficient detail to aid in the
micro-analysis necessary for flooding studies.

Lessons from Extant Studies
100
4.4 METHODOLOGICAL REVIEW OF INTERNATIONAL HOUSING
STUDIES
The focus of this section is a methodological assessment of alternative transaction
based models in a practical sense. It draws upon past reviews of the area and considers
in detail the question of selection of variables for analysis.
A review of hedonic models which included measures of environmental externalities
was carried out by Boyle and Kiel (2001). The research conclusions stress the need to
include all relevant measures of the externality, to include all other relevant variables
and to look at the information pathways by which home owners assess the externality.
Omitted variable bias can be a problem for hedonic studies and it is particularly
important to consider those variables which might be correlated with the focus
variable.
Butler (1982) reports the results of an experiment in omission of variables. In general
the findings are that there is little detrimental impact on the predictive ability of such a
model due to omission. It is the interpretation of coefficients that suffers but only in
the case where the included variable is correlated with one or more omitted variables.
At the same time Butler (1982) acknowledges that mis-specification of the model is
inevitable. In modelling house price the researcher is at best making a local
approximation to a much larger and more complex underlying relationship. Many
different specifications may be equally appropriate approximations and there is no
objective way to judge between them.

Lessons from Extant Studies
101
Consideration of appropriate variables to include in a model will often be pragmatic,
based on availability and due to the expense of measuring environmental externalities it
is rare that more than one will be included in a single study. A comprehensive analysis
of hedonic studies of house prices was carried out by Sirmans et al (2005). The findings
from 125 hedonic models were compared and the most frequently used attributes were
tabulated as shown in Table 4-2. The total number of different variables included in
these 125 studies numbered 357, of which 272 had been found to be significant in at
least one study. The number of variables is made greater by the fact that the authors
list different ways of measuring the same underlying concept such as lot size, log of lot
size, lot perimeter. However the analyst must choose between these different ways of
measurement as well as the basic concepts.
In this paper the authors also perform some meta-analysis comparing regional
variation on responses throughout the US but this is of little relevance to the current
study except to note that findings can vary across regions and are much more likely to
vary across countries. It is also notable that some of the most commonly featured
variables in past studies are unlikely to be relevant in the UK for example the presence
of a pool or air conditioning. Furthermore, although there are a large number of
candidate variables to be included in any hedonic model, there is little consistency
among models. Only the top 20 variables are tabulated above but among these many
are only included in 12 examples ie less than 10% of hedonic models include these
variables. Many of the less featured variables appear in only one study.
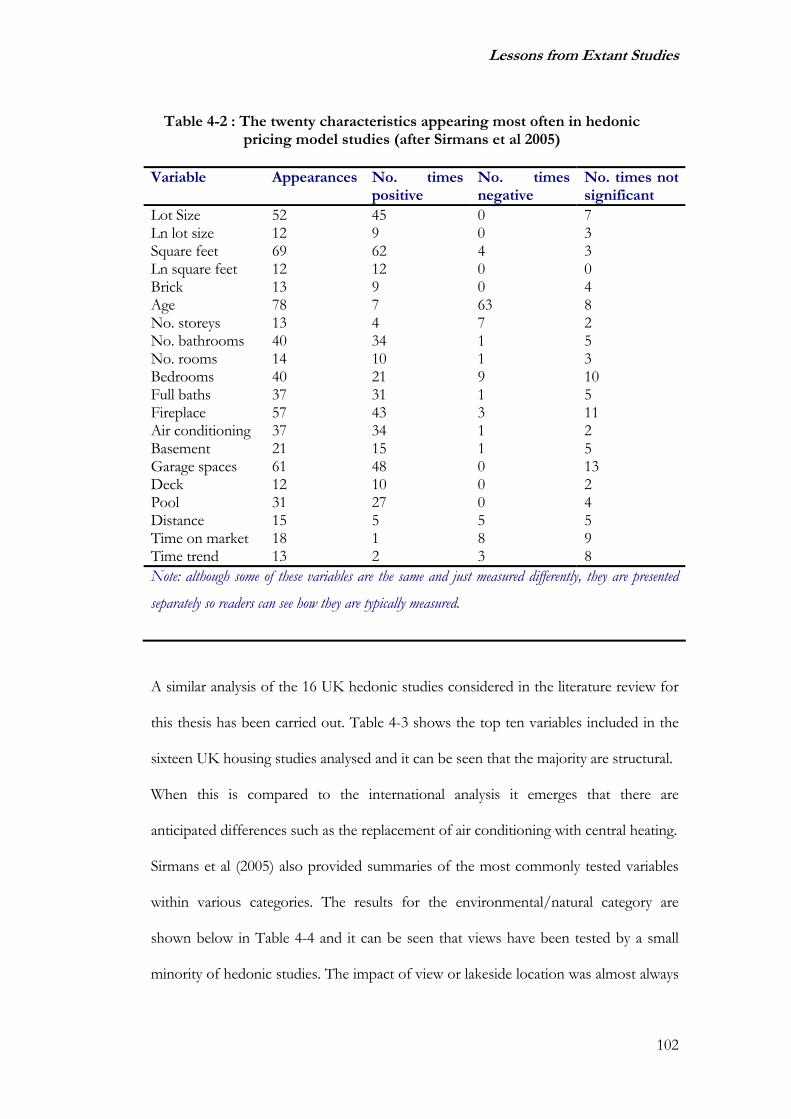
Lessons from Extant Studies
102
Table 4-2 : The twenty characteristics appearing most often in hedonic pricing model studies (after Sirmans et al 2005)
Variable Appearances No. times
positive No. times negative
No. times not significant
Lot Size 52 45 0 7 Ln lot size 12 9 0 3 Square feet 69 62 4 3 Ln square feet 12 12 0 0 Brick 13 9 0 4 Age 78 7 63 8 No. storeys 13 4 7 2 No. bathrooms 40 34 1 5 No. rooms 14 10 1 3 Bedrooms 40 21 9 10 Full baths 37 31 1 5 Fireplace 57 43 3 11 Air conditioning 37 34 1 2 Basement 21 15 1 5 Garage spaces 61 48 0 13 Deck 12 10 0 2 Pool 31 27 0 4 Distance 15 5 5 5 Time on market 18 1 8 9 Time trend 13 2 3 8 Note: although some of these variables are the same and just measured differently, they are presented
separately so readers can see how they are typically measured.
A similar analysis of the 16 UK hedonic studies considered in the literature review for
this thesis has been carried out. Table 4-3 shows the top ten variables included in the
sixteen UK housing studies analysed and it can be seen that the majority are structural.
When this is compared to the international analysis it emerges that there are
anticipated differences such as the replacement of air conditioning with central heating.
Sirmans et al (2005) also provided summaries of the most commonly tested variables
within various categories. The results for the environmental/natural category are
shown below in Table 4-4 and it can be seen that views have been tested by a small
minority of hedonic studies. The impact of view or lakeside location was almost always

Lessons from Extant Studies
103
found to be positive. Views of one sort or another appeared 31 times including ocean
and mountain views and proximity to stream. The overwhelming conclusion is a
positive impact of view, only two cases failed to find significantly positive impacts.
None found a negative impact. This is an example where Freeman’s weight of
evidence (Freeman, 1979) suggests that the presence of a view could be considered as a
positive influence on the price of housing.
Table 4-3 : Top ten variables included in UK hedonic studies
A good view is a nuisance factor for the proposed study because it is likely to be
correlated with riverside location and therefore flood risk. One study which tested
both negative and positive aspects of waterside living was Speyrer and Rajas (1991) in
the US. They found that the positive effect of lakeside location was greater than the
discount due to floodzone status. Bin et al (2006) also tested coastal view in a GIS
methodology designed to disentangle view from flood risk and found large positive
impacts of view.
Variable Number of occurrences
In Sirman’s top twenty
House Type 14 No Presence of garage/double garage 14 Yes Central Heating 13 No Number of Bedrooms 10 Yes Floor Area of property 10 Yes Age 8 Yes Number of bathrooms 8 Yes Neighbourhood dummy 8 No Central Business District distance 6 No Garden 6 No Studies included (Wabe, 1971, Fleming and Nellis, 1986, Pennington et al., 1990, Garrod and Willis, 1992, Forrest et al., 1996, Shinnick, 1997, Henneberry, 1998, Adair et al., 2000, Fletcher et al., 2000, Orford, 2002, Gibbons and Machin, 2003, Leech and Campos, 2003, Gibbons, 2004, Gibbons and Machin, 2005, Sims and Dent, 2005)

Lessons from Extant Studies
104
Table 4-4 : Top four characteristics in the environmental/natural category from hedonic pricing model studies (after Sirmans et al, 2005)
Variable Appearances No. times
positive No. times negative
No. times not significant
Lake view 5 5 0 0 Lake front 5 5 0 0 Ocean view 4 4 0 0 “good view” 4 3 0 1
Studies which use methods other than the hedonic approach are not considered by
Sirmans et al (2005) but include the repeat sales analyses favoured by Palmquist (1982)
and Case et al (2006). Palmquist (1982) proposed the repeat sales methodology in order
to reduce data demands in studying environmental effects. As discussed in Chapter 3
the repeat sales method can be regarded as a variant of the time variant hedonic model
with the majority of characteristics held constant over time. The method is judged to
be appropriate where there has been a change in the environmental quality of the
properties which is not uniform and where the coefficients of an underlying hedonic
model are constant over time. In comparing this simplified method with a hedonic
regression for the same data the author concluded that the two methods produced
comparable results. The assumption of constancy of hedonic coefficients over time, a
necessary one if the repeat sales specification is to be used cannot really be tested
without comparison data. However in the relatively short data sets available in the UK
changes are less likely than in longer runs. There remains the possibility that the flood
event itself has changed the underlying hedonic model dominating the utility function
and diminishing or changing the importance of other attributes. For example riverside
location might suffer a reversal of sign in the aftermath of a flood. The repeat sales
model would attribute this effect to flood impact – it is debatable whether or not this

Lessons from Extant Studies
105
would be a false attribution or whether a hedonic model would be able to satisfactorily
disentangle these nuances. Case et al (2006) use a hybrid technique in their study of
condominium prices. Hybrid techniques can remove the assumption of constant
hedonic coefficients but, crucially, require more data on these attributes.
Leischman and Watkins (2002b) investigated the use of repeat sales indices on UK
housing data. They constructed regional price indices using data available in Scotland
from the register of Sasines. The study compared two methods of constructing the
indices and benchmarked against average price indices. The relative merits of repeat
sales versus hedonic models are discussed at length; in particular the advantage in
terms of reduced data collection is highlighted. Previous studies have asserted that
there may be bias introduced into repeat sales indices due to the subset of repeat sales
being unrepresentative of the market as a whole. Either a positive bias due to the over-
representation of development property (Steele and Goy, 1997) or a negative bias due
to over-representation of low standard, frequently traded properties (Clapp and
Giaccotto, 1992) might occur. However the conclusion is that repeat sales models can
provide a sound basis for constructing indices of local markets. In the past, lack of data
has meant that repeat sales models have been largely neglected in modelling UK
housing markets. Recent developments at the Land Registry, however, have made the
data more readily available and the Land Registry have launched a regional price index,
based on the data (Lim and Pavlou, 2007).
Studies in the US have compared repeat sales, hedonic and hybrid methods and results
are not conclusive. Gatzlaff and Ling (1994) however conclude that biases in the
samples can occur, especially in short run data, but that in the longer term the methods

Lessons from Extant Studies
106
produce very similar results. Comparison of the means of the repeat sub-sample with
the total population can allay any worries about representation. In addition the model
proposed below involves comparison of repeat sales populations. As noted by Gatzlaff
and Smith (1993) in a study of the Miami metrorail, any sample bias will be the same
for both control and test properties. Palmquist (1982) proposed the use of repeat sales
models to measure the impact of environmental nuisance on the price of property with
particular reference to noise pollution. The primary requirement is a change in the
environmental quality of the properties which is not uniform among properties.
Montz (1993) used a form of repeat sales to examine flood effects in New Zealand.
Ratios of prices before and after a devastating flood were modelled against depth of
flooding and the number of quarters between sales. In the case of Paeroa, counter
intuitive results were found: depth of flooding was positively related to price ratio. No
significant effects were detected in the two other sites analysed. Market inflation was
not dealt with explicitly, although from data presented elsewhere in the paper it would
seem that prices had not appreciated a great deal in the time frame.
4.5 LESSONS DRAWN FROM PAST STUDIES
The above examples of research examining the influence of flooding on property value
illustrate some of the issues that will face the proposed research in the UK. This
section summarises those issues which are likely to be most relevant for the current
research. Some of the problems will not be fully overcome in the study and will be
borne in mind as limitations. For other problems, useful lessons are highlighted that
can be applied in the research design.

Lessons from Extant Studies
107
4.5.1 The time varying nature of flood response
As time elapses after a flood event the memory of the event fades (Penning-Rowsell
and Peerbolte, 1994). For some flood victims the trauma of flooding will remain with
them indefinitely but for others the feelings will subside. For the community as a
whole, turnover of property will ensure that the average experience with flood will also
decline with time. The rate of forgetting will vary with the stability of the local area and
can be affected by disclosure regulation or by the action of organisations such as the
Environment Agency or local flood groups. The tendency of the community to forget
about flood risk can be reflected in the value impact of flood as examples in the
literature demonstrate.
BFRG (2004) in their questioning of surveyors enquired about the length of time to
recovery of a flooded property. There was very little consistency in the responses, with
some suggesting under a year and others anticipating longer than an eight year impact.
In Nyngan, Australia the whole town was inundated in 1990 at an estimated cost of
$50 million (AUS) and subsequently the flood defences were raised to increase future
protection. Lambley and Cordery (1997) compared the average house value in Nyngan
with its flood free neighbour Gilgandra. For about 18 months following the flood
there was a divergence in trends with the Nyngan property declining in absolute value.
Two years after the flood, property values in Nyngan had recovered and caught up
with their flood-free neighbour. An interesting facet of this study was the observation
that trading in property never stopped and there was evidence of entrepreneur activity
with houses bought at a discount just after the flood appearing again on the market

Lessons from Extant Studies
108
within four years at a greatly increased price. Lambley and Cordery (1997) suggest that
flooded property should not be sold in the immediate aftermath, residents should be
encouraged to restore their property and sit tight for the recovery. Their research also
confirms the fact that residents can place false confidence in defence works. Although
the banks were raised this does not ensure total safety from future inundation.
Tobin and Montz (1994) have studied multiple flood sites and observed different rates
of recovery. In one example, Linda and Olivehurst in California, the most severely
affected properties had not recovered completely after ten years. It is interesting to
note that in this instance some houses had not been reinstated and served as a visual
reminder of the flood.
Firstly consider the case where a flood or new legislation imparts new information on
risk to the market. The house buyers’ perception of the relative desirability of
properties in and out of the floodplain will change after the event. Harrison et al (2001)
built three models, one before and one after the implementation of the National Flood
Insurance Reform act in 1994 and one over the whole time period. They found that
the price discount due to floodplain location doubled after the implementation, while
estimates of other factors remained fairly robust across the time periods. The third
model, utilising the whole time period and including a dummy for post implementation
discount gave an even higher estimate post reform discount, however, this is no longer
significant. Their results demonstrate the danger of using a global model, in this case
detecting no significant effect from the legislation. Research should begin, if possible,
by estimating pre and post flood and testing whether the models are significantly
different. An alternative to using different models would be to use a model that allows

Lessons from Extant Studies
109
for time varying effects. Tobin and Newton (1986) present theoretical profiles of the
utility impact of flood on land values which are discussed and developed further in
chapter 6.
4.5.2 The impact of age of property
In repeat sales analysis studies the ageing of property between sales is regarded as a
nuisance factor. In the UK market, as discussed in chapter 3, the impact of the age of
property on its desirability is not clear. The result from hedonic studies shows that the
evidence on the impact of age is not consistent. Age was the most frequently included
variable but the treatment of the variable was not uniform, neither were the findings.
Clapp and Giacotto (1998) discuss the concept of age, noting the correlation between
age and location, given that housing tends to be developed in tracts. They also observe
that there may be a vintage effect where older housing may sell at a premium and that
some studies do in fact observe positive coefficients for age.
In the UK age of house is highly correlated with its overall size (Wilkinson, 1973) and
so may to a certain extent proxy for that variable. Older properties tend to be larger
(ABI/BCIS, 2005) and on larger plot sizes. Average age of property in the UK is quite
high (Bourne, 1981) and older housing will almost always have undergone some
refurbishment resulting in modern amenities. Pennington et al (1990) observed that the
age variable derived from building society data was not wholly continuous, tending to
cluster around 25, 30 and 50 years. Pennington et al (1990) tried various formulations
settling on a squared and cubed age variable based on significance in the regression
model. Gibbons (2004) used age of property in hundreds of years and observed a
significant positive effect. Forrest (1996) experimented with two different formulations

Lessons from Extant Studies
110
for age in the study of an urban railway system. Use of age categories rather than a
continuous age variable had very little effect on the estimation of the focus variables
but showed a non-linear effect with houses post war (1945-69) proving less expensive
than those pre-war (1915-1944) although the lowest value houses were pre 1915. For
the present study small changes in the age of property will be ignored. The aging of
property over the period analysed will be considered to be insignificant. An age
category approach will be adopted in any hedonic specifications in order to allow for
non-linear effects.
4.5.3 Data requirements
It is clear from the above analysis of previous hedonic studies that the estimation of a
hedonic model which will adequately explain the discount due to flood status needs to
involve a large number of candidate variables. Data on correspondingly numerous
transactions would be required in order to estimate these models adequately. Previous
flooding research has been carried out on samples ranging from just under one
hundred (Bialaszewski and Newsome, 1990) to many thousands (Troy and Romm,
2004). Typically if flood designation is studied then more observations are available
than if an actual flood is examined.
Collecting sufficient detailed data on properties in one location would be an onerous
task. Given the geographical dispersal of floodplain property in the UK, and the
necessity, identified in chapter 3 to analyse more than one location, this onerous task
will be multiplied into a Herculean one. In the context of this study and with the
limitation of time and resources inherent in a doctoral remit it would be impractical to

Lessons from Extant Studies
111
attempt to develop multiple hedonic models. A methodology which reduces the
burden of data must therefore be sought.
4.5.4 Dealing with market inflation
If a purely cross sectional hedonic model using observations sufficiently close in time is
constructed then market inflation may be ignored. However in the study of floodplains
both the paucity of data and the need to examine changing effects over time make the
consideration of a longer time period desirable. Some method of dealing with inflation
is therefore necessary, particularly in the light of the large house price inflation seen in
the market for England and Wales in section 3.3. Methods employed in previous
studies include discounting (Bin and Polasky, 2003), a time trend variable (Skantz and
Strickland, 1987), dummy variables for each year (Speyrer and Rajas, 1991) and the use
of a control group (Shabman and Damianos, 1976, Montz, 1993). All these methods
have advantages and disadvantages. Time trend variables in linear models have the
defect that they can only generate a steadily increasing (or decreasing) market; in real
examples this is not very likely. Dummy year variables can allow for non-monotonic
trends in house prices. Comparison against a control group requires very careful choice
of the control group. Use of discounting raises the problem of which discounting
factor to use, national price indices are not appropriate for local studies and local price
indices are not always available and can be volatile. For this thesis local price indices
will need to be constructed with the caution that the small sample sizes available could
lead to volatility in the index.

Lessons from Extant Studies
112
4.5.5 Choice of functional form
Where a regression model is used, many authors discuss the use of different functional
forms. Theory does not predict a particular relationship (Rosen, 1974) and so the
choice of form is an empirical one, often based on best fit. Linear and Log/linear are
the most common selection, for example Bin and Polasky (2003) used a log transform
for distance related variables based on the experience of other housing studies. Troy
and Romm (2004) used a semi logarithmic model after examination of residuals from a
linear estimation. In the flooding literature, where more than one form has been tried,
the overall conclusions have not differed between models (Shilling et al., 1989).
Sirmans et al (2005) restates the three well recognised advantages of the log linear
specification commonly quoted, namely that this reduces heteroscedascity, that the
coefficients are readily interpretable as elasticities and that it allows for variation in
dollar values of different characteristics. Log/linear model forms are shown in the
theoretical developments quoted in this thesis as they are the most common. However
the appropriate model form should be explored and, during the empirical phase, tests
for heterogeneity and normality will be carried out before accepting the log/linear
model.
4.5.6 Homogeneity of floodplain markets
The definition of a housing market for the purposes of comparative pricing analysis is
usually based on a geographical area which the analyst perceives to be sufficiently
homogeneous. This may not be an accurate picture of the market for housing, the
possibility of submarkets should be considered because if they exist then building a
single model of the whole market may not be an effective strategy resulting in poor

Lessons from Extant Studies
113
estimation and reducing explanatory power. Substantive differences in the markets for
floodplain and non-floodplain property could arise from differences in type of
property. In New Zealand Montz (1993) found that the average physical attributes of
floodplain houses differed from those outside the floodplain and therefore compared
trends within sub markets. The characteristics of buyers may also create submarkets,
they might be poorly informed individuals, cash buyers or buyers who are in the
market for “development” or “investment” property. Troy and Romm (2004) for
example found that hazard disclosure had a significantly greater impact on the price of
housing in Hispanic neighbourhoods of California than in non-Hispanic communities.
MacDonald et al (1987) split their dataset to check the homogeneity of their test
neighbourhood. They observed higher flood impacts on the price of property in one
neighbourhood that consisted of higher priced properties. Research should consider
likely sub markets to ensure that smoothing across sub markets does not affect
significance testing but also to generate a deeper understanding of the underlying
process. In this study investigation of different property types may be possible but it is
unlikely that sufficient data will be available to carry out rigorous testing. It is hoped
that by selecting small neighbourhoods in given flood locations homogeneity will be
achieved but this cannot be guaranteed. This will be a limitation of the current
research.
4.5.7 Collinearity
If the independent variables used in a predictive model are correlated to one another
then they are described as collinear. This is a common problem in housing studies
where, for example, lot size will be strongly related to house size. In particular as

Lessons from Extant Studies
114
discussed above when estimating flood impact the nuisance variable of view might be
strongly correlated with flood risk. In a hedonic regression model collinearity results in
biased estimates of the partial regression coefficients; they cannot then be used for
robust prediction. In choosing to eschew hedonic models for the major part of this
empirical study it is hoped that the issue of collinearity will be avoided.
Most authors in this literature search have ignored or sidestepped the problem of
collinearity, simply selecting the variables with the most explanatory power.
Presumably the assumption is that there will not be much correlation between flood
variables and the rest. Troy and Romm (2004) touch on the issue. Their model
included a Hispanic/disclosure interaction term that demonstrated that the strength of
the effect of disclosure varied with the percent of Hispanic residents. Hispanic
concentration was highly correlated with floodplain location, they posit due to
financing arrangements. Bialaszewki and Newsome (1990) tested whether
multicollinearity had affected their results using stepwise regression and by examining
the correlation between other independent variables and the flood variable. They
concluded that it had not changed the outcome. Collinearity can be dealt with by a
number of methods such as principal components analysis or residualisation, see
Donnelly (1989) for an application of residualisation.
4.6 SUMMARY
The outcome of published analyses into the effect of flooding on property prices has
produced a wide range of estimates. This is in part due to differing definitions of flood
effect and also to the proximity of a flood event. The measured effect of flooding is

Lessons from Extant Studies
115
also highly dependent on local issues such as frequency of flooding and availability of
alternative housing. Some studies observed that there was no depreciation due to
flooding. One counter-intuitive result is observed in which flooded houses increased in
value relative to non-flooded. This could be explained by the impact of reinstatement
resulting in betterment. The impact of flooding on property prices in the UK cannot
therefore be predicted from extant studies.
However there is some consensus that the impact of a flood event on price declines
over time as people forget about it and permanent capitalisation of flood risk into price
is largely due to regulated disclosure of flood designation. None of the existing
methodologies described in the literature are specifically designed to take account of an
impact which varies over time. Most previous research either ignores the time factor or
use snapshots at arbitrary time periods. An objective of the research programme which
flows directly from the literature review will be to provide a strategy or methodology to
deal with this anticipated feature of the data.
In the published research some form of hedonic modelling is the preferred
methodology where sufficient data is available. Data limitations can heavily influence
the choice of methodology. In the UK detailed data on property transactions is not as
readily available as in other markets. This has led to the situation where all previous
UK studies of flood impact on housing markets have used surveys to canvass expert
opinion.
From the meta – analysis of previous studies of flooding and other housing studies it is
clear that a great deal of time and expense can be expended in building alternative

Lessons from Extant Studies
116
models which are equally as powerful in statistical terms. The choice of input variables
to a hedonic model is generally pragmatic, limited to those variables which are readily
available. For most studies of environmental amenities and disamenities the bulk of the
effort expended in developing new data is expended in developing measurements of
the variable under test. Within the UK market commonly utilised explanatory variables
have been identified but no consensus exists about the relative importance of many of
these variables or even the treatment of such common variables as age of property.
Collecting the amount of data necessary to build and test several hedonic models of
the price impact of flooding was concluded to be impractical and an alternative
methodology will be sought. This review has identified repeat sales as a developing
tool in the valuation of amenities. Repeat sales analysis, which has a much reduced data
demand, will form the basis of the major empirical analysis within this thesis.
The UK studies highlighted river view as a positive driver for house price. This could
be a severe nuisance factor for a study concentrating on riverside properties, by using
repeat sales this nuisance factor will be held constant.
Availability and cost of insurance was also highlighted by the UK research into flood
impacts on property value. All three studies mentioned insurance as a key issue and so
it must be addressed within the current research. However the inclusion of insurance
into either theoretical or empirical models is not a straightforward matter. The
mechanism by which insurance could potentially influence property price is not clear.
The next chapter is therefore devoted to the insurance issue.

Flood Insurance
117
Chapter 5 : FLOOD INSURANCE AND ITS IMPACT
ON HOUSING VALUE
5.1 INTRODUCTION
One of the recurring themes within the modelling of the impact of flooding on house
prices as summarised in Chapter 4 is the importance of flood insurance. It has been
proposed that the cost and availability of insurance will have an impact on the value of
property in the floodplain by many authors including Macdonald et al (1987), Harrison
et al (2001), BFRG (2004), Eves (2004), Crichton (2005) and Kenney et al (2006).
Ehrlich and Becker’s (1972) self insurance theory has been used to predict a link
between willingness to pay for flood avoidance via insurance and property price
discount. For the UK market, surveys have suggested that the hypothesis could be
valid but it has yet to be proven. Agreement as to its importance is present in the
literature but the scale, direction and manner of its impact on house prices are not clear
from theory or from previous studies. The inclusion in this thesis of a separate review
of insurance literature relating to flood and natural perils cover is a reflection of this
emphasis.
Of course, the importance of flood insurance extends well beyond its impact on house
prices. Insurance against flooding can be a central plank in a national flood
management policy, indeed can often incorporate state provision, and as such is
subject to political as well as market forces. Flood insurance must be considered within
the context of a wider flood management regime and the structure of the local
insurance market will be very pertinent to the way in which insurance affects the

Flood Insurance
118
housing transaction. Although it is not within the remit of this research to make
judgements about the appropriateness of the current provision for householders in the
UK it will be necessary to understand the way in which this provision shapes the
actions of property owners and potential buyers within the floodplain market. This
chapter therefore addresses two main themes: the unique UK flood insurance market
and the wider international literature on flood insurance.
In section 5.2 the unique flood insurance regime in force in the UK is described and
contrasted with other international regimes. The history and structure of the UK
insurance market is then considered in section 5.3 and the market is summarised. This
regime is currently in a state of flux in the aftermath of record levels of flood claims
and this changing market and its implications are discussed in section 5.4. Section 5.5 is
concerned with the wider insurance literature and the ways in which flood insurance
may act theoretically on house prices highlighting previous empirical studies in the
literature. In section 5.6 it is seen that these theoretical actions are not wholly
appropriate in the unique UK flood insurance regime and that the data required to
estimate such models is not publicly available in the UK.
5.2 FLOOD INSURANCE REGIMES
The maintenance of floodplain property is dependent upon the ability of the property
owner to reinstate following a flood event. Affordable insurance against flooding or an
adequate relief fund can provide the safety net necessary to effect that reinstatement.
Different approaches have been taken internationally to provide cover for those at risk
of flooding and other natural disasters and variations on schemes are continually

Flood Insurance
119
proposed (Ryland, 2000, Bruen and Gebre, 2001, Schwarze and Wagner, 2004, Spence,
2004). These regimes form a central part of development policies regarding
maintenance of floodplain property and further construction on the floodplain.
5.2.1 The UK regime
In the UK, for example, the government relies on private insurance companies to pick
up a large part of the bill for repairing flood damage (Huber, 2004, Green and
Penning-Rowsell, 2004). Flood cover is bundled into general property insurance, which
is a fairly unique position worldwide. Private individuals have confidence, through
household cover, that they will not suffer devastating financial loss in the event of a
flood disaster. Mortgage lenders also use the protection that insurance provides to
guarantee the value of property on which loans are secured. Property developers base
their investment decisions on the understanding that those who will wish to purchase
the development will be able to obtain loans. Clark et al (2002) argues that a period of
low flood frequency and the historic insurance regime in the UK has resulted in
widespread complacency and under-investment in flood defences leaving the UK
property owner more than ever reliant upon insurance to mitigate the consequences of
future flooding. As a result of the long term commitment by UK private insurers, level
of cover in the UK is well above that of most other markets.
The UK system is fairly unique in providing such universal cover by default, in other
countries the picture is very different (Gaschen et al., 1998, Michel-Kerjan, 2001,
Paklina, 2003). Other approaches range from no cover, with victims relying on
emergency aid, through optional separate flood policies or add-on options, to
compulsory state run schemes. Cover can be provided exclusively by the private sector,
Flood Insurance
120
exclusively by government or in partnership between the two. In this section some
examples will be highlighted that relate countries mentioned in the empirical studies
included in section 5.5 in order to contextualise the range of insurance regimes
considered within this thesis.
5.2.2 International practices
In Canada flood cover is not included in the standard policy. It is possible to purchase
a flood option from private companies at a high price. Penetration of insurance is low
probably because the cost is prohibitive for the average homeowner (Gaschen et al.,
1998). In some communities a policy of purchasing floodplain property and relocation
to higher ground has been executed (Babcock and Mitchell, 1980).
In the US, the National Flood Insurance Program provides heavily subsidised basic
cover in flood risk areas. There is an upper limit on this state cover and top up cover
can be purchased from private companies. A great deal of thought and research has
gone into the scheme and it is continuously monitored and updated to ensure that the
maximum protection is afforded to likely flood victims. However this effort has been
only partly successful. Burby (2001) covers the history of this scheme in some detail
and summarises some key statistics. Penetration of insurance was estimated at 27% of
floodplain residents in 1997 although accurate estimates are hard to make because of
the uncertainty of estimates of flood risk. The damage caused by hurricanes Floyd and
Dennis in 1996 exposed the fact that most damaged properties were not insured.
In Australia flood insurance is provided by private companies. Flood risk is divided
into flash flooding and “mainstream” or riverine flooding. Flash flooding is often

Flood Insurance
121
covered by standard insurance policies, but only a small number of insurers include
mainstream flood cover as standard. Those that do include flooding either levy a
significant premium increase or refuse cover altogether in high risk areas (Paklina,
2003). According to the Insurance Council of Australia, which is a body that represents
private insurers, there are a number of key objectives that need to be achieved by local
governments if insurers are to make cover more widely available. These measures
include effective flood mitigation, accurate flood mapping, effective planning controls
in flood prone areas and disclosure to residents in flood-prone areas (ICA, 2001).
In New Zealand the Earthquake Commission (EQC) provides cover via a national
emergency programme that also covers other natural disasters (Paklina, 2003). All
residential property owners who buy fire insurance automatically acquire ECQ cover
up to a maximum buildings of 100,000 New Zealand Dollars (NZD) and personal
effects up to NZD20,000 (OECD, 2003).
5.3 THE UK FLOOD INSURANCE MARKET
In the UK, flood insurance is contained within the standard general household
insurance policy provided by private insurance companies. Buildings and contents
insurance can be purchased separately or as a package, and flood cover is usually
included in both buildings and contents policies. Insurance is not compulsory but
buildings cover is normally mandatory where homes are purchased using mortgage
finance. Government funds for flood mitigation have been diverted to damage
prevention rather than grants to victims. Those householders who do not purchase
insurance and do not possess the necessary means are dependent on disaster relief,

Flood Insurance
122
emergency aid and loans to fund any reinstatement. For example in Towyn, North
Wales, after a devastating flood in 1990, those uninsured and on income support could
claim community care grants. Households not on income support and without
insurance, for example the many retired people on state pensions, had to rely on
money from the Mayors fund and discretionary grants from Colwyn Borough Council
(Welsh Consumer Council, 1992).
5.3.1 The “Gentlemen’s Agreement”
Until 2002 the universal availability of private coverage was the result of a “gentlemen’s
agreement” between the insurance industry and government. The agreement was
entered into in 1961 in response to severe government pressure and by the end of the
1970s the majority of home insurance polices included flood risk as standard (Arnell et
al., 1984). The main content of the agreement was that the insurance industry
guaranteed to provide cover whatever the risk, and that the cover would not exceed
0.5% of the sum insured except in circumstances where regular flooding was seen to
be inevitable (Huber, 2004).
The events of the last ten years have tested the accord between insurer and the
government to the full. One of the problems with the agreement was that there was no
mechanism for forcing government or individuals to take responsibility for flood risk
reduction. A widely held view is that this has resulted in under-investment in flood
defences by government and lack of planning by individuals residing in flood prone
property (Clark et al., 2002, Huber, 2004, Green and Penning-Rowsell, 2004). Another
problem is that the bundling of flood cover into general household cover makes it
difficult for insurers to quantify the cost of flooding claims and to quantify their total

Flood Insurance
123
exposure to flood risk. This may lead to liquidity problems for insurance companies if
several severe flood events coincide (Huber, 2004).
5.3.2 The structure of the UK property insurance market
Since it is not possible to divorce the flood insurance market from the general property
insurance market in the UK, it is necessary to consider the property insurance market
as a whole. Euromonitor (2004) states that the market for domestic property insurance
in the UK yielded £4.9 billion in premiums in 2003. The top five companies providing
insurance in the UK held 63 percent of that market, while the top ten account for 85
percent. Aviva Plc, which owns Norwich Union (NU) and Commercial Union, is the
largest player with 23 percent. There are many smaller players in the market. The
domestic property insurance market is not always profitable; premium increases in
recent years have been blamed on growth in weather related claims that have resulted
in underwriting losses.
The Automobile Association (AA) surveys 39 different insurers in constructing its
home insurance price index (AA, 2007). Figure 5-1 below shows the index for October
2007 and it is clear that despite the increase in flood and other weather claims the cost
of household insurance has remained remarkably affordable. The increase in domestic
insurance since the index commenced has been only 5%.
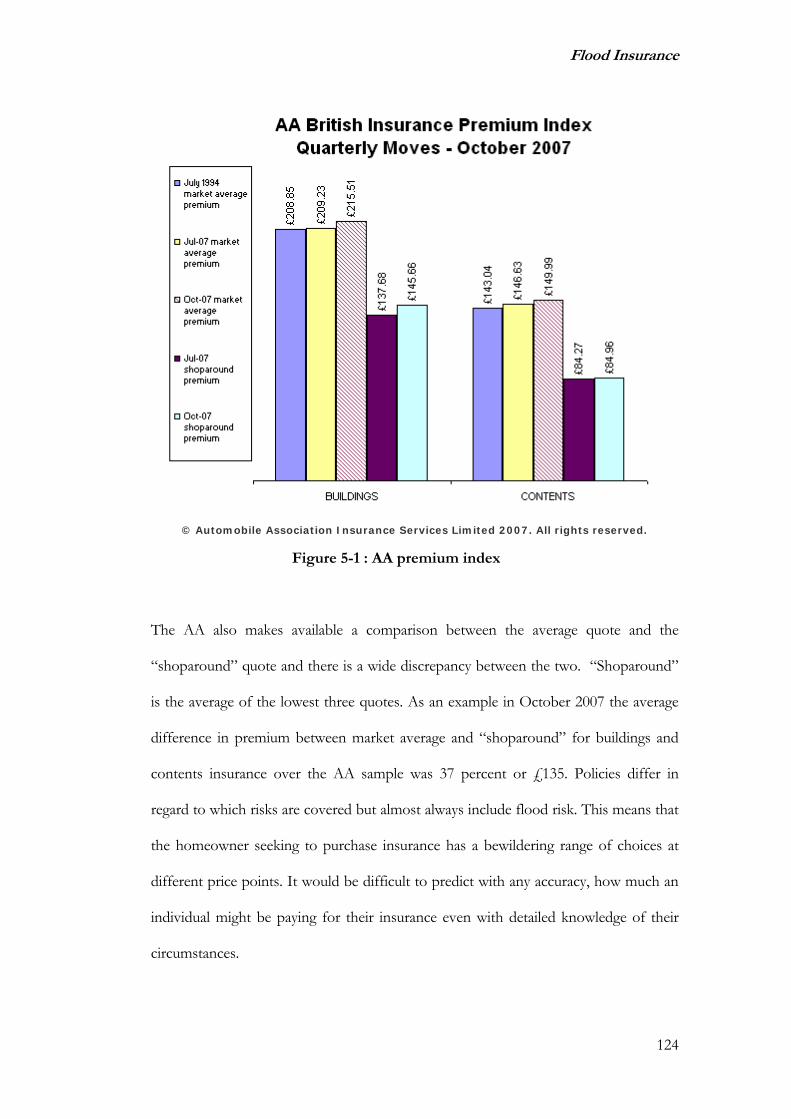
Flood Insurance
124
© Automobile Association Insurance Services Limited 2007. All rights reserved.
Figure 5-1 : AA premium index
The AA also makes available a comparison between the average quote and the
“shoparound” quote and there is a wide discrepancy between the two. “Shoparound”
is the average of the lowest three quotes. As an example in October 2007 the average
difference in premium between market average and “shoparound” for buildings and
contents insurance over the AA sample was 37 percent or £135. Policies differ in
regard to which risks are covered but almost always include flood risk. This means that
the homeowner seeking to purchase insurance has a bewildering range of choices at
different price points. It would be difficult to predict with any accuracy, how much an
individual might be paying for their insurance even with detailed knowledge of their
circumstances.

Flood Insurance
125
Sixty one percent of UK households have buildings property insurance while 75
percent have home contents insurance (Euromonitor, 2004). Swiss Re, the reinsurance
company gives a figure of 95 percent buildings insurance (Gaschen et al., 1998); the
discrepancy may be accounted for by looking at owner-occupied households only.
Most mortgagees hold buildings insurance as a loan condition and in the past this has
tended to be held with the lenders insurer. The propensity to buy property insurance is
heavily linked to income: 92 percent of households in the highest income quintile (the
top 20%) have contents insurance while only 48 percent of the lowest quintile is
insured. For buildings insurance the division is even greater with 87 percent of the
highest quintile purchasing cover but only 26 percent of the lowest quintile. (Some of
these may be insured via their private or local authority landlord) (Euromonitor, 2004).
This implies that in a flood situation there will be a substantial uninsured sector
particularly if the affected area is one of low average income.
Crichton (2005) suggested that this may well be the case as in the past cheap flood
prone land was often utilised for local authority housing. Much of this property may
have passed into private ownership under the “right to buy” scheme. Fordham and
Ketteridge (1995) discussed three historic cases where lack of insurance was common:
a case in Perth where the majority of flood victims were in local authority housing, the
differential between the support offered to local authority tenants and private owners
caused division in the community; Towyn 1990 where a large proportion of retired
people living on state pensions were uninsured; and Paisley in 1994 where residents of
Ferguslie Park could not get affordable insurance (due not to flood risk but theft and
vandalism claims). After the flood emergency state handouts were necessary and this
caused resentment in the wider community.

Flood Insurance
126
5.4 RECENT DEVELOPMENTS IN THE MARKET
Section 5.3 discussed the competitive and fragmented nature of the insurance market
and showed that householders seeking cover will have a wide choice of companies and
policy options. However for the floodplain resident recent developments in insurance
markets may have added to the complexity of their insurance choice while narrowing
their choice options. Changes in the pattern of weather claims over the past decade as
discussed in section 2.3 have sparked a reassessment of the industry attitude to flood
risk (Dlugolecki, 2004). In addition developments in the delivery of cover to the
policyholder and greater provision of information on flood risk has impacts on the
ability of the insurers to distinguish between properties. These developments have led
to reported difficulties for floodplain residents in obtaining cover at a reasonable cost.
5.4.1 The impact of climate change
Weather related claims in general and flood claims in particular have grown
substantially in recent years. Floods in 1998 cost insurers an estimated £500 million
and in Autumn 2000 flooding of about 10,000 properties swallowed an estimated £1
billion of insurers money (Dlugolecki, 2004). Claims are estimated to have doubled
over the five years to 2003 when compared to the previous five years. This trend looks
set to continue: an ABI sponsored report by Dlugolecki (2004), for example, forecast
an increase of 2-4% per year. River flooding in an extreme year was projected to cost
an average £4.5 billion and coastal flooding in an extreme year could cost £40 billion
by 2050. These scenarios compare unfavourably with the estimates of current premium
figures in section 5.3.1, if premium income alone is considered it could take the
industry ten years to recoup the cost of an extreme coastal flood, leaving aside all the

Flood Insurance
127
other claims made on domestic property. The insurance industry has a duty to its
shareholders to address these profitability issues via increased premiums or reduced
exposure to flood risk.
5.4.2 ABI “Statement of Principles”
After the flood events of autumn 2000 a debate was initiated as to whether the
insurance industry could continue to honour the inequitable “gentlemen’s’ agreement”.
The ABI sought to take a leading role in driving change and encouraging other
stakeholders in the property market to bear more responsibility for flood management.
New planning guidelines and pledges of higher government spending have resulted
from the debate and at the time of writing the agreement remains largely intact having
been renewed in 2002 and 2005 (ABI, 2002, ABI, 2005a). For most properties, those
that are protected to the Department of Environment, Food and Rural Affairs’
indicative minimum standard of 1 in 75 years, there should be no change, apart from
perhaps raised premium, to the standard cover which they have enjoyed previously.
Domestic and small businesses will find it equally easy to find cover.
Since the 2000 event many flood defences have been strengthened and more are
planned to be strengthened based on Environment Agency assessments of the cost
benefit of such capital works. Existing policies will be maintained in these areas in the
expectation of a reduction in future claims. More importantly for research into
property value the current insurers will insure new owners subject to satisfactory
information about them. This promise implies that homes in high-risk areas can be
sold, providing defences are planned, and encourages disclosure of the flood risk

Flood Insurance
128
category during property transactions because insurers will switch the policy to the new
owners in most cases.
Houses in the worst category, those where no defence improvements are planned, may
face the situation that cover is withdrawn or maintained at a punitive premium rate.
The ability to sell such property could be severely restricted.
In summary it would follow from the new statement of principles and would appear
from media and anecdotal sources that, while for most home owners the “gentlemen’s
agreement” remains intact, the market is changing for those in the highest risk areas
and that in the future insurance costs are to be more closely linked to flood risk. If
insurers seize upon this agreement as a license to drop potentially expensive policies
the next major flood event could result in severe hardship for its victims.
5.4.3 The move to direct distribution channels
One of the major recent changes in selling of insurance policies in the UK has been
the move into direct selling. In the past the majority of owner occupied households
purchased their buildings insurance along with their mortgage. The underwriting would
be done en-bloc between the building society and their insurer. An implication of this
situation was that many insurers had very little information about the properties they
were insuring and therefore premiums were largely divorced from risk. Contents
insurance has always been optional but for convenience many homeowners keep both
policies with the same suppliers.

Flood Insurance
129
The advent of direct phone selling, most noticeably by Direct Line first began to
challenge the mortgage lenders partial monopoly. Mortgage providers have the right to
evaluate alternative buildings insurance policies taken by their mortgagees because they
need to ensure that their investment is well protected. Some loans providers charge a
reading fee to ensure that insurance is adequate on the property while others reserve
the right to refuse a switch. Direct Line estimate that high insurance fees from tied
policies cost the UK consumer £400m per year (Direct Line, 2002). The company has
attempted to initiate changes in the law to outlaw the reading or switching fees
associated with mortgage insurance, and had a policy of paying those fees for
customers who switched to them. The Internet, with its associated ease of checking
multiple policies has increased the trend away from mortgage tied insurance. Internet
sites exist which will make comparisons between several insurers within minutes.
Furthermore, online purchase out of office hours is possible.
An even more recent development has been the selling of insurance by supermarkets
and utilities suppliers. The convenience factor and the discounts available for
combining utility bills with insurance probably explain the popularity of this sector.
Banks and building societies are also now targeting customers directly as insurance
providers using their position of trust. Many of these new suppliers may be acting
effectively as agents whilst others have set up or bought up their own insurance arm
(Defaqto, 2003). These changes decouple the linkage between mortgage and insurance,
although the eventual underwriters may remain the same. The changes have the
potential to lead to more correlation between risk and premium as policies are
undertaken on an individual basis rather than as block policies and insurers can obtain
more detailed information about the property they insure.

Flood Insurance
130
Direct sellers have changed the dynamics of underwriting. Their reliance on
information technology using large customer databases to produce quotes
automatically results in inflexibility. Customers whose circumstances require individual
underwriting judgements are rejected. Some low cost providers are selecting “good
risks” and thereby ruling out any households that live in the flood plain (Keynote,
2004). In 2002 Esure declared that they were positioning themselves as the number
one provider for low risk policyholders and alerted the media to the worry that some
people would find it difficult to insure their homes. Esure estimated that an annual
saving of £30 per policy could be made by excluding high flood risk houses from their
cover (Stevenson, 2002). For phone and Internet underwriters, the refusal to insure
houses in flood risk areas has become a common stance.
5.4.4 Flood risk mapping
In addition to the greater incentive to price flood policies effectively there is also
improved information now available for insurers to quantify the risk of flood as
described in section 2.5. The Environment Agency has developed flood risk maps
within England and Wales for coastal and riverine flooding. A free internet based
service for the general public is available that will give a risk rating based on postcode.
The underlying maps were subject to a great investment to improve reliability in 2004
(Bradbrook et al., 2005), and a more detailed risk profiling service is available for
insurers. Despite the acknowledged poor quality of the data in some areas the new
flood maps are being used by some insurers. Royal Sun Alliance have developed an
intranet system allowing underwriters to access flood risk information by full postcode
(Crichton, 2005). Norwich Union has tried to take a lead in the area of flood mapping

Flood Insurance
131
by commissioning their own UK height map and combining it with flood flow
information to assess risk on an individual property basis. They have now made this
information commercially available to others. As these initiatives feed through to the
insurance community they enhance the probability that risk based pricing will become
the norm.
5.4.5 Implications for flood risk properties
From the above analysis of market dynamics and official insurance industry statements
there would appear to be implied consequences for owners of property at risk of
flooding. It is possible that any property owner designated at risk of flood, however
slight, may experience difficulty in obtaining insurance cover, could see an increase in
insurance premium and may have to approach several companies before gaining a
policy.
For those moderately or severely at risk, where cover is achieved in the full
acknowledgement of flood risk, the cost of premium is likely to be increasing towards
an actuarially fair rate which may be double their previous rate or more.
Some individuals inhabiting the most frequently flooded property outside the planned
defence areas may find it impossible to gain cover. They may have to accept flood
exclusion or excess charges which would exceed anticipated flood damage claims.
If these implied effects are reflected in real underwriting decisions there will be further
implications for the floodplain resident associated with high premiums or lack of
insurance such as the inability to raise finance against their property investment. The
Flood Insurance
132
most relevant implication to the current research would be the inability to sell a
property due to the high insurance cost or lack of insurance. The way in which this
might operate is discussed in sections 5.5 and 6.5
However, the implied impact on insurance cost and availability has not been measured
by any published academic study and remains open to debate. Market dynamics take
time to feed through to actual premium costs and published policies are not always
adhered to. The fact that published statements and market dynamics predict that
premium costs will increase for the floodplain resident does not mean that they have
already done so. For example in a Consumer Association survey of forty three insurers
(Which?, 2005), nine insurers said they would automatically turn down new customers
who had made a flood claim. However, of the remaining 34 companies, while most
said they might exclude cover for future flooding they also indicated that they would
insure on a case-by-case basis. The evidence for premium price increases is considered
in section 5.6 below.
5.5 INSURANCE LITERATURE RELATING TO FLOOD INSURANCE
AND ITS IMPACT ON PROPERTY VALUE
This section discusses some theories of insurance relating to the impact on property
value. Insurance literature and risk management is a wide topic and so this review has
pragmatically concentrated on models encountered in the narrow literature relating to
flood risk and property value. This falls broadly into the utility model and borrows
concepts from decision theory. However as shall be shown in section 5.6 much of the
theory is not applicable in the UK market and so in-depth analysis is not undertaken.
Flood Insurance
133
5.5.1 Arguments from utility theory
The notion of handling the uncertainty of flood damage via utility theory and the
impact of this upon property value has been extended to include the insurance
dimension by MacDonald et al (1987) and others. In summary, the theory proposes
that the purchase of insurance cover is an expression of willingness to pay for
reduction of an unpleasant event, in this case the financial loss from flooding. When a
property with high flood risk is sold, the discount in value (when compared to a
similar, low-risk property) represents the amount an individual is willing to pay to
permanently remove the risk of financial loss from flooding. The extension of the
theory in the presence of insurance is that the reduction of the flood hazard can be
alternatively effected by purchase of insurance or by removal from the floodplain, the
utility of either strategy being equal. Under the restrictive conditions that insurance
payments in the event of a flood cover the entire cost of flood loss, the expected
amount that a householder would be willing to pay is equal to the present value of
insurance premiums in perpetuity. If there is a difference between the two amounts,
the theory proposes, this could be due to concern that insurance will not cover all the
losses or compensate for emotional upheaval and other intangibles. Some authors
suggest (Macdonald et al., 1987, Shultz and Fridgen, 2001) that these theoretical values
could be used to calibrate or even substitute for measured property price impacts of
floodplain location. They suggest this in the light of empirical results which are
consistent with the theory.
However there are some contentious assumptions inherent in the above proposal, two
of which are whether or not householders purchase insurance when it is available and
whether property buyers are aware of insurance obligations and costs at the time of

Flood Insurance
134
property purchase. According to Harrison et al (2001), where coverage is not
compulsory and universal, discounted insurance should be seen as an upper bound of
the value discount due to flood. The propensity of floodplain residents to buy flood
insurance is discussed in section 2.7.1 and it is recognised that, on the whole, coverage
is low. In section 2.6.4 the variability in perception of risk was also mentioned and in
the next section they are further explored.
5.5.2 Decisions under uncertainty
If the willingness to purchase insurance is seen as the willingness to pay to avoid
disutility associated with a given risk then the arguments above will be valid if all
parties evaluate risk equally. However the gulf between the perception of risk by
floodplain residents and the scientifically assessed or official risk designation has been
recognised before in chapter 2. In the valuation of expected damage due to flooding
both the expected incidence of flooding and the anticipated damage levels caused by a
given flood can be subject to widely varying estimates from property stakeholders and
insurers. Bin and Polasky (2003) observed an illustrative example of this gap in
perception in practice: Hurricane Floyd resulted in an increase in the devaluation
suffered by flood-prone property although the insurance premium did not change.
The risk perception of the house-buying population was clearly affected by the
hurricane whereas pre-event high insurance premiums had not been translated into
devaluation.
In the UK a great deal of uncertainty about the risk of damage to property at risk of
flooding exists not only in the minds of the general population but on the part of
insurers. The choices of individuals under uncertainty, and in particular with respect to

Flood Insurance
135
low probability high loss events, have been argued to deviate from the classic utility
theory (Kunreuther, 1974, Camerer and Kunreuther, 1989, Kunreuther and Pauly,
2004). Multiple causes of such deviations are summarised in Camerer and Kunreuther
(1989) including a threshold probability below which individuals ignore risk, and for
most property in the UK the likelihood of a flood event would fall into this category.
Asymmetric views of losses and gains, general optimism and availability of data are also
quoted. Correspondingly numerous alternatives and modifications to utility theory are
suggested in the paper but many have yet to be tested empirically. The purchase of
insurance for low probability high loss events has been addressed by Kunreuther
(2004). One major barrier in the uptake of insurance is proposed to be the cost of
obtaining information and forming an opinion about the cost benefit of investment in
insurance. The author also discusses the situation where insurers hold different
information and thus charge different premiums and concludes that the necessity of
searching among suppliers may be an added disincentive to insure.
In short if property owners choose not to insure then one major cause may be that
they perceive that their risk of damage from flooding is lower than the insurance
premium suggests. Equally if this is the case then their expected disutility from
flooding is by definition lower than the actuarial estimate and their willingness to
accept property value discount due to flood risk status will be correspondingly low. In
this example discounted insurance premium will overestimate willingness to pay to
relocate out of the floodplain.
Another major cause of not insuring may be the effort of evaluating the cost benefit of
insurance. This may include financial and time investment in information gathering and

Flood Insurance
136
mental and time investment in processing information. This effort would also be
involved in valuing the disutility of floodplain location during property valuation, again
implying that insurance discount will overestimate their willingness to pay.
Affordability of insurance premium in relation to absolute levels of wealth of an
individual is another consideration in the propensity to insure. In the low income
sector this is a major policy issue (Joseph Rowntree Foundation, 1998), largely outside
the scope of this research. High cost flood risk insurance bundled with general
property insurance may lead to larger numbers of individuals failing to insure and thus
become a social policy issue. However, for the purposes of property valuation low
income individuals might be regarded as unable to accept the discounted valuation due
to flood risk, unless they are subsequently moving to another at-risk property. Thus
their lack of ability to pay for insurance will be reflected in a low ability to accept
discount. Once again implying that discounted insurance premium will overestimate
property discount.
5.5.3 Empirical studies
Those authors who have compared the discounted premium to property devaluation
(Macdonald et al., 1987, Shilling et al., 1989, Shultz and Fridgen, 2001) have generally
found results which accord with utility theory. As an alternative to making assumptions
about the relationship between insurance and property price, some authors have
included a measure of insurance cost into a hedonic price model. Shilling et al (1989)
included a combined insurance cost/flood dummy variable into a conventional
hedonic model and compared this with a straightforward dummy variable for

Flood Insurance
137
floodplain location. There was very little to choose between the two models and the
impact of other variables did not change.
Speyrer and Ragas (1991) included insurance as a rate index in their model. The rate of
insurance - the insurance cost divided by unit sales price - was expressed as a
percentage of the average rate of insurance. In this way a semi-continuous variable can
be constructed. The rate of insurance was substituted into the model in place of flood
zone location. The impact of insurance rate index on price was found to be
significantly lower than might have been expected from comparison with flood-zone
dummy models of the same data. Direct comparison of the two models presented in
the paper is not possible because different locational variables are included. The
adjusted R2 for the alternative models are very similar, and most of the estimates of
elasticity for property structural variables are remarkably robust to the model form.
The problem with this sort of analysis in terms of attributing a causal relationship
between insurance cost and property value is that the two different flood variables,
zone status and insurance cost, are treated as interchangeable as indeed they largely are
in the US. Since insurance rate is dependent on flood zone status and insurance costs
are wholly determined by rate and assessed value, a cross-sectional hedonic model
cannot be used to distinguish between the two effects of flood zone status and
insurance cost.
Timing of market events can give information about causality that cannot be gauged
from a purely cross-sectional model. Skantz and Strickland (1987) analysing two
events, a flood followed a year later by an increase in insurance premiums,

Flood Insurance
138
demonstrated that it was the insurance rate rise and not the flood event that sparked
the reduction in price. An adaptation of events analysis from the world of finance was
used. This method looks at the cumulative average forecast errors from a model
estimated before a given event, the non-flooded subdivision performs in line with this
previous model whereas the flooded properties show a systematic bias. This kind of
analysis can yield interesting results if timing of specific events is well established and
the impact of any coincident events can reasonably be disregarded or isolated.
5.6 PROBLEMS IN APPLYING MODELS WITHIN THE UK MARKET
It has been demonstrated above that assessing the impact of flood insurance is
complex in general. There are two additional major obstacles in carrying out empirical
studies of the impact of flood insurance on UK property which are due to the unique
nature of the flood insurance market in the UK. The first is the fact of the bundling of
flood insurance into standard policy implying that a deliberate choice about insuring
the flood hazard is not taken by the policyholder. The second is the lack of data on the
price of flood insurance. The first causes problems with the theoretical formulation,
the second with the practicalities of estimation. These two difficulties are explained in
greater detail below.
5.6.1 Theoretical difficulties
The inclusion of flood insurance into general property insurance in the UK has many
implications. As mentioned in earlier in this chapter this means that for most
purchasers, those who require a mortgage, general buildings insurance and therefore
flood insurance will be compulsory. This implies that the cost of the risk of flooding

Flood Insurance
139
will be spread over a wide population not just those at high risk of flooding. Even for
those who can chose not to purchase insurance flood risk is unlikely to be the deciding
factor in their eventual choice because flooding is just one of a large number of risks
covered. The notion of insurance cost expressing a willingness to pay to avoid flooding
is therefore not relevant.
If insurance cost is to be built into the value of property then it must be assumed that
knowledge of this cost is available to all parties at the time of property price agreement.
It is not clear whether or not this is the case for the UK property transaction. There is
no statutory requirement for disclosure but it is possible that the process of obtaining
finance might amount to disclosure for practical purposes.
It might be possible to isolate the element of insurance premium relating to flood risk
if there were a large flood risk loading on premiums in flood risk areas. Since insurance
is mandatory for many purchasers and in practice domestic insurance coverage is high,
if a loading factor could be established, it could be used to predict the amount a
rational purchaser would be need to discount property value to offset this future
expense. Unfortunately as will be shown in 5.6.2 it has not been possible to isolate a
flood loading factor in the competitive UK market.
The alternative strategy of using the timing of insurance changes in the form of an
events analysis type measurement is also inappropriate in the UK because it relies upon
a single change in insurance rates. In the UK market price changes will be spread over
time and may not be universal because of the competitive nature of the market so
event timings are not discrete.

Flood Insurance
140
5.6.2 Availability of data
Perhaps because, in the UK, flood cover is provided by private companies there has
been little publicly funded research into the cost, availability and take up rates of flood
insurance. Anecdotal evidence is available about the increased cost of insurance in
flooded areas: One property owner, moderately at risk of flooding and with a storm
claim had received quotes varying from £819 to £400 from different insurers (Which?,
2005) despite explaining to each one that her house is built up several metres from the
ground (compare this to an “average” premium of about £300). Excesses of £5,000 or
even more are being applied to some high-risk properties (Crichton, 2005). Crichton
(2005) also noted that the chairman of the All Party Parliamentary Group on Insurance
and Financial Services, complained to the ABI that some constituents had suffered
from increases in premium of up to 250%. Further evidence from Crichton (2005)
citing Datamonitor, suggests that the average premium for a flood risk postcode is
double the average household at £600.
There is very little formal and publicly available research, however, that quantifies the
increased cost a flood victim can expect to pay for home insurance. Two sources that
attempt to do so are Moneysupermarket.com (Modcock, 2003) and the Lewes flood
action group (Lewes Flood Action Group, 2004). There is an important distinction in
the approaches of these two studies. The first considers flood risk as defined by flood
mapping, the second looks at the experience of properties actually flooded where,
presumably, claims have been made and the insurer and insured have a joint history.

Flood Insurance
141
Moneysupermarket.com carried out a survey of insurance quotes for flood risk
postcodes versus flood free ones (Modcock, 2003). They reported an increase of up to
60% but also said that by shopping around substantial savings could be made.
Lewes flood action group carried out a survey of 800 properties in the aftermath of
severe flooding in 2000. The survey was carried out in 2002/2003 and most of the
renewals should have been covered under the original “gentlemen’s agreement” thus
refusal should have been rare. Two hundred and fifty-four responses were received, a
good response rate (not necessarily an unbiased one), which included both business
and residential properties (not all commercial properties came under the “gentlemen’s
agreement”). Forty-five refusals of cover were reported, the majority of these refusals
were for residential properties. Under the conservative assumption that all
householders who had been refused insurance replied to the survey this represents 6%
of the flooded properties, (18% of respondents). Just under half of the respondents
reported significant changes.
While these results must be approached with caution they do represent the only
systematic evidence about post flood insurance rates paid by householders. A
conservative estimate is that 14% of policyholders suffered significant changes
alternatively it may be that the figure is as high as 45%. The converse view is that over
half of the flood victims who responded reported no substantial change. The survey
does not record whether these properties remain uninsured or went on to gain cover
from somewhere else.

Flood Insurance
142
The most important thing that these results demonstrate is the inconsistency displayed
by insurers. It reinforces the desire to understand the insurance market from a
consumer’s point of view because knowledge of the policies of the various insurers and
their national coverage rates will not tell us what the home owners in the floodplain are
actually paying for cover. Crucially, if it is not possible to detect and measure a flood
insurance premium loading due to flooding or flood risk then the hypothesis that
increased premiums will have an impact on property prices cannot be tested.
5.7 SUMMARY
In the UK, flood insurance is included in the standard household policy. This is a fairly
unique position worldwide. Most countries have a much smaller and more specialised
flood insurance regime. The cover in the UK is provided by private companies and is
protected by a statement of principles that ensures that most homes can get insurance.
There are some properties that fall outside the agreement, notably new build and
frequently flooded property with no prospect of new defences.
The increase in severe weather claims in the last decade has put severe pressure on
insurers to raise rates for high flood risk areas. Competitive pressure within the wider
domestic property insurance market makes the targeting of lower risk policyholders
desirable. These factors and other recent developments are predicted to result in a
closer link of premium to risk in all areas and particularly to flood risk.
There is very little research into the impact of these changes on the homeowner in
flooded or flood risk areas. The available evidence suggests that, because insurers are

Flood Insurance
143
pursuing different pricing policies, some policyholders are suffering large cost increases
while others are not. A true measure of the increased insurance cost of flooding to
homeowners can come only from the householders themselves. Therefore a survey of
homeowners will be necessary in order to assess the scale of any increases in the cost
of flood insurance and the prevalence of exclusion from flood cover. The survey
design is presented in chapter 7.
The availability and cost of property insurance is an important factor in the sale of
domestic property. Studies in the UK have identified that if insurance is not available
the property transfer may be problematic. However, previous research has not
established a causal model which explains the action of insurance on property value in
the unique UK market. Theoretical models of utility predict that the purchase of
insurance reflects the willingness of property owners to avoid the risk of flood. These
models are not directly applicable in the UK for both theoretical and practical reasons.
It will therefore be necessary to develop a new conceptual model for the action of the
cost and availability of flood insurance in the UK market. This development is
presented in chapter 6.
Conceptual Model Development
144
Chapter 6 CONCEPTUAL MODEL DEVELOPMENT
6.1 INTRODUCTION
This chapter presents the conceptual model developed in the light of the extensive
literature review. This model has been developed to address identified shortcomings in
previous studies but also to take account of specific difficulties within the UK market.
The conceptual model includes three novel features: a time-varying repeat sales
specification; new hypotheses about the action of insurance upon the property
transaction; and the concept of the three dimensional nature of the flood status of a
property. The hedonic specification adapted for flood impact measurement and for the
UK market is presented in 6.2. The need for a time varying specification is described in
6.3 and the repeat sales formulation follows in 6.4. Section 6.5 describes the
hypothetical action of insurance and 6.6 the three dimensional nature of flood status.
Estimation of the parameters of such a conceptual model is problematic in the UK
market however. The issue of data availability is an enduring theme of the research as
has been touched upon in sections 4.5.3 and 5.6.2. In section 6.6 the data issues are
fully explored and the notion of increasing the available data by combining flood
locations via a block design is outlined in section 6.7. Finally section 6.8 summarises
the three models which will be estimated, one using only secondary data and the other
two also incorporating the questionnaire data.
Conceptual Model Development
145
6.2 HEDONIC MODEL FOR THE UK MARKET
Using the theoretical hedonic framework for house prices as presented in Rosen (1974)
and others a new adaptation for the UK market can be presented. Figure 6-1 shows a
representation of the standard hedonic cross-sectional model adapted for the UK with
the addition of flood status and insurance variables. The candidates for the raw
independent variables for inclusion in the model have been used in hedonic studies of
the UK housing market. Locational and environmental variables have been combined
into “locational desirability” while the flood status and insurance cost have been clearly
separated out. Variables impacting on the cost of insurance have been taken from the
automated quote agents on the websites of insurance companies, from the BCIS
rebuilding cost calculator (ABI/BCIS, 2005), from commentary in Doornkamp (1995)
on the provision of subsidence insurance in the UK and from the categories used by
the AA in conducting their premium index survey (AA, 2005). These have been
confirmed as important through interviews with brokers and insurance company
representatives.
The flood status variables are subject to an in depth analysis in section 6.6 because of
the difficulty of inclusion within a standard framework. The hypothetical actions of
insurance in the UK are discussed and it is seen that within the current framework,
only one of these actions will be formally tested, although the others will be touched
upon. A theoretical model is presented which will allow for combining the analysis of
flood impact with the attribution of that impact to the separate elements of flood
status.

Conceptual Model Development
146
Figure 6-1 : Hedonic specification for the UK market including flood variables
Transport linksDistance to amenities
Distance to disamenitiesSocio economic factors
Neighbourhood dummiesCrime rate
Noise PollutionViewsTrees
Local School rating
No. of bedroomsNo. of bathrooms
No. of reception roomsTotal floor area
Type of propertyAge of property
Presence of garageNew propertyNo. of storeys
Construction typeSubsidence riskCentral heating
Plot sizeGarden
Off-road parkingFreeholdCondition
Designated flood riskFlood history
Cost of reinstatementResilience
Defences/resistance
Age of ownerProfession of owner
Claims history of ownerClaims history of
propertyType of property
Flood riskFlood history
Area crime rateSubsidence history
Security featuresFlood resilience
measuresNo. of bedroomsAge of property
House price at time t
Locational Desirability
Structural Utility
Flood Status
Insurance Cost
Text in bold denotes raw
variable belonging in more than one variable
set

Conceptual Model Development
147
6.3 THE REPEAT SALES SPECIFICATION FOR THE UK MARKET
Adaptation of the above hedonic specification to a repeat sales specification is possible
using the comparison of serial sales of the same property. If a property’s characteristics
do not change between sales then the change in its price is due to one or more of the
following factors: inflation; any major changes in locational variables such as
installation of new transport links; and some random variability. In constructing repeat
sales models it is necessary to assume that the valuation of amenities (other than the
flood effect) does not change with time and the flood event. Palmquist (1982) tested
for this assumption using a full hedonic model and repeat sales on the same area and
concluded that assuming constant coefficients would not reduce the explanatory power
of the model. However, in the UK flooding context, the burden of collecting the
necessary data to perform this check is prohibitive.
Also inherent in the repeat sales approach is the assumption that property
characteristics do not change between sales. Properties with large structural changes
can be eliminated by examination of planning records but there is no readily available
measure of property condition. In the analysis of flood damaged property, the
condition in which a property is sold is a key variable; one might expect that any
property that sold up to six months after a flooding incident will be sold in a poor
condition. Properties sold after reinstatement might well have improved condition.
The absence of condition information will be an issue for the study. In interpreting the
results of the analysis this omission must be borne in mind.
Figure 6-2 shows the way in which a repeat sales specification of the full hedonic
model in Figure 6-1 reduces the variable set.

Conceptual Model Development
148
Figure 6-2 : Repeat sales specification for the UK market

pre flood price level
flood event
post flood price levels
Time
6.4 THEORETICAL PROFILES OF FLOOD IMPACT ON PROPERTY
VALUE
Tobin and Newton (1986) present a theoretical framework for the impact of flood
event on land value. Integrating flood hazard research and urban economics literature
they present charts of land value which vary with time and the severity and frequency
of flood events. These profiles are examined in the context of actual flood events by
Tobin and Montz (1994) who suggest that the speed and scale of the recovery in value
is dictated by various socio-economic and environmental characteristics in addition to
the flood characteristics. The profiles can be further developed, based on scenarios
encountered in the literature into four fundamental profiles as discussed below, for
clarity inflation has been ignored. These recovery profiles, if borne out in UK
examples, can form the basis of prediction of the impact of future flooding events.
Figure 6-3 shows a basic profile where a one-off flood event temporarily depresses
prices and then over time the price level recovers.
Figure 6-3 : Theoretical impact profile 1 - One off or infrequent flood

Conceptual Model Development
150
This profile might be observed under a number of conditions such as the occurrence
of a flash flood in a low flood risk area. Since the risk of return is low there is no
rationale for prices to remain low. In this case, the interval before price levels recover
would probably be quite short, possibly as short as the time taken to reinstate the
property. Price trends following a flood in a moderate risk area could also display this
profile, as was seen in Sydney (Eves, 2004). The recovery happens as people
collectively forget about flood risk, and so the recovery time might be expected to be
longer than for a flash flood.
However, if flooding is regular and already capitalised into house prices then a study of
an individual flood event might reveal no effect. Regulated disclosure or mandatory
insurance could also cause this zero-impact scenario because a new flood event
presents no new information to the property buyer. Figure 6-4 shows this theoretical
profile.
Figure 6-4 : Theoretical impact profile 2 - Flood effect permanently capitalised
pre flood price level
flood event
post flood price levels
Time

Conceptual Model Development
151
The profile could also be observed in fully resilient housing whatever the flood risk
category. Fully resilient property will experience inconvenience for the duration of the
flood but require minimal clean up and costs should be reasonably low. This type of
property might be regarded by a rational consumer as similar to a property with no
risk.
Figure 6-5 shows the profile which might occur if new information were imparted by
the flood and permanently changed the expectations of the residents. This might
happen if a first flood occurred on a new estate where there was no previous
expectation of flooding. It may also be observed if a flood signals a risk to the
insurance community and brings with it financing issues for potential purchasers.
Figure 6-5 : Theoretical impact profile 3 - Flood effect becoming capitalised
pre flood price level
flood event
post flood price level
Time

Conceptual Model Development
152
This scenario may also be typical in high-flood-risk areas, where long gaps have
occurred between events and the population have forgotten about the possibility of
flooding. A renewed awareness may be generated by a new flood incident. This has
been the case for many locations in the UK inundated in the 1998 and 2000 floods
because they occurred after a prolonged dry period of about two decades.
The final profile (Figure 6-6) is included, despite being counter-intuitive because it was
observed by Montz (1992) and by Tobin and Montz (1994). Here, post-flood values of
flooded homes were seen to improve relative to non-flooded comparatives. This could
be due to reinstatement of the property resulting in betterment as might be the case
after a flash flood of an old property, particularly if that requires bringing up to
building standards exceeding the original specification or involves updating fixtures
and decoration. Another instance where it might be observed would be where flood
defences are improved immediately following a flood event. This would not be a true
flood effect but might be confused with flood impact.
Figure 6-6 : Theoretical impact profile 4 -Betterment
pre flood price level
flood eventpost flood price level
Time

Conceptual Model Development
153
These theoretical profiles, which have been derived from the international literature
demonstrate the necessity of considering the temporal dimension in any study of the
UK market. They also suggest that the flood impacts on property prices in UK flood
sites are likely to vary greatly depending on local circumstances. Observed patterns of
flood impact may fall into one of these profile types but may also display a
combination of them, for example where improvements in flood defences follow
closely but not immediately after a flood or where two floods occur closely together in
time.
For the purposes of the empirical analysis the development of these flood impact
profiles serves the primary purpose of demonstrating how flood impact can vary over
time. The methodology described below is designed to detect this variable impact. The
interpretation of findings from the empirical study may also be aided by the above
discussion. In future research, if data was more plentiful, it might be possible to test for
the specific profiles in an events or interventions analysis. Categorisation of flood
location typographies could then aid in prediction of the likely impact for specific flood
events in the future.
6.5 HYPOTHETICAL CAUSES OF DISCOUNT DUE TO FLOOD
INSURANCE PROBLEMS IN THE UK HOUSING MARKET
As described in chapter 5 the market for flood insurance in the UK has many unique
aspects and it is inextricably linked to the property market via financing.
Notwithstanding the fact that many authors have discussed the link (Clark et al., 2002,
Eves, 2004, Building Flood Research Group (BFRG), 2004) there has been little clarity

Conceptual Model Development
154
in describing a mechanism by which insurance cost and availability can impact on
property price. In previous studies of flood insurance the concept of discounting the
future cost of insurance premiums as an expression of payment to avoid flooding has
been used, mainly in the US. However, within the housing transaction the cost and
availability of insurance could potentially act as a severe supply side imperfection as
surveys of valuers have revealed (Building Flood Research Group (BFRG), 2004, Eves,
2004). This section summarises the way that insurance could have an impact on the
property transaction in the form of three hypotheses.
The Cash Buyer Hypothesis: Properties on which their owners cannot get insurance or
can only obtain insurance with an excess charge over £2,500 will be regarded as a risk
by mortgage lenders. They will therefore be subject to a discount due to the need to
attract a cash buyer or a low loan to value ratio buyer. This might result in observed
price drops for such properties but the impact on price may be concealed due to non-
entry of these properties into the market or withdrawal due to lack of offers. Eves
(2004) asked about financing issues in his survey and found that in some areas
difficulties in obtaining insurance had led to financing restrictions. Some evidence to
support the cash buyer hypothesis was also encountered during the survey of valuers
carried out by BFRG (2004). One agent was quoted as saying ‘If there is a history most
owners and agents have been aware, sales are to cash buyers reflecting problems with
insurance cover. They tend to be rented out or owners just stay there unable to take
the hit on value.’
The American hypothesis: High flood insurance premiums are a disincentive to
purchase and result in a continuous loss of value proportional to the insurance rate.

Conceptual Model Development
155
This is the hypothesis underlying the inclusion of insurance rates into hedonic models
and also the discounted premium model prevalent in the US. House buyers act in a
rational manner substituting avoidance of risk via insurance for physical avoidance,
sellers accepting cash discount as a substitute for physical evacuation. In the presence
of insurance, insurance rate rather than direct damage cost is the rational calculation.
The Disclosure Hypothesis: In the UK because disclosure of flood risk is not
mandatory during property transactions, a high insurance quote or refusal may be the
first signal of flood risk. Awareness of flood risk is generated regardless of whether or
not the potential buyer accepts the high quote or can gain finance. This might result in
the collapse of a sale or in price renegotiation regardless of eventual insurance rate
achieved. This eventuality was mentioned by valuers in the BFRG(2004) survey, which
cites ‘Two occasions where insurance turned down based on potential risk, clients went
elsewhere’, these were houses that have never flooded. It must be noted that these
quoted examples did not, at the time, represent a large proportion of property
transactions and also that the fact that one sale fell through does not necessarily imply
that any eventual sale would be at a reduced price.
These hypothetical actions are derived from supposition and examples in the literature
but have not been tested using empirical data in the UK. As a first step towards an
empirical validation the hypotheses are considered further below.
The most natural way to measure the action of insurance cost as represented by the
American hypothesis is to include it in a hedonic model of property price along side
the flood risk variable. This approach can be considered despite the reservations

Conceptual Model Development
156
expressed about their use in the US because of the supposition that at present
insurance cost in the UK is not wholly determined by flood risk. However, the
inclusion of the absolute cost of insurance in a standard hedonic model will
immediately cause some difficulties. The cost of insurance cannot be simply included
in the model as an independent variable because it will be determined to a large extent
by property specific variables, locational variables and personal details. Property
variables and locational variables will themselves affect house prices independent of
their action through insurance, therefore collinearity may be induced in the model. Use
of a insurance rate variable as proposed by Speyrer and Ragas (1991) will partially solve
this problem by removing correlation with structural variables.
Measurement of the supposed impact of the disclosure hypothesis would be highly
labour intensive because it would entail tracking large volumes of purchases, and
would use information about reasons for sale collapse which is not collected on a
routine basis. However from a survey of floodplain residents some insight may be
gained into the prevalence of insurance issues at the time of purchase and any potential
correlation with realised price.
The cash buyer hypothesis contains two necessary conditions, first it is assumed that
insurance problems result in cash buyer status, then it is assumed that cash buyer status
causes a reduction in realised price. As with the disclosure hypothesis testing this fully
would involve tracking the purchase process. However if the cash buyer status is true
then a necessary but not sufficient correlation would exist between insurance problems
at purchase and cash buyers. This correlation can be looked for in a survey of
floodplain properties.

Conceptual Model Development
157
Insurance cost
Flood risk
Flood History
6.6 THE THREE DIMENSIONAL NATURE OF FLOOD STATUS
If the buyer is made aware of the risk to property of flooding during a property
transaction the range of information available to quantify that risk can be conflicting.
In the forgoing chapters the variable quality of flood designation has been noted. The
lack of official sources for flood history has been detailed and the fragmented nature of
the insurance market described. In considering the purchase of a property in the
floodplain the buyer must weigh up all this information and decide whether to avoid
the risk by buying elsewhere or to accept the risk due to some compensatory factor,
possibly a financial one. There is no clear evidence to determine which aspect of the
flood status of a property is most important to purchasers. Figure 6-7 shows the three
dimensional space into which flood risk status may fall.
Figure 6-7 : The three dimensional nature of flood status
Under the assumption that a buyer can access information regarding these three factors
in advance and that there are only two levels of each factor then there are eight
possible variants of flood status. The best case scenario would be low risk, no flood

Conceptual Model Development
158
history and no problems with insurance. The worst case scenario would be high risk,
frequently flooded and no available insurance. If there are more levels of each factor
the possibilities multiply quite quickly. In the UK, because flood history is not wholly
reflected in designated flood risk and flood risk is not reflected in insurance premiums
it will be feasible to observe houses in all categories. Therefore the effect of each factor
on the value of transacted property can, in theory, be tested separately.
6.7 DATA ISSUES FOR THE UK MARKET
In estimating models of house price impacts within a given market the pragmatic
researcher must consider access to appropriate data. As discussed in chapter 4
methodology used in housing studies is often determined by the limits of available
data. A data review was an essential preliminary step before determining which
estimation procedures would succeed in the UK market. Many issues concerning data
have been discussed in the preceding chapters, this section summarises the data issues
and the sources chosen for the present study. These decisions are linked to the choice
and development of the novel methodology described below.
6.7.1 House price data
Data on asking prices of houses is relatively accessible on an ad hoc basis. Often,
studies of house prices use asking prices taken from local estate agents or local press
(Henneberry, 1998). In the case of a study of flooding, or indeed any newly introduced
amenity or disamenity market reaction will take time to filter through to asking prices.
As discussed in chapter 3 asking prices are not ideal for studies of the impact of
disamenities on house prices.

Conceptual Model Development
159
Data on realised prices are available in Scotland via the Register of Sasines on an ad-
hoc basis. However the difficulty in collating these records into an accessible form has
made large scale studies problematic. Transaction data has been even more difficult to
obtain in England and Wales where, until recently, the central source of such data, the
Land Registry, refused to release the information. Since 2005 the Land Registry
database has opened up and is now available at an individual property level from April
2000 to date. In summary the data available is the price of property transfers at market
rates complete with date of transfer by residential address.
6.7.2 Descriptive housing data
In order to build hedonic models of housing markets it is necessary to obtain structural
details of transacted property. The Land Registry only provides information regarding
the type of dwelling (Flat, Semi or Detached), whether a property is newly built or not
and the nature of land tenure. Details such as the number of bedrooms and other
structural characteristics would need to be acquired from another source. Locational
variables are similarly difficult to obtain, although they are more accessible since they
can be determined from outside the property (Day, 2003). The main body of the study
will be based on repeat sales methods in order to avoid the collection of property
specific structural data and locational data. However, as discussed below, additional
information will be collected for a subset of properties by means of a questionnaire
survey. The number of bedrooms, age of property and number of storeys can be
included in a truncated hedonic model for those properties.

Conceptual Model Development
160
6.7.3 Insurance premium data
Since insurance is the concern of private companies, commercial interests dictate that
very little information is shared. Estimates of changes in average insurance costs are
provided by the AA in their premium index, however these are not sufficiently detailed
to pinpoint costs for any group of policyholders. A review of sources likely to hold
insurance data was carried out in the initial phases of the research but identified no
reliable and publicly available source of premium data.
Many of the problems in obtaining insurance data within the UK have been discussed
in sections 5.4 and 5.6. In summary, surveys of published insurance rates for the UK
are likely to overestimate the population affected by insurance problems because they
cannot take account of the joint history of insurer and policyholder. In this instance,
surveys of policyholders will give a more accurate picture.
The use of a questionnaire survey was therefore determined upon as the method of
collecting insurance premium data for this study. Only a subset of properties could be
surveyed due to time and cost considerations. The design and implementation of the
questionnaire survey is described in section 7.6.
6.7.4 Flood history information
Studies which focus on a particular flood event necessarily require information about
that event. Further information about the past floods will also be useful in assessing
the significance of the studied event in the context of local flood experience. Flood
history information is not routinely collected at the detailed level necessary for housing
studies. Many previous analyses have encountered this difficulty (Skantz and

Conceptual Model Development
161
Strickland, 1987, EA/DEFRA, 2005) with the inability to definitively identify flooded
properties.
It is often necessary to collate multiple sources of information in order to build up the
best possible picture of flood history for an area. Institute of Hydrology (1999)
suggests the use of rainfall records, local records, river authorities, parish registers,
newspaper reports, the Dundee database and previous studies compiled for different
purposes. Within this thesis many of these sources will be examined and referenced.
However, it is beyond the scope of this research to provide forensic evidence of past
flooding, in part because it is the intention of the research to address multiple flood
sites. In order to remain consistent across sites a simplifying definition of flood history
is necessary, despite the fact that this will be inaccurate in some cases. Categorisation of
flood sites will be achieved via reference to textual information about flood history and
defence improvements. For the main body of the research a property will be assumed
to have a flood history if it is designated at risk and is within a location which has
suffered flooding. This simplified flood history definition may also reflect the reality
for a property buyer as they would also lack access to accurate flood history
information. For a subset of individual properties, flood history information will be
collected via the insurance questionnaire.
6.7.5 Flood designation
Flood designation can be determined from the Environment Agency profile maps.
These maps change as new models are developed and new defences are installed The
designation category of the properties used in this analysis is a snapshot, taken during
2007 and as such may be unrepresentative of the designation at the time of purchase.

Conceptual Model Development
162
This is an unfortunate limitation of the study which could not be rectified due to the
reluctance of the Environment Agency to provide any better estimates. Interpretation
via textual sources is possible in judging whether the designation will have changed
significantly since the 2000 event.
6.8 METHODOLOGICAL DEVELOPMENT
To overcome the difficulties expressed above several novel model developments are
presented here. These represent an original contribution to methodology of this
research programme. The methodology is based upon a repeat sales specification of
the general hedonic model adapted for the UK market as described above. The
modifications described below are designed to combat the problems represented by
small sample sizes, the time varying nature of flood effect and the three dimensional
nature of flood status.
6.8.1 A time varying specification
Revisiting Equation 2 with the addition of a simple flooding term the growth in price
of property i between time t and t+k is given by Equation 3:
Equation 3
∑∑=
++
−
++ +−++−−=−J
jitkttiktitijj
J
jktijjtikti ccZZXXPP
1,,,,,
1,,,, lnlnlnln τεγγββ
βj = a vector of coefficients representing the elasticity of price with respect to
the matrix of locational and property specific explanatory variables, Xjit.

Conceptual Model Development
163
Zit is the flood status variable at time t with coefficient -γ (0 if not previously
flooded 1 if previously flooded)
εit, the error term is distributed mean 0 and variance σe2
ct a generalised logarithmic market growth term.
Property factors such as size and age of house are assumed not to change significantly
in the small time between t and t+k. Thus Equation 3 reduces to:
Ln Pit+k - Ln Pit = -γ(Zit+k –Zit)+ ct+k - ct + εiτ
In a flood free property the flood status component cancels out leaving the average
growth in a flood free property determined by the market growth rate plus a random
error. This is the basis of the repeat sales index as shown in section 3.6. For a flooded
property the term will persist when t is a time before the flood and t+k is after the
event. The growth effect of the change in flood status is estimated by Equation 4:
Equation 4
∑=
++ −−−=n
itiktitkt ppccn
1,, ))/ln()(()/1(γ
where t is some time period before the event and t+k is after the flood, n is the
number of properties which have a sale before and after the flood event and are in the
flooded cohort. The percentage change in price due to flood becomes (eγ-1)*100.
If the time periods are restricted to two: one before and one after the flood then the
result is a model very similar to the “difference-in-difference” model of Gibbons and
Machin (2005). Where, using the non-flooded property as a control to estimate c gives

Conceptual Model Development
164
(ln Pi2 - ln Pi1 )f = -γ(Zi2 –Zi1)+ (ln Pi2 - ln Pi1 )nf + εiτ
and therefore
(ln Pi2 - ln Pi1 )nf - (ln Pi2 - ln Pi1 )f = γ+ εiτ
However in this analysis, if the 2000 flood event is to be measured, Land Registry data
(which is available at a property level from April 2000 to date) covers a period of only
seven months prior to the flood and six years after the flood. The observations are also
likely to be sparsely spread through the time horizon. Thus it makes sense to introduce
a more flexible time adjustment.
There are a number of ways to do this. Pairing sales to ensure that the average time
between sales is the same for the non-flood and flooded cohorts is a simple option but
involves reducing the number of observations still further. Gibbons and Machin (2005)
estimate a time trend from their full sample although adjustments are made to allow
for time trends which differ between locations and this is seen to affect the estimates
of transport impact substantially. Rather than using the whole sample, the control
population could be used. Growth rate can then be estimated using Equation 4.
These methods result in an estimate of event impact that is constant whatever the time
elapsed since the flood event. Tobin and Montz (1994) and others have argued that
flood effect declines with distance from the flood event. If the control population is
used to estimate underlying market growth, c, then the difference in growth at each
point in the post event history will give additional information. Essentially Equation 4
is estimated separately for each time period (d) post flood
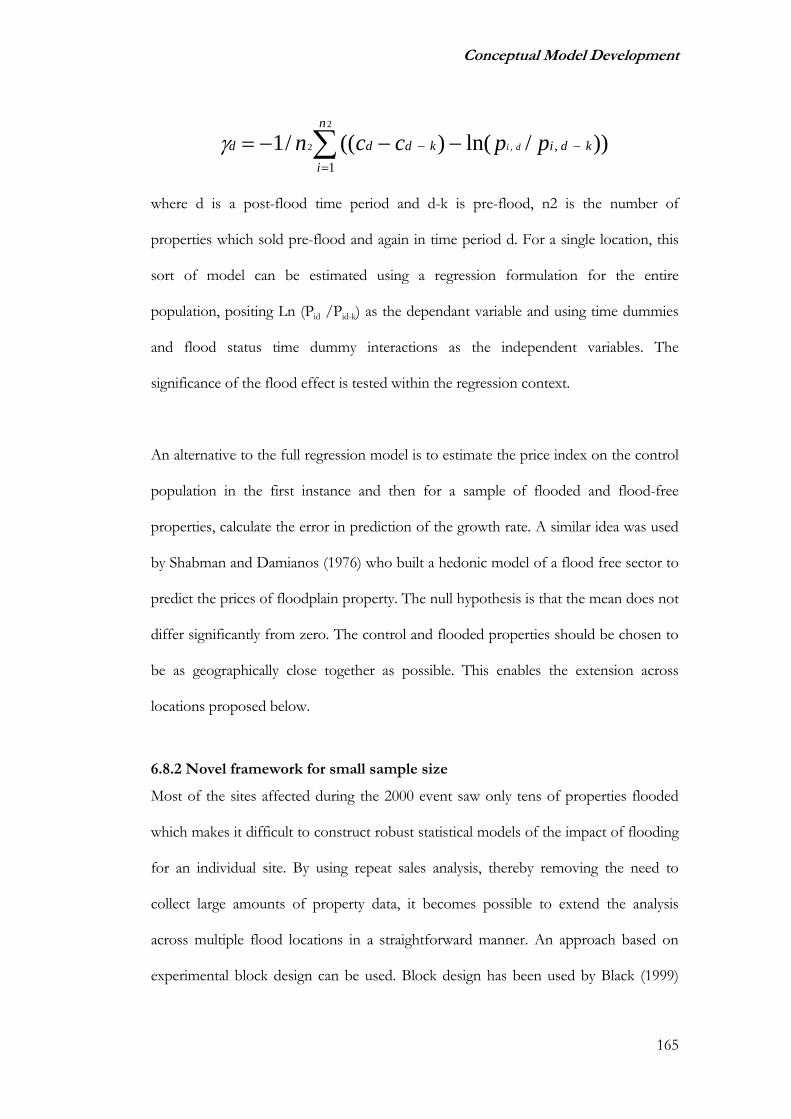
Conceptual Model Development
165
∑=
−− −−−=2
,2
1, ))/ln()((/1
n
ikdikddd ppccn diγ
where d is a post-flood time period and d-k is pre-flood, n2 is the number of
properties which sold pre-flood and again in time period d. For a single location, this
sort of model can be estimated using a regression formulation for the entire
population, positing Ln (Pid /Pid-k) as the dependant variable and using time dummies
and flood status time dummy interactions as the independent variables. The
significance of the flood effect is tested within the regression context.
An alternative to the full regression model is to estimate the price index on the control
population in the first instance and then for a sample of flooded and flood-free
properties, calculate the error in prediction of the growth rate. A similar idea was used
by Shabman and Damianos (1976) who built a hedonic model of a flood free sector to
predict the prices of floodplain property. The null hypothesis is that the mean does not
differ significantly from zero. The control and flooded properties should be chosen to
be as geographically close together as possible. This enables the extension across
locations proposed below.
6.8.2 Novel framework for small sample size
Most of the sites affected during the 2000 event saw only tens of properties flooded
which makes it difficult to construct robust statistical models of the impact of flooding
for an individual site. By using repeat sales analysis, thereby removing the need to
collect large amounts of property data, it becomes possible to extend the analysis
across multiple flood locations in a straightforward manner. An approach based on
experimental block design can be used. Block design has been used by Black (1999)

Conceptual Model Development
166
and Leech and Campos (2003) to measure the effect of school catchment areas. The
problem of measuring school performance is similar to measuring flooding effects
because the boundaries of school catchment and of flooding can subdivide residential
areas. Sometimes streets can be divided in two so that the only difference between one
side of the street and the other is the variable of interest; for example school catchment
or flood status. In essence Black (1999) and Leech and Campos (2003) have used the
block design to offset the effect of locational variables in their studies. They argue that
it is impossible to measure adequately all locational variables and that by focussing on
discrete, small districts, the differences in those locational variables can be minimised.
The same can be true of flooding studies; one of the few benefits of the small numbers
of properties involved in flooding incidents in analysis terms is that there should be a
surrounding area which can be taken as a control and which is not too different in
characteristics from the flood zone. It is common practice in flooding studies to make
this assumption (see for example Skantz and Strickland, 1987 and Shilling et al, 1989).
Where Gibbons and Machin (2005) use a large number of control properties, much
larger than the treatment population, traditional block design would dictate that a
similar number of treatment and control properties would be used in each block or
town.
Cheshire and Sheppard (2004), also modelling the impact of school catchment areas,
maintain that the theory of homogenous housing areas cannot be tested and so favour
the hedonic method. While testing is never going to be possible without collecting all
the variables, this is also true of omitted variables in so called full hedonic studies.
Gibbons and Machin (2005) compare their repeat sales results to a full cross-sectional
model and conclude that full cross-sectional models overstate the effect of transport

Conceptual Model Development
167
innovations on house price due to unobserved area-specific effects which are
correlated to station proximity.
The use of a block design involves the sweeping assumption of consistency of flood
effect across locations. If the assumption is true then it means that the impacts can be
measured with greater accuracy by aggregating observations across towns. If during
anlaysis it becomes apparent that the assumption does not hold then some information
may still be gleaned from the differences between locations. It is difficult to say in
advance whether this will be the case; floods are certainly a very local phenomenon but
the reaction of a population to a perceived flood risk may be consistent between
locations. One major factor that is likely to change that perception is the frequency of
flooding: a first inundation may have a different impact to subsequent floods. The
locations will grouped by flooding history to test this hypothesis.
6.8.3 Methods for dealing with three dimensional nature of flood status
In the discussion above regarding time varying specification and block design a simple
flood status variable has been assumed. However flood status has been shown to be
three dimensional for the purposes of this study. It is not possible to judge a priori
which definition of flood status is most discriminatory in predicting the value of
property. Initially an analysis will attempt to determine this by modelling each vector
separately. However to fully understand the picture it becomes necessary to extend the
block design to incorporate the complexity of the three dimensions.

Conceptual Model Development
168
In the extended block design, the risk profile of a particular property can be thought of
as falling into one of various classes. Figure 6-7 shows the three dimensional nature of
the risk profile of a property: flood history, insurance cost and designated risk category.
High values of any one of these could negatively affect the value of a property.
Properties are likely to be concentrated in the equality diagonal that is having either
high risk accompanying frequent flood history and high insurance costs or low
insurance cost as a result of low risk and no history of flooding. However, as discussed
above, not all properties will follow this pattern and those properties in the other
blocks can be used to test the impact of the three dimensions of flood status
independently.
For this stage of the analysis a cross sectional hedonic specification will be used. The
impact of flood history, insurance problems, and flood designation will be assumed to
be static over time. Although ideally the time varying specification and the insurance
model should be combined, this was not practical within the limitations of the current
study.
6.9 SUMMARY
This chapter has presented the methodological development necessary for the
measurement of flood impact on house prices within the UK market. Three
developments, a time-varying formulation, hypotheses regarding the action of
insurance in the UK and a framework to measure the three dimensions of flood status
have been described. This methodological development is necessary because the UK
differs from other markets where such studies have been carried out.

Conceptual Model Development
169
Novel methodology is also necessary because there has been no adequate strategy for
dealing with the time varying nature of flood impact encountered in the literature.
This methodology will be applicable to any flood impact study which examines a
dynamic flood situation, either changes in actual flood history or in flood risk
perception can be measured.
The available data, the considered choice of data source and the limitations associated
with that data are also described within this chapter. It is not always possible to obtain
an ideal set of data for a particular study and this research is no exception. Block design
is used to counter the problem of collinearity and small sample size. Until the data is
collected the full design cannot be specified since the sample size will be unknown.
This chapter marks the end of the theoretical development of the framework to be
used for the empirical research. Chapters 2 to 5 presented the extensive literature
review and contained metholodogical and contextual analysis. Chapter 6 has distilled
this analysis into a novel framework for empirical analysis within the UK market. The
way in which this new framework has been implemented is now the subject of Chapter
7 which will include the mechanics of data capture and the choice of locations for
study.

Research Design and Methods
170
Chapter 7 : EMPIRICAL RESEARCH DESIGN AND
METHODS
7.1 INTRODUCTION
The output from the literature reviews in chapters 2 to 5 led to the development of
conceptual models, described in Chapter 6, for the measurement of the impacts of
flooding on house prices and insurance. Chapter 6 also described the way in which
data limitations do not allow for easy estimation of these conceptual models and that it
is not possible to combine all concepts simultaneously. In the pragmatic spirit of this
research, rather than selecting a single model, thus neglecting aspects which have been
considered important, multiple models will be estimated and then a selection between
models based on their outcomes can be made.
In this chapter detail of the practical processes and data capture are reported. Section
7.2 outlines the research strategy which is based on analysis of sites flooded in the
autumn 200 flood event. Section 7.3 describes the 2000 flood event and section 7.4
details the selection of case study locations. The following two sections describe the
data capture for the empirical study: secondary data in section 7.5; and primary survey
data in section 7.6. The data analysis and model building phase is outlined in section
7.7 and the basis for model comparison is set out in section 7.8.

Research Design and Methods
171
7.2 RESEARCH STRATEGY
The research strategy employed in the empirical phase of the thesis combined a
quantitative analysis based on transaction data, a bottom up approach and triangulation
of novel approaches with more traditional techniques. Primary and secondary data
were fused through the inclusion of questionnaire survey data generated within this
research programme with secondary data sources for property transaction and flood
designation categories.
7.2.1 Quantitative transaction based analysis
The underlying strategy for the empirical stage of the research programme is to build
quantitative models of the impact of flooding based on actual transaction data.
Chapter 3 examined the broader house price theory and concluded that theory does
not predict adequately the behaviour of property stakeholders in the presence of flood
risk and that empirical analysis is appropriate. Chapters 3 and 4 concluded that
contingent valuation methods cannot be relied upon to predict the value of property at
risk of flood because of the relative inexperience of practitioners in this area and their
widely differing views. A transaction based method was therefore proposed to address
the third research objective. However, Chapters 4 and 5 also concluded that the
optimum methodology for performing these analyses was not established within the
literature and, in addition, there were particular problems inherent in the UK housing
and insurance market which required novel approaches to be employed. Chapter 6
described the development of those approaches and they will be adopted below.

Research Design and Methods
172
7.2.2 Inclusion of questionnaire survey
In dealing with the issue of insurance, as described in Chapter 5, the most appropriate
source of data for the analysis was the collection of primary data from floodplain
residents. Study of the policies of insurers and their pricing of new business could not
yield sound insight because of the competitive nature of the insurance market and
because the individual negotiations between insurer and insured based on shared
history result in policy prices differing from published rates. The data collection was
effected in the form of a questionnaire survey. The output from this survey was
analysed in isolation from the transaction based data in order to determine the
prevalence of difficulties in obtaining insurance. However the data was combined with
the secondary data on flood risk and transaction prices to form the most complete
picture possible of the flood status of properties in order to estimate all three vectors
of flood impact on property price.
7.2.3 Bottom-up approach
A prominent conclusion from the literature review was that the impact of flooding on
property value differs widely dependent upon local circumstances, for example flood
history and insurance regime. Therefore a bottom-up approach was adopted building
multiple local models rather than attempting to build a top level national model. This
approach allowed for different local circumstances to be observed and for measured
impacts to vary by location. Subsequent combining of data could then be based on an
assessment of whether or not a national model is appropriate.
7.2.4 Triangulation
Triangulation of the results of these novel approaches was also necessary in the
discussion of the model outputs. A comparison of more traditional approaches with

Research Design and Methods
173
the novel methods employed enabled judgements about the value of these novel
approaches in measuring the impacts of flooding in the UK. It also shed light on
whether these methods could be employed elsewhere and in other circumstances.
7.3 THE 2000 FLOOD EVENT
The flood sites included in the empirical stage of the research were selected from
locations which were flooded or narrowly avoided flooding during the 2000 flood
event. This section briefly describes this event and its national impact.
Autumn 2000 was the wettest autumn for 270 years (EA, 2001) and it followed on
from a wet spring and early summer. Heavy and prolonged rainfall during October and
November resulted in serious floods over all parts of England and Wales as illustrated
in Figure 7-1 causing severe disruption to transport and business and requiring 11,000
people to be evacuated from their homes.
Estimates of numbers of properties affected vary but the Environment Agency
estimated that 10,000 homes and businesses were flooded while a further 280,000 were
protected from flooding by flood defences (EA, 2001). Insurance industry estimates of
damage costs for the 2000 floods run to £1bn (ABI, 2005b), economic losses have
been estimated at £0.8bn (Penning-Rowsell and Wilson, 2006). During the 2000 event
locations with long and frequent flooding history were inundated but there were also
floods in areas which had not flooded in a generation. Description of the 2000
flooding as one event masks the fact that the flooding took place over the space of

Research Design and Methods
174
more than a month, commencing in October and going into November with many
locations being inundated more than once and for prolonged periods (EA, 2001).
Figure 7-1 : Map of sites affected during the 2000 flood event (copyright Environment Agency)
The choice of this large scale national event as the basis for the empirical study had
two major advantages: Firstly the number of properties affected was large in UK terms,
if dispersed, providing maximum data; Secondly sufficient time had elapsed since the

Research Design and Methods
175
event for recovery to take place and for the medium term impact of flooding on
insurance and house prices to be assessed.
7.4 CASE STUDY SITE SELECTION
Selection of the analysis sites from the 700 locations flooded during the 2000 event
was based on the need to represent the widest possible variation both geographical and
flood typology while retaining minimum numbers of properties within each selected
site. To that end only sites with greater than 100 affected properties were considered.
The selected sites and their main features are summarised in Table 7-1.
Table 7-1 : Selected locations for empirical analysis
LOCATION DEFENCES SOURCE FLOOD STATUS
No. FLOODED/ PROTECTED REGION
Malton/ Norton
No protection main river
Flooded 169 North East
Woking
No protection main river
Flooded 100 Thames
Shewsbury
No protection main river
Flooded 230 Midlands
Bewdley
No protection main river
Flooded 140 Midlands
Barlby overtopped defences
main river
Flooded 152 North East
Lewes overtopped defences
main river
Flooded 800 Southern
Hatton overtopped defences
main river
Flooded 142 Midlands
Ruthin Ordinary watercourse
non main river
Flooded 250 Wales
Mold Ordinary watercourse
non main river
Flooded 181 Wales
Newport Ordinary watercourse
non main river
Flooded 130 Wales
Southsea surface water non main river
Flooded 200 Southern
West Bridgford
Not flooded
9700 North East
Wakefield Not flooded
1150 North East
Locations highlighted in BOLD are to be included in the insurance survey

Research Design and Methods
176
The geographical spread of the selected sites ranged from Northern England to the
South coast, from the East to the West of England and North and South Wales.
They are illustrated in the map depicted in Figure 7-2. Consideration was also given to
the type of reported flooding, the selected sites cover main river flooding, non-main
river flooding, defences overtopped and overland flow. Past flood history of locations
was also varied across the locations from the frequently flooded Shrewsbury and
Bewdley through Ruthin with little or no flood history to sites which due to defences
had not flooded in the 2000 event such as West Bridgford.
7.5 SECONDARY DATA CAPTURE
The questionnaire survey collected insurance and flood history information for a
subset of properties but the major data sources for the empirical investigation were
designed to be existing secondary sources. In this way a much larger sample of
properties could be used. For the pricing analysis actual transaction price was obtained
from the Land Registry. Designated flood risk which was obtained from the
Environment Agency Website. Flood history information was gained from a multitude
of sources.
7.5.1 Land Registry data
Data on all property transactions requiring registration are collected by the Land
Registry on behalf of Government. The registry holds details of title, covenants, plot
details for residential and commercial property in England and Wales. During 2005 a
subset of this data became publicly available at an individual property level, it can be
purchased directly from the Land Registry.

Research Design and Methods
177
Figure 7-2 : Map of study sites

Research Design and Methods
178
Detailes of the dataset is tabulated in Table 7-2. It specifically excludes all commercial
transactions, transactions before April 2000, and transactions likely to be completed
below market value for example ‘right to buy’, short leasehold, gifts and compulsory
purchase orders. These data are the most complete record of housing transactions in
the UK but do not include property details such as size of accommodation or
condition information.
Table 7-2 : Land Registry price paid dataset
Data were purchased from the land registry for the flood locations identified in section
7.4, postcode sectors were identified which contained the postcodes at risk of flooding
by reference to Environment Agency floodplain maps. All property transactions within
these postcodes were purchased forming a large database of property transactions
Data Record Details
Full Address PAON, SAON, Street Postcode Locality( if available) Town, county
Price Paid £ Unadjusted for inflation Date Date of property transfer Property Type Detached
Semi-detached Terraced Flat/Maisonnette
Tenure Freehold Leasehold
Newbuild Yes No
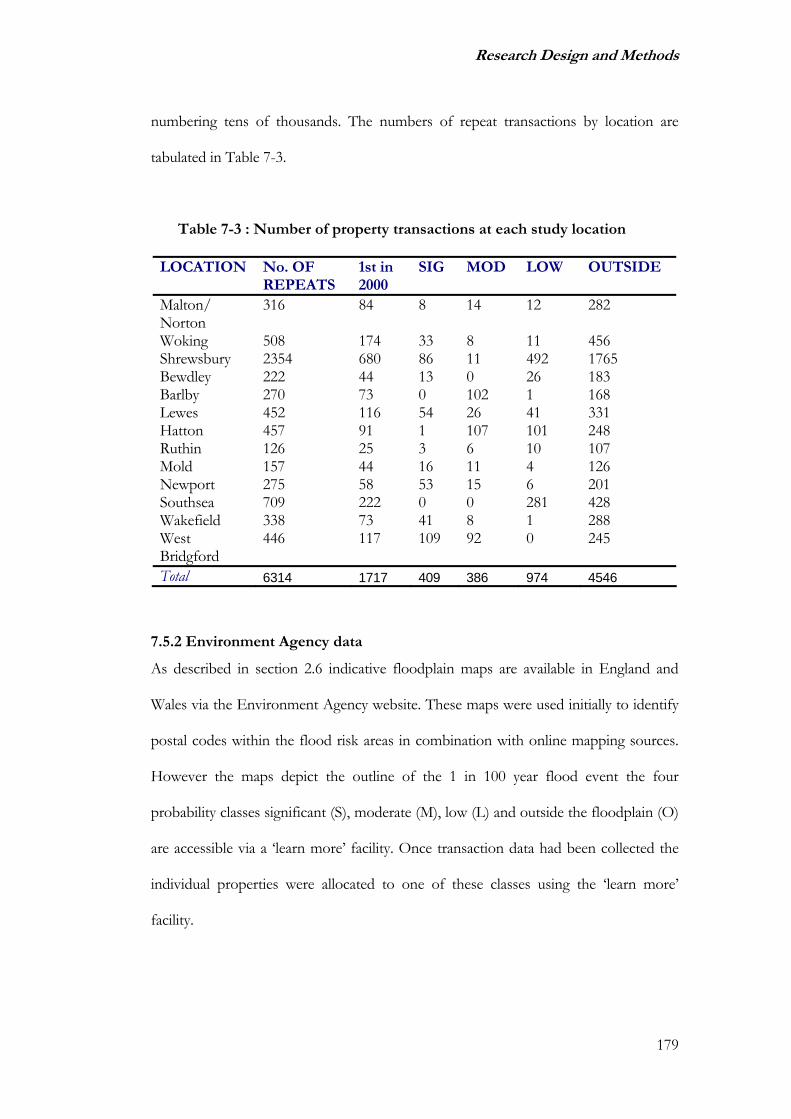
Research Design and Methods
179
numbering tens of thousands. The numbers of repeat transactions by location are
tabulated in Table 7-3.
Table 7-3 : Number of property transactions at each study location
LOCATION No. OF REPEATS
1st in 2000
SIG MOD LOW OUTSIDE
Malton/ Norton
316 84 8 14 12 282
Woking 508 174 33 8 11 456 Shrewsbury 2354 680 86 11 492 1765 Bewdley 222 44 13 0 26 183 Barlby 270 73 0 102 1 168 Lewes 452 116 54 26 41 331 Hatton 457 91 1 107 101 248 Ruthin 126 25 3 6 10 107 Mold 157 44 16 11 4 126 Newport 275 58 53 15 6 201 Southsea 709 222 0 0 281 428 Wakefield 338 73 41 8 1 288 West Bridgford
446 117 109 92 0 245
Total 6314 1717 409 386 974 4546
7.5.2 Environment Agency data
As described in section 2.6 indicative floodplain maps are available in England and
Wales via the Environment Agency website. These maps were used initially to identify
postal codes within the flood risk areas in combination with online mapping sources.
However the maps depict the outline of the 1 in 100 year flood event the four
probability classes significant (S), moderate (M), low (L) and outside the floodplain (O)
are accessible via a ‘learn more’ facility. Once transaction data had been collected the
individual properties were allocated to one of these classes using the ‘learn more’
facility.

Research Design and Methods
180
7.5.3 Flood history information
The variety of sources used for flood history information was large. Newspaper
reports, flood defence scoping reports, crisis management reports, maps supplied by
local EA offices, previous surveys of floodplain populations and the insurance survey
were all employed in building up a picture of the flood history of the selected sites and
the individual properties within them. A summary of the information collected is
contained in chapter 8. Whereas the quality of the information on price and designated
flood risk was the same across flood study sites the flood history information used was
the best available for that location and varied between sites.
Flood history information was collected for three main purposes: First to identify flood
locations suitable for analysis and to narrow down the collection of transaction data to
areas close to the floodplain; second to categorise flood history for the selected sites,
past frequency of flooding and the presence of flood defences were key variables in
this regard; third for the insurance modelling phase to attribute a flood history category
to an individual property. There is no database available which records whether or not
a given property has been subject to flooding in the past. A best assumption has
therefore to be made from questioning the residents and the other sources mentioned
here.
7.6 SURVEY DESIGN
The motivation for undertaking the questionnaire survey was the inadequacy of
available secondary sources as discussed in section 5.6.2. This inadequacy not only
made it impossible to access detailed data for the modelling phase but also left open to

Research Design and Methods
181
debate the scale of the insurance problem for flooded and flood-prone housing.
Therefore the survey instrument had a dual purpose, firstly to establish the distribution
of insurance costs within the floodplain population and secondly to provide detailed
data for the price model.
As detailed at some length above, in the UK there is no published formula from which
one could calculate insurance cost. Property details will be used by a specific insurer to
quote for buildings and contents insurance in a structured way, however not all
insurers will use the same formula. An approximation to the relationship for structural
variables can be made however using the BCIS building cost formula (ABI/BCIS,
2005). An insurance rate can then be calculated for each property, this is the cost of
insurance per sum insured.
In order to fulfil the double needs of data collection and exploratory survey a mixture
of factual, numeric and open questions was used. A large sample was targeted from
within and without the floodplain. The number of questions was kept reasonably low
to make the questionnaire respondent friendly. This had the added benefit of reducing
the burden of data entry and coding. The questionnaire was revised in the light of
comments from a flood victim, an insurance industry representative and a member of a
local flood action group.
Following a pilot study of 350 households in one location, the questionnaire was
revised once more before mailing to 2,130 households spread across four different
locations during the last week in September and first week in October 2006.

Research Design and Methods
182
7.6.1 Initial design
In planning the questionnaire layout and the implementation of the survey, elements of
the Dillman tailored design method (Dillman, 2000) were employed. Due to cost
considerations the entire methodology could not be observed but those
recommendations which were applied appeared to boost the response rate.
The survey instrument employed in the study was a self administered postal
questionnaire. This delivery method was selected in order to minimise cost since the
costs of a postal questionnaire are generally lower than face to face or telephone
interviews (Dillman, 2000). The low response rate of postal questionnaires has been
well explored: Bourque and Fielder (1995) states an expected return rate of 20%.
However in this instance it was also felt that a postal method would increase
compliance in those questionnaires returned because the information requested from
the respondents was largely of a factual nature and may require the homeowner to
refer to insurance documentation. This is more likely to be achieved if the respondent
answers in their own home and can find the information at their leisure rather than
make guesses under time pressure with a face to face or telephone interview.
Self selection of respondents is also an issue for self-administered questionnaires. The
danger that those who reply to a survey are those with a special interest in the survey
topic or are different from the normal population in some other way. There is no way
to avoid the bias introduced by self selection and this must be borne in mind when
interpreting the results.

Research Design and Methods
183
In the proposed price model there are three vectors of flood status, flood history,
flood insurance category and flood risk designation. Designation is available from the
Environment Agency Indicative Floodplain Map. Accurate information on properties
actually flooded and insurance cost however is very difficult to obtain from secondary
sources. The survey was designed to provide the insurance and flood history data on a
subset of properties. Flood history information and insurance cost were therefore the
most important sections of the questionnaire. Questions about the frequency and
severity of flooding and about the cost of insurance and claims history were included.
It was also necessary to collect details of the property and householders because they
can affect the insurance premium charged. Other questions were included to identify
policyholders who have inflated insurance premiums due to some cause unrelated to
flooding. Although it was not deemed possible to completely discount for all factors
affecting insurance premiums, the sample could be checked for bias. The property
details could also be utilised in a truncated hedonic model of floodplain properties for
comparison with the repeat sales model as described below.
Questions about the search strategies involved in choosing an insurance policy were
included to ascertain how far increased costs can be avoided by shopping around.
These sections were also important in determining whether lack of insurance was due
to choice, cost or lack of availability. The identity of the insurance company was
requested to study the difference between the insurance market for flood-risk and
flood-free households.

Research Design and Methods
184
In order to generate realistic ranges for the numerical questions research was
undertaken into expected values for these data. A combination of the building cost
estimator, former surveys and expert opinion were used as described in Table 7-4.
Table 7-4 : Information sources
Annual premium buildings
AA (2005) index sample from £57(shoparound) to £633 (average). Defaqto (2003) average £312 on home insurance Sample quotes from £57 to £350. combined quotes from £160 to £691 Datamonitor (from Crichton 2005) 2002 average £300, flood areas £600 will rise by at least £180 in 2003. Which? (2005) report quotes from Sainsbury of £819 for flood risk house or of £400 with £250 excess
Annual premium contents
AA (2005) index goes from £39 (shoparound) to £423 (average) Defaqto (2003) sample quotes £110 to £600
Excess Crichton 2005 up to £5000 but £1,000-2,500 more common Datamonitor (from Crichton 2005) up to £25,000
Age of resident bands
Use categories from the DEFRA/EA (2004) 18-39,40-64,65-74,75+. Can also compare under 65 and over 65 with census.
Age of property bands
From BCIS rebuilding cost table (ABI, 2006)
Number of bedrooms bands
Use to categorise size of house for BCIS rebuilding costs. Common bands from hedonic studies.
Type of property From BCIS rebuilding cost table (ABI, 2006) Tenure From Census Length of residence
Split at 6 years to reflect resident during 2000 event. Residents with a long history, greater than 10 years may have better relationships with insurers than short term ones.
Length of insurance
Longer than 6 years would mean insured during 2000 event and any claims would be with existing insurer. Lower values can be used to compare at-risk residents loyalty patterns with those not at risk.
The survey instrument was intended to be fairly short and simple to complete requiring
less than 15 minutes effort. To that end most of the questions were closed options
requiring ticks in the relevant box. An open comment box was placed at the end to
allow respondents to express any views or add extra information. A booklet format

Research Design and Methods
185
was chosen as recommended by Dillman (2000) and an accompanying letter to explain
the purpose of the questionnaire was also designed.
Return postage was prepaid and the return envelope was pre-addressed to the same
individual who signed the covering letter. Such personal touches are seen to be
important in raising response rates (Dillman, 2000). The most sensitive questions,
about cost of insurance and insurance claims were situated on the inside pages and so
were not likely to put respondents off at an early stage (Dillman, 2000). A copy of the
pilot questionnaire is included in appendix A together with the accompanying covering
letter.
7.6.2 Pilot study
The pilot study was carried out in Bewdley, a town in the West Midlands. Details of
Bewdley flooding history are discussed in section 8.2. Questionnaires were issued to
350 addresses and a follow up postcard was sent out a fortnight later to residents who
had not responded. Dillman (2000) states that multiple contacts is the most effective
method for generating higher response rates.
Addresses were selected from the council tax register, a list of properties collated for
local taxation charging. This register is available on the internet and contains address
but not name details. It was suitable for the purposes of the survey because it was not
necessary to survey individuals therefore name details were not required. A census
sample of these addresses was drawn from the streets of interest. All streets wholly
within the flood outline were selected. Streets adjacent to the flood outline were
selected. There were several long streets which crossed the flood outline and property

Research Design and Methods
186
numbers within the outline and those outside but close to it were chosen for these
streets. A small area removed from the floodplain entirely was also selected.
For the pilot phase, apart from the form of the questionnaire two further aspects were
directly tested. Class of postage was varied randomly across the mailing to assess
whether there was any difference in response rate due to postage class. Alternative
versions of the questionnaire were presented randomly to the recipients, one version
contained tick boxes containing ranges for the questions regarding insurance cost. The
second version had an open space for the insertion of insurance costs. For such a
sensitive piece of information the danger of leaving an open space for respondents was
that it would reduce compliance. The range box example was seen as more likely to
boost response rates but would have an associated lack of precision. In particular,
because sums of the insurance cost ranges would be taken, a marked improvement in
response rates would be needed to offset the lack of precision.
During the pilot exercise, analysis of the responses was carried out primarily to learn
any lessons and modify the instrument for the full stage of the survey. Total response
rate was 23.7%, i.e. 83 questionnaires. Type 1(with tick boxes for premium costs) had
slightly better return rate at 25.7% rather than 21.1%. Answers to questions about cost
showed a slightly larger gap, 21.1% versus 15.4%. Postage class made no difference.
Those in the floodplain were slightly more likely to respond, 26.1% rather than 17.6%.
The returns following the first mailing numbered 65 (18.5%) and after the reminder
postcard 18 further questionnaires were received ie an extra 5%.

Research Design and Methods
187
A wave analysis was performed to assess the potential for non-response bias. Those
who responded only after a reminder postcard can be regarded as closer to the non-
respondent population than those who responded earlier (Cresswell, 2003). The results
were reassuring as in key variables the differences were negligible as shown in Table
7-5.
Table 7-5 : Wave analysis of pilot responses
Wave 1 Wave 2 Total
Percent of respondents in flood risk area 74 67 72 Percent of respondents assumed flooded 54 50 52 Percent of respondents with no insurance 5 5 5 Respondents median insurance cost category 2 2 2 Respondents modal insurance cost category 2 2 2 Number of respondents in category 65 18 83
If there are any differences in the two populations this table suggests that those least at
risk are least likely to respond but the differences are no larger than rounding errors.
Thirty of the properties had changed hands since the 2000 flood event. Fifty two
respondents were therefore resident during this severe flood. Of those 52, 41 live in
the designated 100 year flood zone and 26 reported having flooded i.e 63%. Many
reasons were advanced for being resident in the floodplain and not flooding including
large sloping gardens, lack of a ground floor, the ground floor consisting of a garage or
having been built on raised ground due to planning guidelines.
Twenty six properties reported a flood history, including those reported as having
flooded prior to respondents residence, twelve had flooded only once, five had flooded

Research Design and Methods
188
twice, seven had flooded up to fiive times and two had flooded more than five times.
The average depth of flooding was less than 1m. Only one property experienced
flooding above 2m and this was a frequently flooded property. The duration for most
was over 24 hours. The typical flooding experience was therefore a prolonged shallow
flooding event.
Only one resident reported a failure to obtain insurance due to flood risk. This
respondent was told that they could gain insurance but would require a letter from the
Environment Agency (EA). The cost of this letter had deterred the tenant from
pursuing the matter. One further respondent reported having been refused insurance
by many companies but had eventually managed to find cover at a high price. Only
four respondents had no insurance, five had buildings only and five had contents only.
83% of residents had both types of insurance.
Only one respondent had premium and excesses in the highest bracket that is premium
cost of over £800 and excess of over £2,500. Excess of over £2,500 may be regarded
as a serious disadvantage when an occupier comes to sell because it will be regarded by
mortgage lenders as capital at risk. In the event of a flood £2,500 is a sizeable sum for a
property owner to pay.
7.6.3 Revised design
In the light of the pilot study, several decisions could be made about the full survey
with increased confidence. Second class postage could be used without impact on the
response rate. The questionnaire was in general clear enough for people to fill in. No
adverse comments were received about the format or the motivation behind the study.
Research Design and Methods
189
Response rate of 24% is good for an unsolicited self administered questionnaire.
Therefore a major redesign of the instrument was not required. The decision was also
taken to use the free entry version of the premium cost question. Although the
response rate would be anticipated to be slightly smaller the increased precision was
seen to outweigh this disadvantage.
There were a few questions on the survey which were poorly complied with. Gender
was left blank by 25 respondents. Perhaps they felt it was irrelevant. In fact unless they
were the named insured their gender was of little relevance. The question was
removed.
Insured contents value was left blank in 59 out of 83 examples. An alternative strategy
was therefore needed to deal with contents value in calculating insurance rate. The
question was removed.
“Reasons for changing insurer” question was only completed by 20 respondents. In
the light of the small numbers being refused insurance it was deemed worthwhile to
explore further the added effort in obtaining insurance for flooded versus non-flooded
residents. The question was replaced with a tick box list of difficulties experiencesd
while seeking insurance garnered from comments on the pilot study and expert
opinion.
Tick all that apply strategy questions were changed to tick the one that most applies
because of the tendency for all respondents to tick “I chose a company I trust”.

Research Design and Methods
190
The questions were rearranged slightly to flow more logically and so that the most
contentious questions were even further down the line.
7.6.4 Implementation of full study
Addresses lists for the full study sites which had suffered flooding were selected in a
similar way to the pilot study. Flood outlines were obtained for Shrewsbury and
Malton and Norton. For Southsea a map showing reported flood incidents was
available, streets which had at least one reported incident were included in the sample,
adjacent streets with no reported flooding were included and a small area just outside
the designated floodplain was also included. In the light of the difficulties in assessing
buildings and contents values for flats and from observation that many flat were
insured via leaseholders, addresses identifiable as flats from the address details were
excluded from the mailing list. For West Bridgford, which had not flooded and had a
very large number of properties at risk of flood a small selection of streets from one
section of West Bridgford which crossed the designated risk bands was selected. A
small area jut outside the designated floodplain was also selected. Questionnaires were
posted to all addresses in each selected street (or street section if street is very long).
The modified questionnaire was issued to the four full study sites within two weeks at
the end of September 2006. Three weeks later a reminder questionnaire was sent to
those who had not responded.
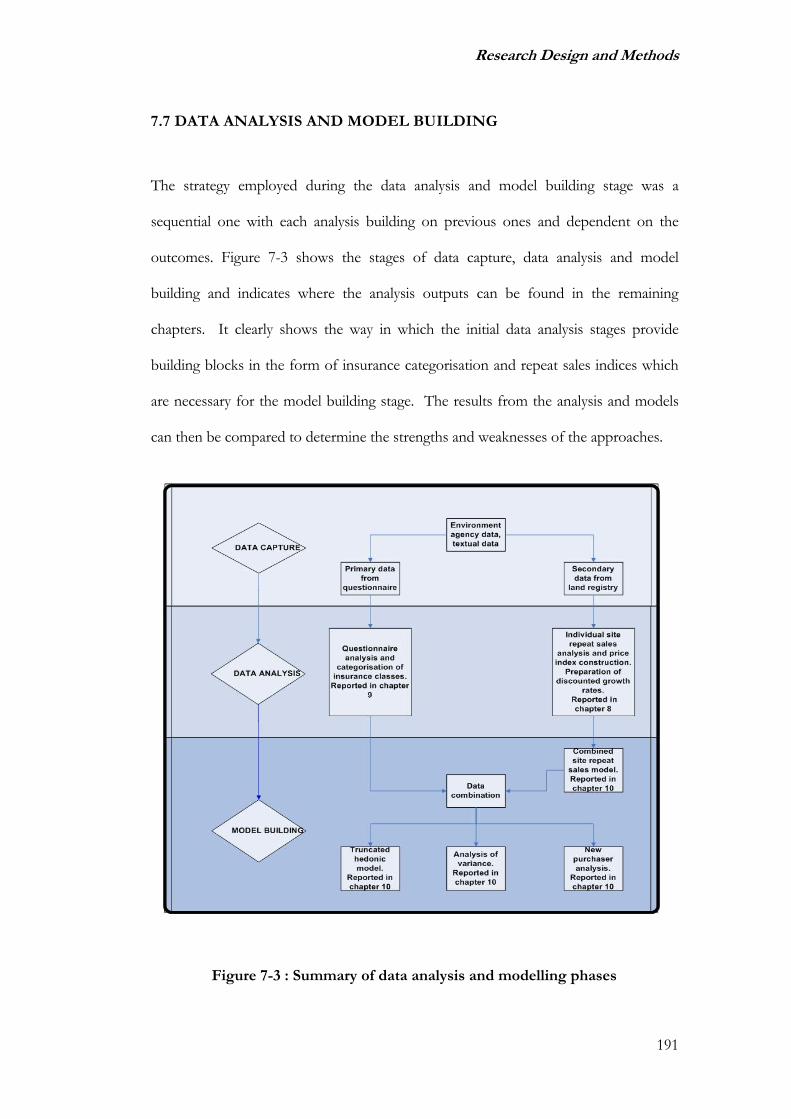
Research Design and Methods
191
7.7 DATA ANALYSIS AND MODEL BUILDING
The strategy employed during the data analysis and model building stage was a
sequential one with each analysis building on previous ones and dependent on the
outcomes. Figure 7-3 shows the stages of data capture, data analysis and model
building and indicates where the analysis outputs can be found in the remaining
chapters. It clearly shows the way in which the initial data analysis stages provide
building blocks in the form of insurance categorisation and repeat sales indices which
are necessary for the model building stage. The results from the analysis and models
can then be compared to determine the strengths and weaknesses of the approaches.
Figure 7-3 : Summary of data analysis and modelling phases
Research Design and Methods
192
7.7.1 Individual site repeat sales analysis
Chapter 8 considers each case study site in turn, summarising the textual and individual
repeat sales analysis. In order to combine growth rates across sites it is necessary to
discount the growth by the average local growth as discussed in chapter 4. This yields
an opportunity to consider each site in isolation in accordance with the bottom up
approach. Three indices are constructed for each site: within the floodplain; outside the
floodplain; and total. The models are compared using a chow test to determine
whether the indices are significantly different over the whole time horizon. Finally a
temporal evaluation is carried out using floodplain/year combination variables to
determine whether there are temporary effects which are significant.
7.7.2 Insurance questionnaire analysis
The main purpose of the insurance analysis is to determine the strength of the
relationship between the flood status variables and the cost and availability of
insurance. This relationship has been claimed but not proven on UK data as described
in chapter 5. The assertion that for the UK the evaluation of insurance cost as a driver
in discounting the value of floodplain property can be undertaken because of the weak
relationship between insurance cost and other status variables rests on this analysis.
As the insurance data is categorical in nature appropriate robust statistics such as the
Kruskal-Wallis analysis of variance and Kendall’s Tau correlation analysis will be used.
This analysis is detailed in chapter 9. Categorisation of the insured into classes for the
combined model will be an essential outcome of the insurance analysis.

Research Design and Methods
193
7.7.3 Combined site repeat sales model
Discounted growth rates were calculated using the individual site analyses and these
were combined into a model of the form described in section 6.5. First a global model
was considered and then the data was divided into three groups of locations with
broadly similar flood histories. In this way flood designation alone could be tested
followed by flood designation in combination with flood history. Finally the change in
flood designation due to the much publicised relaunch of the Environment Agency
indicative floodplain maps was tested by examining the growth rates before and after
the relaunch.
7.7.4 Truncated hedonic model
For a subset of locations a truncated hedonic model was constructed. Property details
were taken from the responses to the questionnaire survey and locational detail was
limited to the survey site. Due to the reduction in sample involved in using the
questionnaire data log of actual price rather than growth was used for this and the
following analysis. Four models were estimated namely: flooded respondents; non-
flooded respondents; all respondents; and all respondents with flood status variables.
The first three models were compared using a Chow test to establish whether the
markets for floodplain and non-floodplain property are different.
7.7.5 Analysis of variance
A robust analysis of variance was carried out on the combined data including flood
status categories as an alternative to the hedonic regression. As discussed in chapter 6
an analysis of variance approach can more clearly demonstrate strengths and
weaknesses in the data. In using a robust method, invalid data assumptions are
avoided. The use of two estimation methods provides a useful validation tool.

Research Design and Methods
194
7.7.6 Analysis of insurance problems at purchase
In a further reduction of sample size there were some respondents to the insurance
questionnaire who had purchased their property since the 2000 event. Analysis of the
difficulties encountered by these residents and the prices subsequently paid by them
was undertaken in order to address the disclosure hypothesis and cash buyer
hypothesis formulated in chapter 6.
7.8 MODEL COMPARISON
In the previous section many analyses and models were described which could
potentially produce conflicting results and which have contrasting strengths and
weaknesses. It is part of the planned internal validation of the analysis to compare the
model outputs and determine whether they are consistent or inconsistent. Findings
which are consistent across models will naturally carry more credence than those which
do not. Anomalies will be highlighted and may indicate areas for future research.
Ultimately the output from one model will be selected to form a predictive framework
for the discount due to flooding. This section describes the method by which
judgement regarding the most appropriate model will be effected
Comparison of the fit of the model to the data is the most fundamental test of model
performance. However, the variety of models and analyses used cannot be compared
on that basis because they use different subsets of a large database. The model fit
statistics will be used only where like can be compared with like.

Research Design and Methods
195
Models based on the widest representation of data will be preferred, in other words
unless inclusion of primary data adds significantly to the explanatory power of the
model then the larger sample of secondary data will be preferred.
Ease of application, is another aspect to be considered. In a market environment it is
unlikely that conclusions reached by this study about the expected levels of discount
due to flooding will remain valid in the long term. In the light of expected changes in
the housing market and in the anticipation of climate change it is important to revisit
the analysis periodically. A methodology which will allow this revisiting with minimum
effort is therefore relatively more attractive than one which requires intensive data
collection.
7.9 SUMMARY
This chapter has described the research strategy for the empirical stage of the current
study. Central themes of the empirical study such as the bottom up approach and the
comparison of methodology have been explained and justified. The process of primary
data collection has been reported in some detail including the design of the
questionnaire survey and brief results of the pilot study. The rationale behind the
selection of study sites has been explored and the secondary data sources clarified.
The following chapter summarises the large volume of data from textual and map
sources which was gathered to determine the flood histories of the selected sites, the
repeat sales indices are also presented. This will be used as contextualising information
for the chapters 9 and 10 which present the results of the quantitative analyses.

Analysis of the Case Study Sites
196
Chapter 8 : FLOOD HISTORY AND PRICE INDEX
ANALYSIS OF THE CASE STUDY SITES
8.1 INTRODUCTION
This chapter summarises the textual sources utilised to determine flood history for the
case study sites. Newspapers, websites, Environment Agency reports and flood risk
assessment reports are the major sources for information on the 2000 event, other
historic flood events and subsequent defence improvements. Also depicted in this
chapter are the indicative floodplain maps for the sites under analysis. These data
demonstrate the great variation in flood history and risk profile for the selected sites.
Price index analysis is also presented in this chapter. The primary aim of the price
index analysis is to establish local price indices for all sites with which to discount the
sales of floodplain and flooded property. Property price inflation is a very important
aspect of the UK housing market during the period under analysis. Many of the local
indices show prices doubling over six years and clearly to deal inadequately with
inflation could mask any flood impacts unless they were of the same order. Local
indices were deemed necessary because housing markets move differently across the
country (Alexander and Barrow, 1994, Cook, 2003). Two sales indices were
constructed for each site one outside and one within the floodplain. These indices are
compared although with the paucity of data these are unlikely to provide robust
estimates of floodplain impact excepting those sites with large datasets.

Analysis of the Case Study Sites
197
A Chow test is performed to determine whether the floodplain subset is significantly
different from the rest of the market. This test, as used by Day (2003) states that when
combining two regression models
RSSR The sum of squared residuals for the combined model
SSR1 AND SSR2 the sum of squared residuals for the individual models
n = number of observations, k parameters common to both models.
Finally in this section a combined regression model tests the significance of the
difference between floodplain and non-floodplain property annually by estimating a
flood index parameter for each year. The chapter is divided into 13 sections one for
each case study site, section 8.15 summarises the analysis.
8.2 MALTON AND NORTON
Malton and Norton are situated on opposite sides of the river Derwent in North
Yorkshire and effectively form one conurbation. Major flood events occurred in
Malton and Norton in 1947, in March 1999 during a period of prolonged rainfall, and
in 2000 during the 2000 event (ARUP, 2006). Other flood events were recorded in
1892, 1931, 1960, 1963, 1982 and 2004. Flooding can be caused by overflowing of the
river Derwent but Mill and Priorpot beck are also involved. During 2000 flooding
occurred in Old Malton, particularly Town Street, up to 3 ft (EA/DEFRA, 2005) in an
area of mixed housing. Springfield Garth and Riverside view in Norton were flooded, a
mix of housing and flats (EA/DEFRA, 2005). Flooding in the 1999 and 2000 events
knkFknSSRSSR
kSSRSSRRSSR2,
21
21 ~)2/()(
/)(−
−+−−

Analysis of the Case Study Sites
198
from Priorpot beck were described as 1 in 5 year events. Groundwater flooding was
also reported during the 1999, 2000 and 2004 events (ARUP, 2006). The flooding was
prolonged estimated at 7 days (EA/DEFRA, 2005).
Since 2000 a new flood alleviation scheme has been constructed, completed in 2003,
which protects Malton and Norton to a level of a 1 in 50 year flood (ARUP, 2006),
there are no plans to raise these defences further. The Mill and Priorpot beck problems
have been alleviated by pumping water from these becks into the Derwent upstream.
In 2004 a flood event occurred on the Derwent after the defences had been installed.
Figure 8-1 shows the indicative floodplain map for Malton and Norton.
© Crown copyright. All rights reserved. Environment Agency,
Figure 8-1 : Indicative floodplain map for Malton and Norton

Analysis of the Case Study Sites
199
For Malton and Norton there were only 316 valid repeat sales, 34 of which were in the
floodplain. The difference between property inside and outside the floodplain is
negligible. Figure 8-2 shows that the floodplain properties appear to lag behind the
market for two years at most. Both the Chow test and the index regression model
indicate that these differences are not significant.
Coefficient Sig I2001 0.142 0.000**I2002 0.392 0.000**I2003 0.596 0.000**I2004 0.844 0.000**I2005 0.897 0.000**I2006 1.007 0.000**F2001 0.017 0.918 F2002 0.071 0.655 F2003 0.110 0.183 F2004 0.032 0.716 F2005 0.033 0.671
Source: Land Registry/Environment Agency2000 2001 2002 2003 2004 2005 2006
-50
0
50
100
150
200
FZ total non-FZ
F2006 -0.175 0.350 Chow test statistic 1.15 not significant at 10%
Adj R-square 0.851
f-test 0.000**
Figure 8-2 : Repeat sales indices for Malton and Norton
8.3 WOKING
Woking is a large heavily developed town in Surrey in the London commuter belt. It is
situated on the river Wey, a tributary of the Thames. At Woking the Wey forks
forming the Hoe stream which flows through the Hoe Valley area of the town.
In 2000 Woking flooded from the Hoe stream around the area of Bonsey Lane, 142
properties were affected (Thrush et al., 2005) in a flood estimated as 1 in 15 year return

Analysis of the Case Study Sites
200
period. Many properties on Bonsey lane affected were maisonettes, implying that
upstairs maisonettes would not be flooded. On the high street flood water was a few
inches and did not enter many properties with raised entries (EA/DEFRA, 2005).
Though a flood watch was in place for the River Wey catchment (including the Hoe
Stream), no direct warning system existed at the time of the Autumn 2000 flood
events. Warning of flooding in the Woking area reportedly came late; information in
the form of leaflets to at-risk households was disseminated by the Borough Council
prior to the flood but some residential roads were mistakenly omitted (Thrush et al.,
2005). The 2000 flood was described as the worst since 1968. In a 1 in 100 year flood
an estimated 300 would be inundated (Woking Borough Council, 2006). Figure 8-3
shows the indicative floodplain map for Woking.
© Crown copyright. All rights reserved. Environment Agency,
Figure 8-3 : Indicative floodplain map for Woking

Analysis of the Case Study Sites
201
Flood defences for Woking were proposed in 2003 to protect 300 homes to a 1 in 100
year standard. To fund the flood defences the scheme also planned to clear up
contamination on a nearby former tip situated partly on the floodplain allowing further
development involving houses and flats. Detailed proposals have now been drawn up
but funding is still an issue (Woking Borough Council, 2006).
In Woking there were 508 valid repeat sales in the area studied of which only 53 were
in the flood zone. There were few differences between the two index curves, if
anything floodzone property grew faster than its equivalent flood free neighbours.
Figure 8-4 shows the price indices for Woking within the floodplain, outside the
floodplain and total, the largest differences are in 2004 and 2005 when the flood risk
property grew slightly faster than the rest. The Chow test suggests that the two
subsectors are different at the 5% level. However the individual index figures are not
significant.
Coefficient Sig I2001 0.080 0.000**I2002 0.235 0.000**I2003 0.313 0.000**I2004 0.412 0.000**I2005 0.451 0.000**I2006 0.451 0.000**F2001 0.030 0.505 F2002 0.027 0.754 F2003 0.020 0.680 F2004 0.062 0.167 F2005 0.069 0.349
Source: Land Registry/Environment Agency2000 2001 2002 2003 2004 2005 20060
20
40
60
80
FZ total non-FZ
F2006 0.023 0.860 Chow test statistic 2.08 significant at 5% Adj R-
square 0.677
f-test 0.000**
Figure 8-4 : Repeat sales indices for Woking

Analysis of the Case Study Sites
202
It is also interesting to note that property prices grew less steeply in Woking than in
many of the other areas studied. After 2004 very little growth is seen. It is reassuring
then that flood risk property is still holding its own in a less buoyant market.
8.4 SHREWSBURY
The Shropshire county town, Shrewsbury, in the West Midlands has a medieval history
with many historic buildings situated in the floodplain. Shrewsbury town centre is
nearly surrounded by the river Severn and during floods can be almost entirely cut off.
The flood history of Shrewsbury is long and frequent, one of the most frequently
flooded of the case study sites. Evidence of the long flood history can be seen in the
elevation of some properties in order to escape the flood levels. These modern
properties coexist alongside older terraced property, historic buildings and a large
number of flats. The most recent event prior to 2000 that flooded domestic property
was in autumn 1998 at 4.87m. In the 2000 event Shrewsbury was flooded extensively
three times in quick succession, the peak was 5.25m. The flooding in Shrewsbury is
quite dispersed geographically, many affected buildings are business premises but it is
estimated that 230 domestic properties were flooded (NAO, 2001).
Many flood alleviation schemes have been discussed for Shrewsbury over the decades
but because of the geographical dispersal few have economic viability. In 2003 a
section of the river in the Frankwell area was defended to the level above the highest
ever recorded peak (5.7 m in 1795) with a combination of permanent and demountable
defences. Other areas of the town have temporary defences and a permanent scheme is

Analysis of the Case Study Sites
203
currently being constructed in the English Bridge area. However there are no plans to
defend other properties at risk. In 2004 during a flood equivalent to the 1998 event
the Frankwell defences proved adequate in defending against flooding, temporary
defences succeeded in defending properties in Coleham but other areas complained of
greater flood depths as a result. A large area of Shrewsbury is designated as within the
1000 year floodplain but outside the 100 year floodplain as shown by the light blue
areas in Figure 8-5, much greater extent than any other of the analysed locations.
© Crown copyright. All rights reserved. Environment Agency,
Figure 8-5 : Indicative floodplain map for Shrewsbury
The large extent of the extreme flood outline may in part explain the lack of price
impact when the 1000 year outline is used to distinguish the flood designation as any
impact would be diluted among properties unlikely to flood. Figure 8-6 shows that

Analysis of the Case Study Sites
204
over most of the time period growth in and out of the floodplain are practically
indistinguishable. However in 2005 there is a marginally significant difference of -5%
for the floodplain property. The chow test confirms that there is a marginal difference
between the two subsectors. However the effect is temporary, disappearing in the
following year.
Coefficient Sig I2001 0.126 0.000**I2002 0.330 0.000**I2003 0.536 0.000**I2004 0.695 0.000**I2005 0.797 0.000**I2006 0.863 0.000**F2001 0.014 0.533 F2002 0.004 0.839 F2003 0.010 0.647 F2004 0.021 0.357 F2005 -0.046 0.051
Source: Land Registry/Environment Agency2000 2001 2002 2003 2004 2005 20060
20
40
60
80
100
120
140
160
FZ total non-FZ
F2006 -0.004 0.874 Chow test 1.54 significant at 10%
Adj R-square 0.87
f-test 0.000**
Figure 8-6 : Repeat sales indices for Shrewsbury
For Shrewsbury it is possible to disaggregate a little further with 86 significantly at risk
properties. Figure 8-7 reveals that the growth in price of significantly at risk property in
Shrewsbury may have been affected by the 2000 event. Whilst moderately at risk and
low risk property shows no impact. This analysis demonstrates the importance of
sufficient disaggregation of data. However for most locations this is impractical as
there are not sufficient properties selling within each risk category. The combination of
locations into a global model in chapter 10 is designed to overcome this issue by
increasing the sample size in each category.
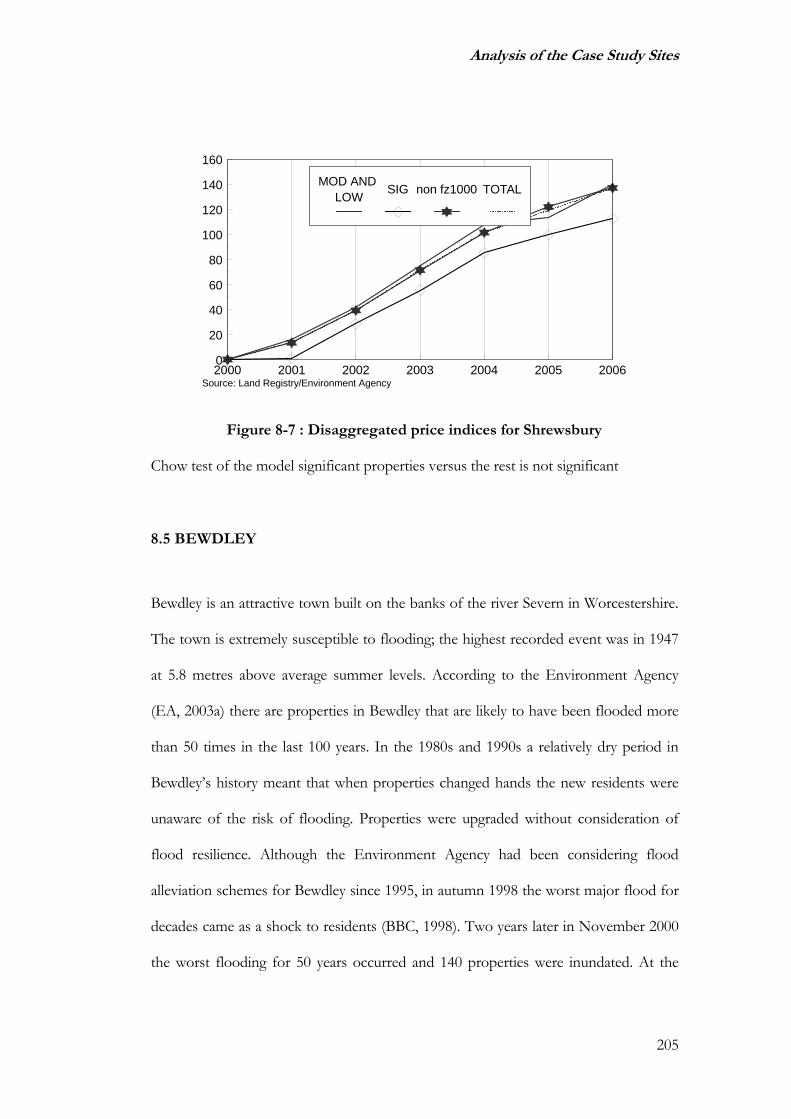
Analysis of the Case Study Sites
205
Source: Land Registry/Environment Agency2000 2001 2002 2003 2004 2005 20060
20
40
60
80
100
120
140
160
MOD AND LOW SIG non fz1000 TOTAL
Figure 8-7 : Disaggregated price indices for Shrewsbury
Chow test of the model significant properties versus the rest is not significant
8.5 BEWDLEY
Bewdley is an attractive town built on the banks of the river Severn in Worcestershire.
The town is extremely susceptible to flooding; the highest recorded event was in 1947
at 5.8 metres above average summer levels. According to the Environment Agency
(EA, 2003a) there are properties in Bewdley that are likely to have been flooded more
than 50 times in the last 100 years. In the 1980s and 1990s a relatively dry period in
Bewdley’s history meant that when properties changed hands the new residents were
unaware of the risk of flooding. Properties were upgraded without consideration of
flood resilience. Although the Environment Agency had been considering flood
alleviation schemes for Bewdley since 1995, in autumn 1998 the worst major flood for
decades came as a shock to residents (BBC, 1998). Two years later in November 2000
the worst flooding for 50 years occurred and 140 properties were inundated. At the
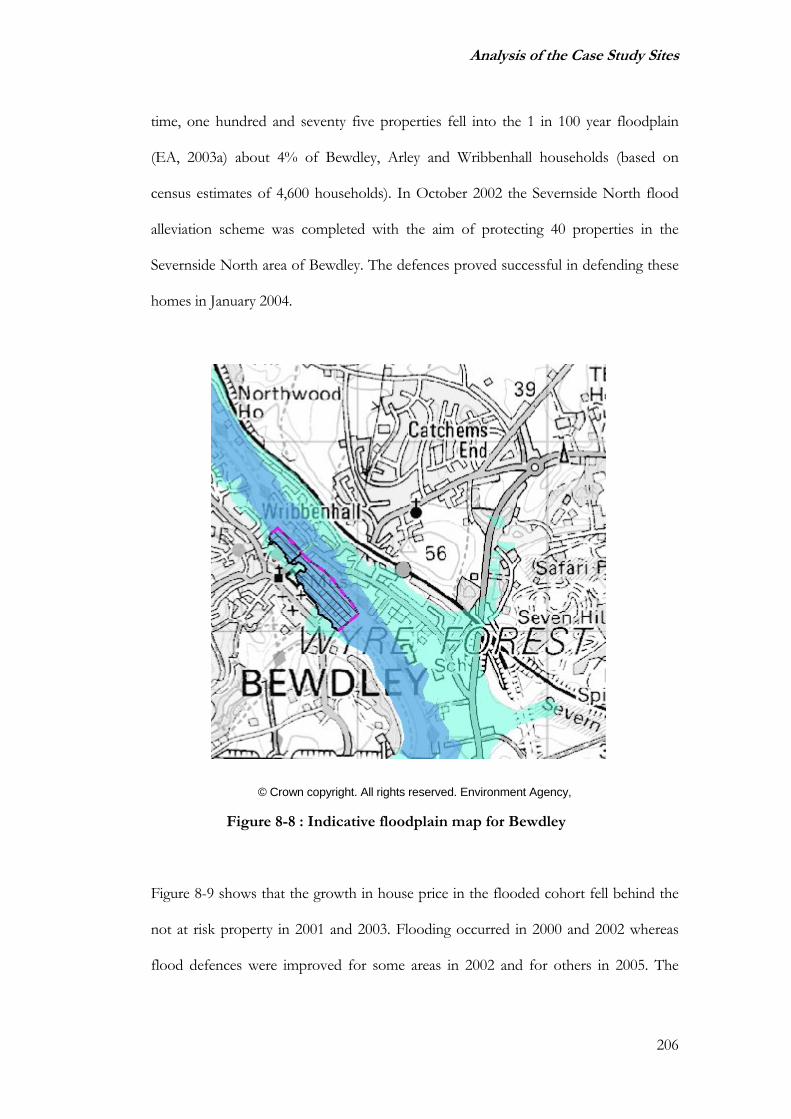
Analysis of the Case Study Sites
206
time, one hundred and seventy five properties fell into the 1 in 100 year floodplain
(EA, 2003a) about 4% of Bewdley, Arley and Wribbenhall households (based on
census estimates of 4,600 households). In October 2002 the Severnside North flood
alleviation scheme was completed with the aim of protecting 40 properties in the
Severnside North area of Bewdley. The defences proved successful in defending these
homes in January 2004.
© Crown copyright. All rights reserved. Environment Agency,
Figure 8-8 : Indicative floodplain map for Bewdley
Figure 8-9 shows that the growth in house price in the flooded cohort fell behind the
not at risk property in 2001 and 2003. Flooding occurred in 2000 and 2002 whereas
flood defences were improved for some areas in 2002 and for others in 2005. The

Analysis of the Case Study Sites
207
Chow test demonstrates that the differences in flooded and flood free indices are
significant at the 1% level.
Coefficient Sig I2001 0.154 0.000**I2002 0.293 0.000**I2003 0.508 0.000**I2004 0.595 0.000**I2005 0.640 0.000**I2006 0.734 0.000**F2001 -0.245 0.001**F2002 0.02 0.820 F2003 -0.201 0.008**F2004 -0.052 0.503 F2005 0.000 0.993
Source: Land Registry/Environment Agency2000 2001 2002 2003 2004 2005 2006
-20
0
20
40
60
80
100
120
FZ total non-FZ
F2006 -0.024 0.815 Chow test 3.3 significant at 1%.
Adj R-square 0.826
f-test 0.000**
Figure 8-9 : Repeat sales indices for Bewdley
Figure 8-9 shows that the flood status for 2001 makes a significant difference to the
price realised for property sold during that year. On average they are selling at a
discount to the property outside the floodplain. This discount amounts to a decline of
seventeen percent of value whereas the rest of the market grew by 10% over the same
period. However the flood risk properties caught up with the flood free ones in the
following year. A similar pattern is seen in 2003 recovery following in 2004.
8.6 SELBY AND BARLBY
Selby and Barlby are situated in North Yorkshire, Barlby is a village to the North East
of the small town of Selby. Selby and Barlby are susceptible to flooding from the river

Analysis of the Case Study Sites
208
Ouse, the last serious flooding occurred during 1947. In Barlby, which is bordered to
the West by the river Ouse and to the East by the A19, in the past there have been two
distinct areas within the village, Barlby Hilltop and Barlby Bridge. New development is
now in-filling the gap between these areas. Barlby is partially protected from flooding
by a flood defence bank. The presence of defences, as is often the case, had reduced
the expectation of flood to the extent that much new development had been or was
planned to be built in the low lying areas of the village. The areas in Selby liable to
flood consist of older properties.
During the autumn 2000 floods the local defences were overtopped inundating 150
properties (NAO, 2001), many of them of recent construction (EA/DEFRA, 2005) to
up to 2 feet. It was a dramatic local event, the planned level of defence was seriously
exceeded by the flood water and it was only thanks to prompt defensive action by the
emergency services that the flooding was prevented from encompassing more
property. From a Manchester University report on the emergency action (Wearne,
2002) there was ‘A massive deployment of sandbags (some via chinook helicopter) on
the left bank of the river from above Barlby and down to Selby’. This partially
succeeded but while overtopping was prevented, scour and piping through resulted in
flooding. Two thousand people were evacuated from their homes and local hospitals
were emptied (Pook, 2000).
After the flood in 2001, emergency strengthening activities were carried out costing
about £1m (Wearne, 2002). Following this shoring up of defences, permanent
improvement of the defences for Barlby were planned. A scheme costing over £10m
to cover Selby and Barlby was started in 2004. In April 2007 the main phase protecting

Analysis of the Case Study Sites
209
1,000 properties in Barlby was opened (Glyn-Jones, 2007) although there is still a
further phase to be completed. Figure 8-10 show the floodplain map for Selby and
Barlby and it can be seen that large areas remain at risk of moderate flooding despite
the recent defence improvements.
© Crown copyright. All rights reserved. Environment Agency,
Figure 8-10 : Indicative floodplain map for Selby and Barlby
The repeat sales indices for Selby and Barlby are shown in Figure 8-11 and it can be
seen that the floodplain property outperformed the market. The chow statistic reveals
that the differences are significant at the 5% level. When Barlby is analysed separately
as in Lamond and Proverbs (2006) there appears to be a much closer correlation
between floodplain and non floodplain property with an apparent short term negative
impact of flooding. Finally the index regression model in Figure 8-11 shows that, on

Analysis of the Case Study Sites
210
an annual basis there are no significant differences between floodplain and non
floodplain property price growth.
Coefficient Sig I2001 0.09 0.046**I2002 0.342 0.000**I2003 0.565 0.000**I2004 0.781 0.000**I2005 0.927 0.000**I2006 0.901 0.000**F2001 0.075 0.403 F2002 0.097 0.264 F2003 0.139 0.125 F2004 0.151 0.088 F2005 0.085 0.359
Source: Land Registry/Environment Agency2000 2001 2002 2003 2004 2005 20060
50
100
150
200
FZ total non-FZ
F2006 0.131 0.133 Chow test statistic 2.08 significant at 5%
Adj R-square 0.86
f-stat 0.000**
Figure 8-11 : Repeat sales indices for Selby and Barlby
8.7 LEWES
Lewes is the county town of the historic county of East Sussex in the South of
England containing many historic buildings including a castle. It is situated in the lower
Ouse sub-catchment about ten miles from the city of Brighton. Lewes is largely built
on a hill but there are some low lying areas adjacent to the river. Lewes had a long
flood history and before the 2000 event had flooded in 1960 and subsequently a flood
defence scheme was designed to protect to a 1 in 100 year flood (Puvacharoen, 2003).
Flooding also occurred in 1979 (EA, 2006b).

Analysis of the Case Study Sites
211
In 2000, widespread flooding in Lewes started at about 1.00pm on 12th October. Flood
defences were overtopped at a number of locations and the town centre was
inundated. Hundreds of people were stranded and had to be rescued by the
Emergency Services in boats. By the time the floodwaters peaked at about 9.30pm,
parts of Lewes were under 3.6m of water. Since the flood defences were breached in so
many places the whole of the floodplain was affected and the waters could not flow
freely away, the flooding lasted for three days. The flood outline as illustrated below in
Figure 8-12 matched almost precisely to the EA extreme flood outline shown in Figure
8-13.
Figure 8-12 : Flood outline for the 2000 event (after Black and Veatch, 2001)
In total 613 residential properties are believed to have flooded in Lewes, principally in
the Malling and Cliffe areas some of which are not included in designated high flood
risk areas. Flood protection schemes are proposed for some of the properties but as
yet only one has been installed. The Malling Brooks catchment is now protected with

Analysis of the Case Study Sites
212
defences costing £1.8m completed in 2004. The breakdown for each area is as shown
in Table 8-1 (adapted from Black and Veatch (2001)).
© Crown copyright. All rights reserved. Environment Agency,
Figure 8-13 : Indicative floodplain map for Lewes
Many development proposals have been put forward in Lewes since the 2000 event.
One particular area, know as the “Phoenix Area” has been subject to several bids for
improvement often incorporating flood defence schemes. The latest version in early
2007 (Lewes Matters, 2007). Some of this area was flooded in 2000. Another area,
partly at risk of flood and partially flooded in 2000 is Landport road. This area is
predominantly council owned although parts of this estate have been sold off under
the right to buy.

Analysis of the Case Study Sites
213
Lewes was officially denoted as the location with the largest number of affected
properties in the 2000 event, it also has one of the most active flood action groups. In
Lewes the floodplain property has fallen behind the market growth consistently as
shown in Figure 8-14, however the chow test suggests that this difference is not
significant.
Table 8-1 : Flood risk and flooded properties in Lewes
Cell No. Cell Name Flood Risk
No of residential properties flooded
Standard of Protection proposed
1 Malling Brooks 1 in 125 227 1 in 200 2 Cliffe 1 in 50 212 1 in 100 3 Town Centre West 1 in 50 32 1 in 100 4 North Street 1 in 50 1 1 in 200 5 Talbot Terrace 1 in 75 46 1 in 200 6 Landport 1 in 25 40 1 in 25 7 Malling Deanery 1 in 25 4 1 in 25 8 North Malling 1 in 25 13 1 in 25
The index regression model confirms this conclusion and shows that the largest
potential impact is a slowing of growth by 11% in 2003. Flooding issues have been
held front of mind by the continual debate around the regeneration and accompanying
flood defences. A more detailed analysis of the Lewes market might yield further
insight into whether the differences are concentrated in the putative regeneration area
and further monitoring of this area should be carried forward to assess the impact of
future developments.
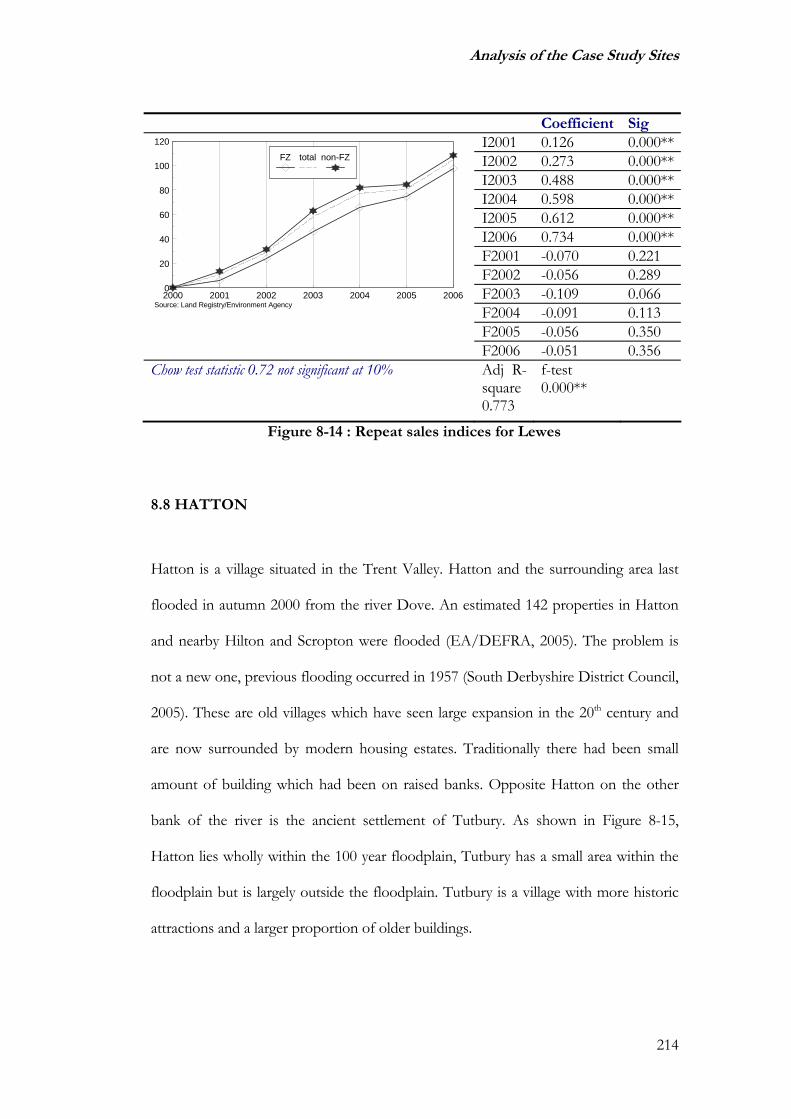
Analysis of the Case Study Sites
214
Coefficient Sig I2001 0.126 0.000**I2002 0.273 0.000**I2003 0.488 0.000**I2004 0.598 0.000**I2005 0.612 0.000**I2006 0.734 0.000**F2001 -0.070 0.221 F2002 -0.056 0.289 F2003 -0.109 0.066 F2004 -0.091 0.113 F2005 -0.056 0.350
Source: Land Registry/Environment Agency2000 2001 2002 2003 2004 2005 20060
20
40
60
80
100
120
FZ total non-FZ
F2006 -0.051 0.356 Chow test statistic 0.72 not significant at 10% Adj R-
square 0.773
f-test 0.000**
Figure 8-14 : Repeat sales indices for Lewes
8.8 HATTON
Hatton is a village situated in the Trent Valley. Hatton and the surrounding area last
flooded in autumn 2000 from the river Dove. An estimated 142 properties in Hatton
and nearby Hilton and Scropton were flooded (EA/DEFRA, 2005). The problem is
not a new one, previous flooding occurred in 1957 (South Derbyshire District Council,
2005). These are old villages which have seen large expansion in the 20th century and
are now surrounded by modern housing estates. Traditionally there had been small
amount of building which had been on raised banks. Opposite Hatton on the other
bank of the river is the ancient settlement of Tutbury. As shown in Figure 8-15,
Hatton lies wholly within the 100 year floodplain, Tutbury has a small area within the
floodplain but is largely outside the floodplain. Tutbury is a village with more historic
attractions and a larger proportion of older buildings.
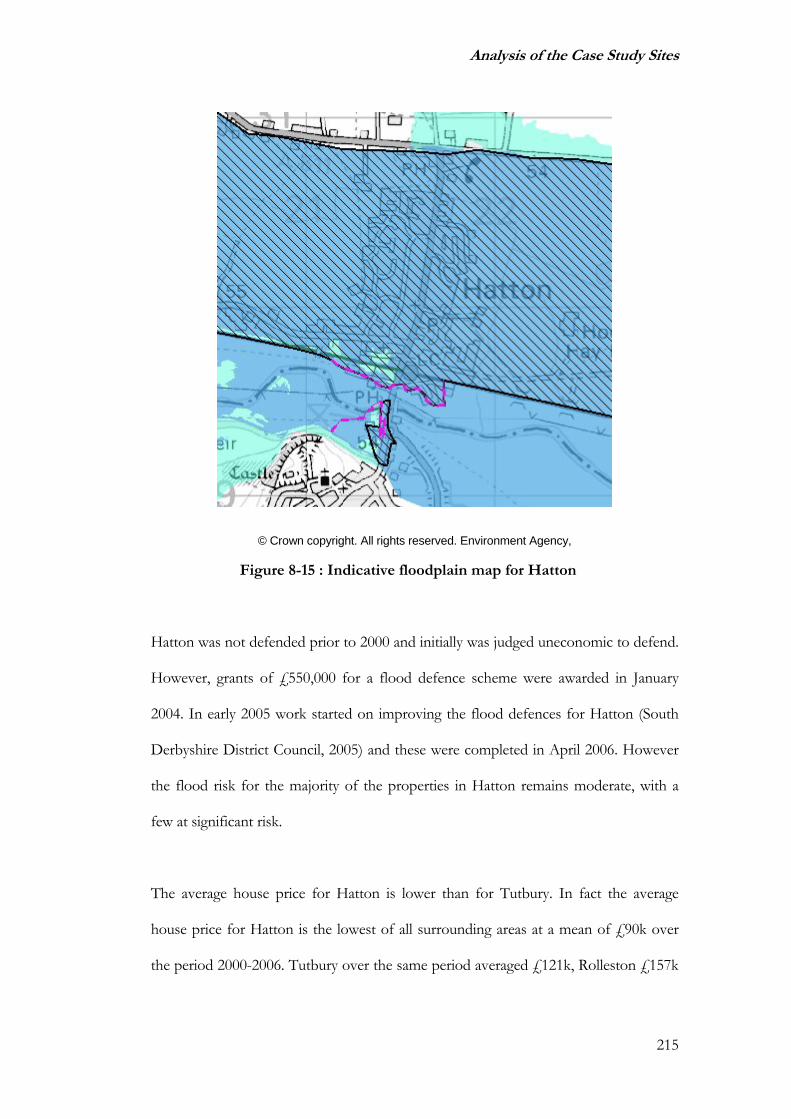
Analysis of the Case Study Sites
215
© Crown copyright. All rights reserved. Environment Agency,
Figure 8-15 : Indicative floodplain map for Hatton
Hatton was not defended prior to 2000 and initially was judged uneconomic to defend.
However, grants of £550,000 for a flood defence scheme were awarded in January
2004. In early 2005 work started on improving the flood defences for Hatton (South
Derbyshire District Council, 2005) and these were completed in April 2006. However
the flood risk for the majority of the properties in Hatton remains moderate, with a
few at significant risk.
The average house price for Hatton is lower than for Tutbury. In fact the average
house price for Hatton is the lowest of all surrounding areas at a mean of £90k over
the period 2000-2006. Tutbury over the same period averaged £121k, Rolleston £157k

Analysis of the Case Study Sites
216
and Hilton £151k. The majority of sales in all villages were detached, freehold
properties with very few flats. The concentration of detached dwellings was most
marked in Hilton.
There were 457 repeat sale pairs in the data, about half in Hilton, the rest spread
between the remaining three villages. About one third contained a new build sale.
About half were in the floodplain. Two repeat sales indices were calculated from the
property inside and outside the floodplain as shown in Figure 8-16. The chow test
shows that the two submarkets are significantly different at the 1% level. The flood
zone property matched the non-floodplain property for growth in the first two years
following the 2000 flood but after 2003 their value began to outstrip the rest. The
index coefficient analysis shows that only the 2003 difference is marginally significant
at greater than the 10% level.
Coefficient Sig I2001 0.126 0.000**I2002 0.273 0.000**I2003 0.488 0.000**I2004 0.598 0.000**I2005 0.612 0.000**I2006 0.734 0.000**F2001 -0.070 0.221 F2002 -0.056 0.289 F2003 -0.109 0.066 F2004 -0.091 0.113 F2005 -0.056 0.350
Source: Land Registry/Environment Agency2000 2001 2002 2003 2004 2005 20060
20
40
60
80
100
120
140
FZ total non-FZ
F2006 -0.051 0.356 Newbuild -0.007 0.000** Tutbury 0.120 0.000**Chow test Statistic 2.7 significant at 1%. Adj R-
square 0.89
f-test 0.000**
Figure 8-16 : Repeat sales indices for Hatton.

Analysis of the Case Study Sites
217
A combination of factors might be at work here. If there was a long term capitalisation
of floodplain location prior to the 2000 flood it is possible that the completion of flood
defences in 2005 may have boosted the price of Hatton property, removing the long
term capitalisation. Tracking of the price of Hatton houses in the longer term might
reinforce this slim evidence. There are two additional terms in this model, newbuild
and a Tutbury term included because of the concentration of newbuilds in the dataset
and the high correlation between Tutbury houses and non floodplain location.
Removing these terms does not impact significantly on the fit of the model but it
changes the significance of the floodplain dummies, shifting the emphasis from growth
within the floodplain to growth within non-floodplain. The Tutbury term is maintained
because it is significant and because it is consistent over time.
8.9 RUTHIN
Ruthin is the county town of Denbighshire in North Wales located around a hill in the
southern part of the vale of Clwyd. The older part of the town, the Castle and Saint
Peter's Square are located on top of the hill, while many newer parts of the town are on
the floodplain of the river Clwyd. However, Ruthin had no great history of flooding,
the worst recorded incident impacted upon only 3 or 4 properties in the 1960s (EA,
2005). Figure 8-17 shows the Environment Agency floodplain map for Ruthin.
Ruthin was affected by flooding three times within six days from the 6th November
2000 onwards. An estimated 250 properties were affected in Park Road, Mwrog Street
and Parc-y-Dre/Denbigh Road. Main flooding was from the river Clwyd. The flood

Analysis of the Case Study Sites
218
model for Ruthin did not predict the flooding of properties in the Parc y dre estate
(EA, 2005) which was suspected to derive from the Mwrog street culvert. In Mwrog
street the water was only inches high and many properties may have escaped damage
(EA/DEFRA, 2005). There are mainly terraced houses in this area. In the Borthyn
area the depth was greater. In 2001 flooding occurred again in Ruthin before the flood
defences had been improved. In October 2003 new flood defences came into force for
Ruthin they were tested in February 2004 and successfully protected Ruthin against
flooding (BBC News, 2004). The price indices for Ruthin are shown in Figure 8-18.
There appears to be a small temporary impact of the 2000 flood event. In 2005 a small
boost is observed correlating with the year following the implementation of new flood
defences. While the chow test indicates a marginal difference between the two subsets,
the index model statistics show no significant flood index coefficients.
© Crown copyright. All rights reserved. Environment Agency,
Figure 8-17 : Indicative floodplain map for Ruthin

Analysis of the Case Study Sites
219
Coefficient Sig I2001 0.010 0.220 I2002 0.240 0.002**I2003 0.417 0.000**I2004 0.760 0.000**I2005 0.861 0.000**I2006 1.107 0.000**F2001 -0.319 0.175 F2002 -0.027 0.925 F2003 0.087 0.671 F2004 -0.058 0.763 F2005 0.186 0.401
Source: Land Registry/Environment Agency2000 2001 2002 2003 2004 2005 2006
-50
0
50
100
150
200
250
FZ total non-FZ
F2006 -0.189 0.402 Chow Test 1.79 significant at 10% Adj R-
square 0.81
f-test 0.000**
Figure 8-18 : Repeat sales indices for Ruthin
8.10 MOLD
Mold is a town in Flintshire, North Wales sited on the river Alyn which grew up
around a castle (now ruined) in the twelfth century. Mold was flooded on the 6th
November 2000, 206 domestic properties were affected (EA, 2005). Twenty six
properties were affected due to defence overtopping during excessive rainfall.
Overland flow was responsible for the remaining 179 properties. As a 1 in 100 year
flood event the 2000 flooding was similar in extent to a flood in 1976. However, more
damage ensued in the 2000 flood due to recent construction in the floodplain. Since
the 2000 flood two phases of defence improvements have been implemented. In April
2006 the new defences were opened with a designed protection level of 200 years for
24 of the properties. The indicative floodplain for Mold is shown in Figure 8-19.

Analysis of the Case Study Sites
220
© Crown copyright. All rights reserved. Environment Agency,
Figure 8-19 : Indicative floodplain map for Mold
Floodplain property in Mold fell behind the market for two years as shown in Figure
8-20 but then recovered. In 2006 floodplain property appears to have overtaken the
non-floodplain cohort. The Chow statistic shows that the apparent differences are not
significant over the whole time period. However there are significant annual effects as
demonstrated by the index regression model in Figure 8-20. In particular there is an
unexpectedly large and significant negative impact of flooding in 2002. This coefficient
is based on 5 properties. Removing one of these properties halves the estimate of
flood impact and renders it insignificant.
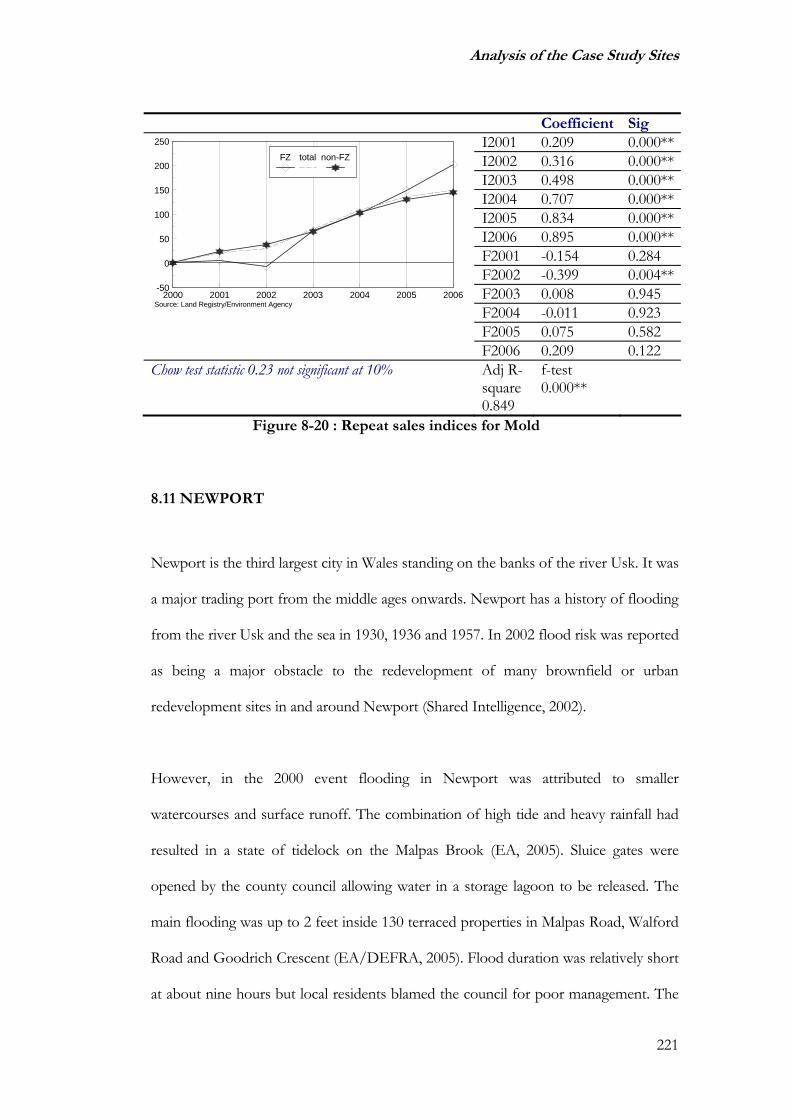
Analysis of the Case Study Sites
221
Coefficient Sig I2001 0.209 0.000**I2002 0.316 0.000**I2003 0.498 0.000**I2004 0.707 0.000**I2005 0.834 0.000**I2006 0.895 0.000**F2001 -0.154 0.284 F2002 -0.399 0.004**F2003 0.008 0.945 F2004 -0.011 0.923 F2005 0.075 0.582
Source: Land Registry/Environment Agency2000 2001 2002 2003 2004 2005 2006
-50
0
50
100
150
200
250
FZ total non-FZ
F2006 0.209 0.122 Chow test statistic 0.23 not significant at 10%
Adj R-square 0.849
f-test 0.000**
Figure 8-20 : Repeat sales indices for Mold
8.11 NEWPORT
Newport is the third largest city in Wales standing on the banks of the river Usk. It was
a major trading port from the middle ages onwards. Newport has a history of flooding
from the river Usk and the sea in 1930, 1936 and 1957. In 2002 flood risk was reported
as being a major obstacle to the redevelopment of many brownfield or urban
redevelopment sites in and around Newport (Shared Intelligence, 2002).
However, in the 2000 event flooding in Newport was attributed to smaller
watercourses and surface runoff. The combination of high tide and heavy rainfall had
resulted in a state of tidelock on the Malpas Brook (EA, 2005). Sluice gates were
opened by the county council allowing water in a storage lagoon to be released. The
main flooding was up to 2 feet inside 130 terraced properties in Malpas Road, Walford
Road and Goodrich Crescent (EA/DEFRA, 2005). Flood duration was relatively short
at about nine hours but local residents blamed the council for poor management. The

Analysis of the Case Study Sites
222
area is not covered by Environment Agency warning schemes. In June 2005 £1.9 m
flood defences were officially completed protecting 45 properties in Isca and Lulworth
road. Figure 8-21 shows the huge extent of flood risk in Newport from the sea and
river. The area around Malpas brook is shown in Figure 8-22.
© Crown copyright. All rights reserved. Environment Agency,
Figure 8-21 : Indicative floodplain map for Newport
The repeat sales analysis shown in Figure 8-23 is for the areas which flooded in 2000:
Malpas Brook and surrounding areas. Floodplain property grew broadly in line with
the rest of the market with perhaps a small temporary impact. Both the Chow test and
the index regression model indicate that there are no significant differences.

Analysis of the Case Study Sites
223
© Crown copyright. All rights reserved. Environment Agency,
Figure 8-22 : Malpas Brook area flood map
Coefficient Sig I2001 0.080 0.120 I2002 0.333 0.000**I2003 0.568 0.000**I2004 0.814 0.000**I2005 0.954 0.000**I2006 1.033 0.000**F2001 -0.008 0.934 F2002 -0.097 0.246 F2003 -0.047 0.624 F2004 0.016 0.857 F2005 -0.081 0.397
Source: Land Registry/Environment Agency2000 2001 2002 2003 2004 2005 20060
50
100
150
200
FZ total non-FZ
F2006 -0.028 0.973 Chow test statistic 0.6 not significant at 10%.
Adj R-square 0.853
f-test 0.000**
Figure 8-23 : Repeat sales indices for Newport

Analysis of the Case Study Sites
224
8.12 SOUTHSEA
Southsea is an area of Portsmouth, a major port on the south coast of England which
is at risk of coastal flooding. Large areas lie below sea level and are protected by
barriers from permanent flooding. Indeed much land reclamation has occurred in the
past (Clark, 2000). Other flooding can occur due to flash flooding during heavy rainfall
and drainage pumps are a necessary part of Southsea flood defence. In 1953 seawater
flooded the rock gardens (Clark, 2000). The 2000 floods were the worst since records
began but were termed a one in 50 year event. During a period of heavy rain the main
sewage pumping station at Eastney failed. (Clark, 2000). Rivers of floodwater mixed
with sewage poured through peoples’ homes until the emergency services managed to
pump the water away about three hours later. Temporary pumping measures remained
in force for more than a month whilst new pumps were installed. The emergency
services recorded attending 260 flooding incidents.
The risk of flooding for the properties in the Southsea floodplain is described as low,
about 1 in 200. The risk from coastal flooding is mitigated by existing defences and the
water company, having repaired the pumps, does not expect failure to occur again.
Figure 8-24 shows the Environment Agency floodplain map for Southsea. Flooding in
2000 was contained within but did not encompass the entirety of the designated flood
zone. One might immediately expect therefore that any impact of the flood on
property values within the floodzone would be diluted. An added complication is that
more than half the properties are flats vertically removing them from the flood zone.
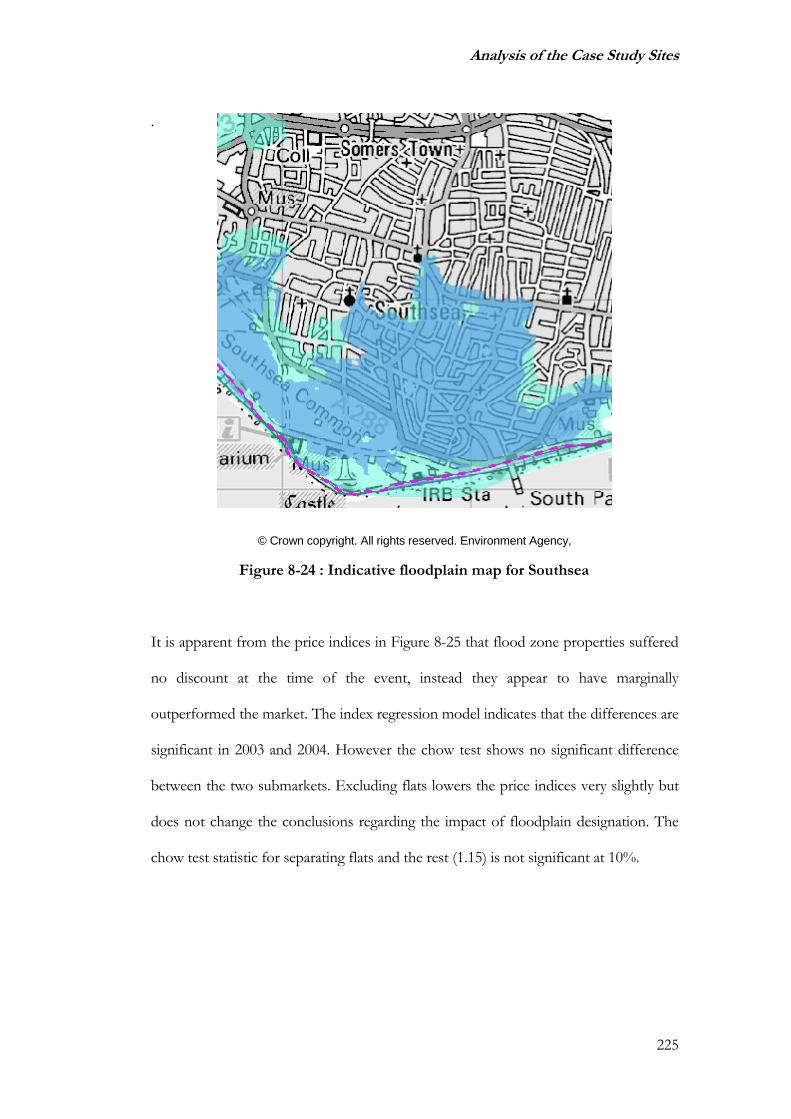
Analysis of the Case Study Sites
225
.
© Crown copyright. All rights reserved. Environment Agency,
Figure 8-24 : Indicative floodplain map for Southsea
It is apparent from the price indices in Figure 8-25 that flood zone properties suffered
no discount at the time of the event, instead they appear to have marginally
outperformed the market. The index regression model indicates that the differences are
significant in 2003 and 2004. However the chow test shows no significant difference
between the two submarkets. Excluding flats lowers the price indices very slightly but
does not change the conclusions regarding the impact of floodplain designation. The
chow test statistic for separating flats and the rest (1.15) is not significant at 10%.
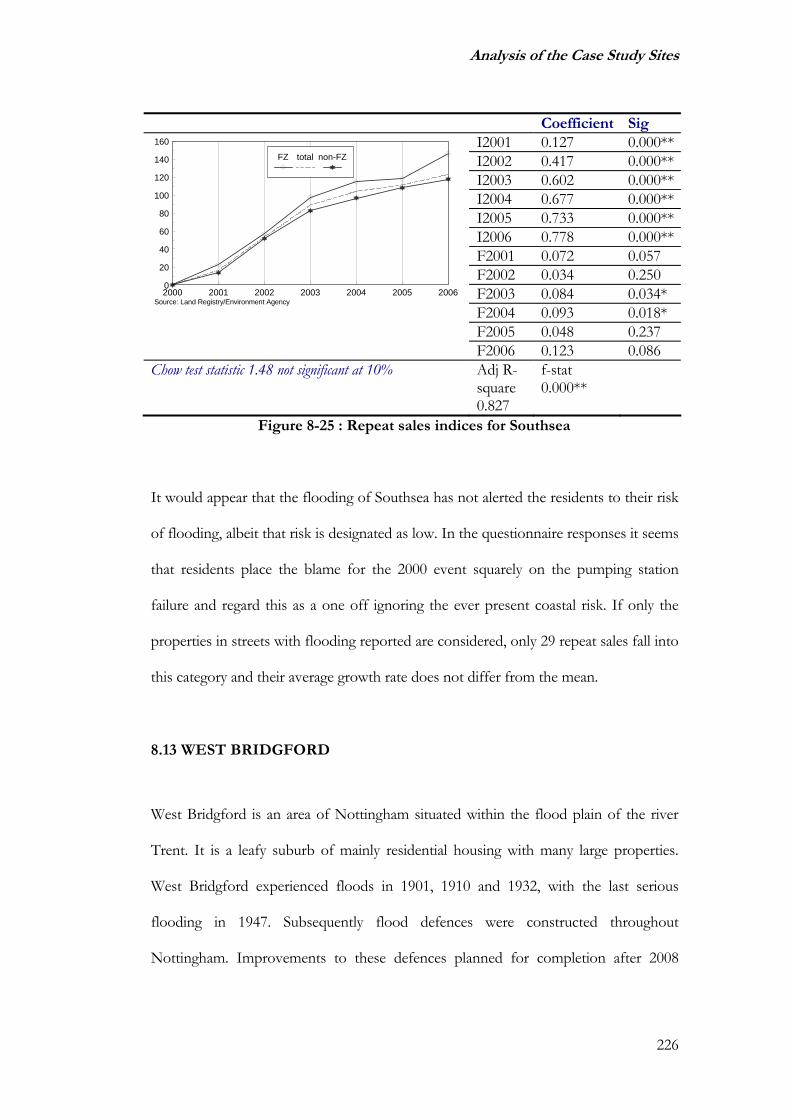
Analysis of the Case Study Sites
226
Coefficient Sig I2001 0.127 0.000**I2002 0.417 0.000**I2003 0.602 0.000**I2004 0.677 0.000**I2005 0.733 0.000**I2006 0.778 0.000**F2001 0.072 0.057 F2002 0.034 0.250 F2003 0.084 0.034* F2004 0.093 0.018* F2005 0.048 0.237
Source: Land Registry/Environment Agency2000 2001 2002 2003 2004 2005 20060
20
40
60
80
100
120
140
160
FZ total non-FZ
F2006 0.123 0.086 Chow test statistic 1.48 not significant at 10%
Adj R-square 0.827
f-stat 0.000**
Figure 8-25 : Repeat sales indices for Southsea
It would appear that the flooding of Southsea has not alerted the residents to their risk
of flooding, albeit that risk is designated as low. In the questionnaire responses it seems
that residents place the blame for the 2000 event squarely on the pumping station
failure and regard this as a one off ignoring the ever present coastal risk. If only the
properties in streets with flooding reported are considered, only 29 repeat sales fall into
this category and their average growth rate does not differ from the mean.
8.13 WEST BRIDGFORD
West Bridgford is an area of Nottingham situated within the flood plain of the river
Trent. It is a leafy suburb of mainly residential housing with many large properties.
West Bridgford experienced floods in 1901, 1910 and 1932, with the last serious
flooding in 1947. Subsequently flood defences were constructed throughout
Nottingham. Improvements to these defences planned for completion after 2008

Analysis of the Case Study Sites
227
should raise them to the 1 in 100 year flood level and will allow for more housing
development (Warren, 2005). Figure 8-26 shows the extent of the floodplain.
© Crown copyright. All rights reserved. Environment Agency,
Figure 8-26 : Indicative floodplain map for West Bridgford
The occurrence of a 1 in 100 year event could devastate this area putting thousands of
homes under water. Although there was no flooding of West Bridgford in 2000
adjacent areas did suffer inundation and therefore awareness of flood risk may be high
in this area. However, the repeat sales price indices depicted in Figure 8-27 show that
the floodplain and non floodplain properties grew at very similar rates over the period.
The Chow test statistic shows that there are no significant differences. This conclusion
is confirmed by the price index regression model.
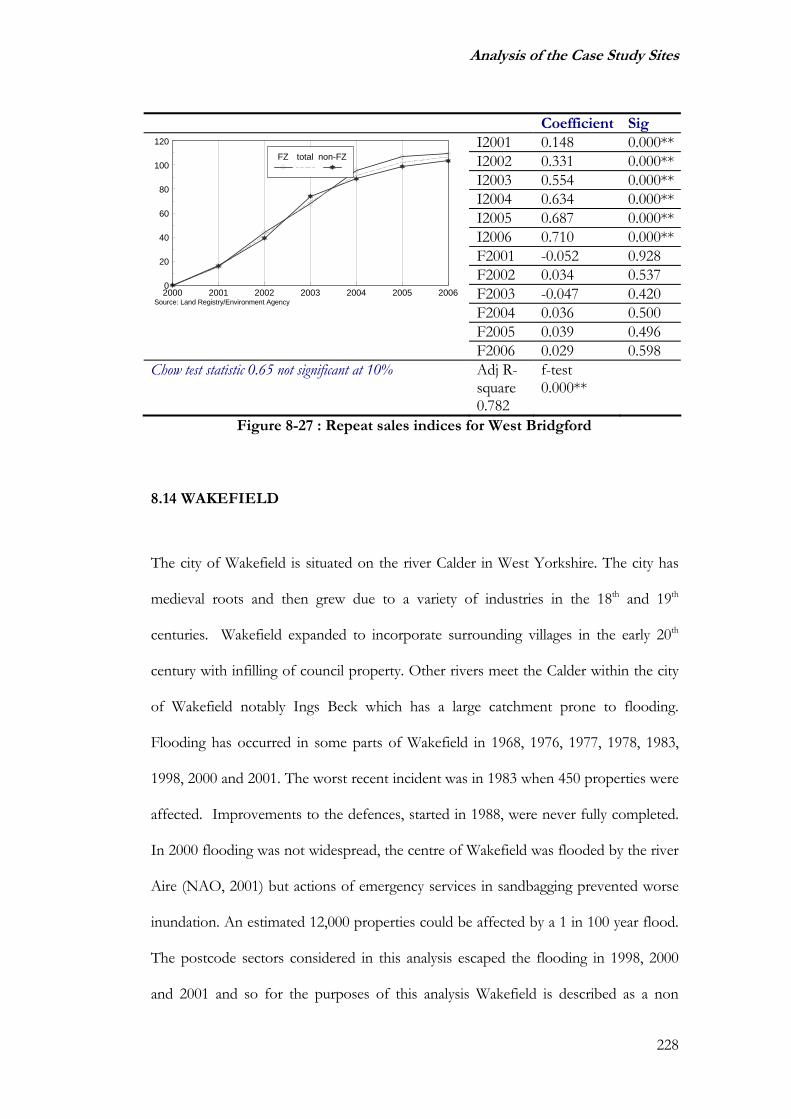
Analysis of the Case Study Sites
228
Coefficient Sig I2001 0.148 0.000**I2002 0.331 0.000**I2003 0.554 0.000**I2004 0.634 0.000**I2005 0.687 0.000**I2006 0.710 0.000**F2001 -0.052 0.928 F2002 0.034 0.537 F2003 -0.047 0.420 F2004 0.036 0.500 F2005 0.039 0.496
Source: Land Registry/Environment Agency2000 2001 2002 2003 2004 2005 20060
20
40
60
80
100
120
FZ total non-FZ
F2006 0.029 0.598 Chow test statistic 0.65 not significant at 10%
Adj R-square 0.782
f-test 0.000**
Figure 8-27 : Repeat sales indices for West Bridgford
8.14 WAKEFIELD
The city of Wakefield is situated on the river Calder in West Yorkshire. The city has
medieval roots and then grew due to a variety of industries in the 18th and 19th
centuries. Wakefield expanded to incorporate surrounding villages in the early 20th
century with infilling of council property. Other rivers meet the Calder within the city
of Wakefield notably Ings Beck which has a large catchment prone to flooding.
Flooding has occurred in some parts of Wakefield in 1968, 1976, 1977, 1978, 1983,
1998, 2000 and 2001. The worst recent incident was in 1983 when 450 properties were
affected. Improvements to the defences, started in 1988, were never fully completed.
In 2000 flooding was not widespread, the centre of Wakefield was flooded by the river
Aire (NAO, 2001) but actions of emergency services in sandbagging prevented worse
inundation. An estimated 12,000 properties could be affected by a 1 in 100 year flood.
The postcode sectors considered in this analysis escaped the flooding in 1998, 2000
and 2001 and so for the purposes of this analysis Wakefield is described as a non

Analysis of the Case Study Sites
229
flooded location but one in which flooding was narrowly avoided. Figure 8-28 shows
this area of the city and the Environment Agency flood outline.
© Crown copyright. All rights reserved. Environment Agency,
Figure 8-28 : Indicative floodplain map for Wakefield
A £7m flood prevention scheme for Wakefield was implemented by 2003 involving
10km of flood defences and upstream flood storage. More than 1,000 properties are
protected by this new work.
The flooded cohort in Wakefield appears to have outperformed the market as shown
in Figure 8-29 but this is seen as not significant by the chow test statistic. Individual
flood index coefficients are significant in 2004 and 2006. It is possible that this may
have been due to flood defences boosting the desirability of this property. However it
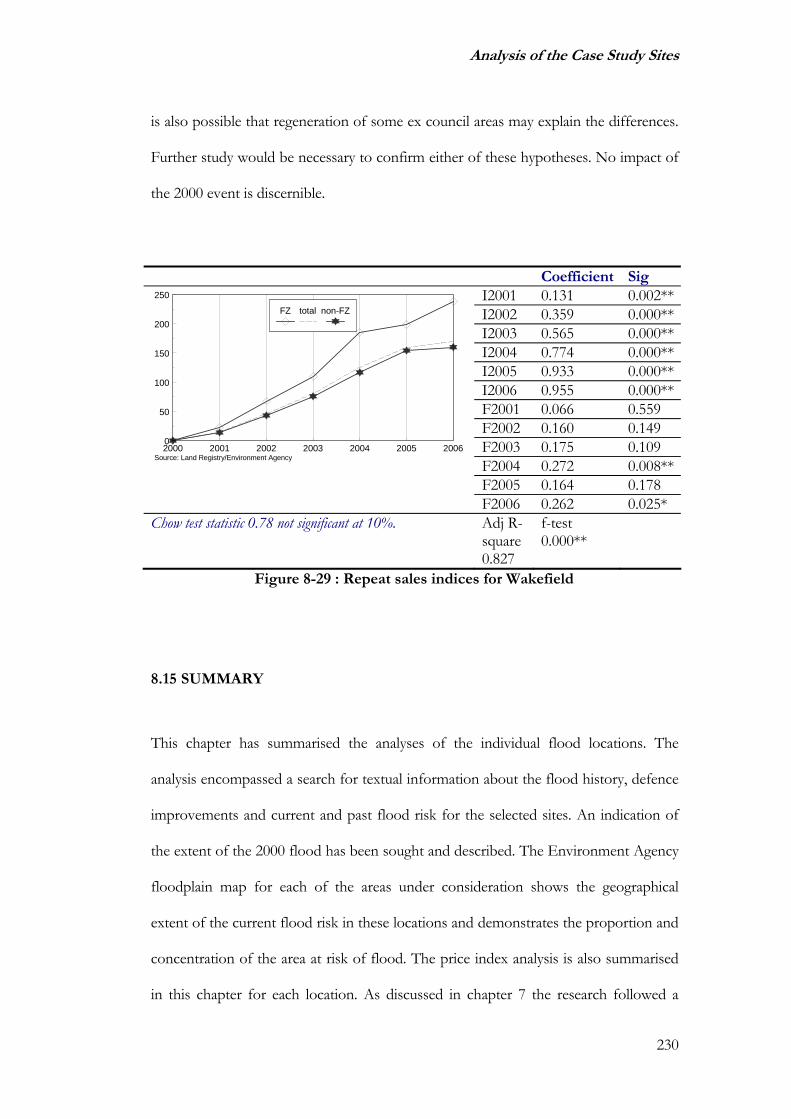
Analysis of the Case Study Sites
230
is also possible that regeneration of some ex council areas may explain the differences.
Further study would be necessary to confirm either of these hypotheses. No impact of
the 2000 event is discernible.
Coefficient Sig I2001 0.131 0.002**I2002 0.359 0.000**I2003 0.565 0.000**I2004 0.774 0.000**I2005 0.933 0.000**I2006 0.955 0.000**F2001 0.066 0.559 F2002 0.160 0.149 F2003 0.175 0.109 F2004 0.272 0.008**F2005 0.164 0.178
Source: Land Registry/Environment Agency2000 2001 2002 2003 2004 2005 20060
50
100
150
200
250
FZ total non-FZ
F2006 0.262 0.025* Chow test statistic 0.78 not significant at 10%.
Adj R-square 0.827
f-test 0.000**
Figure 8-29 : Repeat sales indices for Wakefield
8.15 SUMMARY
This chapter has summarised the analyses of the individual flood locations. The
analysis encompassed a search for textual information about the flood history, defence
improvements and current and past flood risk for the selected sites. An indication of
the extent of the 2000 flood has been sought and described. The Environment Agency
floodplain map for each of the areas under consideration shows the geographical
extent of the current flood risk in these locations and demonstrates the proportion and
concentration of the area at risk of flood. The price index analysis is also summarised
in this chapter for each location. As discussed in chapter 7 the research followed a

Analysis of the Case Study Sites
231
bottom up approach where individual models would be combined if appropriate. The
building blocks of the global model are the price indices generated at the local level by
which means the repeat sales of the flooded property can be discounted for the local
expected growth rate in the absence of flood risk.
What emerges clearly from the textual analysis is that the event labelled “the 2000
flood event” cannot really be regarded as a single event in the aspect of generating
awareness of flood risk. For example the estimated return period of the 2000 event
varies widely across locations so that a resident of Barlby for example would be
unlikely to anticipate a repeat flood of that magnitude during their lifetime whereas one
in Malton and Norton would expect to see several.
Table 8-2 shows a summary of the information obtained from the textual sources
combining the main factors which might be anticipated to have a bearing on the
perception of risk borne by local residents. Risk categories, flood history and defence
improvements are shown. This summary will assist in categorisation of locations for
the combined model.
The results vary a great deal between the flood locations not only in terms of the flood
histories and risk categories of the sites but also in the measured impacts on property
values. This finding was anticipated, indeed partly planned, because locations were
selected to include a variety of flood types and histories including some sites which did
not flood in 2000. The different impacts observed between these locations can be
used to infer which aspect of flood risk is the most important in property devaluation.

Analysis of the Case Study Sites
232
The summary table also shows the results of the statistical testing and it can be seen
there are very few differences which are significant at the 5% level. In fact there are
more flood index coefficients which are significantly positive than there are
significantly negative ones. The hypothesis that flood designation will have an impact
on property price is far from proved by this analysis. The designation hypothesis will
be further tested below by combining all flood locations.
For the two locations at risk of flooding but not flooded in 2000 no price discount was
observable. It is possible that some long term discount applies to floodplain property
which existed before 2000, this has not been tested by the foregoing analysis, but the
events of the last six years have not served to increase any difference.
Two of the previously flooded locations, Bewdley and Mold, showed significant flood
index variables. For Mold the evidence was based on very few flooded properties. All
the impacts had disappeared within three years of flooding. This strengthens the belief
that it is necessary to examine the impact across time. For Shrewsbury weaker evidence
of flood impact was observed which was partly attributed to the dilution of flooded
property within the designated floodplain. One location shows a significant positive
floodplain index which follows a flood defence scheme implementation. Further
investigation of this location is recommended.

Analysis of the Case Study Sites
233
Table 8-2 : Summary of flood status for selected locations
LOCATION
Last flood affecting property before 2000
Highest Risk Properties
Flooded in 2000
Number flooded
Defences improved since 2000
Number of floods 1998 to date
Chow significance level at 10% or better
flood index coefficients significant at 5% or better
Positive or negative impact
Malton/Norton
1999 Significant Yes 169 2003 2 Not sig None
Shrewsbury
1998 Significant Yes 230 2003 4 10% None
Bewdley
1998 Significant Yes 140 2002 and 2005 4 1% 2001 2003
negative negative
Ruthin 1960 Significant Yes 250 2003 2 10% None Barlby 1947 Moderate Yes 152 2007 1 5% None Lewes 1979 Significant Yes 800 2004 1 Not Sig None Hatton 1957 significant Yes 142 2006 1 1% None Woking 1968 Significant Yes 100 No 1 5% None Mold 1976 Significant Yes 181 2006 1 Not sig 2002 negative Newport 1957 Significant Yes 130 No 1 Not Sig None Southsea 1953 Low Yes 200 No but pump
repaired 1 Not sig 2003
2004 positive positive
West Bridgford 1947 Significant No No 0 Not sig None Wakefield 1983 Significant No 2003 0 Not sig 2004
2006 positive positive
Analysis of the Case Study Sites
234
Any impact of floodplain measured was temporary in the majority of instances. At the
end of the six years only one location, Lewes, demonstrated any impact of floodplain
location. In Lewes a discount of 5% was maintained but it was not significant. As
discussed above, special circumstances may make Lewes a unique location and further
tracking of this location is recommended.
The significant temporary price impacts immediately following the 2000 event varied
from no impact to a maximum of 30%. Some locations saw floodplain property
outperform the rest. The choice of the FZ1000 outline as the definition of floodplain
property may explain some of this variation as in some locations the outline is a good
predictor of flood history for example Lewes whereas in others notably Shrewsbury it
is woefully inadequate. However in order to maintain consistency during the combined
analysis the FZ1000 outline will be used to define the flood free price index.
These findings will form the basis of the grouping of flood locations pursued in
chapter 10. As it appears that flood history is likely to affect the measurable price
impact it is proposed to group the locations by flood frequency into three groups
namely not flooded, flooded once and flooded more than once. However within those
groups there is variety in the other aspects of flood status. The not flooded group is
fairly homogenous, as is the frequently flooded group but the third group, flooded
once contains much more variety. In the following section the group of frequently
flooded locations will be combined to form a global model which will consider detailed
flood designation and likely flood history. All of these locations were included in the
questionnaire survey and so a likely flood history can be constructed for each based on
questionnaire responses.

Questionnaire Analysis
235
Chapter 9 : QUESTIONNAIRE ANALYSIS
9.1 INTRODUCTION
In this chapter the data from the questionnaire survey is analysed independently of the
property sales information. The main purpose of this analysis is twofold: to assess the
distribution of insurance availability and cost; and to categorise the insured into groups
for the combined model of price effect with insurance.
The evaluation of the hypothesis discussed in section 5.5 and 6.5 that premium loading
due to flood risk or difficulty in obtaining insurance due to flood risk leads to
depressed house value is critically dependent upon the assumption that property
owners in flood risk areas find it difficult to obtain insurance or have to pay more for
it. As noted in section 5.6 increases in premium and difficulties in obtaining insurance
due to flood risk have been predicted in the light of recent developments in the
insurance market and ABI guidelines. In addition, anecdotal evidence and media
speculation have increased the perception that difficulties with insurance availability are
widespread but this has yet to be demonstrated by systematic research. The results of
this survey will determine the cost and availability of insurance for five of the areas
under study. If insurance problems are detected then categorisation of the insured will
then be possible which will allow for testing of the link between insurance and
property value.
As outlined in chapter 7, this dual purpose survey was carried out using a self
administered postal questionnaire, which was piloted in one location before full

Questionnaire Analysis
236
delivery in four selected sites. A brief summary of findings from the pilot were
included in section 7.6 and the results presented below are for the four full survey
locations, excluding the pilot unless otherwise indicated. The main findings are
consistent across pilot and full survey where comparisons are possible but since the
questionnaire changed after the pilot the two sets of results have not been combined.
Some descriptive and exploratory findings are also included in this chapter which do
not directly address the specific objectives outlined above. These exploratory findings
are valuable and interesting in their own right and may suggest avenues for future
research in the area of flood management and insurance.
Section 9.2 deals with the distribution of the response data, comparing it to national
statistics where possible in order to make an assessment of how representative it may
be of the wider floodplain population. There follows a description of the search for
insurance including the search mechanisms and difficulties encountered in section 9.3.
Section 9.4 summarises the eventual outcome of that search detailing the proportion
who failed to obtain insurance. The average cost of insurance and its distribution
across flood designation and flood history is the focus of section 9.5. Section 9.6 deals
with the perception of risk and mitigation activities pursued by floodplain residents.
Categorisation of the insured necessary for the ongoing analysis is achieved in section
9.7.
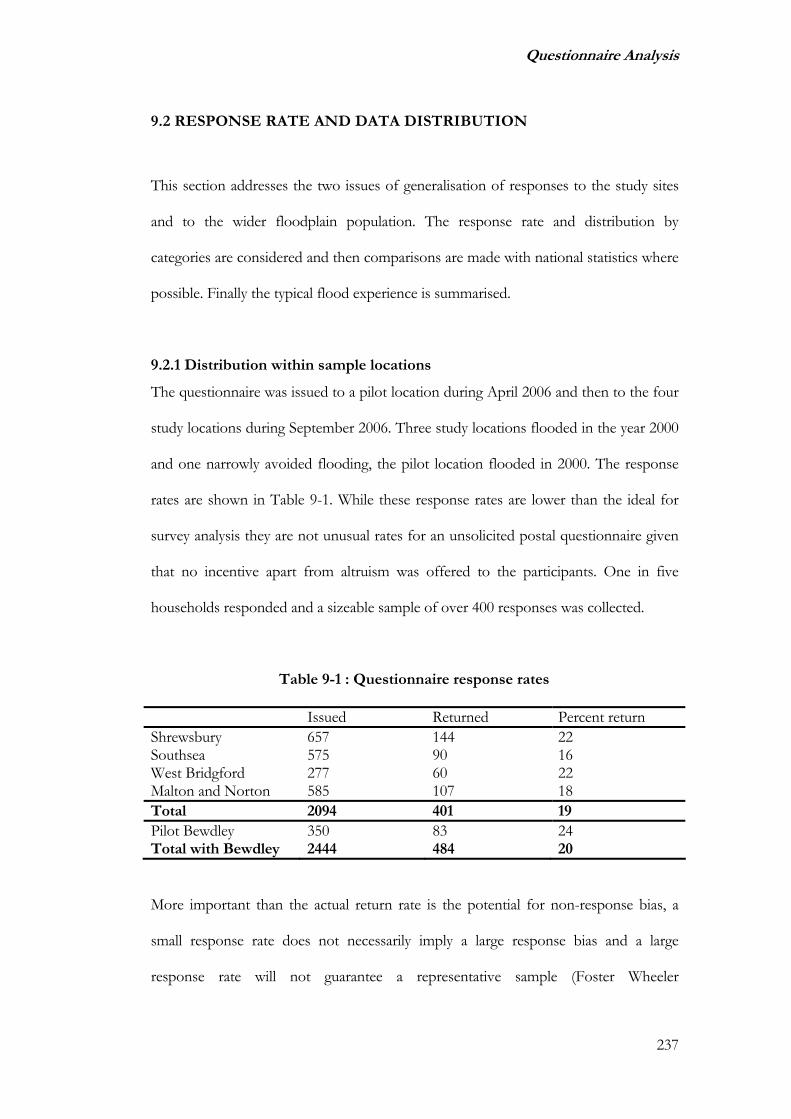
Questionnaire Analysis
237
9.2 RESPONSE RATE AND DATA DISTRIBUTION
This section addresses the two issues of generalisation of responses to the study sites
and to the wider floodplain population. The response rate and distribution by
categories are considered and then comparisons are made with national statistics where
possible. Finally the typical flood experience is summarised.
9.2.1 Distribution within sample locations
The questionnaire was issued to a pilot location during April 2006 and then to the four
study locations during September 2006. Three study locations flooded in the year 2000
and one narrowly avoided flooding, the pilot location flooded in 2000. The response
rates are shown in Table 9-1. While these response rates are lower than the ideal for
survey analysis they are not unusual rates for an unsolicited postal questionnaire given
that no incentive apart from altruism was offered to the participants. One in five
households responded and a sizeable sample of over 400 responses was collected.
Table 9-1 : Questionnaire response rates
Issued Returned Percent return Shrewsbury 657 144 22 Southsea 575 90 16 West Bridgford 277 60 22 Malton and Norton 585 107 18 Total 2094 401 19 Pilot Bewdley 350 83 24 Total with Bewdley 2444 484 20
More important than the actual return rate is the potential for non-response bias, a
small response rate does not necessarily imply a large response bias and a large
response rate will not guarantee a representative sample (Foster Wheeler

Questionnaire Analysis
238
Environmental Corporation and Harris, 2001). In the pilot survey the tendency of
those in the floodplain to respond was slightly higher than those outside the
floodplain. This might imply a slight bias due to salience in the responses but
comparisons within risk groups would not be subject to this bias. While it is never
realistic to completely rule out non-response bias the wave analysis of the pilot survey
in section 7.4 allayed concerns that the respondents would be unrepresentative in
respect of key variables like flood history.
For the full survey, the questionnaire was sent to residents in all EA risk categories and
to areas which had different recent flood histories. The response distribution across
those categories is detailed in Table 9-2. Responses were obtained in all categories and
were relatively evenly distributed across the Environment Agency risk categories also
implying that the bias due to non-response will be minimised.
Table 9-2 : Distribution of responses across flood status categories including Bewdley
EA risk Outside Low Moderate Significant Total Claim? Flooded?
Yes No Yes No Yes No Yes No Yes No
never 0 105 0 98 0 98 0 61 0 362Once 0 2 15 5 14 7 10 4 39 18twice 1 1 2 0 16 3 3 2 22 63-5 0 0 0 1 5 0 0 0 5 16+ 0 0 3 0 4 0 0 3 7 3Total 1 108 20 104 39 108 13 70 73 390
Those at significant or moderate risk of flood number 230, that is approximately half
the properties. It is clear from this table that many of the properties at risk of flooding
had not flooded in the six years prior to the study. Seventy-five percent of those
properties at significant risk of flood had not flooded. Sixty-six percent of those
Questionnaire Analysis
239
moderately at risk and 80 percent of those at low risk reported no flooding. One
quarter of all those which reported flooding had not claimed: the total number of flood
claims reported was 73 whereas the total number reporting flooding was 101.
This distribution of actual flooding is lower than might be anticipated if it is considered
that, during an exceptional event, properties at or above moderate risk are likely to
have flooded. Partly this discrepancy can be explained by the fact that one site was
selected where no recent flooding had occurred despite some property within high risk
categories. There were also properties which reported no flooding because the current
residents were not present during the flood. There still remain 60 properties
representing 26% of those moderately and significantly at risk which did not flood
although the area experienced flooding. This demonstrates that the cautionary
statement from the Environment Agency in stating that their outlines are not designed
to assign risk to individual properties is justified. The EA map simply does not account
adequately for localised ground height or building adaptation. In their comments many
residents stated that their property was built on raised land or was of raised
construction. Some were quite infuriated by the inability of insurers to understand their
special circumstances and had suffered premium increases while others had
successfully explained their flood risk situation and received low premiums.
This finding is significant for the modelling phase of the project because in any
hedonic price model perfect information for all parties is assumed, clearly this
condition would be violated as the best available information, the EA categories, gives
inaccurate information whereas the vendor has better information about flood history
which he or she is not obliged to disclose.
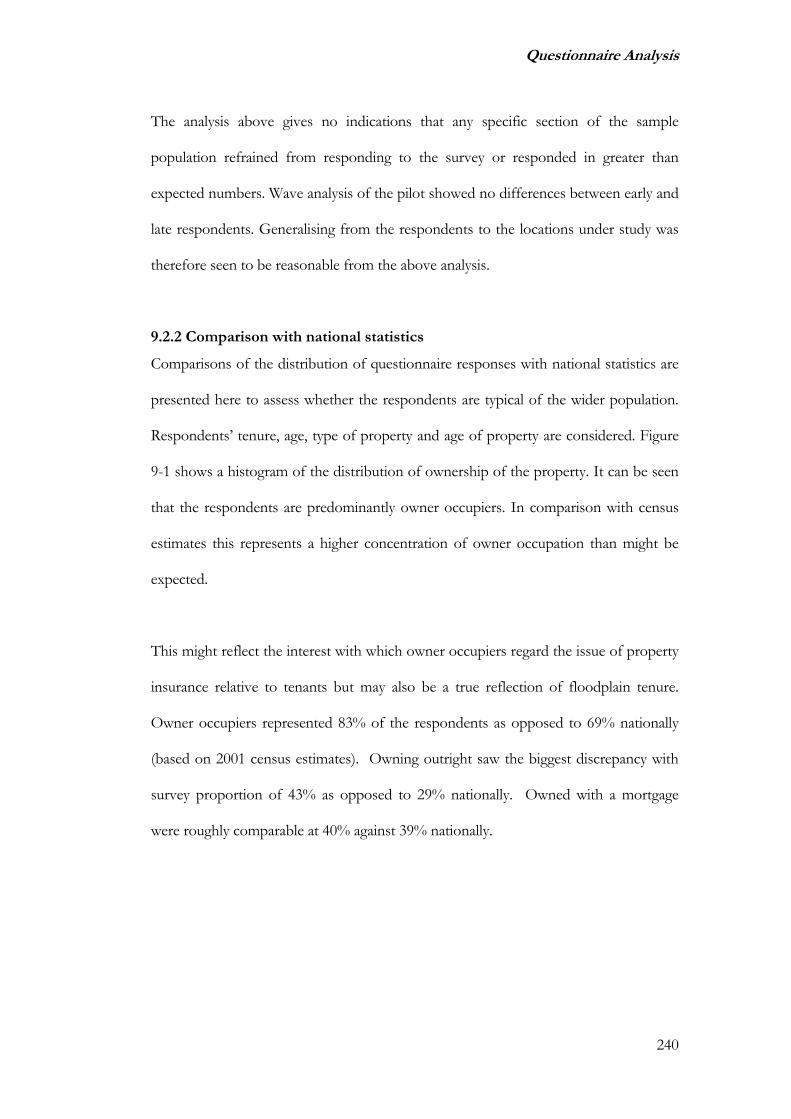
Questionnaire Analysis
240
The analysis above gives no indications that any specific section of the sample
population refrained from responding to the survey or responded in greater than
expected numbers. Wave analysis of the pilot showed no differences between early and
late respondents. Generalising from the respondents to the locations under study was
therefore seen to be reasonable from the above analysis.
9.2.2 Comparison with national statistics
Comparisons of the distribution of questionnaire responses with national statistics are
presented here to assess whether the respondents are typical of the wider population.
Respondents’ tenure, age, type of property and age of property are considered. Figure
9-1 shows a histogram of the distribution of ownership of the property. It can be seen
that the respondents are predominantly owner occupiers. In comparison with census
estimates this represents a higher concentration of owner occupation than might be
expected.
This might reflect the interest with which owner occupiers regard the issue of property
insurance relative to tenants but may also be a true reflection of floodplain tenure.
Owner occupiers represented 83% of the respondents as opposed to 69% nationally
(based on 2001 census estimates). Owning outright saw the biggest discrepancy with
survey proportion of 43% as opposed to 29% nationally. Owned with a mortgage
were roughly comparable at 40% against 39% nationally.

Questionnaire Analysis
241
Who owns the property
otherrented from L.A.
rented from H.A.
rented from private
own outright
own with mortgage
missing
Freq
uenc
y
200
100
0
Figure 9-1 : Distribution of ownership of property
Figure 9-2 shows the age distribution of respondents. The respondents were heavily
weighted towards older people as compared to national populations. For example the
census that estimates 9% of the adult population are 75 or over as opposed to 21% of
this sample. If chief income earner is considered the census estimates that 13% of
households are supported by an individual 75 or older. Concentration of respondents
in the older age categories is a fairly common experience for questionnaire surveys
(Foster Wheeler Environmental Corporation and Harris, 2001).
Age of respondent
75+65-7440-6418-39
Freq
uenc
y
200
100
0
Figure 9-2 : Distribution of age of respondents

Questionnaire Analysis
242
The survey design excluded flats, as discussed in chapter 7, where it was possible to
identify them as such from the address details. This would naturally lead to a lower
proportion of flats compared to the national average in the sample. Figure 9-3 shows
the distribution of respondents by property type. Terraces were the most common
property types represented in the survey responses at just over 40% of the sample.
Table 9-3 shows the comparison of survey respondents with national figures taken
from the English house condition survey 2004. The sample contained a higher
percentage of terraced housing than the national picture. This could reflect the town
centre location of the majority of the sample where higher density housing is more
common. The town centre location could also explain the lack of bungalows, since
bungalows are often very low density housing.
Type of property
det bungalow
semi-det bungalow
detached
semi-detached
terraced
other flat
ground floor flat
missing
Freq
uenc
y
200
100
0
Figure 9-3 : Distribution of property type of survey.

Questionnaire Analysis
243
Table 9-3 : Comparison of survey property type with English house condition survey
Figure 9-4 shows the distribution of age of property within the survey sample. Pre
1920 housing dominates the sample, representing almost half the properties. This may
again be a reflection of town centre location of most of the floodplain properties,;
housing tends to be older in the town centre and get younger as distance to the town
centre increases (Bourne, 1981). When compared to the national picture in Table 9-4 it
appears that property built between 1945 and 1980 is under represented in this sample
compared to national averages. It is not possible to say whether this is a true
representation of the floodplain population.
Age of property
post 19801946-19791920-1945pre 1920
Freq
uenc
y
200
100
0
Figure 9-4 : Distribution of age of property
National Survey Flat 16.9 12.9 Terrace 28.3 40.2 Semi- detached house 16.8 20.2 Detached house 9.6 23.1 Bungalow 16.9 3.7
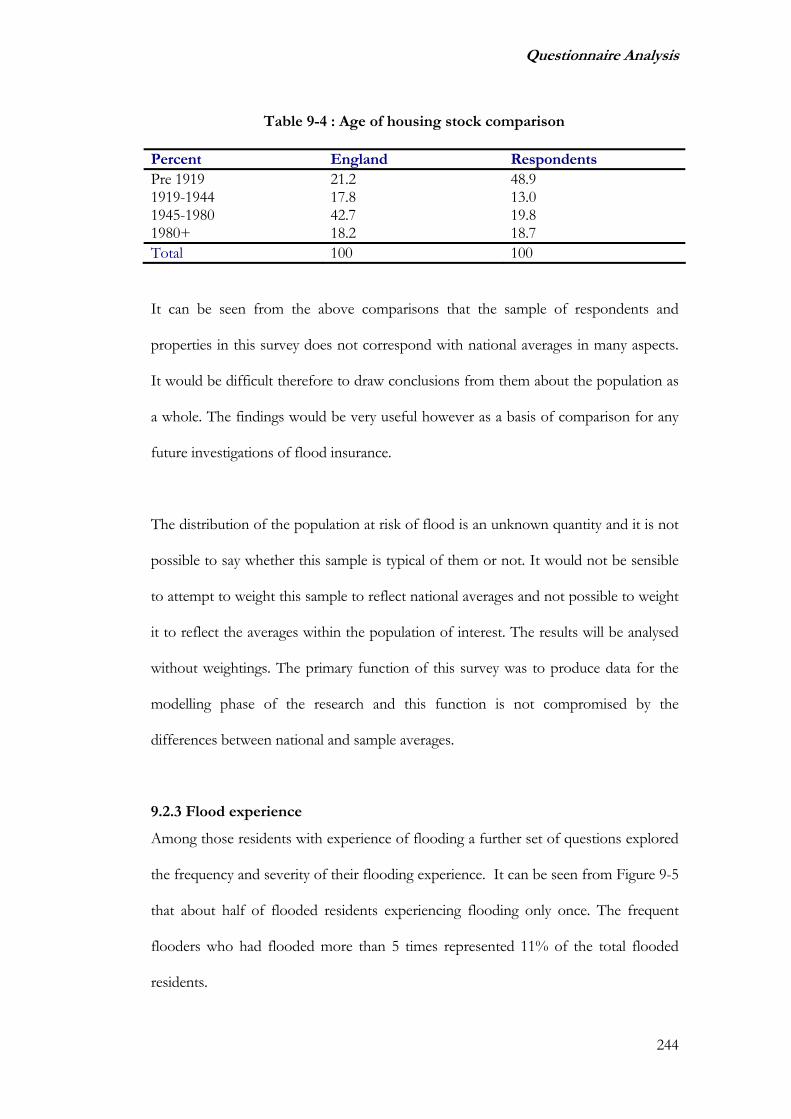
Questionnaire Analysis
244
Table 9-4 : Age of housing stock comparison
Percent England Respondents Pre 1919 21.2 48.9 1919-1944 17.8 13.0 1945-1980 42.7 19.8 1980+ 18.2 18.7 Total 100 100
It can be seen from the above comparisons that the sample of respondents and
properties in this survey does not correspond with national averages in many aspects.
It would be difficult therefore to draw conclusions from them about the population as
a whole. The findings would be very useful however as a basis of comparison for any
future investigations of flood insurance.
The distribution of the population at risk of flood is an unknown quantity and it is not
possible to say whether this sample is typical of them or not. It would not be sensible
to attempt to weight this sample to reflect national averages and not possible to weight
it to reflect the averages within the population of interest. The results will be analysed
without weightings. The primary function of this survey was to produce data for the
modelling phase of the research and this function is not compromised by the
differences between national and sample averages.
9.2.3 Flood experience
Among those residents with experience of flooding a further set of questions explored
the frequency and severity of their flooding experience. It can be seen from Figure 9-5
that about half of flooded residents experiencing flooding only once. The frequent
flooders who had flooded more than 5 times represented 11% of the total flooded
residents.

Questionnaire Analysis
245
Figure 9-5 : Frequency of flooding amongst flooded residents
Figure 9-6 shows the distribution of flood depth amongst flooded residents. The
majority of flooded residents experienced floods of up to one metre above ground
level. The number of residents experiencing very deep flooding was small, fewer than
10 residents.
Depth of flooding
above 2m
1-2mground up to 1m
basement/outbuilding
Cou
nt
70
60
50
40
30
20
10
0
Figure 9-6 : Depth of flooding among flooded residents
Figure 9-7 shows the duration of flooding experienced by respondents. The majority
reported floods which lasted over 24 hours.
OnceTwice
3-5 timesMore than 5 times
0
10
20
30
40
50
coun
t

Questionnaire Analysis
246
Duration of flooding
over 24 hours3-24 hours1-3 hoursless than 1 hour
Cou
nt
80
70
60
50
40
30
20
10
0
Figure 9-7 : Duration of flooding among flooded residents
Figure 9-8 shows the actions taken by residents in advance of flooding. About 3/4 (72
out of 101) flooded residents reported that they had removed belongings to safety.
Less than half of flooded respondents had taken any other actions to prevent damage.
resilient fitting
permanent measures
temporary measures
removed belongings
Cou
nt
80
60
40
20
0
Figure 9-8 : Actions taken in advance of flooding
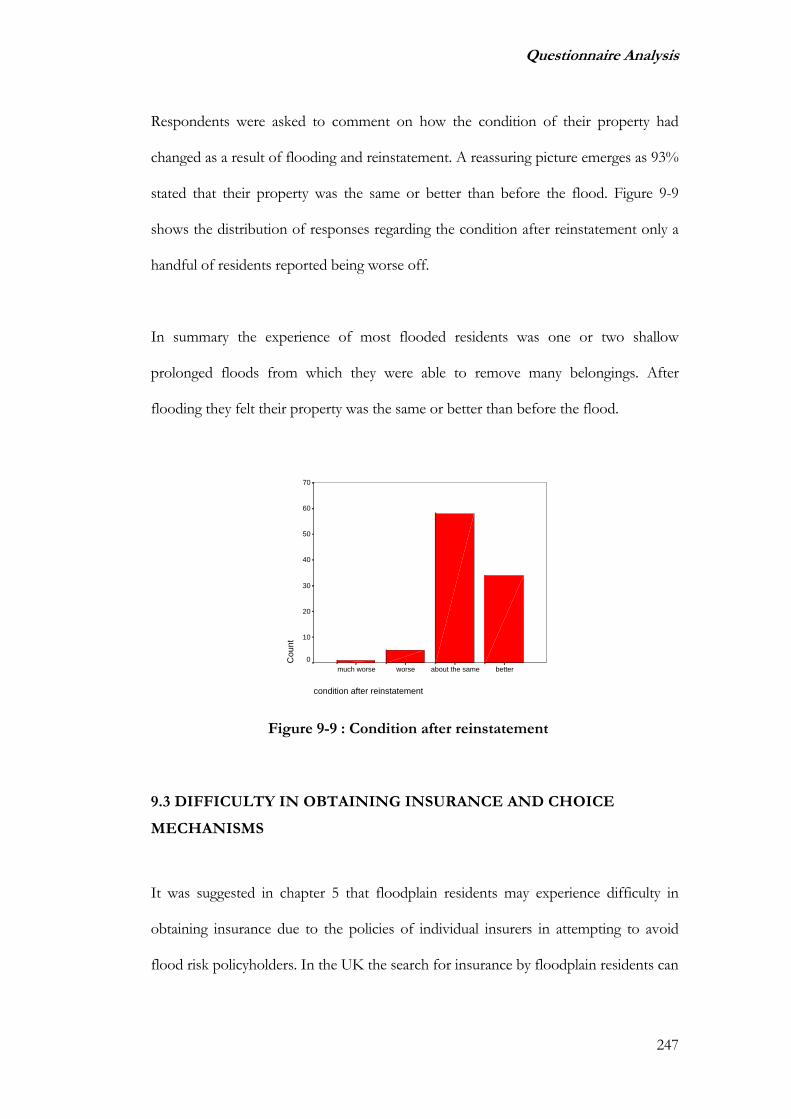
Questionnaire Analysis
247
Respondents were asked to comment on how the condition of their property had
changed as a result of flooding and reinstatement. A reassuring picture emerges as 93%
stated that their property was the same or better than before the flood. Figure 9-9
shows the distribution of responses regarding the condition after reinstatement only a
handful of residents reported being worse off.
In summary the experience of most flooded residents was one or two shallow
prolonged floods from which they were able to remove many belongings. After
flooding they felt their property was the same or better than before the flood.
condition after reinstatement
betterabout the sameworsemuch worse
Cou
nt
70
60
50
40
30
20
10
0
Figure 9-9 : Condition after reinstatement
9.3 DIFFICULTY IN OBTAINING INSURANCE AND CHOICE
MECHANISMS
It was suggested in chapter 5 that floodplain residents may experience difficulty in
obtaining insurance due to the policies of individual insurers in attempting to avoid
flood risk policyholders. In the UK the search for insurance by floodplain residents can

Questionnaire Analysis
248
encompass a large number of private companies as discussed in section 5.3 and a first
refusal does not mean exclusion from insurance elsewhere. Whether or not difficulties
are encountered for prospective property owners will determine whether evidence for
the disclosure hypothesis can be examined.
9.3.1 Difficulties reported on renewal or shopping around
Table 9-5 shows the responses to the question regarding difficulties encountered when
renewing insurance or requesting quotes during the last six years. The most common
reported experience was a significant increase in premiums. Second in frequency was
refusal of a quote due to flood risk. This aspect of flood insurance is one which the
official ABI estimates would not reveal because there is no mechanism to record the
number of refusals of new business. More worryingly 12 respondents reported being
refused renewal due to flood risk, an unexpectedly high number.
The least common experience was to be asked to install flood protection measures in
order to get cover; no respondents reported this. There was only one respondent who
reported being required to install resilient features. This was a property owner whose
residence had flooded more than once and who had also accepted a high premium and
excess on their policy despite their precautions. The evidence from this survey suggests
that insurers are not in general encouraging or compelling their customers to take
mitigating actions. The questions regarding protection and resilience will be excluded
from further breakdowns.

Questionnaire Analysis
249
Table 9-5 : Difficulties experienced by respondents on requesting quotes for insurance
Number of respondents experiencing difficulty (Total number of respondents = 401)
For buildings only
For contents Only
For both buildings and contents
Total experiencing difficulty on one or both policies
A significant increase in premium 9 12 44 65 A significant increase in excess 4 6 16 26 Floods excluded from the policy 2 5 8 15 A significant decrease in premium 1 1 5 7 Refused a quote due to flood risk 7 10 36 53 Refused a renewal due to flood risk
4 1 7 12
Required to provide a letter from the environment agency
4 2 7 13
Required to get a survey of flood risk
1 0 2 3
Had to shop around a lot to get an affordable quote
7 6 22 35
Had to use a broker to get an affordable quote
1 0 5 6
Had to install/buy flood protection measures to get cover
0 0 0 0
Had to install resilient fixtures to get cover
1 0 0 1
Figure 9-10 breaks down the responses by flood designation categories and shows the
percent of each category experiencing the particular problem. Increases in premiums
and excess charges were reported across the board equally irrespective of flood risk.
This suggests that the increases were unrelated to flood risk. The most striking feature
of the data is that one quarter of those residents who lived in property located in an
area at moderate risk of flood reported being refused a quote for insurance due to
flood risk. This was twice as high as the reported refusals from residents located in the
significantly at risk area.

Questionnaire Analysis
250
One possible explanation for this unexpected result could be that the residents at
significant risk have requested fewer quotes. However, refusal of renewal reflects the
expected distribution, being more heavily concentrated in those significantly at risk.
Five percent of significantly at risk residents had been refused renewal.
0
5
10
15
20
25
30
Percent
outside 13.7 6.3 0 5.3 4.2 3.2 0 0 5.3 1.1
low 21 6.7 2.5 0 11.8 2.5 1.6 0.8 11.8 1.6
moderate 19.2 8.1 9 2 25.2 2 9.1 2 12.1 5.2
significant 10.3 6.4 3.9 0 12.8 5.1 2.6 0 5.2 0
premium increase
excess increase
flood excluded
premium decrease
refused quote
refused renew
letter survey shop around
broker
Figure 9-10 : Difficulties experienced when requesting quotes for insurance by flood designation
When the data is partitioned by flood history as shown in Figure 9-11 larger
differences in responses are observed. Having a history of flooding or flood claim was
productive of the most difficulties for residents. Excess increases, exclusion of flood,
quote refusal and refusal of renewal were all more prevalent in previously flooded
homes. Over one third of flooded residents had been refused a quote for insurance.
Five percent were refused renewal. These responses indicate that some insurers are
refusing quotations for flood risk and previously flooded property and some are

Questionnaire Analysis
251
refusing to renew the most at risk. However a majority of residents in the floodplain
had experienced no difficulties even with a history of flooding.
0
5
10
15
20
25
30
35
40
percent
resident not flooded 17.5 5.3 1.6 2.6 4.8 2.6 0 0.5 7.4 2.1not resident 16.5 6 3.8 1.6 13.5 2.3 4.5 0.8 8.3 1.6flooded 13.9 10.1 11.4 0 35.4 5.1 8.9 1.3 12.7 0claimed 16.7 14.8 7.4 0 35.2 3.7 9.3 1.9 11.1 0
premium increase
excess increase
flood excluded
premium decrease
refused quote
refused renew letter survey shop around broker
Figure 9-11 : Difficulties experienced when requesting quotes for insurance by flood history categories
9.3.2 Difficulties for new residents
A particularly interesting category of respondents for the current research programme
is those residents who were not resident during the 2000 flood event but have moved
into floodplain property during the study period. There were 133 of these respondents,
about one third of the sample. In general the sort of difficulties experienced by those
not resident is similar to that of those residents who were resident but did not
experience flooding. The main difference is in refusal of a quote due to flood risk
which is trebled in those who were not resident over those who were resident but not
flooded.

Questionnaire Analysis
252
An open question in the flooding literature for the UK is the extent to which new
purchasers of flood risk properties are aware of the flood status before purchase. This
is because flood risk assessments are not a necessary part of the purchase searches in
the UK. Choosing to pay less for a flood risk property is contingent upon flood
awareness at purchase. Those who now perceived that they lived in a flood risk area
were asked whether they were aware of the risk of flood at property purchase. Figure
9-12 shows that about half of the residents who reported living in a flood risk area
were not fully aware of the flood risk status of their property at purchase.
awareness of risk before purchase
fully awaresomewhat awarenot at all aware
Per
cent
50
40
30
20
10
0
Figure 9-12 : Awareness of flood risk at property purchase
Due to the increase in flooding incidents in recent years it seems likely that people who
purchased recently would have a better knowledge of flood risk than longer term
residents. In fact this is borne out by the Kendal’s Tau correlation (see appendix C)
between awareness of risk at purchase and length of residence which was significant at
1% and of the expected sign.
A further question addressed the issue of insuring new purchases of property in the
floodplain. Those who had recently (in the last six years) purchased their property were

Questionnaire Analysis
253
asked whether they had experienced difficulty in obtaining insurance, 84 of the 133
recent occupants replied to this question. One quarter experienced some difficulty in
obtaining insurance. Table 9-6 displays the responses split by risk category. Over half
of moderately at risk respondents reported some difficulty with obtaining insurance.
Significantly at risk residents reported less difficulty.
Table 9-6 : Difficulty in obtaining insurance for a new residence
Percent of category experiencing -
Outside floodplain
Low risk
Moderate risk
Significant risk
All respondents
No difficulty 75.0 76.9 45.0 84.2 74.0 A little difficulty 21.7 7.7 25.0 10.5 12.0 Quite a lot of difficulty
4.3 15.4 30.0 5.3 14.0
It is clear from this table, however that insurance difficulties will not alert all
prospective floodplain purchasers to flood risk. Just under half of moderately and
significantly at risk residents experienced no difficulty at all. Approximately one in five
respondents had to pay more for their insurance or accept exclusions as summarised in
Table 9-7.
Table 9-7 : Increases in premiums and exclusions accepted by new residents
outside Low Moderate Significant % Don’t know 17.6 20.8 31.6 15.8 20 No 76.5 66.7 47.4 70.6 60 Yes 5.9 12.5 21.1 21.1 20
Whilst this is not a negligible proportion of new residents it does not represent the
scale of problem expected from media reports. If alerted to flood risk by the insurance
process there is little further disincentive to buy in about four out of five cases. In the
majority of cases we would expect no effect from insurance premium increases or

Questionnaire Analysis
254
exclusions because the purchaser is not experiencing increased premiums or exclusions
or does not perceive that they are. Finally when asked when they discovered about
insurance problems only 15 responded. The majority had discovered the insurance
problems during the purchase process. Six had discovered before the offer stage, seven
after offer but before completion and two after completion.
9.3.3 Choice of company
Figure 9-13 shows the distribution of policyholders by company. The larger insurers
(for example Norwich Union, Prudential and Direct Line) are under-represented in the
flood risk cohort relative to the not at risk cohort.
company for buildings insurance
zurichsaga
RIASpruother
Norwich Union
lloydsliverpool victoria
halifax
direct line
CISbudget
Per
cent
of p
olic
ies
50
40
30
20
10
0
EA risk
outside
low/mod/sig
Figure 9-13 : Spread of policyholders by company
There are some companies which are only insuring flood risk residents (CIS and
Liverpool Victoria) in this sample or who have higher representation than in non-flood
risk (Lloyds TSB). This reflects the wider search strategy needed by flood risk
policyholders.

Questionnaire Analysis
255
9.3.4 Selection mechanism
Examination of way in which policyholders selected their insurance reveals differences
between flood risk and non flood risk residents. The choice mechanisms are
summarised in Figure 9-14. The most popular choice mechanism amongst flood risk
residents was to stay with their mortgage lender (22% as opposed to 11% for those not
at risk).
0% 20% 40% 60% 80% 100%
Outside
inside
Total
% o
f res
pond
ents
My insurance was set up by my mortgage lender I used a brokerI phoned a few companies I looked on the internetI used the phone and internet It was recommended by a friend/family/neighbourIt was recommended by an adviser/bank manager I chose a company I trustThe previous owners recommended their insurer Due to flood risk I took over the existing policy on the propertyMy property is insured in a block policy
Figure 9-14 : Comparison of primary choice mechanism floodplain and non floodplain residents
For those outside the floodplain the most popular option was to phone around (25%
compared to 15% of at risk residents). Perhaps there are 10% of would be switchers
who are stuck with their insurer due to flood risk. Phone and internet searching was
the primary choice mechanism for 45% of residents outside the floodplain but only
30% of floodplain residents. There were some categories of choice mechanism only
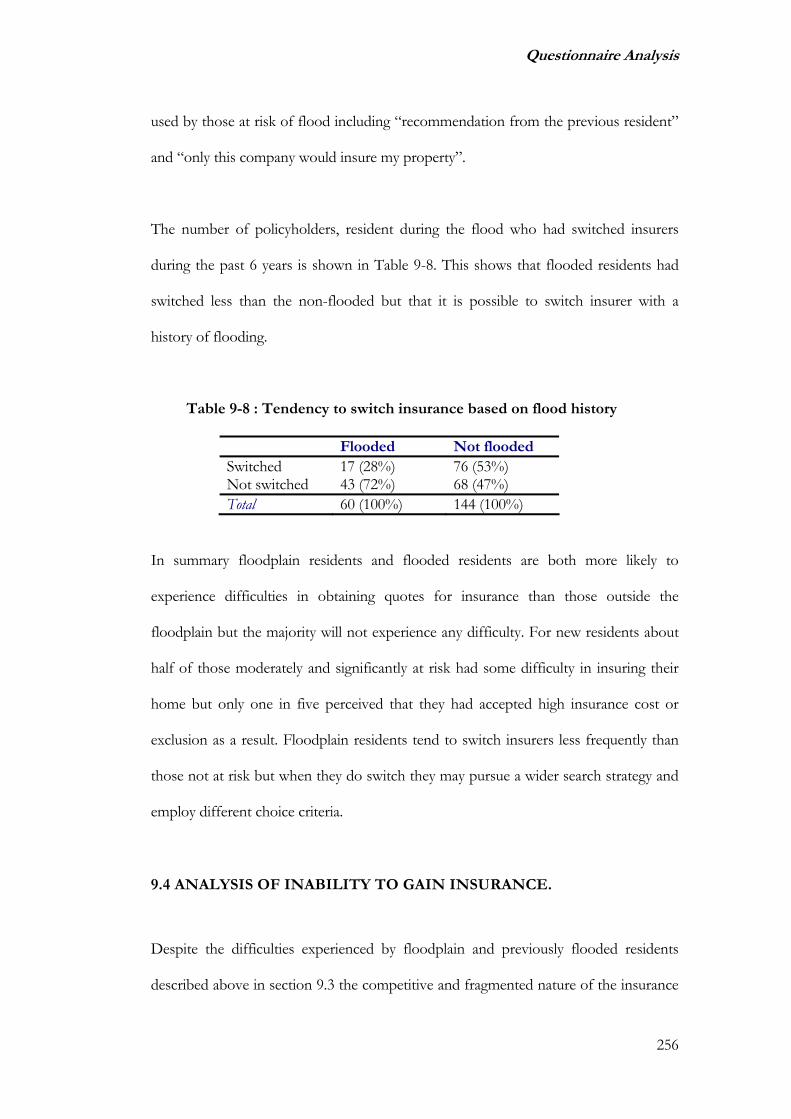
Questionnaire Analysis
256
used by those at risk of flood including “recommendation from the previous resident”
and “only this company would insure my property”.
The number of policyholders, resident during the flood who had switched insurers
during the past 6 years is shown in Table 9-8. This shows that flooded residents had
switched less than the non-flooded but that it is possible to switch insurer with a
history of flooding.
Table 9-8 : Tendency to switch insurance based on flood history
Flooded Not flooded Switched 17 (28%) 76 (53%) Not switched 43 (72%) 68 (47%) Total 60 (100%) 144 (100%)
In summary floodplain residents and flooded residents are both more likely to
experience difficulties in obtaining quotes for insurance than those outside the
floodplain but the majority will not experience any difficulty. For new residents about
half of those moderately and significantly at risk had some difficulty in insuring their
home but only one in five perceived that they had accepted high insurance cost or
exclusion as a result. Floodplain residents tend to switch insurers less frequently than
those not at risk but when they do switch they may pursue a wider search strategy and
employ different choice criteria.
9.4 ANALYSIS OF INABILITY TO GAIN INSURANCE.
Despite the difficulties experienced by floodplain and previously flooded residents
described above in section 9.3 the competitive and fragmented nature of the insurance

Questionnaire Analysis
257
market in the UK allowed most to overcome the difficulties. The eventual outcome of
the search for insurance is covered in this and the following section in terms of
availability and then cost.
9.4.1 Respondents without insurance
Only seven percent of the survey respondents reported having no property insurance,
93% had either buildings insurance, contents insurance or both. This compares
favourably with Gaschen et al (1998) estimates for the Swiss Reinsurance company
that 95% of households have buildings insurance. Only one respondent reported being
unable to obtain buildings insurance due to flood risk. Three respondents reported
being unable to obtain contents insurance due to flood risk. This is a reassuring picture
and reflects the perception of the ABI (2005c) that their members are not refusing to
insure flood risk residents in large numbers.
9.4.2 Exclusion of flood risk
Although very few residents had failed to obtain property insurance, for some flood
risk residents their cover may be compromised by the exclusion of flood risk or by the
imposition of high excess charges. Inclusion of flood risk in the standard domestic
policy is the default position for the UK as described above in chapter 5. However
anecdotal evidence had suggested that some flooded or flood risk property owners had
accepted flood exclusion or high flood excess in order to gain cover for other risks
such as fire and theft. Clearly for a flood risk respondent exclusions and excess charges
may severely compromise their ability to reinstate a flooded property. In addition and
most relevant for the current investigation, for the purposes of property purchase this
exclusion or excess may be regarded by lenders as capital at risk.

Questionnaire Analysis
258
Surprisingly 80 respondents (20%) did not know whether their insurance covered flood
risk, 26 of these were at moderate or above risk of flooding. This is worrying in that
these residents do not seem to be concerned about flooding risk, but it is fair to
assume that if they have not been told that flooding is excluded from the policy then it
will almost certainly be included since inclusion is the default position in the UK.
Exclusion of flooding from their policy was suffered by 24 respondents (6%). Of these
respondents, six had previously flooded and a further nine were at moderate or above
risk of flooding. It is not possible to determine from the survey whether these
respondents had any choice in accepting the exclusion which may have been an option
taken to reduce insurance cost.
Excess charges are another way in which cover can be compromised. Excess over
£2,500 may be regarded as capital at risk by mortgage lenders (Clark et al., 2002). In
this survey four policyholders (1%) had to accept excess of £2,500 or above. As with
flood exclusion this may have been an option.
In summary, 18 respondents were at moderate or above risk of flooding and had no
cover for flood risk. This is 5% of the total sample and 10% of those at moderate or
above risk of flooding. The majority of these were covered for other risks. This is a
cause for concern for those property owners but reassuring that the proportion of at-
risk residents who can get insured for flood risk is so high.

Questionnaire Analysis
259
9.5 COST OF INSURANCE WITHIN THE FLOODPLAIN
For the analysis of insurance costs a subset of respondents was selected. Respondents
who held both buildings and contents insurance, for whom flooding was included in
the policy and who had provided their insurance cost details were included. This
provided a sample of 198 questionnaires. Insurance rate was calculated for each
property as described in section 7.6. The median rate of insurance by category is
presented in Table 9-9. The differences between categories are very small, in general
statistically insignificant, and do not reflect the doubling suggested by other sources
(Crichton, 2005).
Table 9-9 : Median insurance rate by EA risk category (£per £000 insured)
Median Total Resident Not resident
Flooded Resident not flooded
Outside 2.2 2.5 1.9 Na 2.5 Low 2.6 2.5 2.6 3.2 2.4 Moderate 2.5 2.4 3.7 2.5 2.3 Significant 2.5 2.3 2.3 2.4 2.3 Total 2.5 2.5 2.5 2.5 2.4 Kruskal Wallis
0.101 0.451 0.006** 0.557 0.353
It appears that the variability of premium paid increases with flood risk reflecting the
fact that some residents are experiencing difficulty in obtaining insurance and some are
not. However for those not resident during the 2000 flood event there appears to be
an effect of risk category on premiums paid. Further investigation reveals that the
difference is greatest between outside and inside the flood risk map. The distinction
between low, moderate and significant risk is not significant. The median difference
between outside the floodplain and inside for respondents not resident during the
Questionnaire Analysis
260
flood is 0.8, an extra 40% on top of average premium of 1.9 but the variation between
policyholders is wide. Remember also that this group did not perceive that they were
paying more on the whole as demonstrated in Table 9-7.
When flood history is examined no significant differences are observed between the
rates paid by the previously flooded and flood free.
In summary then the average premium paid by those who are able to obtain insurance
is not determined by the risk of flood or the flood history. For new residents there is
an effect of EA risk category but, on average, it is less than double the premium paid
by those outside the floodplain.
9.6 PERCEPTION OF RISK AND MITIGATION UNDERTAKEN BY
HOMEOWNERS
One further aspect of flood risk is the perception of the homeowners themselves. In
sites where flooding occurred during 2000 the residents may have a better idea about
the likelihood of flooding in a similar event than the Environment Agency. A
comparison of stated flood risk versus EA category shows that about a quarter of
respondents outside the floodplain considered themselves to be living in a flood risk
area while a third of those living in the significant category did not consider themselves
at risk of flood.
Table 9-10 shows the Kendalls tau_b correlations between flood risk categories for all
repondents. The variables are significantly correlated but the level of correlation is not

Questionnaire Analysis
261
uniformly high. In particular the correlation between EA risk category and perceived
flood risk is only 0.3 suggesting that there is a large element of disagreement between
the residents’ perceived risk and the EA estimated risk. This is pertinent to the current
thesis because as discussed in section 5.5.1 the gulf in risk perception between official
estimates and residents will result in lower willingness to pay to evacuate the
floodplain.
Table 9-10 : Correlation between flood risk status variables
Resident During flood
Flooded Claimed Perceived in flood area
EA risk category
Resflood 1 0.239** 0.239** 0.003 -0.030 Flooded 1 0.734** 0.335** 0.207** Claimed 1 0.239** 0.138** Perceived 1 0.301** EA risk 1
This may have serious implications for the modelling work which will use EA
estimates of risk to categorise properties. However, as discussed in chapter 6,
prospective purchasers will not always have access to the vendor’s assessment of flood
risk and may in any case lend far more weight to official estimates.
Respondents were asked what measures they had taken to mitigate against flood
damage. The responses for those who perceived a risk are summarised in Figure 9-15.
Just over half had registered for flood warnings and less than 10% had taken any of the
other measures namely purchasing temporary barriers, installing permanent barriers or
installing resilient fixtures and fittings.

Questionnaire Analysis
262
If previously flooded residents are considered the percentage registering for warnings
increases to 73% and 20% have taken other measures. Experience of flooding appears
to have given some residents the motivation to take action but these actions are largely
those which are cost neutral or can be deployed once a flood is imminent.
0.0
10.0
20.0
30.0
40.0
50.0
60.0
70.0
80.0
%
flooded 73.4 73.4 30.4 3.8 3.8 12.7 5.1 8.9perceived at risk 52.7 29.9 12.9 1.8 1.8 3.6 1.8 2.2
registered for flood warnings
removed belongings
deployed sandbags/ doorboards
purchased temporary measures
resilient fixtures and fittings pre
flood
resilient fixtures and fittings post
flood
installed permanent measures pre flood
installed permanent measures post flood
Figure 9-15 : Mitigation measures taken by residents perceiving a flood risk
These findings suggest that the complacency reported in previous studies of at risk
populations (Clark et al., 2002, Grothmann and Reusswig, 2006) is repeated in this
sample of respondents. Experience of a flood in their area improves awareness of risk
but only among those whose property actually flooded. The implication of this
complacency in terms of anticipating low potential property value impacts has been
well rehearsed above.
Questionnaire Analysis
263
9.7 CATEGORISATION OF INSURED
The results of the Kruskal Wallis tests show that insurance premium paid is not in
general correlated to EA flood risk status. For the crucial group of new residents there
is a relationship between insurance premium and EA risk category. However the
correlation is reasonably low at 0.3 and therefore as outlined in section 6.8, it may be
possible to test the two factors separately.
The aim of categorising the insured into premium bands based on their insurance rate
is to form a factor in the block design phase of the price modelling described in section
10.4. In the conceptual description in section 6.8 two levels of insurance cost were
envisaged. However, in the light of the analysis of perceived problems above it would
appear that a categorisation of insurance problems can be constructed which
incorporates more of the difficulties experienced by floodplain purchasers than simply
increased insurance cost.
Three categories can be used – normal insurance, high premium and compromised
insurance. Insurance is said to be compromised if a resident is uninsured for flood or
has accepted an excess charge of above £2,500. The choice of cut off point for the
category of high premium will be based on the upper limit of the inter-quartile ranges
for the respondents outside the floodplain. This leads to a definition of high premium
rate of 3.05 or above. Sixty nine respondents (30%) fall into this category. All other
insured will be placed in the normal category.

Questionnaire Analysis
264
9.8 SUMMARY
Analysis of the questionnaire survey data was necessary in this research because the
availability and cost of insurance for floodplain residents has not been studied
previously in the UK. Studies of the impact of flooding on house prices have identified
insurance cost and availability as an important issue in determining the size of discount.
Understanding the difficulties encountered by floodplain residents is important in
determining the way in which insurance can be incorporated into the price model.
Chapter 5 discussed the available evidence about the cost of insurance to homeowners
in detail. The main conclusion was that the competitive nature of the UK home
insurance market (into which flood insurance is subsumed) made it impossible to
predict with any precision a priori the insurance rate paid by individuals from their
property details. The output from the questionnaire survey largely backs up this
conclusion especially with regard to flood risk, neighbouring properties of similar type
can experience very different treatment by their insurers and will also take different
steps in their search for affordable cover.
For the studied flood risk locations it appears that for most residents full insurance is
available. For a minority of residents the problems in obtaining insurance have proved
insurmountable. It is not possible to say whether or not these respondents could gain
insurance but near neighbours have done so.
On average the floodplain resident faces more difficulties in obtaining insurance. They
are more likely to experience a range of problems when looking for a policy, and

Questionnaire Analysis
265
perhaps in consequence they are more likely to remain with their mortgage lender.
However the majority of floodplain residents reported no difficulties at all.
The premium paid by residents who obtained full insurance showed no relationship
with EA flood risk category except for new residents. Some new residents of property
at risk, a minority, perceived they were paying more for cover and this was confirmed
by examining their average insurance rate. However the increase in rate was only 40%
on average. Extreme excess charges were experienced by very few respondents but
these were exclusively in flood risk areas.
Recently flooded residents faced more difficulties in obtaining insurance than those
who had not flooded and also more than those who were at risk but not flooded. It is
still the case however that more than half reported no difficulties with gaining cover.
There was no relationship between flood history and average premium paid.
The analysis resulted in a three stage definition of insurance categories for the price
model: Compromised insurance; high premium insurance; and normal insurance.
These categorisations will be used in the construction of the insurance model, which is
the third combined model described in the following chapter.

Model Estimation
266
Chapter 10 : MODEL ESTIMATION
10.1 INTRODUCTION
Chapters 8 and 9 above have provided detailed analyses of the data collected in order
to build a combined model of the price impact of flooding across multiple flood sites
in the UK. These analyses have provided some insight into the state of the flood
insurance market in the UK and the variation in property price impacts. The primary
purpose of these analyses however was to generate local price indices for discounting
the repeat sales of floodplain property and to derive a categorisation of insurance costs
appropriate to include in the insurance model.
For the individual locations very few significant value impacts could be measured.
Partly this was due to small sample sizes but the dilution of flood risk categories were
also shown to have a bearing in some cases. The research design described in chapter 7
had anticipated this issue and the combined model described in this chapter is the
proposed solution in that it combines the data, in the expectation that this will allow
for increased statistical power.
10.2 COMBINED SITE REPEAT SALES MODEL
Data were generated from the individual repeat sales analyses by discounting the
growth figures by the local price index calculated from the property outside the
floodplain as described in section 6.5. The data from the 13 sites were combined into a
global database and the annual discounted growth rates calculated. Repeat sales pairs

Model Estimation
267
were limited to those which had a first sale before the flood and the average
discounted rates were calculated. The date of the second sale being used as the
summary year as described in section 6.5.
10.2.1 Impacts in all flood locations
When all categories of flood site were combined and flood designation is considered to
be whether inside or outside the 1000 year floodplain there was no discernable impact
of flood designation on the discounted growth in price. This is an important finding
because it suggests that designation alone had no impact on the growth in price of
floodplain property. When it is considered that several factors may have increased the
importance of flood designation in the mind of the floodplain population over the
analysis period this finding is suggestive of the conclusion that flood designation alone
has no impact on property value growth.
10.2.2 Impacts in flooded locations
Control sites, those which had not flooded in the year 2000, were then removed and
the analysis repeated for those sites which had flooded in 2000. The results are shown
in Table 10-1. It is clear that the averages are close to and not significantly different
from zero. There is no negative effect of flood designation on growth in property price
even in those areas which suffered a flood event. A Kruskal-Wallis rank test (see
appendix G) confirms this assessment.

Model Estimation
268
Table 10-1 : Mean discounted growth rate for properties inside and outside the extreme flood outline
However if instead of the fz1000 outline, the Environment Agency risk categories are
used then those significantly at risk of flood emerge as of lower rank as shown in Table
10-2. This weak result, which is significant at the 10% level, shows that there is a
tendency for the price of properties within the significantly at risk category and in
locations which flooded in the year 2000 to grow at less than the average rate. Those
moderately at risk, at low risk and outside the floodplain appear to grow at comparable
rates.
Table 10-2 : Mean rank of growth rates by flood designation category
EA Category Number of Sales Pairs Mean Rank Outside Floodplain 963 656 Low Risk 239 670 Moderate Risk 41 632 Significant Risk 60 535 Kruskal-Wallis Test 0.087
10.2.3 Effect of flood frequency
The sites were further subdivided into those which had flooded once and those
flooded ‘frequently’ defined as subject to more than one flood in the period 1998-2006.
Fz1000 Non fz1000
2001 (n)
0.10 (47)
0.07 (120)
2002 (n)
-0.01 (70)
0.04 (197)
2003 (n)
-0.01 (62)
-0.01 (187)
2004 (n)
0.04 (68)
0.00 (167)
2005 (n)
-0.04 (52)
-0.04 (158)
2006 (n)
0.00 (40)
-0.01 (135)

Model Estimation
269
The category of flood risk was subdivided into low moderate and significant. This
disaggregation further confirmed the tendency within significantly at risk properties in
areas which were subject to flooding in 2000 to grow more slowly.
For those which were flooded once only the tendency to slow growth was very limited
as shown in Figure 10-1 peaking in 2003 for significantly at risk properties. This is not
perhaps surprising given the analysis of individual sites where some displayed no
impact at all. An interesting anomaly in the averages is the tendency for 2001 sales to
have a positive discounted growth. This could be due to the impact of short holds –
properties must have been bought in 2000 and resold in 2001 to feature in this average.
A positive tendency might reflect the impact of entrepreneurs improving property for
profit.
-0.4
-0.3
-0.2
-0.1
0
0.1
0.2
0.3
2001 2002 2003 2004 2005 2006lmodoutsig
Figure 10-1 : Discounted growth rate, flooded locations, by designated risk category
Within locations which flooded more than once stronger trends were observed. The
average discounted growth is shown in Figure 10-2. For significantly at risk properties
the average discounted growth is consistently negative. This implies that significantly at

Model Estimation
270
risk properties in flood locations which flooded frequently grew at less than the
average rate after suffering flooding in 2000. For those moderately at risk the effects
are smaller and in 2006 a positive impact is seen.
Whilst these averages are not significantly different from zero, they are consistently
negative and of greater magnitude than the property outside the floodplain. Having
noted the effects it has to be reiterated that even for the most at risk properties in the
areas with the most frequent flood history these are small scale impacts averaging only
9%. It is also worth noting that these are changes in growth rate. In fact, on average,
property within the floodplain continues to grow in price throughout the period but
grew at a slightly reduced rate. Also of note is the fact that the largest impact was
observed in the year 2005. This date corresponds with the year following a minor flood
in 2004, the re-launch of the Environment Agency maps and coincided with the year
of the massive flooding in Carlisle. However care should be exercised when
interpreting the results based on only 20 examples.
-0.25
-0.2
-0.15
-0.1
-0.05
0
0.05
0.1
2001 2002 2003 2004 2005 2006 lowmodoutsig
Figure 10-2 : Discounted growth rate, frequently flooded locations, by designated risk category

Model Estimation
271
The conclusion suggested by this analysis is that the impact of flood risk designation
on the growth in residential property price is small even in the aftermath of actual
flood events and non-existent in the absence of flood events. The greater the number
of recent events and the more significant the designated risk the higher the effect.
10.2.4 Impact of flood history
Further analysis of the most frequently flooded locations, Shrewsbury, Malton and
Norton and Bewdley, was made possible by use of extra information about flood
history. In the foregoing analysis frequency of flood was taken for the floodplain as a
whole and, as discussed in chapter 6, property by property flood history was not
available. More detailed flood history information was available for the three frequently
flooded via the questionnaire survey but also via extra information provided by the
Environment Agency for these three locations. A flood history variable was therefore
constructed for individual properties based on a judgement, nearest neighbour
approach. A property was defined as flooding never, once twice or more than twice.
The results of the resulting analysis are in line with expected patterns as shown in
Figure 10-3. The properties flooded most frequently display lower discounted growth
rates in the immediate aftermath of the 2000 event. The impacts are seen to decline
with time.
The maximum average impact is for those properties flooded more than three times, a
discount of 30% in the year following the 2000 event. For some properties this
represented a reduction in absolute price mainly for properties in Severnside South in

Model Estimation
272
Bewdley which sold in 2000 and again in 2001. It is possible that these properties were
sold in a compromised condition.
-0.35
-0.3
-0.25
-0.2
-0.15
-0.1
-0.05
0
0.05
0.1
2001 2002 2003 2004 2005 2006
0123+
Figure 10-3 : Discounted growth rate, frequently flooded locations, by flood history
The maximum average impact is for those properties flooded more than three times, a
discount of 35% in the year following the 2000 event. For some properties this
represented a reduction in absolute price mainly for properties in Severnside South in
Bewdley which sold in 2000 and again in 2001. It is possible that these properties were
sold in a compromised condition.
All the repeat sales models point to the same conclusion. There is a small effect of
flood for the most significantly at risk properties in areas which have suffered a recent
inundation and it is worst for those frequently inundated. This suggests that house
purchasers are behaving in an entirely reactive manner and evaluating risks based on
recent experience rather than scientifically calculated probabilities. The absence of any

Model Estimation
273
measured impact in towns which have not suffered recent flooding reinforces this
view.
10.2.5 Impact of change in designation maps
A final comparison was made between flood designation categories. This analysis was
carried out for properties which sold before and after the 2004 relaunch of the flood
maps. Using the same technique of temporal analysis as for the 2000 event no impact
was measurable.
A further conclusion from this modelling work is that the accuracy of the identification
of the flood history of properties could make a large difference to the model estimates.
If purchasers are more concerned with history than with designation (as the
questionnaire survey output also suggests) then use of risk category information will
not yield results appropriate for those properties which have been flooded. A detailed
analysis of significantly at risk properties in flooded areas is more appropriate.
Obtaining detailed flood history information would be a necessary condition of such
an analysis.
10.3 TRUNCATED HEDONIC MODEL INCLUDING INSURANCE
From the responses to the questionnaires it was possible to determine which
properties had changed hands during the previous six years. The price and date at
which these properties changed hands could then be extracted from the transaction
database. This resulted in 141 data records, some properties having sold more than
once. The distribution of these properties across sites is shown in Table 10-3. Property

Model Estimation
274
details were taken from the questionnaire including type of property, number of
bedrooms and purchase condition. A hedonic model was then constructed for these
records.
Table 10-3 : Distribution of property sales across locations
The nomal p-plot of price and natural log of price (lnprice) are shown in appendix E
and lnprice is seen to conform more readily to the normality. The descriptives in
appendix E show that taking the logarithm reduces the tendency to skewness and is
also consistent with the foregoing repeat sales model.
A stepwise regression procedure (executed in SPSS) was employed as an aid in
selecting relevant variables, the candidate variables are described in Table 10-4. In the
end all year variables were forced into the model for completeness. Correlations
between the focus variables are discussed below. Correlations between other included
raw variables (shown in appendix E) were negligible apart from a tendency for four
bedroom detached houses to be concentrated in West Bridgford. However these
correlations were below 0.5 and so were not felt to prevent model construction. Table
10-5 shows the final selected model with an adjusted r-squared of 83%.
Bewdley 24 Portsmouth 29 West Bridgford 18 Shrewsbury 43 Malton and Norton 27 Total 141

Model Estimation
275
Table 10-4 : Candidate variables for the hedonic regression model
Possible values Reference value
No of responses
Type of property
Ground floor flat, flat not on ground flood, terrace, semi, detach, semi det bungalow, detached bungalow
terraced 141
Age of property
Pre 1914, 1915-1945, 1945-1980, 1980+ 1915-1945 139
Number of bedrooms
1,2,3,4+ 2 beds 137
Number of storeys
1,2,3,4+ 2 storeys 139
Newbuild Y/N N 141 Leasehold Y/N N 141 Owner occ y/n Y 141 Perceived at risk
Y/N n 131
EA category
O,L,M,S O 141
Aware at purchase
Not at all aware, somewhat aware, fully aware Not at all aware
94
Assumed flooded
0,1,2,3-5, 6+ 0 141
Purchase condition
Just flooded, needs modernising, about average, excellent recently renovated
About average
121
Insurance class
1,2,3 1 141
Insurance problems at purchase
None, a little, a lot None 115
Has to pay more or accept excess
No, yes don’t know No/don’t know
106
When discovered
Before offer, after offer before completion, after completion
Before offer and Before completion
24
Year of sale 2000,2001,2002,2003,2004,2005,2006 2000 141 Study site Southsea, Bewdley, Shrewsbury, Malton and
Norton, West Bridgford, Shrewsbury 141
Owner occupied
Yes, no Yes 141
constant

Model Estimation
276
Table 10-5 : Truncated hedonic model
Flooded respondents
Respondents not flooded
All respondents
All respondents with flood status variables
N 44 97 141 139 Adj r2 0.70 0.86 0.83 0.84 Constant 10.935** 11.083** 11.016** 11.030** Detached 0.506* 0.504** 0.436** 0.399** Semi Bungalow Na 0.282 0.343 0.319 Det Bungalow -0.06 0.604** 0.515** 0.378* 1 bed -0.153 -0.382** -0.287** -0.330** 3 bed 0.329* 0.05 0.149* 0.172** 4 bed 0.575** 0.590** 0.624** 0.611** Propage 4 0.244 0.009 0.158* 0.144* Propage 1 0.175 0.203** 0.163** 0.143* Cond 4 0.100 0.114 0.118* 0.092 Y2001 -0.322 -0.067 -0.062 -0.001 Y2002 0.193 0.237* 0.271** 0.252** Y2003 0.600** 0.485** 0.507** 0.508** Y2004 0.595* 0.593** 0.655** 0.689** Y2005 0.648** 0.590** 0.651** 0.658** Y2006 0.735** 0.659** 0.715** 0.720** Southsea 0.352* 0.141 0.188** 0.178* Malton -0.219 -0.200* -0.272** -0.210** West Bridgford n/a 0.258** 0.315** 0.397** Insurance class 3 0.167* Insurance class 2 -0.049 Designated sig -0.108 Designated mod -0.078 Assumed flooded 0.089 Assumed flooded and sold in 2001
-0.182
Dependent variable ln price
* sig at 5% ** sig at 1%
Chow test statistic 0.94 not sig at 10%
All the variables included bear signs that are readily interpretable. The inflation in
house value over the study period is very marked as observed in the earlier sections.
Number of bedrooms is acting as a proxy for property size. The regional distribution is
roughly as expected with Malton and Norton having lower average property prices and
Portsmouth having higher ones than the Shrewsbury/Bewdley average. West

Model Estimation
277
Bridgford house prices are the highest of all – this reflects the fact that West Bridgford
is a prestige suburb of Nottingham.
In line with findings of the repeat sales analysis that without history of flooding
designation is not an important predictor of price the data set was split between
previously flooded and not flooded property. Three models were estimated: flooded,
not flooded and total these are shown in Table 10-5. There is no significant difference
between the models according to the Chow test also shown in the table. The
coefficients which display large changes are the 2001 growth, detached bungalows and
the condition variables. The 2001 coefficient could be due to the effect of flood
impacting in 2001, therefore a flooded and sold in 2001 interaction term was
introduced to the flood status model. Bungalows could change due to lack of data in
the flooded cohort or to the fact that retirement markets are more sensitive to
flooding.
There are relatively few significant variables included in the model and the relative
importance of the year and site dummies indicates that small errors in their estimation
might have large knock on effects for detecting smaller impacts due to other locational
factors. Bearing that caution in mind the next stage was to attempt to incorporate
flood status variables into the model.
The final model shown in Table 10-5 included the flood status variables. Flood status
variables were constructed as follows: Designated risk category was extracted from the
EA website as described in section 7.7.2; flood insurance class was taken from the
questionnaire responses as described in section 9.6; flood history took the value 0/1

Model Estimation
278
dependent upon whether the property was judged to have flooded in 2000 as described
below.
Judgement about flood history was made based on the response given on the
questionnaire where there was knowledge of past history. Where this was not available
assumptions had to be employed. First it was assumed that properties outside the
floodplain and flats not on the ground floor did not flood. Finally nearest neighbour
giving evidence was used. If a property was in the designated flood area and the nearest
(postcode and address details were referenced on detailed maps) neighbour reported
flooding then a property was assumed to have flooded the same number of times.
The table of correlations shown in Table 10-6 demonstrates the fact that the vectors of
flood status are not strongly correlated. It is particularly noteworthy that the correlation
between significant designation and other variables is so low.
Table 10-6 : Kendal’s Tau Correlations between the vectors of flood status
Floodass EA cat mod
EA cat sig Ins3 Ins2
Floodass 1 0.302** 0.074 0.193* 0.220* EA cat mod 1 -0.315** 0.195* 0.229** EA cat sig 1 0.095 -0.108 Ins3 1 -0.194* Ins2 1
Including any of the vectors of flood risk into this model had a very marginal effect
upon the explanatory power of the model. Insurance class is the only one to have
significant coefficient but the sign of the impact is counter intuitive as shown in Table

Model Estimation
279
10-5. Designated risk category has the largest absolute value impact but is not
significant at the 5% level.
From this truncated hedonic model therefore we can conclude that there is no strong
evidence to suggest an impact of flood designation, flood history or insurance class on
the value of property in the studied locations.
10.4 ANALYSIS OF VARIANCE INCLUDING INSURANCE
As an alternative to the regression model described above an analysis of variance
approach was also taken. Five dimensions were considered: flood designation, flood
history, flood insurance class, location and year of sale. In order to adjust for size of
property the independent variable chosen was cost per bedroom. Table 10-7 shows the
distribution of properties by the three vectors of flood status.
Table 10-7 : Distribution of sold properties across flood status categories
Significant Moderate Low Outside tot Flooded Flooded Flooded Flooded Yes No Yes No Yes No Yes No
Ins class 1 6 15 5 11 9 25 0 23 94 Ins class 2 3 1 10 4 3 6 0 5 32 Ins class 3 3 2 6 3 0 2 0 0 16 Tot 12 18 21 18 12 33 0 28 142
This is clearly an incomplete and unbalanced block design and so a robust analysis
such as median polish was most appropriate. Information was lacking on the impact
of flooding on properties outside the designated floodplain. Compromised insurance
was largely limited to those at moderate or significant risk of flooding.

Model Estimation
280
Median polish was carried out by subtracting level medians from the cost per bedroom
for each of the five dimensions in turn. The total sum of squares falls quickly but then
oscillates, as do the factor effects, indicating some interaction between the factors and
reducing the confidence that factor effects are estimated precisely. Three iterations of
the five dimensions were sufficient to achieve convergence, which was judged by the
reduction in residual sum of squares see appendix H. The resulting model is
summarised below in Table 10-8.
Table 10-8 : Factor effects from median polish analysis
Global Median 59768
Year effect Site Effect Designation effect Flood History Insurance Class
Y2000 -21,233 Bewdley -2,158 Outside 16,070 Not Flooded -820 Normal 365
Y2001 -18,967 Shrewsbury -4,671 Low 1,339 Flooded 278 High -11,069
Y2002 -13,362 Southsea 3,788 Moderate -3,376 Compromised 7,548
Y2003 1058 West Bridgford 31,605 Significant -10,242
Y2004 14,959 Malton and Norton
-20,790
Y2005 11.180
Y2006 21,818
Some similarities to the truncated model can be observed. Insurance class has effects
which are counter intuitive, those properties with compromised insurance selling at
above average price. Flood history also has the wrong sign with previously flooded
property selling at a premium. Designation has broadly expected effect with
moderately and significantly at risk properties selling at a discount to the rest. Location

Model Estimation
281
factors have a similar pattern, albeit on a larger scale, to the hedonic model and
inflation explains most of the variability.
From this median polish we can therefore conclude that there is no strong evidence of
impacts due to flood status variables. The general property inflation is the biggest
effect observed. Of the three status variables flood designation acts as expected with
the other two vectors behaving counter-intuitively. No judgement as to the significance
of these effects can be made.
Discounting the price using the truncated hedonic model, all respondents without
flood status categories, as shown in Table 10-9, yields a similar picture again. With
insurance class 3 having an above average selling price.
Table 10-9 : Median discounted price by flood status categories
Significant Moderate Low Outside tot Flooded Flooded Flooded Flooded Yes No Yes No Yes No Yes No
Ins class 1
-0.08 (6)
-0.14 (15)
0.02 (5)
0.06 (11)
0.20 (9)
-0.01 (25)
(0)
-0.08 (23)
-0.02 (94)
Ins class 2
-0.12 (3)
0.16 (1)
0.03 (10)
0.08 (4)
-0.07 (3)
-0.03 (6)
(0)
0.19 (5)
0.02 (32)
Ins class 3
0.16 (3)
-0.11 (2)
0.16 (6)
0.14 (3)
(0)
0.49 (2)
(0)
(0)
0.15 (16)
Total 0.00 (12)
-0.11 (18)
0.07 (21)
0.06 (18)
0.08 (12)
0.0 (33)
(0)
-0.04 (28)
0.0 142
10.5 ANALYSIS OF INSURANCE PROBLEMS AT PURCHASE
Using the output from the questionnaire allows us to explore some further aspects of
the insurance regime in detail. For those who responded to the questions about the

Model Estimation
282
process of insuring their new home it is possible to investigate the impact of any
insurance issues during the purchase process. Referring back to the three hypotheses in
chapter 6 about the action of insurance in the presence of flood risk, all three
hypotheses rely upon the fact that insurance issues arise at purchase.
The disclosure hypothesis relies only upon insurance difficulties signalling a flood risk.
Of the 45 properties which we have assumed to have flooded recently and therefore to
be likely to experience problems in fact only 18 did so of which 20% discovered the
problems after completion. This implies that only one third of purchasers of property
designated at risk and recently flooded would have been alerted to a possible flood risk
via insurance problems. Figure 10-4 shows the distribution of errors in estimation for
those reporting that they had insurance problems which were discovered before
completion. There is no difference in the two distributions (see appendix G).
19122N =
PURPROB
1.00.00
ERR
OR
1.0
.5
0.0
-.5
-1.0
-1.5
12
30
8
619
39
Figure 10-4 : Distribution of prediction errors for those experiencing insurance problems at purchase
The discounted premium hypothesis relies on purchasers being charged more for
insurance. This happened to 15 respondents or one third of those assumed to have
flooded. Figure 10-5 shows a boxplot of the distribution of the errors in prediction
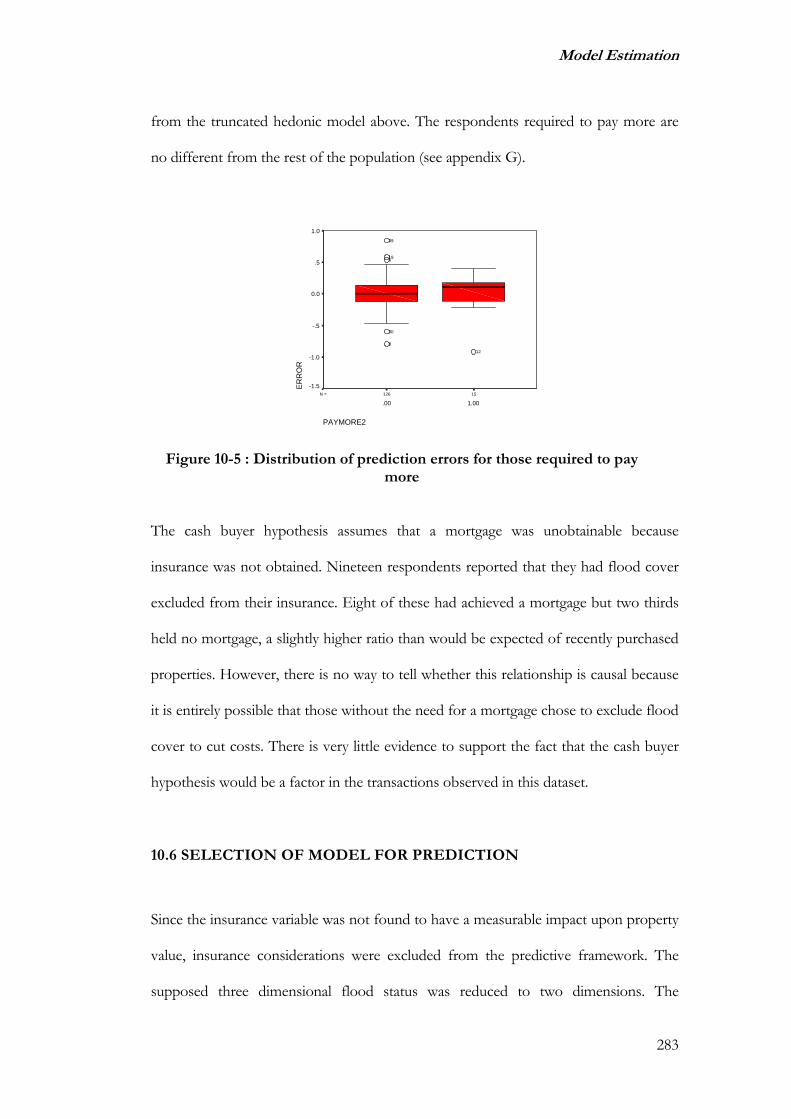
Model Estimation
283
from the truncated hedonic model above. The respondents required to pay more are
no different from the rest of the population (see appendix G).
15126N =
PAYMORE2
1.00.00
ER
RO
R
1.0
.5
0.0
-.5
-1.0
-1.5
12
30
8
619
39
Figure 10-5 : Distribution of prediction errors for those required to pay more
The cash buyer hypothesis assumes that a mortgage was unobtainable because
insurance was not obtained. Nineteen respondents reported that they had flood cover
excluded from their insurance. Eight of these had achieved a mortgage but two thirds
held no mortgage, a slightly higher ratio than would be expected of recently purchased
properties. However, there is no way to tell whether this relationship is causal because
it is entirely possible that those without the need for a mortgage chose to exclude flood
cover to cut costs. There is very little evidence to support the fact that the cash buyer
hypothesis would be a factor in the transactions observed in this dataset.
10.6 SELECTION OF MODEL FOR PREDICTION
Since the insurance variable was not found to have a measurable impact upon property
value, insurance considerations were excluded from the predictive framework. The
supposed three dimensional flood status was reduced to two dimensions. The

Model Estimation
284
advantage of excluding insurance is that a larger set of data is available once insurance
variables are excluded. The disadvantage of excluding insurance is that nothing can be
said about the impact of insurance on the property purchase and if the insurance
regime were to change then property prices might change in an unpredictable way.
The evidence above also showed that designation alone had no impact upon the price
of property. Home buyers appear to be acting reactively based on recent flooding
experience. While it is not clear exactly how a buyer may make a judgement upon flood
history, the most consistent factor resulting in a measurable price impact is a sustained
history of flooding. A tentative predictive framework for the impact of flooding on
house prices is therefore based mainly on the impacts shown in Figure 10-3 and has
associated large uncertainty. As discussed above more detailed analysis of significantly
at risk property would be necessary to make firm predictions of impact for individual
properties. The tentative framework is shown in Table 10-10.
Table 10-10 : Predictive framework for categories of flooded property
Not flooded
Flooded once
Flooded twice Flooded 3+
Significant No Impact
Possible temporary impact.
Temporary impact peaking at 15% in first year.
Short term temporary impact peaking at 35% in first year.
Moderate No Impact
Possible temporary impact
Temporary impact peaking at 15% in first year.
Short term temporary impact peaking at 35% in first year.
Low No Impact
No impact No information No information
Outside control No information
No information No information

Model Estimation
285
10.7 MODEL VALIDATION
Validation of negative findings, that is those that have failed to measure an impact, is
not as straightforward as validating models which find a measurable impact. It is not
possible to compare predictions with and without the measured effect. However, there
are several factors which will lead to confidence in the conclusions from this analysis.
10.7.1 External Validation
The findings from this analysis do not contradict theory. It has been observed that,
although a rational consumer should be willing to pay to avoid flood risk, the
assessment of flood risk is a highly individual and subjective matter in the UK.
Disclosure is not standard practice and as chapter 9 demonstrates finance problems do
not force disclosure for all property transactions.
The findings are within the range of previously published studies of the impact of
flooding on property value as discussed in chapter 4. The maximum measured impact
is at the limit of previously measured average impacts but this impact is temporary,
declines quickly and only observed for those properties which have flooded frequently
and which are, by extension, significantly at risk of flood. It is also possible that some
of these properties may have been sold in an unrestored condition. The observation
that designation produces no impact has also been duplicated in previous studies and
may be seen to be reasonable in the absence of enforced disclosure of risk during the
property transaction.
Model Estimation
286
The findings from this research agree with practitioner beliefs in many respects. In the
survey of valuation professionals carried out by the Building Flood Research Group
(BFRG) (2004) the median discount for flooded was estimated at 12-15% which can
be regarded as consistent with 15% discount for property flooded more than once,
maximum discount was up to 40% which can be regarded as consistent with the
average 30% discount for property flooded more than 3 times. Furthermore in the
BFRG investigation and also in the study by Eves (2004) large variability was observed
in the responses from professionals and this is supported from the transactional
analysis. Finally the consensus view from these two surveys of practitioners was that
flood impact would decline with time elapsed from the flood a conclusion which the
current research supports.
In discussions during workshops of the flood repair forum repair specialists and
insurance company representatives agreed that three or more floods were usually
needed before homeowners recognised themselves as at serious ongoing risk of
flooding. This accords well with the finding that the most significant impacts are seen
in properties which have flooded three times or more.
10.7.2 Internal Validation
The most compelling internal validation of this analysis is the fact that where more
than one approach tested the same hypotheses the same broad conclusions were
reached. This is not a common experience in studying flood impact as demonstrated
by Schaeffer (1990) and it adds confidence to the interpretation of the findings. This
means that within the foregoing comparison, validation was being carried out and
triangulation was achieved for the broad conclusions.

Model Estimation
287
However for the more detailed conclusions, the temporary impacts which were
observed were measured with a great deal of surrounding uncertainty and can be
described as weak results. There is a tendency towards discount in frequently flooded
property but the scale of discount is unpredictable. Attempting to make point estimates
on a property by property basis of the impact on price in the year following flood
would be doomed to failure. The results can be regarded as general framework of
guidance on the impact of flooding rather than a detailed predictive tool.
10.8 SUMMARY
The above analysis reveals that the overriding feature of the property price data used in
this study is the strong growth over time. However, if there was devastating property
blight due to the risk of flood, a recent flood history or insurance problems for
transacted property then these analyses should detect it despite the market growth. We
can conclude that among property which is traded any flood status effect is small
relative to location, property size and type.
Measured impacts of flooding on property price are temporary in nature, they appear
to be a reaction to flood events rather than to risk designation.
The insurance class variable has a correlation with price which is wholly unexpected.
On reflection a possible explanation may be that compromised insurance, which
comprises mostly those who have flood excluded from their cover may contain an
element of choice by the policyholder. The correlation may be due to richer, perhaps

Model Estimation
288
better informed, individuals inhabiting higher value property and choosing to self
insure the risk of flood from a position of financial strength or better information.
Since these data were not collected the supposition cannot be tested.
In reflecting on the messages emerging from the two analyses above it is important to
remember that this period of analysis was one of very strong price growth. Authors
have speculated (Whittle, 2005) that in a strong market flood risk may be less of an
issue than it would be in a weak market. That contention cannot be tested in the
current economic conditions.
Conclusions and Recommendations
289
Chapter 11 : CONCLUSIONS AND
RECOMMENDATIONS
11.1 INTRODUCTION
The aim of this research was to explore the relationship between flooding and the
value of residential property in the UK. Measurement of the impact of flooding and
the role of the cost and availability of insurance in influencing the relationship between
flooding and property value were also central to the research aim.
A driving principle behind the research was the desire of property stakeholders to be
able to predict the impact of flood on property in the face of future flooding or
designation changes. Apart from the obvious concern of the property owner in
maintaining the value of their investment, several other property stakeholders were
identified as having an interest in the findings of such research. Valuation
professionals, house builders, mortgage lenders, insurers and government would be
concerned if floodplain property suffered large discount.
A detrimental impact of flooding on property value has often been assumed, for
example in cost benefit estimation of flood management schemes (Chao et al., 1998).
Press speculation has also often taken this impact as read (Hughes, 2000, Jackson,
2005, Whittle, 2005). This assumption had yet to be fully tested in the UK market and
this is a fundamental research gap which the current study has aimed to fill. The three
objectives of the study, listed in section 1.6, were formulated in the expectation that the

Conclusions and Recommendations
290
fulfilment of the objectives would make a contribution to, but not completely, close
the knowledge gap.
A comprehensive literature review was carried out during this study encompassing
flooding literature; economic house price modelling literature; insurance theory; and
empirical studies of the impact of amenities and disamenities on property prices,
particularly flooding. These reviews are discussed at length in chapters 2 to 5 and fulfil
objective 1, covering thematic, theoretical, quantitative and methodological aspects.
Some consensus was identified from previous studies and this is summarised below
under major research findings in section 11.2. Inadequacies were identified in
methodologies previously used in flooding studies and in methods from the wider
literature when attempting to measure flood impacts in the UK property market.
Achievement of the second objective followed naturally from the methodological
issues identified within the review. Key issues arising from these chapters were: the
three dimensional nature of the flood status variable; the time varying nature of the
response to a flood event; the lack of a theoretical model appropriate for incorporating
insurance into models of house prices in the unique regime prevalent in the UK and
the small sample sizes inherent in studying flood events in the UK.
Chapter 6 presented the conceptual developments employed in this research
programme to address the key issues within the constraints of available data and
resources. These developments included a novel specification of the repeat sales model
of house prices; new hypotheses regarding the action of insurance within the UK flood

Conclusions and Recommendations
291
insurance regime; a block design to incorporate the three dimensional nature of the
flood status variable and combination of flood sites to increase statistical power.
The third objective was achieved via the collection and analysis of data for the UK
market as described in chapters 7 to 10. Chapter 7 described the practical aspects of
the empirical research program. The collection of data including the implementation of
a large survey of homeowners is explained in detail. The analysis of the collected data
and model estimation follow in chapters 8 to 10, findings from this analysis are
summarised in sections 11.2.
11.2 RESEARCH FINDINGS
The findings from the study are divided below into findings from the literature,
findings about flood insurance in the UK and findings about flood impact.
11.2.1 Findings from the literature review
Discount in the price of property situated in the floodplain can be regarded in
economic theory as a reflection of willingness to pay to avoid annual flood damage.
Theoretical estimation of the discount amount consistent with this theory is
problematic in the UK market because of uncertainties associated with damage
estimates and the unique UK insurance regime.
Floodplain property does not necessarily suffer flood discount. Many studies found no
impact of floodplain status or of a flood event. Measured flood discount ranges from
Conclusions and Recommendations
292
no impact to an average of 30% with some previously flooded property selling at a
premium to the market.
Flood status can be regarded as three dimensional with the impact of flood events,
flood designation and insurance regimes all having a bearing on home buyers
willingness to pay. There is no strong evidence as to which has most bearing upon a
market’s willingness to pay and it is partially dependent on insurance and disclosure
regimes.
11.2.2 Findings from the insurance questionnaire
The reported flooding patterns within the floodplain revealed that many people
designated at risk of flooding, while acknowledging that they lived in a flood risk area,
did not consider their property to be actually at risk of flooding. Many had justified
that belief by citing evidence of elevation of land or property. This was an unsurprising
result and concurs with the Environment Agency view that their maps are not suitable
for assessing risk on individual properties.
Many residents experienced difficulties in obtaining and renewing insurance policies
but in general insurance was available at a reasonable price for residents at risk of
flood. There were only a handful of residents who reported being unable to obtain
insurance due to flood risk. A larger minority had accepted the exclusion of flood risk
from their policy.

Conclusions and Recommendations
293
In addition, insurance cost was not determined by flood risk, other factors such as a
history with their insurer or the company selected for insurance appeared to make
more difference.
11.2.3 Findings from the flood price impact modelling
There was no measurable impact of flood designation as defined by the Environment
Agency on the price of property in the absence of a flood event. Both the repeat sales
and truncated model failed to find a significant impact.
No significant impact of the cost of insurance was measurable on property prices. An
anomalous result regarding the correlation of exclusion of flood from insurance cover
with higher property price was found.
A single flood of a property outside the floodplain or in a low flood risk area had no
significant measurable impact on the price of property.
Combination of a history of flooding with designated flood risk category moderate or
significant can sometimes lead to temporary discount in the price of property. The
scale of that impact was highly variable ranging from no impact to a significant
measured impact of 35%. Three years after the flood, the effects had disappeared.
Repeated flooding could generate a renewed impact.

Conclusions and Recommendations
294
11.3 CONTRIBUTION
This program of research was designed to make contributions in two areas: in novel
methodological approaches which could be utilised in future studies in the UK and
elsewhere, and in understanding of the UK market for floodplain property.
11.3.1 Contribution to methodology
The adaptation of repeat sales analysis adopted in this research is a novel approach to
measuring the impact of disruptive events. The particular feature which makes it
appropriate in studying flooding is the flexibility of observing impacts which change
with time elapsed from the disruptive event. The use of repeat sales in itself is not
novel, although it has been underemployed relative to the cross sectional hedonic
model. The advantage of the repeat sales methodology over the hedonic in reducing
the data burden is clear. A method based upon repeat sales can be applied far more
easily and economically. In this research the adapted repeat sales was also useful in
reducing the data to discounted growth rates which could then be combined across
sites without the concern for absolute levels of house prices. In the light of the small
impacts detected by the study the question about whether this framework increased
statistical power is not definitively answered.
The second contribution to methodology is the treatment of the insurance variable.
Within this thesis the flood status of a property with regard to an individual
considering investment in the property has been described as three dimensional.
Insurance status is one of these vectors of flood status and can be tested independently
in the UK because it is not determined wholly by the other two, namely flood risk and

Conclusions and Recommendations
295
flood history. This thesis is unique in considering the mechanics of the action of
insurance within the purchase process. Hypotheses stemming from surveys of
valuation professionals and from insurance literature have been presented and it is seen
that a simple cost of insurance treatment would be inadequate and holds the risk of
underestimating the impact of insurance within the property market in the UK. The
findings from estimating models based upon these hypotheses are intriguing and
warrant further investigation.
11.3.2 Contribution to understanding
The contribution of this analysis to understanding of the market for flood risk property
was anticipated to be improved in four ways:
Understanding of the spread of price effect over time was expected. From both the
literature review and the empirical study it emerges that the impact of a flood event is
temporary. People forget about the flood experience in the absence of other flood risk
messages. The empirical study observed significant impacts to be temporary in all
studied sites. The maximum length to recovery was three years. In one frequently
flooded location a subsequent flood appeared to generate a second impact which again
declined quickly.
Designation on the other hand has been seen to have a permanent impact on property
value by some authors in the literature review. By contrast this study found no impact
due to flood designation temporary or permanent.

Conclusions and Recommendations
296
The magnitude of the flood effect was seen to be highly variable from the literature. In
the empirical phase of this research that finding was reinforced. For some flood
locations no impact was measurable whereas significant impacts were measured in
others. When flood sites were combined the variability of measured impacts became
clear.
The impact of flooding on the cost of insurance has been measured via a
questionnaire. A unique insight has been gained and the scale of the insurance cost
increases has been seen to be much smaller than anticipated. As may be anticipated
from the above insurance finding, no discount was measurable in the price of property
which could be attributed to insurance cost. An interesting correlation between
property value and self insuring flood has been observed.
11.3.3 Dissemination
Findings from this research have been presented as the research progressed at
international conferences, published in peer reviewed journals and discussed at
workshops of the flood repair network. A summary of the questionnaire findings has
been placed on the website of the flood repair network. A summary of initial findings
has formed part of a book chapter. A list of publications is attached at appendix I.
Further publications are in preparation and in review. A key aim of the dissemination
has been to reflect the multidisciplinary nature of the thesis by publishing in the widest
range of sources. Both theoretical and empirical findings have been published.

Conclusions and Recommendations
297
11.4 LIMITATIONS
This study has been concerned with the impact of flooding on the value of residential
property in the UK. Domestic residential property only was considered because
business properties are subject to different valuation processes and insurance regimes.
While the review of literature has considered a wide range international studies
encompassing different flooding types and designation regimes the empirical analysis
has been strictly limited.
The empirical research has been based on data from England and Wales, from sites
which flooded, or narrowly avoided flooding, in the autumn 2000 event which was
limited to inland flooding, mainly river and overland flow. The use of this event was
determined by the desire to be able to combine multiple sites. It has not been possible
to test whether these results will hold true for another flood event. However the simple
methodology developed during the research will allow for such analysis once sufficient
time has elapsed from more recent flooding events such as Carlisle 2005 and the
Summer 2007 flooding.
Use of the Environment Agency website to obtain flood designation information is a
limitation of the study as discussed at length above, this enforced the use of whole
postcode designation. Where more detailed lists were available from the Environment
Agency it became clear that a more accurate categorisation is possible and this would
have lent better precision to the analysis. In addition the categories employed by the
Envionment Agency are rather broad, the results of the study suggest that
concentrating on frequently flooded and significantly at risk properties would be

Conclusions and Recommendations
298
appropriate in any further study of this issue. The limitations of the Environment
Agency categorisation is not detailed enough to allow for this kind of analysis.
For the price impact analysis only transacted property prices have been obtained
therefore it is not possible to assess the effect of flooding on the flow of property onto
the market. The limitation of using the Land Registry data is that while coverage is the
best available it will not be complete.
The data on insurance coverage is limited to five locations in England, while these
locations contain some of the most frequently flooded property in the UK it is possible
that there are other locations where insurance cover is more problematic. As a self
administered postal questionnaire the responses may be subject to self-selection bias.
Return rate for the questionnaire was 20% which, whilst good for this kind of study
cannot be regarded as complete.
Within the current economic conditions in the UK the housing market has been highly
buoyant. Housing markets may react differently to perceived risks in times with lower
growth.
Use of the repeat sales model implies the assumption that property details, other than
the focus variables remain constant over time. This assumption has not been tested
within the research, however the use of multiple sites reduces the chances that a
systematic bias will distort the results for the focus variable. A further assumption is
that any measured differences in growth rate are due to the impact of flood status,
once again the use of multiple sites reduces the chance that an omitted variable is
Conclusions and Recommendations
299
changing at the same time as the focus variable. However, changes in property
condition could feasibly be correlated with flood history for all locations and this was
not measured during the repeat sales analysis. The absence of condition information is
a limitation of the study. Reassuringly the questionnaire responses implied that the
majority of flooded properties were restored to about the same condition as pre-flood.
The risk remains that short term impacts measured by the study may be due to
property sold before restoration.
A further limitation of repeat sales analysis is the fact that only changes can be
measured, any long term capitalisation of the impact of flood could not be measured.
This limitation was partially addressed by the use of a truncated hedonic model which
failed to find any long term capitalisation of designation or flood history.
11.5 IMPLICATIONS AND RECOMMENDATIONS
The findings from the price impact model that, for the vast majority of floodplain
properties, flood impacts on property prices are small and temporary imply that the
natural concern experienced by property owners about long term equity in their home
is largely unfounded. This is a reassuring message which is somewhat unexpected given
the amount of media speculation on the issue and the views of some valuation
professionals.
A recommendation which stems naturally from the study is that, for the overwhelming
majority of flood affected property and where finances allow, property owners can
invest with confidence in the restoration of their property to pre-flood condition. If
Conclusions and Recommendations
300
possible, any subsequent sale of the property should be delayed until the market
recovers. Where this is not possible, discount should not be anticipated in the asking
price because in many instances recently flooded property suffers no discount at all.
For professional valuation purposes, in the vast majority of instances, flood risk can be
disregarded. If insurance is available in the prevailing market the medium term
investment potential of floodplain property appears to be sound.
For those frequently flooded properties where, continuous flooding makes impacts
seem longer term, impacts are still small and have been dwarfed by the impact of
inflation over the study period. In a more difficult housing market it is possible that the
picture would be less advantageous and it is recommended that further study of
frequently flooded property and property in static markets should be carried out if data
allows.
The implication of the insurance findings are, broadly, that while residents are
experiencing difficulties with flood insurance for most residents these are not severe
enough to prompt modifications in their behaviour. The current insurance regime is
not encouraging mitigating behaviour because switching insurer allows large up-front
savings on premium and excess charges whereas improvements in resistance and
resilience do not.
The problems with obtaining insurance are also not severe enough to provide a
disincentive to purchase in most cases. The consideration of transacted property may
have limited this finding, but the current insurance regime does not appear to be
unduly obstructing property transactions. Vendors could reduce the chances of

Conclusions and Recommendations
301
insurance problems halting a sale by establishing that their insurer would be willing to
continue to provide cover with a future owner subject to that owner’s status.
The fact that no measurable impact of designation was detected implies that the official
view of flood risk is not capitalised into the price of floodplain property. This raises the
further possibility that, if designation regimes changed, for example if the disclosure of
flood risk was regulated into the property transaction process, floodplain property
might suffer value loss. The literature review suggests that any impact would be
relatively small scale in comparison to the possible temporary impacts following a
flood event. However policy makers should be aware of this possible additional risk to
floodplain occupants.
11.6 SCOPE FOR FUTURE RESEARCH
Opportunities have been created by the validation of a new variant of the repeat sales
model within this thesis. Recent and future flood events can be analysed in a relatively
quick and inexpensive manner using the methods employed here. Two recent events
which would be suitable for this treatment are Carlisle 2005 and the Summer 2007
floods. Other flood related testing could also be carried out with the method for
example testing the market impact of new or improved flood defences in areas not
recently flooded.
This thesis has identified that the impact of flood on property value is concentrated in
significantly at risk and recently flooded property. The work could be extended via a

Conclusions and Recommendations
302
detailed study of high risk and frequently flooded locations. This would require more
detailed designation and history information than was available to this research.
The town of Lewes displayed a possible long term impact of flood, not significant but
consistent. A further analysis of Lewes taking into account the development and flood
defence improvements might yield insights into the role of regeneration schemes in
managing the value of property at risk of flood.
This research was limited by the current economic conditions. If these conditions
change as experts have suggested they may in the short term the analysis could be
extended to the static market.
The second opportunity created by this research is a dataset of responses to the
insurance questionnaire. Within the above research much of the data has been utilised
but the focus has been upon the relationship with property value. The analysis raised
several interesting issues however which could be pursued partly by further
interrogation of that dataset but also via alternative research routes. The respondents
provided extensive commentary of their experiences which was not formally analysed.
The issue of whether self insuring for flood risk is a positive choice or a compulsory
imposition from the insurance company is a fascinating area and could demonstrate a
gap in risk perception between experts and floodplain populations. The issue of
whether insurance deters homeowners from self protection has been discussed for
many countries but in the unique UK market as demonstrated by this research, efforts
by the insurers to introduce rewards for mitigation may be negated by the ability of
homeowners to switch insurers.

Conclusions and Recommendations
303
11.7 CONCLUDING REMARKS
This study had the stated aim of improving the understanding of the impact of
flooding on the value of UK property. In addressing this aim it has been necessary to
advance the understanding of the impact of flooding on the cost and availability of
insurance and to develop a novel methodology for measuring these impacts. The study
has provided a significant step forward in understanding of these issues. The study
found that where there is an impact of fluvial flooding on the price of UK property it
is local, temporary and triggered by flood events rather than risk designation. The
effort expended in generating a novel measurement framework which will be relatively
easy to apply to future flood events has created an opportunity to continue to develop
understanding in this area.

References
304
LIST OF REFERENCES
AA (2005) British insurance premium index introduction. Accessed (23rd May 2005) Available from http://www.theaa.com/services/insuranceandfinance/insuranceindex
AA (2007) Insurance Premium Index. Accessed (December 2007) Available from http://www.theaa.com/services/insuranceandfinance/insuranceindex/index.html
ABI (2002) ABI statement of principles on the provision of flooding insurance. Accessed (23rd November 2004) Available from http://www.abi.org.uk
ABI (2005a) ABI statement of principles on the provision of flood insurance- updated version, November 2005. Association of British Insurers
ABI (2005b) Financial risks of climate change. Association of British Insurance ABI (2005c) Revisiting the partnership: five years on from autumn 2000 - October
2005 anniversary report. Association of British Insurers ABI (2006) Flood resilient homes - what homeowners can do to reduce flood
damage. Association of British Insurers ABI/BCIS (2005) Building insurance for homeowners. Association of British
Insurers ABI/NFF (2006) Repairing your home or business after a flood - how to limit
damage and disruption in the future. Association of British Insurers and the National Flood Forum
ADAIR, A., MCGREAL, S., SMYTH, A., COOPER, J. & RYLEY, T. (2000) House prices and accessibility: the testing of relationships within the Belfast urban area. Housing Studies, 15(5), 699-716.
AGLAN, H., WENDT, R. & LIVENGOOD, S. (2004) Field testing of energy-efficient flood-damage-resistant residential envelope systems summary report. U.S. department of energy
ALEXANDER, C. & BARROW, M. (1994) Seasonality and cointegration of regional house prices in the UK. Urban Studies, 31(10), 1668-1689.
ARNELL, N. W., CLARK, M. J. & GURNELL, A. M. (1984) Flood insurance and extreme events: the role of crisis in prompting changes in British institutional response to flood hazard. Applied Geography, 4(2), 167-181.
ARUP (2006) Northeast Yorkshire strategic flood risk assessment. Final report for Ryedale Disctict Council, Scarborough Borough Council and North York Moors National Park Authority. Final report Ryedale Disctict Council, Scarborough Borough Council and North York Moors National Park Authority ARUP
BABCOCK, M. & MITCHELL, B. (1980) The impact of flood hazard on residential property values in Galt (Cambridge) Ontario. Water Resources Bulletin, 16(3), 532 - 537.
BARHAM, N. (2004) A flash flood assessment. An insurance company perspective on the Boscastle floods of 16th August 2004. . Journal of Meteorology, 29(293), 22-27.

References
305
BARKER, K. (2004) Delivering stability: securing our future housing needs. Review of Housing Supply Office of the Deputy Prime Minister
BARNETT, J. & BREAKWELL, G. G. (2001) Risk perception and experience: hazard personality profiles and individual differences. Risk Analysis, 21(1), 171-177.
BBC (1998) UK more floods on the way. Accessed (12th June 2005) Available from http://news.bbc.co.uk
BBC NEWS (2004) Relief as Ruthin spared floods. Accessed (4th August 2007) Available from http://news.bbc.co.uk/1/hi/wales
BENNET, G. (1970) Bristol Floods 1968: controlled survey of effects on health of local community disaster. British Medical Journal, 3, 454 - 458.
BIALASZEWSKI, D. & NEWSOME, B. A. (1990) Adjusting comparable sales for floodplain location: the case of Homewood, Alabama. The Appraisal Journal, 58(1), 115 - 118.
BIN, O., CRAWFORD, T., KRUSE, J. B. & LANDRY, C. (2006) Flood prone with a view: coastal housing market response to risk and amenity. East Carolina University
BIN, O. & POLASKY, S. (2003) Effects of flood hazards on property values: evidence before and after hurricane Floyd. Land Economics, 80(4), 490-500.
BISHOP, R. C. & HEBERLEIN, T. A. (1979) Measuring values of extramarket goods: are indirect measures biased? American Journal of Agricultural Economics, 61(5), 926-930.
BLACK, A. R. & EVANS, S., A (1999a) Flood Damage in the UK. New insights for the insurance industry. University of Dundee Geography Department
BLACK, A. R. & EVANS, S., A (1999b) A new insurance perspective on British Flood losses. 34th MAFF conference of River and Coastal Engineers. Keele University.
BLACK, A. R. & LAW, F. M. (2004) Development and utilization of a national web-based chronology of hydrological events. Hydrological Sciences, 49(2), 237-246.
BLACK, S. E. (1999) Do better schools matter? Parental valuation of elementary education Quarterly Journal of Economics, 114(2), 577 - 599.
BMRB (2002) National awareness survey (January 2002), summary of results. British Market Research Bureau
BMRB (2006) Flooding: is the nation prepared? Aspects of social research. BOLLENS, S. A., KAISER, E. J. & BURBY, R. J. (1981) Evaluating the effects of
local floodplain management policies on property owner behaviour. Environmental management, 12(3), 311-325.
BOURNE, L. S. (1981) The geography of housing, V. H. Winston and Sons. BOURQUE, L. B. & FIELDER, E. P. (1995) How to conduct self-administered and
mail surveys, Thousand Oaks, California, Sage Publications. BOWKER, P. (2007) Flood resistance and resilience solutions an R&D scoping
study. R&D technical report Department for Food and Rural Affairs BOYLE, M. A. & KIEL, K. A. (2001) A survey of house price hedonic studies of
the impact of environmental externalities. Journal of Real Estate Literature, 9(2), 117-144.

References
306
BRADBROOK, K., WALLER, S. & MORRIS, D. (2005) National floodplain mapping : data sets and methods - 160,000 km in 12 months. Natural Hazards, 36(1-2), 103 - 123.
BRAMLEY, G., MUNRO, M. & PAWSON, H. (2004) Key Issues in housing. Policies and markets on 21st Century Britain, Palgrave Macmillan.
BRE SCOTTISH LABORATORY (1996) Design guidance on flood damage to dwellings. HMSO for Scottish Office Development Department
BRILLY, M. & POLIC, M. (2005) Public perception of flood risks, flood forecasting and mitigation. Natural Hazards and Earth System Sciences, 5, 345-355.
BROOKSHIRE, D. S., THAYER, M. A., SCHULZE, W. D. & D'ARGE, R. C. (1982) Valuing public goods: a comparison of survey and hedonic approaches. The American Economic Review, 72(1), 165-177.
BROWN, P. (2004) New Flood Maps pinpoint risk areas. The Guardian, Thursday October 7th 2004
BRUEN, M. & GEBRE, F. A. (2001) Worldwide public perception of flood risk in urban areas and its consequences for hydrological design in Ireland. National Hydrological Seminar.
BUILDING FLOOD RESEARCH GROUP (BFRG) (2004) The impact of flooding on residential property values. RICS foundation report Building Flood Research Group
BURBY, R. J. (2001) Flood insurance and floodplain management: The US experience. Global Environmental Change Part B: Environmental Hazards, 3(3-4), 111 - 122.
BUTLER, R. V. (1982) The specification of hedonic values for urban housing. Land Economics, 58(1), 96 - 108.
BYE, P. & HORNER, M. (1998) Easter floods 1998: a preliminary assessment by the independent review team. Environment Agency
CAMERER, C. F. & KUNREUTHER, H. (1989) Decision processes for low probability events: policy implications. Journal of policy analysis and management, 8(4), 565-591.
CASE, B., COLWELL, P. F., LEISHMAN, C. & WATKINS, C. (2006) The impact of environmental contamination on condo prices: a hybrid repeat-sales/hedonic approach. Real Estate Economics, 34(1), 77-107.
CEH WALLINGFORD (2006) CEH data holdings. Accessed (10th November 2006) Available from http://www.ceh.ac.uk/data/index.html
CHAGNON, S. A., PIELKE, R. A., CHAGNON, D., SYLVES, R. T. & PULWARTY, R. (2000) Human factors explain the increased losses from weather and climate extremes. Bulletin of the American Meteorological Society, 81(3), 437-442.
CHAMBERS (1993) Chambers twentieth century dictionary, Bath, Pitman Press. CHAO, P. T., FLOYD, J. L. & HOLLIDAY, W. (1998) Empirical studies of the
effect of flood risk on housing prices. 98-ps-2, IWR report United States Army Corps of Engineers
CHESHIRE, P. & SHEPPARD, S. (2004) Capitalising the value of free schools : The impact of supply characteristics and uncertainty. The Economic Journal, 114, 397-424.
References
307
CLAPP, J. M. & GIACCOTTO, C. (1992) Estimating price indices for residential property: a comparison of repeat sales and assessed value methods. Journal of the American Statistical Association, 87(418), 300-306.
CLAPP, J. M. & GIACCOTTO, C. (1998) Residential hedonic models: a rational expectations approach to age effects. Journal of Urban Economics, 44, 415-437.
CLARK, C. (2000) The great morass reappears, Southsea flood. Portsmouth Society News.
CLARK, M., SMITH, D. & MCCONVILLE, M. (1994) Slippery customers, estate agents, the public and regulation, Blackstone Press Ltd.
CLARK, M. J., PRIEST, S. J., TREBY, E. J. & CRICHTON, D. (2002) Insurance and UK floods a strategic reassessment. Report of the Tsunami project Universities of Southampton, Bournemouth and Middlesex
COMMUNITIES AND LOCAL GOVERNMENT (2007) What is a leasehold. Accessed (October 2007) Available from http://www.communities.gov.uk/housing/buyingselling/residentialleasehold/whatis/
COOK, S. (2003) The convergence of regional house prices in the UK. Urban Studies, 40(11), 2285-2294.
COSTELLO, G. & WATKINS, C. (2002) Towards a system of local house price indices. Housing Studies, 17(6), 857-873.
COWLEY, R., LEY, S. & WHITLOW, H. (2002) UK households: floods, inflation and under-insurance. Working Party report Chartered Institute of Actuaries
CRESSWELL, J. W. (2003) Research design: qualitative, quantitative and mixed methods approaches, Thousand Oaks, Sage Publications Inc.
CRICHTON, D. (2005) Flood risk and insurance in England and Wales: are there lessons to be learned from Scotland? Technical Report Benfield Hazard Research Centre
CRICHTON, D. (2006) The effects of insurance changes and climate change on small and medium size enterprises (SMEs) in Britain. Axa insurance
CROMPTON, R., MC ANENEY, J. & LEIGH, R. (2006) Natural disaster losses and climate change: an Australian perspective. Climate change and disaster losses workshop, understanding and attributing trends and projections. Hohenkammer, Germany.
CUMMINGS, R. G., BROOKSHIRE, D. S. & SCHULZE, W. D. (1986) Valuing environmental goods: as assessment of the contingent valuation method, New Jersey, Rowman and Allanheid.
DAY, B. (2003) Submarket identification in property markets: a hedonic housing price model for Glasgow. EDM -03-09 working paper Centre for Social and economic research on the global environment UAE Norwich
DAY, B., BATEMAN, I. J. & LAKE, I. R. (2003) What price peace? a comprehensive approach to the specification and estimation of hedonic housing price models. EDM 03-08 working paper Centre for Social and Economic Research on the Global Environment, UAE, Norwich
DEFAQTO (2003) Home insurance in the UK - annual review of the UK home insurance market Defaqto Limited

References
308
DENT, P. & SIMS, S. (2007) What is the impact of wind farms on house prices? Findings in Built and Rural Environments (FiBRE) Royal Insititute of Chartered Surveyors
DEPARTMENT OF COMMUNITIES AND LOCAL GOVERNMENT (2006) Planning Policy Statement (PPS)25: development and flood risk. The Stationery Office.
DEY, I. (2006) Insurers threaten to withdraw flood cover. Vulnerable properties will be 'uninsurable' if Defra cuts pounds 15m from flood defence budget. The Sunday Telegraph, London City section p.1
DILLMAN, D. (2000) Mail and internet surveys, the tailored design method, John Wiley and Sons inc.
DIRECT LINE (2002) Making the switch: a report on the barriers to changing home insurers. The Direct Line home insurance report Direct Line
DLUGOLECKI, A. (2004) A changing climate for insurance : a summary report for chief executives and policymakers. Association of British Insurers
DOE, R. K. (2004) Extreme precipitation and run-off induced flash flooding at Boscastle, Cornwall, UK - 16th August 2004. Journal of Meteorology, 29(293), 7-21.
DOLING, J. (2006) Home Ownership. Getting in, getting from, getting out. Part II, IOS Press.
DONELLY, W. A. (1989) Hedonic price analysis of the effect of a floodplain on property values. Water Resources Bulletin, 25(3), 581-586.
DOORNKAMP, J. C. (1995) Perception and reality in the provision of insurance against natural perils in the UK. Transactions of the Institution of British Geographers, 20, 68-80.
EA (2001) Lessons learned Autumn 2000 floods. Environment Agency EA (2003a) Bewdley flood alleviation scheme, Severnsde North - the invisible
defences. Environment Agency EA (2003b) East coast floods 1953. Accessed (10th November 2006) Available
from http:// www.environment-agency.gov.uk/subjects/flood EA (2005) Flooding in Wales - October/November 2000. Environment Agency EA (2006a) Environment Agency Flood map. Accessed (October 2006) Available
from http://maps.environment-agency.gov.uk/wiyby/mapController EA (2006b) River Ouse catchment management plan - scoping report. Environment
Agency EA (2007) Development and flood risk in England 2006/07. High level target 5
Environment agency for the Department of Food and Rural Affairs and Communities and Local Government
EA/DEFRA (2005) The appraisal of human related intangible impacts of flooding. FD2005/TR Technical report Environment Agency / Department of Food and Rural Affairs
EHRLICH, I. & BECKER, G. S. (1972) Market insurance, self-insurance and self-protection. Journal of political economy, 80(4), 623-648.
ENTEC (2004) Study into the environmental impacts of increasing the supply of housing in the UK. Department for Environment Food and Rural Affairs
ENTEC (2005) Making communitites sustainable-managing flood risk in the government's growth areas. Association of British Insurers
EUROMONITOR (2004) Property insurance in the UK. Euromonitor

References
309
EVANS, E., ASHLEY, R., HALL, J., PENNNG-ROWSELL, E., SAUL, A., SAYERS, P., THORNE, C. & WAKINSON, A. (2004) foresight future flooding, scientific summary: volume 1 future risks and their drivers. Foresight Future flooding Office of Science and Technology
EVES, C. (2002) The long-term impact of flooding on residential property values. Property Management, 20(4), 214-227.
EVES, C. (2004) The impact of flooding on residential property buyer behaviour: an England and Australian comparison of flood affected property. Structural Survey, 22(2), 84-94.
FLEMING, G. (2001a) After the flood: lessons from the Scottish Experience. Keynote Address University of Strathclyde
FLEMING, G. (2001b) Learning to live with rivers. The Institution of Civil Engineers
FLEMING, M. C. & NELLIS, J. G. (1986) The Halifax house price index, technical details. Halifax Building Society
FLEMING, M. C. & NELLIS, J. G. (2003) The Halifax house price index. Halifax Building Society
FLETCHER, M., P., G. & MANGAN, J. (2000) Heteroscedasticity in hedonic house price models. Journal of Property Research, 17(2), 93-108.
FLOOD REPAIRS FORUM (2006) A guide to the investigation and repair of flood damage to housing and small business, BRE Press Watford.
FLOOD RISK MANAGEMENT RESEARCH CONSORTIUM (2007) Vision statement. Accessed (January 2007) Available from http://www.floodrisk.org.uk/content/view/12/58/
FORDHAM, M. & KETTERIDGE, A. M. (1995) Flood disasters - dividing the community. Emergency planning. Lancaster, UK.
FORREST, D., GLEN, J. & WARD, B. (1996) The impact of a light rail system on the structure of house prices - a hedonic longitudinal study. Journal of Transport Economics and Policy, 30(1), 15-29.
FOSTER WHEELER ENVIRONMENTAL CORPORATION & HARRIS, C. C. (2001) Assessment and evaluation of the drawdown regional economic workgroup (DREW) recreation analysis findings. U.S. Army Corps of Engineers
FREEMAN, A. M. (1979) Hedonic prices, property values and measuring environmental benefits: a survey of the issues. Scandinavian Journal of Economics, 81(2), 154-173.
FRIEDMAN, M. (1976) Price Theory, Chicago, Aldine Publishing Company. GARROD, G. & WILLIS, K. (1992) The environmental economic impact of
woodland: a two stage hedonic price model of the amenity value of forestry in Britain. Applied Economics, 24, 715-728.
GASCHEN, S., HAUSMANN, P., MENZINGER, I. & SCHAAD, W. (1998) Floods - an insurable risk? A market survey. Swiss Re
GATZLAFF, D. H. & LING, D. C. (1994) Measuring changes in local house prices: an empirical investigation of alternative methodologies. Journal of Urban Economics, 35(2), 221-244.
GATZLAFF, D. H. & SMITH, M. T. (1993) The impact of the Miami metrorail on the value of residences near station locations. Land Economics, 69(1), 54-66.

References
310
GIBBONS, S. (2004) The cost of urban property crime. The Economic Journal, 114(November), 441-463.
GIBBONS, S. & MACHIN, S. (2003) Valuing English pimary schools. Journal of Urban Economics, 53(2), 197-219.
GIBBONS, S. & MACHIN, S. (2005) Valuing rail access using transport innovations. Journal of Urban Economics, 57(1), 148-169.
GISSING, A. (2002) Business in the Macleay commercial flood damage kempsey 2001. 42nd Annual NSW floodplain management conference. Kempsey.
GLYN-JONES, F. (2007) Barlby flood victim opens defence work. Accessed (2nd August 2007) Available from www.environment-agency.gov.uk/news
GOUGH, J. (2000) Perceptions of risk from natural hazards in two remote New Zealand communities. Australian Journal of Disaster and Trauma Studies, 2000(2), 1174-4707.
GREEN, C. & PENNING-ROWSELL, E. (2004) Flood insurance and government: "parasitic" and "symbiotic" relations. The Geneva Papers on risk and insurance, 29(3), 518-539.
GREEN, C., VAN DER VEEN, A., WIERSTRA, E. & PENNING-ROWSELL, E. C. (1994) Vulnerability refined: analysing full flood impacts IN PENNING-ROWSELL, E. C. & FORDHAM, M. (Eds.) Floods Across Europe. London, Middlesex University Press.
GROTHMANN, T. & REUSSWIG, F. (2006) People at risk of flooding: why some residents take precautionary action while others do not. Natural Hazards, 38(1-2), 101-120.
GRUNTFEST, E. (1995) Long term social and economic impacts of extreme floods. US - Italy research workshop on the Hydrometeorology, impacts, and management of extreme floods. Perugia (Italy).
HADLEY CENTRE (2003) Climate change - observations and predictions. Met Office
HAJAT, S., EBI, K. L., KOVATS, S., MENNE, B., EDWARDS, S. & HAINES, A. (2003) The human health consequences of flooding in Europe and the implications for public health: a review of the evidence. Applied Environmental Science and Public Health, 1(1), 13-21.
HALL, J. W., MEADOWCROFT, I. C., SAYERS, P., B. & BRAMLEY, M. E. (2003) Integrated Flood Risk Management in England and Wales. Natural Hazards Review, 4(3), 126-135.
HARRISON, D. M., SMERSH, G. T. & SCHWARTZ JR, A. L. (2001) Environmental determinants of housing prices: the impact of flood zone status. Journal of Real Estate Research, 21(1-2), 3-20.
HENDY, P. (2006) Carlisle events - the victims perspective. floodrepair network workshop on identification and dissemination of good practice. Sheffield Hallam University.
HENNEBERRY, J. (1998) Transport investment and house prices. Journal of property valuation and investment, 16(2), 144-158.
HERTIN, J., BERKHOUT, F., GANN, D. M. & BARLOW, J. (2003) Climate change and the UK house building sector: perceptions, impacts and adaptive capacity. Building Research and Information, 31(3-4), 278-290.
HISCOX (2006) Do your sums add up? Accessed (24th November 2006) Available from http://www.hiscox.com

References
311
HUBER, M. (2004) Insurability and regulatory reform: is the English flood insurance regime able to adapt to climate change. The Geneva Papers on risk and insurance, 29(2), 169-182.
HUGHES, J. (2000) Reduced: riverside home with sandbags thrown in. The Times, London Features p.12
HUMPHREYS, O. (2005) Havoc as the heavens open; villagers up trees as storm water rises. Evening Mail, Birmingham p.4
ICA (2001) Submission to the review of natural disaster relief and mitigation arrangements. Insurance Council of Australia
INSTITUTE OF HYDROLOGY (1999) Flood estimation handbook, Institute of Hydrology.
IPCC (2001) Climate change 2002: Impacts, adaptation and vulnerability. Summary for policy makers. World Meteorology Organisation
JACKSON, P. (2005) Vox prop: would you buy a house in a UK flood-risk area? The Independent, London Features p.2
JOBSON, J. D. (1991) Applied multivariate data analysis, Volume 1: Regression and experimental design, Springer-Verlag.
JONES, C., LEISHMAN, C. & WATKINS, C. (2004) Intra-urban migration and housing markets housing submarkets, theory and evidence. Housing Studies, 19(2), 269-283.
JOSEPH ROWNTREE FOUNDATION (1998) Access to home contents insurance for low-income households - findings. Joseph Rowntree Foundation
KELMAN, I. & SPENCE, R. (2004) An overview of flood actions on buildings. Engineering Geology, 73(3-4), 297-309.
KENNEY, S., POTTINGER, G., PLIMMER, F. & YASMIN, P. (2006) Flood risk and property, impacts on commercial and residential stakeholder's strategies. College of Estate Management
KETTERIDGE, A. M. & FORDHAM, M. (1998) Flood evacuation in two communities in Scotland, lessons from European research. International Journal of Mass Emergencies and Disasters, 16(2), 119-143.
KEYNOTE (2004) Direct insurance - house insurance. Keynote KREIBICH, H., THIEKEN, A., PETROW, T., M., M. & MERZ, B. (2005) Flood
loss reduction of private households due to building precautionary measures - lessons learned from the Elbe flood in August 2002. Natural Hazards and Earth System Sciences, 5(1), 117-126.
KUNREUTHER, H. (1974) Disaster insurance: a tool for hazard mitigation. The Journal of Risk and Insurance, 41(2), 288-303.
KUNREUTHER, H. & PAULY, M. (2004) Neglecting disaster: why don't people insure against large losses? Journal of Risk and Uncertainty, 28(1), 5-22.
LAKE, I. R., LOVETT, A. A., BATEMAN, I. J. & LANGFORD, I. H. (1998) Modelling environmental influences on property prices in an urban environment. Computing Environment and Urban Systems, 22(2), 121-136.
LAMBERT, P. (2006) Research on the impacts of speed drying. EPSRC flood repair network workshop on identification and facilitation of flood damage research. Sheffield.
LAMBLEY, D. & CORDERY, I. (1997) The effects of catastrophic flooding at Nyngan and some implications for emergency management. Australian Journal of Emergency Management, 12(2), 5-9.
References
312
LAMOND, J. & PROVERBS, D. (2006) Does the price impact of flooding fade away? Structural Survey, 24(5), 363-377.
LANCASTER, J., PREENE, M. & MARSHAL, C. (2004) Development and flood risk - Guidance for the construction industry. CP/102 Funders Report Construction Industry Research and Information Association
LAND REGISTRY (2007) House Prices. Accessed (November 2007) Available from http://www.landregistry.gov.uk/houseprices/
LEECH, D. & CAMPOS, E. (2003) Is comprehensive education really free? A case study of the effects of secondary school admissions policies on house prices in one local area. Journal of the Royal Statistical Society (a), 166(1), 235-154.
LEISHMAN, C. & WATKINS, C. (2002a) Estimating repeat sales price indices for British cities. Journal of Property Investment and Finance, 20(1), 36-58.
LEISHMAN, C. & WATKINS, C. (2002b) The estimation of house price indices based on repeat sales regression using Land Registry data. RICS education trust
LEWES FLOOD ACTION GROUP (2004) Survey results. Accessed (1st December 2004) Available from <http\\:www.lewes-flood-action.org.uk/insurance/surveyresults.html>.
LEWES MATTERS (2007) The Phoenix Quarter. Accessed (4th August 2007) Available from http://www.lewesmatters.co.uk/blogcategory/
LIM, S. & PAVLOU, M. (2007) An improved national house price index using land registry data. Volume 7, Number 11 RICS Research Paper Series RICS
LONGUEPEE, J. & ZUINEAU, B. (2001) L'Impact du Cout des inondations sur les valeurs immobilieres: une application de la methode des prix hedoniques a la basse vallee de la Canche. Revue du GRATICE, 19(numero special economie immobiliere), 143-166.
MACDONALD, D. N., MURDOCH, J. C. & WHITE, H. L. (1987) Uncertain hazards, insurance and consumer choice: evidence from housing markets. Land Economics, 63(4), 362 - 371.
MCCOMB, G., LANTZ, V., NASH, K. & RITTMASTER, R. (2006) International valuation databases: overview, methods and operational issues. Ecological Economics, 60(3), 461-472.
MEEN, G. (2005) Local housing markets and segregation in England. Economic Outlook, Jan, 11-17.
MERLO, A. & ORTALO-MAGNE, F. (2004) Bargaining over residential real estate: evidence from England. Journal of Urban Economics, 56(2), 192-216.
MERZ, B., KREIBICH, H., THIEKEN, A. & SCHMIDTKE, R. (2004) Estimation uncertainty of direct monetary flood damage to buildings. Natural Hazards and Earth System Sciences, 4(1), 153-163.
MICHEL-KERJAN, E. (2001) Insurance against natural disasters: do the French have the answer? strengths and limitations. 2001-007 Working paper Laboratoire d’économétrie, Ecole Polytechnique, Paris
MODCOCK, S. (2003) Home Insurance: Four ways to save money. Interactive Investor.
MONTZ, B. E. (1992) The effect of flooding on residential property values in three New Zealand communities. Disasters, 16(4), 283-298.

References
313
MONTZ, B. E. (1993) The hazard area disclosure in NZ, the impact on residential property values in 2 communities. Applied Geography, 13(3), 225-242.
MUIR WOOD, R., MILLER, S. & BOISSONADE, A. (2006) The Search for trends in a global catalogue of nrmalised weather-related catastrophe losses. Climate change and disaster losses workshop, understanding and attributing trends and projections. Hohenkammer, Germany.
MUNICH RE (2004a) Annual review: natural catastrophes 2003. Topics Geo Munchener Ruck
MUNICH RE (2004b) Flood risks. topics Munchener Ruck NAO (2001) Inland flood defence, report by the controller and auditor general. HC
299 National Audit Office NATIONAL FLOOD FORUM (NFF) (2006) National Flood Forum Home Page.
Accessed (March 2006) Available from http://www.floodforum.org.uk NETHERTON, C. (2006) PAS64. EPSRC flood repair network workshop on
identification and facilitation of flood damage research. Sheffield. NIELSEN, J. (2006) on the design of buildings in relation to climate change.
Proceedings of the WCABE conference. Birmingham. ODPM (2007) Residential long leaseholders, a guide to your rights and
responsibilities, ODPM publications. OECD (2003) Lessons learned in dealing with large-scale disasters. Organisation
for Economic Co-operation and Development OFFICE OF SCIENCE AND TECHNOLOGY (2003) Foresight future flooding ,
executive summary. flood and coastal defence project of the foresight programme
OLIVER, A. (2007) Flooding fright. New Civil Engineer. 13.09.2007 ed. ORFORD, S. (2002) Valuing locational externalities: a GIS and multilevel
modelling approach. Environment and Planning B, Planning and Design, 29(1), 105-127.
PAKLINA, N. (2003) Flood insurance. Organisation for Economic Cooperation and Development
PALMQUIST, R. B. (1982) Measuring environmental effects on property values without hedonic regressions. Journal of Urban Economics, 11, 333-347.
PENNING-ROWSELL, E. & GREEN, C. (2000) New insights into the appraisal of flood alleviation benefits: (1) Flood damage and flood loss information. Journal of the chartered Institution of water and environment management, 14(5), 354-362.
PENNING-ROWSELL, E. & PEERBOLTE, B. (1994) Concepts, policies and research. IN PENNING-ROWSELL, E. & FORDHAM, M. (Eds.) Floods across Europe: flood hazard assessment, modelling and management. London, Middlesex University Press.
PENNING-ROWSELL, E. & WILSON, T. (2006) Gauging the impact of natural hazards: the pattern and cost of emergency response during flood events. Transactions of the Institute of British Geographers, 31(2), 99-115.
PENNING-ROWSELL, E. C., CHATTERTON, J. & WILSON, T. (2005) The benefits of flood and coastal risk management, a handbook of assessment techniques, London, Middlesex University Press.

References
314
PENNINGTON, G., TOPHAM, N. & WARD, R. (1990) Aircraft noise and residential property values adjacent to Manchester International Airport. Journal of Transport Economics and Policy, 24(1), 49-59.
PIELKE, R. A. (2006) White paper prepared for the workshop. Climate change and disaster losses workshop, understanding and attributing trends and projections. Hohenkammer, Germany.
POOK, S. (2000) City rail links cut as flood chaos spreads. The Daily Telegraph, London News p.18
PRIEST, S. J., CLARK, M. J. & TREBY, E. J. (2005) Flood insurance: the challenge of the uninsured. Area, 37(3), 295-302.
PROVERBS, D. & SOETANTO, R. (2004) Flood damaged property: A guide to repair, Blackwell.
PUVACHAROEN, P. (2003) Assessment of social vulnerability to flood risk management. Department of Environmental Science and Technology. London, Imperial College of Science, Technology and Medicine.
PYNN, R. & LJUNG, G. M. (1999) Flood insurance: a survey of Grand Forks, North Dakota homowners. Applied Behavioural Science Review, 7(2), 171-184.
QIAN, Y. (2006) Factor analysis of disaster losses: China case study. Climate change and disaster losses workshop, understanding and attributing trends and projections. Hohenkammer, Germany.
REACHER, M., MCKENZIE, C., LANE, C., NICHOLS, T., KEDGE, I., IVERSON, A., HEPPLE, P., WALTER, T., LAXTON, C. & SIMPSON, J. (2004) Health impacts of flooding in Lewes: a comparison of gastrointestinal and other illness and mental health in flooded and non-flooded households. Communicable Diseases and Public Health, 7(1), 39-46.
REED, D. W. (2002) Reinforcing flood-risk estimation. Philosophical transactions of the Royal Society of London (A), 360, 1373-1387.
RICHARDSON, J., REILLY, J. & JONES, P. J. S. (2003) Community and public participation: risk communication and improving decision making in flood and coastal defence. DEFRA flood and coastal management conference. Keele University.
RIDKER, R. G. & HENNING, J. A. (1967) The determinants of residential property values with special reference to air pollution. The Review of Economics and Statistics, 49(2), 246-257.
ROSEN, S. (1974) Hedonic prices and implicit markets: product differentiation in pure competition. Journal of political economy, 82(1), 34-55.
RYLAND, H. G. (2000) A Piece of the puzzle: insurance industry perspective on mitigation. Natural Hazards Review, 11(1), 43-49.
SALTHOUSE, R. (2002) Lessons to be learned from the autumn 2000 flood disaster. Insurance Research and Practice, 17(1), 64-76.
SAMWINGA, V., PROVERBS, D. & HOMAN, J. (2004) Exploring the experience of UK homeowners in flood disasters. International construction research conference. Royal Institute of Chartered Surveyors.
SCHAEFFER, K. A. (1990) The effect of floodplain designation regulation on residential property values: a case study in North York Ontario. Canadian Water Resources Journal, 15(4), 1-14.

References
315
SCHWARZE, R. & WAGNER, G. G. (2004) In the aftermath of Dresden: new directions in German flood insurance. The Geneva Papers on risk and insurance, 29(2), 154-168.
SHABMAN, L. A. & DAMIANOS, D. I. (1976) Flood hazard effects on residential property values. Journal of the Water Resources Planning and Management Division, 102(1), 151-162.
SHABMAN, L. A. & STEPHENSON, K. (1996) Searching for the correct benefit estimate: empirical evidence for an alternative perspective. Land Economics, 72(4), 433-449.
SHAPIRO, E., F (2000) Residential properties. IN REES, W. H. & HAYWARD, R. E. H. (Eds.) Valuation: principles into practice. fifth ed. London, Estates Gazette.
SHARED INTELLIGENCE (2002) Newport Urban Regeneration Company, Designation Report. Shared Intelligence
SHAW, M. M. (2004) Group flood insurance program and flood insurance purchase decisions. International Journal of Mass Emergencies and Disasters, 22(2), 59-75.
SHILLING, J. D., SIRMANS, C. F. & BENJAMIN, J. D. (1989) Flood insurance, wealth redistribution and urban property values. Journal of Urban Economics, 26(1), 43-53.
SHINNICK, E. (1997) Measuring Irish housing quality. Journal of Economic Studies, 24(1/2), 95-119.
SHREWSBURY CHRONICLE (2007) Chronicle Property. Shrewsbury Chronicle, Shrewsbury
SHROPSHIRE COUNTY COUNCIL (2004) Flooding in Shrewsbury, joint action plan. Shropshire County Council
SHULTZ, S. D. & FRIDGEN, P. M. (2001) Floodplains and housing values, implications for flood mitigation projects. Journal of the American Water Resources Association, 37(3), 595-603.
SIMS, S. & DENT, P. (2005) High-voltage overhead power lines and property values: a residential study in the UK. Urban Studies, 42(4), 665-694.
SIRMANS, G. S., MACPHERSON, D. A. & ZIETZ, E. N. (2005) The composition of hedonic pricing models. Journal of Real Estate Literature, 13(1), 3-43.
SKANTZ, T. R. & STRICKLAND, T. H. (1987) House prices and a flood event: an empirical investigation of market efficiency. Journal of Real Estate Research, 2(2), 75-83.
SLOVIC, P. (1987) Perception of risk. Science, 236(4799), 280-286. SMITH, K. & TOBIN, G. A. (1979) Human adjustment to the flood hazard,
London, Longman. SOETANTO, R., PROVERBS, D. & NICHOLAS, J. (2002) Benchmarking
domestic property flood damage assessment. University of Wolverhampton report for LLoyds TSB insurance
SOUTH DERBYSHIRE DISTRICT COUNCIL (2005) Flood prevention work complete. Accessed (29th June 2006) Available from http://www.south-derbys.gov.uk/news/pressreleasearchive/flood.htm
SPENCE, R. (2004) Risk and regulation: can improved government action reduce the impacts of natural disasters? Building Research and Information, 32(5), 391-402.
References
316
SPEYRER, J. F. & RAJAS, W. R. (1991) Housing prices and flood risk, an examination using spline regression. Journal of real estate finance and Economics, 4, 395-407.
STEELE, M. & GOY, R. (1997) Short holds, the distributions of first and second sales, and bias in the repeat-sales index. Journal of real estate finance and Economics, 14(1-2), 133-154.
STERN, N. (2006) Stern Review: The Economics of Climate Change H M Treasury
STEVENSON, R. (2002) Esure axes insurance for property at risk of flooding. Money Marketing, 14
TAGG, A. (2006) Research on flood resilient construction. EPSRC flood repair network workshop on identification and facilitation of flood damage research. Sheffield.
TAPSELL, S. & TUNSTALL, S. (2003) An examination of the health effects of flooding in the United Kingdom. Journal of Meteorology, 28(283), 341-349.
THIEKEN, A., H., PETROW, T., KREIBICH, H. & MERZ, B. (2006) Insurability and mitigation of flood losses in private households in Germany. Risk Analysis, 26(2), 1-13.
THOMPSON, J. & FITZWILLIAMS, M. (2005) Carlisle cut off by floods as UK feels force of 128mph winds. The Independent on Sunday, p.2
THRUSH, D., BURNINGHAM, K. & FIELDING, J. (2005) Flood warning for vulnerable groups: a qualitative study. w5c-018/3 R&D technical report EA/DEFRA
TOBIN, G. A. & MONTZ, B. E. (1994) The flood hazard and dynamics of the urban residential land market. Water Resources Bulletin, 30(4), 673-685.
TOBIN, G. A. & MONTZ, B. E. (1997) The impacts of a second catastrophic flood on property values in Linda and Olivehurst, California. Quick response report 95 Department of Geography, University of Florida
TOBIN, G. A. & NEWTON, T. G. (1986) A theoretical framework of flood induced changes in urban land values. Water Resources Bulletin, 22(1), 67-71.
TROY, A. & ROMM, J. (2004) Assessing the price effects of flood hazard disclosure under the California natural hazard disclosure law (AB 1195). Journal of Environmental Planning and Management, 47(1), 137-162.
TUKEY (1977) Exploratory Data Analysis, Reading Ma, Addison-Wesley. TUNSTALL, S. M., JOHNSON, C. L. & PENNING-ROWSELL, E. C. (2004)
Flood hazard management in England and Wales: from land drainage to flood risk management. World congress on Natural Disaster Management.
UK CLIMATE IMPACTS PROGRAMME (UKCIP) (2007) UKCIP02 headline messages. UK Climate Impacts Programme
WABE, J. S. (1971) A study of house prices as a means of establishing the value of journey time, the rate of time preference and the valuation of some aspects of environment in the London metropolitan region. Applied Economics, 3, 247-255.
WANG, F. T. & ZORN, P. M. (1997) Estimating house price growth with repeat sales data: what's the aim of the game? Journal of Housing Economics, 6(2), 93-118.

References
317
WARREN, D. (2005) Nottingham flood alleviation scheme improvements - West Bridgford. Environment Agency Midlands Region
WARWICKSHIRE TRADING STANDARDS (1998) A Flood of Claims. Warwickshire Trading Standards Department
WATSON, D. S. & GETZ, M. (1981) Price theory and its uses, Boston, Houghton Mifflin.
WEARNE, S. H. (2002) River Ouse bank raising, Selby and Barlby, South Yorkshire. Managing urgent emergency projects, case report University of Manchester
WELSH CONSUMER COUNCIL (1992) In deep water - A study of consumer problems in Towyn and Kinmel Bay after the 1990 floods. Welsh Consumer Council
WERRITY, A., BLACK, A. R., DUCK, R., FINLINSON, B., THURSTON, N. & SHACKLEY, S. (2002) Climate change: flooding occurrences review. Scottish Executive Central Research Unit
WHEATER, H. S. (2002) Progress in and prospects for fluvial flood modelling. Philosophical transactions of the Royal Society of London (A), 360, 1409-1431.
WHICH? (2005) Buildings insurance: the cost of claiming. Accessed (1st July 2005) Available from http://www.which.co.uk/index.jsp/content/main/home.jsp
WHITTLE, J. (2005) Floods blight house prices. News and Star, Carlisle WILKINSON, R. K. (1973) House prices and the measurement of externalities. The
Economic journal, 83(329), 72-86. WILSON, I., PARIS, S., WARE, A. & JENKINS, D. (2002) Residental price
forecasting at national and regional levels. Real estate valuation trends and issues University of Glamorgan
WOKING BOROUGH COUNCIL (2006) Improvement plans for the Hoe Valley. Accessed (3rd August 2007) Available from http://www.woking.gov.uk/council/hoe_valley
WORRALL, S. J. (2004) Evaluation of temporary flood barriers February 2004 Flood - Severn Valley. Executive summary. Environment Agency
WYNN, P. (2005) Development control and flood risk: analysis of local planning authority and developer approaches to PPG25. Planning, Practice and Research, 20(3), 241-261.

Bibliography
318
BIBLIOGRAPHY
ABI (2002) renewing the partnership - how the insurance industry will work with others to improve protection against floods Accessed (23rd May 2005) Available from http://www.abi.org.uk/Display/File/78/Renewing_the_Partnership.doc
ABI (2003) Assessment of the cost and effect on future claims of installing flood damage resistant measures. Association of British Insurers.
ABI (2004) Review of planning policy guidance note 25: Development and flood risk. Association of British Insurers.
ABI (2005) The social value of general insurance. Association of British Insurers.
ABI (2005) building insurance for homeowners. Association of British Insurers.
ABI (2007) Summer floods 2007: learning the lessons. London, Association of British Insurers.
ADAIR, A., BERRY, J. N. & MCGREAL, W. S. (1996) Hedonic modelling, housing submarkets and residential valuation. Journal of Property Research, 13(1), 67-83.
ANAS, A. & JICK, E. S. (1984) Hedonic analysis of a housing market in disequilibrium. Journal of Urban Economics, 15(1), 87-106.
ARCHER, F. (2005) Trapped by rising water in an uninsurable home. The Daily Telegraph, London Your Money p.9
ARNELL, N. W. (2003) Relative effects of multi-decadal climatic variability and changes in the mean and variability of climate due to global warming: future streamflows in Britain. Journal of Hydrology, 270, 195-213.
ASHLEY, R., BLANKSBY, J., CHAPMAN, J. & ZHOU, J. (2007) Towards integrated approaches to reduce flood risk in urban areas. IN ASHLEY, R., GARVIN, S., PASCHE, E., VASSILOPOULOS, A. & ZEVENBERGEN, C. (Eds.) Advances in urban flood management. London, Taylor Francis.
ATTANASI, E. D. & KARLINGER, M. R. (1979) Risk preferences and flood insurance. American Journal of Agricultural Economics, 61(3), 490-495.
BARTIK, T. J. (1987) Estimating hedonic demand parameters with single market data: the problems caused by unobserved tastes. The Review of Economics and Statistics, 69(1), 178-180.
BARTOSOVA, A., CLARK, D. E., NOVOTNY, V. & TAYLOR, K. S. Using GIS to evaluate the effects of flood risk on residential property values. Milwaukee, Marquette University.
BATEMAN, I. J., DAY, B. H., GEORGIOU, S. & LAKE, I. R. (2006) The aggregation of environmental benefit values: welfare measures, distance decay and total WTP. Ecological Economics, 60(2), 450-460.
Bibliography
319
BBC (2005) What now for biscuit making in Carlisle? Accessed (5th March 2006) Available from http://www.bbc.co.uk/cumbria/content/articles/2005/01/27/mcvities_carlisle_flood_feature.shtml
BENNETT, J. (2002) Flooding: what impact on the housing market. Housing Finance. Council of Mortgage Lenders.
BENSON, E. D., HANSEN, J. L. & SCHWARTZ, A. L. (2000) Water views and residential property values. The Appraisal Journal 2000(July), 260-271.
BERON, K. J., MURDOCH, J. C., THAYER, M. A. & VIJVERBERG, W. P. M. An analysis of the housing market before and after the 1989 Loma Prieta Earthquake. Land Economics, 73(1), 101-113.
BIN, O., KRUSE, J. B. & LANDRY, C. E. (2006) Flood hazards, insurance rates and amenities: evidence from the coastal housing market. East Carolina University.
BLACK AND VEATCH (2001) Sussex Ouse 12th October flood report. Environment Agency.
BLONG, R. (2004) Residential building damage and natural perils: Australian examples and issues. Building Research and Information, 32(5), 379-390.
BOARDMAN, J. (2001) Flooding and the use of land. Town and Country Planning, April, 113.
BOASE, T. (2005) Apocalypse soon: build now mop up later? The Daily Telegraph, London February 19th 2005 property p.6
BOLITZER, B. & NETUSIL, N. R. (2000) The impact of open spaces on property values in Portland, Oregon. Journal of Environmental Management, 59, 185-193.
BOND, M., SEILER, V. & SEILER, M. (2002) Residential real estate prices - a room with a view. Journal of Real Estate Research, 23(1/2), 129-137.
BRAMLEY, M. E. & BOWKER, P. (2002) Improving local flood protection to property. Civil Engineering, 150(May), 49-54.
BRASINGTON, D. M. & HITE, D. (2005) Demand for environmental quality: a spatial hedonic analysis. Regional Science and Urban Economics, 35(1), 57-82.
BROOKSHIRE, D. S., THAYER, M. A., TSCHIRHART, J. & SCHULZE, W. D. (1985) A test of the expected utility model: evidence from earthquake risks. Journal of political economy, 93(2), 369-389.
BROUWER, R. & VAN EK, R. (2004) Integrated ecological, economic and social impact assessment of alternative flood control policies in the Netherlands. Ecological Economics, 50(1-2), 1-21.
BROWN, J. D. & DAMERY, S. L. (2002) Managing flood risk in the UK : towards and integration of social and technical perspectives. Transactions of the Institute of British Geographers, 27(4), 412-426.
BROWN, J. P., SONG, H. & MCGILLIVRAY, A. (1997) Forecasting UK house prices: a time varying coefficient approach. Economic Modelling, 14(4), 529-548.

Bibliography
320
BROWN, P. (2003) Dont use sandbags say flood researchers. The Guardian. 6th Sep 2003 ed. Manchester.
BROWNE, M. J. & HOYT, R. E. (2000) The demand for flood insurance: empirical evidence. Journal of Risk and Uncertainty, 20(3), 291-306.
CASE, B., POLLAKOWSKI, H. O. & WACHTER, S. M. (1991) On choosing among house price index methodologies. AREUEA Journal, 19(3), 286-307.
CATOVSKY, S. (2004) Boscastle and climate change: implications for insurance. Journal of Meteorology, 29(293), 28.
CAVUSGIL, S. T. & ELVEY-KIRK, L. A. (1998) Mail survey response behaviour. A conceptualization of motivating factors and an empirical study. European journal of marketing, 32(11/12), 1165-1192.
CHESHIRE, P. & SHEPPARD, S. (1995) On the price of land and the value of amenities. Economica, 62, 247-267.
CHESHIRE, P. & SHEPPARD, S. (1998) Estimating the demand for housing land and neighbourhood characteristics. Oxford Bulletin of Economics and Statistics, 60(3), 357-382.
CHIVERS, J. & FLORES, N. E. (2002) market failure in information: the national flood insurance program. Land Economics, 78(4), 515-521.
CLAPP, J. M., GIACOTTO, C. & TIRTIROGLU, D. (1991) Housing price indices based on all transactions compared to repeat subsamples. AREUEA, 19(3), 270-285.
CLARKE, D. E. & TIM, A. (1999) Spent nuclear fuel and residential property values: the influence of proximity, visual clues and public information. Papers in Regional Science, 78(4), 403-421.
COOK, S. & HOLLY, S. (2000) Statistical properties of UK house prices: an analysis of disaggregated vintages. Urban Studies, 37(11), 2045-2055.
COOPER, K. (2004) House prices in flood areas could fall 80%. The Sunday Times, London
CORREIA, F. N., FORDHAM, M., SARAIVA, M. D. G. & BERNADO, F. (1998) Flood hazard assessment and management: interface with the public. Water Resources Management, 12(3), 209-227.
CUBBIN, J. (1974) Price, quality and selling time in the housing market. Applied Economics, 6(3), 171-187.
DALE, L. (1999) Do property values rebound from environmental stigmas? Evidence from Dallas. Land Economics, 75(2), 311-26.
DATAMONITOR (2004) Insurance in the United Kingdom: industry profile. Datamonitor.
DATAMONITOR (2004) Non-life insurance in the United Knigdom. Datamonitor.
DE CHERNATONY, L. (1989) Achieving high response rates; a survey of postal research special interest group members. Cranfeld School of Management.

Bibliography
321
DEFRA (2002) Survey of public attitudes to quality of life and to the environment - 2001. Department for Environment, Food and Rural Affairs.
DEI-TUTU, V. A. (2002) Flood hazards, insurance and house prices - a hedonic property price analysis. MSc research paper. East Carolina University.
DELANEY, C. J. & SEWARD, A. J. (1991) An analysis of the relationship between price and variance for homogeneous housing stock. The Journal of Real Estate Research, 6(1), 99-111.
DLUGOLECKI, A. F. (2000) Climate change and the insurance industry. The Geneva Papers on risk and insurance, 25(4), 582 - 601.
DOLAN, L. (2004) House prices set to plummet in flood-prone areas. The Sunday Telegraph, London 26th Sept 2004 City p.1
DOWNES, S. (2005) Floods: insurers cut up rough. The Sunday Telegraph, London 6th Nov 2005 p.18
DU PLESSIS, C., IRURAH, D. K. & SCHOLES, R. J. (2003) The built environment and climate change in South Africa. Building Research and Information, 31(3-4), 240-256.
DURBIN, D. (2001) Managing natural catastrophe risks: the structure and dynamics of reinsurance. The Geneva Papers on risk and insurance, 26(2), 297-309.
EA (2004) What does the foresight report show? Accessed (13/8/2004) Available from http://www.environment-agency.gov.uk/subjects/flood/763964/763974/?version=1&lang=_e
EA (2005) Flood what you need to know Accessed (4th April) Available from http://www.environment-agency.gov.uk/subjects/flood
EA (2006) River Roding flood risk management strategy. strategic environmental assessment. Environment Agency (Thames).
ELLIOT, C. R. N. & LEGGETT, D. J. (2002) Reducing the impact of flooding - extemporary measures. Construction Industry Research and Information Association.
ENTEC (2005) Stategic flood risk assessment of East London. Entec UK limited.
FLYNN, J., SLOVIC, P. & KUNREUTHER, H. (2001) Risk, Media and Stigma. Understanding public challenges to modern science and technology, London, Earthscan Publications Ltd.
FORREST, D., GLEN, J. & WARD, B. (1992) Both sides of the track are wrong: a study of the effect of an urban railway system on the pattern of house prices. Salford papers in Economics. University of Salford.
FRAME, D. E. (1998) Housing, natural hazards and insurance. Journal of Urban Economics, 44(1), 93-109.
FREEMAN, P. & KUNREUTHER, H. (1997) Managing environmental risk through insurance, Boston, Kluwer Academic Publishers.
GARVIN, S., REID, J. & SCOTT, M. (2005) Standards for the repair of buildings following flooding. London, CIRIA.
GATZLAFF, D. H. (1998) Sample selection and biases in local house value indices. Journal of Urban Economics, 43(2), 199-222.

Bibliography
322
GEISSLER, T. R. (2006) Internet based flood risk assessment and retrofit. flows report.
GISSING, A. (2003) Flood action plans - making loss reduction more effective in the commercial sector. Australian Journal of Emergency Management, 18(3), 46-54.
GOODESS, C. M., HALL, J., BEST, M., BETTS, R., CABANTOUS, L., JONES, P. D., KILSBY, C. G., PEARMAN, A. & WALLACE, C. J. Climate scenarios and decision making under uncertainty. Built Environment, 33(1), 10-30.
GOODMAN, A. C. & THIBODEAU, T. G. (2003) Housing market segmentation and hedonic prediction accuracy. Journal of Housing Economics, 12(3), 181-201.
GRAVES, P., MURDOCH, J. C., THAYER, M. A. & WALDMAN, D. (1988) The robustness of hedonic price estimation: urban air quality. Land Economics, 64(3), 220-233.
GREEN, C. (2004) The evaluation of vulnerability to flooding. Disaster prevention and management, 13(4), 323-329.
GUTTERY, R. S., POE, S. L. & SIRMANS, C. F. (2004) An empirical investigation of federal wetlands regulation and flood delineation: implications for residential property owners. Journal of Real Estate Research, 26(3), 299-315.
HALL, J. W., EVANS, E. P., PENNING-ROWSELL, E. C., SAYERS, P., B., THORNE, C. R. & SAUL, A. (2003) Quantified scenarios analysis of drivers and impacts of changing flood risk in England and Wales: 2030-2100. Environmental Hazards, 5(3-4), 51-65.
HAMILTON, S. W. & SCHWANN, G. M. (1995) Do high voltage electric transmission lines affect property value? Land Economics, 71(4), 436-444.
HAQUE, C. E., KOLBA, M., MORTON, P. & QUINN, N. P. (2002) Public involvement in the Red River Basin management decisions and preparedness for the next flood. Environmental Hazards, 4(4), 87-104.
HAURIN, D. R. & HENDERSHOTT, P. H. (1991) House price indexes: issues and results. AREUEA, 19(3), 259-269.
HENDRIKS, D. (2005) Apportionment in property valuation: should we separate the inseparable? Journal of Property Investment and Finance, 23(5), 456-470.
HOLWAY, J. M. & BURBY, R. J. (1990) The effects of floodplain development controls on residential land values. Land Economics, 66(3), 259-271.
HWANG, S.-N. (2003) Environmental amenities and disamenities, and housing prices; using GIS techniques. Hazard Reduction and Recovery Center. Texas, Texas A&M University.
INMAN, P. (2005) So would you pay £40,000 to protect your home? The Guardian, London Guardian Money Pages 3
INSTITUTE FOR BUSINESS AND HOME SAFETY (IBHS) (2006) Water damage prevention for commercial buildings. IBHS.

Bibliography
323
JOBSON, J. D. (1991) Applied multivariate data analysis, Volume 1: Regression and experimental design, Springer-Verlag.
JOHNSON, C. L., TUNSTALL, S. M. & PENNING-ROWSELL, E. Crises as catalysts for adaptation: human response to major floods. End of Award Full Report. ESRC.
JOHNSON, C. L., TUNSTALL, S. M. & PENNING-ROWSELL, E. (2005) Floods as catalysts for policy change: historical lessons from England and Wales. International Journal of Water Resources Management, 21(4), 561-575.
JONES, C. & MACLENNAN, D. (1987) Building societies and credit rationing: an empirical examination of redlining. Urban Studies, 24(3), 205-216.
KAUKO, T. (2003) Residential property value and locational externalities. Journal of Property Investment and Finance, 21(3), 250-270.
KELLY, D. J. & GARVIN, S. L. (2007) European flood strategies in support of resilient buildings. IN ASHLEY, R., GARVIN, S., PASCHE, E., VASSILOPOULOS, A. & ZEVENBERGEN, C. (Eds.) Advances in urban flood management. London, Taylor Francis.
KELMAN, I. (2002) Physical flood vulnerability of residential properties in coastal Eastern England. Cambridge, University of Cambridge.
KIEL, K. A. (1995) Measuring the impact of the discovery and cleaning of identified hazardous waste sites on house values. Land Economics, 71(4), 428 - 435.
KNIGHT, J. R., HILL, R. C. & SIRMANS, C. F. (1993) Estimation of hedonic housing price models using nonsample information: a monte carlo study. Journal of Urban Economics, 34(3), 319-346.
KRIESEL, W. & LANDRY, C. (2004) Participation in the National Flood Insurance Program: an empirical analysis for coastal properties. The Journal of Risk and Insurance, 71(3), 405-420.
KUNREUTHER, H. (2001) Mitigation and financial risk management for natural hazards. The Geneva Papers on risk and insurance, 26(2), 277-296.
LARSSON, N. (2003) Adapting to climate change in Canada. Building Research and Information, 31(3-4), 231-239.
LASKA, S. B. (1986) Involving homeowners in flood mitigation. APA Journal, 52(4), 452-466.
LAVE, T. R. & LAVE, L. B. Public Perception of the Risks of Floods: Implications for Communication. Risk Analysis, 11(2), 255-267.
LISO, K. R., AANDAHL, G., ERIKSEN, S. & ALFSEN, K. H. (2003) preparing for climate change impacts in Norway's built environment. Building Research and Information, 31(3-4), 200-209.
LOWE, R. (2003) Preparing the built environment for climate change. Building Research and Information, 31(3/4), 195-199.
LUTTIK, J. (2000) The value of trees, water and open space as reflected by house prices in the Netherlands. Landscape and Urban Planning, 48(3-4), 161-167.
MARK, J. H. (1983) An empirical examination of the stability of housing price equations over time. AREUEA, 11(3), 397-415.

Bibliography
324
MACERLEAN, N. (2005) Hoping to be home and dry next time. The Observer, London Observer Cash Pages 20
MILLS, E. (2003) Climate change, insurance and the buildings sector:technological synergisms beween adaptation and mitigation. Building Research and Information, 31(3-4), 257-277.
MILLS, E. (2005) Insurance in a climate of change. Science, 309(5737), 1040-1044.
MILNE, J. (2002) Flood protection: a public private partnership. Insurance Trends, July, 1-9.
MILON, J. W., GRESSEL, J. & MULKEY, D. (1984) Hedonic amenity valuation and functional form specification. Land Economics, 60(4), 378-387.
MING, Y. S. & HIAN, C. C. (2005) Obstruction of view and its impact on residential apartment prices. Pacific rim property research journal, 11(3), 299-315.
MONTI, A. (2002) Environmental risks and insurance - a comparative analysis of the role of insurance in the management of environment-related risks. Organisation for Economic Cooperation and Development.
MONTZ, B. E. & GRUNTFEST, E. (2002) Flash flood mitigation: recommendations for research and applications. Environmental Hazards, 4(1), 15-22.
MUCKLESTON, K. W. (1983) The impact of floodplain regulations on residential land values in Oregon. Water Resources Bulletin, 19(1), 1-7.
MUNRO, M. & DUNCAN, M. Intra-urban changes in housing prices : Glasgow 1972-83. Housing Studies, 2(2), 65-81.
NEWPORT CITY COUNCIL (2004) Developing in Flood Risk Areas. Inquiry Topic Paper. Newport, Newport City Council.
NICHOLAS, J. & PROVERBS, D. (2002) Benchmarking the assessment of flood damaged domestic properties. Royal Institute of Chartered Surveyors.
NICHOLLS, R. J. & LOWE, J. A. (2004) Benefits of mitigation of climate change for coastal areas. Global Environmental Change Part A, 14(3), 229-244.
NIEMEYER, S., PETTS, J., HOBSON, K. & GLENN, M. (2004) Understanding thresholds in human behaviour and responses to rapid climate change. University of Birmingham.
NORFOLK COUNTY COUNCIL (2005) Residential, low elevation infrastructure project, Norfolk 2005. WP2 Flows report.
NORWICH UNION (2005) Home insurance Accessed (25th May 2005) Available from <http://www.norwichunion.com/home-insurance/index.htm>
ODPM (2003) Preparing for floods - interim guidance for improving the flood resistance of domestic and small business properties. Office of the Deputy Prime Minister.
OLIVER, A. (2007) Flooding fright. New Civil Engineer. 13.09.2007 ed.

Bibliography
325
OSBORN, A. (2003) Dutch float solution to housing crisis: firm in Netherlands plans to build homes, roads and even greenhouses on water The Guardian, Manchester Guardian Foreign Pages 18
PAGE, E. (2005) Landlords hunt for cover. Estates Gazette, 501, 86-89. PAIN, N. & WESTAWAT, P. (1997) Modelling structural change in the UK
housing market: a comparison of alternative house price models. Economic Modelling, 14(4), 587-610.
PALMQUIST, R. B., ROKA, F. M. & VUKINA, T. (1997) Hog operations, environmental effects and residential property values. Land Economics, 73(1), 114-124.
PATERSON, R. W. & BOYLE, K. J. (2002) Out of sight , out of mind? Using GIS to incorporate visibility in hedonic property value models. Land Economics, 78(3), 417-425.
PENNING-ROWSELL, E. (2001) Flooding and planning - conflict and confusion. Town and Country Planning, 70(4), 108-110.
PETTS, J., HOMAN, J., BREAKWELL, G. & BARNETT, J. (2002) Understanding public perception of risk: report of an environment agency workshop. Technical Report. Environment Agency.
PITT, M. (2007) The Pitt Review. London, Cabinet Office. POWE, N. A., GARROD, G. D., BRUNSDON, C. F. & WILLIS, K. G.
(1997) Using a geographic information system to estimate an hedonic price model of the benefits of woodland access. Forestry, 70(2), 139-149.
PROSSER, D. (2005) Flood risk homes can still be insured. The Independent, London News 2
RADCLIFFE, G. E. J. (1985) Some evidence on the intertemporal stability of hedonic price functions. Land Economics, 61(4), 445-451.
RETTGER, M. J. & BOISVERT, R. N. (1979) Flood insurance or disaster loans: an economic evaluation. American Journal of Agricultural Economics, 61(3), 496-505.
RMS (2000) UK floods, October 13-14 2000. Risk Management Solutions. RMS (2001) UK river flood, risk assessment models. Risk Management
Solutions. RMS (2005) Natural hazard risk Accessed (7th December 2006) Available
from http://www.rms.com/Catastrophe/Models/United_Kingdom.asp SANDERS, C. H. & PHILLIPSON, M. C. (2003) UK adaptation strategy
and technical measures: the impacts of climate change on buildings. Building Research and Information, 31(3-4), 210-221.
SCHIPPER, Y., NIJAMP, P. & PIET, R. (1998) Why do aircraft noise values differ? a meta-analysis. Journal of Air Transport Management, 4(2), 117-124.
SEPA (2001) Flooding: a SEPA view. SEPA view. SIMONS, R. A., BOWEN, W. & SEMENTELLI, A. The effect of
underground storage tanks on residential property values in Cuyahoga county, Ohio. Journal of Real Estate Research, 14(1/2), 30-42.

Bibliography
326
SIMS, J. H. & BAUMANN, D. D. (1987) The adoption of residential flood mitigation measures. What price success? Economic Geography, 63(3), 259-273.
SIRMANS, C. F., TURNBULL, G. K. & DOMBROW, J. (1995) Quick house sales: seller mistake or luck? Journal of Housing Economics, 4(3), 230-243.
SMITH, V. K., DESVOUGES, W. H., JOHNSON, F. R. & ANN, F. (1989) Can public information programs affect risk perceptions? Journal of policy analysis and management, 9(1), 41-60.
SPLASH, C. L. & VATN, A. (2006) Transferring environmental value estimates: issues and alternatives. Ecological Economics, 60(3), 379 388.
STEVENSON, S. (2004) New empirical evidence on heteroscedascity in hedonic housing models. Journal of Housing Economics, 13(2), 136-153.
THROUPE, R., FREITAG, B. & MONTGOMERY, R. (2002) A reconnaissance study on the market impacts on elevated homes in known floodplains. City of Snoqualmie Case Study. Snoqualmie, City of Snoqualmie.
TOL, R. S. J. (1998) Climate change and insurance: a critical appraisal. Energy Policy, 26(3), 257-262.
TREBY, E. J., CLARK, M. J. & PRIEST, S. J. (2006) Confronting flood risk: implications for insurance and risk transfer. Journal of Environmental Management, 81(4), 351-359.
TUCKER, M. (1997) Climate change and the insurance industry: the cost of increased risk and the impetus for action. Ecological Economics, 22(2), 85-96.
WALLACE, A. (2004) Understanding local housing markets? The need for a complementary institutional approach. York, University of York.
WEBB, J. D. C. (2004) Historical intense rainfall events in South West England. Journal of Meteorology, 29(293), 29.
WERRITY, A., HOUSTON, D., BALL, T., TAVENDALE, A. & BLACK, A. R. (2007) Exploring the social impacts of flood risk and flooding in Scotland. Research Findings. Social Research Environment Group, University of Dundee.
WHITE, I. & HOWE, J. (2002) Flooding and the role of planning in England and Wales: a critical review. Journal of Environmental Planning and Management, 45(5), 735-745.
WILKINS, B. (2001) Towns in flood. Town and Country Planning, April, 114-115.
WILSON, S., LTD, R. A. P. A., JONES, P. & SHEATE, W. (2004) Community and public participation: risk communication and improving decision-making in flood and coastal defence. R&D technical report. Environment Agency/ DEFRA.
WONG, K.-K. & ZHAO, X. (2001) Living with floods: victims' perceptions in Beijiang, Guangdong, China. Area, 33(2), 190-201.

Bibliography
327
WORDSWORTH, P. & BITHELL, D. (2004) Flooding in buildings: assessment, limitation and rehabilitation. Structural Survey, 22(2), 105-109.
WORK, P. A., SPENCER, M. R. J. & OSBORNE, R. (1999) Flood retrofit of coastal residential structures: outer banks, North Carolina. Journal of Water Resources Planning and Management, 125(2), 88-93.
YEO, S. Effects of disclosure of flood-liability on residential property values. Natural Hazards Research Centre, Macquarie University.
YUZURU, M. & ABE, H. (1994) Measuring the effects of a flood control project: hedonic land price approach. Journal of Environmental Management, 42(4), 389-401.
ZIKMUND, W. G. (1982) Exploring Marketing Research, Fort Worth, Texas, Dryden Press.
ZIMMERMAN, R. (1979) The effect of flood plain location on property values: three towns in northeastern New Jersey. Water Resources Bulletin, 15(6), 1653-1665.

Appendices
328
APPENDIX A : INSURANCE QUESTIONNAIRE AND
COVERING LETTER
FLOOD INSURANCE QUESTIONNAIRE
This questionnaire is divided into six sections. For your convenience most of the questions only require ticks in the relevant boxes. In some cases there are spaces to fill in additional information and exact amounts if known. If you have your insurance policy documents to hand please use them to help you find the answers to section 3 and 4. An event is considered a flood if water enters your property from outside.
Section 1: Questions about you and your household
Age 18-39 40-64 65-74 75+ Type of property ground
floor flat
flat not on ground floor.
terraced semi-
detached detached semi-
detached bungalow
detached bungalow
Who owns the property
owned with mortgage
owned outright
rented from private landlord
rented from housing association
rented from Local Authority
other
Number of storeys 1 2 3 4+ Age of property pre 1920 1920-1945 1946-1979 post 1980 Number of bedrooms 1 2 3 4+ How long have you lived in your current home?
less than 2 years.
2-5 years 6-10 years, more than 10 years
Section 2: Questions about your property’s flood risk and flooding history
Is your property in a flood risk area? no yes If yes, were you aware of the risk before you purchased it?
not at all aware
somewhat aware
fully aware
Has your property flooded during your residence?
never
once
twice
up to 5 times
more than 5 times
If you purchased your home in the last 6 years, what was the condition in which you bought it?
It had just been flooded and needed a lot of work.
It needed modernising or some structural work.
about average, just needing a few changes or redecoration.
very good condition, recently renovated.
What was the depth of flooding during the most recent incident?
basement/ outbuildings only
between ground level and up to 1m
above 1m and below 2m
above 2m
How long did the water remain in the property?
less than 1 hour
1-3 hours 3-24 hours over 24 hours
Did you take avoiding action in advance of first flooding?
removed belongings to safety
installed temporary barriers eg. sandbags or door boards
installed permanent defences to your property eg. skirts or pumps.
installed resilient fittings and furniture
As a result of flooding and reinstatement. How has the condition of your property changed?
much worse than before
slightly worse than before
about the same as before
better than before

Appendices
329
Section 3: Questions about the sort of insurance you have on your property What sort of insurance do you have? none
buildings insurance only
contents insurance only
both building and contents
If you have both buildings and contents insurance, are your policies
with different insurers
with same insurers but separate policies
combined policy
Which flood mitigation measures do you have in place? (tick all that apply)
registered for flood warnings
installed resilient fittings and furniture
purchased temporary defences
installed permanent defences to your property eg. Skirts or pumps
What is the name of your present insurer for buildings insurance
What is the name of your present insurer for contents insurance?
How long have you been insured with your present insurer?
less than a year
1-3 years
4-6 years
longer than 6 years
If you do not have insurance, please tell us why (tick the one that most applies) buildings contents Insurance is a waste of money I intend to arrange insurance but have not yet done so My landlord arranges the insurance I would like insurance but cannot afford it I had insurance but my insurer put the price up too high Insurance was refused due to flood risk Insurance was refused for some other reason Other reason please specify Section 4: Questions about the cost of your insurance and claims history (If you have no insurance please go on to section 6). Amount paid for your buildings policy. (If you have a combined policy enter the amounts under buildings and leave the contents question blank.)
Please enter amount (please enter approximate amount if exact amount is not known) £
Amount paid for your contents policy
Please enter amount £
Amount of excess on your buildings policy. (If you have different excesses for different risks please state the excess relating to flood risk.)
Please enter amount £
Amount of excess on your contents policy.
Please enter amount £

Appendices
330
Are floods excluded from your policy? no yes don’t know
Have you made an insurance claim for flooding on this property in the last 6 years?
no once more than once
Have you made any other claim on your property insurance in the last 6 years?
no once more than once
Did your premium or excess increase by a large amount as a direct result of making a flood claim?
Yes
No
insurance refused
How much was the cost of your claim for buildings? (Use your largest flood claim if more than one)
please enter amount £
How much was your claim for contents? (Use your largest flood claim if more than one)
please enter amount £
Section 5: Questions about the way you chose your insurance If you purchased your home in the last six years, please answer the next set of questions about the insurance you took out when you bought your home.
Did you experience difficulty in insuring your new home because it was at risk of flood?
no yes, a little.
yes quite a lot.
Did you have to pay more for your premium, have high excess or accept exclusions due to flood risk?
no yes don’t Know.
If you had to pay more, have high excess or accepted exclusions, when did you discover this problem?
before making an offer
after offer but before completion
after completion
How did you choose your current policies? Tick the one that most applies
buildings contents My insurance was set up by my mortgage lender I used a broker I phoned a few companies for quotes I looked on the internet for quotes I used the phone and the internet to search for quotes It was recommended by a friend/family/neighbour It was recommended by an adviser/bank manager etc. I chose a company I trust. The previous owners of the house recommended their insurer. Due to flood risk, I took over the existing policy on the property. My property is insured in a block policy by the leaseholder. Only this company would insure my property. A salesman approached me and the quote seemed very good. Other please state

Appendices
331
Section 6: Have you experienced any of the following when renewing insurance or requesting quotes for insurance during the last 6 years. Tick all that apply buildings contents A significant increase in premium A significant increase in excess Floods excluded from the policy A significant decrease in premium Refused a quote due to flood risk Refused renewal due to flood risk Required to provide a letter from the Environment Agency Required to get a survey of flood risk Had to shop around a lot to get an affordable quote Had to use a broker to get an affordable quote Had to install/buy flood protection measures to get cover Had to install resilient fixtures and fittings to get cover Other please specify
Use this space to write more about your experience. Please include any comments or views you may have about your insurance or flooding history that you could not put elsewhere on the form. Continue on a separate sheet if necessary.
Thank you for completing the questionnaire. Please send it back to us in the prepaid envelope. Data will be handled in confidence by the University of Wolverhampton and not passed on to any third party

Appendices
332
Dear Householder,
You have been sent this questionnaire as part of an investigation into how flooding of people’s homes affects their insurance. Please do not be concerned, receiving this questionnaire does not mean that your home is at risk of flooding. The questionnaire is being sent to a number of homes, some of which will have a history of floods and some will not. This is an independent study into the increased cost of insurance for flooded houses and has not been sponsored by insurers. The information you give will be held completely confidentially by the University of Wolverhampton and will not be passed on to any third parties. The information will not be used to send you any junk mail or to sell you insurance policies. Answering this survey will not directly affect your insurance cover in any way.
If you have been flooded or are at risk, then you probably are aware how important flood insurance can be. You might also be aware of changes in the way insurance companies are dealing with flood-prone properties. This questionnaire survey is designed to collect the real experience of the owners of homes at risk. We hope to be able to discover how much more it costs to insure flood-risk properties and how the cost might be reduced by, for example, registering for floodline warnings direct. If you have never been flooded and are not likely to be, your information will still be very important to the study. Better understanding of flood insurance will help keep the cost of insurance down for everyone. We need your response to compare to the flooded group. Please take time to complete the enclosed questionnaire and return it in the prepaid envelope. It should not take more than fifteen minutes of your time. If you have any questions about the study you can call the University of Wolverhampton School of Engineering on (01902) 518530, email [email protected] or write to the above address.
Summary results of the survey will be published on the Government sponsored flood repair network website at www.floodrepair.net in early 2007 but will not contain any individual details. You can access the website now to see a copy of the questionnaire and some useful flooding links. Thank you very much for helping with this important study Sincerely Professor David Proverbs

Appendices
333
APPENDIX B: EXAMPLE OF DATA EXPLORATION
AND MODEL DIAGNOSTICS FOR INDIVIDUAL
SITE INDEX MODELS – BEWDLEY
Distribution of price of first sale
PRICE_1
850000.0
800000.0
750000.0
700000.0
650000.0
600000.0
550000.0
500000.0
450000.0
400000.0
350000.0
300000.0
250000.0
200000.0
150000.0
100000.0
50000.0
120
100
80
60
40
20
0
Std. Dev = 80943.89 Mean = 126166.2
N = 222.00
Distribution of price of second sale
PRICE_2
1000000.0
950000.0
900000.0
850000.0
800000.0
750000.0
700000.0
650000.0
600000.0
550000.0
500000.0
450000.0
400000.0
350000.0
300000.0
250000.0
200000.0
150000.0
100000.0
50000.0
100
80
60
40
20
0
Std. Dev = 107680.1 Mean = 179916.7N = 222.00
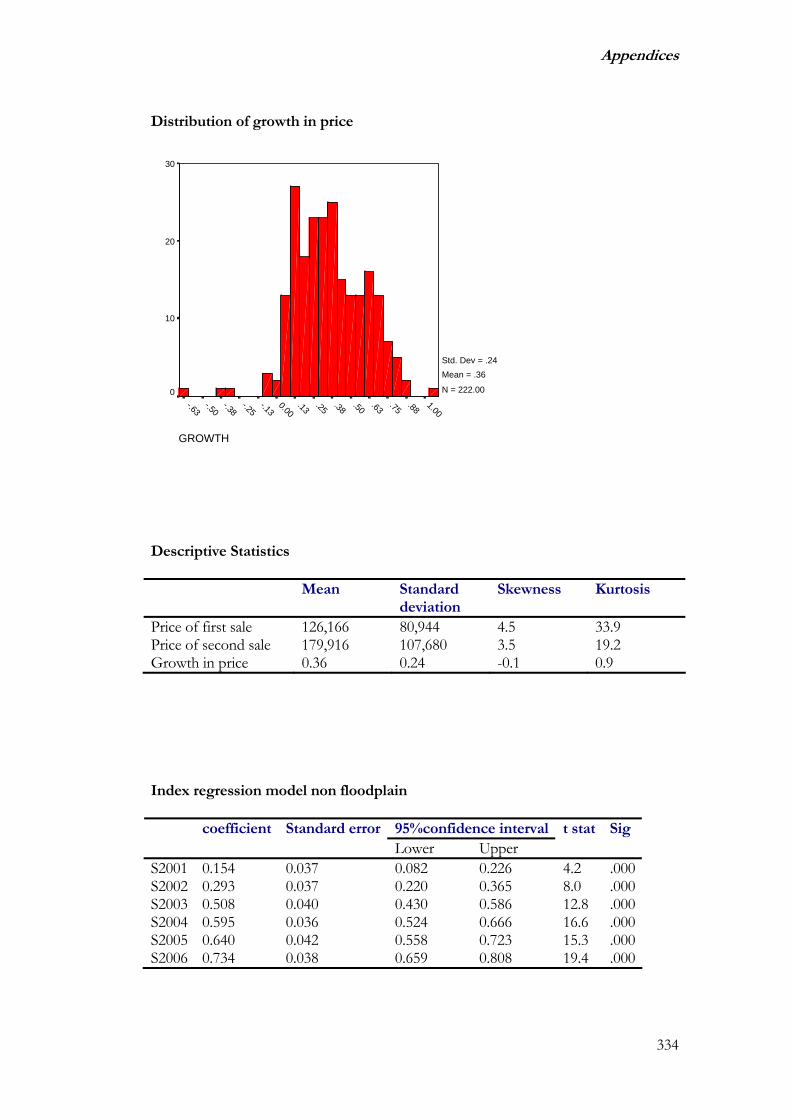
Appendices
334
Distribution of growth in price
GROWTH
1.00.88.75.63.50.38.25.130.00
-.13-.25
-.38-.50
-.63
30
20
10
0
Std. Dev = .24 Mean = .36
N = 222.00
Descriptive Statistics
Mean Standard deviation
Skewness Kurtosis
Price of first sale 126,166 80,944 4.5 33.9 Price of second sale 179,916 107,680 3.5 19.2 Growth in price 0.36 0.24 -0.1 0.9
Index regression model non floodplain
95%confidence interval coefficient Standard errorLower Upper
t stat Sig
S2001 0.154 0.037 0.082 0.226 4.2 .000 S2002 0.293 0.037 0.220 0.365 8.0 .000 S2003 0.508 0.040 0.430 0.586 12.8 .000 S2004 0.595 0.036 0.524 0.666 16.6 .000 S2005 0.640 0.042 0.558 0.723 15.3 .000 S2006 0.734 0.038 0.659 0.808 19.4 .000

Appendices
335
ANOVA
Distribution of model residuals
Regression Standardized Residual
5.504.50
3.502.50
1.50.50-.50
-1.50-2.50
-3.50-4.50
Histogram of Selected Cases
Dependent Variable: GROWTH
Freq
uenc
y
60
50
40
30
20
10
0
Std. Dev = .98 Mean = .05
N = 183.00
ANOVAc,d,e
27.947 6 4.658 148.363 .000a
5.557 177 3.139E-0233.503b 183
RegressionResidualTotal
Model1
Sum ofSquares df Mean Square F Sig.
Predictors: S2006, S2005, S2004, S2003, S2002, S2001a.
This total sum of squares is not corrected for the constant because the constant iszero for regression through the origin.
b.
Dependent Variable: GROWTHc.
Linear Regression through the Origind.
Selecting only cases for which FZ1000 = .00e.

Appendices
336
Index regression model floodplain
95%confidence interval coefficient Standard errorLower Upper
t stat Sig
S2001 -0.091 0.066 -0.224 0.043 -1.4 .178 S2002 0.313 0.085 0.140 0.485 3.7 .001 S2003 0.307 0.068 0.168 0.446 4.5 .000 S2004 0.543 0.074 0.393 0.692 7.4 .000 S2005 0.641 0.087 0.464 0.818 7.4 .000 S2006 0.709 0.102 0.503 0.916 7.0 .000
ANOVA
Index regression model total
95%confidence interval coefficient Standard errorLower Upper
t stat Sig
S2001 0.097 0.032 0.033 0.161 3.0 .000 S2002 0.265 0.032 0.199 0.331 8.0 .000 S2003 0.451 0.035 0.382 0.519 13.0 .000 S2004 0.564 0.032 0.501 0.628 17.5 .000 S2005 0.620 0.038 0.545 0.695 16.3 .000 S2006 0.697 0.035 0.628 0.766 19.9 .000
ANOVAc,d,e
6.397 6 1.066 29.162 .000a
1.206 33 3.656E-027.603b 39
RegressionResidualTotal
Model1
Sum ofSquares df Mean Square F Sig.
Predictors: S2006, S2004, S2005, S2001, S2002, S2003a.
This total sum of squares is not corrected for the constant because the constant iszero for regression through the origin.
b.
Dependent Variable: GROWTHc.
Linear Regression through the Origind.
Selecting only cases for which FZ1000 = 1.00e.
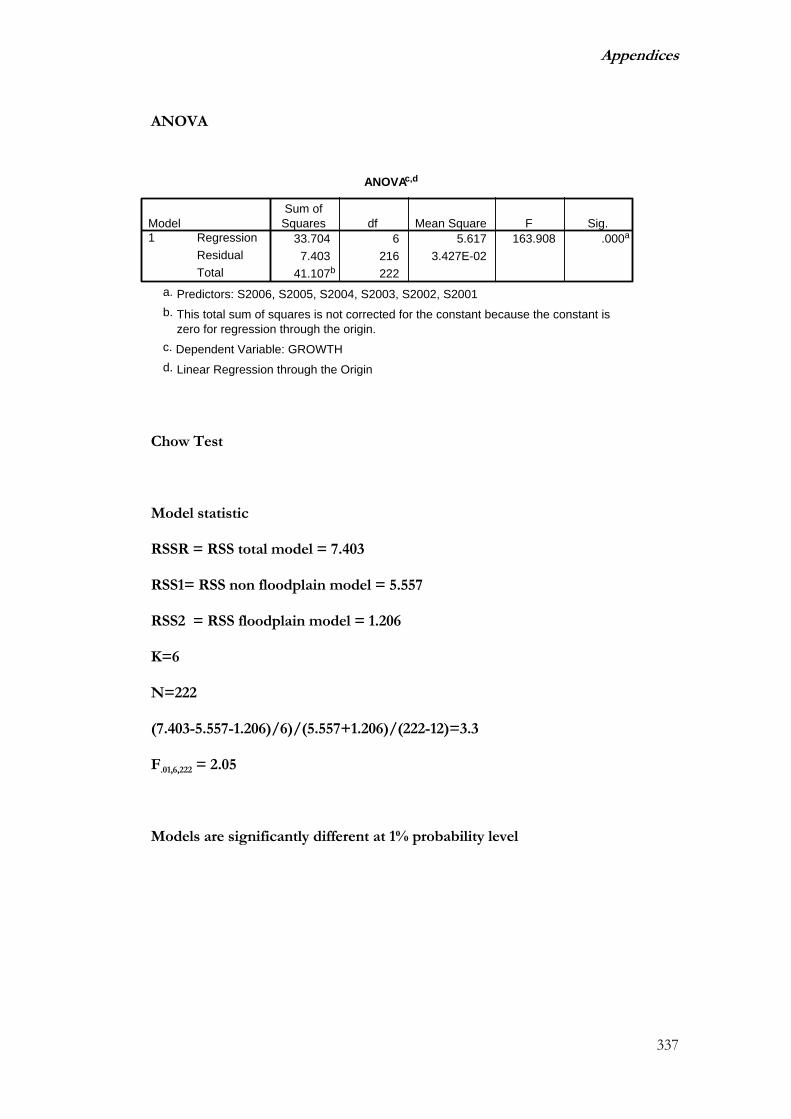
Appendices
337
ANOVA
Chow Test
Model statistic
RSSR = RSS total model = 7.403
RSS1= RSS non floodplain model = 5.557
RSS2 = RSS floodplain model = 1.206
K=6
N=222
(7.403-5.557-1.206)/6)/(5.557+1.206)/(222-12)=3.3
F.01,6,222 = 2.05
Models are significantly different at 1% probability level
ANOVAc,d
33.704 6 5.617 163.908 .000a
7.403 216 3.427E-0241.107b 222
RegressionResidualTotal
Model1
Sum ofSquares df Mean Square F Sig.
Predictors: S2006, S2005, S2004, S2003, S2002, S2001a.
This total sum of squares is not corrected for the constant because the constant iszero for regression through the origin.
b.
Dependent Variable: GROWTHc.
Linear Regression through the Origind.

Appendices
338
APPENDIX C : CORRELATION OF QUESTIONNAIRE RESPONSES
Correlations
1.000 -.098* .060 .027 .408** -.083 -.198** .111*. .037 .195 .564 .000 .099 .002 .023
358 351 349 343 355 343 201 337-.098* 1.000 -.193** .277** -.011 .222** .080 .107*.037 . .000 .000 .805 .000 .186 .027351 383 373 367 378 366 217 359
.060 -.193** 1.000 -.065 -.058 -.098* -.130* -.019
.195 .000 . .156 .198 .044 .033 .699349 373 378 362 373 362 215 356
.027 .277** -.065 1.000 .188** .079 -.009 .058
.564 .000 .156 . .000 .108 .884 .229343 367 362 373 371 356 215 350
.408** -.011 -.058 .188** 1.000 -.062 -.427** .223**
.000 .805 .198 .000 . .199 .000 .000355 378 373 371 385 367 220 362
-.083 .222** -.098* .079 -.062 1.000 .046 .312**.099 .000 .044 .108 .199 . .480 .000343 366 362 356 367 373 216 351
-.198** .080 -.130* -.009 -.427** .046 1.000 -.175**.002 .186 .033 .884 .000 .480 . .004201 217 215 215 220 216 220 217
.111* .107* -.019 .058 .223** .312** -.175** 1.000
.023 .027 .699 .229 .000 .000 .004 .337 359 356 350 362 351 217 367
Correlation CoefficientSig. (2-tailed)NCorrelation CoefficientSig. (2-tailed)NCorrelation CoefficientSig. (2-tailed)NCorrelation CoefficientSig. (2-tailed)NCorrelation CoefficientSig. (2-tailed)NCorrelation CoefficientSig. (2-tailed)NCorrelation CoefficientSig. (2-tailed)NCorrelation CoefficientSig. (2-tailed)N
AGE
STOREY
PROPAGE
BEDS
RESID
FLOODRIS
AWARE
FLOODED
Kendall's tau_bAGE STOREY PROPAGE BEDS RESID FLOODRIS AWARE FLOODED
Correlation is significant at the .05 level (2-tailed).*.
Correlation is significant at the .01 level (2-tailed).**.

Appendices
339
Correlations
1.000 .312** .182* .207* .145 .330** .237** .047 .085 -.096 .006. .000 .023 .022 .136 .000 .000 .360 .101 .336 .910
373 351 138 110 101 373 373 373 373 97 321.312** 1.000 .012 .132 .190* .689** .414** .168** .214** .103 .187**.000 . .879 .115 .033 .000 .000 .001 .000 .266 .000351 367 139 109 102 367 367 367 367 96 318
.182* .012 1.000 -.187 -.023 .110 -.022 -.142 .107 -.443** -.004
.023 .879 . .179 .879 .165 .780 .072 .176 .008 .963138 139 143 42 35 143 143 143 143 32 121
.207* .132 -.187 1.000 .106 -.055 -.096 -.101 -.046 -.017 .177*
.022 .115 .179 . .248 .539 .284 .262 .607 .864 .048110 109 42 111 101 111 111 111 111 92 98
.145 .190* -.023 .106 1.000 .028 .237* -.041 .139 -.040 -.054
.136 .033 .879 .248 . .772 .014 .670 .149 .695 .570101 102 35 101 102 102 102 102 102 89 92
.330** .689** .110 -.055 .028 1.000 .466** .121* .212** -.020 .180**
.000 .000 .165 .539 .772 . .000 .017 .000 .842 .000373 367 143 111 102 392 392 392 392 98 337
.237** .414** -.022 -.096 .237* .466** 1.000 .142** .262** -.118 .082
.000 .000 .780 .284 .014 .000 . .005 .000 .234 .102373 367 143 111 102 392 392 392 392 98 337
.047 .168** -.142 -.101 -.041 .121* .142** 1.000 -.012 .074 .092
.360 .001 .072 .262 .670 .017 .005 . .819 .456 .068373 367 143 111 102 392 392 392 392 98 337
.085 .214** .107 -.046 .139 .212** .262** -.012 1.000 -.021 .058
.101 .000 .176 .607 .149 .000 .000 .819 . .836 .245373 367 143 111 102 392 392 392 392 98 337
-.096 .103 -.443** -.017 -.040 -.020 -.118 .074 -.021 1.000 .119.336 .266 .008 .864 .695 .842 .234 .456 .836 . .231
97 96 32 92 89 98 98 98 98 98 85.006 .187** -.004 .177* -.054 .180** .082 .092 .058 .119 1.000.910 .000 .963 .048 .570 .000 .102 .068 .245 .231 .321 318 121 98 92 337 337 337 337 85 337
Correlation CoefficientSig. (2-tailed)NCorrelation CoefficientSig. (2-tailed)NCorrelation CoefficientSig. (2-tailed)NCorrelation CoefficientSig. (2-tailed)NCorrelation CoefficientSig. (2-tailed)NCorrelation CoefficientSig. (2-tailed)NCorrelation CoefficientSig. (2-tailed)NCorrelation CoefficientSig. (2-tailed)NCorrelation CoefficientSig. (2-tailed)NCorrelation CoefficientSig. (2-tailed)NCorrelation CoefficientSig. (2-tailed)N
FLOODRIS
FLOODED
PURCOND
DEPTH
DURATION
REMOVED
TEMPMEAS
PERMMEAS
RESILFIT
POSTCOND
LENGTH
Kendall's tau_bFLOODRIS FLOODED PURCOND DEPTH DURATION REMOVED TEMPMEAS PERMMEAS RESILFIT POSTCOND LENGTH
Correlation is significant at the .01 level (2-tailed).**.
Correlation is significant at the .05 level (2-tailed).*.

Appendices
340
Correlations
1.000 .312** .006 -.213** .244** -.037 .183**. .000 .910 .000 .000 .515 .000
373 351 321 290 312 305 373.312** 1.000 .187** -.191** .704** -.066 .155**.000 . .000 .001 .000 .231 .001351 367 318 285 311 303 367.006 .187** 1.000 -.019 .259** -.050 -.151**.910 .000 . .715 .000 .341 .002321 318 337 288 307 299 337
-.213** -.191** -.019 1.000 -.235** -.010 -.146**.000 .001 .715 . .000 .858 .006290 285 288 302 294 282 302.244** .704** .259** -.235** 1.000 -.029 .143**.000 .000 .000 .000 . .602 .006312 311 307 294 327 313 327
-.037 -.066 -.050 -.010 -.029 1.000 .154**.515 .231 .341 .858 .602 . .003305 303 299 282 313 318 318.183** .155** -.151** -.146** .143** .154** 1.000.000 .001 .002 .006 .006 .003 .373 367 337 302 327 318 392
Correlation CoefficientSig. (2-tailed)NCorrelation CoefficientSig. (2-tailed)NCorrelation CoefficientSig. (2-tailed)NCorrelation CoefficientSig. (2-tailed)NCorrelation CoefficientSig. (2-tailed)NCorrelation CoefficientSig. (2-tailed)NCorrelation CoefficientSig. (2-tailed)N
FLOODRIS
FLOODED
LENGTH
FLOODEX
FLCLAIM
OTHCLAIM
PROBLEMS
Kendall's tau_bFLOODRIS FLOODED LENGTH FLOODEX FLCLAIM OTHCLAIM PROBLEMS
Correlation is significant at the .01 level (2-tailed).**.
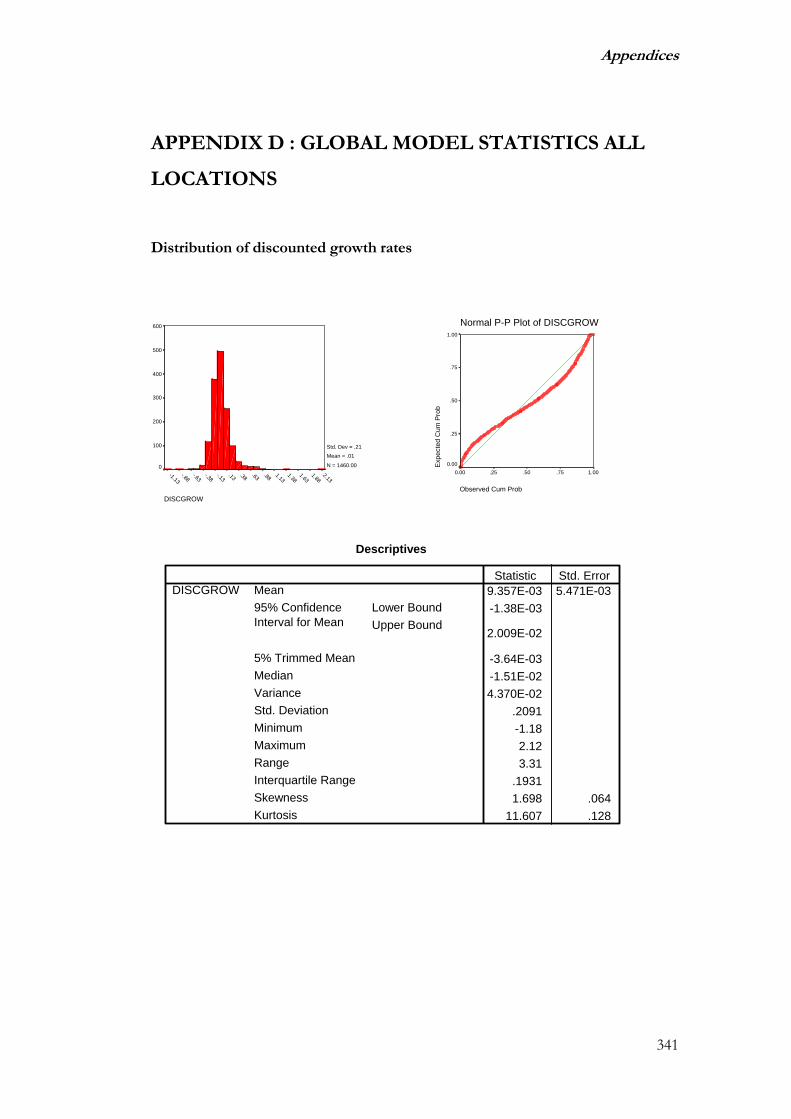
Appendices
341
DISCGROW
2.131.88
1.631.38
1.13.88.63.38.13-.13
-.38-.63
-.88-1.13
600
500
400
300
200
100
0
Std. Dev = .21 Mean = .01
N = 1460.00
Descriptives
9.357E-03 5.471E-03-1.38E-03
2.009E-02
-3.64E-03-1.51E-024.370E-02
.2091-1.182.123.31
.19311.698 .064
11.607 .128
MeanLower BoundUpper Bound
95% ConfidenceInterval for Mean
5% Trimmed MeanMedianVarianceStd. DeviationMinimumMaximumRangeInterquartile RangeSkewnessKurtosis
DISCGROWStatistic Std. Error
APPENDIX D : GLOBAL MODEL STATISTICS ALL
LOCATIONS
Distribution of discounted growth rates
Normal P-P Plot of DISCGROW
Observed Cum Prob
1.00.75.50.250.00
Exp
ecte
d C
um P
rob
1.00
.75
.50
.25
0.00

Appendices
342
Table of annual mean discounted growth rate by flood designation– all
locations
Scatter plot of discounted growth rate against predicted growth rate
PREDGROW
1.21.0.8.6.4.20.0
DIS
CG
RO
W
2.5
2.0
1.5
1.0
.5
0.0
-.5
-1.0
-1.5
FZ1000
1
0
Fz1000 Non fz1000
2001 (n)
0.11 (50)
0.07 (129)
2002 (n)
0.01 (708)
0.03 (221)
2003 (n)
0.00 (71)
-0.01 (201)
2004 (n)
0.04 (84)
0.00 (194)
2005 (n)
-0.02 (59)
-0.04 (171)
2006 (n)
-0.02 (47)
-0.01 (155)

Appendices
343
Report
DISCGROW
6.094E-03 1071 .2050 -1.29E-021.834E-02 389 .2198 -2.46E-029.357E-03 1460 .2091 -1.51E-02
FZ100001Total
Mean N Std. Deviation Median
ANOVA Table
.043 1 .043 .979 .32363.720 1458 .04463.763 1459
(Combined)Between GroupsWithin GroupsTotal
DISCGROW * FZ1000
Sum ofSquares df Mean Square F Sig.
Comparison of mean discounted growth rate by designation
Ranks
1071 731.44389 727.92
1460
FZ100001Total
DISCGROWN Mean Rank
Test Statisticsa,b
.0201
.888
Chi-SquaredfAsymp. Sig.
DISCGROW
Kruskal Wallis Testa.
Grouping Variable: FZ1000b.

Appendices
344
APPENDIX E : ANNUAL AVERAGES FOR TEST OF
CHANGE IN FLOODPLAIN DESIGNATION IN 2004
YEAR OUTSIDE LOW MOD SIG
2004 0.05 0.10 0.10 0.09
2005 0.01 -0.01 0.02 0.03
2006 -0.01 -0.01 0.03 0.03
TOTAL 0.00 0.00 0.03 0.04

Appendices
345
Descriptives
166412.5 8896.5755148823.5
184001.5
157279.1135000.01.1E+10
105641.025500.00625000.0599500.0124977.5
1.467 .2042.730 .406
11.8385 5.176E-0211.7362
11.9408
11.842611.8130
.378.614610.1513.35
3.20.8705-.043 .204-.331 .406
MeanLower BoundUpper Bound
95% ConfidenceInterval for Mean
5% Trimmed MeanMedianVarianceStd. DeviationMinimumMaximumRangeInterquartile RangeSkewnessKurtosisMean
Lower BoundUpper Bound
95% ConfidenceInterval for Mean
5% Trimmed MeanMedianVarianceStd. DeviationMinimumMaximumRangeInterquartile RangeSkewnessKurtosis
PRICE
LNPRICE
Statistic Std. Error
APPENDIX F : EXPLORATORY DATA ANALYSIS
AND MODEL DIAGNOSTICS FOR TRUNCATED
HEDONIC MODEL
Scatterplots of price and lnprice against year of sale
YEAR
2006200520042003200220012000
PR
ICE
700000
600000
500000
400000
300000
200000
100000
0
YEAR
2006200520042003200220012000
LNPR
ICE
13.5
13.0
12.5
12.0
11.5
11.0
10.5
10.0
Normal probability plots of price and lnprice
Normal P-P Plot of PRICE
Observed Cum Prob
1.00.75.50.250.00
Exp
ecte
d C
um P
rob
1.00
.75
.50
.25
0.00
Normal P-P Plot of LNPRICE
Observed Cum Prob
1.00.75.50.250.00
Exp
ecte
d C
um P
rob
1.00
.75
.50
.25
0.00
Descriptives of price and lnprice
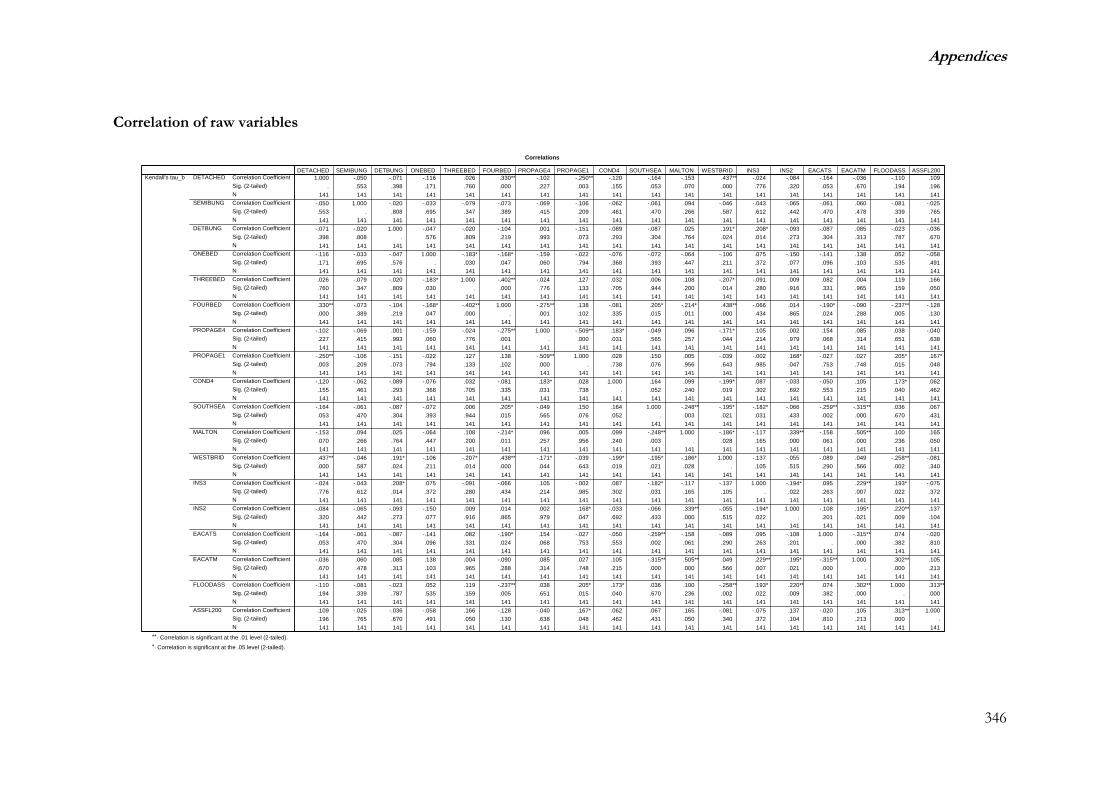
Appendices
346
Correlations
1.000 -.050 -.071 -.116 .026 .330** -.102 -.250** -.120 -.164 -.153 .437** -.024 -.084 -.164 -.036 -.110 .109. .553 .398 .171 .760 .000 .227 .003 .155 .053 .070 .000 .776 .320 .053 .670 .194 .196
141 141 141 141 141 141 141 141 141 141 141 141 141 141 141 141 141 141-.050 1.000 -.020 -.033 -.079 -.073 -.069 -.106 -.062 -.061 .094 -.046 -.043 -.065 -.061 .060 -.081 -.025.553 . .808 .695 .347 .389 .415 .209 .461 .470 .266 .587 .612 .442 .470 .478 .339 .765141 141 141 141 141 141 141 141 141 141 141 141 141 141 141 141 141 141
-.071 -.020 1.000 -.047 -.020 -.104 .001 -.151 -.089 -.087 .025 .191* .208* -.093 -.087 .085 -.023 -.036.398 .808 . .576 .809 .219 .993 .073 .293 .304 .764 .024 .014 .273 .304 .313 .787 .670141 141 141 141 141 141 141 141 141 141 141 141 141 141 141 141 141 141
-.116 -.033 -.047 1.000 -.183* -.168* -.159 -.022 -.076 -.072 -.064 -.106 .075 -.150 -.141 .138 .052 -.058.171 .695 .576 . .030 .047 .060 .794 .368 .393 .447 .211 .372 .077 .096 .103 .535 .491141 141 141 141 141 141 141 141 141 141 141 141 141 141 141 141 141 141.026 -.079 -.020 -.183* 1.000 -.402** -.024 .127 .032 .006 .108 -.207* -.091 .009 .082 .004 .119 .166.760 .347 .809 .030 . .000 .776 .133 .705 .944 .200 .014 .280 .916 .331 .965 .159 .050141 141 141 141 141 141 141 141 141 141 141 141 141 141 141 141 141 141.330** -.073 -.104 -.168* -.402** 1.000 -.275** .138 -.081 .205* -.214* .438** -.066 .014 -.190* -.090 -.237** -.128.000 .389 .219 .047 .000 . .001 .102 .335 .015 .011 .000 .434 .865 .024 .288 .005 .130141 141 141 141 141 141 141 141 141 141 141 141 141 141 141 141 141 141
-.102 -.069 .001 -.159 -.024 -.275** 1.000 -.509** .183* -.049 .096 -.171* .105 .002 .154 .085 .038 -.040.227 .415 .993 .060 .776 .001 . .000 .031 .565 .257 .044 .214 .979 .068 .314 .651 .638141 141 141 141 141 141 141 141 141 141 141 141 141 141 141 141 141 141
-.250** -.106 -.151 -.022 .127 .138 -.509** 1.000 .028 .150 .005 -.039 -.002 .168* -.027 .027 .205* .167*.003 .209 .073 .794 .133 .102 .000 . .738 .076 .956 .643 .985 .047 .753 .748 .015 .048141 141 141 141 141 141 141 141 141 141 141 141 141 141 141 141 141 141
-.120 -.062 -.089 -.076 .032 -.081 .183* .028 1.000 .164 .099 -.199* .087 -.033 -.050 .105 .173* .062.155 .461 .293 .368 .705 .335 .031 .738 . .052 .240 .019 .302 .692 .553 .215 .040 .462141 141 141 141 141 141 141 141 141 141 141 141 141 141 141 141 141 141
-.164 -.061 -.087 -.072 .006 .205* -.049 .150 .164 1.000 -.248** -.195* -.182* -.066 -.259** -.315** .036 .067.053 .470 .304 .393 .944 .015 .565 .076 .052 . .003 .021 .031 .433 .002 .000 .670 .431141 141 141 141 141 141 141 141 141 141 141 141 141 141 141 141 141 141
-.153 .094 .025 -.064 .108 -.214* .096 .005 .099 -.248** 1.000 -.186* -.117 .339** -.158 .505** .100 .165.070 .266 .764 .447 .200 .011 .257 .956 .240 .003 . .028 .165 .000 .061 .000 .236 .050141 141 141 141 141 141 141 141 141 141 141 141 141 141 141 141 141 141.437** -.046 .191* -.106 -.207* .438** -.171* -.039 -.199* -.195* -.186* 1.000 -.137 -.055 -.089 .049 -.258** -.081.000 .587 .024 .211 .014 .000 .044 .643 .019 .021 .028 . .105 .515 .290 .566 .002 .340141 141 141 141 141 141 141 141 141 141 141 141 141 141 141 141 141 141
-.024 -.043 .208* .075 -.091 -.066 .105 -.002 .087 -.182* -.117 -.137 1.000 -.194* .095 .229** .193* -.075.776 .612 .014 .372 .280 .434 .214 .985 .302 .031 .165 .105 . .022 .263 .007 .022 .372141 141 141 141 141 141 141 141 141 141 141 141 141 141 141 141 141 141
-.084 -.065 -.093 -.150 .009 .014 .002 .168* -.033 -.066 .339** -.055 -.194* 1.000 -.108 .195* .220** .137.320 .442 .273 .077 .916 .865 .979 .047 .692 .433 .000 .515 .022 . .201 .021 .009 .104141 141 141 141 141 141 141 141 141 141 141 141 141 141 141 141 141 141
-.164 -.061 -.087 -.141 .082 -.190* .154 -.027 -.050 -.259** -.158 -.089 .095 -.108 1.000 -.315** .074 -.020.053 .470 .304 .096 .331 .024 .068 .753 .553 .002 .061 .290 .263 .201 . .000 .382 .810141 141 141 141 141 141 141 141 141 141 141 141 141 141 141 141 141 141
-.036 .060 .085 .138 .004 -.090 .085 .027 .105 -.315** .505** .049 .229** .195* -.315** 1.000 .302** .105.670 .478 .313 .103 .965 .288 .314 .748 .215 .000 .000 .566 .007 .021 .000 . .000 .213141 141 141 141 141 141 141 141 141 141 141 141 141 141 141 141 141 141
-.110 -.081 -.023 .052 .119 -.237** .038 .205* .173* .036 .100 -.258** .193* .220** .074 .302** 1.000 .313**.194 .339 .787 .535 .159 .005 .651 .015 .040 .670 .236 .002 .022 .009 .382 .000 . .000141 141 141 141 141 141 141 141 141 141 141 141 141 141 141 141 141 141.109 -.025 -.036 -.058 .166 -.128 -.040 .167* .062 .067 .165 -.081 -.075 .137 -.020 .105 .313** 1.000.196 .765 .670 .491 .050 .130 .638 .048 .462 .431 .050 .340 .372 .104 .810 .213 .000 .141 141 141 141 141 141 141 141 141 141 141 141 141 141 141 141 141 141
Correlation CoefficientSig. (2-tailed)NCorrelation CoefficientSig. (2-tailed)NCorrelation CoefficientSig. (2-tailed)NCorrelation CoefficientSig. (2-tailed)NCorrelation CoefficientSig. (2-tailed)NCorrelation CoefficientSig. (2-tailed)NCorrelation CoefficientSig. (2-tailed)NCorrelation CoefficientSig. (2-tailed)NCorrelation CoefficientSig. (2-tailed)NCorrelation CoefficientSig. (2-tailed)NCorrelation CoefficientSig. (2-tailed)NCorrelation CoefficientSig. (2-tailed)NCorrelation CoefficientSig. (2-tailed)NCorrelation CoefficientSig. (2-tailed)NCorrelation CoefficientSig. (2-tailed)NCorrelation CoefficientSig. (2-tailed)NCorrelation CoefficientSig. (2-tailed)NCorrelation CoefficientSig. (2-tailed)N
DETACHED
SEMIBUNG
DETBUNG
ONEBED
THREEBED
FOURBED
PROPAGE4
PROPAGE1
COND4
SOUTHSEA
MALTON
WESTBRID
INS3
INS2
EACATS
EACATM
FLOODASS
ASSFL200
Kendall's tau_bDETACHED SEMIBUNG DETBUNG ONEBED THREEBED FOURBED PROPAGE4 PROPAGE1 COND4 SOUTHSEA MALTON WESTBRID INS3 INS2 EACATS EACATM FLOODASS ASSFL200
Correlation is significant at the .01 level (2-tailed).**.
Correlation is significant at the .05 level (2-tailed).*.
Correlation of raw variables

Appendices
347
Model output all respondents
Model Summaryb
.923a .852 .830 .2531Model1
R R SquareAdjustedR Square
Std. Error ofthe Estimate
Predictors: (Constant), WESTBRID, Y2001, SEMIBUNG,ONEBED, PROPAGE1, Y2003, COND4, SOUTHSEA,DETBUNG, Y2006, THREEBED, Y2004, MALTON,Y2005, DETACHED, PROPAGE4, FOURBED, Y2002
a.
Dependent Variable: LNPRICEb.
ANOVAb
45.065 18 2.504 39.075 .000a
7.817 122 6.407E-0252.882 140
RegressionResidualTotal
Model1
Sum ofSquares df Mean Square F Sig.
Predictors: (Constant), WESTBRID, Y2001, SEMIBUNG, ONEBED, PROPAGE1,Y2003, COND4, SOUTHSEA, DETBUNG, Y2006, THREEBED, Y2004, MALTON,Y2005, DETACHED, PROPAGE4, FOURBED, Y2002
a.
Dependent Variable: LNPRICEb.
Coefficientsa
11.016 .086 127.570 .000.436 .079 .253 5.496 .000.343 .196 .066 1.750 .083.515 .142 .140 3.616 .000
-.287 .095 -.120 -3.024 .003.149 .058 .112 2.552 .012.624 .071 .452 8.843 .000.158 .067 .112 2.351 .020.163 .059 .132 2.758 .007.118 .057 .079 2.079 .040
-6.22E-02 .091 -.035 -.686 .494.271 .083 .189 3.256 .001.715 .094 .380 7.569 .000.507 .092 .282 5.500 .000.655 .107 .287 6.150 .000.651 .086 .412 7.612 .000.188 .062 .124 3.053 .003
-.272 .061 -.175 -4.434 .000.315 .085 .172 3.718 .000
(Constant)DETACHEDSEMIBUNGDETBUNGONEBEDTHREEBEDFOURBEDPROPAGE4PROPAGE1COND4Y2001Y2002Y2006Y2003Y2004Y2005SOUTHSEAMALTONWESTBRID
Model1
B Std. Error
UnstandardizedCoefficients
Beta
Standardized
Coefficients
t Sig.
Dependent Variable: LNPRICEa.

Appendices
348
Model output flooded respondents
Regression Standardized Residual
3.252.75
2.251.75
1.25.75.25-.25
-.75-1.25
-1.75-2.25
-2.75-3.25
-3.75
Histogram
Dependent Variable: LNPRICEFr
eque
ncy
30
20
10
0
Std. Dev = .93 Mean = 0.00
N = 141.00
Model Summaryb,c
.900a .825 .809 .696 .2946Model1
FLOODASS= 1.00
(Selected)
FLOODASS~= 1.00
(Unselected)
R
R SquareAdjustedR Square
Std. Error ofthe Estimate
Predictors: (Constant), MALTON, DETACHED, Y2004, COND4, Y2005,DETBUNG, FOURBED, Y2002, ONEBED, PROPAGE1, SOUTHSEA, Y2006,THREEBED, Y2003, Y2001, PROPAGE4
a.
Unless noted otherwise, statistics are based only on cases for whichFLOODASS = 1.00.
b.
Dependent Variable: LNPRICEc.
ANOVAb,c
9.943 16 .621 7.162 .000a
2.343 27 8.677E-0212.285 43
RegressionResidualTotal
Model1
Sum ofSquares df Mean Square F Sig.
Predictors: (Constant), MALTON, DETACHED, Y2004, COND4, Y2005, DETBUNG,FOURBED, Y2002, ONEBED, PROPAGE1, SOUTHSEA, Y2006, THREEBED,Y2003, Y2001, PROPAGE4
a.
Dependent Variable: LNPRICEb.
Selecting only cases for which FLOODASS = 1.00c.
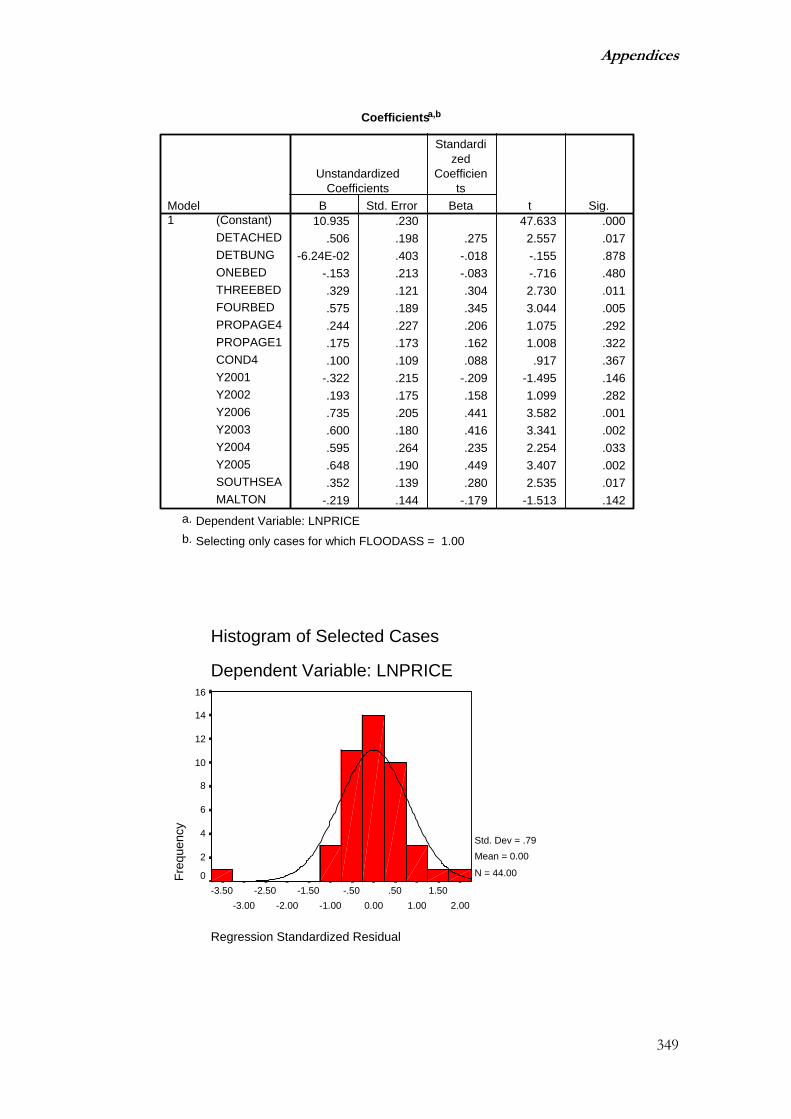
Appendices
349
Regression Standardized Residual
2.001.50
1.00.50
0.00-.50
-1.00-1.50
-2.00-2.50
-3.00-3.50
Histogram of Selected Cases
Dependent Variable: LNPRICE
Freq
uenc
y
16
14
12
10
8
6
4
2
0
Std. Dev = .79 Mean = 0.00
N = 44.00
Coefficientsa,b
10.935 .230 47.633 .000.506 .198 .275 2.557 .017
-6.24E-02 .403 -.018 -.155 .878-.153 .213 -.083 -.716 .480.329 .121 .304 2.730 .011.575 .189 .345 3.044 .005.244 .227 .206 1.075 .292.175 .173 .162 1.008 .322.100 .109 .088 .917 .367
-.322 .215 -.209 -1.495 .146.193 .175 .158 1.099 .282.735 .205 .441 3.582 .001.600 .180 .416 3.341 .002.595 .264 .235 2.254 .033.648 .190 .449 3.407 .002.352 .139 .280 2.535 .017
-.219 .144 -.179 -1.513 .142
(Constant)DETACHEDDETBUNGONEBEDTHREEBEDFOURBEDPROPAGE4PROPAGE1COND4Y2001Y2002Y2006Y2003Y2004Y2005SOUTHSEAMALTON
Model1
B Std. Error
UnstandardizedCoefficients
Beta
Standardized
Coefficients
t Sig.
Dependent Variable: LNPRICEa.
Selecting only cases for which FLOODASS = 1.00b.

Appendices
350
Model Output not flooded
Model Summaryb,c
.942a .825 .888 .862 .2381Model1
FLOODASS = .00 (Selected)
FLOODASS~= .00
(Unselected)
R
R SquareAdjustedR Square
Std. Error ofthe Estimate
Predictors: (Constant), WESTBRID, PROPAGE1, Y2003, ONEBED, Y2001,SEMIBUNG, COND4, DETBUNG, Y2005, THREEBED, MALTON, Y2006,SOUTHSEA, Y2004, PROPAGE4, DETACHED, FOURBED, Y2002
a.
Unless noted otherwise, statistics are based only on cases for whichFLOODASS = .00.
b.
Dependent Variable: LNPRICEc.
ANOVAb,c
34.929 18 1.941 34.242 .000a
4.420 78 5.667E-0239.349 96
RegressionResidualTotal
Model1
Sum ofSquares df Mean Square F Sig.
Predictors: (Constant), WESTBRID, PROPAGE1, Y2003, ONEBED, Y2001,SEMIBUNG, COND4, DETBUNG, Y2005, THREEBED, MALTON, Y2006,SOUTHSEA, Y2004, PROPAGE4, DETACHED, FOURBED, Y2002
a.
Dependent Variable: LNPRICEb.
Selecting only cases for which FLOODASS = .00c. Coefficientsa,b
11.083 .108 102.498 .000.504 .094 .301 5.361 .000.282 .191 .063 1.477 .144.604 .164 .164 3.685 .000
-.382 .117 -.145 -3.258 .0024.780E-02 .077 .033 .618 .538
.590 .087 .439 6.807 .0008.985E-02 .076 .060 1.185 .240
.203 .070 .154 2.922 .005
.114 .077 .066 1.483 .142-6.67E-02 .110 -.037 -.607 .546
.237 .104 .158 2.280 .025
.659 .116 .341 5.668 .000
.485 .114 .251 4.250 .000
.593 .129 .270 4.596 .000
.590 .103 .367 5.707 .000
.141 .076 .088 1.860 .067-.200 .077 -.117 -2.583 .012.258 .088 .158 2.948 .004
(Constant)DETACHEDSEMIBUNGDETBUNGONEBEDTHREEBEDFOURBEDPROPAGE4PROPAGE1COND4Y2001Y2002Y2006Y2003Y2004Y2005SOUTHSEAMALTONWESTBRID
Model1
B Std. Error
UnstandardizedCoefficients
Beta
Standardized
Coefficients
t Sig.
Dependent Variable: LNPRICEa.
Selecting only cases for which FLOODASS = .00b.

Appendices
351
Regression Standardized Residual
2.001.50
1.00.500.00
-.50-1.00
-1.50-2.00
-2.50-3.00
-3.50
Histogram of Selected Cases
Dependent Variable: LNPRICEFr
eque
ncy
20
10
0
Std. Dev = .90 Mean = 0.00
N = 97.00
Model Output including flood status variables
Model Summaryb
.929a .864 .836 .2490Model1
R R SquareAdjustedR Square
Std. Error ofthe Estimate
Predictors: (Constant), ASSFL200, EACATS,SEMIBUNG, DETBUNG, Y2006, COND4, ONEBED,Y2005, PROPAGE1, MALTON, INS3, THREEBED,Y2004, FLOODASS, Y2003, DETACHED, INS2,SOUTHSEA, Y2001, WESTBRID, PROPAGE4,FOURBED, EACATM, Y2002
a.
Dependent Variable: LNPRICEb. ANOVAb
45.687 24 1.904 30.693 .000a
7.195 116 6.202E-0252.882 140
RegressionResidualTotal
Model1
Sum ofSquares df Mean Square F Sig.
Predictors: (Constant), ASSFL200, EACATS, SEMIBUNG, DETBUNG, Y2006,COND4, ONEBED, Y2005, PROPAGE1, MALTON, INS3, THREEBED, Y2004,FLOODASS, Y2003, DETACHED, INS2, SOUTHSEA, Y2001, WESTBRID,PROPAGE4, FOURBED, EACATM, Y2002
a.
Dependent Variable: LNPRICEb.
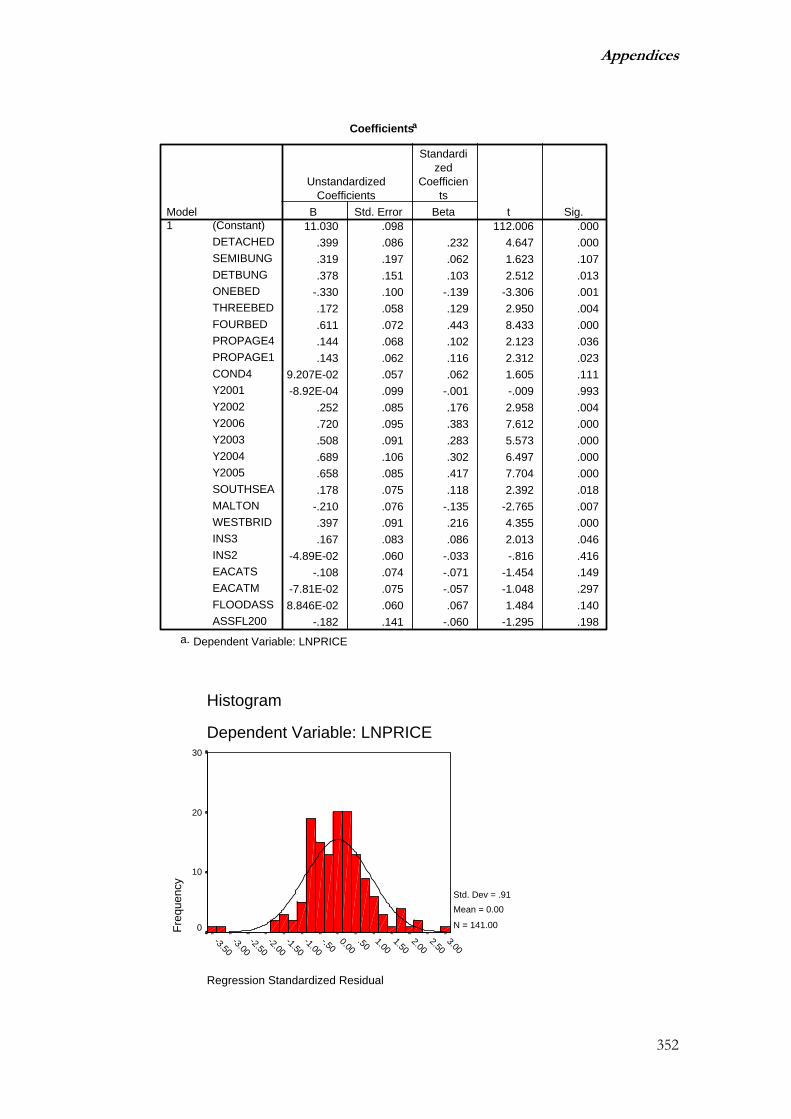
Appendices
352
Regression Standardized Residual
3.002.50
2.001.50
1.00.500.00
-.50-1.00
-1.50-2.00
-2.50-3.00
-3.50
Histogram
Dependent Variable: LNPRICE
Freq
uenc
y
30
20
10
0
Std. Dev = .91 Mean = 0.00
N = 141.00
Coefficientsa
11.030 .098 112.006 .000.399 .086 .232 4.647 .000.319 .197 .062 1.623 .107.378 .151 .103 2.512 .013
-.330 .100 -.139 -3.306 .001.172 .058 .129 2.950 .004.611 .072 .443 8.433 .000.144 .068 .102 2.123 .036.143 .062 .116 2.312 .023
9.207E-02 .057 .062 1.605 .111-8.92E-04 .099 -.001 -.009 .993
.252 .085 .176 2.958 .004
.720 .095 .383 7.612 .000
.508 .091 .283 5.573 .000
.689 .106 .302 6.497 .000
.658 .085 .417 7.704 .000
.178 .075 .118 2.392 .018-.210 .076 -.135 -2.765 .007.397 .091 .216 4.355 .000.167 .083 .086 2.013 .046
-4.89E-02 .060 -.033 -.816 .416-.108 .074 -.071 -1.454 .149
-7.81E-02 .075 -.057 -1.048 .2978.846E-02 .060 .067 1.484 .140
-.182 .141 -.060 -1.295 .198
(Constant)DETACHEDSEMIBUNGDETBUNGONEBEDTHREEBEDFOURBEDPROPAGE4PROPAGE1COND4Y2001Y2002Y2006Y2003Y2004Y2005SOUTHSEAMALTONWESTBRIDINS3INS2EACATSEACATMFLOODASSASSFL200
Model1
B Std. Error
UnstandardizedCoefficients
Beta
Standardized
Coefficients
t Sig.
Dependent Variable: LNPRICEa.

Appendices
353
Ranks
41 84.5149 90.4949 81.9827 72.04
166
EARISK.001.002.003.00Total
RATEN Mean Rank
APPENDIX G : KRUSKAL-WALLIS RANK TESTS
The Kruskal-Wallis test for equivalence of sample means in the absence of normality
and homogeneity of variance is based on the ranks of the observations (Jobson, 1991).
All observations are ranked jointly and the sums of the ranks for each subsample
computed. The test statistic
2
1
2
. 4)1( snnRT
g
j
rj∑
=
+−=
Where ⎥⎦
⎤⎢⎣
⎡ +−
−= ∑∑
= = 4)1(
11 2
1 1
2 nnRn
sg
j
n
iij
j
Is distributed χ2(g-1).
The facility to perform Kruskal-Wallis tests is a standard feature of SPSS.
Kruskal-Wallis test of distribution for differences in insurance rates
All respondents
Resident in 2000
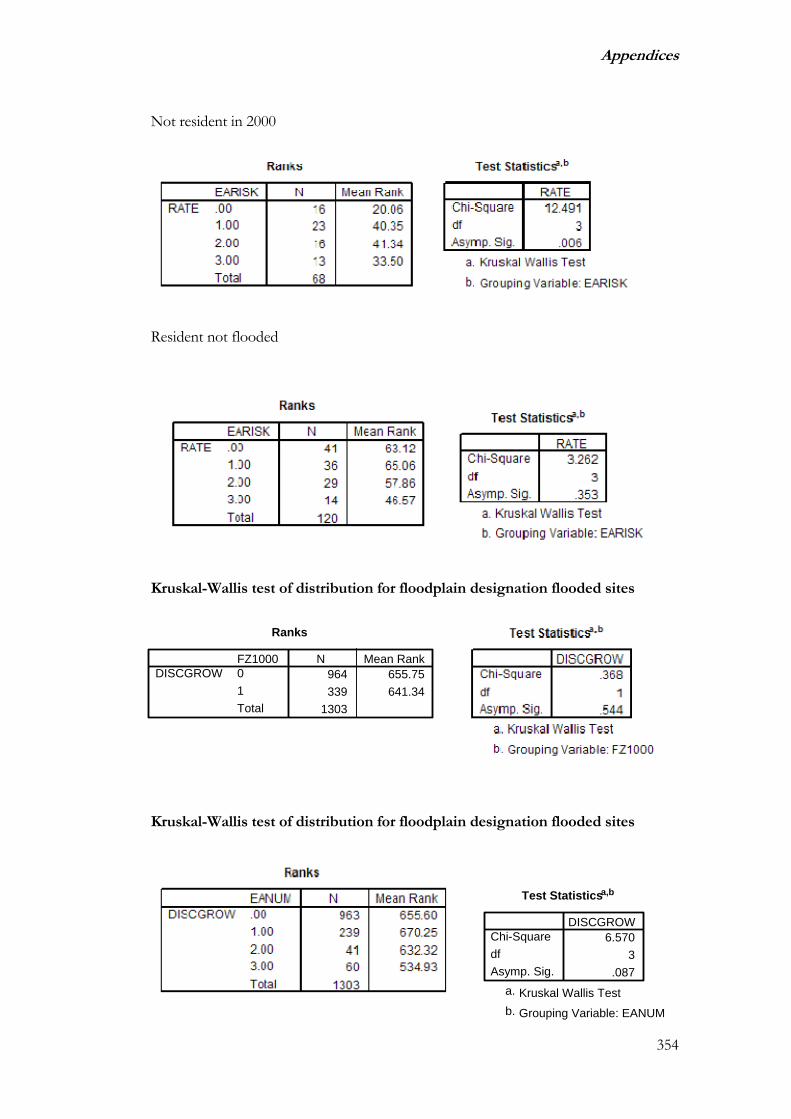
Appendices
354
Ranks
964 655.75339 641.34
1303
FZ100001Total
DISCGROWN Mean Rank
Test Statisticsa,b
6.5703
.087
Chi-SquaredfAsymp. Sig.
DISCGROW
Kruskal Wallis Testa.
Grouping Variable: EANUMb.
Not resident in 2000
Resident not flooded
Kruskal-Wallis test of distribution for floodplain designation flooded sites
Kruskal-Wallis test of distribution for floodplain designation flooded sites

Appendices
355
Test Statisticsa,b
.8521
.356
Chi-SquaredfAsymp. Sig.
ERROR
Kruskal Wallis Testa.
Grouping Variable: PAYMORE2b.
Kruskal-Wallis test of distribution for insurance problems at purchase
Kruskal-Wallis test of distribution for paying more at purchase
Test Statisticsa,b
.3431
.558
Chi-SquaredfAsymp. Sig.
ERROR
Kruskal Wallis Testa.
Grouping Variable: PURPROBb.

Appendices
356
APPENDIX H : MEDIAN POLISH ANALYSIS
Summary of Median Polish
Median Polish is a robust analysis of variance technique for examining the significance
of various factors in a multifactor model. It can work with unbalanced designs unlike
the classical ANOVA and is distribution free. It was first suggested by Tukey (Tukey,
1977). The procedure is iterative, terminating when the improvement in residuals
converges to minimal, usually measured via the ratio of the sums of the residuals from
two passes. The algorithm involves calculating medians for each level of a factor and
subtracting the median levels from the response variable.
Summary of analysis
Since median polish is not available in SPSS the analysis was carried out in Microsoft
Excel. Five factors were tested, year, insurance class, flood status, flood history and
case study site and the price data was transformed into cost per bedroom as a crude
approximation to property size. A summary of the analysis is shown below.
Step one is to subtract the global median 55, 833
Total sum of squares 96,600,000,000

Appendices
357
First pass factor medians
Global Median 0.3
Year effect Site Effect Designation effect Flood History Insurance Class
Y2000 -24858 Bewdley 4417 Outside 15417 Not Flooded 1125 Normal 1750
Y2001 -20584 Shrewsbury -3833 Low 125 Flooded -2583 High -10,833
Y2002 -10833 Portsmouth 417 Moderate 3542 Compromised 3417
Y2003 7292 West Bridgford 23417 Significant -10583
Y2004 9167 Malton and Norton
-19958
Y2005 7792
Y2006 24167
Residual 42,400,000,000 Ratio of RSS = 2.28
Second pass factor medians
Global Median 4165
Year effect Site Effect Designation effect Flood History Insurance Class
Y2000 7776 Bewdley 1742 Outside -11999 Not Flooded -4395 Normal -3999
Y2001 3302 Shrewsbury -3081 Low -1092 Flooded 10563 High 9167
Y2002 -2521 Portsmouth 1001 Moderate 5271 Compromised 6002
Y2003 -6895 West Bridgford -10415 Significant 2002
Y2004 6563 Malton and Norton
5375
Y2005 2397
Y2006 -3082
Residual 46,400,000,000 Residual ratio 0.91

Appendices
358
Third pass factor medians
Global Median -280
Year effect Site Effect Designation effect Flood History Insurance Class
Y2000 -4151 Bewdley -8317 Outside 12652 Not Flooded 2450 Normal 2614
Y2001 -1685 Shrewsbury 2243 Low 2306 Flooded -7702 High -9403
Y2002 -8 Portsmouth 2370 Moderate -12189 Compromised -1871
Y2003 661 West Bridgford 18603 Significant -1661
Y2004 -771 Malton and Norton
-6207
Y2005 991
Y2006 733
Residual 41,600,000,000 Residual ratio vs pass 3 1.11 Residual ratio vs pass 2 1.02
Less than 5% performance change convergent
Fourth pass factor medians
Global Median 777
Year effect Site Effect Designation effect Flood History Insurance Class
Y2000 1377 Bewdley 5701 Outside -16313 Not Flooded -6264 Normal -6264
Y2001 -2407 Shrewsbury -3365 Low -4948 Flooded 9004 High 5626
Y2002 5339 Portsmouth -5538 Moderate 9306 Compromised 1377
Y2003 -2140 West Bridgford -16948 Significant 985
Y2004 1245 Malton and Norton
5860
Y2005 -4451
Y2006 -7493

Appendices
359
APPENDIX I : LIST OF PUBLICATIONS
Journal Papers and Book Chapter 1. LAMOND, J. & PROVERBS, D. (2006) Does the price impact of flooding
fade away? Structural Survey, 24(5), 363-377. 2. LAMOND, J., PROVERBS, D. & ANTWI, A. (2007) Measuring the
impact of flooding on UK house prices- a new framework for small sample problems. Property Management, 25(4), 344-359.
3. LAMOND, J., PROVERBS, D. & ANTWI, A. (2007) The impact of flood insurance on residential property prices : towards a new theoretical framework for the UK market. Journal of the Financial Management of Property and Construction, 12(3), 129-137.
4. SOETANTO, R., PROVERBS, D., LAMOND, J. & SAMWINGA, V. (2008) Residential properties in England and Wales: an evaluation of repair strategies towards attaining flood resilience. IN BOSHER, L. (Ed.) Hazards and the built environment: attaining built-in resilience. Taylor and Francis ISBN 9780415427296 (In press)
Published, Peer Reviewed Conference Papers 5. LAMOND, J., PROVERBS, D. & ANTWI, A. (2005) The effect of floods
and floodplain designation on the value of property: an analysis of past studies. 2nd Probe Conference. Glasgow.
6. LAMOND, J., PROVERBS, D., ANTWI, A. & GAMESON, R. (2006) Flood insurance in the UK: how does the changing market affect the availability and cost to homeowners. IN BALDWIN, A., HUI, E. & WONG, F. (Eds.) CIB W89 International Conference on Building Education and Research Conference. Hong Kong, CIB.
7. LAMOND, J. PROVERBS, D. (2006) Elephants or ostriches, does the collective memory of flood events fade with time? First World Conference for Accelerating Excellence in the Built Environment. Birmingham.
Other conference and workshop papers 8. LAMOND, J. (2006) Impact of flooding on residential property values.
Workshop on identification and facilitation of flood damage research. Sheffield, EPSRC international network of experts in flood damage and repair.
9. LAMOND, J. & PROVERBS, D. (2007) Measuring the long term financial impact of flooding on homeowners, data issues and opportunities. European Geosciences Union General Assembly. Vienna.

Appendices
360
10. PROVERBS, D. & LAMOND, J. (2007) Putting a value on repair: a modular approach to assessing the cost of flood damage. European Geosciences Union General Assembly. Vienna.
Pending publications
11. LAMOND, J., PROVERBS, D. & HAMMOND, F. (2008) Accessibility of flood risk insurance in the UK - confusion competition and complacency. Journal of Risk and Uncertainty, in review.
12. PROVERBS, D. & LAMOND, J. (2008) The Barriers to Resilient Reinstatement of Flood Damaged Homes. 4th International i-Rec conference 2008. Building resilience: achieving effective post-disaster reconstruction. Christchurch, New Zealand. Abstract accepted paper in review