land change modelling gilberto câmara, pedro andrade licence: creative commons ̶̶̶̶ by...
TRANSCRIPT
Land change modelling
Gilberto Câmara, Pedro Andrade
Licence: Creative Commons ���� By Attribution ���� Non Commercial ���� Share Alikehttp://creativecommons.org/licenses/by-nc-sa/2.5/
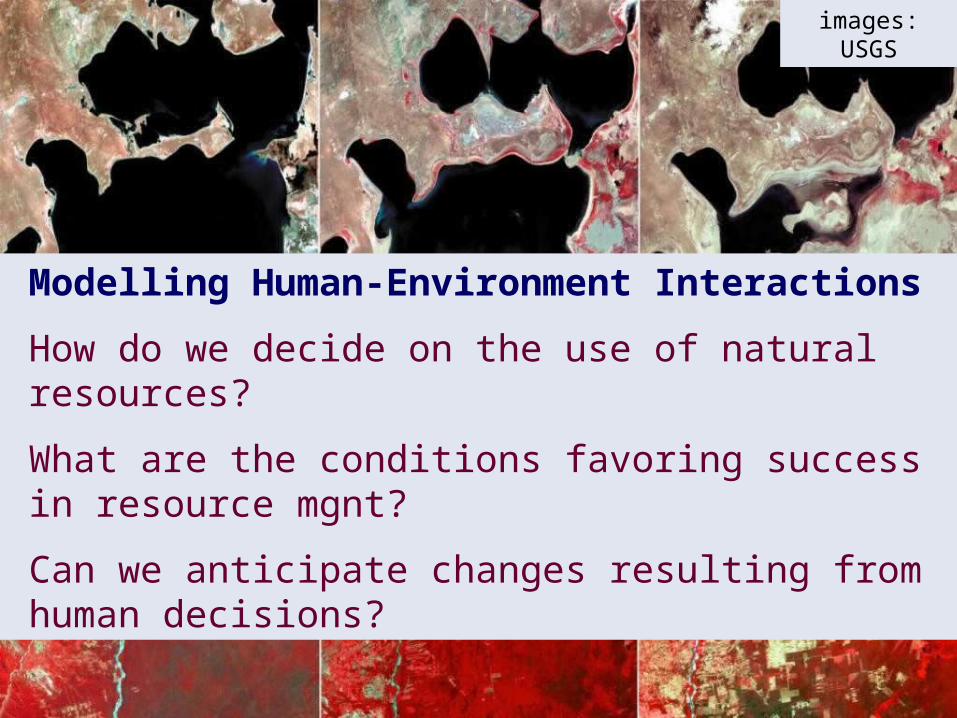
Slides from LANDSAT
Aral Sea 1973 1987 2000
images: USGS
Modelling Human-Environment Interactions
How do we decide on the use of natural resources?
What are the conditions favoring success in resource mgnt?
Can we anticipate changes resulting from human decisions?
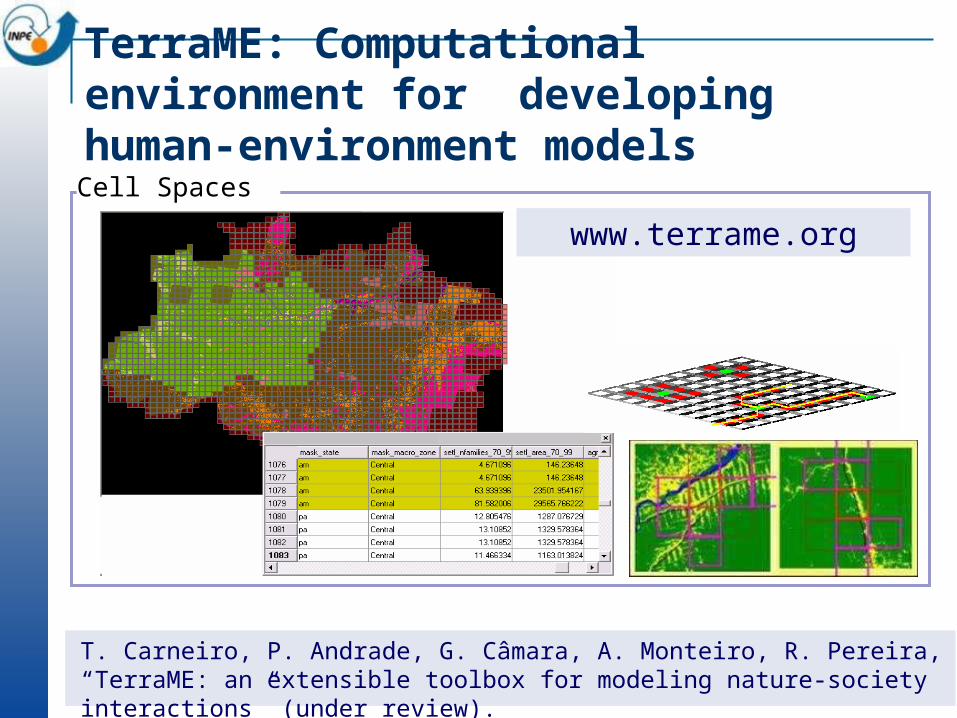
TerraME: Computational environment for developing human-environment models
Cell Spaces
www.terrame.org
T. Carneiro, P. Andrade, G. Câmara, A. Monteiro, R. Pereira, “TerraME: an extensible toolbox for modeling nature-society interactions” (under review).
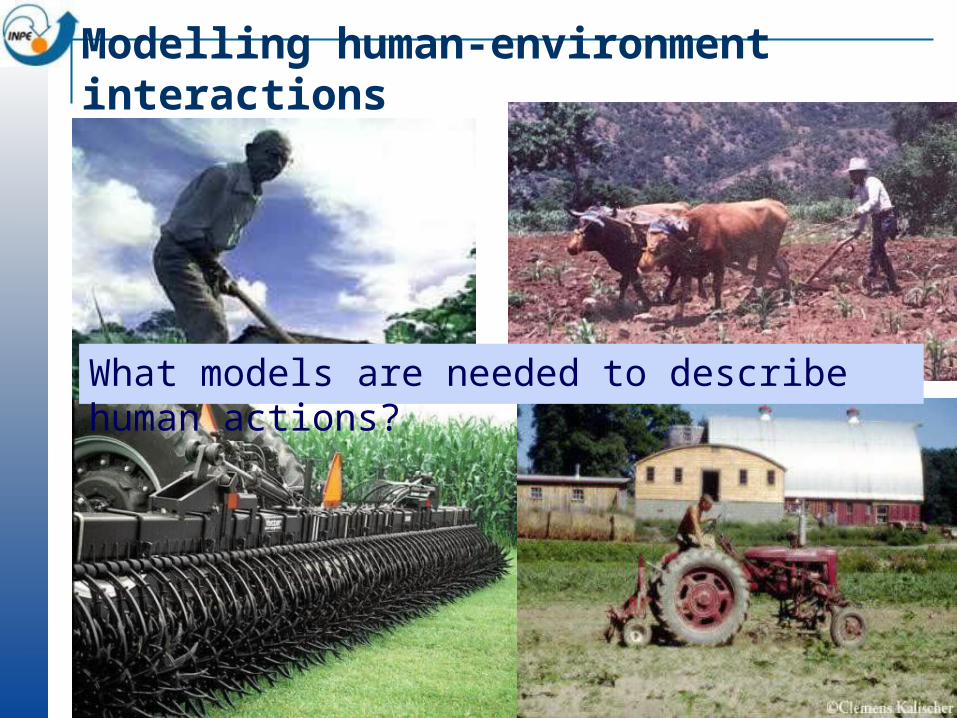
What models are needed to describe human actions?
Modelling human-environment interactions
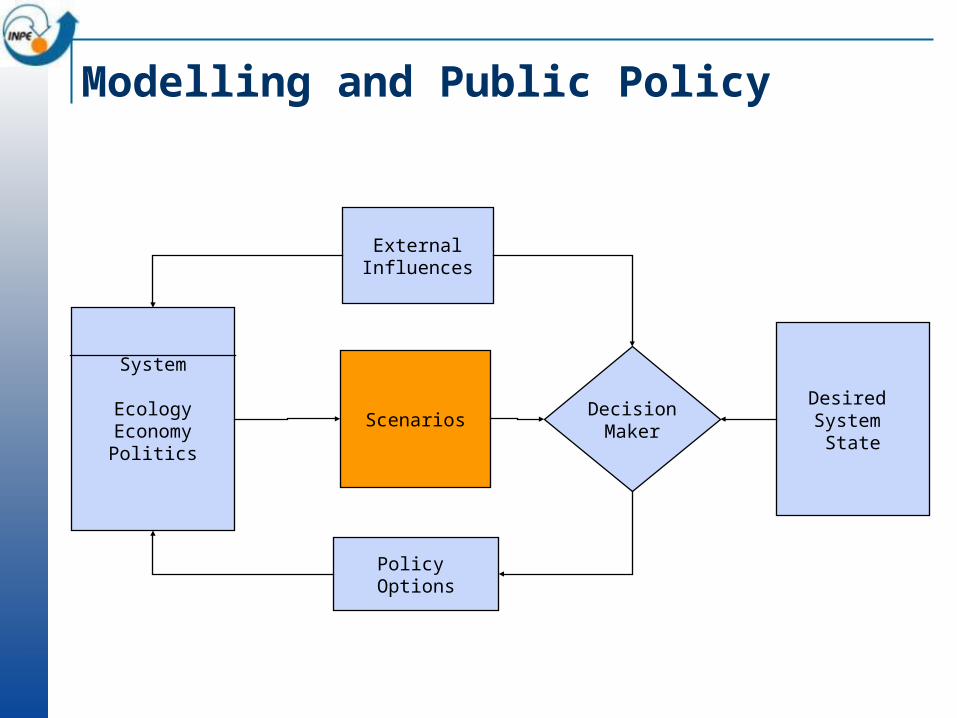
Modelling and Public Policy
System
EcologyEconomyPolitics
Scenarios DecisionMaker
Desired System
State
ExternalInfluences
Policy Options
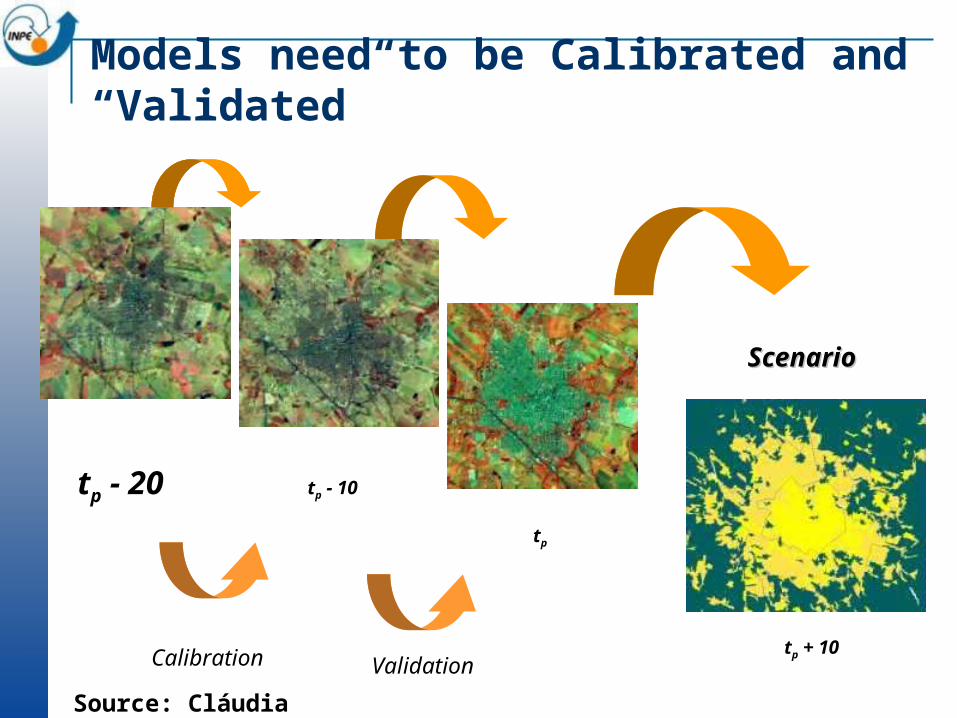
Models need to be Calibrated and “Validated”
tp - 20 tp - 10
tp
Calibration Validationtp + 10
ScenarioScenario
Source: Cláudia Almeida
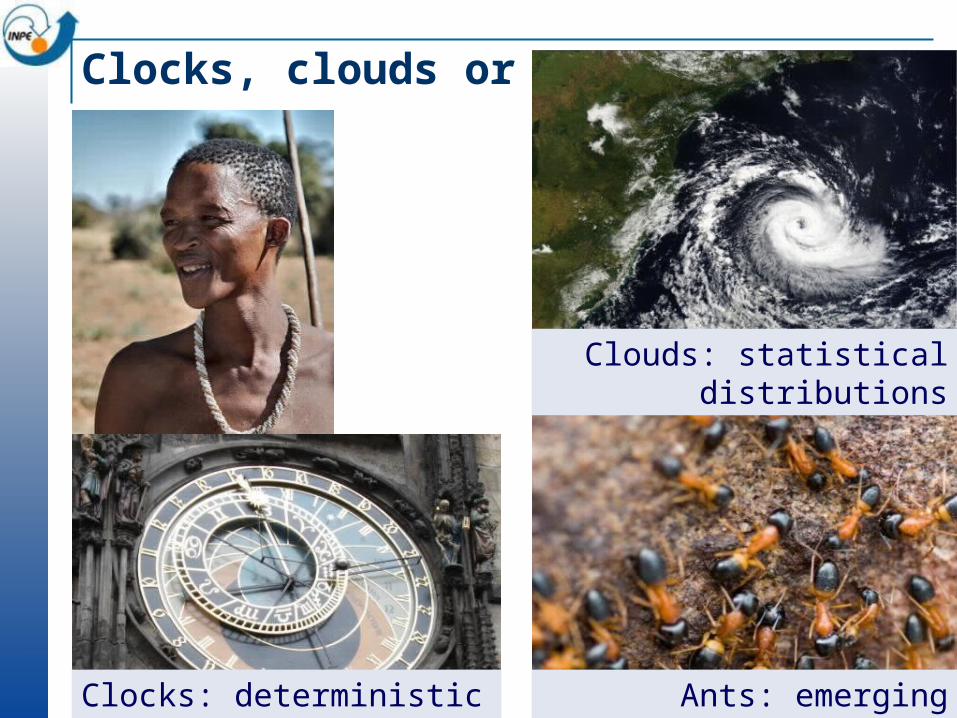
Clocks, clouds or ants?
Clocks: deterministic equations
Clouds: statistical distributions
Ants: emerging behaviour
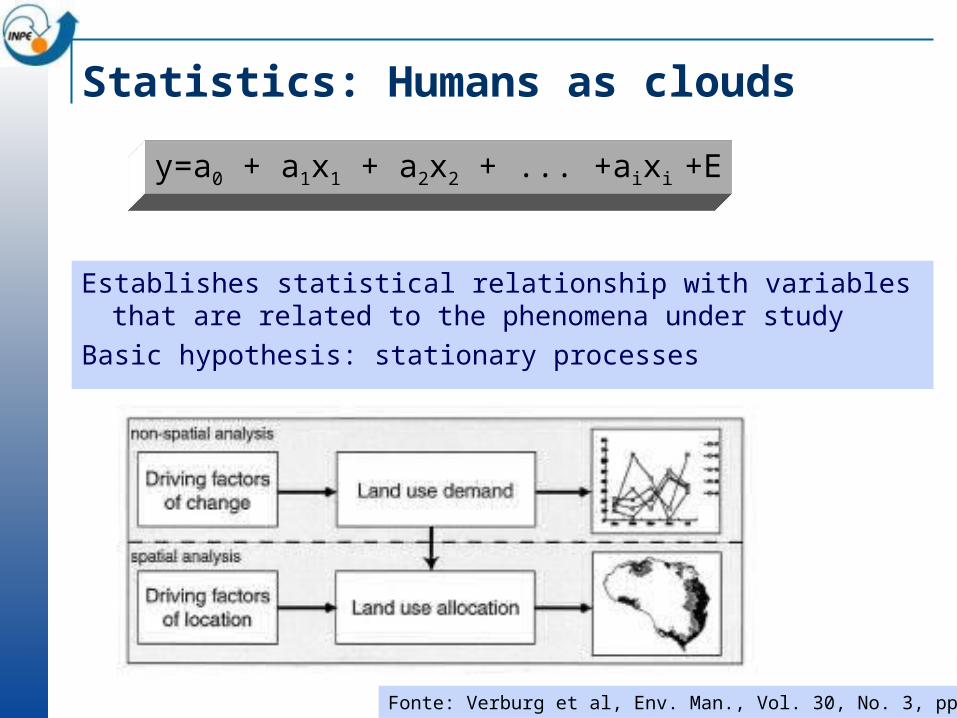
Statistics: Humans as clouds
Establishes statistical relationship with variables that are related to the phenomena under study
Basic hypothesis: stationary processes
y=a0 + a1x1 + a2x2 + ... +aixi +E
Fonte: Verburg et al, Env. Man., Vol. 30, No. 3, pp. 391–405

Statistical-based land use models
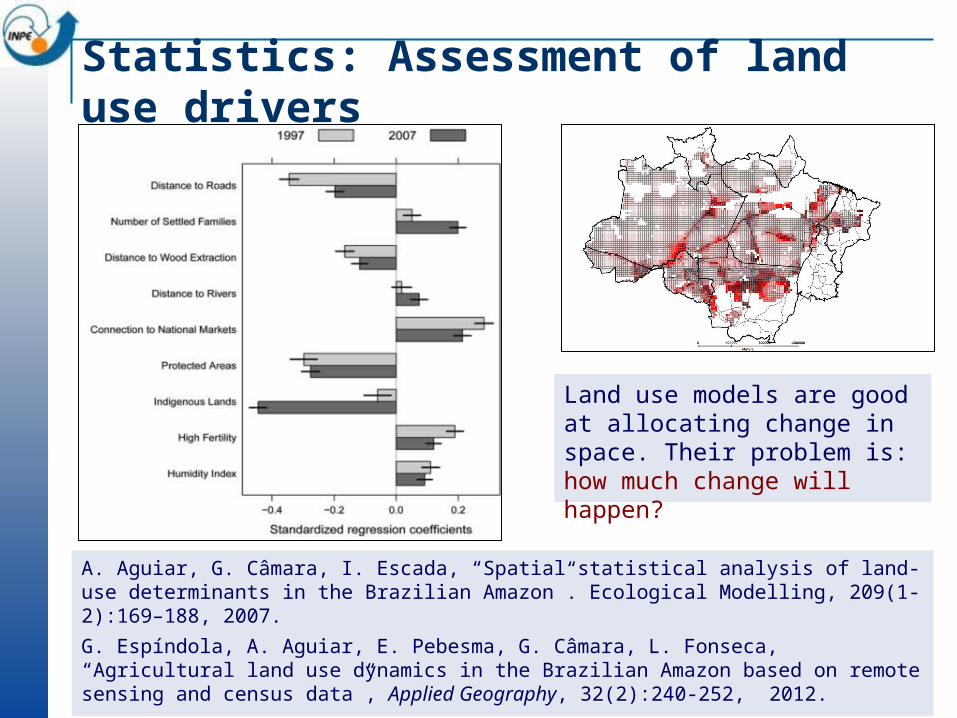
Statistics: Assessment of land use drivers
A. Aguiar, G. Câmara, I. Escada, “Spatial statistical analysis of land-use determinants in the Brazilian Amazon”. Ecological Modelling, 209(1-2):169–188, 2007.
G. Espíndola, A. Aguiar, E. Pebesma, G. Câmara, L. Fonseca, “Agricultural land use dynamics in the Brazilian Amazon based on remote sensing and census data”, Applied Geography, 32(2):240-252, 2012.
Land use models are good at allocating change in space. Their problem is: how much change will happen?
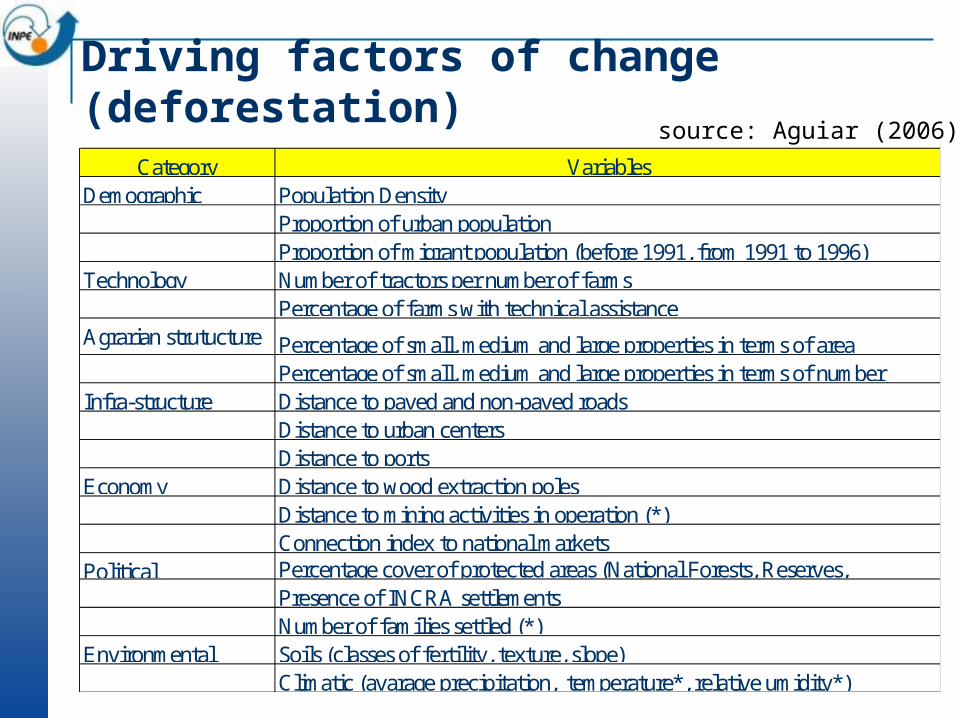
Driving factors of change (deforestation)
Category VariablesDemographic Population Density
Proportion of urban populationProportion of migrant population (before 1991, from 1991 to 1996)
Technology Number of tractors per number of farmsPercentage of farms with technical assistance
Agrarian strutucture Percentage of small, medium and large properties in terms of areaPercentage of small, medium and large properties in terms of number
Infra-structure Distance to paved and non-paved roadsDistance to urban centersDistance to ports
Economy Distance to wood extraction polesDistance to mining activities in operation (*)Connection index to national markets
Political Percentage cover of protected areas (National Forests, Reserves, Presence of INCRA settlementsNumber of families settled (*)
Environmental Soils (classes of fertility, texture, slope)Climatic (avarage precipitation, temperature*, relative umidity*)
source: Aguiar (2006)
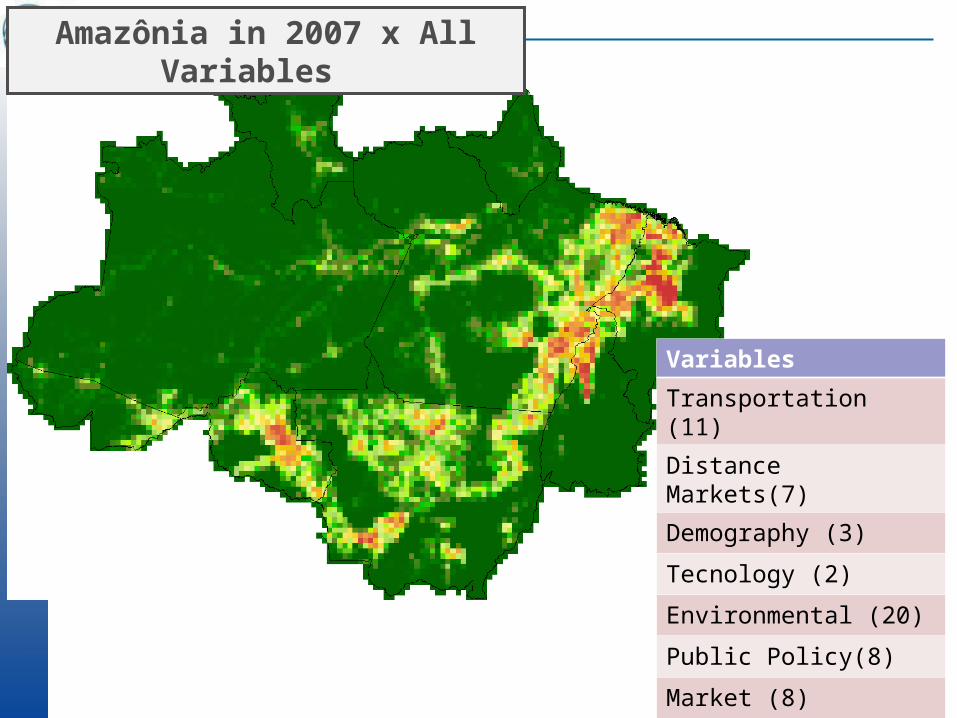
Amazônia in 2007 x All Variables
Variables
Transportation (11)
Distance Markets(7)
Demography (3)
Tecnology (2)
Environmental (20)
Public Policy(8)
Market (8)
Agrarian Structure(6)
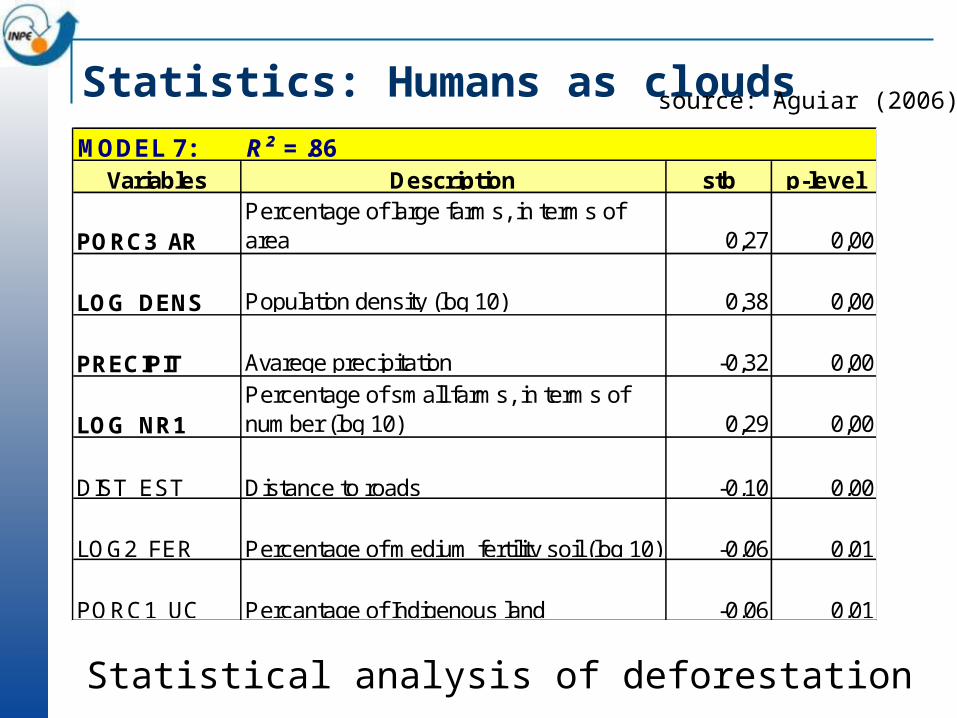
Statistics: Humans as cloudsMODEL 7: R² = .86
Variables Description stb p-level
PORC3_ARPercentage of large farms, in terms of area 0,27 0,00
LOG_DENS Population density (log 10) 0,38 0,00
PRECIPIT Avarege precipitation -0,32 0,00
LOG_NR1Percentage of small farms, in terms of number (log 10) 0,29 0,00
DIST_EST Distance to roads -0,10 0,00
LOG2_FER Percentage of medium fertility soil (log 10) -0,06 0,01
PORC1_UC Percantage of Indigenous land -0,06 0,01
Statistical analysis of deforestation
source: Aguiar (2006)
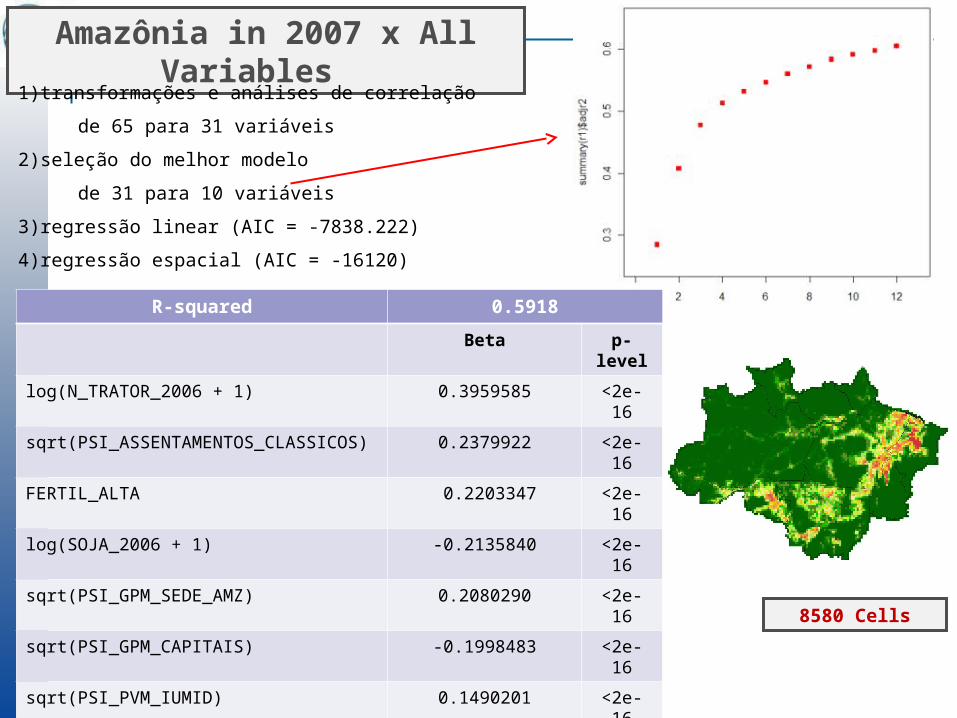
Amazônia in 2007 x All Variables
1)transformações e análises de correlação
de 65 para 31 variáveis
2)seleção do melhor modelo
de 31 para 10 variáveis
3)regressão linear (AIC = -7838.222)
4)regressão espacial (AIC = -16120)
R-squared 0.5918
Beta p-level
log(N_TRATOR_2006 + 1) 0.3959585 <2e-16
sqrt(PSI_ASSENTAMENTOS_CLASSICOS) 0.2379922 <2e-16
FERTIL_ALTA 0.2203347 <2e-16
log(SOJA_2006 + 1) -0.2135840 <2e-16
sqrt(PSI_GPM_SEDE_AMZ) 0.2080290 <2e-16
sqrt(PSI_GPM_CAPITAIS) -0.1998483 <2e-16
sqrt(PSI_PVM_IUMID) 0.1490201 <2e-16
log(DIST_MIN_MAD + 1) -0.1400526 <2e-16
TI_2006 -0.1372373 <2e-16
UC_2006 -0.1160321 <2e-16
8580 Cells
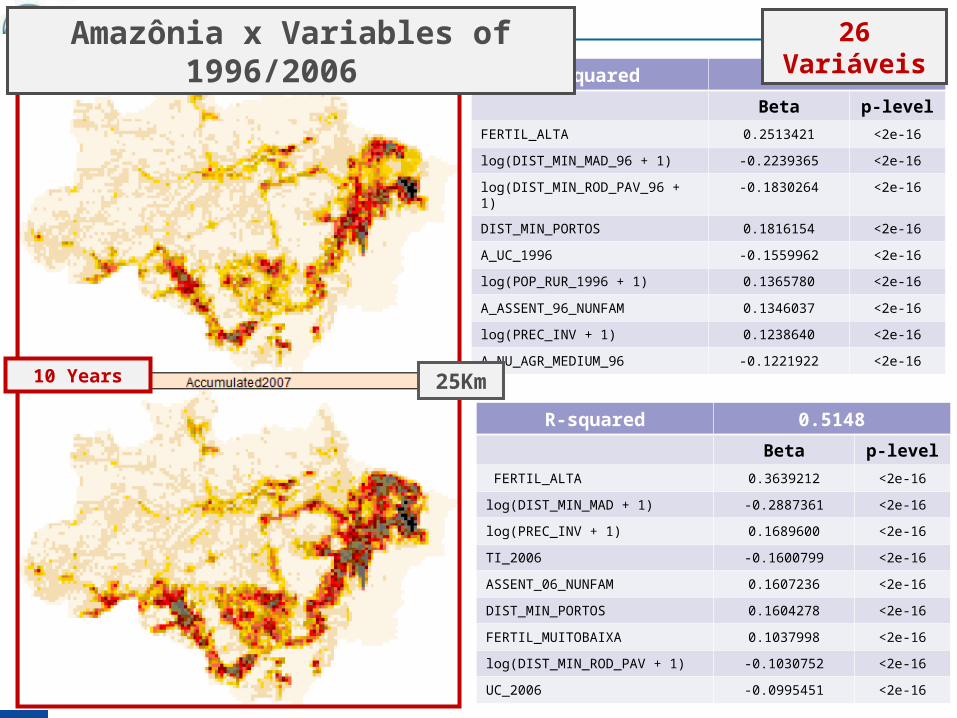
R-squared 0.5148
Beta p-level
FERTIL_ALTA 0.3639212 <2e-16
log(DIST_MIN_MAD + 1) -0.2887361 <2e-16
log(PREC_INV + 1) 0.1689600 <2e-16
TI_2006 -0.1600799 <2e-16
ASSENT_06_NUNFAM 0.1607236 <2e-16
DIST_MIN_PORTOS 0.1604278 <2e-16
FERTIL_MUITOBAIXA 0.1037998 <2e-16
log(DIST_MIN_ROD_PAV + 1) -0.1030752 <2e-16
UC_2006 -0.0995451 <2e-16
R-squared 0.4501
Beta p-level
FERTIL_ALTA 0.2513421 <2e-16
log(DIST_MIN_MAD_96 + 1) -0.2239365 <2e-16
log(DIST_MIN_ROD_PAV_96 + 1) -0.1830264 <2e-16
DIST_MIN_PORTOS 0.1816154 <2e-16
A_UC_1996 -0.1559962 <2e-16
log(POP_RUR_1996 + 1) 0.1365780 <2e-16
A_ASSENT_96_NUNFAM 0.1346037 <2e-16
log(PREC_INV + 1) 0.1238640 <2e-16
A_NU_AGR_MEDIUM_96 -0.1221922 <2e-16
10 Years 25Km
Amazônia x Variables of 1996/2006
26 Variáveis
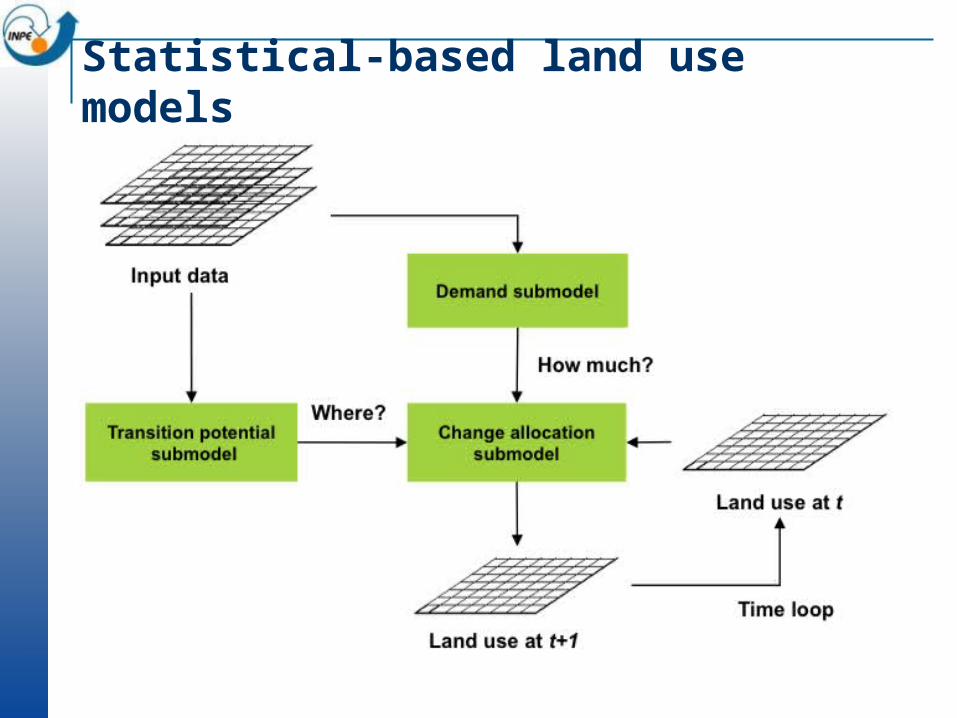
Statistical-based land use models
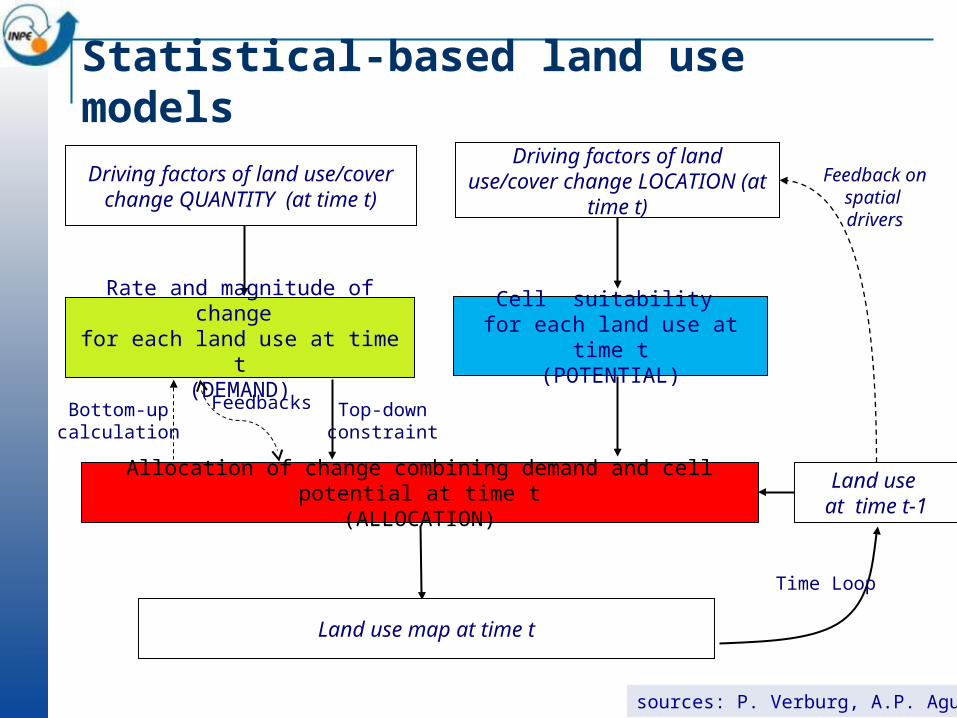
Allocation of change combining demand and cell potential at time t(ALLOCATION)
Cell suitability for each land use at time t
(POTENTIAL)
Rate and magnitude of change for each land use at time t
(DEMAND)
Land use at time t-1
Land use map at time t
Time Loop
Top-down constraint
Bottom-up calculation
Feedbacks
Driving factors of land use/cover change QUANTITY (at time t)
Driving factors of land use/cover change LOCATION (at time t)
Feedback on spatial drivers
sources: P. Verburg, A.P. Aguiar
Statistical-based land use models
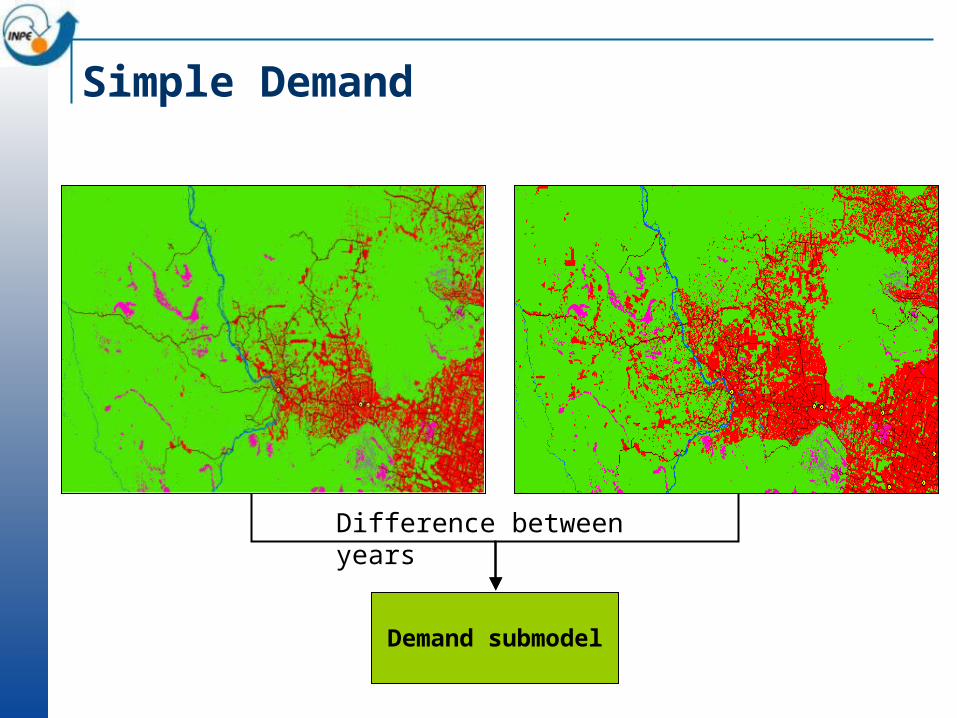
Simple Demand
Demand submodel
Difference between years
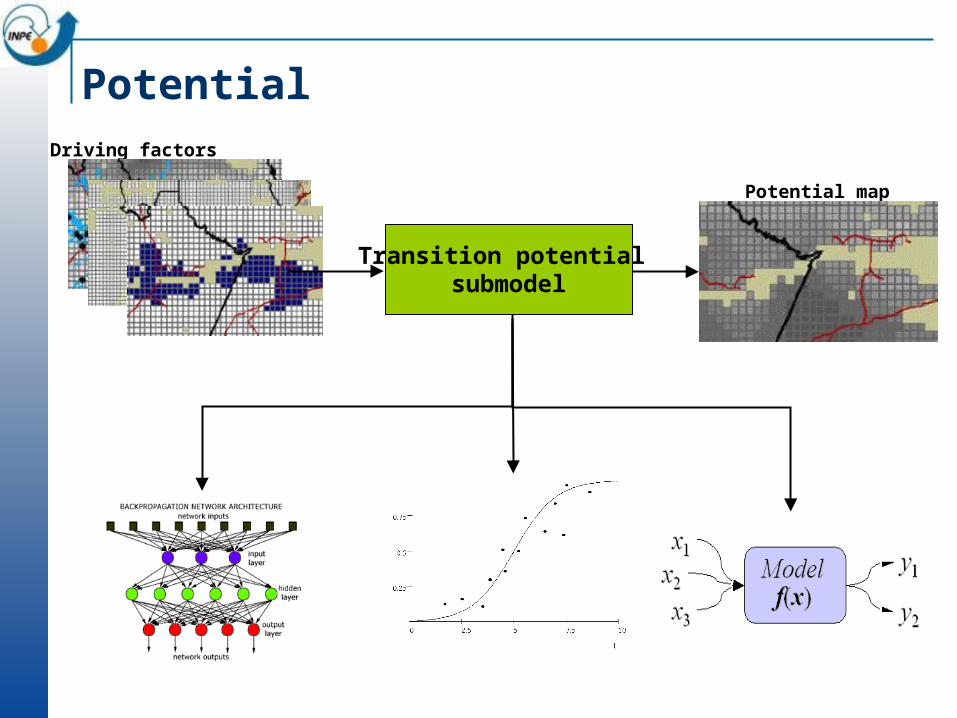
Potential map
Driving factors
Neural Network
Multivariate Statistics Mathematics
Potential
Transition potential submodel
Potential map
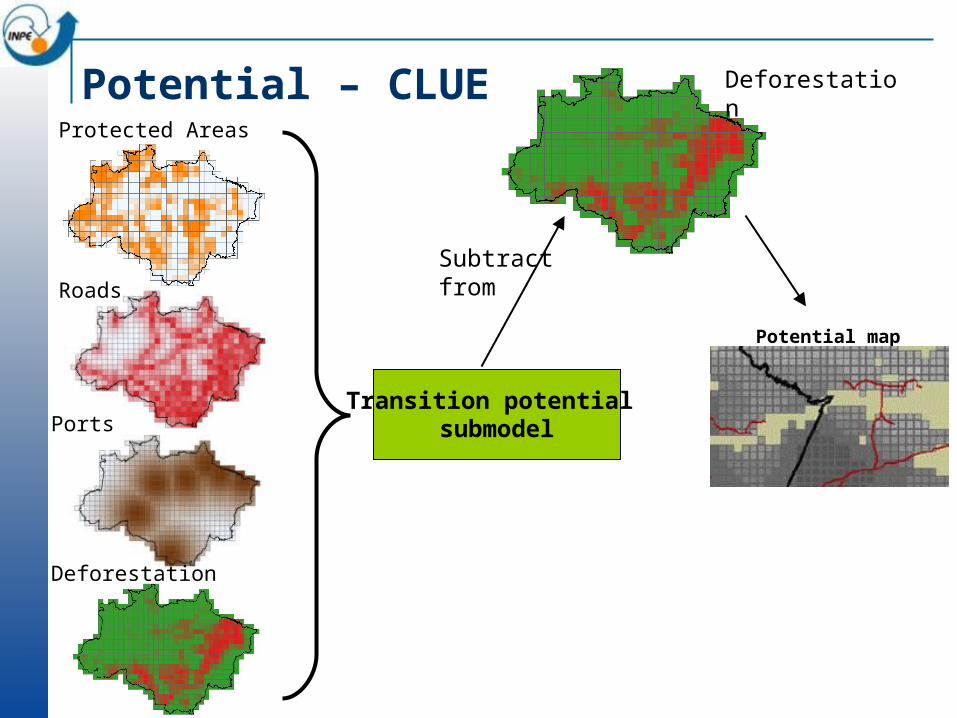
Potential – CLUE like
Transition potential submodel
Protected Areas
Roads
Ports
Deforestation
Subtract from
Deforestation
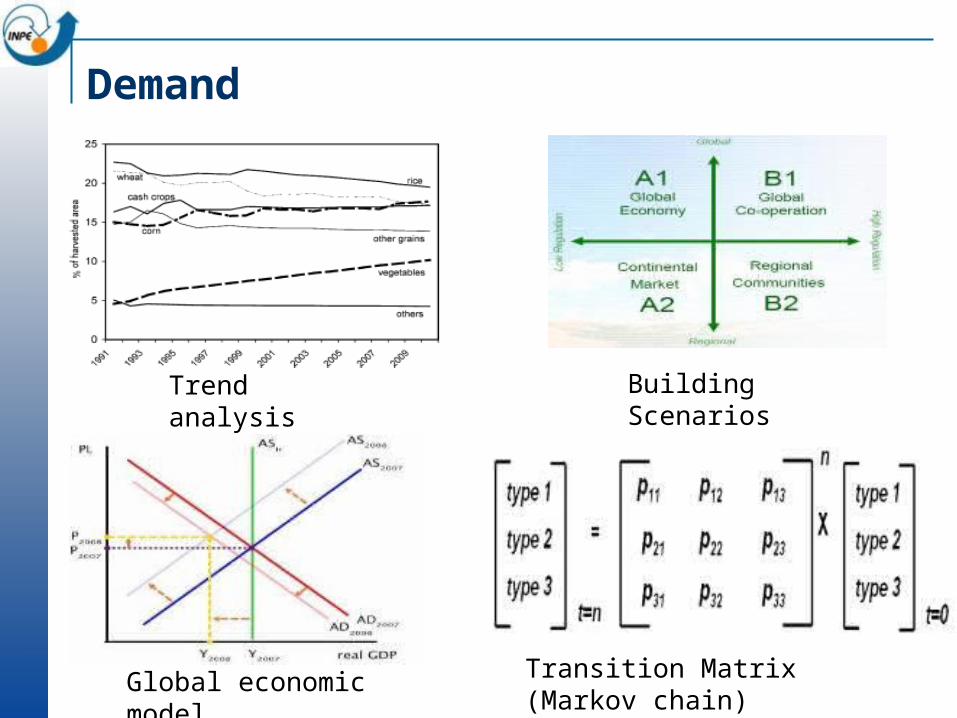
Transition Matrix (Markov chain)
Global economic model
Trend analysis
Building Scenarios
Demand
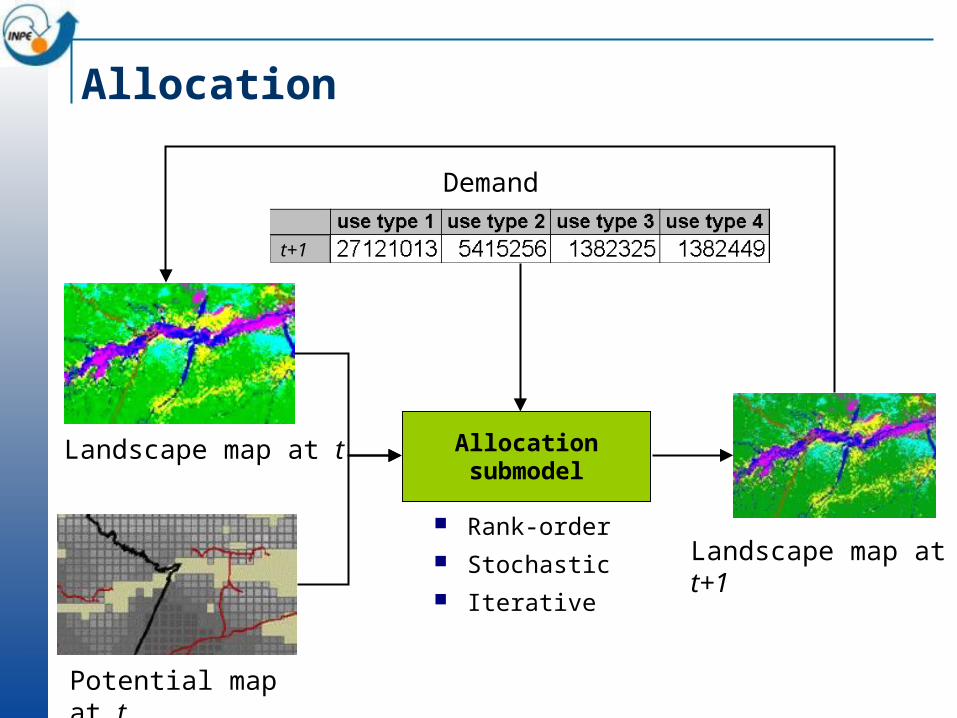
Potential map at t
Landscape map at t
Landscape map at t+1
Demand
t+1
Rank-order Stochastic Iterative
Allocationsubmodel
Allocation
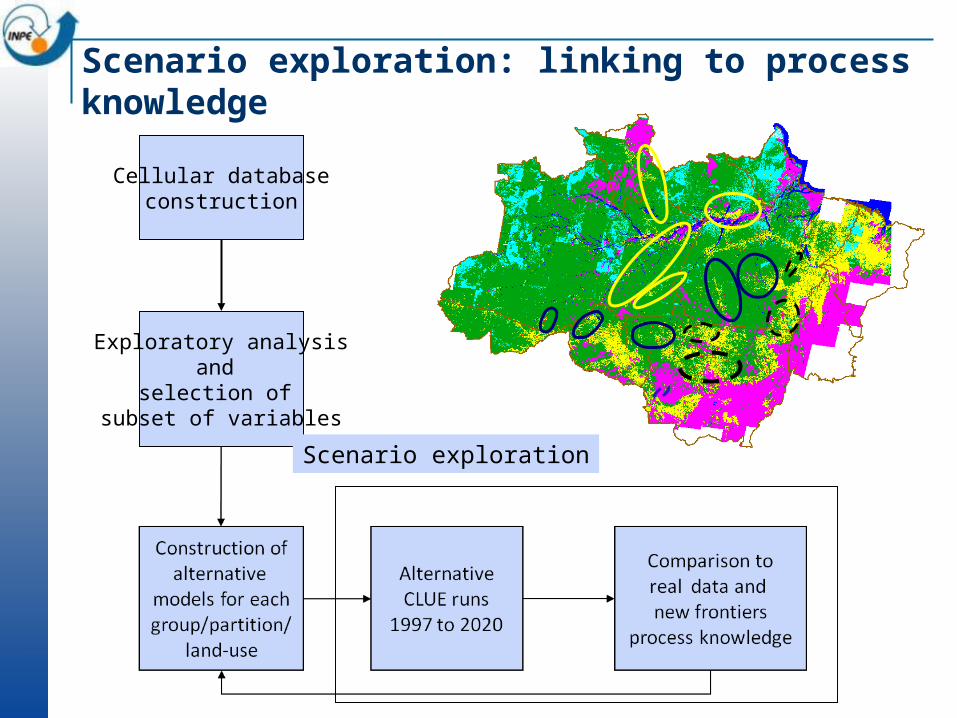
Scenario exploration: linking to process knowledge
Cellular databaseconstruction
Exploratory analysisand
selection of subset of variables
Porto Velho-Manaus
BR 163Cuiabá-Santarém
São Felix/Iriri
ApuíHumaitáBoca do Acre
SantarémManaus-Boa Vista
Aripuanã
Scenario exploration
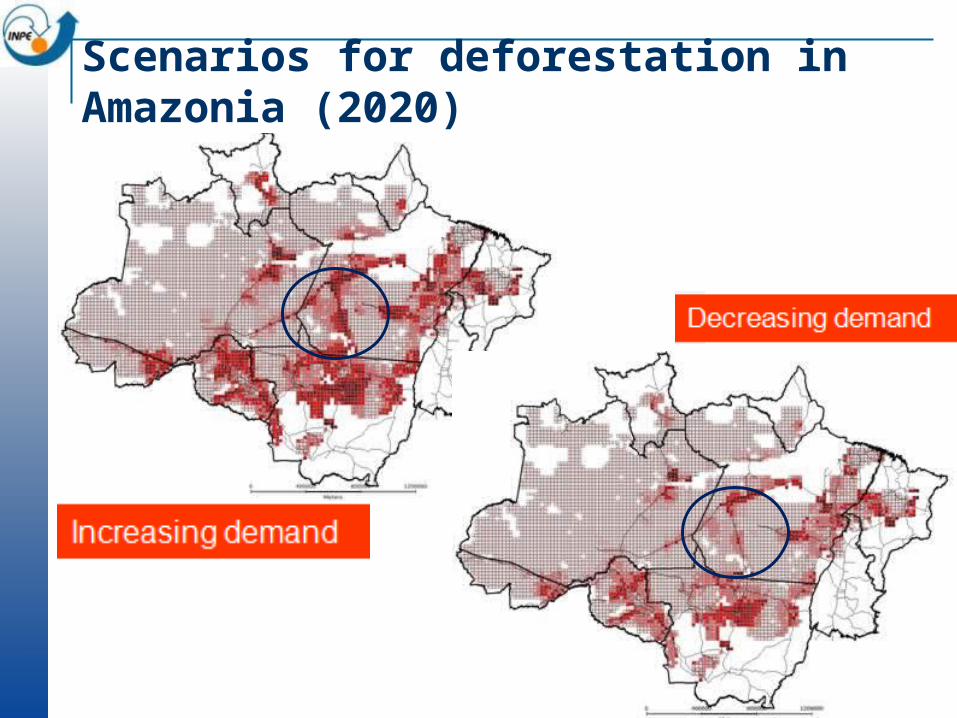
Scenarios for deforestation in Amazonia (2020)
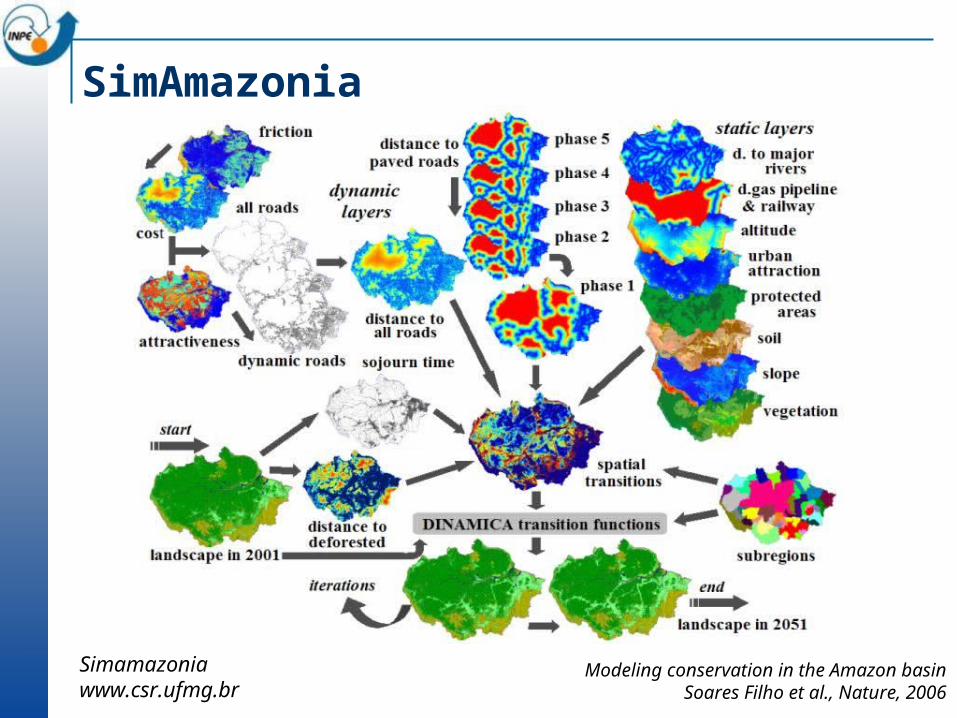
SimAmazonia
Modeling conservation in the Amazon basinSoares Filho et al., Nature, 2006
Simamazonia www.csr.ufmg.br
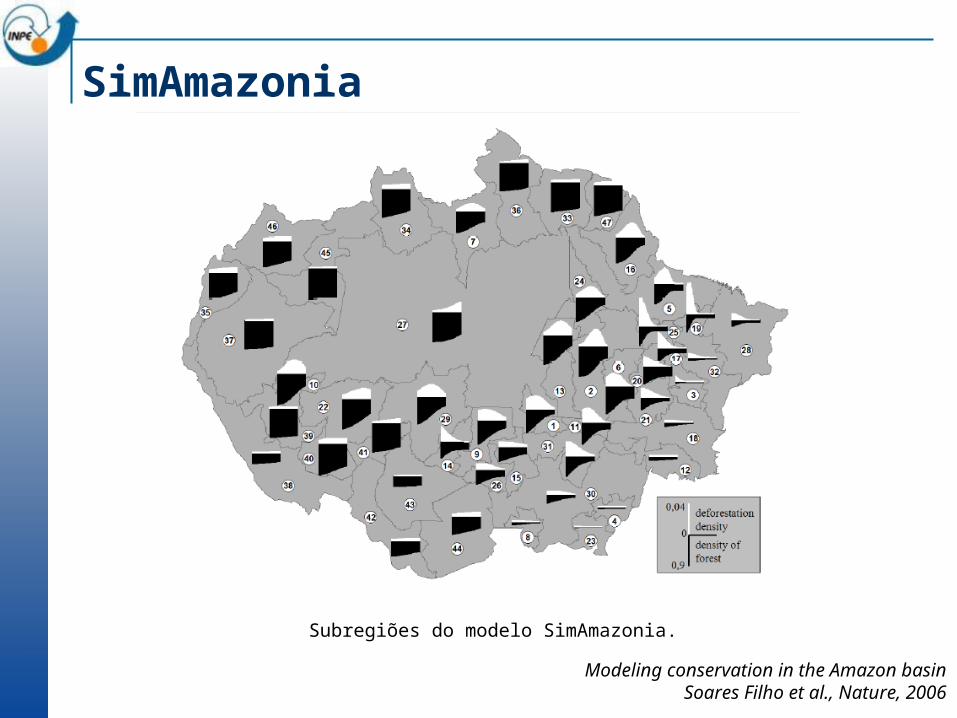
SimAmazonia
Subregiões do modelo SimAmazonia.
Modeling conservation in the Amazon basinSoares Filho et al., Nature, 2006
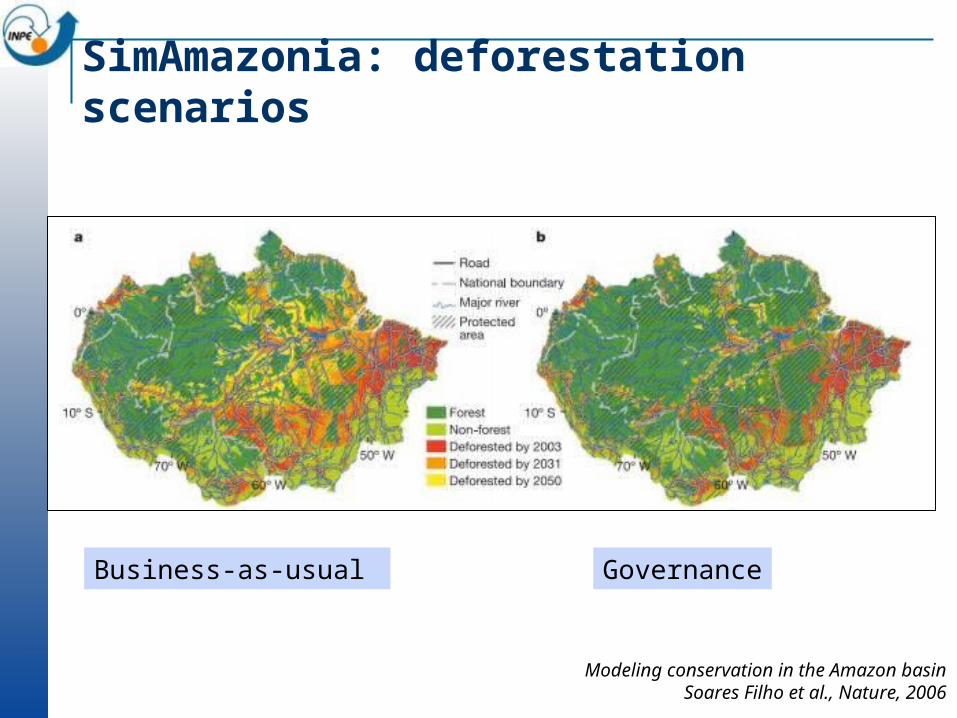
SimAmazonia: deforestation scenarios
Business-as-usual Governance
Modeling conservation in the Amazon basinSoares Filho et al., Nature, 2006
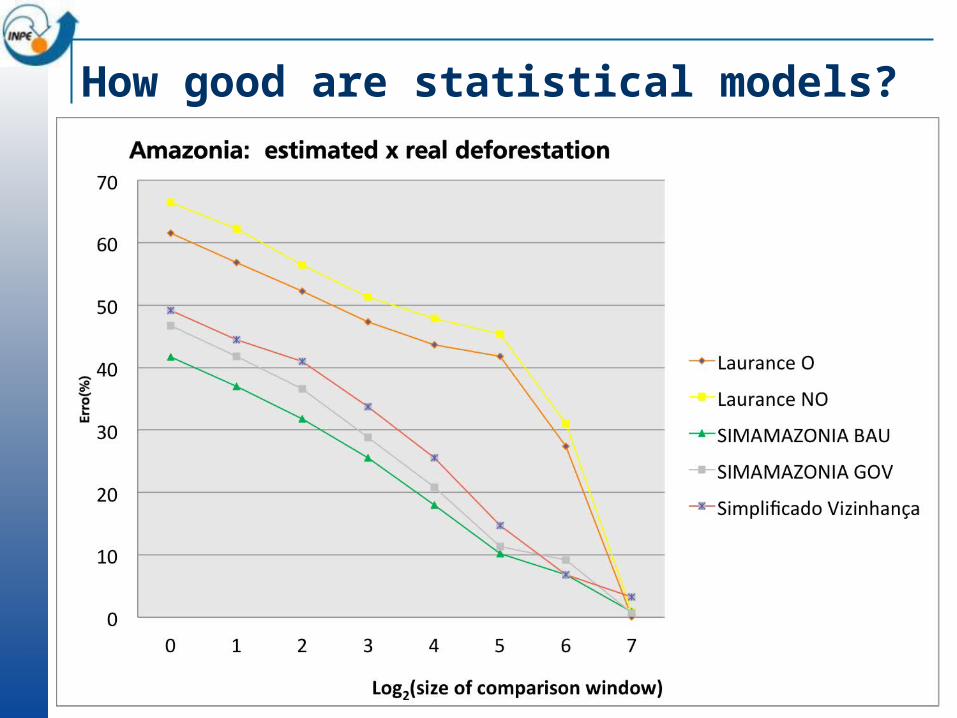
How good are statistical models?
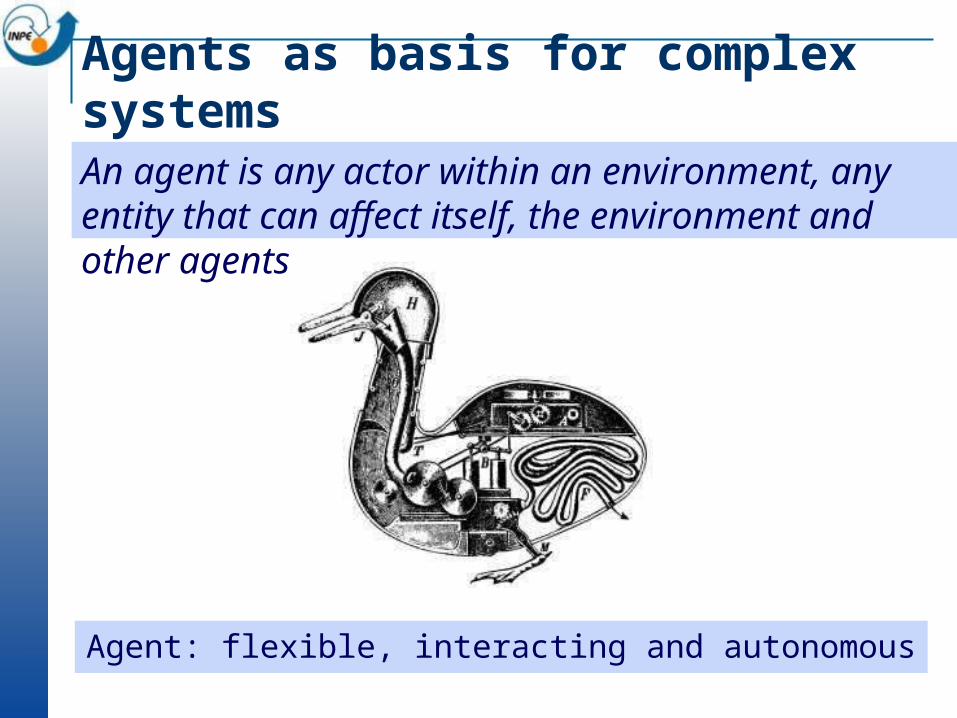
Agents as basis for complex systems
Agent: flexible, interacting and autonomous
An agent is any actor within an environment, any entity that can affect itself, the environment and other agents.
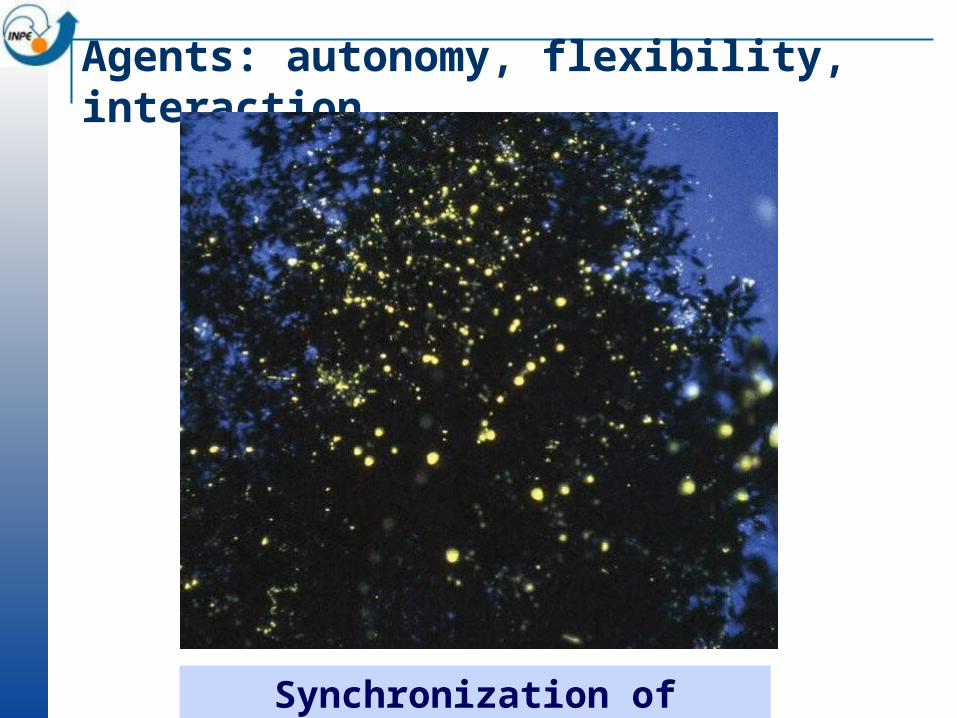
Agents: autonomy, flexibility, interaction
Synchronization of fireflies
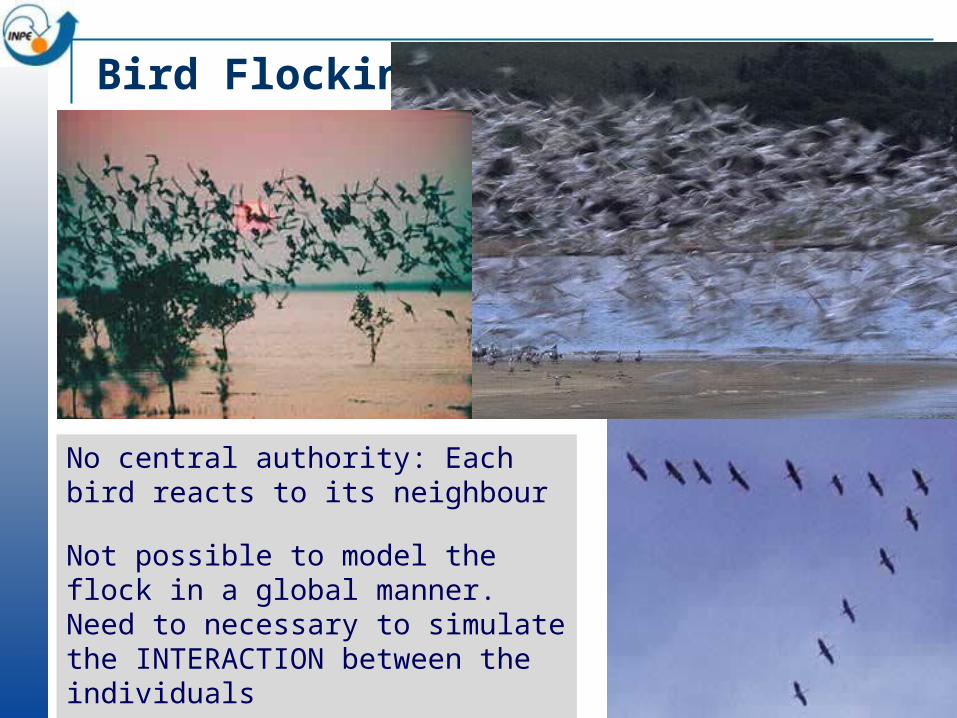
Bird Flocking
No central authority: Each bird reacts to its neighbour
Not possible to model the flock in a global manner. Need to necessary to simulate the INTERACTION between the individuals
Agen
t
Spa
ce
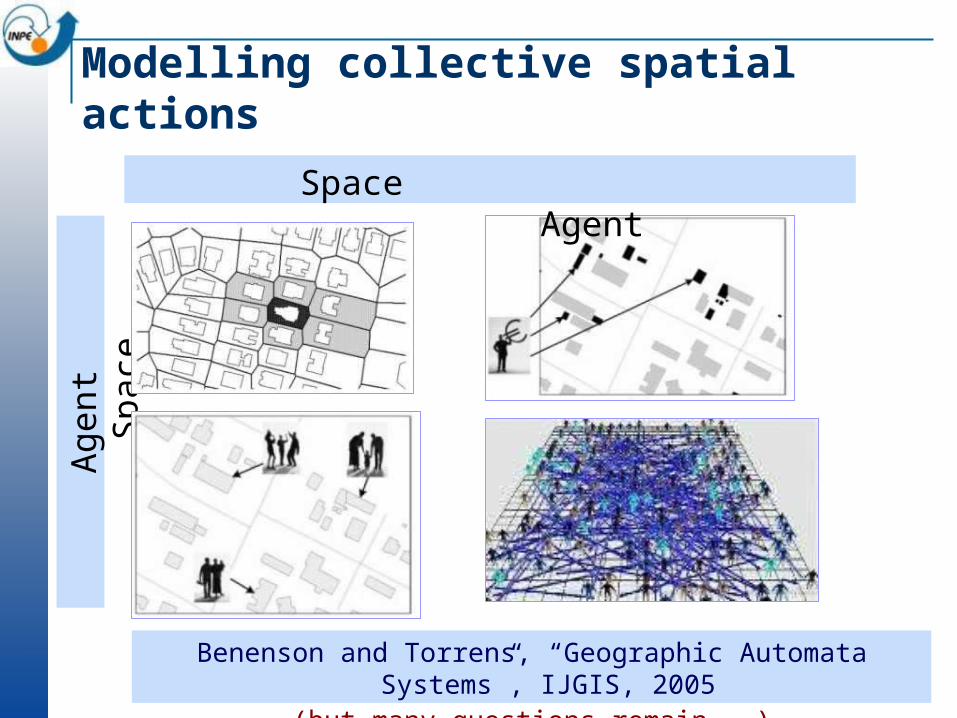
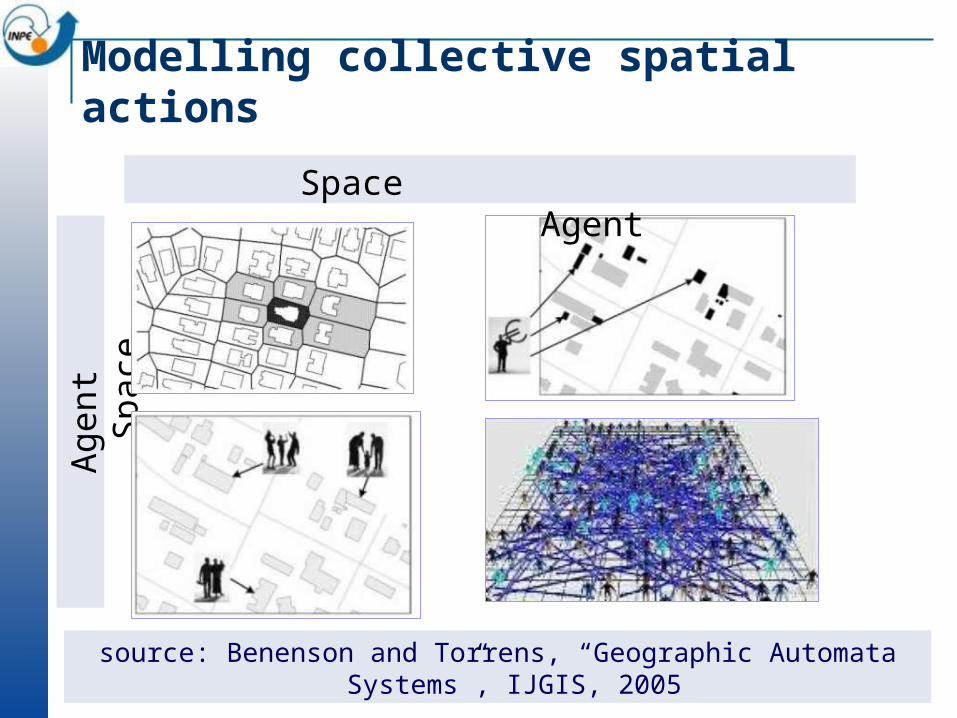
Space Agent
Benenson and Torrens, “Geographic Automata Systems”, IJGIS, 2005(but many questions remain...)
Modelling collective spatial actions
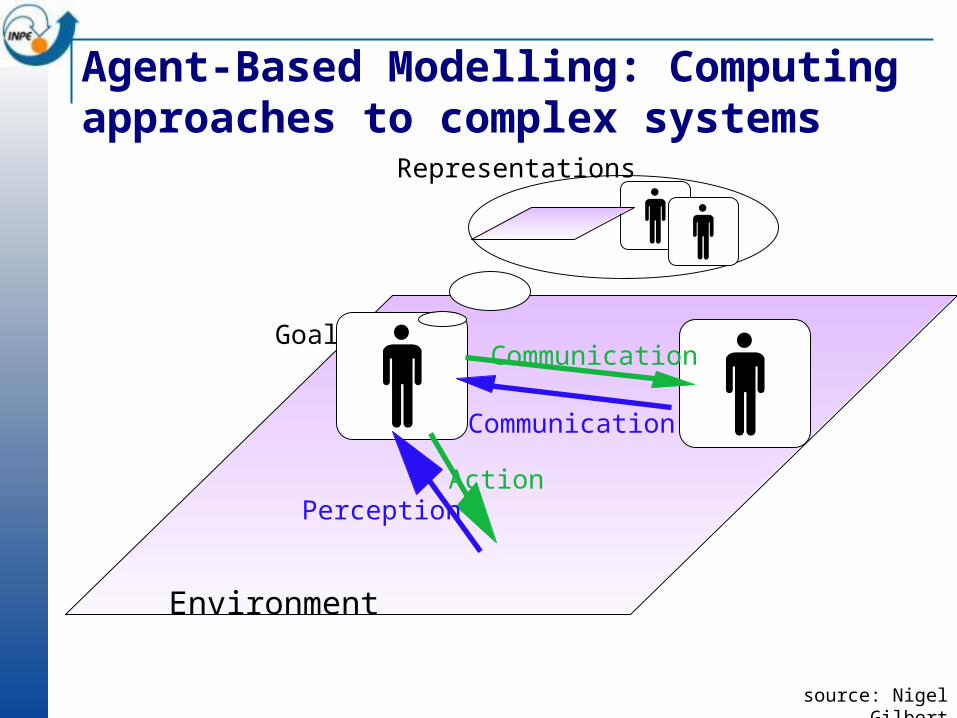
Agent-Based Modelling: Computing approaches to complex systems
Goal
Environment
Representations
Communication
ActionPerception
Communication
source: Nigel Gilbert
Agen
t
Spa
ce
Space Agent
source: Benenson and Torrens, “Geographic Automata Systems”, IJGIS, 2005
Modelling collective spatial actions
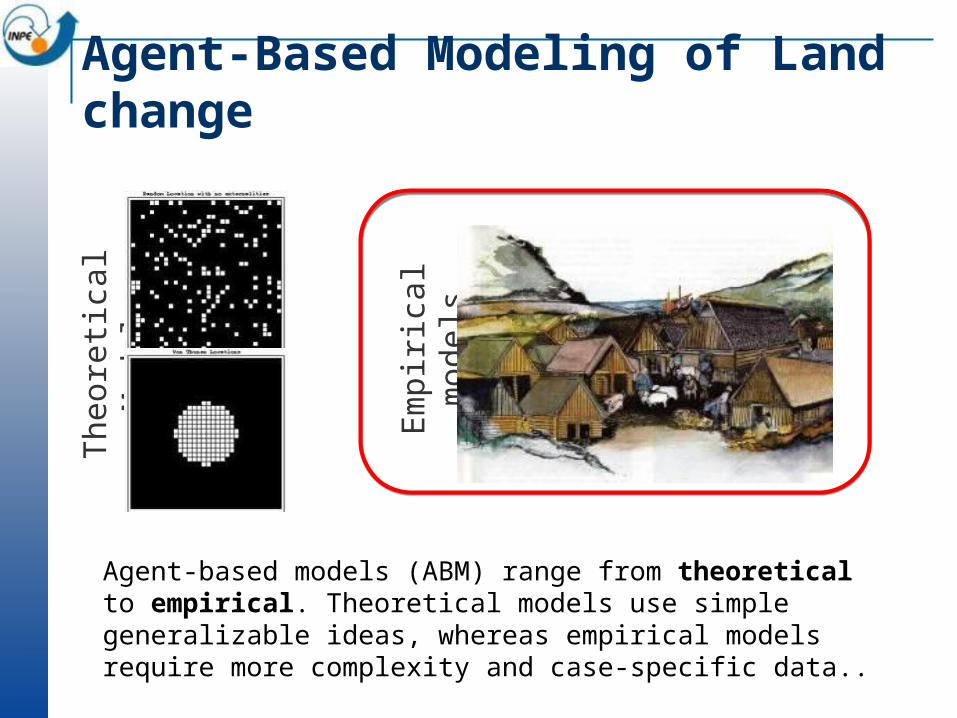
Agent-Based Modeling of Land changeT
heor
etic
al M
odel
s
Em
piri
cal m
odel
s
Agent-based models (ABM) range from theoretical to empirical. Theoretical models use simple generalizable ideas, whereas empirical models require more complexity and case-specific data..
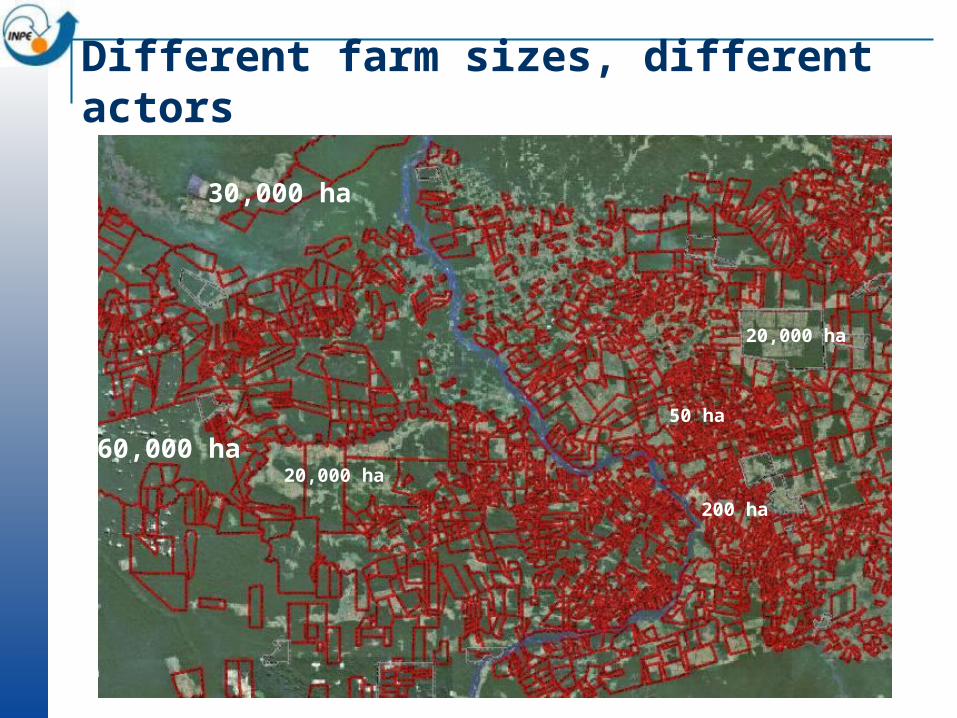
61,000 ha
30,000 ha
50-200 ha
60,000 ha
30,000 ha
50 ha
20,000 ha
20,000 ha
200 ha
Different farm sizes, different actors
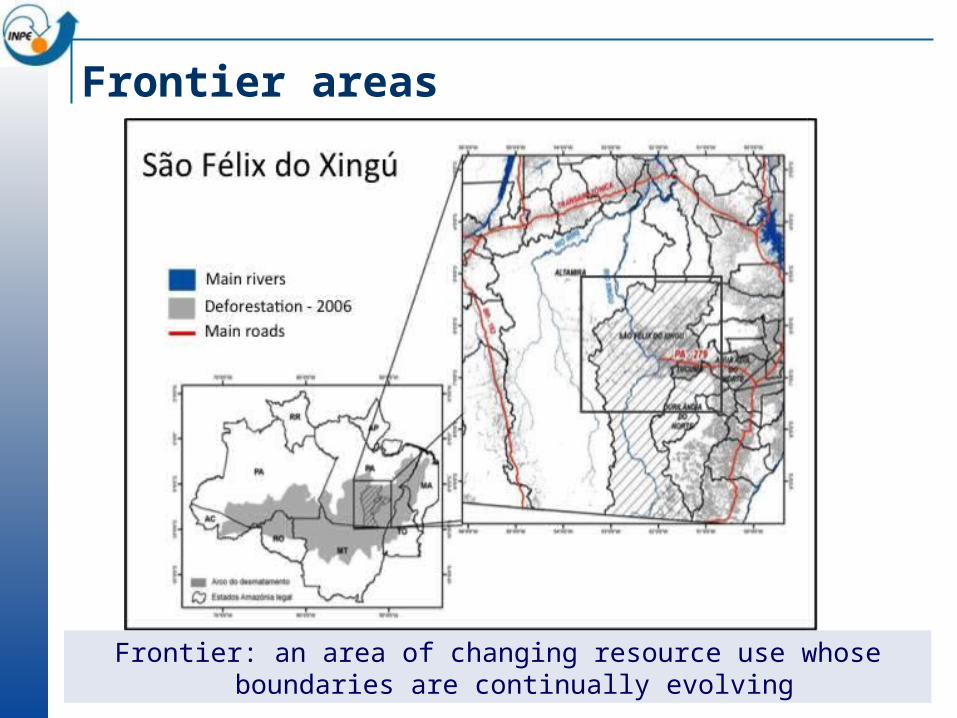
Frontier areas
Frontier: an area of changing resource use whose boundaries are continually evolving
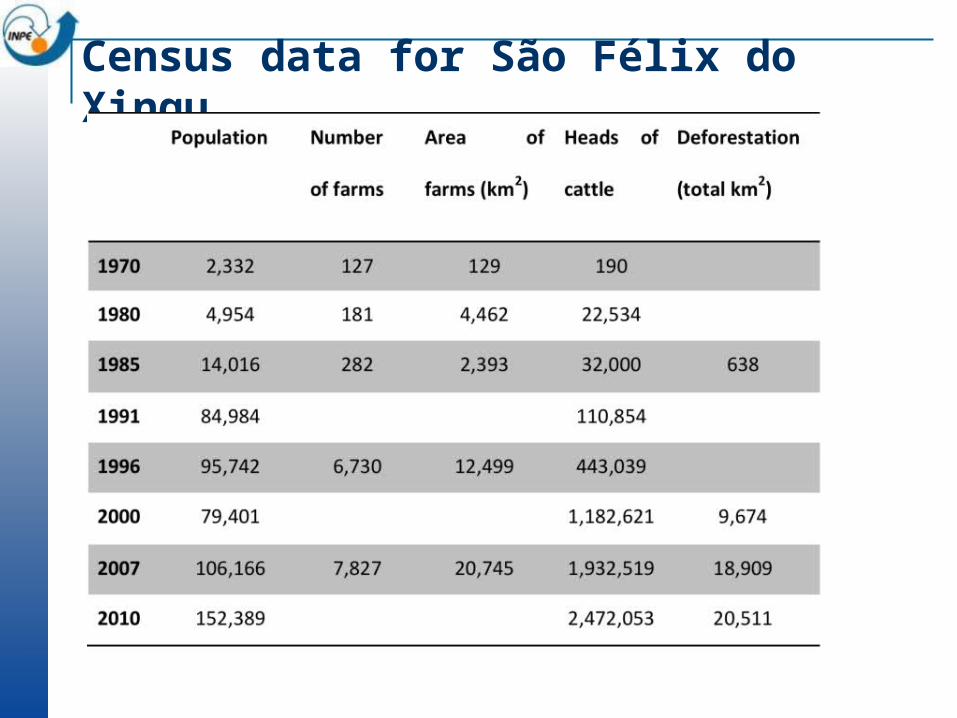
Census data for São Félix do Xingu
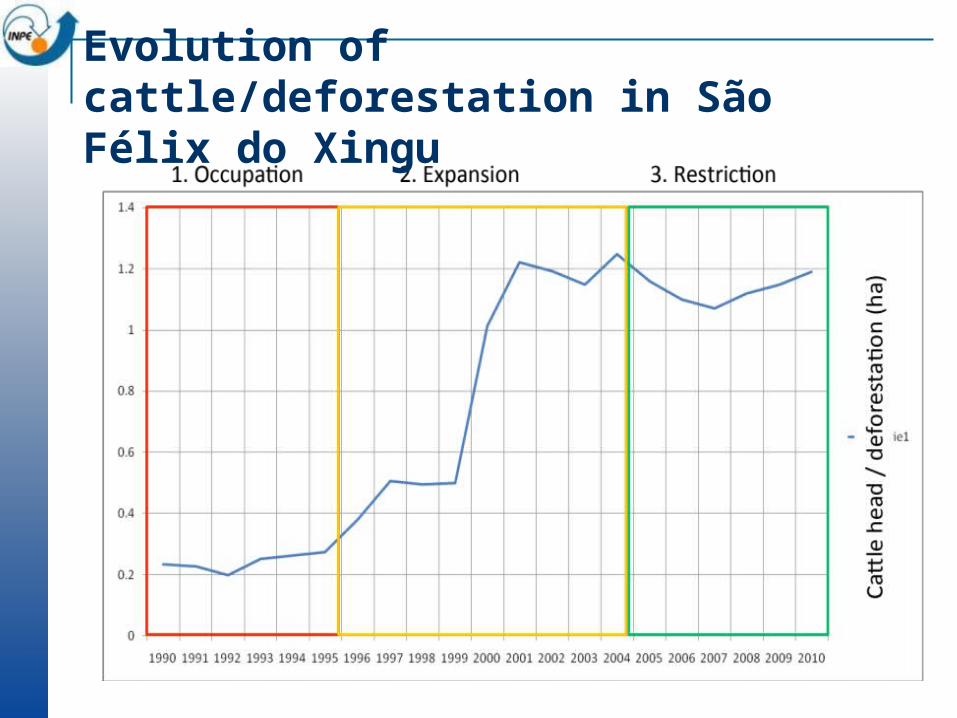
Evolution of cattle/deforestation in São Félix do Xingu
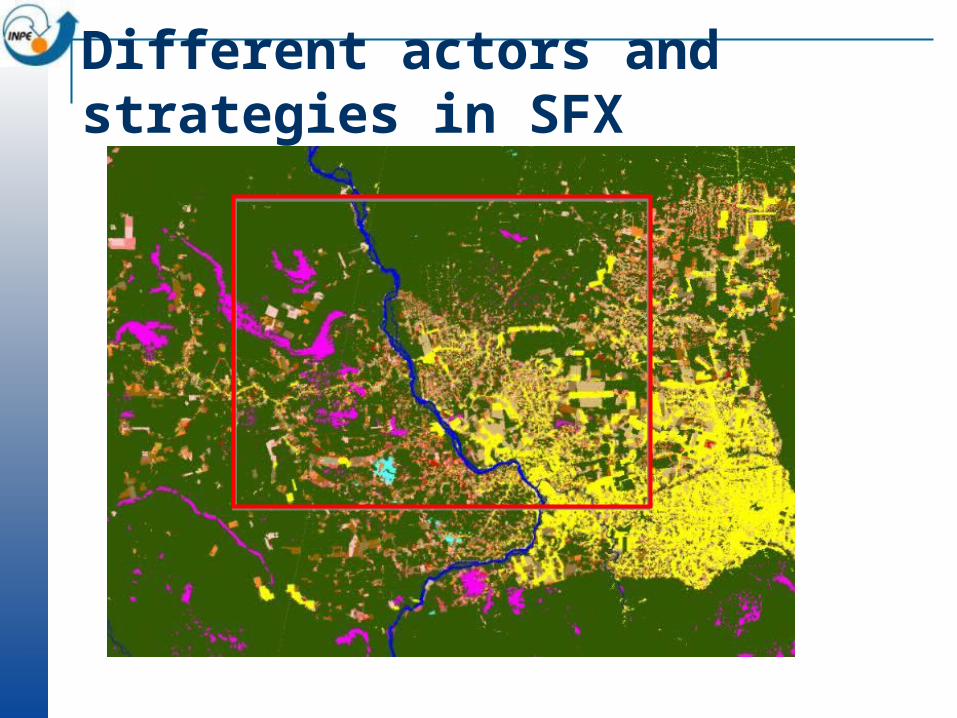
Different actors and strategies in SFX
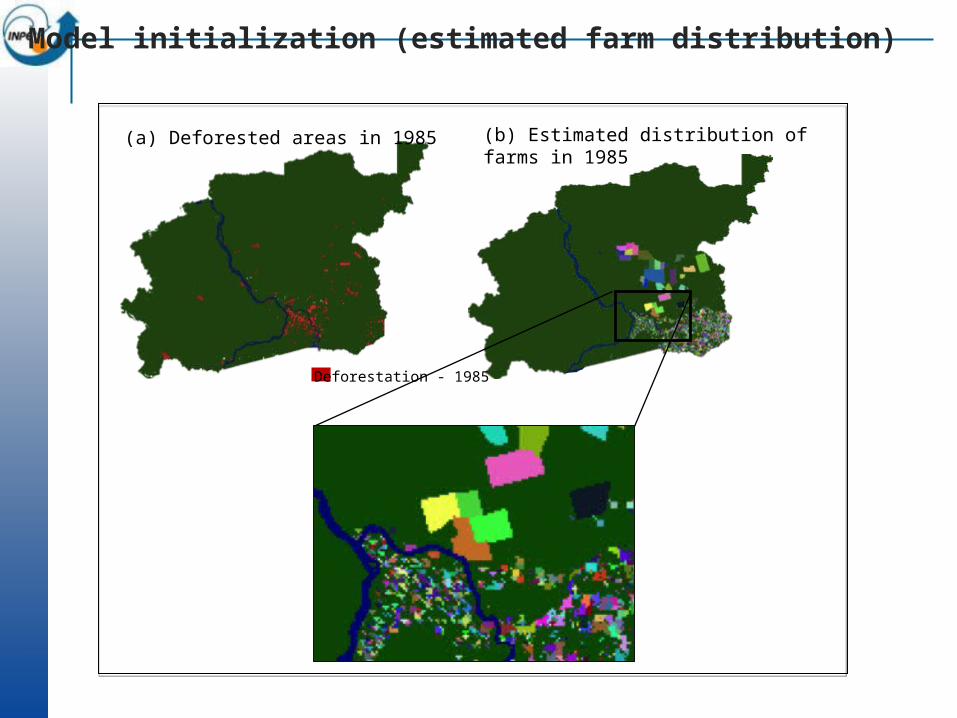
Model initialization (estimated farm distribution)
(a) Deforested areas in 1985 (b) Estimated distribution of farms in 1985
Deforestation - 1985
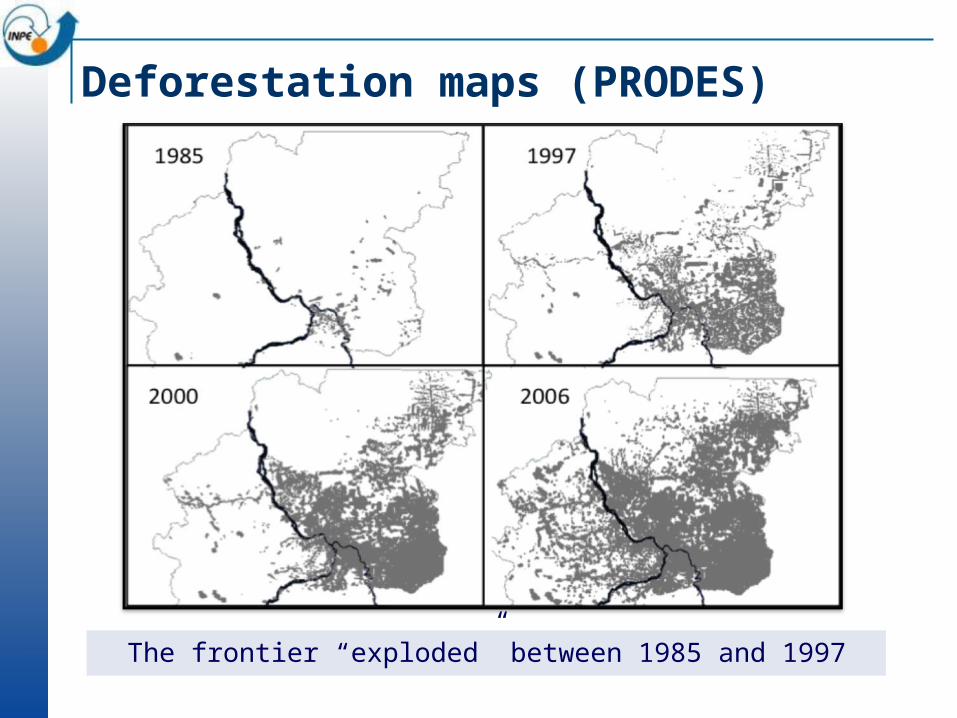
Deforestation maps (PRODES)
The frontier “exploded” between 1985 and 1997
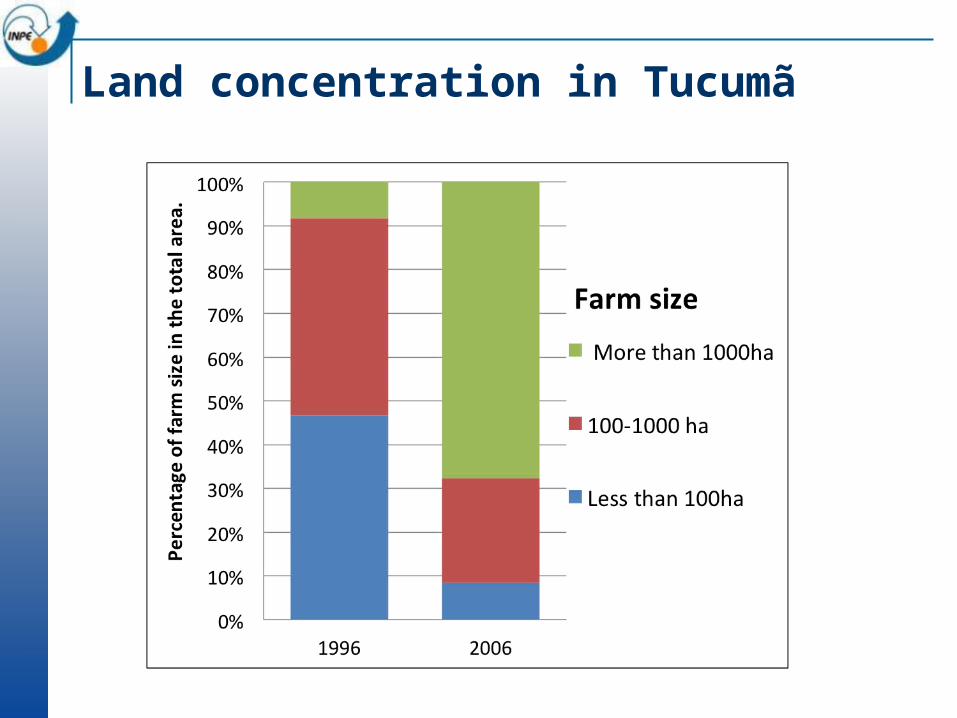
Land concentration in Tucumã
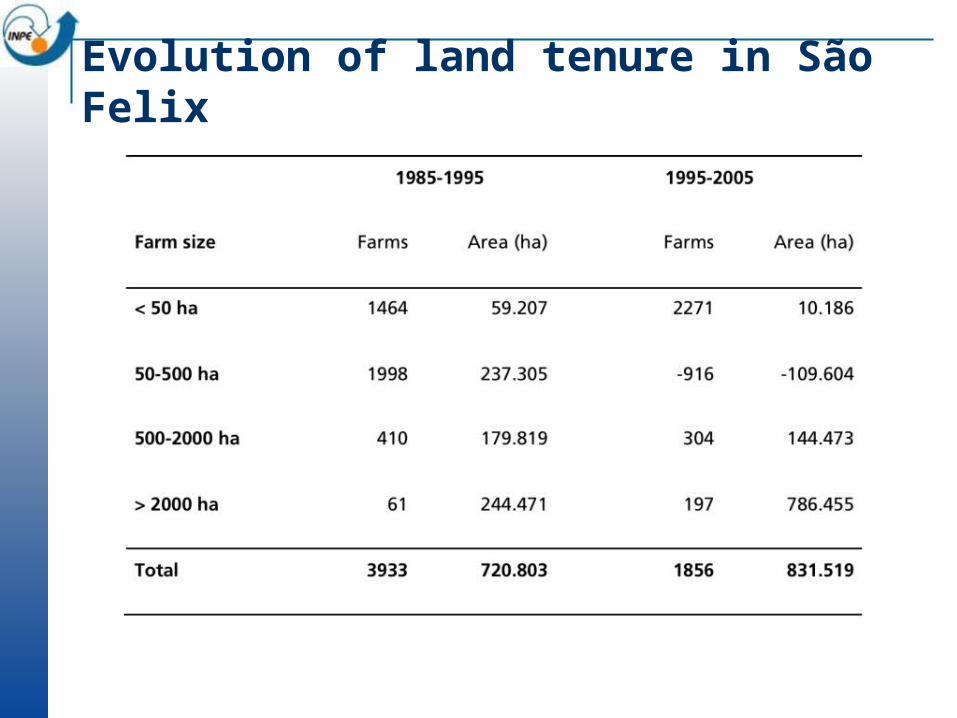
Evolution of land tenure in São Felix
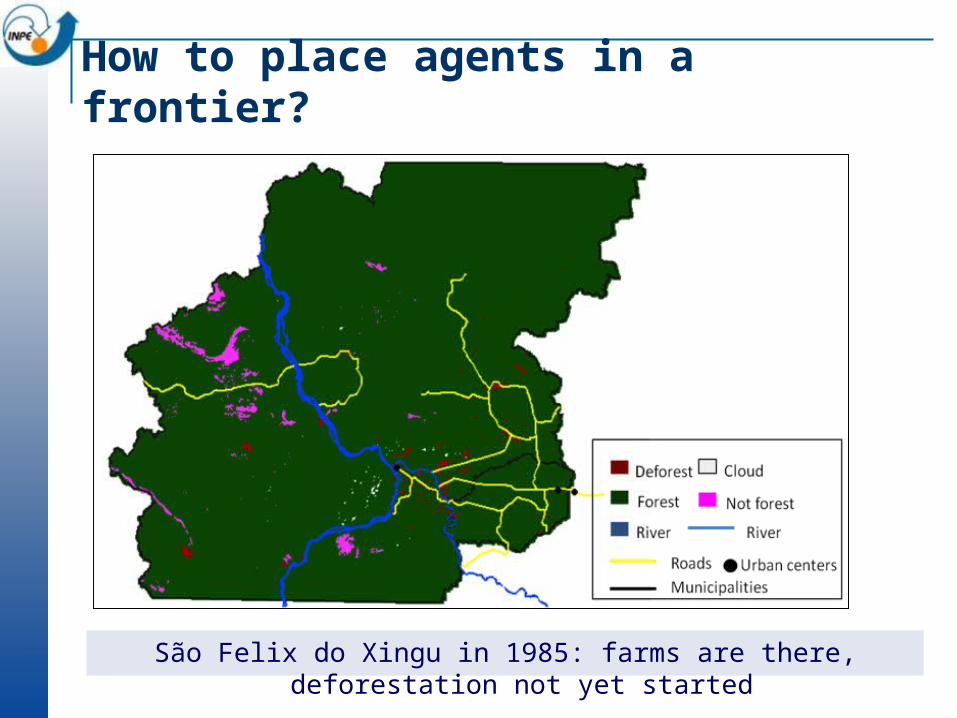
How to place agents in a frontier?
São Felix do Xingu in 1985: farms are there, deforestation not yet started
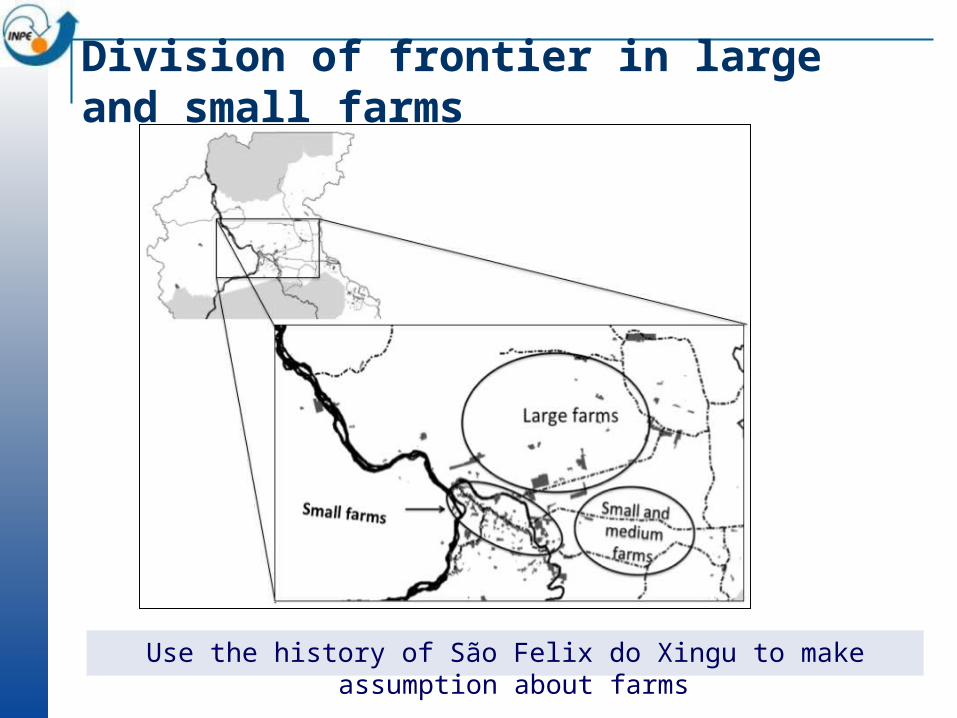
Division of frontier in large and small farms
Use the history of São Felix do Xingu to make assumption about farms
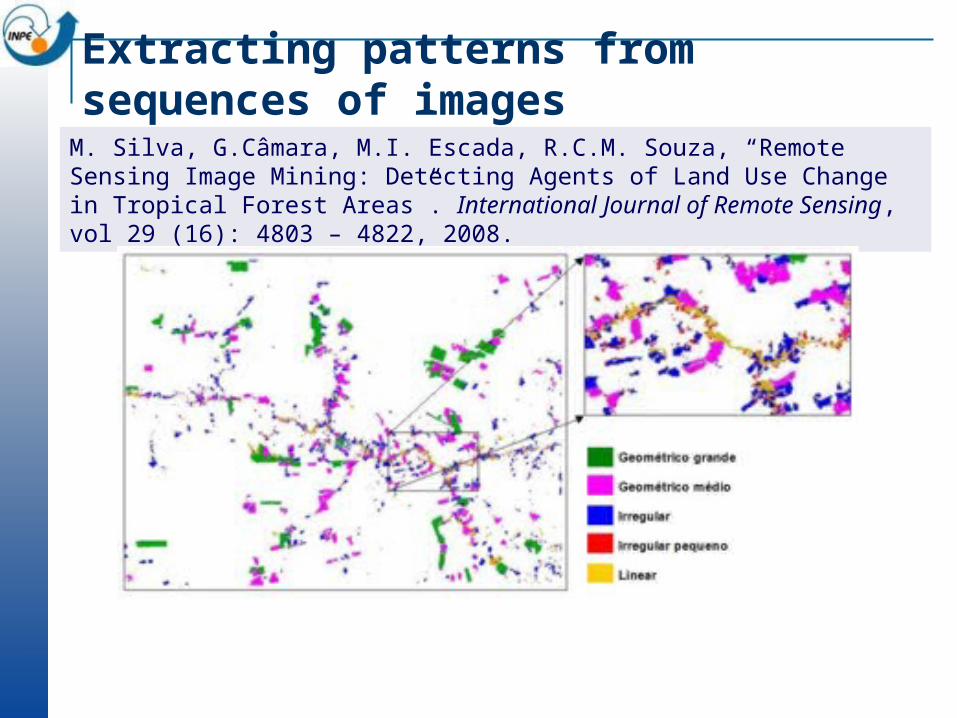
Extracting patterns from sequences of images
M. Silva, G.Câmara, M.I. Escada, R.C.M. Souza, “Remote Sensing Image Mining: Detecting Agents of Land Use Change in Tropical Forest Areas”. International Journal of Remote Sensing, vol 29 (16): 4803 – 4822, 2008.
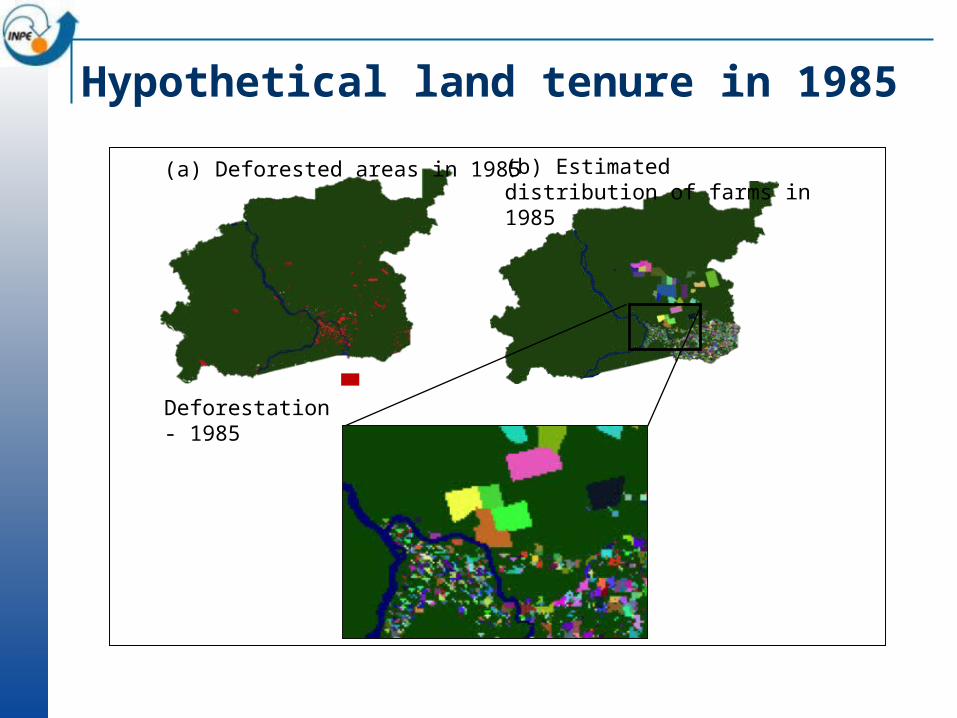
Hypothetical land tenure in 1985
(a) Deforested areas in 1985 (b) Estimated distribution of farms in 1985
Deforestation - 1985
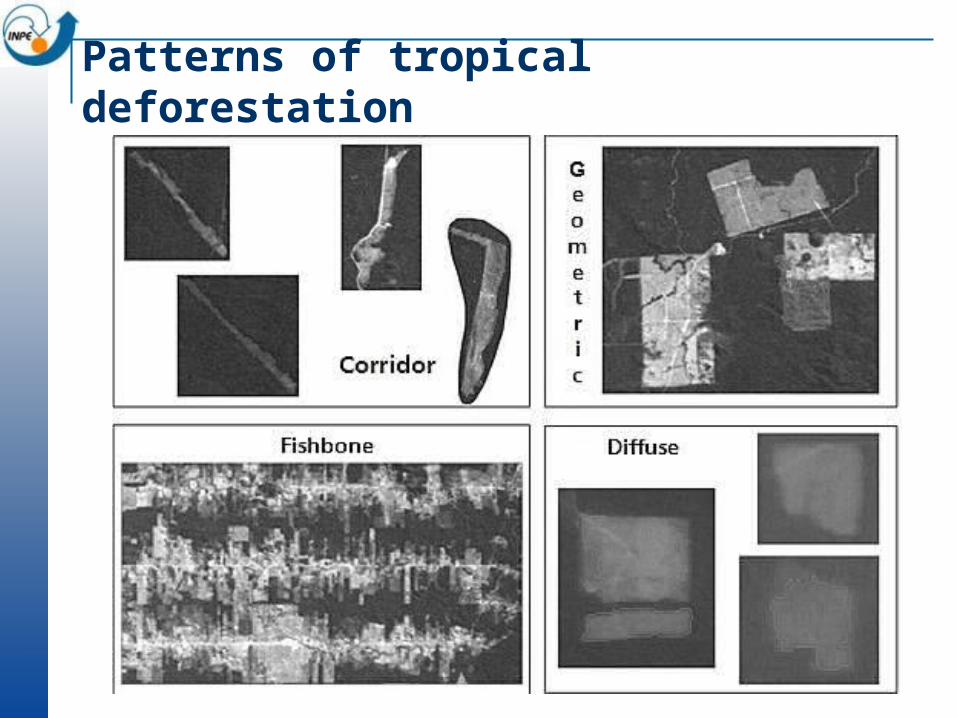
Patterns of tropical deforestation
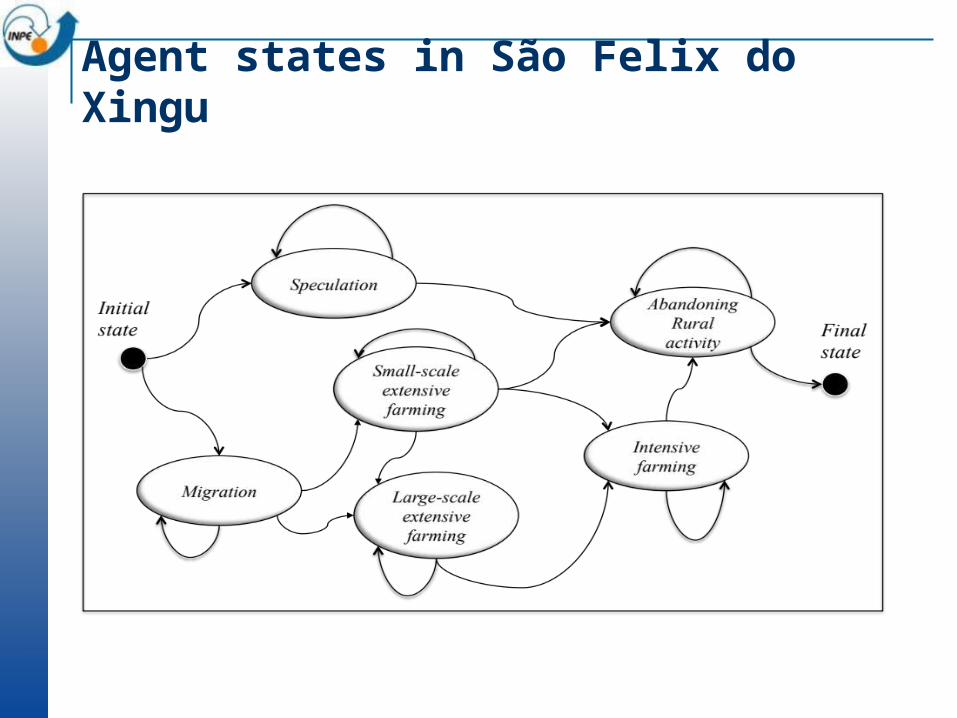
Agent states in São Felix do Xingu
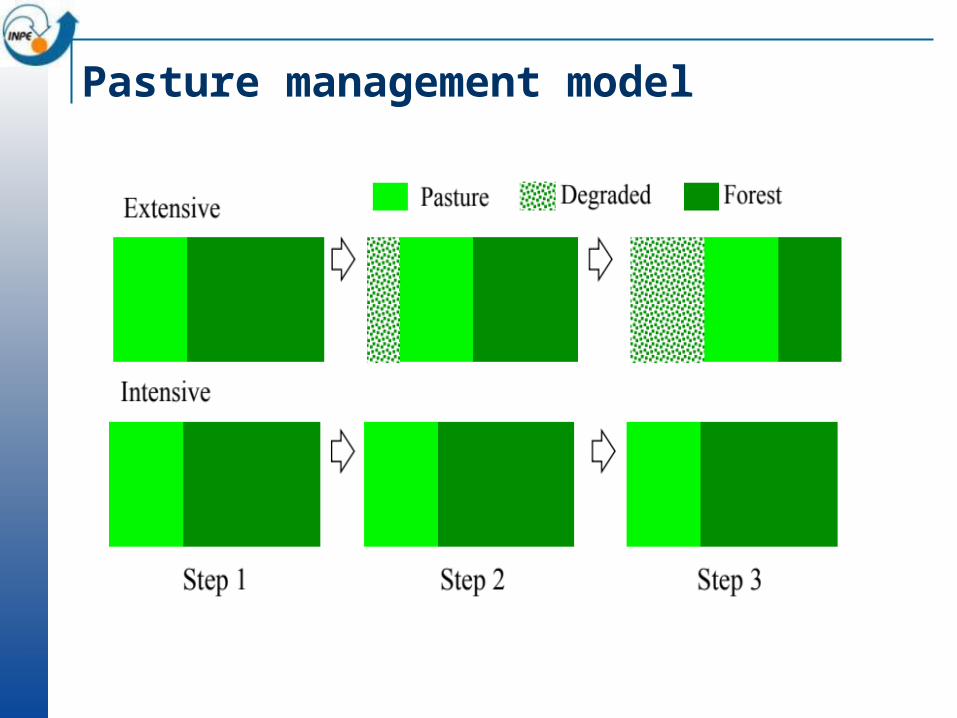
Pasture management model
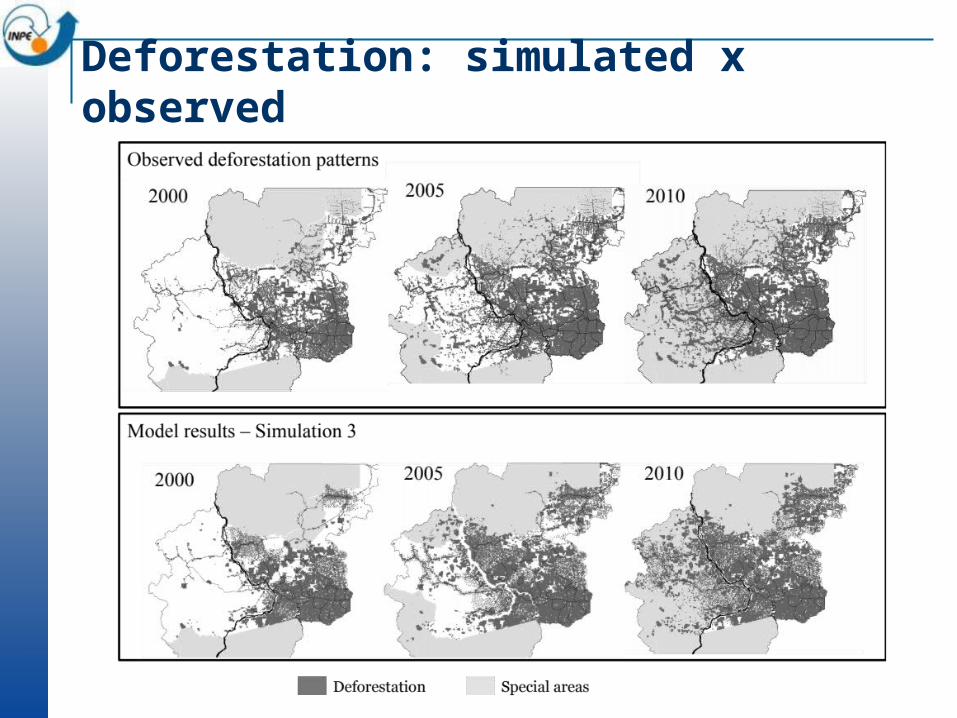
Deforestation: simulated x observed
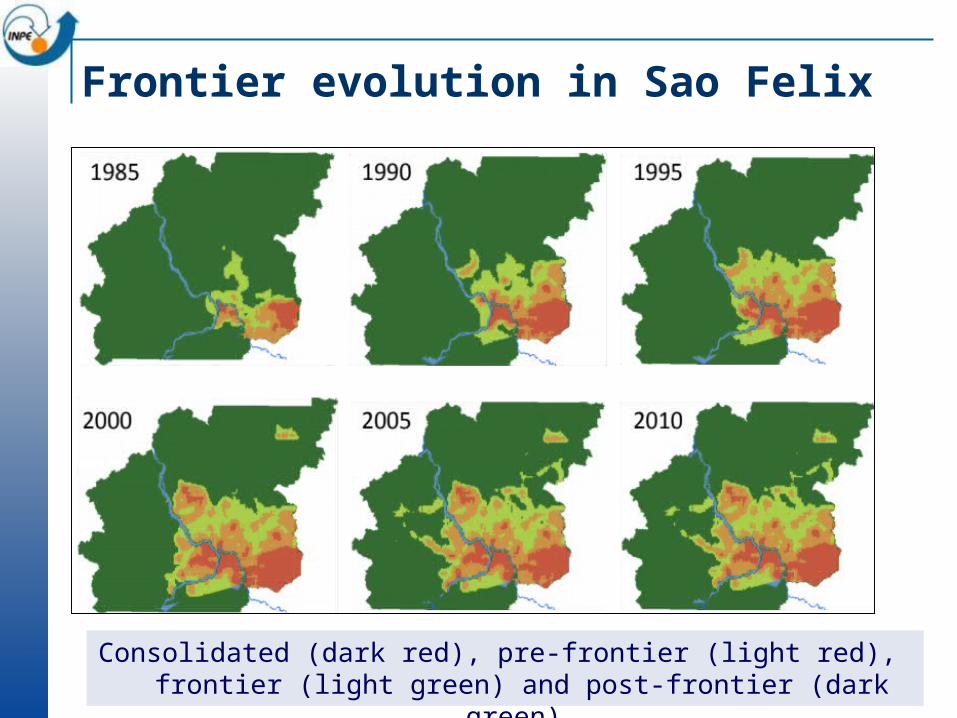
Frontier evolution in Sao Felix
Consolidated (dark red), pre-frontier (light red), frontier (light green) and post-frontier (dark green).
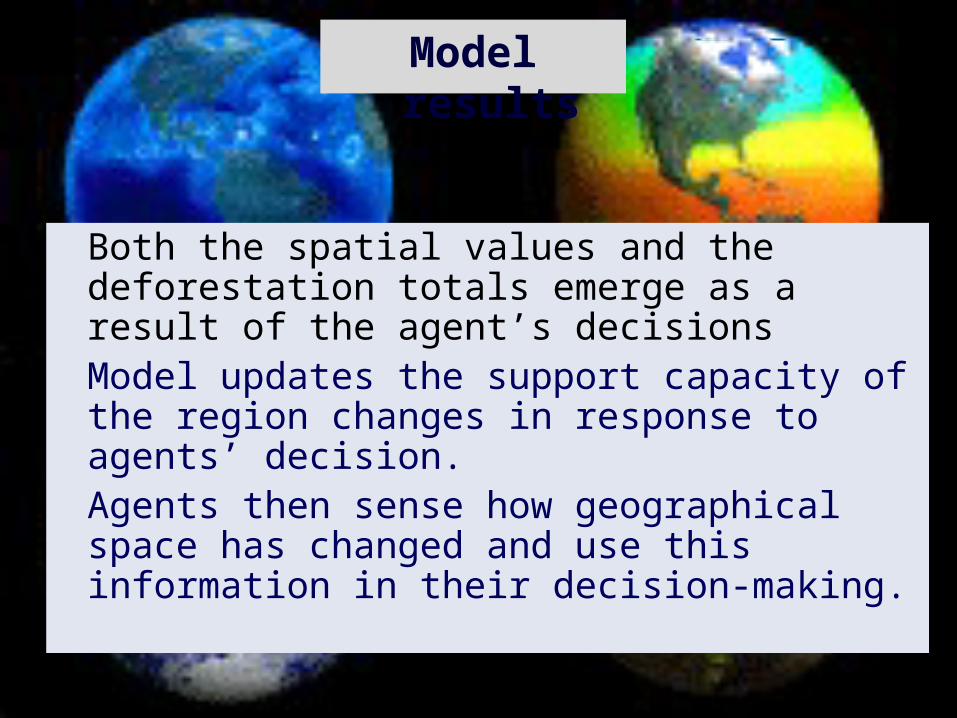
Both the spatial values and the deforestation totals emerge as a result of the agent’s decisions Model updates the support capacity of the region changes in response to agents’ decision. Agents then sense how geographical space has changed and use this information in their decision-making.
Model results
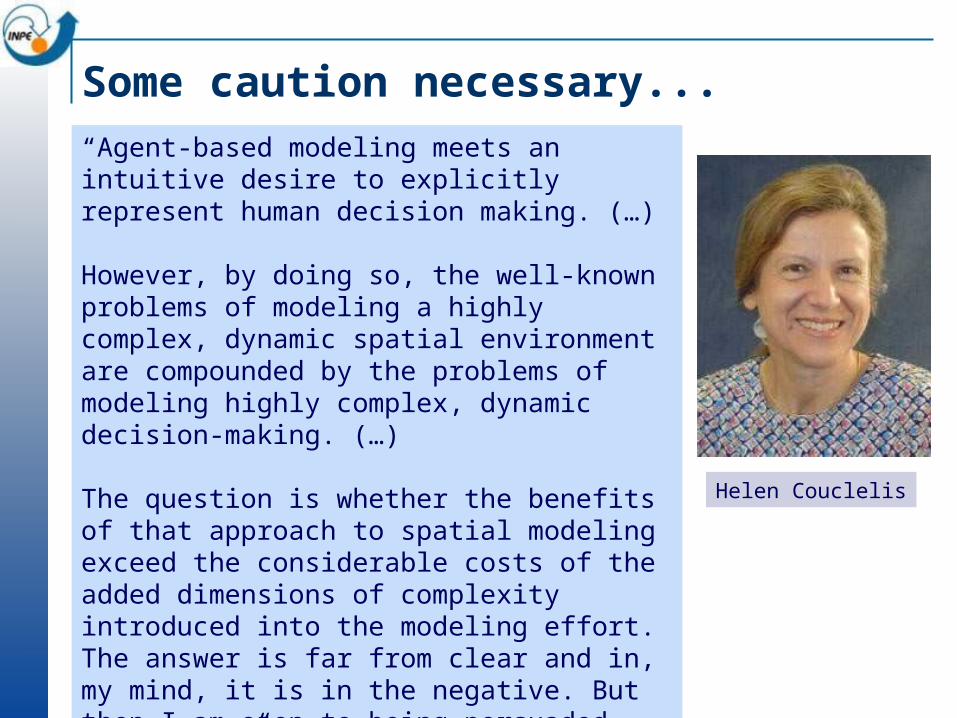
“Agent-based modeling meets an intuitive desire to explicitly represent human decision making. (…)
However, by doing so, the well-known problems of modeling a highly complex, dynamic spatial environment are compounded by the problems of modeling highly complex, dynamic decision-making. (…)
The question is whether the benefits of that approach to spatial modeling exceed the considerable costs of the added dimensions of complexity introduced into the modeling effort. The answer is far from clear and in, my mind, it is in the negative. But then I am open to being persuaded otherwise ”.
(from “Why I no longer work with agents”, 2001 LUCC ABM Workshop)
Some caution necessary...
Helen Couclelis

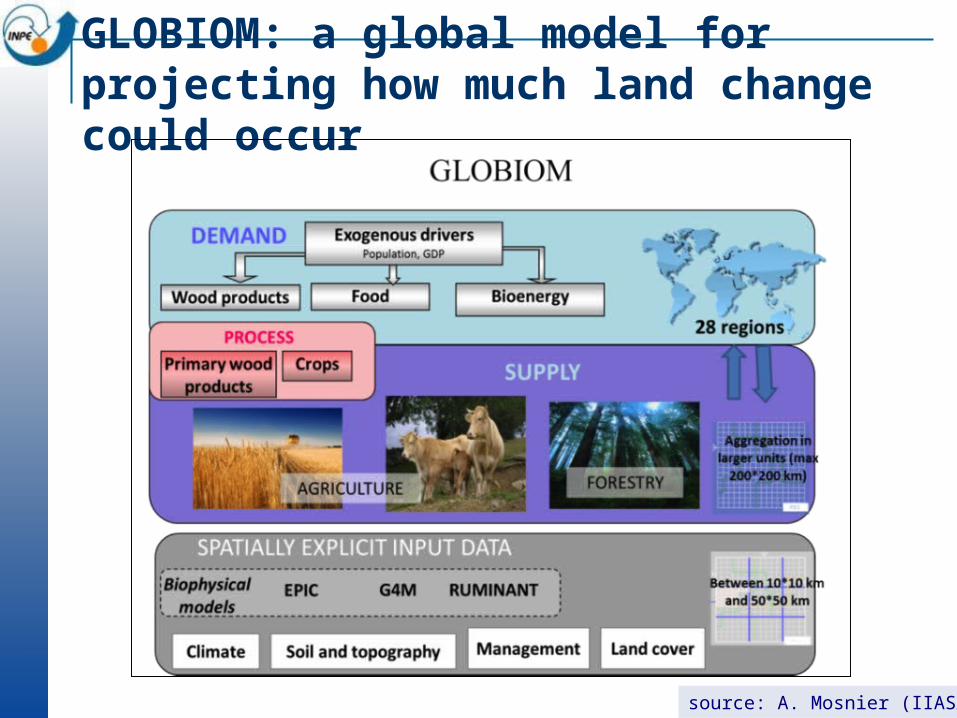
GLOBIOM: a global model for projecting how much land change could occur
source: A. Mosnier (IIASA)
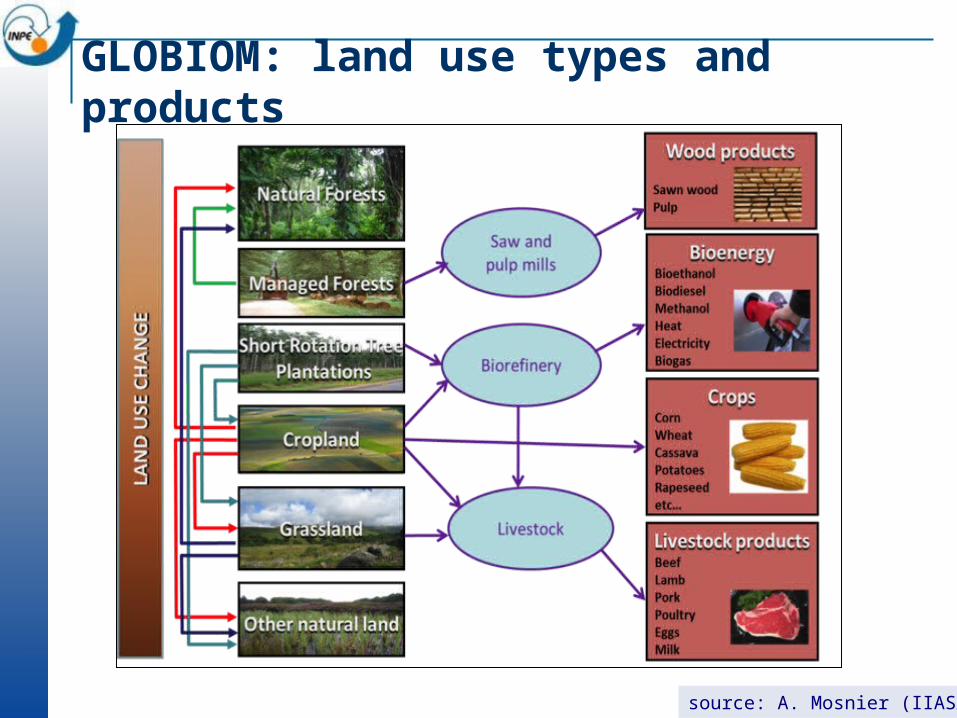
GLOBIOM: land use types and products
source: A. Mosnier (IIASA)
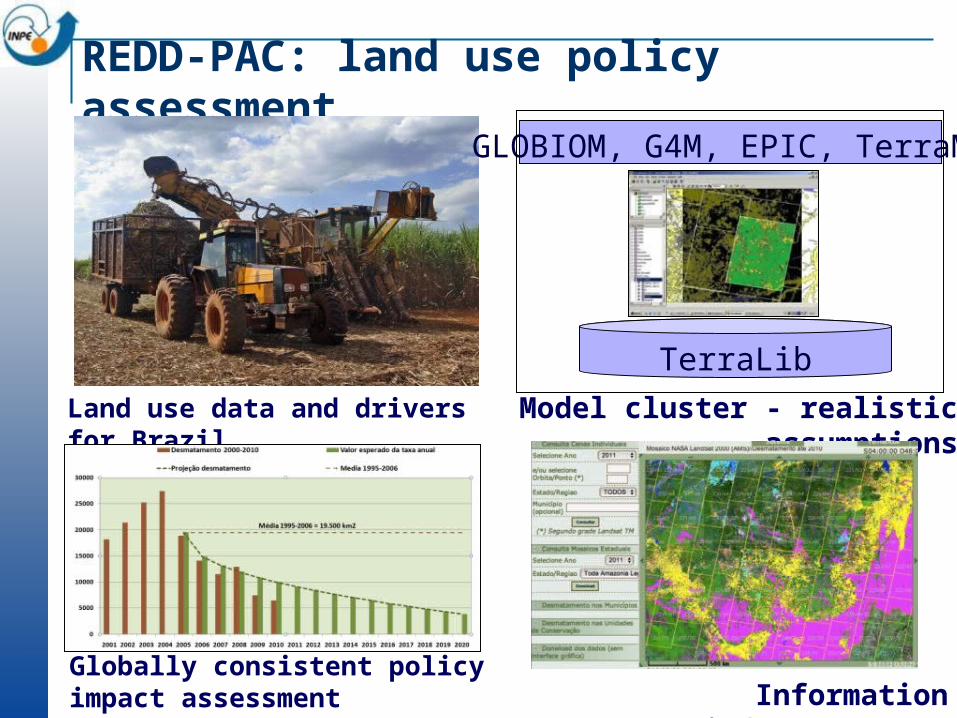
REDD-PAC: land use policy assessment
Land use data and drivers for Brazil Model cluster - realistic assumptions
Globally consistent policy impact assessment Information infrastructure
GLOBIOM, G4M, EPIC, TerraME
TerraLib