land-use and land c ov er, se dimen t and nutrien t hot...
TRANSCRIPT

Land-use and land cover, sediment and nutrient hotspot areas changes in Lake Tanganyika
Basin
E. AZANGA1, M. MAJALIWA2, F. KANSIIME2, N. MUSHAGALUSA1, K. KARUME1 and M.M. TENYWA 2
1Université Evangélique en Afrique, Faculté d’Agronomie et Environnement, B.P. 3323, Bukavu- R,D. Congo2Makerere University, College of Agicultural and Environmental Sciences, P. O. Box 7062, Kampala, Uganda
Corresponding author: [email protected]
African Journal of Rural Development, Vol. 1(1): 2016: pp. 75 - 90
This article is lincenced under a Creative Commons license, Attribution 4.0 International (CC BY 4.0)
ABSTRACT
The impact of global land use and land cover changes in relation to climate change and declining biodiversityhas been a subject of interest in the recent years. Nonetheless, there is limited data capturing trends in landuse and land cover changes in the Tanganyika catchment. This study characterized the trend in land use/cover changes and examined the change in sediment and nutrients hotspot areas in the Kalimabenge micro-catchment, for the last 40 years. Land use/cover change was quantified and reconstructed by analyzing aseries of Landsat images taken in 1973, 1986, and 2010 using the Integrated Land and Water InformationSystem (ILWIS) 3.3 software and field observations. Both supervised and non-supervised classificationswere used in the classification of the Landsat images in order to obtain the land use/cover change map.Sediment and nutrient loading into the Kalimabenge micro-catchment were modeled using ArcSWATsoftware integrated in ArcGIS 9.3. ArcSWAT was calibrated using two years field observations at the riveroutlet into Lake Tanganyika. Results showed that the dominant land use/covers in the micro-catchment arecultivated land, followed by forest/tree plantations, grassland and built-up area. Grassland/savannah hasdeclined gradually over time, forest/woodlot land increased gradually, built up areas acreage remainedquasi similar, cultivated land followed a quadratic trend. The partial sources of sediments, runoff andphosphorous changed for the last 4 decades. These sources areas first decreased in 1986 and then increasedin 2010.
Key words: Deforestation, Lake Tanganyika, pollution loading, soil erosion, South-Kivu, Uvira
RESUME
L’impact des changements globaux dans l’utilisation des terres et la couverture végétale en rapport avecles changements climatiques et la réduction de la biodiversité a été un sujet d’intérêt ces dernières années.Néanmoins, il existe des données limitées reproduisant les tendances dans les changements de l’utilisationdes terres et de la couverture végétale pour le bassin versant de Tanganyika. Cette étude a caractérisé latendance dans les changements de l’utilisation des terres et de la couverture végétale et a examiné lechangement dans les régions à point chaud de sédiments et de nutriments dans le micro-bassin versant deKalimabenge, pour les quatre dernières décennies. Le changement dans l’utilisation des terres et dans lacouverture végétale a été quantifié et reconstruit en analysant une série d’images Landsat prises en 1973,1986 et 2010 en utilisant le logiciel ILWIS 3.3 qui est un système intégré d’information sur l’eau et la terre eten utilisant les observations sur le terrain. La classification supervisée et celle non supervisée ont étéutilisées dans la classification des images Landsat afin d’obtenir la carte de changement dans l’utilisationdes terres et la couverture végétale. Les chargements des sédiments et des nutriments dans le micro-bassinversant de Kalimabenge ont été modélisés à l’aide du logiciel ArcSWAT intégré dans ArcGIS 9.3. ArcSWATa été calibré en utilisant des observations sur le terrain de deux ans à l’exutoire de la rivière dans le lacTanganyika. Les résultats ont montré que l’utilisation des terres et la couverture végétale dominante dansle micro-bassin versant sont les terres cultivées, suivies par la forêt/les plantations d’arbres, les prairies etles agglomérations urbaines. La prairie et la savane ont diminué progressivement au cours du temps, laforêt et les espaces boisés ont augmenté progressivement, la superficie des zones d’agglomération urbaineest restée quasi similaire et les terres cultivées ont suivi une tendance quadratique. Les sources partielles
Date received: 10 January, 2016 Date accepted: 18 March, 2016
ISSN 2415-2838

76
Hotspot areas changes in Lake Tanganyika Basin
de sédiments, de ruissellement et du phosphore ont changé durant les quatre dernières décennies. Ceszones sources ont d’abord diminué en 1986, puis elles ont augmenté en 2010.
Mots clés: Deforestation, Lake Tanganyika, pollution loading, soil erosion, South-Kivu, Uvira
INTRODUCTION
Over the last decades there has been increasing interestin the impacts of global land use and land cover changes(Wood et al., 2004). These changes are associated witha wide variety of issues, including declining biodiversity(Darkoh, 2003), change in hydrology and ecosystemservices, global climate change, food insecurity, andland degradation. Human activities are recognizedworldwide as the causes of these changes (Timberlake,1985; Biswas et al., 1987; Houghton, 1994; Moser,1996; de Koning et al., 1999; Kok et al., 2001). Severalstudies (Elkholm, 1994; Isabirye et al., 2001; Albinuset al., 2008; Kusimi, 2008) have shown significantassociation between land use changes and horizontalexpansion of agricultural land, settlements andindustries, fuelwood gathering and logging in Africa.In the last few decades, conversion of grassland,woodland, wetlands and forest into cropland, pasture,built up area, plantations and industrial areas has risendramatically in the tropics (Houghton, 1994; Majaliwaet al., 2010; Ouedraogo et al., 2010; Barasa et al.,2011). Many factors cited as causes of land use changein Africa, include inappropriate farming practices onfragile lands without conservation measures (Kajembeet al., 2005), rapid local population growth ormigrations (Bilsborrow, 1992; Lombardozzi andO’Reilly; Swanson, 1996), inadequate land tenure,overstocking (Kajembe et al., 2005), over-exploitationof natural resources (Emerton et al., 1998; Kyambaddeet al., 2004; Schuyt, 2005), shifting cultivation inforests, and the use of firewood or charcoal as fuel bythe poor (Babanyara and Saleh, 2010).
Lake Tanganyika is one of the richest fresh waterecosystems in the world. However, it is among themost highly sensitive and fragile ecosystem in the AfricaGreat Lakes Region (Bruton and Merron, 1990;O’Reilly, 2002; Snoeks et al., 2000). Currently itpossesses a unique type of flora and fauna of globalinterest (Harrison et al., 1982) but its basin has beenexperiencing significant land-use/cover changes in thelast five decades due to anthropogenic activities (Alinet al., 2002; Downing et al., 1999; O’Reilly, 2002)and most especially deforestation and wildfire (Cohenet al., 2005). The latter are induced by humans insearch of firewood and new land for farming (Mashalla,1988). Large-scale land clearing for cultivation andlarge-scale timber harvesting for fuelwood have beenreported to be the root causes of deforestation carriedout by local people and refugees in order to satisfytheir need for food and energy (Cohen et al., 1993a;Cohen et al., 1993b). In the last fifteen years political
instability, tribal and ethnic conflicts, and repetitivewars, causing migration of populations have aggravatedthe already fragile conditions in the region (Black et
al., 2008; Majaliwa, 2008; Bagalwa et al., 2015).
Changes in land-use/cover, poor management of themicro-catchment compounded with climate changehave enormously contributed to increased soil erosionand pollution related loadings into the fresh surfacewaters of Lake Tanganyika (O’Reilly et al., 2003;Rosenzweig et al., 2008). Sediment and nutrientsloading from watersheds towards the river water is afunction of the size of the river micro-catchment, itstopography, climate, soil characteristics and vegetationcover and their distribution and the nature and qualityof other human activities (Gorgula and Connell, 2004;Houlahan and Findlay, 2004; Jha et al., 2004; Liu et
al., 2004; Puigdefábregas, 2005; Thomasa et al., 1999;Young et al., 1989; Turner, 1993). Values of 300 to700 t/ha/yr have been reported in Rwanda, on 20 to60% slopes (Roose and Ndayizigiye, 1997). In theLake Tanganyika basin like other lake basins in theregion, non-point agricultural land sources of pollutionhave been identified as a major source of sediment andnutrients in surface waters (Cooke and Prepas, 1998;Devito et al., 2000; Majaliwa and Magunda, 2004).
In the late 1970s, a concerted effort was made in themanagement of the Lake Tanganyika catchment inEastern Democratic Republic of Congo (DRC) throughafforestation. This approach coupled with promotionof energy efficient technology was supposed to yieldsignificant environmental and economic benefits (Blackand Sessay, 1997; Kristy and Susan, 2002).Unfortunately, these reform attempts were thwartedby a series of exogenous shocks including sectorialand uncoordinated nature of actions and lack ofadequate implementation of strategy. The strategy didnot take into account the demographic pressure onforest resources and the evolution of household energyconsumption. Thus, when the region suffered fromthe scarcity or lack of electricity and the unavailabilityof kerosene, significant changes occurred in terms ofland-use/cover in the region (Elkan, 1988).
Several scholars report that the Lake’s basin isundergoing deforestation at an alarming rate; around50% of the central areas have been cleared of theirnatural vegetation, leading to increased erosion (Cohenet al., 2005; Cohen et al., 1993b; Jorgensen et al.,2006; Lambin et al., 2003). However, very few studieshave tried to quantify the amount of sediments and
77
E. AZANGA et al.
nutrients loading into the Lake waters due to the on-going land-use/cover change, and identify the sourcesof these sediments and nutrients in the DRC side. Thisstudy therefore characterizes the trend in land use/cover changes, and examined the changes of sedimentand nutrients hotspot areas in Kalimabenge micro-catchment for the last four decades. This informationcould be used to design a quick restoration strategy ofthe micro-catchment and the Lake Tanganyikacatchment in general.
MATERIALS AND METHODS
Description of the study area
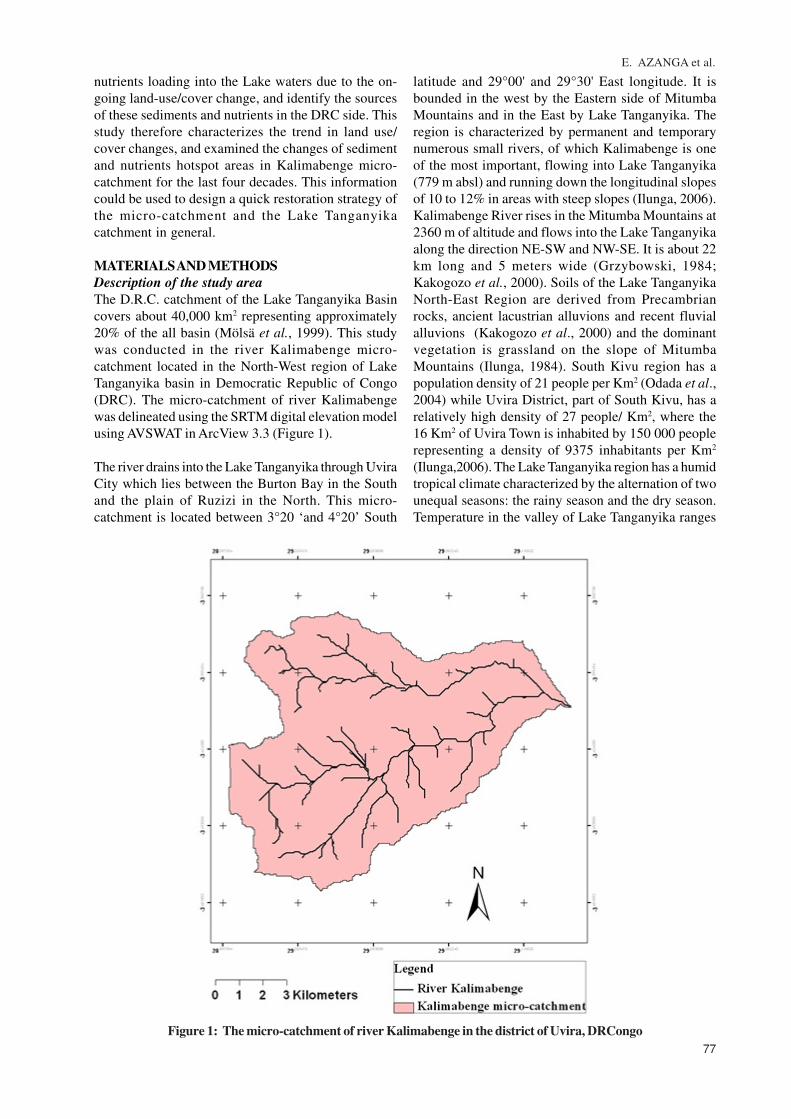
The D.R.C. catchment of the Lake Tanganyika Basincovers about 40,000 km2 representing approximately20% of the all basin (Mölsä et al., 1999). This studywas conducted in the river Kalimabenge micro-catchment located in the North-West region of LakeTanganyika basin in Democratic Republic of Congo(DRC). The micro-catchment of river Kalimabengewas delineated using the SRTM digital elevation modelusing AVSWAT in ArcView 3.3 (Figure 1).
The river drains into the Lake Tanganyika through UviraCity which lies between the Burton Bay in the Southand the plain of Ruzizi in the North. This micro-catchment is located between 3°20 ‘and 4°20’ South
latitude and 29°00' and 29°30' East longitude. It isbounded in the west by the Eastern side of MitumbaMountains and in the East by Lake Tanganyika. Theregion is characterized by permanent and temporarynumerous small rivers, of which Kalimabenge is oneof the most important, flowing into Lake Tanganyika(779 m absl) and running down the longitudinal slopesof 10 to 12% in areas with steep slopes (Ilunga, 2006).Kalimabenge River rises in the Mitumba Mountains at2360 m of altitude and flows into the Lake Tanganyikaalong the direction NE-SW and NW-SE. It is about 22km long and 5 meters wide (Grzybowski, 1984;Kakogozo et al., 2000). Soils of the Lake TanganyikaNorth-East Region are derived from Precambrianrocks, ancient lacustrian alluvions and recent fluvialalluvions (Kakogozo et al., 2000) and the dominantvegetation is grassland on the slope of MitumbaMountains (Ilunga, 1984). South Kivu region has apopulation density of 21 people per Km2 (Odada et al.,2004) while Uvira District, part of South Kivu, has arelatively high density of 27 people/ Km2, where the16 Km2 of Uvira Town is inhabited by 150 000 peoplerepresenting a density of 9375 inhabitants per Km2
(Ilunga,2006). The Lake Tanganyika region has a humidtropical climate characterized by the alternation of twounequal seasons: the rainy season and the dry season.Temperature in the valley of Lake Tanganyika ranges
Figure 1: The micro-catchment of river Kalimabenge in the district of Uvira, DRCongo

78
Hotspot areas changes in Lake Tanganyika Basin
between 25 ° C and 20° C with an average annualvalue of 24 °C and Year 2010 appears to be the rainiestof the study area for the period from 2002 to 2010with an annual rainfall of 1386 mm. The main growingseasons for annual crops is September-October forthe first growing season and in February-March forthe second season (Meadows and Zwick, 2000).Cropping in wetlands is done generally during the dryseason in June and July.
RESEARCH APPROACH
Land-use/cover change and its trend
Land use/cover change and its trend in the Kalimabengemicro-catchment was determined by analyzing threesets of ortho-rectified satellite images (Landsat TM/ETM, 1973, 1986 and 2000) taken in the dry seasonincluding (p186r062) for 1973, (p173r62_5t19860719)for 1986 (p173r062_7t20000615) for 2000 usingILWIS 3.3 software (Integrated Land and WaterInformation System). Both supervised and non-supervised classifications were used in the classificationof the Landsat images in order to obtain the land use/cover map for each year. Seven broad classes wereconsidered in the classification namely: Forest, smallscale cultivation, woodland, water bodies, built up area,grassland and bare ground ( Majaliwa, 2008). The 1973and 1986 land use/cover of the area was reconstructedusing both the classified map and local knowledgeobtained through targeted interviews. To obtain the2010 map a land-use/cover map of the micro-catchment was clipped from the USGS (2005) land-use map and updated using field observations. Todetermine the accuracy of the classification, a sampleof pixels was selected and then visited (or vice versa),in order to build a confusion matrix. Kappa index wasdetermined to verify the precision of classification(Fung and Chan, 1994). The overall accuracies of 0.7;0.75 and 0.8 were obtained for the 1973, 1986 and2000 images, respectively. In order to assess the trendin land use change, regression analysis was used byfitting a regression curve on the series of land use typesfor the analyzed years. The fitness of the regressionequation was determined by the regression coefficientand the significance of the relationship.
Determination of sediment and nutrients hotspot
dynamics
The dynamics of sediments and nutrients hotspots wasdetermined by assessing the trajectory of the hotspotcentre of gravity over the three studied periods ([1973-1986], [1986-2000] and [2000-2010]). Sediment andnutrients hotspots were estimated using the Soil WaterAssessment Tool (SWAT) software integrated inArcGIS, based on the Digital Elevation Model (DEM),land-use/cover, soils, and climate. The SRTM DEMwas obtained from the UNADRA dataset at College ofAgricultural and Environmental Sciences (CAES) of
Makerere University. Preliminary soil maps wereobtained from SOTER dataset at CAES and wereupdated using field data. Transects cutting across thedifferent units were laid down and soil cores were dugclose to the boundaries. Climate data was obtained fromUvira Research Centre of Hydro-biology (CRH). Gapfilling techniques were used to populate the dataset forthe period presenting missing data using the AgMERRAdataset from NASA.
Water quality and quantity monitoring
Water samples from the river were taken at the bridge-river level located at a distance of approximately 900m from the Lake Tanganyika. Physico-chemicalparameters such as temperature, electrical conductivity,pH and total dissolved solids (TDS) were measured insitu using a Cambo pH and EC apparatus. All otherparameters were analysed at the Hydro- biologyResearch Centre of Uvira using standard techniques.In addition, a staff gauge was installed near the bankof the river to measure water levels. Both water flowand water levels were measured twice a day at 9.00a.m. and 5.00 p.m. for twelve months, using a globalwater flow meter-Flow probe FP01. The rating curvewas then generated for the river to predict flow forprevious years when flow measurements were nottaken.
SWAT predictions
The SWAT predictions were calibrated using 2006 and2008 field data and validated using 2010 field dataset.The output of the model was re-classified using theFAO (1990) criteria for sediments (Table 1). Runoffclasses used in this study are presented in Table 1.
Data analysis
To determine land-use/cover change trend regressiontechniques were used in Genstat Discovery 3rd Edition.Tables and histograms were generated from thedescriptive statistics obtained using cross tabulationtool in SPSS. For water quality and modeled dataANOVA in Genstat Discovery 3rd Edition was used testfor difference between monthly data, and between theobserved and predicted water quality and quantityparameters for the different years. The correlationbetween water discharge and rainfall was alsodetermined using Genstat Discovery 3rd Edition.
RESULTS
Magnitude and trends of Land use/cover changes in
Kalimabenge
The distributions of land-use/cover in Kalimabengemicro-catchment covering an area of 9666.7 ha areshown in Figures 2.1, 2.2 and 2.3, and Table 5. During1973, the most predominant land use was cultivatedland (55.8%) followed by grassland (36.6%), built-upareas (7.2%) and forest/woodlands (0.4%). Cultivated

79
E. AZANGA et al.
Table 1: Sediment and runoff yield classes
Classes Very low Low Moderate High Extremely High
Sediment yield (t/Km2/yr) 0-200 200-1000 1000-5000 5000-9000 >9000Runoff yield (% of annual precipitation) 0-0.01 0.01-0.1 0.1-10 10-25 >25
land remained the dominant land use/cover for the othertwo periods and represented 50.2% and 52.5% of themicro-catchment; respectively for the year 1986 and2010. It was followed by grassland for the threeperiods. Built up area remained almost constant. Forest/woodland remained relatively lowest compared to theother land-use/cover for the two periods 1973 and1986, before increasing in 2010. Overtime, forestsignificantly increased linearly (R2=0.99; y=0.55t-1092.8; p=0.05); grassland/savannah significantlydeclined gradually (R2=0.98; y=0.45t+920.38; p=0.09);
cultivated land tended to decline linearly (R2=0.40;y=0.11t+280.49) though not significantly (p>0.05).
Physico-chemical properties of river Kalimabenge
Variations of temperature, conductivity, pH and flowof the river Kalimabenge waters in 2010 are presentedin Table 3. During the observation year 2010, thetemperature of Kalimabenge waters ranged between18.4 ° C and 22.5 ° C with an annual average of 20.7° C and electrical conductivity ranged between 65 ìs/cm and 115 ìs/cm with an annual average of 99.1ìs/
Table 2: Distribution of land use in Kalimabenge micro-catchment
Year 1973 1986 2010
Land use Area (ha) % Area (ha) % Area (ha) %
Built-up areas 692.7 7.2 710.5 7.3 707.8 7.3Grassland/savannah 3541.9 36.6 2752.7 28.5 1895.4 19.6Cultivated lands 5392.1 55.8 5720.7 59.2 5072.7 52.5Forest / woodlands 40.0 0.4 582.8 6 1990.8 20.6
Total 9666.7 100% 9666.7 100% 9666.7 100%
Figure 2.1: Distribution of the different land use/cover in Kalimabenge Micro-catchment, 1973

80
Hotspot areas changes in Lake Tanganyika Basin
Figure 2.2: Distribution of the different land use/cover in Kalimabenge micro-catchment, 1986
Figure 2.3: Distribution of the different land Use/cover in Kalimabenge micro-catchment, 2010
cm. The average value of pH (7.3) is close to thevalue 7 to that of freshwater. In addition, the pH valuesobserved are between 7.1 and 7.8. This range of pH isbetween 5 and 9 which are the limits within whichnormal development of flora and fauna seems to beenabled. Water flow in river Kalimabenge decreasedfrom January (maximum: 11.3m3/s) to July (minimum:
3.6m3/s) before increasing with an annual value of7.1m3/s. Water flow and rainfall were moderatelycorrelated linearly with the coefficient of determinationR2 = 0.594 (Figure 3). Periods from January to April2010 and from November to December 2010 were ofrainy season with January the rainiest month while thedry season was from May to October with July and

81
E. AZANGA et al.
Table 3: Physico-chemical properties of water in river Kalimabenge (2010)
Months Jan Feb Mar Apr May Jun Jul Aug Sep Oct Nov Dec
Temperature [p C] 21.1 20.9 20.8 20.2 21.6 20.7 19.4 18.4 19.8 21.0 21.8 22.5Conductivity [ìs/cm] 115 112 111 105 81 91 98 105 111 100 65 96pH 7.1 7.1 7.1 7.2 7.6 7.4 7.6 7.1 7.1 7.1 7.8 7.5Flow [m3/s] 11.3 9.5 10.1 10.6 10.3 5.7 3.6 3.9 5.1 4.5 5.2 5.6
Figure 3 : Water flow in river Kalimabenge and rainfall at Uvira Town in 2010
Figure 4: Rainfall at Uvira Town and TSS in river Kalimabenge water, 2010
October the driest months. The month of May was ofweak rainfall but with appreciable water flowparadoxically.
Suspended sediment and nutrients concentration
Correlation between Total suspended solids TSS andrainfall, total phosphorous TP and total nitrogen TNconcentration, and water flow are shown in Figures4, 5, 6 and 7. Total suspended TSS solids showedbetter linear correlation with rainfall (R2=0.70) and TP(R2=0.67) while very weak correlation with TN(R2=0.099) and water flow (R2=0.239). During the
2010 period, the TSS presented a parabolic shape witha strong coefficient of determination R2= 0.933.
Sediments, TN and TP Loads
During 2010, sediment, total nitrogen (TN), and totalphosphorous (TP) loads ranged from 2.53 to 67.46103 t / year, from 68.7 to 1147.4 t / year and from 11.5to 387.9 t / year respectively, in the river Kalimabenge(Figure 8). Changes in TP load and sediment load havea parabolic trend with R2=0.983 and R2=0.992respectively and present the minimum in August whilethose of TN load reach the maximum in April and the

82
Hotspot areas changes in Lake Tanganyika Basin
Figure 6: Total suspended solids and total nitrogen in river Kalimabenge water, 2010
Figure 7: Total suspended solids and water flow in river Kalimabenge, 2010
minimum in July before becoming nearly constant fromOctober to December.
Validation of flow, sediments and nutrient predictions
using SWAT
Results obtained for the SWAT Model validation aresummarized in Figures 9, 10, 11 and 12. The predictedvalues and observed values for water flow in the
River Kalimabenge were linearly correlated with amoderate coefficient of determination R2 = 0.616(Figure 9); for sediment, highly correlated with acorrelation of determination R2 = 0.94 (Figure 10); fornitrogen discharge, weakly correlated with a coefficientof determination R2 = 0.007 (Figure 11); for dischargeof organic phosphorus to Lake Tanganyika, linearlycorrelated with a significantly higher coefficient of
Figure 5: Total suspended solids and total phosphorous in river Kalimabenge water, 2010

83
E. AZANGA et al.
Figure 8: Sediments, total nitrogen and total phosphorous loads in the River Kalimabenge
Figure 9: Predicted and observed values of flow out of the River Kalimabenge during 2010
Figure 10: Predicted and observed values of sediment out of the River Kalimabenge during 2010

84
Hotspot areas changes in Lake Tanganyika Basin
Figure 12: Predicted and observed values of organic phosphorus load in the river Kalimabenge during 2010
Figure 11: Predicted and observed values of nitrogen load in the Kalimabenge during 2010
determination R2 = 0.913 (Figure 12). SWAT resultsshowed that simulated water flow, sediment load, andP load fit very well measured data in the averagemonthly values with better coefficients ofdetermination but simulated N load deviated comparedto observed N load with a weak coefficient ofdetermination. On the other hand, the Student t-testapplied in comparing means of simulated and observedvalues confirmed that there was no significantdifference at p=0.05.
Sediment and nutrient yield hotspot areas dynamics
Sediment, phosphorous, and flow yield hotspot areasfor the three periods are given in Figures 13, 14 and15 respectively. In 1973 the upper part of the catchment(25.58 km2), the lower part of the catchment (theheavily settled part of the micro-catchment: 1.13 km2)and a small patch in the middle of the micro-catchment(0.23 km2) were highly yielding sediment into the LakeTanganyika. This represented 27.6% of the micro-catchment. In 1986, only 9.73 km2 of the upper and
1.05 km2 of the lower part of micro-catchment wereyielding more sediment into the Lake. The hotspot areafor sediment was reduced to only 10% of the micro-catchment; hence representing 59% reduction of thehotspot areas. In 2010, almost all sediment contributingareas of 1973 were re-activated. The total sedimenthotspot area in 2010 was of 29.01 km2, representingan increment of 8.6% in the sediment hotspot areawith reference to 1973 and of 190% with regards to1986 sediment yield hotspot areas.
In 1973, low phosphorous yield was generated in theall sub-basins of the Kalimabenge micro-catchment.In 1986, the TP-yield high contributing area covered26.97 km2 (27.9% of micro-catchment) emerged inthe south eastern part of the micro-catchment. Thisunit disappeared in 2010, but a small patch emerged inthe central part of the micro-catchment (2.3 km2). Thisrepresented 2.4% of the micro-catchment. TP-yieldof this particular part increased substantially since 1973to date.

85
E. AZANGA et al.
Figure 13: Sediment yield map in the Kalimabenge micro-catchment during the period 1973, 1985 and 2010
Figure 14: Total phosphorus yield in the Kalimabenge micro-catchment
Figure 15: Flow yield in the Kalimabenge micro-catchment

86
Hotspot areas changes in Lake Tanganyika Basin
In 1973, the flow yield hotspot area was concentratedaround the outlet of the river Kalimabenge and covered1.05 km2. This represented 1.08 % of the all micro-catchment. In 1986, new additional hotspot areasdeveloped upstream and around the centre of the micro-catchment and covered a total of 32.30 Km2. In 2010,the distribution of hotspot areas was very similar tothat of 1973 period.
DISCUSSION
Land use/cover changes trend in the Kalimabenge
micro-catchments
Grassland/savannah linearly declined in the Kalimabengemicro-catchment at the expense of Forest/woodlands,whereas built up areas remained quasi unchanged. Thisis in line with observations made by several authorsearlier (Bagalwa et al., 2014) for grasslands/savannahbut contradict observations by Fermon (2007), Cohen(1991) and Bagalwa et al. (2015) concerning the forest/woodland and built up areas. Cohen (1991) reportedthat 40 to 60 per cent of the land originally covered byforests in the central basin of the Lake Tanganyika andalmost 100 percent had been cleared in the north basin.Indeed, during the last four decades, forest wascompletely devastated by the population looking forfirewood, charcoal and land for subsistence farmingor grazing. Fermon (2007) also reported that all themountains in this area were particularly denuded oftrees with a density which reduces from South to theNorth of Lake Tanganyika Basin. This explains whygrassland was seen as the most predominant land usein the North-West region of the Lake Tanganyika basinduring the study period (1973 to 2010). However, dueto afforestation programme initiated around 1986,forest/woodland were spreading across the micro-catchment. Bagalwa et al. (2015) observed that warsand flux of refugees in the region had contributed toforest clearance in some places for fuelwood and timberin Lwiro peri-urban area of Lake Kivu. Political warsand tribal conflicts linked to regional insecurity since1995 caused the population to abandon the highmountains leaving place for regeneration of forestduring the last decade. Although positive changes inarea covered by trees and shrubs are large comparedto other land uses in the micro-catchments, forest stilloccupies a relatively small portion of all the micro-basin, most of the micro-basin being occupied by thebuilt-up areas, cultivated areas and grasslands/savannas. The reforestation campaigns are also thebasis of the reappearance of some tree plantations orwoodlands while the expansion of the city of Uvira isincreasing due to population growth and newconstruction of houses in areas formerly covered byvegetation. The region has the highest population inthe Lake Tanganyika Basin with an annual rate of naturalincrease of 3.2% and a density of 21 inhabitants perkm2 (Odada et al., 2004). The highland areas remain
the zone of non-intensive agriculture and livestockespecially cattle.
Sediment and nutrients hotspot areas dynamics
Sediment yields observed in Kalimabenge micro-catchment averaged 2.387 t ha -1yr-1. Theseobservations were similar to those reported by Bagalwaet al. (2015) in Lwiro micro-catchment in eastern DRCand Majaliwa et al. (2004) in Bukoora micro-catchmentin Uganda; and those observed in several micro-catchments in North American basins. Sedimentconcentration of the river waters in this study had largevalues ranging from 0,011 g / l to 0,475 g / l. This isdue to the distribution of land-use/cover and theirmanagement, the topography and the soil of the micro-catchment. Sebahene et al. (1999) found that the riverRuzizi which is one of the largest tributaries of LakeTanganyika located in the Northwest region of thebasin, carried a big amount of suspended sediment,ranging from approximately 0.22 g / l to 2.46 g / lduring the dry season and rainy season respectivelydue to the extent of the basin that it drains and its flattopography compared to the river Kalimabenge. Thishas a significant environmental effect at the outlet whereturbidity is high and prevents light penetration in thelake water.
Values of total phosphorus yield and total nitrogen yieldfor Kalimabenge were 0.012 t ha-1yr-1 and 0.042 tha-1yr-1 respectively. There were relatively higher thanvalues observed in micro-basins of the same size frommajor agricultural lands in the Lake Victoria region(Magunda et al., 2003). Nutrient concentrations forthe river of this study did not exceed 3.43 mg / l fornitrogen and ranged between 0.061 mg / l and 1.093mg / l for phosphorus. These values are relatively lowercompared to those of the region (Magunda et al., 2003)and Australia (Peters and Donohue, 1999). This is dueto less intensive agricultural activities with minimuminputs and the type of soils (Magunda et al., 2003).
The partial sources of sediments, runoff andphosphorous in Kalimabenge changed with periods.Sediment partial contributing areas were different fromrunoff contributing areas. They reduced in size in 1986and returned to their 1973 patterns and size in 2010.Total phosphorus partial contributing areas increasedin 1986 before reducing to a quasi-similar pattern in1973. The non similarity of sediment and runoffcontributing areas in the catchment corroborate reportsfrom other studies (Moore et al., 1976; Campbell,1985; Baade, 1996; Majaliwa et al., 2004). However,the change in partial contributing areas for sedimentsand runoff is attributed to the 1986 afforestation effortsconducted in the region and particularly in the micro-catchment, the change in land-use/cover during thecivil war and climatic fluctuations.

87
E. AZANGA et al.
Erosion studies in experimental plots in Chiledemonstrated the role of vegetation cover in sedimentyield (Espinozaand and Fuentes, 1983a; Espinoza et
al., 1983b). Dieckmann et al. (1989) found that adecrease of 30% of vegetation cover may causean increase of sediment yield by 90%. During theperiod the illegal electrical connection to the nationalgrid coupled with the outdated nature of the facilitycontributed to the slowdown of the electrical plantfacility. This accelerated cutting of eucalyptusplantations trees which had emerged in many parts ofthe DRC side of the Tanganyika basin. The reversesituation was produced with the repeated civil wars inthe eastern part of DRC pushing many people out ofthe forested zones towards the built up areas. Thiscontributed significantly to change in land use/coverwithin the Lake Tanganyika catchment.
The climatic variability effects have been reported inLake Tanganyika (O’Reilly, 2003). Temperature hasincreased by 0.31oC in deep-water and monthly averageof cool windy season speed declined by 30% from itsvalues of 1970. Over the last two centuries, an analysisof rainfall variability in the Lake Tanganyika suggeststhat historical fluctuations in the Lake Tanganyika aregenerally explained by variations in catchmenttemperatures (Nicholson, 1999). Thus, variations insediment yield can also be explained by climate changein the region, especially rainfall change; indeed, duringthe last decade, abundant rainfall above normal wasobserved in the Kalimabenge micro-basin in 2010compared to other years.
CONCLUSION AND RECOMMENDATIONS
In light of the above results and discussions it can beconcluded that:
(i) Grassland, forest, built-up and cultivated landwere the major land use/cover in the Kalimabengemicro-catchment located in the northwest regionof Lake Tanganyika Basin. Forest coversignificantly increased in the last four decades. Inthe Kalimabenge micro-catchment cultivated landis the most predominant land use while built-uparea did not change.
(ii) The partial sources of sediments are notnecessarily sources of runoff in Kalimabenge.They changed in 1986 and returned to the 1973pattern in 2010. Phosphorus high yielding sourcesemerged in 2010. Built up area remained a partialsource of sediment, runoff and phosphorus. Amaximum of 32.30 Km2 has contributed tosediment, runoff and phosphorus in the last fourdecades.
Recommendations
(i) Grassed strips have agro-environmental advantagein reduction of soil erosion, preservation of riverwater quality, diversification of the landscape andland cover, and biodiversity enrichment. Theestablishment of grassed buffer strips along 10meters of food crops and grassed areas of roughly50 meters along studied rivers will conserve thewater quality of rivers and reduce excessiveerosion in the region.
(ii) Reforestation of the region during the years 1970-80 was achieved with eucalyptus tree specieswhich are not agro-environmental tree species.Reforestation of the area with local tree speciesand prohibition of growing food crops on steepslopes offer a better way of environmentalmanagement.
(iii) Local authorities should encourage and promotethe use of improved stoves or undertake a wideelectrification program in the region, rich inhydrography, in order to overcome the problemof deforestation which, over time, may causeprecipitation decrease or soil erosion increase.
(iv) Strategic land management planning should bedeveloped by the Government, in collaborationwith the population.
ACKNOWLEDGEMENT
This research was supported by grants from START,IFS and RUFORUM.
STATEMENT OF NO CONFLICT OF
INTEREST
We the authors of this paper hereby declare that thereare no competing interests in this publication.
REFERENCES
Adrian, R., O’Reilly, C.M., Zagarese, H., Baines, S.B.,Dag O. Hessen and Keller, W. 2009. Lakes assentinels of climate change. Limnol. Oceanogr.,
54(6):2283-2297.Albinus, M.P., Makalle, J.O. and Yazidhi, B. 2008.
Effects of land use practices on livelihoods in thetransboundary sub-catchments of the Lake VictoriaBasin. African Journal of Environmental Science
and Technology 2(10):309-317.Alin, S.R., O’Reilly, C.M., Cohen, A.S., Dettman, D.L.,
Palacios-Fest, M.R. and McKee, B. A. 2002. Effectsof land-use change on aquatic biodiversity: A viewfrom the paleorecord at Lake Tanganyika. East
Africa Geology 30(12):1143-1146.

88
Hotspot areas changes in Lake Tanganyika Basin
Baade, J. 1996. Spatial and temporal variability ofdischarge and sediment yield in small loess-coveredcatchments. Géomorphologie : Relief, Processus,
Environnement 2(3):65-74.Babanyara, Y.Y. and Saleh, U.F. 2010. Urbanisation and
the choice of fuel wood as a source of energy inNigeria. J Hum Ecol, 31(1):19-26.
Bagalwa, M., Majaliwa, J.G.M., Mushagalusa, N. andKarume, K. 2014. Dynamics of land use and coverin Kahuwa River Micro-catchment in response tourbanization from 1986 to 2010. Greener Journal
of Geology and Earth Sciences 2(1):1-8.Bagalwa, M., Majaliwa, M., Kansiime, F., Bashwira,
S., Tenywa, M. and Karume, K. 2015. Sedimentand nutrient loads into river Lwiro, in the Lake Kivubasin, Democratic Republic of Congo. Int. J. Biol.
Chem. Sci., 3:1678-1690.Barasa, B., Majaliwa, J. G. M., Lwasa, S., Obando, J.,
and Bamutaze, Y. 2011. Magnitude and transitionpotential of land-use/cover changes in the trans-boundary river Sio catchment using remote sensingand GIS. Annals of GIS 17(1):73-80.
Bilsborrow, R.E. 1992. Population growth, internalmigration, and environmental degradation in ruralareas of developing countries. European Journal
of Population/Revue europénne de Démographie
8(2):125-148.Biswas, A.K., Masakhalia, Y.F.O., Odero-Ogwel, L.A.
and Pallangyo, E.P. 1987. Land use and farmingsystems in the Horn of Africa. Land Use Policy
4(4):419-443.Black, R., Kniveton, D., Skeldon, R., Coppard, D.,
Akira Murata, A. and Schmidt-Verkerk, K. 2008.Demographics and Climate Change: Future Trends
And their Policy Implications for Migration
(Working Paper T-27): Development ResearchCentre on Migration, Globalisation and Poverty.
Black, R. and Sessay, M.F. 1997. Forced migration,environmental change and woodfuel issues in theSenegal River Valley. Environmental Conservation
24(03):251-260.Brooks, K.N., Ffolliott, P.F., Gregersen, H.M. and
Thames, J.L. 1991. Hydrology and the managementof watersheds. Ames, Iowa: Iowa State University
Press.Bruton, M. N. and Merron, G. S. 1990. The proportion
of different eco-ethological sections of reproductiveguilds of fishes in some African inland waters.Environmental Biology of Fishes 28(1):179-187.
Campbell, I. A. 1985. Partial area concept and itsapplication to the problem of sediment source areas.Soil Erosion and Conservation. Soil Conservation
Society of America, Ankeny, Iowa. 1985. pp. 128-138, 70
Chambers, P., Meissner, R., Wrona, F., Rupp, H., Guhr,H. and Seeger, J. 2006. Changes in nutrient loadingin an agricultural watershed and its effects on water
Quality and Stream Biota. Hydrobiologia 556(1):399-415.
Cohen, A.S. 1991. Report on the first InternationalConference on the conservation and biodiversityof Lake Tanganyika. March, 1991. Bujumbura.Biodiversity Support Program.
Cohen, A.S., Bills, R., Cocquyt, C.Z. and Caljon, A.G.1993. The impact of sediment pollution onbiodiversity in Lake Tanganyika Conservation
Biology 7(3):667-677.Cohen, A.S., Palacios-Fest, M.R., Msaky, E.S., Alin,
S.R., McKee, B. and O’Reilly, C.M. 2005.Paleolimnological investigations of anthropogenicenvironmental change in Lake Tanganyika: Summaryof paleorecords of environmental change andcatchment deforestation at Lake Tanganyika andimpacts on the Lake Tanganyika ecosystem.Journal of Paleolimnology 34(1):125-145.
Cohen, A.S., Soreghan, M.J. and Scholz, C.A. 1993.Estimating the age of formation of lakes: an examplefrom Lake Tanganyika, East African Rift system.Geology 21:511-514.
Cooke, S.E. and Prepas, F.F. 1998. Stream phosphorusand nitrogen export from agricultural and forestedwatersheds in the Boreal Plain. Canadian Journal
of Fisheries & Aquatic Science 55:2292-2299.Darkoh, M.B.K. 2003. Regional perspectives on
agriculture and biodiversity in the drylands of Africa.Journal of Arid Environments 54:261-279.
de Koning, G., Verburg, P., Veldkamp, A. and Fresco,L. 1999. Multi-scale modeling of land use changedynamics in Ecuador. Agricultural Systems 61:77-93.
Devito, K.J., Fitzgerald, D., Hill, A.R. and Aravena, R.2000. Nitrate dynamics in relation to lithology andhydrogeologic flow path in a river riparian zone.Journal of Environmental Quality 29:1075-1084.
Dickinson, W.T. and Wall, G.J. 1976. Temporal patternof erosion and fluvial sedimentation in the GreatLakes Basin. Geoscience 3:158-163.
Dickinson, W.T. and Wall, G. J. 1977. The relationshipbetween source-area erosion and sediment yield.Hydrological Sciences 22(4):527-530.
Dieckmann, H., Motzer, J., Seuffert, O. and Harres,H. P. 1989. Vegetation vs. Erosion - The exampleof the Pixinamanna catchment in southernSardinia. Geoöko plus 2(11).
Downing, J.A., McClain, M., Twilley, R., Melack, J.M., Elser, J. and Rabalais, N. N. 1999. The impactof accelerating land-use change on the N-Cycle oftropical aquatic ecosystems: Current conditions andprojected changes. Biogeochemistry 46(1):109-148.
Elkan, W. 1988. Alternatives to Fuelwood in AfricanTowns. World Development 16(4):527-533.
Elkholm, P. 1994. Bioavailability of phosphorous inagriculturally loaded covers in Southern Farmland.Hydrobiologia 287:179-194.

89
E. AZANGA et al.
Emerton, L., Iyango, L., Luwum, P. and Malinga, A.1998. The present economic value of Nakivubourban wetland, Uganda. IUCN – The World
Conservation Union.Espinoza, G. A. and Fuentes, E.R. 1983. Medidas de
erósion en los Andes centrales de Chile : Effectosde pastes y arbustos. Terra Australis 27:75-87.
Espinoza, G. A., Gardia, H. I. and Fuentes, E.R. 1983.Cubierta vegetal y erósion: experimentospreliminares en los Andes centrales de Chile.Terra Australis 27:67-74.
Falkenmark, M. and Chapman, T. 1989. Comparativehydrology. An ecological approach to land and waterresources. Paris: UNESCO.
Fermon, Y. 2007. Étude de l’état des lieux de la partienord du lac Tanganyika dans le cadre duProgramme Pêche d’Action Contre la Faim enRépublique Démocratique du Congo. Action Against
Hunger, USA.Fung, T. and Chan, K.C. 1994. Spatial composition of
spectral calsses: a structural approach for imageanalysis of heterogeneous land-use and land-covertype. Photogrammetric Engineering & Remote
Sensing 60(2):173-180.Gorgula, S.K. and Connell, S.D. 2004. Expansive
covers of turf-forming algae on human-dominatedcoast: The relative effects of increasing nutrientand sediment loads. Marine Biology 145(3):613-619.
Grzybowski, K. 1984. Les résultats préliminaires del’analyse granulométrique des sables actuelsd’Uvira. Cahier du Ceruki-ISP Bukavu., nouvelle
série n° 12.Harrison, J., Miller, K. and McNeely, J. 1982. The world
coverage of protected areas: Development goals andenvironmental needs. Ambio 11(5):238-245.
Houghton, R. 1994. The Worldwide Extent of LandUse Change. BioScience 44(5):305-313.
Houlahan, J.E. and Findlay, C.S. 2004. Estimating the“critical” distance at which adjacent land-usedegrades wetland water and sediment quality.Landscape Ecology, 19(6):677-690.
Ilunga, L. 1984. Le quaternaire de la plaine de la Ruzizi.Thèse de doctorat. Vrije Universiteit Brussel, inédit,
353p.Ilunga, L. 2006. Study of the main sites of erosion in
Uvira (D.R. Congo). Geo-Eco-Trop, 30(2):1-12.Isabirye, M., Magunda, M. and Ssali, C.K. 2001. People
and agroecosystems:Issues and strategies forsustainable land management in Mayuge district.Land use management technical report No.7. LakeVictoria Environmental Management Project,NARO-Kawanda, Uganda.
Jha, M., Gassman, P.W., Secchi, S., Gu, R. and Arnold,J.G. 2004. Effect of watershed subdivision onSWAT Flow, Sediment, and Nutrient Predictions.JAWRA 40(3):811-825.
Jorgensen, S. E., Ntakimazi, G. and Kayombo, S. 2006.Lake Tanganyika. Experience and lessons learnedbrief. International Lake Environment Commitee-
ILEC
Kajembe, G.C., Julius, F., Nduwamungu, J., Mtakwa,P.W. and Nyange, D.A. 2005. Impact of indigenous-based interventions on land conservation: a casestudy of a Soil Conservation and AgroforestryProject, Arumeru District, Tanzania. Land Degrad.
Develop. 16:311-325.Kakogozo, B., Kahindo, Mwenyimali and Drieu, O.
2000. Etude hydrologique du bassin Nord-ouest du
Lac Tanganyika, UNDP/GEF, RAF/92/G32, Uvira
(No. 10).Kok, K., Farrow, A., Veldkamp, A. and Verburg, P.
2001. A method and application of multi-scalevalidation in spatial land use models. Agriculture
Ecosystems and Environment 85:223–238.Kristy, W. and Susan, K.J. 2002. A social and
environmental evaluation of fuel-efficient cook-stoves and conservation in Uganda. Environmental
Conservation 25:99-108.Kusimi, J. 2008. Assessing land use and land cover
change in the Wassa west district of Ghana usingremote sensing. GeoJournal 71(4):249-259.
Kyambadde, J., Kansiime, F., Gumaelius, L. andDalhammar, G. 2004. Hydraulic loading, stabilityand water quality of Nakivubo wetland, Uganda.African Journal of Aquatic Science 29 (2):213-220.
Lambin, E.F., Geist, H.J. and Lepers, E. 2003.Dynamics of Land-Use and Land-cover Change inTropical Regions. Annu. Rev. Environ. Resour., 28:205-241.
Liu, S., Kairé, M., Wood, E., Diallo, O. and Tieszen,L.L. 2004. Impacts of land use and climate changeon carbon dynamics in south-central Senegal.Journal of Arid Environments 59(3):583-604.
Lombardozzi, D. and O’Reilly, C. The effects ofdeforestation on nutrient concentrations in tributariesof Lake Tanganyika.
Magunda, M.K., Majaliwa, J.G.M., Tenywa, M.M. andMusitwa, F. 2003. Runoff, soil and nutrient lossesfrom major agricultural land-use practices in theLake Victoria basin, Uganda. African Journal of
Tropical Hydrobiology and Fisheries 11(1):87-103.Majaliwa, J.G.M., Magunda, M.K., Tenywa, M.M. and
Semalulu, O. 2003. Soil erosion and pollutionloading from agricultural land in Bukoora sub-catchment. Uganda Journal of Agricultural
Sciences 8(10):305-312.Majaliwa, J.G.M., Magunda, M.K. and Tenywa, M.M.
2004. Non-point pollution loading in a selectedmicro-catchment of the Lake Victoria basin. In:Proceedings of the Ninth International Symposiumon river Sedimentation (9th ISRS) Yichang, China.pp. 2206-2211.

90
Hotspot areas changes in Lake Tanganyika Basin
Majaliwa, J.G.M., Magunda, M.K. and Tenywa, M.M. 2004.Non-point pollution loading in a selected micro-catchment of the Lake Victoria basin. In: Proceedings
of the Ninth International Symposium on river
Sedimentation (9th ISRS) Yichang, China pp. 2206-2211.
Majaliwa, M.J.G. 2008. Land use and climate change effectson livelihoods and sediment and carbon loading in theLake Tanganyika region, START report.
Majaliwa, J.G.M., Twongyirwe, R., Nyenje, R., Oluka, M.,Ongom, B., Sirike, J. and Mfitumukiza, D. 2010. Theeffect of land cover change on soil properties aroundKibale National Park in South Western Uganda.Applied and Environmental Soil Science Article ID:185689. http://dx.doi.org/10.1155/2010/185689. 7pp.
Mashalla, S.K. 1988. The human impact on the naturalenvironment of the Mbeya Highlands, Tanzania.Mountain Research and Development 8(4):283-288.
McFarland, A.M.S. and Hauek, L.M. 2001. Determiningnutrient export coefficients and source loadinguncertainty using in-stream monitoring data. Journal
of the Amer. Water Res. Assoc., 37:223-236.Meadows, K. and Zwick, K. 2000. Pollution Control and
Other Measures to Protect Biodiversity in Lake
Tanganyika, UNDP/GEF/RAF/92/G32 (No. IV).Mölsä, H., Reynolds, J.E., Coenen, E.J. and Lindqvist, O.V.
1999. Fisheries research towards resource managementon Lake Tanganyika. Hydrobiologia 407:1-24.
Moore, T.R., Dunne, T. and Taylor, C.H. 1976. Mappingrunoff-producing zones in humid regions. Soil Wat.
Cons. 31:160-164.Moser, S.C. 1996. A partial instructional module on global
and regional land use/cover change: Assessing thedata and searching for general relationships.GeoJournal 39(3):241-283.
NEMA. 2001. State of Environment Report for Uganda,2000/2001, Kampala, Uganda National Environmental
Management Authority.Nicholson, S.E. 1999. Historical and modern fluctuations
of Lakes Tanganyika and Rukwa and their relationshipto rainfall variability. Climatic Change 41:53-71.
O’Reilly, C.M. 2002. The effects of land use change onlittoral zone dynamics of Lake Tanganyika, East Africa.Science and Engineering 63(1).
O’Reilly, C.M., Alin, S.R., Plisnier, P.D., Cohen, A. S. andMcKee, B. A. 2003. Climate change decreases aquaticecosystem productivity of Lake Tanganyika, Africa.NATURE 24:766-768.
Odada, E.O., Olago, D.O., Kulindwa, K. A. A., Bugenyi, F.,West, K. and Ntiba, M. 2004. East African Rift Valleylakes. Global International Waters Assessment (GIWA)Regional assessment 47. United Nations
Environmental Programme (UNEP), University of
Kalmar, Kalmar, Sweden. pp. 1-114.Ouedraogo, I., Tigabu, M., Savadogo, P., Compaoré, H.,
Odén, P.C. and Ouadba, J.M. 2010. Land cover changeand its relation with population dynamics in Burkina
Faso, West Africa. Land Degradation & Development
21(5):453-462.Peters, N.E. and Donohue, R. 1999. Nutrient
concentrations and fluxes in tributaries to the Swan-Canning estuary, Western Australia. IAHS Publ, 257.
Puigdefábregas, J. 2005. The role of vegetation patternsin structuring runoff and sediment fluxes in drylands.Earth Surface Processes and Landforms 30(2):133-147.
Roose, E. and Ndayizigiye, F. 1997. Agroforestry, waterand soil fertility management to fight erosion in tropicalmountains of Rwanda. Soil Technology 11(1);109-119.
Rosenzweig, C., Karoly, D., Vicarelli, M., Neofotis, P., Wu,Q. and Casassa, G. 2008. Attributing physical andbiological impacts to anthropogenic climate change.Nature 453:353-357.
Schuyt, K.D. 2005. Economic consequences of wetlanddegradation for local populations in Africa. Ecological
Economics 53(2:177-190.Sebahene, M., Nduwayo, M., Songore, T.,
Ntungumburanye, G. and Drieu, O. 1999. TravauxHydrologique et d’echantillonnage sédimentologiquedu Bassin du Lac Tanganyika (Burundi). PollutionControl and Other Measures to Protect Biodiversity inLake Tanganyika. (UNDP/GEF/RAF/92/G32) http://www.ltbp.org/FTP/SSS8.PDF, 74.
Snoeks, J., Rossiter, A. and Kawanabe, H. 2000. How wellknown is the ichthyo diversity of the large East Africanlakes? Advances in Ecological Research 31:17-38.
Stocking, M. 1984. Rates of erosion and sediment yield inthe African environment. Challenges In African
Hydrology and Waier Resource, 144.Swanson, M. 1996. The economics of environmental
degradation. Edward Elgar Publishing Company,Chelten UK. pp. 92.
Thomasa, A.D., Walsh, R.P.D. and Shakesby, R.A. 1999.Nutrient losses in eroded sediment after fire ineucalyptus and pine forests in the wet Mediterraneanenvironment of northern Portugal. CATENA 36(4):283-302.
Timberlake, L. 1985. Africa in crisis: The causes, the curesof environmental bankruptcy. London: Earthscan.
Turner, B., Hyden, G. and Kates, R. 1993. Population growthand agricultural change in Africa. Carter Lecture Series.Centre for African Studies, University of Florida.University Press of Florida, Gainesville.
Ulén, B., Bechmann, M., Fölster, J., Jarvie, H. P. andTunney, H. 2007. Agriculture as a phosphorus sourcefor eutrophication in the north-west Europeancountries, Norway, Sweden, United Kingdom andIreland: a review. Soil Use and Management 23:5-15.
Wood, E.C., Tappan, G.G. and Hadj, A. 2004. Understandingthe drivers of agricultural land use change in south-central Senegal. Journal of Arid Environments
Young, R.A., Onstad, C.A., Bosch, D.D. and Anderson, J.R. 1989. AGNPS: A nonpoint-source pollution modelfor evaluating agricultural watersheds. Journal of Soil
and Water Conservation 44 (2):168-173.