landflux assessment and organization workshop, june, 2007, toulouse, france atmospheric correction...
Post on 20-Dec-2015
218 views
TRANSCRIPT
LANDFLUX Assessment and Organization Workshop , June, 2007, Toulouse, France
Atmospheric Correction in the Atmospheric Correction in the Reflective Domain of MODIS and Reflective Domain of MODIS and
AVHRR DataAVHRR Data
Uncertainties Analysis and Evaluation Uncertainties Analysis and Evaluation of AERONET Sitesof AERONET Sites
Eric F. Vermote Department of Geography, University of Maryland,and NASA GSFC code 614.5Crystal SchaafDepartment of Geography, Boston University
and many contributors
Surface Reflectance (MOD09)Surface Reflectance (MOD09)
2
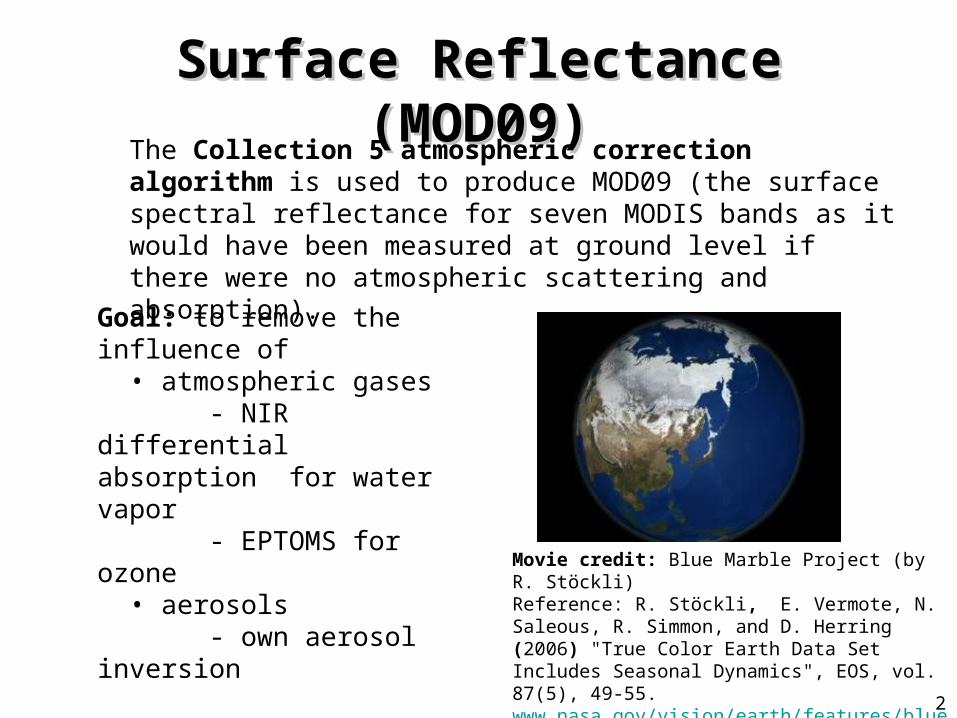
Goal: to remove the influence of • atmospheric gases - NIR differential absorption
for water vapor - EPTOMS for ozone • aerosols - own aerosol inversion
Home page: http://modis-sr.ltdri.org
The Collection 5 atmospheric correction algorithm is used to produce MOD09 (the surface spectral reflectance for seven MODIS bands as it would have been measured at ground level if there were no atmospheric scattering and absorption).
Movie credit: Blue Marble Project (by R. Stöckli)Reference: R. Stöckli, E. Vermote, N. Saleous, R. Simmon, and D. Herring (2006) "True Color Earth Data Set Includes Seasonal Dynamics", EOS, vol. 87(5), 49-55. www.nasa.gov/vision/earth/features/blue_marble.html
Basis of the MODIS Atmospheric Basis of the MODIS Atmospheric Correction algorithmCorrection algorithm
The Atmospheric Correction algorithm relies on
the use of very accurate (better than 1%) vector radiative transfer modeling of the coupled atmosphere-surface system (6SV)
the inversion of key atmospheric parameters (aerosol, water vapor)
atmospheric correction algorithm look-up tables are created on the basis of vector RT simulations performed by the 6SV (Second Simulation of a Satellite Signal in the Solar Spectrum, Vector) code, which enables accounting for radiation polarization.
May 2005: the release of a β-version of the vector 6S (6SV1.0B) . . . . . . . . . . . . . . . . . . . . . . . . . . . . . . . . . . . . . . . . . . . . . . . .
. . . . e x t e n s i v e v a l i d a t i o n a n d t e s t i n g . . . . . . . . . . . . . . . . . . . . . . . . . . . . . . . . . . . . . . . . . . . . . . . . . . . . . May 2007: the release of version 1.1 of the vector 6S (6SV1.1)
3

6SV Features6SV Features
5
Spectrum: 350 to 3750 nm
Molecular atmosphere: 7 code-embedded + 6 user-defined models
Aerosol atmosphere: 6 code-embedded + 4 user-defined (based on components and distributions) + AERONET
Ground surface: homogeneous and non-homogeneous with/without directional effect (10 BRDF + 1 user-defined)
Instruments: AATSR, ALI, ASTER, AVHRR, ETM, GLI, GOES, HRV, HYPBLUE, MAS, MERIS, METEO, MSS, TM, MODIS, POLDER, SeaWiFS, VIIRS, and VGT
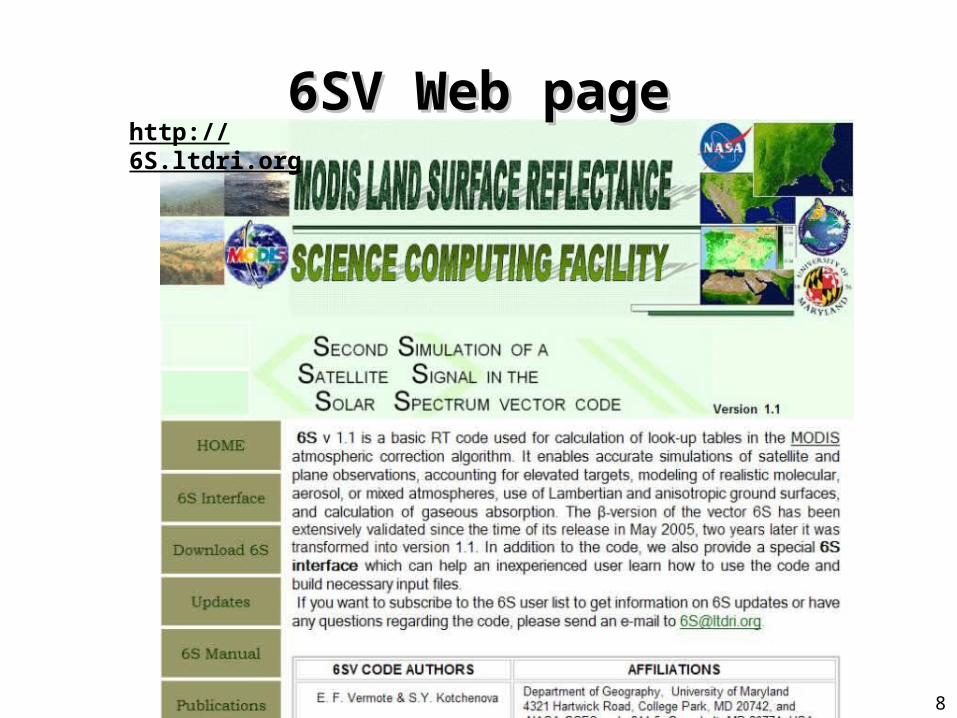
6SV Web page6SV Web pagehttp://6S.ltdri.org
8

6SV Users (over the World)6SV Users (over the World)
10
Total: 898 users
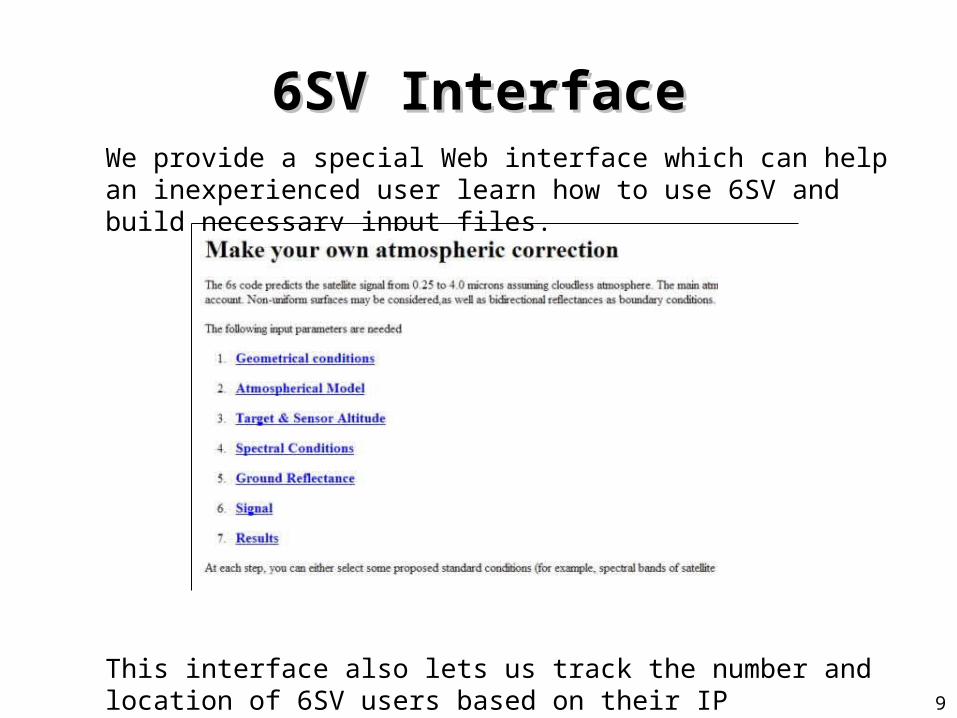
6SV Interface6SV InterfaceWe provide a special Web interface which can help an inexperienced user learn how to use 6SV and build necessary input files.
This interface also lets us track the number and location of 6SV users based on their IP addresses.
9

6SV Validation Effort6SV Validation Effort
The complete 6SV validation effort is summarized in two manuscripts:
S. Y. Kotchenova, E. F. Vermote, R. Matarrese, & F. Klemm, Validation of a vector version of the 6S radiative transfer code for atmospheric correction of satellite data. Part I: Path Radiance, Applied Optics, 45(26), 6726-6774, 2006.
S. Y. Kotchenova & E. F. Vermote, Validation of a vector version of the 6S radiative transfer code for atmospheric correction of satellite data. Part II: Homogeneous Lambertian and anisotropic surfaces, Applied Optics, in press, 2007.
6

Code Comparison Project (1)Code Comparison Project (1)
13
SHARM(scalar)
RT3
Coulson’s tabulated
values(benchmark)
Dave Vector
Vector 6S
Monte Carlo(benchmark)
All information on this project can be found at http://rtcodes.ltdri.org
Effects of PolarizationEffects of Polarization
7
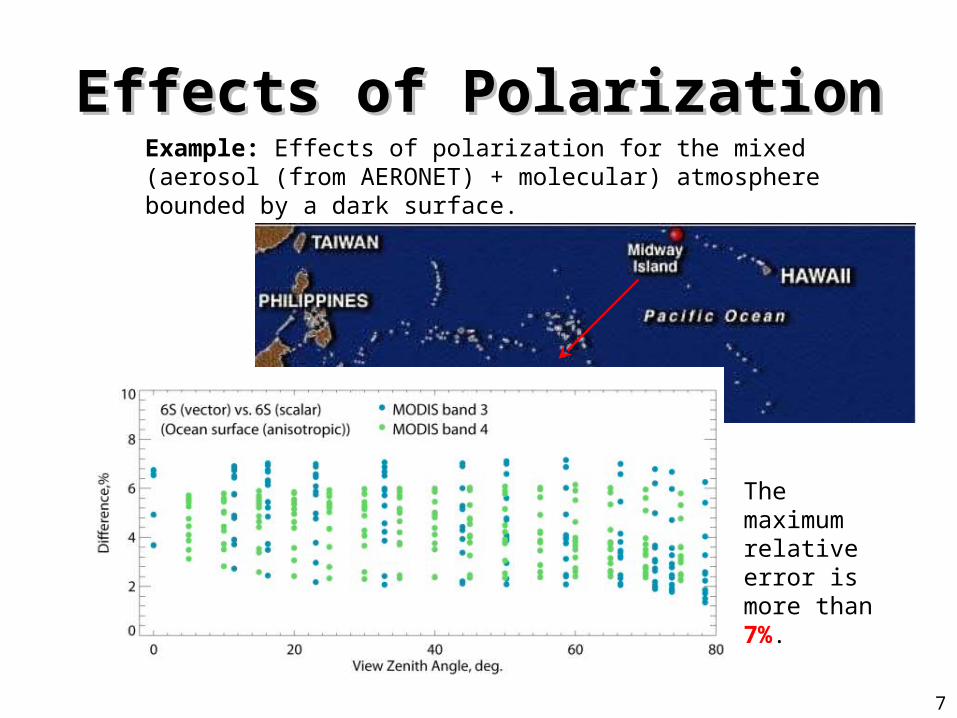
Example: Effects of polarization for the mixed (aerosol (from AERONET) + molecular) atmosphere bounded by a dark surface.
The maximum relative error is more than 7%.
Input Data for Atmospheric Input Data for Atmospheric CorrectionCorrection
15
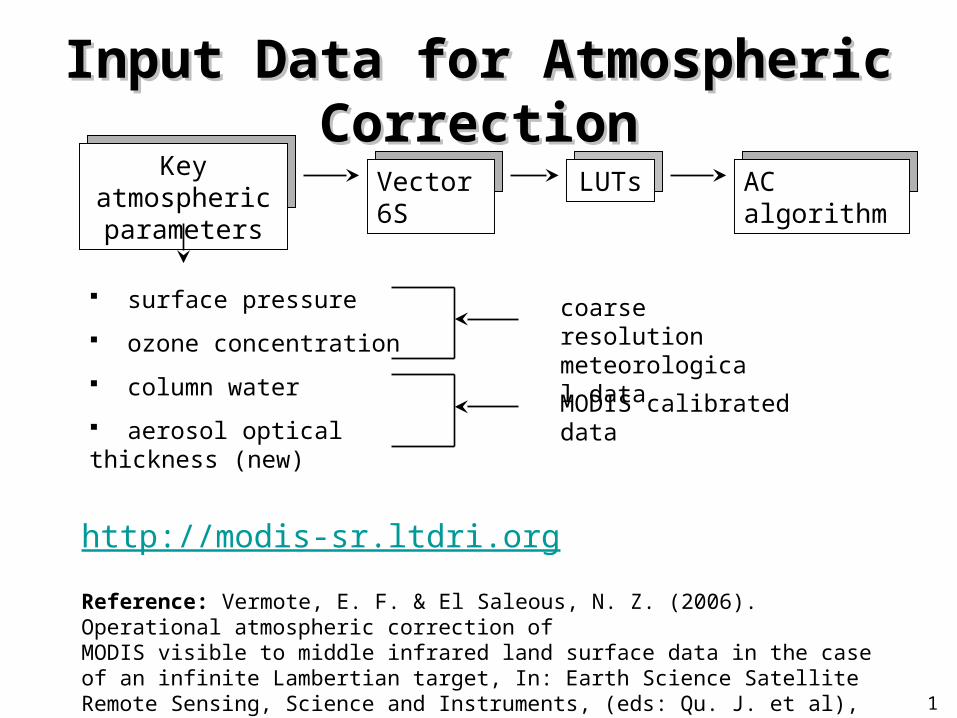
AC algorithmLUTsVector 6SKey atmospheric
parameters
surface pressure
ozone concentration
column water
aerosol optical thickness (new)
http://modis-sr.ltdri.org
Reference: Vermote, E. F. & El Saleous, N. Z. (2006). Operational atmospheric correction of MODIS visible to middle infrared land surface data in the case of an infinite Lambertian target, In: Earth Science Satellite Remote Sensing, Science and Instruments, (eds: Qu. J. et al), vol. 1, chapter 8, 123 - 153.
coarse resolution meteorological data
MODIS calibrated data

Calibration Uncertainties Calibration Uncertainties (MODIS)(MODIS)
17
Impact of Calibration uncertainties (+/-2%)
0
0.1
0.2
0.3
0.4
0.5
0.6
0.7
0.8
0 0.1 0.2 0.3 0.4 0.5 0.6 0.7
Aerosol optical depth true
Ae
roa
ol o
pti
ca
l de
pth
re
trie
ve
d
550nm
470nm
645nm
870nm
We simulated an error of ±2% in the absolute calibration across all 7 MODIS bands.
Results: The overall error stays under 2% in relative for all τaer considered.
(In all study cases, the results are presented in the form of tables and graphs.)
Table (example): Error on the surface reflectance (x 10,000) due to uncertainties in the absolute calibration for the Savanna site.

Uncertainties on Pressure and Uncertainties on Pressure and OzoneOzone
18
Impact of pressure uncertainties (+/-10mb)
0
0.05
0.1
0.15
0.2
0.25
0.3
0.35
0.4
0.45
0 0.1 0.2 0.3 0.4 0.5
Aerosol optical depth true
Aer
oao
l op
tical
dep
th r
etri
eved
550nm
470nm
645nm
870nm
Impact of ozone uncertainties (+/-0.2cm.atm)
0
0.05
0.1
0.15
0.2
0.25
0.3
0.35
0.4
0.45
0.5
0 0.1 0.2 0.3 0.4 0.5
Aerosol optical depth true
Ae
roa
ol o
pti
ca
l de
pth
re
trie
ve
d
550nm
470nm
645nm
870nm
The pressure error has impact on
molecular scattering (specific band)
the concentration of trace gases (specific band)
τaer (all bands)
The ozone error has impact on
the band at 550 nm (mostly)
the band at 470 nm the retrieval of τaer all bands

Uncertainties on Water VaporUncertainties on Water Vapor
19
Retrieval of the column water vapor content: if possible, from MODIS bands 18 (931-941 nm) and 19 (915 – 965 nm) by using the differential absorption technique. The accuracy is better than 0.2 g/cm2. if not, from meteorological data from NCEP GDAS
Impact of water vapor uncertainties (+/-0.2cm)
0
0.05
0.1
0.15
0.2
0.25
0.3
0.35
0.4
0.45
0.5
0 0.1 0.2 0.3 0.4 0.5
Aerosol optical depth true
Ae
roa
ol o
pti
ca
l de
pth
re
trie
ve
d
550nm
470nm
645nm
870nm
Impact of water vapor uncertainties (+/-0.2g/cm2)
Table (example): Error on the surface reflectance (x 10,000) due to uncertainties in the water vapor content for the Semi-arid site.

Uncertainties on the Aerosol Uncertainties on the Aerosol ModelModel
21
In the AC algorithm, an aerosol model is prescribed depending on the geographic location. We studied an error generated by the use of an improper model.
Prescribed: urban clean
Additional: urban polluted, smoke low absorption, smoke high absorption
The choice of the aerosol model
is critical for the theoretical
accuracy of the current product
(in particular, for the accuracy
of optical thickness retrievals).

Retrieval of Aerosol Optical Retrieval of Aerosol Optical ThicknessThickness
20
Original approach: “dark and dense vegetation (DDV) technique” a linear relationship between ρVIS and ρNIR limitation to the scope of dark targets
Current approach: a more robust “dark target inversion scheme”
a non-linear relationship derived using a set of 40 AERONET sites representative of different land covers
can be applied to brighter targets
MODIS Collection 5 Aerosol MODIS Collection 5 Aerosol Inversion AlgorithmInversion Algorithm
22
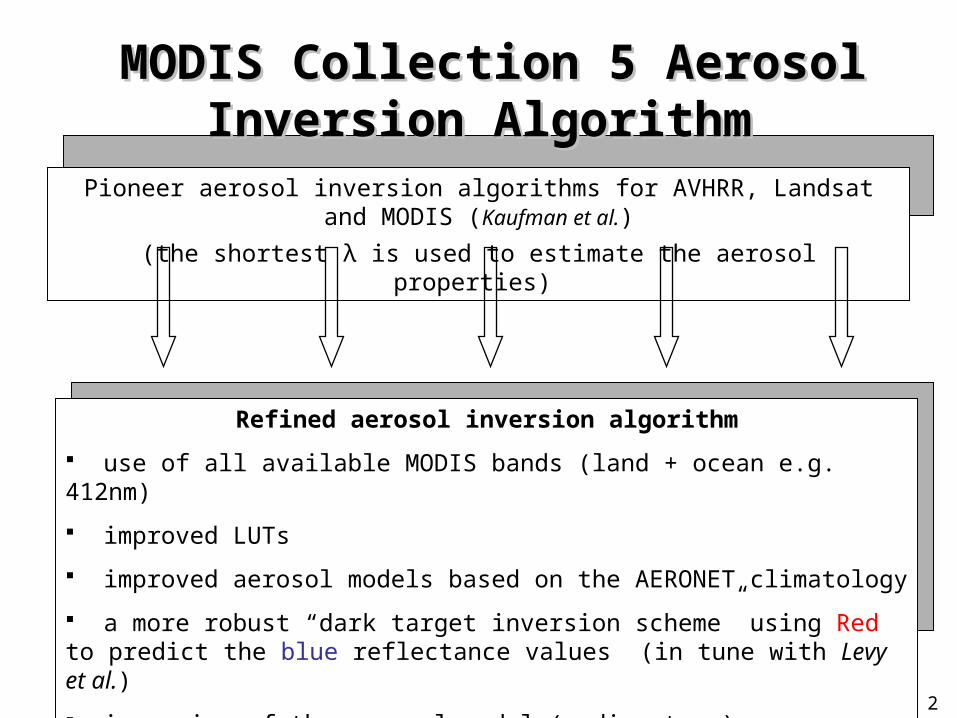
Pioneer aerosol inversion algorithms for AVHRR, Landsat and MODIS (Kaufman et al.)
(the shortest λ is used to estimate the aerosol properties)
Refined aerosol inversion algorithm
use of all available MODIS bands (land + ocean e.g. 412nm)
improved LUTs
improved aerosol models based on the AERONET climatology
a more robust “dark target inversion scheme” using Red to predict the blue reflectance values (in tune with Levy et al.)
inversion of the aerosol model (rudimentary)

Error BudgetError Budget
16
Goal: to estimate the accuracy of the atmospheric correction under several scenarios
Input parameters Values
Geometrical conditions 10 different cases
Aerosol optical thickness 0.05 (clear), 0.30 (average), 0.50 (high)
Aerosol model Urban clear, Urban polluted, Smoke low absorption, Smoke high absorption (from AERONET)
Water vapor content (g/cm2)
1.0, 3.0, 5.0 (uncertainties ± 0.2)
Ozone content (cm · atm) 0.25, 0.3, 0.35 (uncertainties ± 0.02)
Pressure (mb) 1013, 930, 845 (uncertainties ± 10)
Surface forest, savanna, semi-arid
MODIS Overall Theoretical MODIS Overall Theoretical AccuracyAccuracy
27
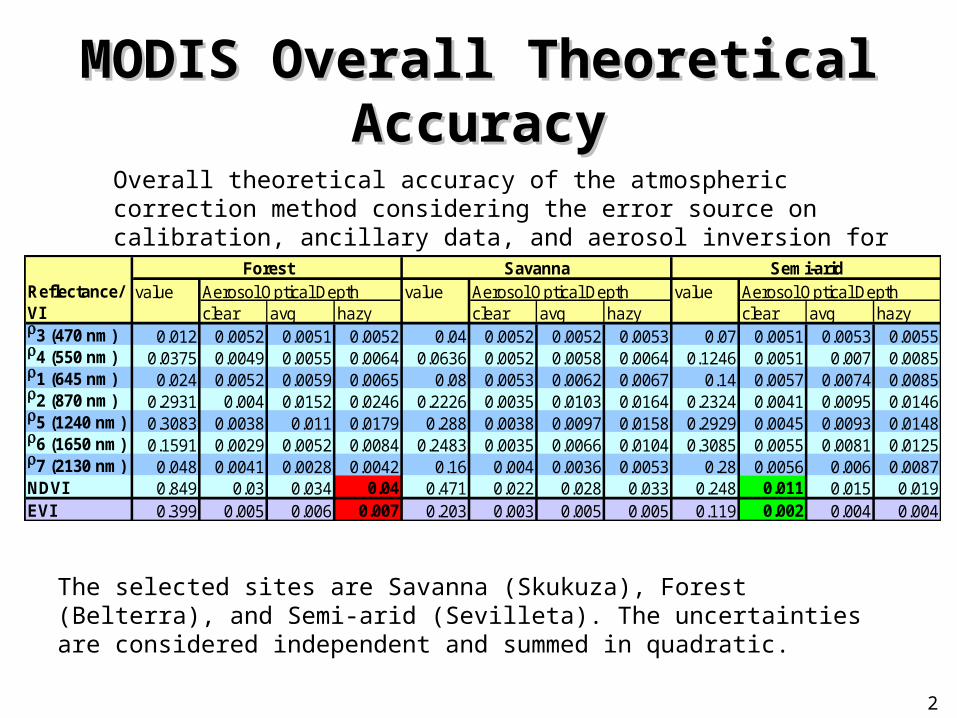
Overall theoretical accuracy of the atmospheric correction method considering the error source on calibration, ancillary data, and aerosol inversion for 3 τaer = {0.05 (clear), 0.3 (avg.), 0.5 (hazy)}:
Reflectance/ value value valueVI clear avg hazy clear avg hazy clear avg hazyr3 (470 nm) 0.012 0.0052 0.0051 0.0052 0.04 0.0052 0.0052 0.0053 0.07 0.0051 0.0053 0.0055r4 (550 nm) 0.0375 0.0049 0.0055 0.0064 0.0636 0.0052 0.0058 0.0064 0.1246 0.0051 0.007 0.0085r1 (645 nm) 0.024 0.0052 0.0059 0.0065 0.08 0.0053 0.0062 0.0067 0.14 0.0057 0.0074 0.0085r2 (870 nm) 0.2931 0.004 0.0152 0.0246 0.2226 0.0035 0.0103 0.0164 0.2324 0.0041 0.0095 0.0146r5 (1240 nm) 0.3083 0.0038 0.011 0.0179 0.288 0.0038 0.0097 0.0158 0.2929 0.0045 0.0093 0.0148r6 (1650 nm) 0.1591 0.0029 0.0052 0.0084 0.2483 0.0035 0.0066 0.0104 0.3085 0.0055 0.0081 0.0125r7 (2130 nm) 0.048 0.0041 0.0028 0.0042 0.16 0.004 0.0036 0.0053 0.28 0.0056 0.006 0.0087NDVI 0.849 0.03 0.034 0.04 0.471 0.022 0.028 0.033 0.248 0.011 0.015 0.019EVI 0.399 0.005 0.006 0.007 0.203 0.003 0.005 0.005 0.119 0.002 0.004 0.004
Forest Savanna Semi-aridAerosol Optical Depth Aerosol Optical Depth Aerosol Optical Depth
The selected sites are Savanna (Skukuza), Forest (Belterra), and Semi-arid (Sevilleta). The uncertainties are considered independent and summed in quadratic.

Performance of the MODIS C5 Performance of the MODIS C5 algorithmsalgorithms
To evaluate the performance of the MODIS Collection 5 algorithms, we analyzed 1 year of Terra data (2003) over 127 AERONET sites (4988 cases in total).
Methodology:
http://mod09val.ltdri.org/cgi-bin/mod09_c005_public_allsites_onecollection.cgi28
Subsets of Level 1B data processed using the standard surface
reflectance algorithm
Reference data set
Atmospherically corrected TOA
reflectances derived from Level 1B subsets
Vector 6SAERONET measurements
(τaer, H2O, particle distribution)
If the difference is within ±(0.005+0.05ρ), the observation is “good”.
comparison

Validation of MOD09 (1)Validation of MOD09 (1)Comparison between the MODIS band 1 surface reflectance and the reference data set.
The circle color indicates the % of comparisons within the theoretical MODIS 1-sigma error bar:green > 80%, 65% < yellow <80%, 55% < magenta < 65%, red <55%.
The circle radius is proportional to the number of observations.
Clicking on a particular site will provide more detailed results for this site.29
Validation of MOD09 (2)Validation of MOD09 (2)
30
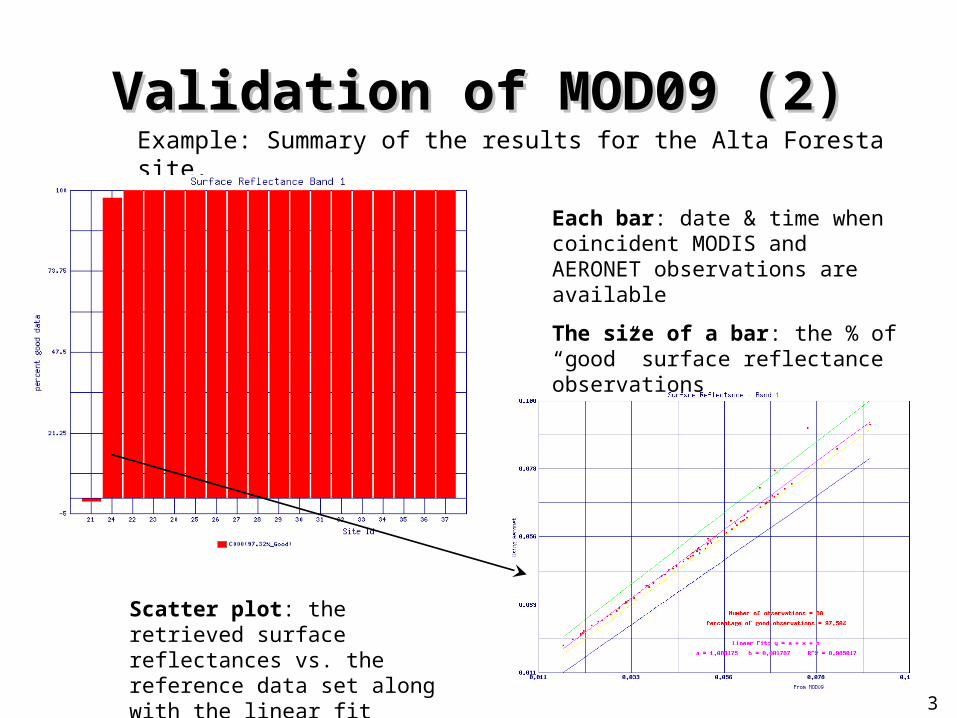
Example: Summary of the results for the Alta Foresta site.
Each bar: date & time when coincident MODIS and AERONET observations are available
The size of a bar: the % of “good” surface reflectance observations
Scatter plot: the retrieved surface reflectances vs. the reference data set along with the linear fit results
Validation of MOD09 (3)Validation of MOD09 (3)
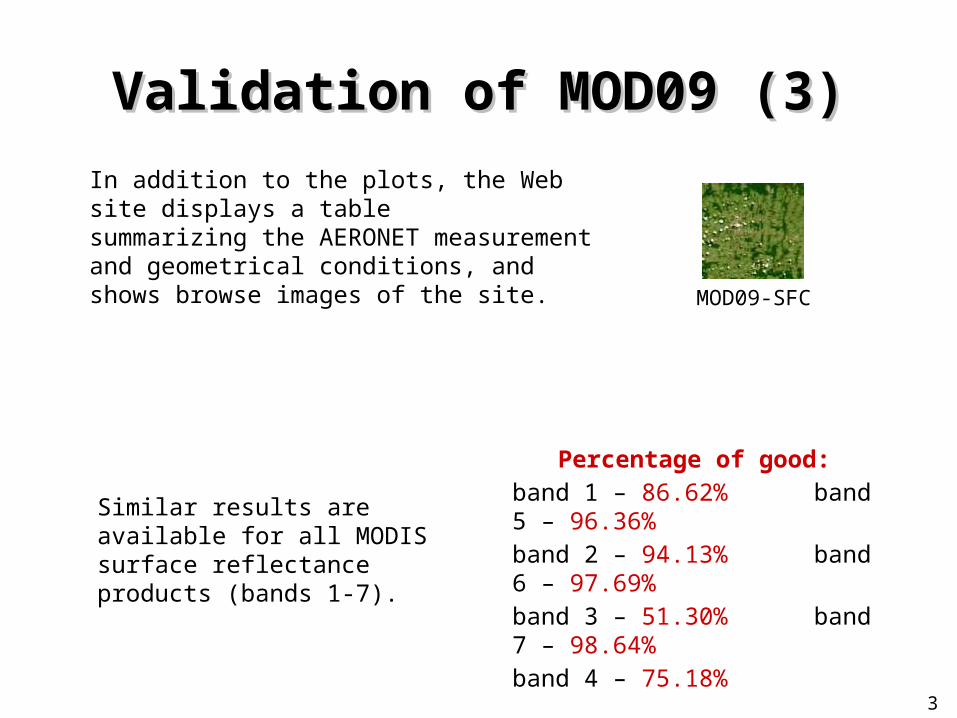
In addition to the plots, the Web site displays a tablesummarizing the AERONET measurementand geometrical conditions, and shows browse images of the site.
31
Percentage of good:
band 1 – 86.62% band 5 – 96.36%
band 2 – 94.13% band 6 – 97.69%
band 3 – 51.30% band 7 – 98.64%
band 4 – 75.18%
MOD09-SFC
Similar results are available for all MODIS surface reflectance products (bands 1-7).
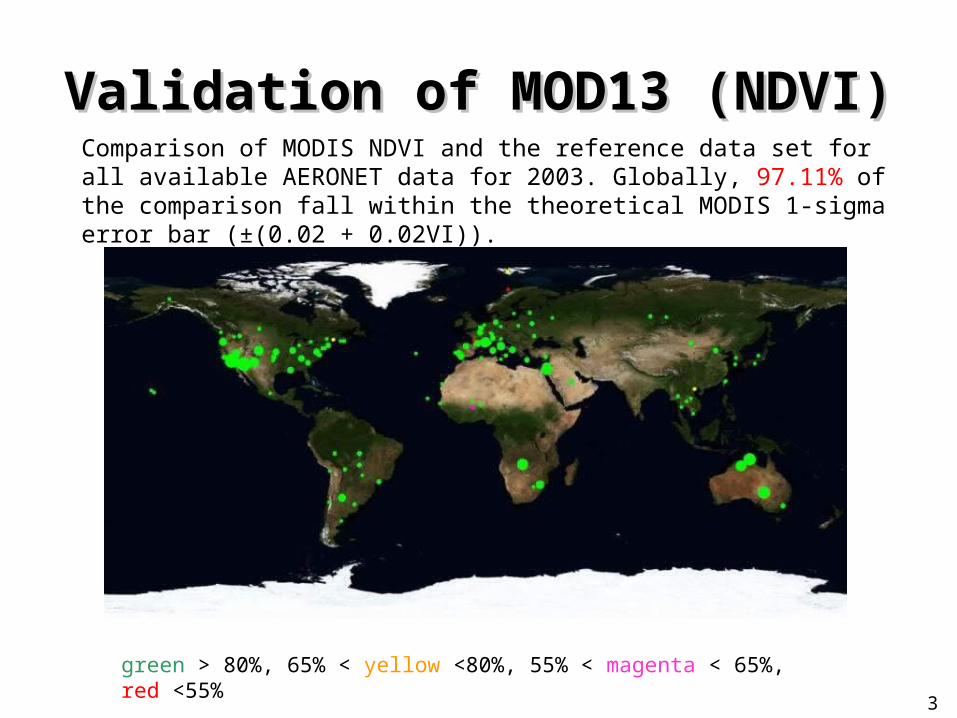
Validation of MOD13 (NDVI)Validation of MOD13 (NDVI)Comparison of MODIS NDVI and the reference data set for all available AERONET data for 2003. Globally, 97.11% of the comparison fall within the theoretical MODIS 1-sigma error bar (±(0.02 + 0.02VI)).
green > 80%, 65% < yellow <80%, 55% < magenta < 65%, red <55%
32

Validation of MOD09 (EVI)Validation of MOD09 (EVI)
33
Comparison of MODIS EVI and the reference data set for all available AERONET data for 2003. Globally, 93.64% of the comparison fall within the theoretical MODIS 1-sigma error bar (±(0.02 + 0.02VI)).
green > 80%, 65% < yellow <80%, 55% < magenta < 65%, red <55%
• NASA: Ed Masuoka (MODAPS), Nazmi Saleous, Jeff Pedelty (Processing), Sadashiva Devadiga (Quality Assessment), Jim Tucker & Jorge Pinzon (Assessment)
• UMD: Eric Vermote (Science), Steve Prince (Outreach), Chris Justice• NOAA: Jeff Privette (Land Surface Temperature)• South Dakota State University: David Roy (Burned Area)• Boston University: Crystal Schaaf (BRDF/Albedo)
A 0.05 degree global climate/interdisciplinary long term data
set from AVHRR, MODIS and VIIRS
A 0.05 degree global climate/interdisciplinary long term data
set from AVHRR, MODIS and VIIRS
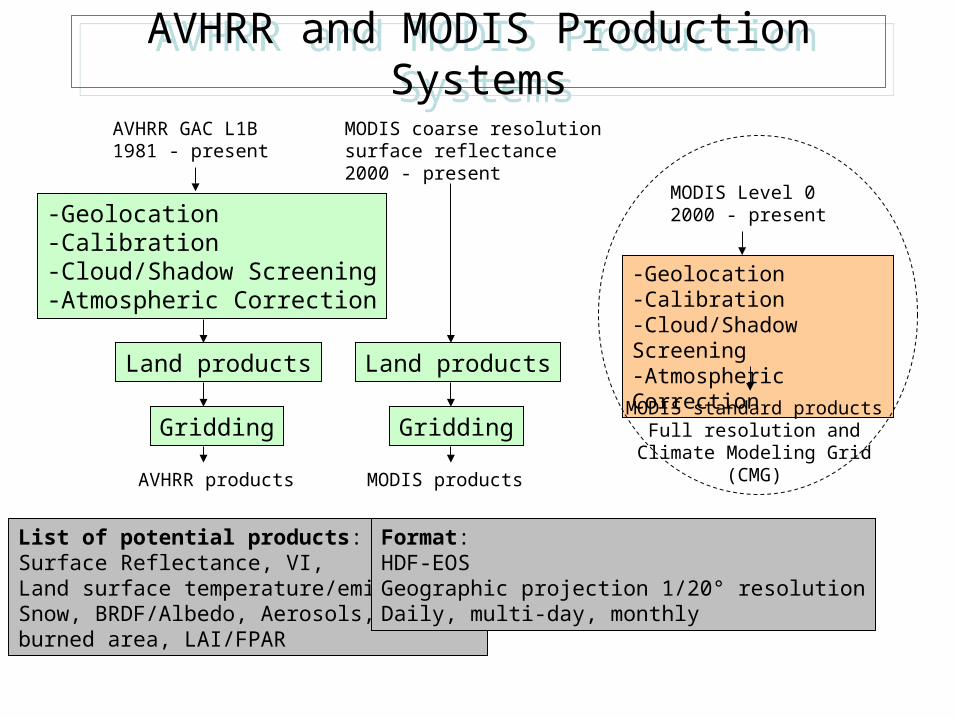
-Geolocation-Calibration-Cloud/Shadow Screening-Atmospheric Correction
Gridding
Land products
Gridding
Land products
AVHRR GAC L1B1981 - present
MODIS coarse resolution surface reflectance 2000 - present
-Geolocation-Calibration-Cloud/Shadow Screening-Atmospheric Correction
AVHRR products MODIS products
AVHRR and MODIS Production SystemsAVHRR and MODIS Production Systems
List of potential products:Surface Reflectance, VI, Land surface temperature/emissivity,Snow, BRDF/Albedo, Aerosols,burned area, LAI/FPAR
Format:HDF-EOSGeographic projection 1/20° resolutionDaily, multi-day, monthly
MODIS Level 02000 - present
MODIS standard productsFull resolution and
Climate Modeling Grid(CMG)
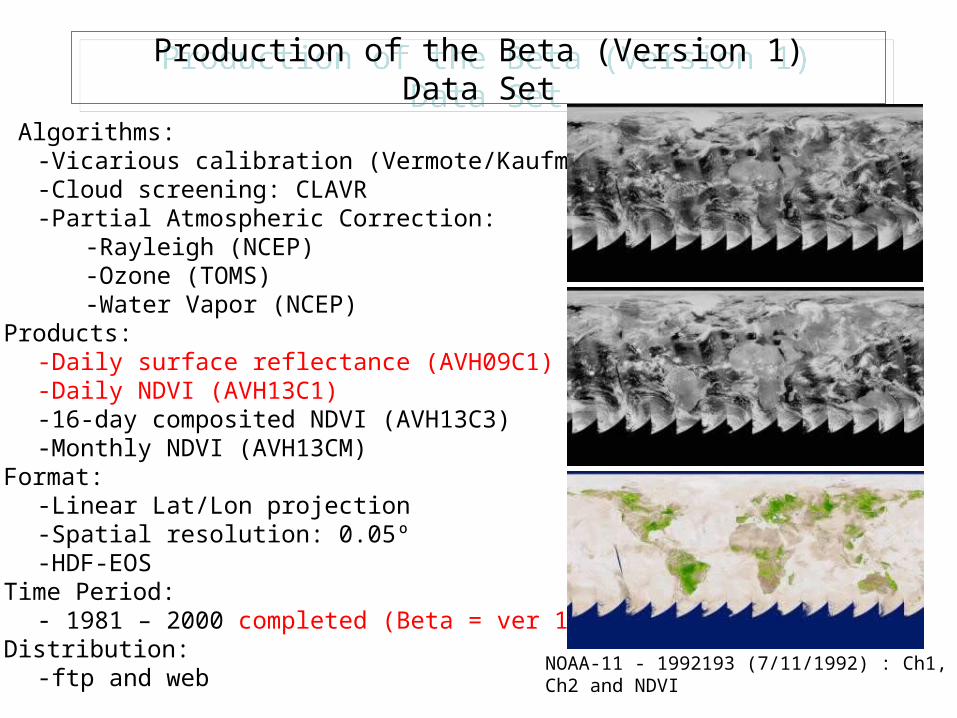
Production of the Beta (Version 1)Data Set
Production of the Beta (Version 1)Data Set
- Algorithms:-Vicarious calibration (Vermote/Kaufman)-Cloud screening: CLAVR-Partial Atmospheric Correction:
-Rayleigh (NCEP)-Ozone (TOMS)-Water Vapor (NCEP)
-Products:-Daily surface reflectance (AVH09C1)-Daily NDVI (AVH13C1)-16-day composited NDVI (AVH13C3)-Monthly NDVI (AVH13CM)
-Format:-Linear Lat/Lon projection-Spatial resolution: 0.05º -HDF-EOS
-Time Period:- 1981 – 2000 completed (Beta = ver 1)
-Distribution:-ftp and web
NOAA-11 - 1992193 (7/11/1992) : Ch1,Ch2 and NDVI

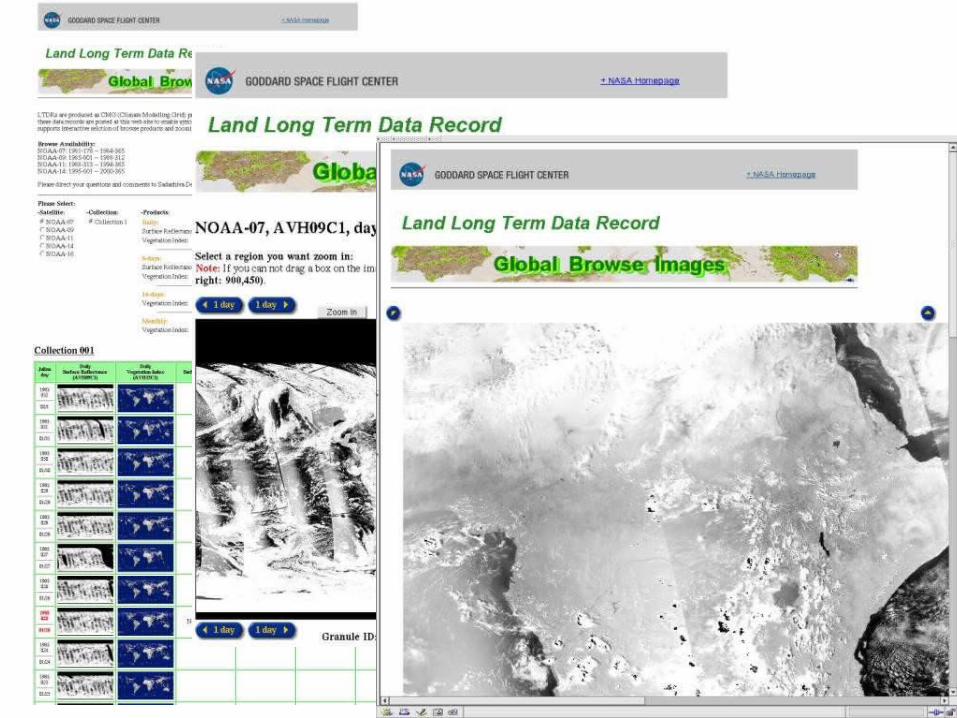
LTDR Web PageLTDR Web Page
http://ltdr.nascom.nasa.gov/ltdr/ltdr.html
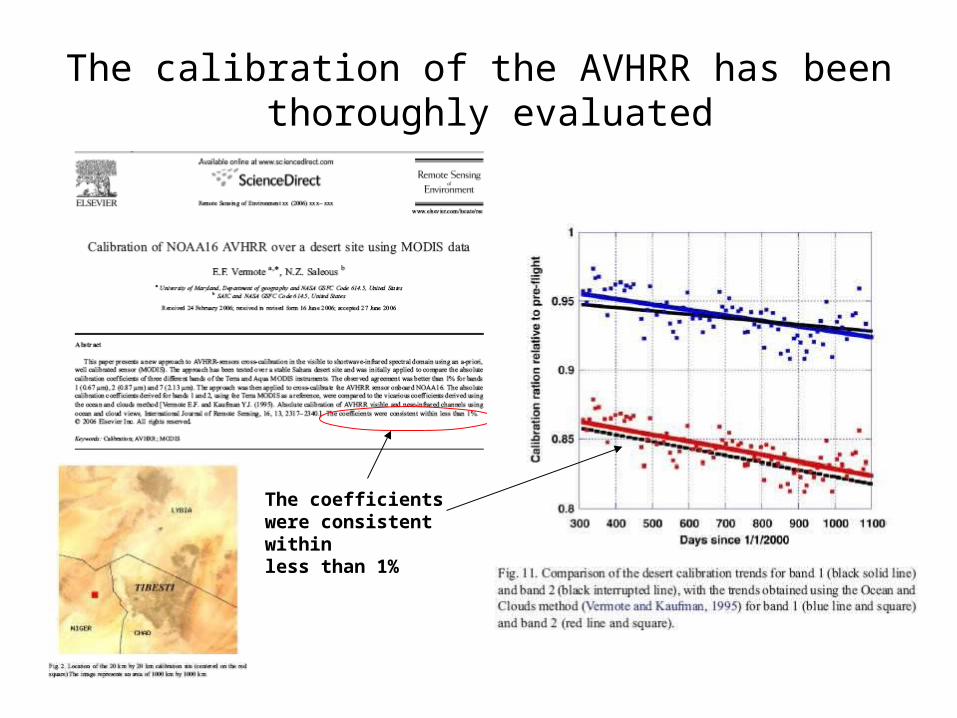
The calibration of the AVHRR has been thoroughly evaluated
The coefficientswere consistent withinless than 1%
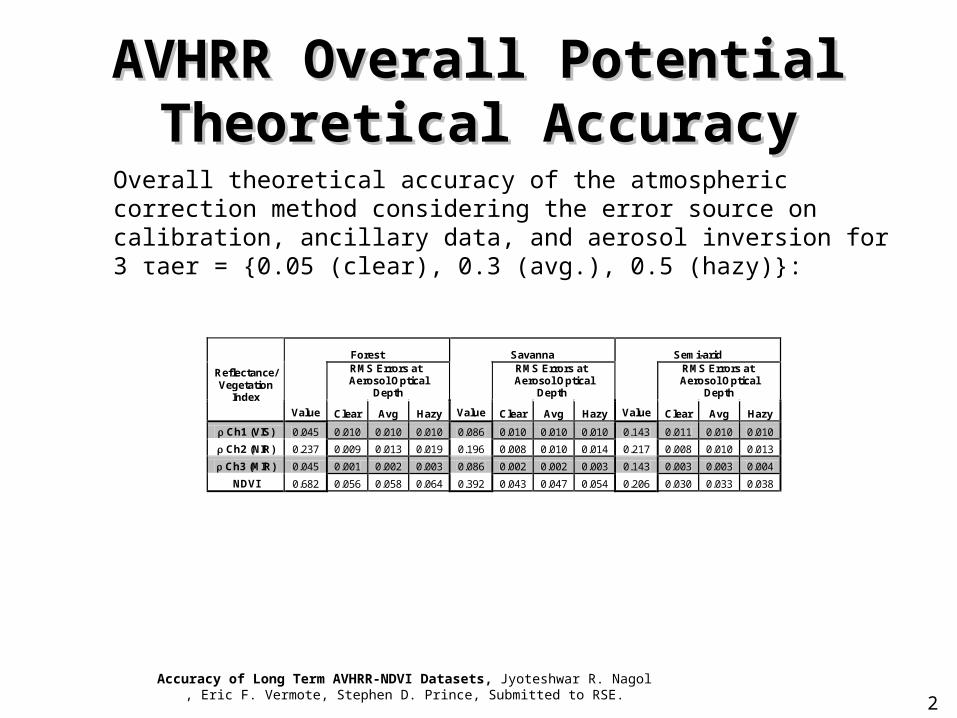
AVHRR Overall Potential AVHRR Overall Potential Theoretical AccuracyTheoretical Accuracy
27
Overall theoretical accuracy of the atmospheric correction method considering the error source on calibration, ancillary data, and aerosol inversion for 3 τaer = {0.05 (clear), 0.3 (avg.), 0.5 (hazy)}:
Forest Savanna Semi-arid RMS Errors at Aerosol Optical
Depth
RMS Errors at Aerosol Optical
Depth
RMS Errors at Aerosol Optical
Depth
Reflectance/ Vegetation
Index
Value Clear Avg Hazy Value Clear Avg Hazy Value Clear Avg Hazy
r Ch1 (VIS) 0.045 0.010 0.010 0.010 0.086 0.010 0.010 0.010 0.143 0.011 0.010 0.010
r Ch2 (NIR) 0.237 0.009 0.013 0.019 0.196 0.008 0.010 0.014 0.217 0.008 0.010 0.013
r Ch3 (MIR) 0.045 0.001 0.002 0.003 0.086 0.002 0.002 0.003 0.143 0.003 0.003 0.004
NDVI 0.682 0.056 0.058 0.064 0.392 0.043 0.047 0.054 0.206 0.030 0.033 0.038
Accuracy of Long Term AVHRR-NDVI Datasets, Jyoteshwar R. Nagol, Eric F. Vermote, Stephen D. Prince, Submitted to RSE.

Validation of AVHRR LTDR (1)Validation of AVHRR LTDR (1)
29
Name of data PAL GIMMS-G GVI LTDR (Beta release)
Spatial Resolution 8 km 8 km 16 km 0.05 degree
Frequency 10 day & monthly Bimonthly 10 day & monthly
Daily, multi-day, monthly
Availability 1981-2001 1981-2003 1985-2000 1981- Present
Format 8 bit 8 bit 8 bit
Cloud Screen CLAVR
(Stowe et al. 1995)
Temperature (T5) (James and Kalluri
1994) None
CLAVR-3 (Stowe et al. 1995)
Raleigh/ ozone Yes No No Yes
Water Vapor correction
No No No Yes
Aerosol correction No No No Yes
(not included in Beta release)
Calibration
(Rao and Chen 1996)
(Los 1998; Rao and Chen 1996)
(Rao and Chen 1996)
(Vermote and Kaufman 1995)
Satellite Drift (SZA)
No Yes, (Pinzon et al.
2002) No
Yes (not included in Beta
release)
Accuracy of Long Term AVHRR-NDVI Datasets, Jyoteshwar R. Nagol, Eric F. Vermote, Stephen D. Prince, Submitted to RSE.

Validation of AVHRR LTDR (2)Validation of AVHRR LTDR (2)
29Accuracy of Long Term AVHRR-NDVI Datasets, Jyoteshwar R. Nagol, Eric F. Vermote, Stephen D. Prince, Submitted to RSE.
Spatial distribution of AERONET sites used to produce reference data. After masking for cloud, cloud shadow, and view zenith angle greater than 42 only 580 data points from 48 AERONET sites remain in the reference data for 1999.
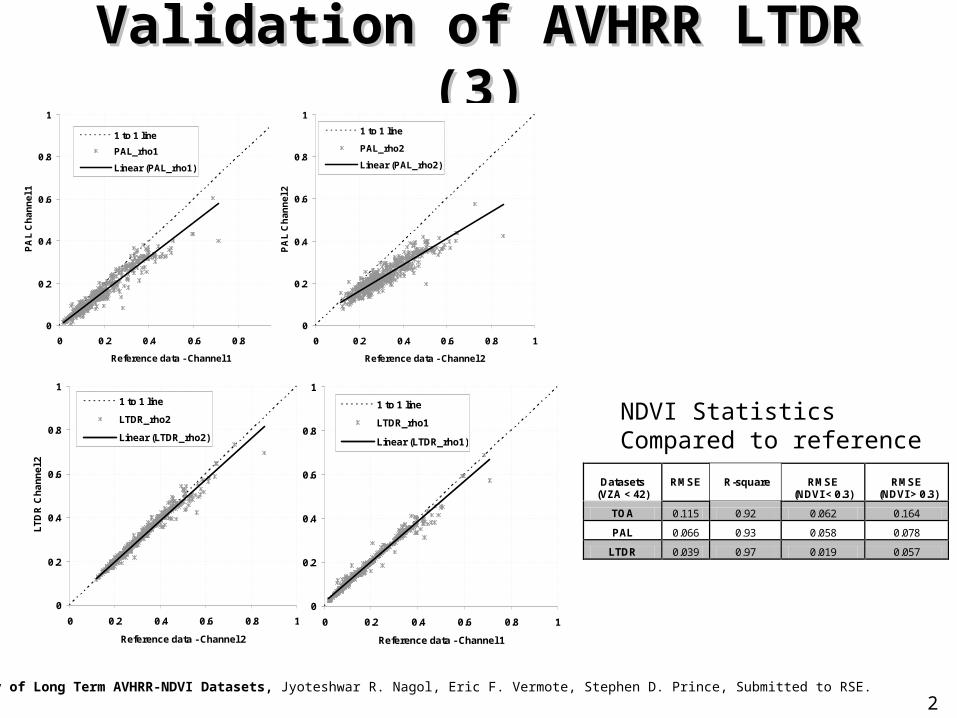
Validation of AVHRR LTDR (3)Validation of AVHRR LTDR (3)
29Accuracy of Long Term AVHRR-NDVI Datasets, Jyoteshwar R. Nagol, Eric F. Vermote, Stephen D. Prince, Submitted to RSE.
0
0.2
0.4
0.6
0.8
1
0 0.2 0.4 0.6 0.8 1
Reference data - Channel 1
PA
L C
ha
nn
el 1
1 to 1 line
PAL_rho1
Linear (PAL_rho1)
0
0.2
0.4
0.6
0.8
1
0 0.2 0.4 0.6 0.8 1
Reference data - Channel 2
PA
L C
ha
nn
el 2
1 to 1 line
PAL_rho2
Linear (PAL_rho2)
0
0.2
0.4
0.6
0.8
1
0 0.2 0.4 0.6 0.8 1
Reference data - Channel 1
LT
DR
Ch
an
ne
l 1
1 to 1 line
LTDR_rho1
Linear (LTDR_rho1)
0
0.2
0.4
0.6
0.8
1
0 0.2 0.4 0.6 0.8 1
Reference data - Channel 2
LT
DR
Ch
an
ne
l 2
1 to 1 line
LTDR_rho2
Linear (LTDR_rho2)
Datasets (VZA < 42)
RMSE
R-square
RMSE (NDVI < 0.3)
RMSE RMSE
(NDVI > 0.3)
TOA 0.115 0.92 0.062 0.164
PAL 0.066 0.93 0.058 0.078
LTDR 0.039 0.97 0.019 0.057
NDVI StatisticsCompared to reference

LTDR QA Home Page

AVHRR BRDF/Albedo Product Using the MODIS Algorithm: Broadband Black-Sky Albedo (July 1999)
Narrowband to broadband conversion:
Liang, S. L. et al, 2002, Remote Sensing of Environment, 84: 25-41
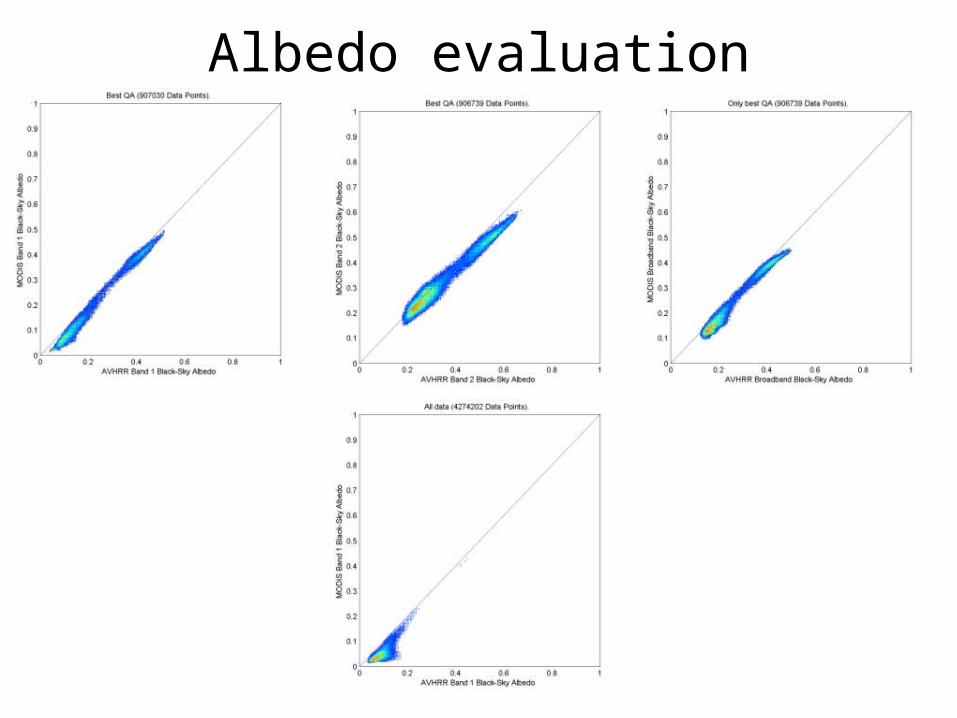
Albedo evaluation

2006 activities2006 activities
• Produced an AVHRR surface reflectance and NDVI beta data set using Pathfinder 2 algorithms (vicarious calibration; Rayleigh, ozone and water vapor correction).
• Set up a web/ftp interface for data distribution.• Identified a set of validation sites for use in the
evaluation of the products.• Evaluated data set and started operational QA activity
(global browse, known issues, time-series monitoring and trends).– Identified problems with geolocation, cloud screening, water
vapor correction, QA bits, etc. in Beta (version 1) data set– Fixes have been made and will be incorporated in version 2
data set.

Outreach workshop January 2007Outreach workshop January 2007
- LTDR workshop held January 18, 2007 at the UMUC Conference Center- Held in conjunction with MODIS Collection 5 workshop- Most in C5 workshop stayed for LTDR Outreach Workshop- Goal was to present project status, receive feedback on products/schedule
- Approximately 140 attendees, including MODIS/AVHRR project personnel.- Presentations from LTDR folks (algorithms, science, QA, data formats, evaluation,
intercomparisons with existing AVHRR products)- Also presentations from international AVHRR experts
- A. Trischenko (CCRS) “Developing the AVHRR and MODIS Long Term
Data Records at the CCRS”- P. Frost (CSIRO) “Integration of Sensors Applied on South African
Ecosystems (ISAFE)”- M. Leroy (CESBIO) “African Monsoon Multidisciplinary Analysis (AMMA)”
- Good interaction and feedback.
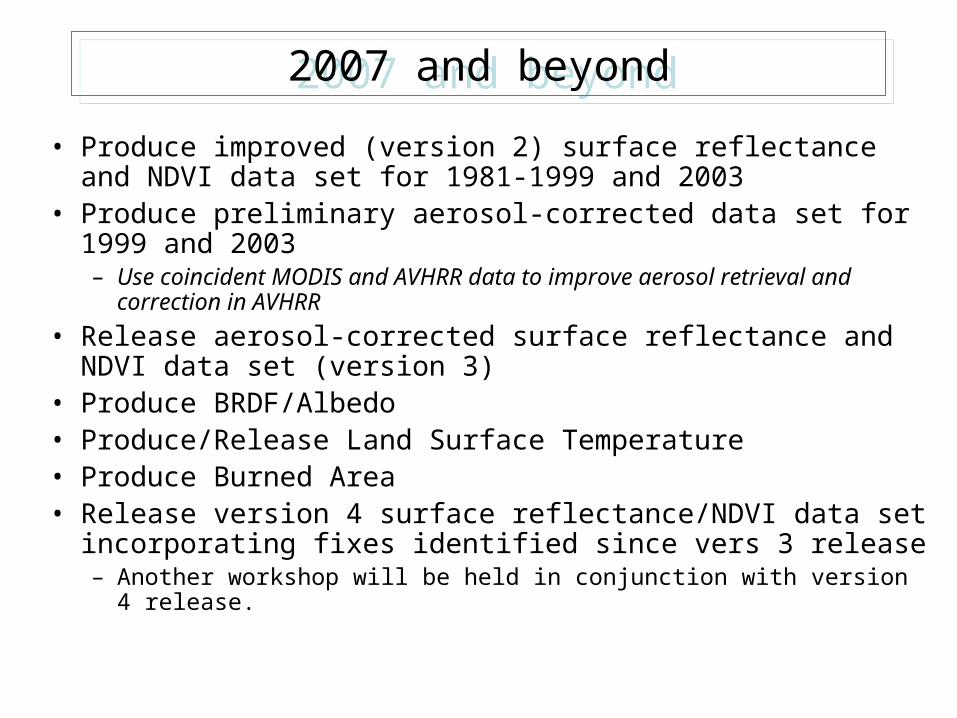
2007 and beyond2007 and beyond
• Produce improved (version 2) surface reflectance and NDVI data set for 1981-1999 and 2003
• Produce preliminary aerosol-corrected data set for 1999 and 2003 – Use coincident MODIS and AVHRR data to improve aerosol retrieval
and correction in AVHRR
• Release aerosol-corrected surface reflectance and NDVI data set (version 3)
• Produce BRDF/Albedo • Produce/Release Land Surface Temperature • Produce Burned Area • Release version 4 surface reflectance/NDVI data set
incorporating fixes identified since vers 3 release – Another workshop will be held in conjunction with version 4 release.