landsberger bj comparing vav duct designs ncembt
TRANSCRIPT

FINAL REPORT NCEMBT 070315
COMPARING VAV DUCT DESIGNS
Brian J. Landsberger, Ph.D. Liangcai (Tom) Tan, Ph.D. University Of Nevada, Las Vegas Davor Novosel National Center for Energy Management and Building Technologies


FINAL REPORT NCEMBT-070315
NATIONAL CENTER FOR ENERGY MANAGEMENT AND BUILDING TECHNOLOGIES TASK 3: COMPARING VAV DUCT DESIGNS
MARCH 2007 Prepared B : y Brian J. Landsberger, Ph.D. Liangcai (Tom) Tan, Ph.D. University Of Nevada, Las Vegas Davor Novosel National Center for Energy Management and Building Technologies Prepared For: U.S. Department of Energy William Haslebacher Project Officer / Manager This report was prepared for the U.S. Department of Energy Under Cooperative Agreement DE-FC26-03GO13072

NCEMBT-070315
ii
NOTICE This report was prepared as an account of work sponsored by an agency of the United States government. Neither the United States government nor any agency thereof, nor any of their employees, makes any warranty, express or implied, or assumes any legal liability or responsibility for the accuracy, completeness, or usefulness of any information, apparatus, product, or process disclosed, or represents that its use would not infringe privately owned rights. Reference herein to any specific commercial product, process, or service by trade name, trademark, manufacturer, or otherwise does not necessarily constitute or imply its endorsement, recommendation, or favoring by the United States government or any agency thereof. The views and opinions of authors expressed herein do not necessarily state or reflect those of the United States government or any agency thereof.
NATIONAL CENTER FOR ENERGY MANAGEMENT AND BUILDING TECHNOLOGIES CONTACT Davor Novosel Chief Technology Officer National Center for Energy Management and Building Technologies 601 North Fairfax Street, Suite 250 Alexandria VA 22314 703-299-5633 [email protected] www.ncembt.org

NCEMBT-070315
iii
TABLE OF CONTENTS ACKNOWLEDGEMENTS .......................................................................................................................................... ix EXECUTIVE SUMMARY.............................................................................................................................................1 1 PROJECT OBJECTIVE.............................................................................................................................................2 2 BACKGROUND.....................................................................................................................................................3
2.1 Duct Design Issues .......................................................................................................................................3 2.2 Performance Issues ......................................................................................................................................4 2.3 Installation Problems....................................................................................................................................5
3 METHODOLGY......................................................................................................................................................6 3.1 General Approach.........................................................................................................................................6
3.1.1 Identifying the Knowledge Gap ..............................................................................................................6 3.1.2 Design of the Experiment (DoE)..............................................................................................................6 3.1.3 Development of Laboratory and Test Procedures ....................................................................................7 3.1.4 Testing and Industry Guidance ...............................................................................................................7
3.2 Aligning project scope with the knowledge gap ..............................................................................................8 3.2.1 Installation Variations Identified From Literature Review.........................................................................8 3.2.2 Expert Committee Recommendations ....................................................................................................8 3.2.3 DOE Peer Review of the VAV Duct Design Variations Test Plan ...............................................................11
3.3 System performance characterization and measurement .............................................................................12 3.4 Design of the Experiment ............................................................................................................................14
3.4.1 Parameter Selection............................................................................................................................14 3.4.2 Test Matrix Selection and Modification ................................................................................................16
3.5 Laboratory Design and Instrumentation ......................................................................................................20 3.5.1 Laboratory System Modifications And Capabilities ...............................................................................20 3.5.2 Laboratory Instrument Modifications and Capabilities..........................................................................23 3.5.3 Test Conditions, Measurement Setup and Procedures ..........................................................................27 3.5.4 Experimental Error...............................................................................................................................28
3.6 Analysis Procedures...................................................................................................................................29 3.6.1 Parameter Effects On Performance ......................................................................................................30 3.6.2 Airflow Distribution Performance .........................................................................................................30
4 RESULTS ...........................................................................................................................................................31 4.1 Energy Efficiency For Square and Slot Diffusers ...........................................................................................31 4.2 Noise Generation For Square Diffusers ........................................................................................................32 4.3 Air Distribution Variations Resulting From Installation Variations For Square and Slot Diffusers ....................33

NCEMBT-070315
iv
5 DISCUSSION .....................................................................................................................................................34 5.1 Energy Efficiency.........................................................................................................................................34
5.1.1 Square Diffusers .................................................................................................................................34 5.1.2 Slot Diffusers ......................................................................................................................................35
5.2 Sound Levels ..............................................................................................................................................36 5.3 Air Distribution ...........................................................................................................................................36
6 CONCLUSIONS ..................................................................................................................................................38 7 REFERENCES.....................................................................................................................................................39 APPENDIX A - ENERGY EFFICIENCY TEST RESULTS .................................................................................................40
A1. Test Conditions and Results ........................................................................................................................41 A2. Parameter Main Effects Analysis .................................................................................................................45
APPENDIX B - NOISE GENERATION TEST RESULTS.................................................................................................47 B1. Test conditions and Results ........................................................................................................................48 B2. Parameter Main Effects Analysis .................................................................................................................50
APPENDIX C - AIR DISTRIBUTION VARIATION TEST RESULTS ..................................................................................52 C1. Airflow Around Diffusers:Square Diffusers...................................................................................................53 C2. Airflow Around Diffusers:Slot Diffusers ........................................................................................................62 C3. Room Airflow Between Diffusers: Square Diffusers.......................................................................................71 C4. Room Airflow Between Diffusers: Slot Diffusers ...........................................................................................89

LIST OF FIGURES Figure 1. Schematic of typical branch installation variations ....................................................................................9 Figure 2. Different types of diffusers that are used in terminal duct installations. Top: two 4-foot slot diffusers, one with a 8 inch round adaptor and one with a 10-inch oval adaptor. Bottom right: typical 2 by 2-foot louvered square diffuser. Bottom right: Plaque type 2 by 2-foot square diffuser. ..............................................................................10 Figure 3. Schematic of non-ideal energy transformation in the target system ..........................................................12 Figure 4. Schematic of air distribution modifications for VAV system.......................................................................21 Figure 5. Picture of duct showing a hard turn in the duct and a 3-foot vertical entry into the diffuser (low state of Parameter 4) ........................................................................................................................................................22 Figure 6. Picture of duct showing a 3-foot vertical duct section attached to the diffuser (high state of Parameter 3) .22 Figure 7. Picture of duct showing the duct running horizontal right before attachment to the diffuser (low state of Parameter 3) ........................................................................................................................................................23 Figure 8. Test room diffuser locations and measurement scan pattern for square diffusers (left) and slot diffusers (right). ..................................................................................................................................................................24 Figure 9. Measurement scan patterns for slot (upper) and square (lower) diffusers..................................................25
Figure 10. Directional sensitivity for the HT-412 velocity probe. For φ = 0o, flow is at a right angle to the direction of the probe shaft. ....................................................................................................................................................26 Figure 11.Traversing mechanism sensor ................................................................................................................27 Figure 12. Main effects plots for square (left) and slot (right) diffusers for the five test parameters and where the performance measure is airflow rate ratio ..............................................................................................................31 Figure 13. Noise criteria means for square diffusers when noise criteria levels have been adjusted to that estimated for a standard airflow rate .....................................................................................................................................32 Figure 14. Airflow distribution from the test diffuser for condition 1 and 4 for square diffusers at 100% design airflow............................................................................................................................................................................33 Figure 15. Airflow rate ratio means for square diffusers. .........................................................................................45 Figure 16. Signal to noise ratio for airflow rate ratio for square diffusers. ................................................................45 Figure 17. Airflow rate ratio means for slot diffusers...............................................................................................46 Figure 18. Signal to noise ratio for airflow rate ratio for slot diffusers .....................................................................46 Figure 19. Noise criteria means for square diffusers without adjustment to a standard airflow rate .........................50 Figure 20. Noise criteria means for square diffusers when noise criteria levels have been adjusted to that estimated for a standard airflow rate .....................................................................................................................................51 Figure 21. Signal to noise ratio for noise criteria for square diffusers when noise criteria levels have been adjusted to that estimated for a standard airflow rate ..............................................................................................................51 Figure 22. Test condition 0 airflow velocity from diffuser measured in a 2 by 2 foot square pattern around the diffuser.............................................................................................................................................................................53 Figure 23. Test condition 1 airflow velocity from diffuser measured in a 2 by 2 foot square pattern around the diffuser.............................................................................................................................................................................54 Figure 24. Test condition 2 airflow velocity from diffuser measured in a 2 by 2 foot square pattern around the diffuser.............................................................................................................................................................................55
NCEMBT-070315
v

NCEMBT-070315
vi
Figure 25. Test condition 3 airflow velocity from diffuser measured in a 2 by 2 foot square pattern around the diffuser.............................................................................................................................................................................56 Figure 26. Test condition 4 airflow velocity from diffuser measured in a 2 by 2 foot square pattern around the diffuser.............................................................................................................................................................................57 Figure 27. Test condition 5 airflow velocity from diffuser measured in a 2 by 2 foot square pattern around the diffuser.............................................................................................................................................................................58 Figure 28. Test condition 6 airflow velocity from diffuser measured in a 2 by 2 foot square pattern around the diffuser.............................................................................................................................................................................59 Figure 29. Test condition 7 airflow velocity from diffuser measured in a 2 by 2 foot square pattern around the diffuser.............................................................................................................................................................................60 Figure 30. Test condition 8 airflow velocity from diffuser measured in a 2 by 2 foot square pattern around the diffuser.............................................................................................................................................................................61 Figure 31. Test condition 0 airflow velocity from diffuser measured across the face from 6 inches away from the diffuser.................................................................................................................................................................62 Figure 32. Test condition 1 airflow velocity from diffuser measured across the face from 6 inches away from the diffuser.................................................................................................................................................................63 Figure 33. Test condition 2 airflow velocity from diffuser measured across the face from 6 inches away from the diffuser.................................................................................................................................................................64 Figure 34. Test condition 3 airflow velocity from diffuser measured across the face from 6 inches away from the diffuser.................................................................................................................................................................65 Figure 35. Test condition 4 airflow velocity from diffuser measured across the face from 6 inches away from the diffuser.................................................................................................................................................................66 Figure 36. Test condition 5 airflow velocity from diffuser measured across the face from 6 inches away from the diffuser.................................................................................................................................................................67 Figure 37. Test condition 6 airflow velocity from diffuser measured across the face from 6 inches away from the diffuser.................................................................................................................................................................68 Figure 38. Test condition 7 airflow velocity from diffuser measured across the face from 6 inches away from the diffuser.................................................................................................................................................................69 Figure 39. Test condition 8 airflow velocity from diffuser measured across the face from 6 inches away from the diffuser.................................................................................................................................................................70 Figure 40. Airflow distribution between diffusers for test condition 0, Square diffusers, at 100% design airflow. .....71 Figure 41. Airflow distribution between diffusers for test condition 0, Square diffusers, at 50% design airflow. ......72 Figure 42. Airflow distribution between diffusers for test condition 1, Square diffusers, at 100% design airflow. .....73 Figure 43. Airflow distribution between diffusers for test condition 1, Square diffusers, at 50% design airflow. .......74 Figure 44. Airflow distribution between diffusers for test condition 2, Square diffusers, at 100% design airflow. .....75 Figure 45. Airflow distribution between diffusers for test condition 2, Square diffusers, at 50% design airflow. .......76 Figure 46. Airflow distribution between diffusers for test condition 3, Square diffusers, at 100% design airflow. .....77 Figure 47. Airflow distribution between diffusers for test condition 3, Square diffusers, at 50% design airflow. .......78 Figure 48. Airflow distribution between diffusers for test condition 4, Square diffusers, at 100% design airflow. ....79 Figure 49. Airflow distribution between diffusers for test condition 4, Square diffusers, at 50% design airflow. .......80

NCEMBT-070315
vii
Figure 50. Airflow distribution between diffusers for test condition 5, Square diffusers, at 100% design airflow. .....81 Figure 51. Airflow distribution between diffusers for test condition 5, Square diffusers, at 50% design airflow. .......82 Figure 52. Airflow distribution between diffusers for test condition 6, Square diffusers, at 100% design airflow. .....83 Figure 53. Airflow distribution between diffusers for test condition 6, Square diffusers, at 50% design airflow. .......84 Figure 54. Airflow distribution between diffusers for test condition 7, Square diffusers, at 100% design airflow. .....85 Figure 55. Airflow distribution between diffusers for test condition 7, Square diffusers, at 50% design airflow. .......86 Figure 56. Airflow distribution between diffusers for test condition 8, Square diffusers, at 50% design airflow. .......87 Figure 57. Airflow distribution between diffusers for test condition 8, Square diffusers, at 50% design airflow. .......88 Figure 58. Airflow velocity between diffusers for test condition 0, Slot diffusers, at 100% design airflow..................89 Figure 59. Airflow velocity between diffusers for test condition 0, Slot diffusers, at 50% design airflow....................90 Figure 60. Airflow velocity between diffusers for test condition 1, Slot diffusers, at 100% design airflow. ................91 Figure 61. Airflow velocity between diffusers for test condition 1, Slot diffusers, at 50% design airflow....................92 Figure 62. Airflow velocity between diffusers for test condition 2, Slot diffusers, at 100% design airflow..................93 Figure 63. Airflow velocity between diffusers for test condition 2, Slot diffusers, at 50% design airflow....................94 Figure 64. Airflow velocity between diffusers for test condition 3, Slot diffusers, at 100% design airflow..................95 Figure 65. Airflow velocity between diffusers for test condition 3, Slot diffusers, at 50% design airflow....................96 Figure 66. Airflow velocity between diffusers for test condition 4, Slot diffusers, at 100% design airflow..................97 Figure 67. Airflow velocity between diffusers for test condition 4, Slot diffusers, at 50% design airflow....................98 Figure 68. Airflow velocity between diffusers for test condition 5, Slot diffusers, at 100% design airflow..................99 Figure 69. Airflow velocity between diffusers for test condition 5, Slot diffusers, at 50% design airflow..................100 Figure 70. Airflow velocity between diffusers for test condition 6, Slot diffusers, at 100% design airflow................101 Figure 71. Airflow velocity between diffusers for test condition 6, Slot diffusers, at 50% design airflow..................102 Figure 72. Airflow velocity between diffusers for test condition 7, Slot diffusers, at 100% design airflow................103 Figure 73. Airflow velocity between diffusers for test condition 7, Slot diffusers, at 50% design airflow..................104 Figure 74. Airflow velocity between diffusers for test condition 8, Slot diffusers, at 100% design airflow................105 Figure 75. Airflow velocity between diffusers for test condition 8, Slot diffusers, at 50% design airflow..................106

NCEMBT-070315
viii
LIST OF TABLES Table 1. Possible Standardized Input Conditions ...................................................................................................11 Table 2. Parameter list for the experimental design following Department of Energy review .....................................15 Table 3. Taguchi Orthogonal L8 Array ....................................................................................................................16 Table 4. Parameter List for Test Array ....................................................................................................................16 Table 5. Test Array with One 4-Level Parameter, Four 2-Level Parameters And One Noise Parameter........................17 Table 6. Expected effect of parameter variation on output ......................................................................................19 Table 7. Vertical locations of the traversing mechanism sensors .............................................................................25 Table 8. Airflow Rate Ratio predictions with parameter levels set at levels for high and low performance for square diffusers ...............................................................................................................................................................35 Table 9. Airflow Rate Ratio predictions with parameter levels set at levels for high and low performance for slot diffusers ...............................................................................................................................................................35 Table 10. Test conditions and results for square diffuser tests ...............................................................................41 Table 11. Test conditions and results for square diffuser tests (continued) .............................................................42 Table 12. Test conditions and results for slot diffuser tests.....................................................................................43 Table 13. Test conditions and results for slot diffuser tests (continued) ..................................................................44 Table 14. Test conditions and sound results for square diffuser tests ......................................................................48 Table 15. Test conditions and sound results for slot diffuser tests...........................................................................49

NCEMBT-070315
ix
ACKNOWLEDGEMENTS The authors obtained help and guidance from many outside sources during the course of this project. The collaboration of those people steered this project in the productive direction toward filling essential industry knowledge gaps and keeping the project focused on those goals. They also were very helpful in applying practical knowledge on experimental techniques that are particular to ductwork and room airflow testing. The expert committee members: Ted Carnes, Steve Kimmel, Richard John, Robert Browning, and Michael Mamayek, contributed their expertise and guided the project team. Also, Dan Int-Hout contributed multiple times to the success of the experiment testing.

NCEMBT-070315
x

NCEMBT-070315
1
EXECUTIVE SUMMARY This task compared the performance of conventional air distribution (CAD) systems, built according to current design specifications and workmanship standards, with CAD systems that have been built with common variations in construction and workmanship seen in typical field installations. Variations examined in this task are those found in the ducted air distribution system from the variable air volume (VAV) unit to the diffuser.
The results of this project testing revealed the quantitative differences in energy use, sound generation and room air distribution due to variations in the installation of ductwork and diffusers after the VAV unit. Specifically, for a constant supply air pressure:
Increasing flex-duct length from 6 to 35 feet decreased airflow by 11 percent
Decreasing diameter of the flex duct from 10 to 8 inches decreased airflow by 25 percent
One hard turn or a kink in the flex-duct near the diffuser decreased airflow by 11 percent and noticeably increased noise level (5 dB)
The two standard types of diffuser tested had a 9 percent difference in airflow rate
For square diffusers, the absence of a vertical section in the flex-duct right above the diffuser (no substantial length of vertical duct) actually resulted in a slight increase in airflow compared to an installation with a 40 inch vertical section but was accompanied by a significant (6 dB) increase in flow generated noise and significant asymmetric diffuser discharge airflow.
A branch duct installed immediately after the VAV unit, compared to at least four duct diameters after the VAV unit, in the square diffuser tests caused a slight decrease in airflow. The same effect could not be determined from the slot diffuser tests.
Room air diffusion symmetry was affected primarily by the type of diffuser and the approach of the flex duct immediately before the diffuser. For square diffusers, the two levels of the flex duct elbow near the diffuser condition, (1) three feet of vertical duct before the diffuser and (2) three feet of horizontal duct with only 5 inches of vertical duct before the diffuser, gave significantly different room air distribution patterns. Apparently the horizontal momentum of the airflow carried through the diffuser creating an asymmetric airflow discharge pattern. For slot diffusers, which have an internal air plenum, the two levels of the flex duct elbow near the diffuser condition did not result in significant differences in airflow discharge symmetry. The net effect on room draft and air distribution performance index (ADPI) was not determined.
These effects were consistent for both the 100 percent design and 50 percent design airflow conditions tested
The tests were conducted in the new environmental systems room at UNLV under repeatable conditions that replicated expected field installation variations. The test parameters and their test conditions were determined with the help of the literature review, the advise of an expert panel and the advise of a Department of Energy review panel. Quantitative effects were determined through the use of an orthogonal test array. The orthogonal test array gives the main effect of parameter level variation under both flow conditions in the fewest possible number of tests.
The results confirm many standard held beliefs and results of some previous testing by others, but the results also show some standard held beliefs are not accurate. The main contribution of this research is that it provides quantitative results that can be used to make energy efficiency and noise generation design and installation decisions, and to predict the efficiency and noise levels of an installation.

1 PROJECT OBJECTIVE
NCEMBT-070315
2
1 PROJECT OBJECTIVE This task compared the performance of conventional air distribution (CAD) systems, built according to current design specifications and workmanship standards, with CAD systems that have been built with common variations in construction and workmanship seen in typical field installations. Variations examined in this task are those found in the ducted air distribution system from the variable air volume (VAV) unit to the diffuser. A test protocol was developed and implemented in the UNLV Building Technologies Laboratory (BTLab) to measure performance of CAD VAV systems with respect to energy use, air distribution and acoustics. Test data were collected and analyzed to identify the sensitivity of CAD systems to the typical variations.
The specific task objectives were:
Identify typical (with potential faults) field installations of ducted CAD VAV systems.
Conduct laboratory airflow, energy, and sound tests on selected typical installations of ducted VAV systems to develop a body of valid engineering design data for these systems.
Upgrade and modify the laboratory facilities at UNLV/CMEST to conduct airflow, energy, and sound tests on ducted CAD VAV systems.
Information gathered by the project team including guidance from the Department of Energy motivated this research and guided formation of the specific project objectives. Those objectives cover gathering information on past research that could be used to refine the project objectives and methodology, identifying industry needs that will be used to define the project scope, design the experiment to fit the project scope, develop a measurement protocol to meet the experimental design, develop analysis methods used to determine the effects of installation variation on performance and disseminate this information to the industry.

2 BACKGROUND
NCEMBT-070315
3
2 BACKGROUND ASHRAE has sponsored several research projects for the purpose of updating friction loss coefficients for duct fittings in rectangular, round, and flat oval ducts and for improving design methodologies for HVAC air distribution systems in buildings. That research has helped to significantly improve the design of that part of HVAC air distribution systems up to the point where branch ducts supply air to variable volume terminal units and room air terminal devices (grills, registers, and diffusers). Design information on duct design from variable volume terminal units to room air terminal devices is primarily anecdotal in nature, and it is predicated on ideal system installations, which seldom if ever occur in field installations. There are very little measured data concerning the effects on building air distribution, energy, and sound due to variations in duct installations between air terminal units and room diffusers.
The installation of supply duct and VAV systems raises a number of issues that impact overall air distribution system efficiency and performance. Although research information on specific details is limited, there are established guidelines addressing common installation issues. The primary information sources for VAV duct design are SMACNA’s HVAC Systems Duct Design Manual (SMACNA 1990), California Energy Commission’s (CEC) Advanced Variable Air Volume Design Guide (Hydeman 2003), and the ASHRAE Handbook of Fundamentals (ASHRAE 2001). An additional important source is Mr. Dan Int-Hout, Chief Engineer for Krueger. The purpose of this literature review was to extract published information on the effect on the performance of the HVAC system of VAV terminal unit-to-diffuser duct design and installation variations. Specific information sought included duct design issues, performance issues, and installation problems.
2.1 DUCT DESIGN ISSUES The predominant duct design issues deal with duct leakage, noise and duct contamination.
Duct leakage is a frequently raised issue. Leakage in all unsealed ducts varies considerably with the fabricating machinery used, the methods of assembly, and installation workmanship (ASHRAE 2001). In the buildings investigated by Xu et al. (Xu 2002), the duct systems leaked more than what is specified by ASHRAE for “unsealed ducts.” Air leakage not only increases fan energy consumption and run-time, but also increases the induced cooling load by the extra heat generated by the fan (Xu 2002). For large commercial buildings the complete elimination of air leakage from the ducts has an electricity energy savings potential on the order of 10 kWh/m2 per year. (Modera 2001). However, SMACNA (SMACNA 1990) cautions on the impracticality of obtaining zero leakage.
Noise is also an important consideration in HVAC duct design. Ducts serve as transmitters of break-in noise while flexible ducts are effective attenuators of upstream noise sources (Int-Hout 1996). Issues with flexible duct connections at the inlet of the diffuser include increased pressure drop, increased sound levels, and non-uniform air distribution from the diffuser (Int-Hout 1996). Concerning VAV terminal design, discharge noise is rarely an issue if the unit has hard duct on the inlet, a lined outlet plenum and flex duct between the plenum and diffusers VAV units above acoustical ceilings should have radiated Noise Criteria levels no more than ~5 NC above the desired room NC rating.” (Hydeman 2003).
Contamination of the duct walls is another important consideration particularly with respect to indoor environmental quality. According to Hydeman (Hydeman 2003), it is yet to be determined how significant a health issue duct liner retention of dirt and moisture truly is. However, Foarde et al. (Foarde 1996) acknowledged the contamination of fiberglass duct materials due to soil and moisture. Their study

2 BACKGROUND
NCEMBT-070315
4
results suggest that dust accumulation and/or high humidity should be properly controlled in any HVAC duct to prevent the growth of P. chrysogenum (a species of fungus) (Foarde 1996).
2.2 PERFORMANCE ISSUES Variable airflow, proper unit sizing, and minimum airflow settings of VAV systems are the main performance issues.
The variability of the flow rates common to VAV systems appears in the literature as a common issue. Diffusers are designed to optimally distribute the air at some particular load condition and air volume. Thus, the performance of outlets with regard to throw, room velocity and noise levels will vary greatly with the discharge volume (SMACNA 1990). An adequate diffuser for VAV systems should be able to perform across the whole operational range of a VAV system. As one option, Linder generally recommends only linear slot diffusers for VAV systems (Linder 1997). Unfortunately, diffusers are often being selected without regard to the effect of VAV turn-down (Int-Hout 2001), which results in the degraded performance of diffusers at very low flow rates (Hydeman 2003). Diffusers with perforated faces tend to have short throws at high airflow rates and thus may be unacceptable for VAV applications (Int-Hout 2004).
The California Energy Commission suggests designing the HVAC system to efficiently handle auxiliary loads that operate during off hours. HVAC systems may operate at only one-half of the design airflow for the bulk of the time. Recognizing that VAV systems seldom operate at their design capacity, a reasonable balance between first costs and energy costs often results in designs using smaller duct sizes. This design approach results in a friction rate (airflow friction loss per 100 ft) at maximum design capacity that is very high compared to a system designed around maximum expected capacity (Hydeman 2003). On the other hand, optimizing the system at a dominant part load operating condition results in cost savings (Kim 2002). In a separate article, Kim reported a 7% reduction in energy consumption using the optimized part load design approach compared to the duct area over the T-method, and a higher reduction compared to the equal friction and static regain method (Kim 2002b). When considering proper room air distribution, SMACNA suggests designing with overthrow at maximum design volumes to achieve acceptable throw at part load volumes (SMACNA 1990).
Over-sizing of VAV terminals can lead to significant operational issues and generally results from using a safety factor when sizing the equipment. The outcome is quite often a reduced turndown ratio and a more expensive system (Linder 1997). Additionally, over-sizing a VAV unit significantly reduces the velocity of the air passing the velocity sensor at the same air flow as a properly sized unit, resulting in a velocity pressure that is below the sensing range of the VAV unit manufacturer’s velocity sensor (Simon 2002).
The California Energy Commission design guidelines suggest setting the minimum airflow set point to the larger of the lowest controllable airflow set point allowed by the unit and the minimum ventilation requirement. In California, the minimum ventilation rate for an office is 0.15 CFM/sq.ft. In contrast, it is common practice to have the minimum airflow set point between 30% and 50% of the cooling maximum airflow set point, well above the guidelines. The recommended approach is a dual maximum scheme that allows reduction of flow when heating or cooling load is low. There are many buildings operating comfortably with lower than 30% airflow minimums (Hydeman 2003). Some issues that drive high minimum set points are stratification, short-circuiting and dumping of cold air. Room temperature non-uniformities can result from insufficient flow at low loads due to low unit flow (Linder 1997). Also, if the airflow set point is below the working range of the velocity controller, the unit may cycle between closed and partially open, causing some varying sound levels (Int-Hout 2003). Taylor has developed a simulation that considers many of the above mentioned design factors and determined optimum design total pressure drop for the VAV unit that is on the path with the highest pressure drop (Taylor 2004).

2 BACKGROUND
NCEMBT-070315
5
2.3 INSTALLATION PROBLEMS Installation problems predominantly concern the length and type of the duct branch, how duct turns are accomplished and how the duct approaches the diffuser.
The length of the duct branch, the type of duct, and its radius affect the air delivery characteristics from the VAV unit to the diffuser. Without sufficient length to develop a uniform profile, the flow in duct branches too close to the VAV terminal or a previous branch is non-uniform, and hence causes an increase in pressure loss. SMACNA suggests a sufficiently long duct section before elbows. In addition, it highly emphasizes the use of turning vanes in elbows. However, the installation of elbows with only some vanes and with no vanes is common practice. Eliminating every other turning vane from the vane runners is believed to decrease the pressure drop. Research results, however, have revealed that this practice more than doubles elbow pressure losses, and is definitely not recommended. More astounding is the total elimination of vanes in the installation of fittings. This may be due to the fact that some sheet metal contractors have found that they do not get paid for furnishing expensive fittings, such as ones with turning vanes that were not shown on the project mechanical drawing. Without turning vanes, especially in fittings used for avoiding obstructions, good airflow in the duct system can be totally destroyed (SMACNA 1990).
The advantages of installing vanes in elbows are significant but their purpose will not be met without the proper alignment of the vane rails. Improper alignment is a common problem found in the field. Vane rails need to be aligned tangent to the flow to maintain uniformity in the flow. If the flow, however, approaching the elbow is non-uniform, the turning vanes will instead assist in maintaining non-uniformity in the flow downstream, and hence cause a pressure increase in the system upstream. The position of fittings with respect to each other is also important for the air distribution. Hydeman et al. suggest avoiding consecutive fittings to reduce the pressure drop, noting that in fittings less than six hydraulic diameters apart the flow pattern entering subsequent fittings differs from the flow pattern used to determine loss coefficients (Hydeman 2003). Thus, accurate loss calculation may be difficult.
Roughness of the ducts also affects the airflow distribution, and hence the energy used. The higher the friction factor, the more energy it takes to push the air through the ducts. Straighter and smoother ducts result in lower energy consumption and first cost (Hydeman 2003). The friction factor substantially increases for not fully extended flexible ducts. For a straight flex duct extended only 70% of full length a 400% increase of the friction factor is expected (ASHRAE 2001).
The duct approach to the diffuser is also very important, since detrimental effects of improper duct approach cannot be corrected by the diffuser itself. Both SMACNA and ASHRAE agree that for proper diffusion, the velocity of the air stream must be as uniform as possible over the entire connection to the duct and must be perpendicular to the outlet face. However, few outlets are installed in this manner. In some cases, special devices can assist redirecting and stabilizing the airflow. Most ceiling outlets are attached either directly to the bottom of horizontal ducts or to vertical take-off ducts that connect the outlet with the horizontal duct (ASHRAE 2001; SMACNA 1990).
With respect to noise, SMACNA suggest placing the diffusers as far as possible from duct elbows and branch take-offs to minimize noise transmission. For flexible ducts, SMACNA recommends to keep bends “as gentle as possible” to diminish noise transmission, however, they also indicate the possible need for bends to assist in sound attenuation (SMACNA 1990). Moreover, direct duct connections to the diffuser can result in noise levels by as much as 12 NC higher than catalog levels (Int-Hout 1996). An offset of the flexible duct connection between the diffuser and the supply duct equal to the diffuser diameter over a connection length equal to two diameters can increase the sound power level as much as 12 dB. Improperly used diffusers can also be a source of noise. Diffuser dampers cannot be used for reducing high air volumes without inducing objectionable noise (SMACNA 1990).

3 METHODOLGY
NCEMBT-070315
6
3 METHODOLGY To meet the project objectives, a detailed investigation methodology was developed and followed. To determine scope and design of the experiment, and develop test procedures, the investigation used information gathered from published literature, advise from an industry expert committee, and review comments from a Department of Energy peer review panel. The test laboratory was designed and developed and test protocols were developed and followed to conduct experiments called for in the experimental design.
3.1 GENERAL APPROACH
3.1.1 Identifying the Knowledge Gap The goal of this task was to develop useful information for the HVAC industry on duct installation between a VAV box and the diffuser. Therefore, collecting customer needs is essential to determine the best direction and scope of the investigation. Some of the customer needs were extracted from the literature review. The major source of customer needs came from a group of design and installation experts assembled specifically for this project. Specific guidance sought included:
1. Consensus on a best or industry standard installation
2. Typical variations from that standard seen in the field
3. Predominance of the different variations and the magnitude of the variation encountered in the field
4. Performance expectations from an industry standard installation
5. Expert opinion on the effect and importance of various installation variations
The information collected was used to determine the different installation parameters and to prioritize the list based on the anticipated performance effect of variation in each parameter.
3.1.2 Design of the Experiment (DoE) The design of the experiment is the crucial process used to devise a method to economically and accurately determine the effects of parameter variation on the performance of the system. The system field-operating environment is realistically simulated in the laboratory by testing under various environmental conditions expected in the field. Important inputs to the design are the environmental conditions, the physical installation parameters, the expected system performance and the parameters expected effect on performance. Specific objectives of the experimental design are to determine:
1. What are the significant environmental conditions in the field
2. Which parameters have a significant effect on the system performance
3. Which significant parameters are likely to be controlled by design or installation practices
4. Which significant parameters are likely to be not controlled by design or installation practices
5. What is the significant performance parameters to measure

3 METHODOLGY
NCEMBT-070315
7
6. What is the most economical test matrix that can be used to capture the main effects of parameter variation and achieve the objective of the experiment.
3.1.3 Development of Laboratory and Test Procedures Laboratory and test procedures are needed to effectively and reliably perform the testing called for in the experimental design. Specific objectives of the laboratory and test procedures development include:
1. Create a stable and repeatable laboratory test environment
2. Controls for modifying the test environment as required by the testing
3. Procedures for performing the various duct installations called for in the experiment design.
4. Sufficient instrumentation to monitor the test environment and accurately capture the target performance.
5. Data recording equipment and data reduction procedures for analysis of the results.
6. Understand the source and magnitude or experimental error
3.1.4 Testing and Industry Guidance Experiments were conducted as called for in the experimental design using the laboratory and test procedures. Data analysis, conclusions and recommendations focus on producing useful information and guidance for the industry. Specific objectives of the testing and analysis of results include:
1. Conduct airflow, energy, and sound tests on a HVAC system with common installation variations from a typical industry standard system
2. Determine the main effects of those variations on significant performance measures
3. Determine the importance of each type of variation and the target value for best performance
4. Determine the quantitative advantage of holding a parameter on target and the quality loss for off target performance.
5. Disseminate this information in a practical and usable format for industry use

3 METHODOLGY
NCEMBT-070315
8
3.2 ALIGNING PROJECT SCOPE WITH THE KNOWLEDGE GAP Valuable assistance from outside sources was used to obtain the ‘voice of the customer’ concerning the knowledge gap in duct design and installation. The literature review, the project expert panel and a Department of Energy review panel made particularly significant contributions toward identifying the knowledge gap.
3.2.1 Installation Variations Identified From Literature Review The literature identified rules for proper installation of ductwork and gave reasons for following the rules. In general, installations that result in unsteady flow at a branch connection or diffuser should be avoided due to increased airflow pressure drop, increased noise and unpredictable flow balancing. Common installation variations are branches to close to the terminal unit or to each other, flex duct too short or with hard bends, and duct approach to the diffuser offset from the diffuser center.
3.2.2 Expert Committee Recommendations To ensure relevance with up to date installation practices and problems, an expert committee for advising the project team was established. This committee met at UNLV during the initial project methodology development to identify the state of the art of VAV-to-diffuser duct design and common construction variations found in the field. The panel members evaluated a range of construction variations with regard to good workmanship, commonly accepted construction practices and potential detrimental impact on the air distribution performance of the system. The panel also identified several possible test setups and the variations that should be tested in this Task.
The identified variations were generally expected to disadvantageously affect the performance of the air distribution system due to either added flow restrictions, creation of uneven or disturbed flow in the ducts or added imbalance of the system. The effect of two variations, perforated face on the diffuser for square diffusers and round or oval side or top plenum inlet for slot diffusers, was not clearly known and could negatively or positively impact the performance of air distribution system.
For square diffuser systems, the panel identified the following common variations:
1. First branch too close to VAV terminal discharge
2. Short length to diffuser
3. Flex duct offset
4. Bad radius in flex duct
5. Short vertical length to diffuser
6. Flex duct too long
7. Factory supplied damper in the face of diffuser grill
8. Perforated face on the diffuser
3 METHODOLGY
NCEMBT-070315
9
For slot diffuser systems:
1. First branch too close to VAV terminal discharge
2. Short duct length to diffuser
3. Flex duct offset
4. Small radius turn in flex duct
5. Flex duct too long
6. Round or oval, side or end plenum inlet.
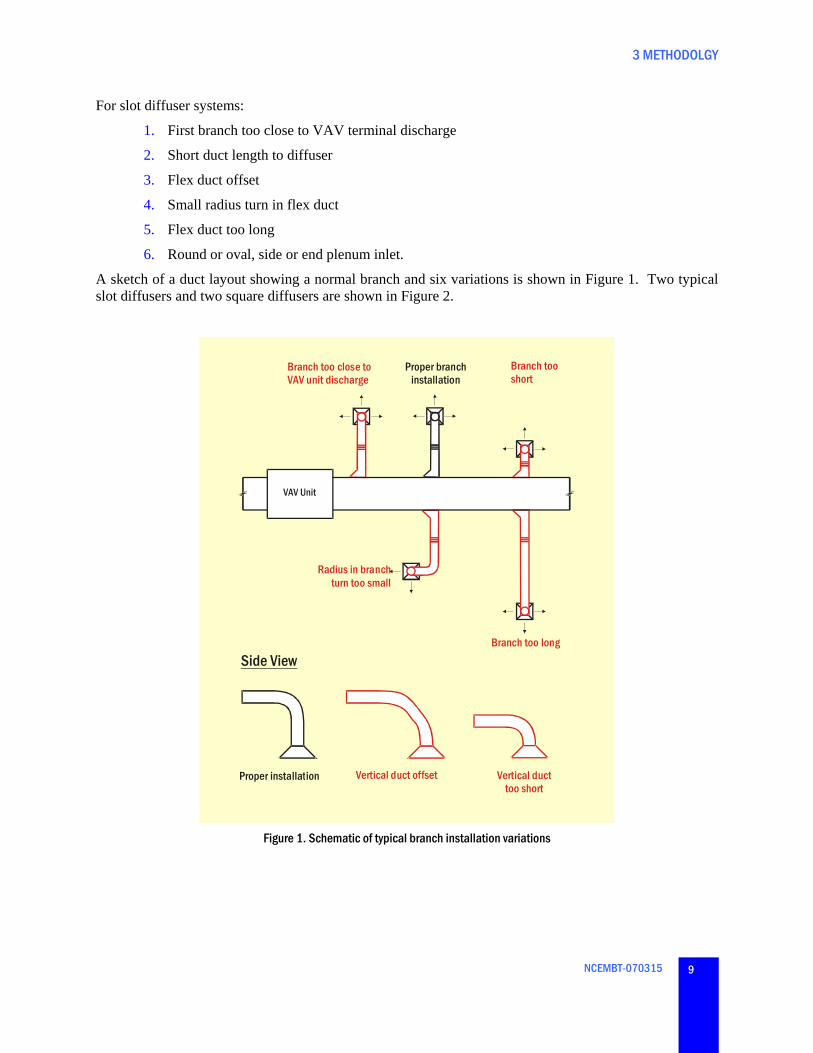
A sketch of a duct layout showing a normal branch and six variations is shown in Figure 1. Two typical slot diffusers and two square diffusers are shown in Figure 2.
VAV Unit
Branch too close to VAV unit discharge
Proper branch installation
Branch too short
Proper installation
Radius in branch turn too small
Side View
Vertical duct offset Vertical duct too short
Branch too long
Figure 1. Schematic of typical branch installation variations

3 METHODOLGY
NCEMBT-070315
10
Figure 2. Different types of diffusers that are used in terminal duct installations. Top: two 4-foot slot diffusers, one with a 8 inch
round adaptor and one with a 10-inch oval adaptor. Bottom right: typical 2 by 2-foot louvered square diffuser. Bottom right: Plaque type 2 by 2-foot square diffuser.
The expert panel suggested a separate series of tests for square diffusers and slot diffusers due to the different fundamental air distribution characteristics of the two types of diffusers. Two-foot and four-foot slot diffusers were discussed for the testing. Originally, when the test plan called for four square diffusers in the test room, using four two-foot end slot diffusers in the test room would give the best comparison to the square diffusers and are a common size of slot diffusers used in that size of room. Later, after a series of preliminary tests, a room configuration with only two diffusers, either square or slot, was determined to be the best for room air distribution and for testing. The panel initially worked out a series of tests that were based on having one condition at the extreme or bad setting while holding the other conditions at nominal or the good setting. This testing sequence was modified in favor of a more efficient orthogonal array test sequence, which is discussed in detail in section 3.4 Design of the Experiment.
3 METHODOLGY
NCEMBT-070315
11
A summary of a preliminary test plan was submitted back to the expert committee for their review and comment. Changes suggested by several members of the committee were subsequently incorporated into the test plan.
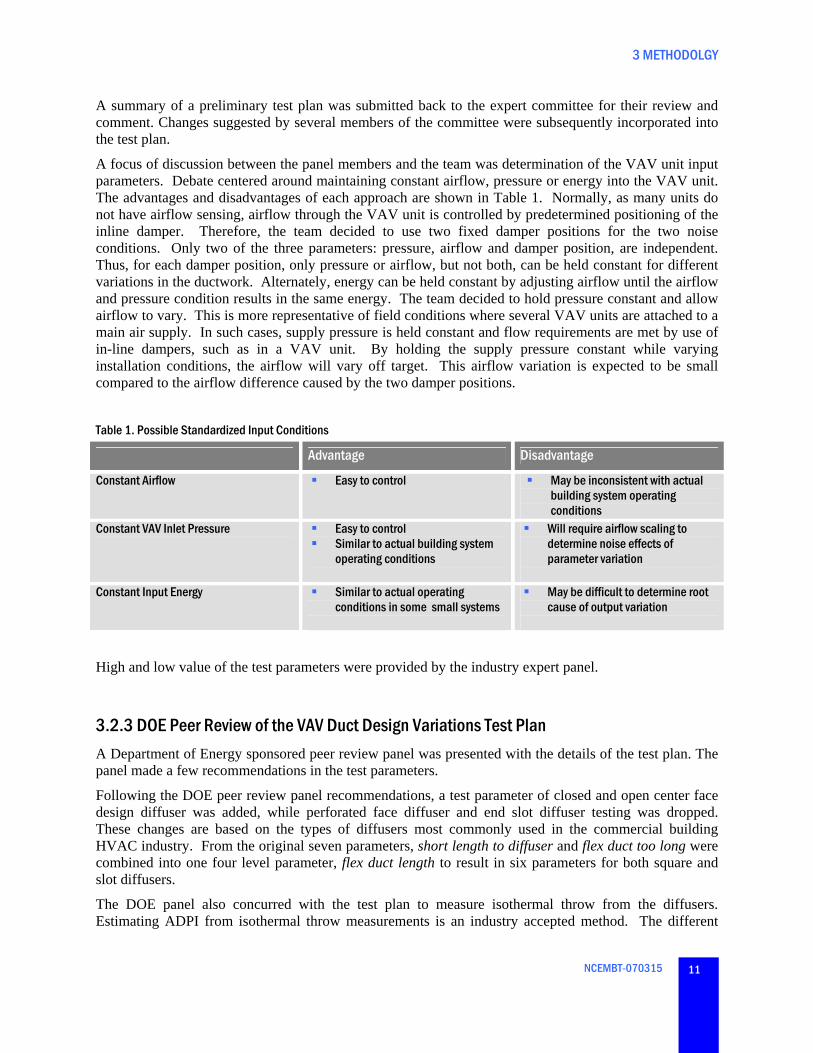
A focus of discussion between the panel members and the team was determination of the VAV unit input parameters. Debate centered around maintaining constant airflow, pressure or energy into the VAV unit. The advantages and disadvantages of each approach are shown in Table 1. Normally, as many units do not have airflow sensing, airflow through the VAV unit is controlled by predetermined positioning of the inline damper. Therefore, the team decided to use two fixed damper positions for the two noise conditions. Only two of the three parameters: pressure, airflow and damper position, are independent. Thus, for each damper position, only pressure or airflow, but not both, can be held constant for different variations in the ductwork. Alternately, energy can be held constant by adjusting airflow until the airflow and pressure condition results in the same energy. The team decided to hold pressure constant and allow airflow to vary. This is more representative of field conditions where several VAV units are attached to a main air supply. In such cases, supply pressure is held constant and flow requirements are met by use of in-line dampers, such as in a VAV unit. By holding the supply pressure constant while varying installation conditions, the airflow will vary off target. This airflow variation is expected to be small compared to the airflow difference caused by the two damper positions.
Table 1. Possible Standardized Input Conditions
Advantage Disadvantage
Constant Airflow Easy to control May be inconsistent with actual building system operating conditions
Constant VAV Inlet Pressure Easy to control Similar to actual building system
operating conditions
Will require airflow scaling to determine noise effects of parameter variation
Constant Input Energy Similar to actual operating
conditions in some small systems
May be difficult to determine root cause of output variation
High and low value of the test parameters were provided by the industry expert panel.
3.2.3 DOE Peer Review of the VAV Duct Design Variations Test Plan A Department of Energy sponsored peer review panel was presented with the details of the test plan. The panel made a few recommendations in the test parameters.
Following the DOE peer review panel recommendations, a test parameter of closed and open center face design diffuser was added, while perforated face diffuser and end slot diffuser testing was dropped. These changes are based on the types of diffusers most commonly used in the commercial building HVAC industry. From the original seven parameters, short length to diffuser and flex duct too long were combined into one four level parameter, flex duct length to result in six parameters for both square and slot diffusers.
The DOE panel also concurred with the test plan to measure isothermal throw from the diffusers. Estimating ADPI from isothermal throw measurements is an industry accepted method. The different

3 METHODOLGY
NCEMBT-070315
12
installations used in this project are expected to result in changes in total airflow and flow pattern from the effected diffuser.
3.3 SYSTEM PERFORMANCE CHARACTERIZATION AND MEASUREMENT Good performance measures posses the important characteristics of a strong relation to the customer needs and being identifiable as the result of an energy transformation from input to output. It is also advantageous that the performance measure be a leading indicator of customer satisfaction. System designers require sufficient information to design a system that will provide the desired thermal and acoustic comfort as economically as possible. The common indicator of thermal comfort is ADPI, and of acoustic comfort is the noise criteria (NC) level. The information needed to create a good system design includes diffuser airflow, diffuser airflow pattern, the expected pressure drop and noise generated from a given installation.
The energy transformation takes place in the target system from VAV unit to the test room. The input is airflow at a given rate, temperature and pressure. The desired output is airflow into the room at a desired rate, temperature and distribution. The intended energy transformation consists of redirection of the flow. The unintended consequences of the transformation are airflow decrease, pressure loss, noise generation, heat loss or gain, and undesired airflow distribution. A depiction of the energy flow is shown in Figure 3. This project deals with isothermal flow so heat transfer is not considered. A strong effort was made to avoid airflow loss due to leakage between the VAV unit and the diffuser. Airflow decrease due to leakage was not used as a parameter and any loss was considered experimental error in this experiment. As previously mentioned, at a given inline damper setting airflow and system pressure drop are inter-dependent.
Energy Output Energy Input Airflow
Figure 3. Schematic of non-ideal energy transformation in the target system
For this experiment, the supply air pressure was held constant. For a given VAV damper setting, airflow decreased due to increased airflow resistance in the ductwork including diffuser. Thus, changes in airflow were a good measure of the efficiency of the energy transformation. Before reaching the VAV unit, the supply air passed through several silencer like plenums, nearly 15 feet of lined metal duct with perforated inner surface and about 30 feet of large diameter flex duct. At the VAV unit the flow had no significant noise content. All noise created in the room was noise that was generated from the VAV unit to the diffuser. Thus, noise measured in the room was a good indicator of unintended energy transformation in the target system. Airflow entered the VAV unit through a 4-foot straight metal duct and was presumed to be uniform. The distribution of the air into the room, uniform or otherwise was a
Airflow Energy Transformation Flow Distribution Pressure Noise Temperature Temperature
Unintended Energy Input Noise Heat Transfer

3 METHODOLGY
NCEMBT-070315
13
combination of the intended and unintended consequence of the installation from the VAV unit to the diffuser. Airflow distribution was a good measure of part of the energy transformation in the target system. For this experiment, airflow rate, airflow pattern and room noise levels were measured as performance parameters.
Airflow rates were measured at each diffuser before and after each test run. The performance parameter used was the ratio of test diffuser airflow to the airflow measured during the nominal case run. This gave a direct measure of the relative efficiency of the installation.
Room noise level was measured at two elevations for all test points during all test runs. An average of the readings from the microphone at mid level during a scan around the diffuser was used for the performance measurement. The measurement was converted to the Noise Criteria (NC). Noise Criteria is designed for measuring HVAC related noise and is commonly used by the industry. Because of intermittent extraneous noise in the test room at the two lowest octave bands used for calculating NC, the measurements at those bands were omitted. Therefore, the reported levels were modified NC levels. Those omitted bands covered the low frequencies typically associated with rumble. Rumble is a characteristic of large fan noise or unstable flow in large ducts and the generation of such noise was not expected from the ductwork in this experiment. The modified NC was expected to be a good representation of the actual NC due to the ductwork installation. For nearly all measurements, they were in fact the same.
Room diffuser airflow pattern and throw characteristics were measured to determine air distribution changes due to variations in ductwork installation. If a room air distribution system is designed with the assumption of directionally symmetric diffuser performance, then any significant deviation from that symmetry could be detrimental to the room ADPI. However, most room designs, including the test room for this task, have inherent compromises in the diffuser design. Most notably, the characteristic length used to select diffuser location may not be symmetrical in every direction. In the test room used in this experiment, the square diffuser characteristic length varied from eight to eleven feet. It is possible that matching asymmetry in diffuser throw with asymmetry in characteristic length could be beneficial. On the other hand, random anti-symmetrical throw is likely to be especially detrimental to ADPI. Clearly, APDI has dual dependency on both diffuser throw and room air distribution design. The Task goals were to produce data that could be used for different room designs, and in a sense, be room independent. Therefore, diffuser throw variation were deemed to be a better indicator of the effect of variations in the test parameters than ADPI measurements. Some parameter variations may not affect throw symmetry, but may affect the system balance and, as a result, the overall efficiency with or without system rebalancing.

3 METHODOLGY
NCEMBT-070315
14
3.4 DESIGN OF THE EXPERIMENT The design of the experiment determines how economically and accurately the effects of parameter variation on the performance of the system are captured. Parameters that have a direct effect on the energy transformation were chosen and grouped as either control, test or noise parameters. Following parameter selection, the most efficient test matrix was chosen and parameter levels were adjusted to best capture the main effects of parameter variation.
3.4.1 Parameter Selection The expert panel identified seven different conditions and two different types of diffusers that most likely would be installed in a typical VAV system. A full factorial design of experiment (DoE) for those seven conditions and two diffuser types at just two levels would involve hundreds of tests. Alternately, a basic vary-from-nominal one parameter at a time test for four configurations would require 26 tests at each airflow level (48 for two airflow levels) and would not give any information in cases where more than one parameter is different from nominal. Along with total number of tests, the required labor and the difficulty of achieving test parameters must also be considered. Each test involves configuring the duct system and diffuser according to the selected levels of the parameters, running the HVAC system until conditions such as air velocity and temperature have stabilized, then measure air velocity, temperature and sound at all the required positions in the test room.
To achieve the task objectives in the budget and time allotted, an efficient experimental design was required.
A DoE based on the Taguchi Orthogonal Array is a very efficient tool used to derive relationships between parameters and the results. The Taguchi method of experimental design has gained wide acceptance in industry and applied research for quality improvement in product and process design. The method is used to determine the relationships between different parameters such as ingredients, strength, shape, length and smoothness, and the quality level achieved in the output. The orthogonal property of the test array allows for easy and accurate statistical analysis. For example, from the experimental results, the designer can determine the best level for a parameter, the sensitivity of the output to that parameter and the sensitivity of the output to noise (changes in uncontrolled conditions) at different parameter levels. In this experiment, the relations obtained were for the main effects. A main effect was defined as the impact a particular parameter had on the output. In contrast, an interaction was defined as any change in the effect of a parameter caused by a change in the level of a different parameter. In other words, an interaction was the change in the output that was not caused by the main effect. When the Taguchi Orthogonal Array is used, any interaction is spread out evenly through all the output of the experiment. Thus, the interaction is not measurable, but fortunately, due to the spreading out of any interaction effects on the experimental output, the interaction has a minimum impact on the main effect.
The Taguchi Orthogonal Array was used to test the system for all the parameter variations. Along with the conditions obtained from the expert panel, analysis of the literature suggested an additional condition of VAV terminal variable flow rate. One of the conditions suggested by the expert panel, flex duct vertical section above the diffuser is offset, was incorporated into short vertical section above diffuser. Knowledge of the physics of the system suggested that both parameters have a similar effect and have strong interaction. In fact, short vertical section above diffuser, is just the extreme case of duct offset. The conditions and resulting parameters are listed in Table 2. The table also lists the form of energy conversion associated with that parameter and the type of parameter as either test, control or noise.

3 METHODOLGY
NCEMBT-070315
15
The type definitions are:
Test Parameter. A parameter that is a cause of variation and is tested a several levels.
Control Parameter. A parameter that can be controlled and eliminated as a source of variation. May be tested to evaluate different design option.
Noise Parameter. A parameter that cannot be controlled, or is preferred not to be controlled, in actual system use. Therefore a good system should be robust to changes in the noise parameter. This parameter may be varied in the experiment to test for system robustness.
Table 2. Parameter list for the experimental design following Department of Energy review
Condition Parameter Energy Form Type of Parameter
Duct branch close to VAV terminal or previous branch
Distance from branch to VAV unit or previous branch
Flow disturbance Test Parameter (x)
Duct very short or very long Distance from branch to diffuser
Flow disturbance Test Parameter (x)
Short vertical section above diffuser Distance from elbow to diffuser
Flow disturbance Test Parameter (x)
Small radius turn in flex duct Size of radius Flow resistance / noise Test Parameter (x)
Closed or open face diffuser (square diffuser only)
Closed / open Flow resistance, disturbance
Control Parameter (C)
Round / oval diffuser plenum inlet (slot diffuser only)
Round / oval Flow disturbance Control Parameter (C)
VAV airflow volume Flow rate Flow resistance / noise /disturbance
Noise Parameter (N)
Note that the type of parameter classification (test, control or noise) is dependent on where in the whole process of HVAC system creation the evaluation is performed. For example, a system designer may not specify the exact diffuser or duct but instead just the source of air for each diffuser and the expected flow for the anticipated room load. To that designer, some of the control parameters listed in Table 2 become noise parameters such as diffuser choices, and variations in duct installation and room conditions. Alternately, to the installer that chooses the diffuser and duct products, and directs the installation, many of the test parameters in Table 2 become control parameters. Possible noise parameters for the installer would be parameters such as flow rate, room load, room furniture and partition arrangement, variations within the products, and variations from the designated installation.
For this experiment, it was assumed that diffuser choices are controlled but that exact installation conditions are subject to variation. The seven parameters in Table 2 were determined to be acceptable parameters for the DoE. One practical consideration was that, based on the available time for testing and how the design sequence affected ease of changing between tests, the total number of tests would not exceed 35. To the maximum extent possible, test parameters that were expected to have a strong interaction or were essentially the same parameter at different levels were combined and varied together

3 METHODOLGY
NCEMBT-070315
16
as one parameter. It was decided to include the control parameter, diffuser inlet or face type, as a test parameter to capture the effects of changing the diffuser type.
3.4.2 Test Matrix Selection and Modification For the experiment itself, there were a discrete number of arrays to choose from. Considering the number of parameters and the desire to economize on the number of tests, the L8 array, requiring 8 tests and having the ability to evaluate the main effects of up to 7 parameters at two levels, or 5 parameters, 1 at four levels and 4 at two levels was chosen. The array shown in Table 3 is the 5-parameter configuration. The first test shown has all parameters at level one while all other tests have the parameters at mixed levels. When the test is actually conducted the order of tests is randomized to help reduce uncontrolled noise interference in the results. The array is balanced by choosing parameter levels such that any condition of any parameter is tested with an equal number of high and low conditions of the other parameters. For example, parameter 2, level 1 is tested with parameter 4, level 1 twice and level 2 twice. This testing method reduces interaction effects in the output and exposes all parameters to the different levels of the other parameters. This is an excellent array to determine main effects as long as interactions are low and effects for the two level parameters are close to linear.
Table 3. Taguchi Orthogonal L8 Array
TEST CONDITION PARAMETERS
Test No. Branch to elbow distance
Branch to VAV unit distance
Elbow to diffuser distance
Bend in duct radius
Diffuser/duct type
1 1 1 1 1 1 2 1 2 2 2 2 3 2 1 1 2 2 4 2 2 2 1 1 5 3 1 2 1 2 6 3 2 1 2 1 7 4 1 2 2 1 8 4 2 1 1 2
The list of the five parameters for the two diffuser cases is shown in Table 4.
Table 4. Parameter List for Test Array Parameter Low State Mid State High State
1. Branch to diffuser distance 6 (square), 9 (slot) feet 15 and 25 feet 35 feet 2. Branch to VAV unit distance 6 inches 54 inches 3. Elbow to diffuser distance 5 inches 40 inches 4. Bend in duct radius 5 inch radius, 120 degree
turn 30 inch radius, less than
90 degree turn 5. Diffuser design (square) Louvered Plaque 5. Duct size and connection (slot) 8-inch, round 10-inch, oval

3 METHODOLGY
NCEMBT-070315
17
Table 3 is referred to as the inner array. The one noise test condition, airflow rate, still needed to be added to the experiment. Noise conditions are added at the right of the matrix in what is called the outer array. With only one noise condition, the outer array is just a one-row, two-column array. The complete test array, inner and outer, for both diffuser types is shown in Table 5. One nominal test condition, listed as test condition 0, was added to the array. Test parameters for this test condition were set at what are considered standard installation practice levels and the more common diffuser was chosen. Test condition 0 was not used in the calculations for main effects and signal to noise levels. It was included to give comparative information on the performance of a standard installation. The measured output for each test is entered under each Noise Test Condition column. Thus, for each type of diffuser (square or slot) there are eight test numbers, each done once for each noise condition. Because we have two diffuser types, a total of 32 tests were required. The results of the experiment were used to determine the main effects of the test parameters. The main effects were the average effects for that test parameter with the other parameters at equal instances of all possible test levels and while exposed to the different noise condition levels.
Using the main effects, it was possible to predict the results for all possible cases of parameter levels, most of which were not tested. Also, for any given performance measure or combination of measures, optimum settings of the test parameters can be determined. Parameters that can have continuous levels (not just either/or) can be set at values between the extremes. Results for the 4-level parameter can show non-linearity in the output and can show an optimum value between extremes. Because a noise parameter is evaluated, robustness of the design to that noise condition can be evaluated. These results also can be used to help with tolerance design.
Table 5. Test Array with One 4-Level Parameter, Four 2-Level Parameters And One Noise Parameter
TEST CONDITION PARAMETERS NOISE TEST CONDITION
Test No. 1 2 3 4 5 1 2
1 1 1 1 1 1
2 1 2 2 2 2
3 2 1 1 2 2
4 2 2 2 1 1
5 3 1 2 1 2
6 3 2 1 2 1
7 4 1 2 2 1
8 4 2 1 1 2
0 Nominal 2 2 2 1

3 METHODOLGY
NCEMBT-070315
18
Because the arrays are balanced and orthogonal, analysis of the results of the test is greatly simplified. Analysis of the results produces values for the main effects (change in output when a parameter is changed from one level to the other), and the signal-to-noise ratios (S/N), (the effect of noise and other parameter variation on the output with the parameter at a given level). Those values are plotted for easy parameter at all test levels. The main effects are calculated using the equation:
Al,i =j=1
j= n
ΣYl ,i, j
n (1)
where Al,i is the mean performance when parameter i is at level l, and Yl,i, j is the result for the j test when parameter i is at level l. For example, for the mean when parameter 2 is at level 1, the results from the four tests (numbered 1, 3, 5, and 7 in Table 5) are averaged.
The S/N calculation depends on the type of performance characteristic. The performance characteristic of airflow is a larger the better characteristic and noise level is a smaller the better characteristic. The signal-to-noise calculation uses the equation:
S /N = −10log10 MSD (2)
where MSD is the mean square deviation. For smaller the better:
MSDl ,i =j=1
j= n
ΣYl,i, j2
n (3)
while for greater the better,
MSDl ,i =j=1
j= n
Σ1/Yl,i, j2
n (4)
for level l of parameter i.
The mean gives the average performance when a test condition is at a specific level. Because the other test parameters are equally balanced at all of their levels, this mean is the best indicator of expected performance at that level. S/N, on the other hand, also measures the variation of performance when a test condition is at a specific level. Because of the way S/N is calculated, the highest value of S/N is always desirable in both larger and smaller the better performance measures. For the larger and smaller the better performance measures, the mean and the S/N level normally indicate the same level as the best for any given parameter. However, if performance has high variation at a specific parameter level, the S/N value

3 METHODOLGY
NCEMBT-070315
19
may be lower than a level with a less desirable mean but lower variability. A designer then needs to decide if the low variation is more desirable than the better mean. In many cases, low variation is chosen and a different parameter is used to obtain a desirable mean. In the case of energy efficiency in ductwork, the optimum mean may be chosen to maximize potential energy savings, while the lower variation may be chosen so that performance can be better predicted.
Based on principals of physics and engineering experience, certain changes in performance were expected from changes in the different parameters. Table 6 lists the expected change in different performance characteristics with changes in the test parameter. This list was compiled before the experiment was run to help build the design and measurement scheme so as to not miss those performance changes.
Table 6. Expected effect of parameter variation on output
Parameter Expected effect at variation
Effect on diffuser throw symmetry
Effect on system performance
Energy efficiency related effect
Duct branch to diffuser distance Unstable flow Small to none Airflow balance change
Resistance added by balancing
Duct branch to VAV unit distance
Unstable flow Possible asymmetry
Airflow balance change
Resistance added by balancing
Duct hard elbow to diffuser distance
Flow velocity direction
Significant asymmetry
Flow noise generation
Unknown
Bend in duct radius Flow restriction none Flow resistance Resistance added to balance
Diffuser design (square diffuser)
Throw pattern variation, flow resistance
Different throw pattern
Possible resistance change
Possible resistance change, different balancing
Duct connection (slot diffuser) Flow resistance and direction
Different throw pattern
Possible resistance change
Possible resistance change, different balancing

3 METHODOLGY
NCEMBT-070315
20
3.5 LABORATORY DESIGN AND INSTRUMENTATION The UNLV test room was extensively modified to accommodate the requirements of this and other NCEMBT projects. The modifications included new heat pumps for the room air system, rework and extensive additions to the room ductwork, addition of a temperature control system for all test room surfaces, the addition of extensive system monitoring instruments and new instruments for measuring the performance characteristics.
3.5.1 Laboratory System Modifications And Capabilities The laboratory system modifications that made this project possible were the addition of temperature control of the room HVAC system and room surfaces, and the rework and extensive additions to the room ductwork.
The room HVAC control was designed to supply air at a stable volume and temperature. The volume for each test is maintained by a manually controlled fan run at a set speed. The supply air temperature was conditioned by two multi-stage compressor heat pumps. Each heat pump was controlled by a variable demand thermostat with a temperature sensor in the supply duct located just before the VAV unit. To stabilize the supply air temperature, the air passed a heat exchanger with 15 gallons of circulating water and glycol. The buffering effect of the heat exchanger reduced temperature changes in supply air to a rate of less than 2F per minute under all operating conditions.
Temperature control of the room surfaces was accomplished by ducting conditioned air through a channel between layers in the walls, sub-floor and ceiling. Surface control was divided into thirteen independently controlled zones. The zones could be heated or cooled to maintain the desired temperature or heat transfer, on their respective surfaces. The four vertical surfaces (room walls) were covered with 1/4-inch wallboard backed by 1/8-inch of dense foam rubber like material. The wall covering added sufficient insulation between the temperature control air ducting and the room interior surface to achieve thermal buffering in the wall and create slower thermal convection through the wall. At the same time, the control scheme for the surface temperature control was optimized to hold target and reduce temperature variations. Tests indicate a temperature gradient along the walls of 4 F or less. Average surface temperature variation was below ± 2 F. For this experiment, all the walls and ceiling were maintained at 75 F to achieve isothermal conditions. Total heat load in the room was estimated at 150 watts from overhead florescent lighting, 80 watts from the instrument motion system, and 50 watts from the instrumentation.
The room ductwork was modified to accommodate the CAD and under floor air distribution (UFAD) testing. The UFAD tests were conducted under a separate NCEMBT task. A depiction of the supply ductwork in the test room is shown in Figure 4. Starting with the main supply duct, a T-section with a class III smoke damper on each branch was attached to the end of the main supply duct. The smoke dampers were remotely operated and selectively positioned fully open or fully closed to direct supply air to either the UFAD or the CAD duct system. For the CAD system, following the damper, flow entered a 35-foot, 14-inch inner diameter flex duct. The flex duct connected to a 48-inch, 14-inch diameter rigid duct section that leads directly into the VAV unit. The VAV unit had no reheat coil or a fan but did have a remotely controlled damper that could be set from 100 percent to 0 percent open. The setting of the VAV unit damper could be repeated accurately within ± 1 percent. Attached to the VAV unit outlet was a short transition section that had an 18-inch round outlet. To accommodate the various test configurations, various rigid duct sections could be attached to the transition.

3 METHODOLGY
NCEMBT-070315
21
To UFAD
VAV unit
rigid duct
flex duct
flex duct
Supply
flex duct
Figure 4. Schematic of air distribution modifications for VAV system
The VAV unit is depicted in a typical position and not a permanent position. The VAV unit could be moved to any location in the room that its size and duct connections allowed. This flexibility was necessary to accommodate the various diffuser branch duct lengths required in the experiment. The ductwork downstream of the VAV unit was configured as required by the respective experiment. The rigid duct section between the VAV unit transition and the first branches was a 48-inch section that could be removed, allowing to place the branches immediately after the transition. The 24-inch rigid duct between the first two branches and the last two branches was removable. The rigid duct sections after the VAV unit were held together by Duct-Mate connectors. All 4 branches had an internal damper that could be used to balance airflow between diffusers. From the branches, flex duct of the designated diameter and length was run to the diffuser. The characteristics of the duct run, such as the existence of any hard turns or the distance of the last 90 degree turn to the diffuser were set according to the requirements of the experimental run. Hard duct turns of 180-degree 5-inch radius were held in place by wrapping duct tape around the duct as shown in Figure 5. The distance of the last 90-degree in the duct before entering the diffuser is shown in Figure 6 and Figure 7 where the distance is 36 inches and 5 inches respectively.
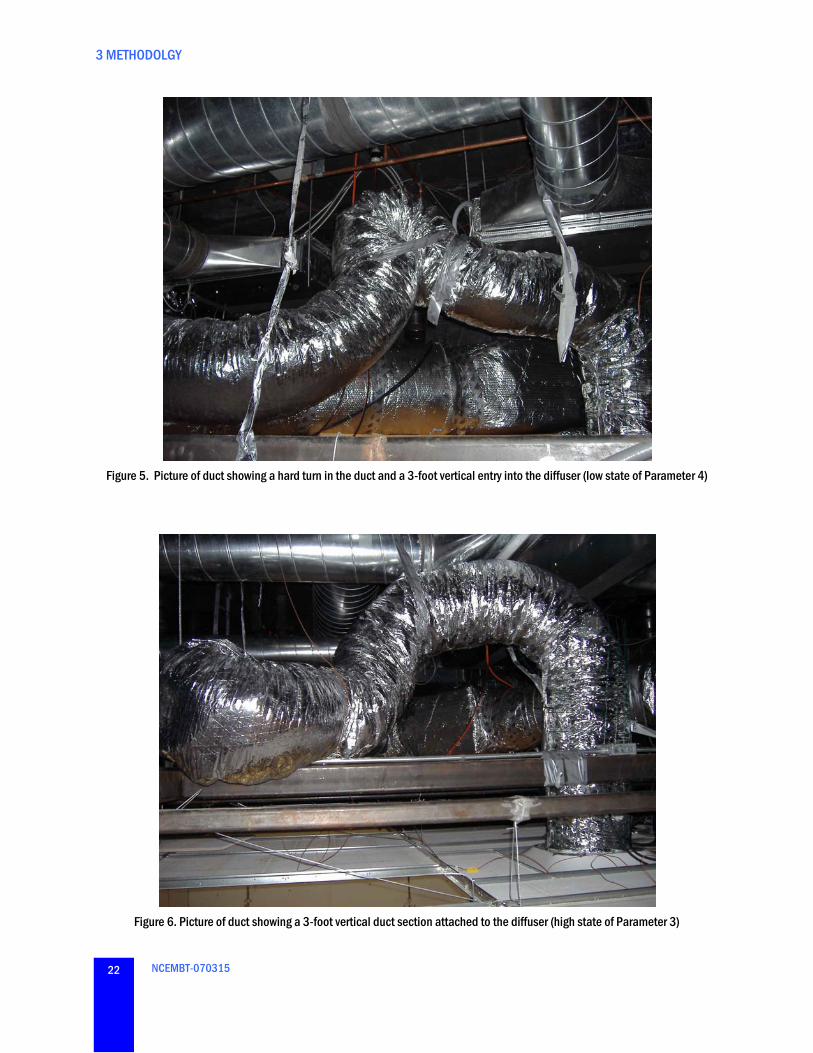
3 METHODOLGY
NCEMBT-070315
22
Figure 5. Picture of duct showing a hard turn in the duct and a 3-foot vertical entry into the diffuser (low state of Parameter 4)
Figure 6. Picture of duct showing a 3-foot vertical duct section attached to the diffuser (high state of Parameter 3)

3 METHODOLGY
NCEMBT-070315
23
Figure 7. Picture of duct showing the duct running horizontal right before attachment to the diffuser (low state of Parameter 3)
Only two diffusers were used for this project so two of the branches were blocked after the damper with a duct cap and sealed with tape. All rigid ductwork attached to the VAV unit, and the unit itself were insulated to approximately R-6 by exterior wrapping with aluminum backed foam sheets. The flex duct came with an R-6 insulation between the inner and outer liner.
3.5.2 Laboratory Instrument Modifications and Capabilities Laboratory modifications included the addition of new instruments for extensive system monitoring and measurement of the performance parameters.
All tests for this project were run under isothermal conditions. Multiple temperature sensors were used to monitor the temperature at various locations in the supply air and the test room. Supply air temperature was sensed at every transition point along its journey from the return grills to the supply diffusers. The temperature control sensor of the supply air was located just before the VAV unit. Due to isothermal conditions throughout the room and return air plenum, temperature gain or loss from the VAV unit to the room diffusers was negligible. Readings from diffuser discharge sensors, the room reference sensor and the return air grill sensors confirmed that temperature variation in the room was within ± 2 F of set point.
Performance characteristics were measured by automatic scanning of airflow and noise at multiple locations in the room and by manual flow measurements at each diffuser.

3 METHODOLGY
NCEMBT-070315
24
The diffuser locations and the test scan pattern for square diffusers and slot diffusers are shown in Figure 8. Square diffuser locations were determined using standard installation guidance to achieve the proper ratio of diffuser throw to characteristic length for good ADPI. This configuration was tested and had an ADPI over 90 percent. The slot diffuser were placed to obtain good room air distribution and allow for scanning with the movable instruments. Due to instrument scanning limitations, the configuration had the slot diffusers further from the wall than would be expected in a normal installation. However, the flow between the diffusers and not near the wall was of interest in this Task, and those results were not likely to be significantly changed by the small decrease in the separation distance of the slot diffuses.
10 ft
8 ft
9 ft 9 ft
8 ft 30 ft
20 ft
#2
#32x2 ft diffuser
20 ft
5 ft
4 ft
4 ft
Figure 8. Test room diffuser locations and measurement scan pattern for square diffusers (left) and slot diffusers (right).
The scan patterns used to capture diffuser throw and interaction between the two diffusers are shown in Figure 8. They consist of one centerline scan and one scan on each side two feet from centerline. Point spacing along each scan was six inches. It was anticipated that flow changes would occur more rapidly in the predominant flow direction than transverse to the flow.
The scan pattern used to capture flow velocity and asymmetry of the flow in the immediately diffuser discharge was a four or three-sided scan around the square or slot diffuser respectively as shown in Figure 9.

3 METHODOLGY
NCEMBT-070315
25
9"
60"
24"
24"
one point every six inches
flow direction
point 1
scandirection
Figure 9. Measurement scan patterns for slot (upper) and square (lower) diffusers
The vertical locations of the draft and temperature sensors are shown in Table 7. During the scans of the square diffusers sensor TV17 was in the diffuser throw while the next sensor down, TV16, was for the most part out of the throw.
Table 7. Vertical locations of the traversing mechanism sensors
Sensor Height from the floor (in) Height from the ceiling (in) TV17 106.5 1.25 TV16 104 4.75 TV15 101 7 Mic 2 100 8 TV14 98 10 TV13 95 13 TV12 92 16 TV11 89 19 TV10 86 22 TV9 83 25 TV8 77 31 TV7 72 36
Mic 1 68 40 TV6 67 41 TV5 54 53 TV4 43 65 TV3 30 78 TV2 23 85 TV1 6 102

3 METHODOLGY
NCEMBT-070315
26
The airflow speed measured by the draft sensors was slightly dependent on the orientation of the flow to the sensor as show in Figure 10. During the measurement scanning, the orientation of the sensors relative to the room remained the same which resulted in the presumed horizontal orientation relative to the flow that was different for all four cardinal directions (front, left, right, and behind).
Figure 10. Directional sensitivity for the HT-412 velocity probe. For φ = 0o , flow is at a right angle to the direction of the probe
shaft.
The sensors were mounted to the traversing mechanism as shown in Figure 11. The top sensor, TV17, was also oriented 20 degrees up so that the presumed flow orientation, using the convention of Figure 10, varied from +70 to -70 degrees yaw. A correction to the flow measurement was applied based on the information in Figure 10. For +70 degrees yaw the measurement was divided by 0.95, for 0 degrees yaw, 1.0, for -70 degrees yaw, 0.8. Measurements made at orientations between those values were scaled appropriately based on assumed flow direction along a radial from the center of the diffuser.

3 METHODOLGY
NCEMBT-070315
27
Figure 11.Traversing mechanism sensor
3.5.3 Test Conditions, Measurement Setup and Procedures The test protocol was designed to maintain stable, repeatable test conditions and to collect sufficient data to test the hypothesis of the task. Specific setup items involved installing or modifying the ductwork configuration to meet the test parameter conditions, setting VAV unit damper position, room air-conditioning supply temperature and pressure setup, set up of the test point grid in the room, initial diffuser balancing and initial microphone balancing for the sound data recording setup. Test conduct and data recording included recording:
The room air temperature and velocity from the TV sensors every four seconds
A 10-second average of third-octave band sound levels from the two microphones
Supply and return air temperature, pressure and flow volume at various locations every four seconds
Temperatures at all the surfaces in the plenums every four seconds
Manually recorded diffuser airflow measurements at the beginning and end of each test
An outline of the protocol is below:
Once at start of testing and once after completing all tests:
1. Determine the supply pressure to maintain 800 cfm total with all diffusers in the nominal condition and the VAV damper at 100%. This is test condition 0 at noise condition 1.

3 METHODOLGY
NCEMBT-070315
28
2. Determine the VAV damper position to maintain 400 cfm total with all diffusers in the nominal condition and the supply air pressure at the value determined in 1 above. This is test condition 0 at noise condition 2.
For each test:
1. Install the appropriate duct, diffuser, post-VAV unit branches called for in the DOE test condition. Install the duct as called for in the DOE (bends, straight sections).
2. Inspect all other diffusers to ensure they are in the nominal condition.
3. Set the VAV damper at 100% (open) for a 100% airflow test and at the proper percentage for a 50% airflow test.
4. Set the supply air pressure to the value determined at the beginning of testing that maintained 800 cfm total airflow in the nominal condition.
5. Stabilize the test room at the test condition for at least 30 minutes.
6. Manually measure both diffuser’s air volume flow. Record the fan motor amperage.
7. Perform the two scan patterns for that test condition.
8. After scans are complete, again manually measure the flow volume on both diffusers and record the fan motor amperage.
The eight experiments in the test array in Table 5 were performed in random order. The two noise conditions were performed in order 1 first then 2 second. Scans around the diffuser and the raster scans were performed in the most convenient order. The two sets of experiments for the square diffusers and slot diffusers were in that order.
3.5.4 Experimental Error All experimental results contain some experimental error. Care was taken to minimize the effect of know causes of experimental error. In this series of tests, experimental error was due to instrument tolerances, HVAC temperature and airflow control tolerances, physical ductwork installation variation, experiment setup variation and instrument use variation.
Instruments installed in the laboratory were all calibrated and regularly checked for proper function. In addition, instrument redundancy helped eliminate errors due to instrument inaccuracies or malfunctions. Instrument tolerances on critical measurements were:
supply static pressure: .05 in w.c. or 1% of full scale
supply air flow rate: 30 cfm maximum or 3% of reading
supply air temperature: .2 F
diffuser air flow rate: 20 cfm maximum or 5% of reading
room draft velocity: .01 m/s maximum or 1% of reading
room air temperature: .4 F
octave band sound level: ±1 dB absolute, ±0.5 dB relative
Airflow control was accomplished by manually setting the frequency of the fan drive to maintain the designated supply air static pressure. Airflow rate measurement varied less than 20 cfm during the tests.

3 METHODOLGY
NCEMBT-070315
29
Supply air temperature was automatically controlled through a proportional integral controller running a five-stage compressor. The supply air was conditioned after the supply fan so that the fan air was at the return air temperature.
Physical ductwork installation had a significant potential for adding to the experimental error. Every test condition required changing one to five of the test parameters. Because of the post VAV unit rigid duct changes and different lengths of flex duct, test setup often required moving the VAV unit. This resulted in changes in the bending of the main supply flex duct. Efforts were made to avoid any sharp turns in the duct. Also, because the test conditions were set based on supply pressure after the main supply flex duct, any changes in duct flow resistance were assumed not to affect the test setup. The different configurations required four different lengths of flex duct. Actual duct length varied depending on how much force was used to stretch the duct. Duct sections were measured in their extended condition. Between configurations an inch or two of length may have been lost during removing and reattaching. Lengths were within 6 inches of that specified. Many configurations required several turns in the flex duct to the test diffuser. Special efforts were made to minimize the number of turns and maximize the turn radiuses. All turns that were not a test parameter had a radius larger than 30 inches. Flex duct was stretched to its design length to avoid compression of the duct wire and the consequential varying duct inner diameter. However, some compression may have occurred along with some turns adding to the duct flow resistance. Hard turns in the ducts required for some configurations were performed in a consistent manner but probably had some variation in the amount of resulting flow restriction. The procedures followed should have kept the airflow resistance installation variation significantly lower than the airflow resistance change caused by changes in the levels of the test conditions.
Experimental setup had several manual operations that could have resulted in an experimental error. Before each experimental run, the VAV damper was manually set to the desired position and the fan control frequency was manually adjusted to achieve the required supply static pressure. The VAV damper control was analog and was difficult to read closer than .5% of damper. Coupled with the clock drive variation, the experimental error was estimated at ±1%. Supply static pressure instantaneous readout varied by ±.05 in w.c. requiring that a 2-minute average or longer be taken to determine the steady state pressure. Fan frequency was adjusted until the average supply static pressure was ±.025 in. w.c. of the target pressure. Together, these two setup variations probably resulted in an experimental error of ±2% in the resulting airflow rate.
A flow hood was used to measure the diffuser flow rates. Considerable effort was made to teach all team members a standard method to use the hood. The test procedures called for multiple measurements when possible. Flow hood measurement variation due to instrument error and operator use variation was estimated to be ±10% of actual airflow and ±4% for repeatability and comparison.
Overall measurement variation due to instrument error and operator use variation for the 95% confidence level was estimated to be ±11% of actual airflow and ±5% for repeatability and comparison.
3.6 ANALYSIS PROCEDURES Test specifics and measurement data were recorded in laboratory records and on computer disks. Measurements of supply pressure at the VAV unit was averaged and compared to the reference pressure to ensure the test was conducted at the proper supply pressure. The acceptable variation was ±.020 in. w.c. Supply air, room and return air temperature records were checked to ensure the test was isothermal. The acceptable difference between supply, room and return air temperatures was ± 2 F. The acceptable variation from steady state temperature was ± 2 F. Data from the 17 TV sensors was averaged over two

3 METHODOLGY
NCEMBT-070315
30
minutes of stationary measurements for each test scan grid point. Before and after each test diffuser flow measurements, when available, were averaged.
Sound data was recorded as 10 second averages of all the third octave bands from 10 Hz to 10000 Hz and the A-Weighted sound level. That data was supplemented with calculated octave band levels. Modified Noise Criteria (NC), using the octave bands from 63 Hz to 4000 Hz, was calculated for sound measurements made during the 3 and 4 sided scans around the diffusers. Because the upper microphone was at times exposed to airflow velocities greater than .1 m/s, which can result in microphone generated flow noise, analysis was performed using the lower microphone data.
3.6.1 Parameter Effects On Performance Statistical analysis of parameter effects on performance were conducted for energy efficiency and sound generation. The airflow rate was used to determine energy efficiency, while NC sound level was used to determine sound generation.
The measured airflow rate was transformed to the airflow ratio r, equal to actual airflow for that condition divided by airflow rate for the nominal condition.
Noise level was normalized to the expected level at the nominal airflow rate. Airflow rate had a strong effect on sound generation and different test conditions resulted in different diffuser airflow rates. To evaluate the effects of the test condition on sound generation, it was necessary to adjust sound levels for each test condition to the expected sound level for that condition at the nominal airflow rate. The adjustment was based on the results of tests run at the nominal condition where the sound level was measured at total supply airflow rates of 600, 800 and 1000 cfm respectively. The resulting formula is:
NCcorrected = NC −10log10(r8) (5)
where r is the airflow ratio.
Equation 5 was used to adjust the square diffuser noise levels. The slot diffuser tests had too high a variation in airflow rate to allow for accurate noise level adjustment.
Airflow ratio and adjusted NC noise level were entered as the performance results in the Taguchi test array. The mean and signal to noise ratio for each parameter level were calculated in Minitab, a commercial statistical analysis program.
3.6.2 Airflow Distribution Performance Airflow distribution was determined from the scans around the diffuser and the raster scans between the two room diffusers. For square diffusers, the four-side around the diffuser scan gave a direct measure of the flow out of the four sides of the diffuser and clearly showed any asymmetry in airflow. The raster scan showed how the airflow of the two room diffusers progressed and how the airflow from the two diffusers interacted. The effects of parameter variations manifested themselves through changes in the airflow and interaction when compared to the nominal case.

4 RESULTS
NCEMBT-070315
31
4 RESULTS The complete test results of all the individual tests are presented in table form and graphically in Appendices A, B and C respectively. Significant findings in the test results are presented in this section.
4.1 ENERGY EFFICIENCY FOR SQUARE AND SLOT DIFFUSERS Both square and slot diffusers were evaluated for energy efficiency. Since air supply pressure at the VAV unit was held constant for all tests with each type of diffuser (square or slot), energy efficiency was inferred from airflow changes with the different test parameter conditions.
Tables 10 through 13 in Appendix A give a summary of the test conditions and the performance measure, in this case diffuser airflow. Diffuser #2 was the test diffuser in all tests except for square diffusers condition 2 where diffuser #3 was used as the test diffuser. Therefore, for the performance measure the results in the column named Diffuser #2 ratio to std. is the performance measure in all tests except for square diffusers condition 2 and the results in the column named Diffuser #3 ratio to std. is the performance measure for condition 2. Those performance data were the input performance for the Taguchi design of experiment. The results of the energy analysis of the experiment are shown in Figures 15 through 18. The main effects plots from square and slot diffusers are repeated here in Figure 12. The signal to noise values for those same tests followed the same trends as the means indicating that variation of performance was relatively consistent at the different performance levels.
Figure 12. Main effects plots for square (left) and slot (right) diffusers for the five test parameters and where the performance
measure is airflow rate ratio

4 RESULTS
NCEMBT-070315
32
4.2 NOISE GENERATION FOR SQUARE DIFFUSERS Noise generation was the second performance measure for the ductwork and diffuser installations. The test results are shown in Appendix B and repeated here in Figure 13. Under normal circumstances, a 3 dB change in sound level is noticeable and a 10 dB change sound twice or half as loud.
The performance measure the results in the column named mic 2 sound level, adjusted is the performance measure in all tests. Those performance data were the input performance for the Taguchi design of experiment. Due to instrument accuracy and other experimental error, a sound level difference of at least 2 dB was required to have confidence in the parameter level causing the change in the sound level. The main effects plots from square diffusers are repeated here in Figure 13. The signal to noise values for those same tests followed the same trends as the ng that variation of performance was relatively consistent at the different performance levels. Duct length, elbow to diffuser distance and a hard bend in the duct appeared to have the greatest effect on sound generated by the ductwork.
means indicati
Figure 13. Noise criteria means for square diffusers when noise criteria levels have been adjusted to that estimated for a
standard airflow rate

4 RESULTS
NCEMBT-070315
33
M INSTALLATION VARIATIONS FOR SQUARE
ected, if the overall
rs.
4.3 AIR DISTRIBUTION VARIATIONS RESULTING FROAND SLOT DIFFUSERS The test results are shown in Appendix C, Figure 22 thru Figure 75. The variations in air distribution attributable to the different configurations fall in two general categories. First, as expairflow rate out of the test diffuser increased or deceased due to the test configuration, a corresponding change in the air distribution can be seen. These air distribution changes consisted of a few percent change in flow velocity along the ceiling and a shift in the airflow interaction zone between the two diffusers. The second and more striking variation in air distribution appearing in the square diffuser results was a change in the symmetry of the airflow out of the diffuser due exclusively to the 5-inch level of the elbow to diffuser parameter. The results from condition 1 (5-inch elbow to diffuser) and condition 4 (40-inch elbow to diffuser) are repeated here in Figure 14 for square diffusers. For condition 1, the flex duct approached the diffuser from right (East). Similar results were not seen for slot diffuse
0
1
2
3
4
5
60
1427
37
45
53
63
76
90
104
117
127
135
143
153166
180194
207
217
225
233
243
256
270
284
297
307
315
323
333346
angle [deg]
velocity [m/s]
100% design airflow condition 1
0
0.5
1
1.5
2
2.5
3
3.5
40
1427
37
45
53
63
76
90
104
117
127
135
143
153166
180194
207
217
225
233
243
256
270
284
297
307
315
323
333346
angle [deg]
velocity [m/s]
100% design airflowcondition 4
Figure 14. Airflow distribution from the test diffuser for condition 1 and 4 for square diffusers at 100% design airflow

5 DISCUSSION
NCEMBT-070315
34
Examining the results for square diffusers first we see that the change of parameter level from low to high in four of the five parameters caused greater than a five percent change in airflow rate ratio. These parameter level changes resulted in changes in airflow consistent with commonly held beliefs and previously measured data.
Duct length (parameter 1) showed a monotonic decrease in airflow with increasing length. The shortest and longest lengths used could be expected to represent the shortest and longest lengths found in the field. This shows that the effect of those differences in duct length is a 10 percent variation in airflow at constant pressure, or a 20 percent decrease in efficiency. A hard turn in the duct (parameter 4) had a similar decrease in airflow and hence energy efficiency. These tests show that a hard turn in the duct adds the approximate equivalent resistance as 30 feet of duct. In contrast, the distance from the diffuser of the 90 degree turn from a horizontal run to a vertical run (parameter 3) showed a three percent or slightly below significant effect on airflow rate. The slightly higher airflow for the turn close to the diffuser is plausible because with the turn so close to the diffuser, the airflow never totally completes the turn as can be se
Moving the branch very close (less than one diamete unit was expected to result in unsteady ow at the branch. Unsteady flow could result in either an increase or decrease in flow through the
branch. Here, it resulted in a decrease slightly above the significance threshold to about seven percent, or a 14 percent decrease in energy efficiency.
The closed center diffuser decreased airflow by about eight percent, or a 16 percent decrease in energy efficiency. The decrease in total exit cross section area likely accounts for the difference.
An actual installation will be at some state of all of the parameters examined in this analysis. With the results of the experiment, it is possible to predict performance for any configuration, including those configurations that were not tested. Two predictions were made, one with the best energy efficiency parameter levels, and one with the poorest energy efficiency levels. The parameter levels and performance results are show in Table 8 where Case A is the best and Case B is the poorest in energy efficiency. The results show that Case A has a 32 percent airflow advantage over the nominal case while Case B has a 34 percent disadvantage compared to the nominal case. Compared to each other, the Case A is 135 percent more energy efficient than Case B.
5 DISCUSSION 5.1 E E NERGY FFICIENCYThe data in Table 10 thru Table 13in Appendix A show significant changes in the airflow of the test diffuser for the six different test conditions. Those differences are reflected in the mean of the results for each level of each parameter shown in Figure 12. The difference in airflow rate ratio between the levels of each parameter shows the strength of that parameter in influencing the performance and the direction of change in performance with the corresponding change in the parameter level. The possibility that experimental error could cause up to a five percent change in the performance measure means that parameter level variation resulting in a performance changes lower than five percent do not indicate with high confidence a significant effect caused by changes in the levels of that parameter.
5.1.1 Square Diffusers
en from the diffuser air distribution plots covered later.
r) to the VAV fl

5 DISCUSSION
NCEMBT-070315
35
tions with parameter levels set at levels for high and low performance for square diffusers
Table 8. Airflow Rate Ratio predic
Case Duct
Length Distance to
Branch Elbow to Diffuser
Bend in Duct
Type of Diffuser
Predicted Airflow Rate Ratio
Predicted Energy Efficiency Ratio
A 6 54 5 30 1 1.15 1.32 B 36 6 40 5 2 0.75 0.56
5.1.2 Slot Diffusers Examining the results for slot diffusers we see that the change of parameter level from low to high in two of the five parameters caused greater than a five percent change in airflow rate ratio. Similar to the square
evel changes resulted in changes in airflow consistent with commonly
ge minimum used to have confidence that the results are due to other than
al case. Compared to each other, the Case C
diffuser results, these parameter lheld beliefs and previously measured data. In fact, it appears that the effects of duct length and type of diffuser/duct were so strong that the effects of the other parameters could not be determined at an acceptable confidence level. Distance to Branch and Elbow to Diffuser had less than a three percent effect on the airflow rate ratio, while Bend in Duct was slightly above three percent. All those values are below the five percent chanexperimental error. The two diffusers used required different diameter ducts. Diffuser 1 had an oval duct adaptor that accepted a 10-inch duct while diffuser 2 had a round adaptor that accepted an 8-inch duct. Except for the adaptor, the two slot diffusers are nearly identical. The results for diffuser levels actually reflect the effect on airflow resistance of the different duct diameters.
Just as with the square diffusers, two predictions were made, one with the best energy efficiency parameter levels, and one with the poorest energy efficiency levels. The three parameters that had effects below the significance level were set to the same levels for both cases. The parameter levels and performance results are show in Table 9 where Case C is the best and Case D is the poorest in energy efficiency. The results show that Case C has a 7 percent airflow advantage over the nominal case while Case D has a 68 percent disadvantage compared to the nominis 234 percent more energy efficient than Case D.
Table 9. Airflow Rate Ratio predictions with parameter levels set at levels for high and low performance for slot diffusers
Case Duct Length Distance to
Branch Elbow to Diffuser
Bend in Duct
Type of Diffuser
Predicted Airflow RateRatio
Predicted Energy Efficiency Ratio
C 9 54 40 30 1 1.036 1.07 D 36 54 40 30 2 0.57 0.32

5 DISCUSSION
NCEMBT-070315
36
All sound lev a ion ed he s iff . D a nonlinear aff noise ted -foot h m genera oise in it ma ave been to short to ipate no genera the VAV unit, at the branch, or in a hard bend. Th nger duct ths were g enou most of any noise generated in the VAV unit
r at the branch but may have caused noise to be generated in the duct itself. The results show that for is installation, there appears to be an optimum length of flex duct for low noise.
The short distance to the branch appears to be responsible for a small noise increase. This could be w is non-uniform at the branch. Non-uniform airflow is characterized by higher
e the duct area change is unlikely
.3 AIR DISTRIBUTION bow to
diffuser parameter, cause es in the isotherm ion. Changes in the pattern m he ist are ed parael o the dif e pe ge ce in airfl en thelowest configuration for squa iffusers near for slot diffusers the difference wnear 60 percent. The movement of the interaction zone between the two diffusers is such that
creased effective throw of the diffuser with higher airflow helps to maintain even room air distribution. With the added airflow variations in a normal room with 55 F supply air and 75 F air temperature in the occupied zone, natural mixing would also help to compensate for the uneven diffuser output. If a single room had diffusers at the two extremes uneven airflow distribution would be a likely consequence. Otherwise, in a room with an installation reflecting variation in diffuser output found in the test cases, the detectable differences would likely be in the cooling capacity of the air system.
The differences in airflow resulting from the two levels of the elbow to diffuser parameter flow did significantly change the isothermal airflow distribution. The airflow shown in the left plot of Figure 14 shows that the airflow still had considerable horizontal momentum when it exited the diffuser. It is likely
5.2 SOUND LEVELS el dat
ect on interpretat
genera is deriv. The 6
from t lengt
quare day have
user test resultsted little n
uct length had the duct but
y h o diss se ted ine lo leng lon gh to dissipate all or
oth
anticipated if the airflothan average velocities in part of the duct and lower velocities in other parts. The gradients between the areas with different velocities may also trigger turbulence in the flow. To a rough approximation, flow noise increases with the second to eight power of velocity. Turbulence generated in the flow is one of the major reasons for noise increases. Thus, even though the average velocity is unchanged, the areas with increased velocity generate significantly more noise such that the average noise level is increased.
Forgoing a vertical section of duct before connecting to the diffuser as tested in the 5-inch elbow to diffuser level resulted in a 6 dB noise increase. The increased noise is likely due to the non-uniform flow in the diffuser, air striking the diffuser louvers at unexpected angles, and increased airflow velocity on three sides of the diffuser.
A hard bend in the duct resulted in a noise level increase of nearly 5 dB. This type of bend causes increased airflow resistance and increased airflow velocities in the resulting vicinity of decreased duct cross-section. The flow in that area is also likely to be non-uniform sincto be smooth. Because the hard bend was consistently about five feet from the diffuser, the noise effect of the hard bend would be the same for all duct lengths.
The closed center diffuser caused a slight increase in noise level probably due to the resulting higher exit airflow velocity compared to the open center diffuser.
5The differences in airflow resulting from the different test levels of all parameters, except the el
only overall magnitude changmetry of t
type of
al airflow distributprimarily to the
ow betwe and sy
diffuser andairflow dfuser. Th
ributionrcenta
attributdifferen
meters of the highest and bow t
re d was 40 percent while as the
in
5 DISCUSSION
NCEMBT-070315
37
at this asymmetry in airflow distribution is likely to persist in some form in a normal room with 55 F supply air and 75 F air temperature in the occupied zone. Absent other installation problems, in a room
lecting the asymmetrical flow from the short elbow to diffuser condition, the ould likely be asymmetric room cooling and ventilation.
th
with an installation refdetectable differences w

6 CONCLUSIONS
NCEMBT-070315
38
The conclusions present in this report may be used by planners and installers of ductwork to maximize the performance of the installation within the existing constraints of each particular installation. The performance considered includes energy efficiency, noise generation and air distribution.
The comparisons in Section 4 show the magnitude of energy consumption that hangs in the balance when installing duct work. Other considerations and physical constraints may prevent using the most energy or noise efficient type installation. In fact, the sections on noise and air distribution show that normally an installation performs better for noise and air distribution if the elbow to diffuser distance of 40 inches (or greater) is used. For square diffusers, that change from the most energy efficient results in an airflow rate ratio of 1.12 vs. 1.15, and an energy efficiency ratio of 1.25 vs. 1.32. The data presented here gives the designer the information needed to determine the contribution to the overall energy efficiency ratio of the entire air distribution system due to the ratio of the post VAV unit duct work. For example, examine a case where the desired flow rate is 800 cfm pre VAV unit, the design overall pressure of the system is 2.0 in water, the duct and the average diffuser configuration has a predicted energy efficiency ratio of 1.2. The square diffuser nominal case has a supply pressure of 0.224 ±0.012 in. w.c. at the VAV unit. Thus the pressure loss for the rest of the system is about 1.78 in. w.c.. For the chosen configuration, the airflow can be maintained with .224/1.2 = 0.19 in. w.c. or a .034 reduction. The total required pressure would now by 1.97 in. w.c. or a 1.5 percent energy reduction. A more dramatic, and unwanted, change in energy use would result if the average installed post VAV unit configuration had a 0.6 energy efficiency ratio. The overall energy usage to maintain flow would then be a 7.5 percent increase. An unfortunate case results if one VAV unit has a particularly low energy efficiency ratio. To maintain airflow at that unit the pressure of the entire system must be increased resulting in balancing losses at the other more efficient installations and an overall efficiency reflecting the worst VAV unit installation.
Overall noise levels can be influenced by many factors such as other noise producing devices in or out of the room, and the sound reflective properties of the room walls and furniture. However, the contribution due to the air distribution system can be estimated using the diffuser manufacturer supplied noise data and the incremental noise level changes given in this report for installation variations. Manufacturer data is normally for an ideal installation where there is no noise prior to the duct, and the duct approaches the diffuser in a long vertical section. This installation presents the diffuser with uniform horizontally symmetric flow. The noise levels from those installations are comparable to noise from the case with the 15-foot duct, the 40-inch elbow to diffuser, the 54-inch VAV to branch length, and the 30-inch radius bend in duct parameter levels. That is very close to the nominal case used here. Therefore, the noise increase or decrease from any variation from that case can be estimated from the data presented in this report.
Finally, the resulting air distribution symmetry from a given installation can be estimated from the data presented here. Although it is unlikely an installation would be planned with asymmetric diffuser discharge, plenum height and other limitations can result in directing flow to a diffuser without sufficient vertical length to eliminate airflow horizontal momentum at the diffuser inlet. Tests in this report only cover the two extremes of installation. Thus, an installer will have the limits of the effect of an installation with a minimum vertical section and can then estimate what fraction of that effect is expected from the actual installation.
6 CONCLUSIONS

7 REFERENCES
NCEMBT-070315
39
fiberglass duct
7 REFERENCES ASHRAE. 2001. Handbook of Fundamentals: American Society of Heating Refrigerating and Air-
Conditioning Engineers, Inc. Foarde, K.K., D.W. VanOsdell, and J.C.S. Chang. 1996. Evaluation of fungal growth on
materials for various moisture, soil use and temperature conditions. Indoor Air 6 (2):83-92. Hydeman, M., S. Taylor, J. Stein., Taylor Engineering, E. Kolderup, T. Hong, and Eley Associates. 2003.
Advanced Variable Air Volume System Design Guide: Design Guidelines, edited by C. E. Commission.
Int-Hout, D. 2001. Those Who Forget the Past. ASHRAE Journal Forum. ———. 2003. VAV Box Airflow Measurement. In Krueger White Paper: www.krueger-hvac.com. ———. 2004. Best Practices for Selecting Diffusers. ASHRAE Journal Int-Hout, D. and R. Ratz. 1996. Cold air distribution design manual: Electric Power Research Institute. Kim, T., J.D. Spitler, and R.D. Delahoussaye. 2002. Optimum duct design for variable air volume
systems, Part 1: Problem domain analysis of VAV duct systems. ASHRAE Transactions 108 (1):96-104.
———. 2002b. Optimum duct design for variable air volume systems, Part 2: Optimization of VAV duct systems. ASHRAE Transactions 108 (1):105-127.
Linder, R., and C.B. Dorgan. 1997. VAV systems work despite some design and application problems. ASHRAE Transactions 103 (2):807-813.
Modera, M.P., O. Brzozowski, F.R. Carrie, D.J. Dickerhoff, W.W. Delp, W.J. Fisk, R. Levinson, and D. Wang. 2001. Sealing ducts in large commercial buildings with aerosolized sealant particles. Energy and Buildings 34:705-714.
Simon, C. 2002. One person’s opinion: A VAV box dilemma. www.esmagazine.com, Posted November 30, 2002, 41-43.
SMACNA. 1990. HVAC Systems – Duct Design: SMACNA. Taylor, S.T., and J. Stein. 2004. Sizing VAV Boxes. ASHRAE Journal. Xu, T.T., F. Carrie, D. Dickerhoff, W. Fisk, J. McWilliams, D. Wang, and M. Modera. 2002.
Performance of thermal distribution systems in large commercial buildings. Energy and Buildings 34 (3):215-226.

APPENDIX A - ENERGY EFFICIENCY TEST RESULTS
NCEMBT-070315
40
APPENDIX A - ENERGY EFFICIENCY TEST RESULTS

APPENDIX A - ENERGY EFFICIENCY TEST RESULTS
NCEMBT-070315
41
1. TEST CONDITIONS AND RESULTS he following tables list the details of the tests conducted for this project and the energy performance easure, diffuser #2 (or #3) airflow ratio to standard.
ATmTable 10. Test conditions and results for square diffuser tests
Flow cond.
VAV damper
Fan Speed
Supply static pressure
Pre test Supply air,
Pre test Diffuser #2
Pre test Diffuser #3
Pre test Test cond. Date Scan type % % Hz in w.c. cfm Cfm cfm
0 5/10/06 Raster 100 100 0.22 810 0 5/11/06 Square 100 100 26.9 0.220 810 362 385 0 5/11/06 Square 50 40 0.225 398 170 180 0 5/12/06 Raster 50 40 14.3 0.220 403 176 185 6 5/12/06 Square 100 100 0.221 814 391 383 6 5/15/06 Raster 100 100 26.9 0.220 816 384 373 6 5/15/06 Raster 50 40 14.3 0.220 400 178 177 6 5/15/06 Square 50 40 14.3 0.236 390 180 183 4 5/16/06 Square 100 100 26 0.220 808 330 380 4 5/16/06 Raster 100 100 26 0.220 795 334 380 4 5/16/06 Raster 50 40 14.7 0.220 411 167 198 4 5/16/06 Square 50 40 14.7 0.220 411 169 201 3 5/17/06 Square 100 100 28.3 0.227 858 367 412 3 5/17/06 Raster 100 100 28.3 0.227 855 356 395 3 5/17/06 Raster 50 40 14.5 0.223 408 154 192 3 5/17/06 Square 50 40 14.5 0.224 399 156 195 5 5/18/06 Square 100 100 25.2 0.225 795 290 400 5 5/18/06 Raster 100 100 25.2 0.225 766 286 389 5 5/18/06 Raster 50 40 14.3 0.224 397 131 209 5 5/18/06 Square 50 40 14.3 0.224 400 127 206 1 5/19/06 Square 100 100 28.2 0.220 843 390 408 1 5/19/06 Raster 100 100 28.2 0.227 838 388 407 1 5/19/06 Raster 50 40 14.8 0.223 413 173 202 1 5/19/06 Square 50 40 14.8 0.212 412/ 173 202 7 5/22/06 Square 100 100 26.6 0.230 795 341 389 7 5/22/06 Raster 100 100 26.6 0.229 799 341 390 7 5/22/06 Raster 50 40 14.4 0.218 397 158 202 7 5/22/06 Square 50 40 14.4 0.214 397 162 204 8 5/23/06 Square 100 100 23.7 0.222 720 280 370 8 5/23/06 Raster 100 100 23.7 0.223 718 283 376 8 5/23/06 Raster 50 40 17.8 0.223 415 161 211 8 5/23/06 Square 50 40 14.8 0.220 415 160 213 2 5/24/06 Square 100 100 31 0.219 919 432 410 2 5/24/06 Raster 100 100 31 0.221 910 417 405 2 5/24/06 Raster 50 40 16 0.228 455 204 194 2 5/25/06 Square 50 40 15.8 0.224 452 200 192 0 5/26/06 none 100 100 30 0.220 890 416 396 0 5/26/06 none 100 100 28.4 0.216 840 392 388

APPENDIX A - ENERGY EFFICIENCY TEST RESULTS
NCEMBT-070315
42
er tests (continued) Table 11. Test conditions and results for square diffus
Supply static pressure, Post test
Supply air, Post test
Diffuser #2 Post test
Diffuser #3 Post test
Diffuser #2 avg.
Diffuser #3 avg.
Diffuser #2 ratio to std
Diffuser #3 ratio to stdTest
Cond. in. w.c. cfm cfm cfm cfm cfm 0 0.222 812 0 0.220 809 362 385 1.000 1.0000 0.221 398 0 0.210 402 173 183 1.000 1.0006 0.221 808 6 0.205 810 385 382 387 379 1.068 0.9856 0.225 387 180 183 6 0.230 391 178 180 179 181 1.035 0.9904 0.225 788 328 381 4 0.225 776 333 380 331 380 0.915 0.9884 0.222 410 169 201 4 0.225 410 172 203 169 201 0.978 1.1003 0.221 854 354 399 3 0.232 842 367 405 361 403 0.997 1.0463 0.225 401 156 195 3 0.225 403 158 193 156 194 0.902 1.0625 0.221 767 279 386 5 0.226 764 285 395 285 393 0.787 1.0195 0.221 395 127 206 5 0.221 340 129 209 129 208 0.743 1.1371 0.224 842 388 391 1 0.220 835 286 399 338 401 0.934 1.0421 0.225 412 172 198 1 0.219 410 171 202 172 201 0.996 1.1017 0.232 795 341 390 7 0.240 789 352 391 344 390 0.950 1.0137 0.215 402 162 7 0.212 404 163 161 203 0.932 1.1128 0.225 720 283 376 8 0.225 719 280 372 282 374 0.778 0.9708 0.224 415 160 213 8 0.266 401 154 159 212 0.918 1.1632 0.210 417 405 2 0.216 910 420 402 422 406 1.164 1.0532 0.229 454 204 195 2 0.224 447 198 186 202 192 1.165 1.0510 0 404 392 1.116 1.018

APPENDIX A - ENERGY EFFICIENCY TEST RESULTS
NCEMBT-070315
43
Table 12. Test conditions and results for slot diffuser tests
Flow cond.
VAV damper
Fan Speed
Supply static pressure,
Pre test Supply air,
P re test,Diffuser #2
Pre test Diffuser #3
Pre test Test Cond. Date
Scan type % % Hz in w.c. cfm cfm cfm
0 6/14/06 3 Side 100 100 27.8 0.357 808 376 3580 6/14/06 3 Side 100 100 27.8 0.354 808 370 3600 6/15/06 Raster 100 100 27.8 0.352 806 380 3500 6/15/06 3 Side 50 36 15.7 0.361 401 171 1710 6/15/06 3 Side 50 36 15.7 0.358 399 171 1770 6/16/06 Raster 50 36 15.7 0.365 404 177 1646 6/16/06 Raster 50 36 15.7 0.364 405 158 1566 6/19/06 3 Side 50 36 15.7 0.357 401 166 1656 6/19/06 Raster 100 100 27.8 0.357 806 350 3556 6/19/06 3 Side 100 100 27.8 0.345 804 350 3556 6/20/06 Raster 100 100 27.8 0.359 811 350 3556 6/20/06 3 Side 100 100 27.8 0.348 804 350 3554 6/21/06 Raster 50 36 15.7 0.353 406 163 1814 6/21/06 3 Side 50 36 15.7 0.343 404 166 1804 6/21/06 3 Side 100 100 24.6 0.357 776 338 3504 6/21/06 Raster 100 100 24.6 0.369 767 330 3803 6/22/06 Raster 100 100 24.5 0.366 712 236 3613 6/22/06 3 Side 100 100 24.5 0.360 715 236 3723 6/22/06 Raster 50 36 15.8 0.368 412 145 2103 6/23/06 3 Side 50 36 15.8 0.360 404 148 2025 6/23/06 3 Side 50 36 15.8 0.371 404 124 2225 6/23/06 Raster 50 36 15.8 0.367 404 129 2225 6/23/06 3 Side 100 100 23.5 0.364 683 232 3655 6/23/06 Raster 100 100 23.5 0.372 688 232 3807 6/27/06 Raster 100 100 27.5 0.350 798 346 3707 6/27/06 3 Side 100 100 27.5 0.356 795 342 3687 6/27/06 Raster 50 36 15.8 0.370 406 154 1937 6/28/06 3 Side 50 36 15.8 0.358 407 156 1851 7/6/06 3 Side 100 100 29.7 0.350 856 1 7/6/06 Raster 100 100 29.7 0.355 846 396 3961 7/6/06 3 Side 50 36 17.5 0.363 456 187 2041 7/7/06 Raster 50 36 17.5 0.370 455 184 2168 7/7/06 3 Side 100 100 23.4 0.365 669 172 3828 7/7/06 Raster 100 100 23.4 0.351 672 180 3868 7/7/06 Raster 50 36 16.8 0.360 432 119 2348 7/7/06 3 Side 50 36 16.8 0.356 426 2 7/10/06 Raster 100 100 26.6 0.364 771 282 3482 7/10/06 3 Side 100 100 26.6 0.356 765 278 3342 7/10/06 Raster 50 36 16.9 0.361 446 139 1832 7/11/06 3 Side 50 36 16.9 0.365 449 149 1902 7/11/06 3 Side 50 36 16.9 0.365 449 149 190

APPENDIX A - ENERGY EFFICIENCY TEST RESULTS
NCEMBT-070315
44
continued) Table 13. Test conditions and results for slot diffuser tests (
Supply static pressure, Post test
Supply air, Post test
Diffuser #2 Post test
Diffuser #3 Post test
Diffuser #2 avg
Difffuser #3 avg
Diffuser #2 ratio to std
Diffuser #3 ratio to stdTest
Cond. in w.c. cfm cfm cfm cfm cfm 0 0.357 805 370 360 376 357 1.000 0.9480 0.346 806 380 350 0 0.349 800 382 362 0 0.358 399 177 171 178 169 1.000 0.9480 0.363 400 177 164 0 0.360 406 194 164 6 0.361 404 166 165 165 164 0.929 0.9216 0.358 402 171 169 6 0.344 806 350 355 350 355 0.930 0.9436 0.345 808 350 355 6 0.364 810 350 355 350 355 0.930 0.9436 0.359 806 350 355 4 0.347 403 166 180 165 180 0.929 1.0124 0.355 403 166 179 4 0.358 767 330 380 331 366 0.878 0.9734 0.367 774 324 354 3 0.353 718 236 372 239 369 0.634 0.9803 0.356 716 246 370 3 0.358 412 141 208 144 208 0.807 1.1673 0.355 412 140 210 5 0.377 403 129 222 127 222 0.714 1.2465 0.365 401 126 220 5 0.373 682 232 380 227 380 0.603 1.0095 0.376 684 212 394 7 0.367 803 242 368 314 370 0.835 0.9827 0.367 802 327 372 7 0.363 408 156 185 155 187 0.869 1.0507 0.354 409 152 184 1 0 3. 56 855 396 396 398 393 1.058 1.0441 0.351 854 400 390 1 0.371 458 184 216 186 211 1.043 1.1881 0.379 459 187 209 8 0.357 674 180 386 177 382 0.470 1.0168 0.352 673 176 375 8 0.356 433 114 222 117 228 0.655 1.2828 0.354 423 113 220 2 0.361 768 278 334 278 340 0.737 0.9022 0.368 776 272 342 2 0.366 452 149 190 148 188 0.829 1.0562 0.362 448 153 188 2 0.362 448 153 188

APPENDIX A - ENERGY EFFICIENCY TEST RESULTS
NCEMBT-070315
45
A2. PARAM S T lowing show results he Tagu m results for he energy efficiency performance measure, airflow rate ratio.
ETER MAIN EFFECT ANALYSIShe fol figures the of t chi design of experi ent t
Figure 15. Airf te ratio m quare diffusers.
low ra eans for s
Figure gnal to no tio for airf te ratio uare diff16. Si ise ra low ra for sq users.

APPENDIX A - ENERGY EFFICIENCY TEST RESULTS
NCEMBT-070315
46
Figure 17. Airflow rate ratio means for slot diffusers
Figure 18. Signal to noise ratio for airflow rate ratio for slot diffusers

APPENDIX B - NOISE GENERATION TEST RESULTS
NCEMBT-070315
47
APPENDIX B - NOISE GENERATION TEST RESULTS

APPENDIX B - NOISE GENERATION TEST RESULTS
NCEMBT-070315
48
1. TEST CONDITIONS AND RESULTS e level performance
Table 14. Test conditions and sound results for square diffuser tests
BThe following tables list the details of the tests conducted for this project and the noismeasure, mic 2 sound level adjusted.
Flow cond.
Diffuser #2 ratio to std
Diffuser #3 ratio to std
mic 1 sound level
mic 2 sound level
mic 1 sound level,
adjusted
mic 2 sound level,
adjustedTest Cond. Scan type % NC, dB NC, dB NC, dB NC, dB
0 Raster 100 0 Square 100 1.000 1.000 35.6 31.4 35.6 31.40 Square 50 0 Raster 50 1.000 1.000 6 Square 100 42.1 37.4 39.9 35.16 Raster 100 1.068 0.985 6 Raster 50 6 Square 50 1.035 0.990 4 Square 100 31.3 28.0 34.4 31.14 Raster 100 0.915 0.988 4 Raster 50 4 Square 50 0.978 1.100 3 Square 100 44.0 37.6 44.1 37.73 Raster 100 0.997 1.046 3 Raster 50 3 Square 50 0.902 1.062 5 Square 100 35.7 30.2 44.0 38.55 Raster 100 0.787 1.019 5 Raster 50 5 Square 50 0.743 1.137 1 Square 100 44.5 39.5 46.9 41.91 Raster 100 0.934 1.042 1 Raster 50 1 Square 50 0.996 1.101 7 Square 100 35.0 32.0 36.8 33.77 Raster 100 0.950 1.013 7 Raster 50 7 Square 50 0.932 1.112 8 Square 100 41.2 35.1 49.9 43.98 Raster 100 0.778 0.970 8 Raster 50 8 Square 50 0.918 1.163 2 Square 100 43.5 37.0 38.2 31.72 Raster 100 1.164 1.053 2 Raster 50 2 Square 50 1.165 1.051 0 none 100 0 none 100 1.116 1.018

APPENDIX B - NOISE GENERATION TEST RESULTS
NCEMBT-070315
49
Table 15. Test conditions and sound results for slot diffuser tests
Flow cond.
Diffuser #2 avg
Difffuser #3 avg
Diffuser #2 ratio to std
Diffuser #3 ratio to std
mic 1 sound level
mic 2 sound levelTest
Cond. Scan type % cfm cfm NC, dB NC, dB0 3 Side 100 376 357 1.000 0.948 0 3 Side 100 41.5 41.30 Raster 100 0 3 Side 50 178 169 1.000 0.948 0 3 Side 50 34.5 34.50 Raster 50 6 Raster 50 165 164 0.929 0.921 6 3 Side 50 35.3 356 Raster 100 350 355 0.930 0.943 6 3 Side 100 41.6 39.56 Raster 100 350 355 0.930 0.943 6 3 Side 100 42.6 414 Raster 50 165 180 0.929 1.012 4 3 Side 50 35.6 35.44 3 Side 100 331 366 0.878 0.973 4 Raster 100 40.9 39.83 Raster 100 239 369 0.634 0.980 3 3 Side 100 39.4 36.83 Raster 50 144 208 0.807 1.167 3 3 Side 50 32.8 32.45 3 Side 50 127 222 0.714 1.246 Not avail Not avail5 Raster 50 5 3 Side 100 227 380 0.603 1.009 5 Raster 100 36.3 33.57 Raster 100 314 370 0.835 0.982 7 3 Side 100 41.8 39.67 Raster 50 155 187 0.869 1.050 7 3 Side 50 34.2 31.61 3 Side 100 398 393 1.058 1.044 1 Raster 100 44.7 41.81 3 Side 50 186 211 1.043 1.188 1 Raster 50 28.9 25.18 3 Side 100 177 382 0.470 1.016 8 Raster 100 37.7 358 Raster 50 117 228 0.655 1.282 8 3 Side 50 37 34.52 Raster 100 278 340 0.737 0.902 2 3 Side 100 40.6 37.52 Raster 50 148 188 0.829 1.056 2 3 Side 50 2 3 Side 50

APPENDIX B - NOISE GENERATION TEST RESULTS
NCEMBT-070315
50
B2. PARAMETER MAIN CT YSIThe following figures show the re the hi ex results noise pe anc e, nois teria.
EFFE S ANALsul f
S Tats o guc design of periment for the level
rform e measur e cri
Figure 19. Noise ria means for square diffusers without adjustment to a standard airflow rat
crite e

APPENDIX B - NOISE GENERATION TEST RESULTS
NCEMBT-070315
51
e 20. Noise cr m s for squa fusers when noise criteria levels have been adjusted to that estimated for a ard airflow rate
Figur iteria ean re dif
stand
Figure 21. Signal to noise ratio for noise criteria for square diffusers when noise criteria levels have been adjusted to that
estimated for a standard airflow rate

APPENDIX C - AIR DISTRIBUTION VARIATION TEST RESULTS
NCEMBT-070315
52
APata on diffuser output velocity and room airflow between diffusers was obtained from the measurements ade using the scan patterns described in Section 3.5.2 Laboratory Instrument Modifications and
Capabilities. The test conditions for the tests are described in Section 3.4.2 Test Matrix Selection and Modification. All data in the following plots show airflow magnitude at specific locations. The direction of the airflow was not measured.
PENDIX C - AIR DISTRIBUTION VARIATION TEST RESULTS Dm

APPENDIX C - AIR DISTRIBUTION VARIATION TEST RESULTS
NCEMBT-070315
53
C1. AIRFLOW AROUND DIFFUSERS:SQUARE DIFFUSERS
0
0.5
1
1.5
2
2.5
3
3.5
4
4.50
1427
37
45
307
315
323
333346
angle [deg]velocity [m/s]
100% design airflowcondition 0
53
63
76
90
104
117
127
135
143
153166
180194
207
217
225
233
243
256
270
284
297
0
0.2
0.4
0.6
0.8
1
1.2
1.4
1.6
1.8
20
1427
37
45
53
63
76
90
104
117
127
135
143
153166
180194
207
217
225
233
243
256
270
284
297
307
315
323
333346
Figure 22. Test condition 0 airflow velocity from diffuser measured in a 2 by 2 foot square pattern around the diffuser.

APPENDIX C - AIR DISTRIBUTION VARIATION TEST RESULTS
NCEMBT-070315
54
0
1
2
3
4
5
27
323
3336
014
37
45
53
63
76
90
104
117
127
135
143
153166
180194
207
217
225
233
243
256
270
284
297
307
315
346
angle [deg]
velocity [m/s]
100% design airflow condition 1
0
0.5
1
1.5
2
2.50
1427
37
45
53
63
76
90
104
117
127
135
143
153166
180194
207
217
225
233
243
256
270
284
297
307
315
323
333346
angle [deg]
velocity [m/s]
50% design airflow condition 1
Figure 23. Test condition 1 airflow velocity from diffuser measured in a 2 by 2 foot square pattern around the diffuser.

APPENDIX C - AIR DISTRIBUTION VARIATION TEST RESULTS
NCEMBT-070315
55
0
0.5
1
1.5
2
2.5
3
3.50
1427
37
45
53
63
76
90
104
117
127
135
143
153166
180194
207
217
225
233
243
256
270
284
297
307
315
323
333346
angle [deg]
velocity [m/s]
100% design airflowcondition 2
0
0.2
0.4
0.6
0.8
1
1.2
1.40
1427
37
45
53
63
76
90
104
117
127
135
143
153166
180194
207
217
225
233
243
256
270
284
297
307
315
323
333346
angle [deg]
velocity [m/s]
50% design airflowcondition 2
Figure 24. Test condition 2 airflow velocity from diffuser measured in a 2 by 2 foot square pattern around the diffuser.

APPENDIX C - AIR DISTRIBUTION VARIATION TEST RESULTS
NCEMBT-070315
56
0
0.5
1
1.5
2
2.5
3
3.5
4
4.50
1427
37
45
53
63
76
90
104
117
127
135
143
153166
180194
207
217
225
233
243
256
270
284
297
307
315
323
333346
angle [deg]
velocity [m/s]
100% design airflowcondition 3
0
0.2
0.4
0.6
0.8
1
1.2
1.4
1.6
1.80
1427
37
45
53
63
76
90
104
117
127
135
143
153166
180194
207
217
225
233
243
256
270
284
297
307
315
323
333346
angle [deg]
velocity [m/s]
50% design airflowcondition 3
Figure 25. Test condition 3 airflow velocity from diffuser measured in a 2 by 2 foot square pattern around the diffuser.

APPENDIX C - AIR DISTRIBUTION VARIATION TEST RESULTS
NCEMBT-070315
57
0
0.5
1
1.5
2
2.5
3
3.5
40
1427
37
45
53
63
76
90
104
117
127
135
143
153166
180194
207
217
225
233
243
256
270
284
297
307
315
323
333346
angle [deg]
velocity [m/s]
100% design airflowcondition 4
0
0.2
0.4
0.6
0.8
1
1.2
1.4
1.6
1.8
20
1427
37
45
53
63
76
90
104
117
127
135
143
153166
180194
207
217
225
233
243
256
270
284
297
307
315
323
333346
angle [deg]
velocity [m/s]
50% design airflowcondition 4
Figure 26. Test condition 4 airflow velocity from diffuser measured in a 2 by 2 foot square pattern around the diffuser.
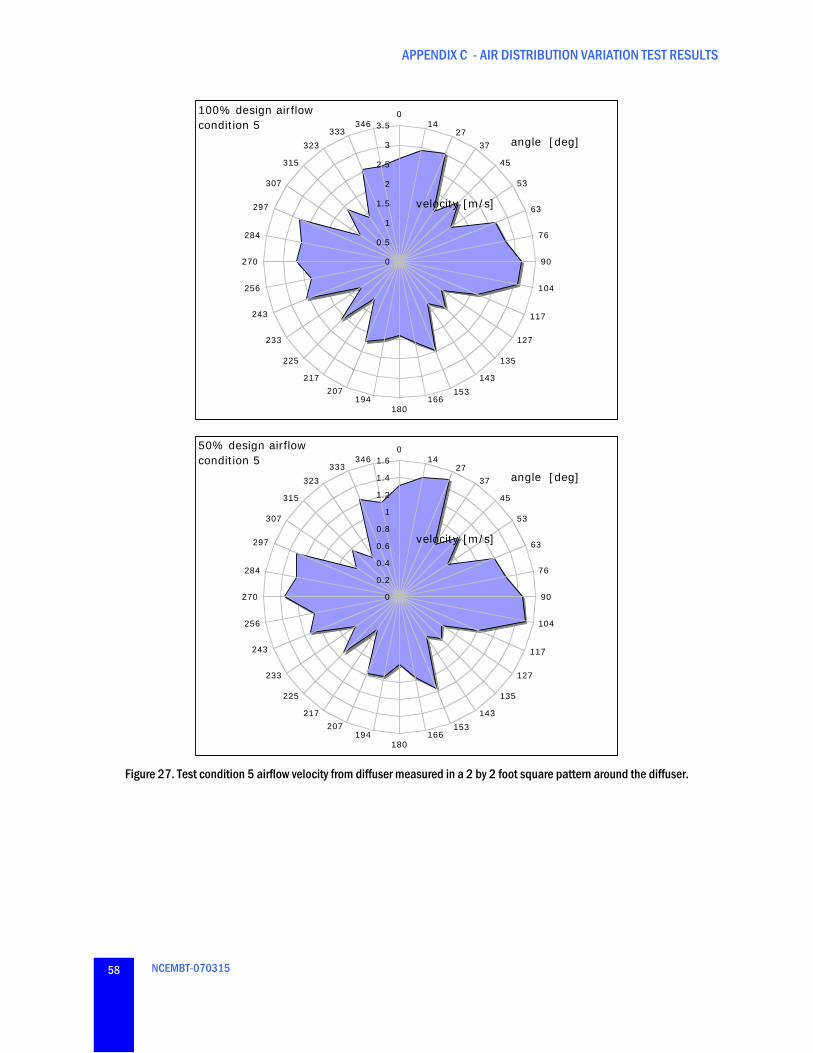
APPENDIX C - AIR DISTRIBUTION VARIATION TEST RESULTS
NCEMBT-070315
58
0
0.5
1
1.5
2
2.5
3
3.50
1427
37
45
53
63
76
90
104
117
127
135
143
153166
180194
207
217
225
233
243
256
270
284
297
307
315
323
333346
angle [deg]
velocity [m/s]
100% design airflowcondition 5
0
0.2
0.4
0.6
0.8
1
1.2
1.4
1.60
1427
37
45
53
63
76
90
104
117
127
135
143
153166
180194
207
217
225
233
243
256
270
284
297
307
315
323
333346
angle [deg]
velocity [m/s]
50% design airflowcondition 5
Figure 27. Test condition 5 airflow velocity from diffuser measured in a 2 by 2 foot square pattern around the diffuser.

APPENDIX C - AIR DISTRIBUTION VARIATION TEST RESULTS
NCEMBT-070315
59
0
1
2
3
4
5
60
1427
37
45
53
63
76
90
104
117
127
135
143
153166
180194
207
217
225
233
243
256
270
284
297
307
315
323
333346
angle [deg]
velocity [m/s]
100% design airflowcondition 6
0
0.5
1
1.5
2
2.50
1427
37
45
53
63
76
90
104
117
127
135
143
153166
180194
207
217
225
233
243
256
270
284
297
307
315
323
333346
angle [deg]
velocity [m/s]
50% design airflowcondition 6
Figure 28. Test condition 6 airflow velocity from diffuser measured in a 2 by 2 foot square pattern around the diffuser.

APPENDIX C - AIR DISTRIBUTION VARIATION TEST RESULTS
NCEMBT-070315
60
0
0.5
1
1.5
2
2.5
3
3.5
40
1427
37
45
53
63
76
90
104
117
127
135
143
153166
180194
207
217
225
233
243
256
270
284
297
307
315
323
333346
angle [deg]
velocity [m/s]
100% design airflowcondition 7
0
0.2
0.4
0.6
0.8
1
1.2
1.4
1.6
1.80
1427
37
45
53
63
76
90
104
117
127
135
143
153166
180194
207
217
225
233
243
256
270
284
297
307
315
323
333346
angle [deg]
velocity [m/s]
50% design airflowcondition 7
Figure 29. Test condition 7 airflow velocity from diffuser measured in a 2 by 2 foot square pattern around the diffuser.
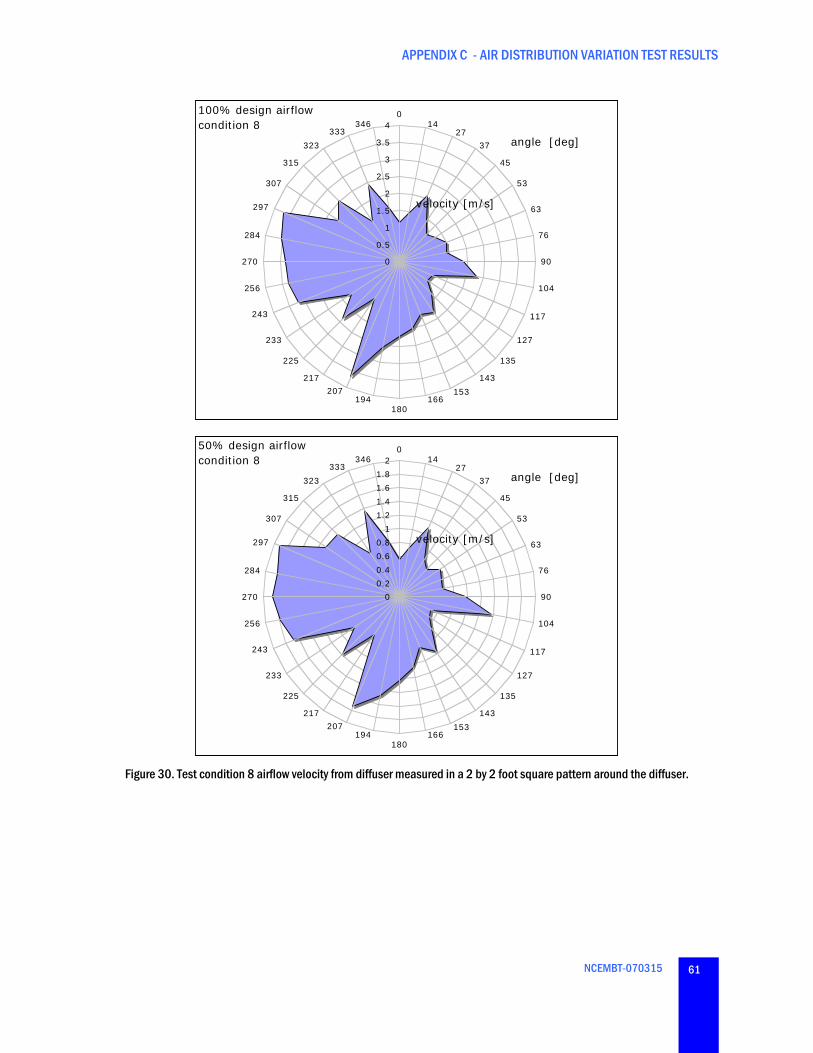
APPENDIX C - AIR DISTRIBUTION VARIATION TEST RESULTS
NCEMBT-070315
61
0
0.5
1
1.5
2
2.5
3
3.5
40
1427
37
45
53
63
76
90
104
117
127
135
143
153166
180194
207
217
225
233
243
256
270
284
297
307
315
323
333346
angle [deg]
velocity [m/s]
100% design airflowcondition 8
0
0.2
0.4
0.6
0.8
1
1.2
1.4
1.6
1.8
20
1427
37
45
53
63
76
90
104
117
127
135
143
153166
180194
207
217
225
233
243
256
270
284
297
307
315
323
333346
angle [deg]
velocity [m/s]
50% design airflowcondition 8
Figure 30. Test condition 8 airflow velocity from diffuser measured in a 2 by 2 foot square pattern around the diffuser.

APPENDIX C - AIR DISTRIBUTION VARIATION TEST RESULTS
NCEMBT-070315
62
C2. AIRFLOW AROUND DIFFUSERS:SLOT DIFFUSERS
90 96 102 108 114 120 126 132 138 144 1500
1
2
3
4
5
6
7.004.751.25
Diffuser discharge velocity [m/s]
West-East Room Coordinates
Distanace fromceiling [in]
100% design airflowcondition 0
90 96 102 108 114 120 126 132 138 144 1500
0.5
1
1.5
2
2.5
3
3.5
7.004.751.25
50% design airflowcondition 0 Distanace
fromceiling [in]
West-East Room Coordinates [in]
Diffuser discharge velocity [m/s]
Figure 31. Test condition 0 airflow velocity from diffuser measured across the face from 6 inches away from the diffuser.

APPENDIX C - AIR DISTRIBUTION VARIATION TEST RESULTS
NCEMBT-070315
63
90 96 102 108 114 120 126 132 138 144 1500
1
2
3
4
5
67.00 Distanace 4.751.25
fromceiling [in]
100% design airflow
West-East Room Coordinates [in]
Diffuser discharge velocity [m/s]
condition 1
90 96 102 108 114 120 126 132 138 144 1500
0.5
1
1.5
2
2.5
3
3.5
7.004.751.25
Distanace fromceiling [in]
50% design airflowcondition 1
West-East Room Coordinates [in]
Diffuser discharge velocity [m/s]
Figure 32. Test condition 1 airflow velocity from diffuser measured across the face from 6 inches away from the diffuser.

APPENDIX C - AIR DISTRIBUTION VARIATION TEST RESULTS
NCEMBT-070315
64
90 96 102 108 114 120 126 132 138 144 1500
1
2
3
4
5
6
7.004.751.25
100% design airflowcondition 2
Distanace fromceiling [in]
Diffuser discharge velocity [m/s]
West-East Room Coordinates [in]
90 96 102 108 114 120 126 132 138 144 1500
0.5
1
1.5
2
2.5
3
3.5
7.004.751.25
West-East Room Coordinates [in]
50% design airflowcondition 2
Distanace fromceiling [in]
Diffuser discharge velocity [m/s]
Figure 33. Test condition 2 airflow velocity from diffuser measured across the face from 6 inches away from the diffuser.

APPENDIX C - AIR DISTRIBUTION VARIATION TEST RESULTS
NCEMBT-070315
65
90 96 102 108 114 120 126 132 138 144 1500
1
2
3
4
5
6
7.004.751.25
West-East Room Coordinates [in]
Distanace fromceiling [in]
100% design airflowcondition 3
Diffuser discharge velocity [m/s]
90 96 102 108 114 120 126 132 138 144 1500
0.5
1
1.5
2
2.5
3
3.5
7.004.751.25
Diffuser discharge velocity [m/s]
West-East Room Coordinates [in]
Distanace fromceiling [in]
50% design airflowcondition 3
Figure 34. Test condition 3 airflow velocity from diffuser measured across the face from 6 inches away from the diffuser.

APPENDIX C - AIR DISTRIBUTION VARIATION TEST RESULTS
NCEMBT-070315
66
90 96 102 108 114 120 126 132 138 144 1500
1
2
3
4
5
6
7.004.751.25
100% design airflowcondition 4
West-East Room Coordinates [in]
Diffuser discharge velocity [m/s]
Distanace fromceiling [in]
90 96 102 108 114 120 126 132 138 144 1500
0.5
1
1.5
2
2.5
3
3.5
7.004.751.25
Distanace fromceiling [in]
West-East Room Coordinates [in]
50% design airflowcondition 4
Diffuser discharge velocity [m/s]
Figure 35. Test condition 4 airflow velocity from diffuser measured across the face from 6 inches away from the diffuser.

APPENDIX C - AIR DISTRIBUTION VARIATION TEST RESULTS
NCEMBT-070315
67
90 96 102 108 114 120 126 132 138 144 1500
1
2
3
4
5
67.004.751.25
Diffuser discharge velocity [m/s]
West-East Room Coordinates [in]
Distanace fromceiling [in]
100% design airflowcondition 5
90 96 102 108 114 120 126 132 138 144 1500
0.5
1
1.5
2
2.5
3
3.5
7.004.751.25
Diffuser discharge velocity [m/s]
West-East Room Coordinates [in]
Distanace fromceiling [in]
50% design airflowcondition 5
Figure 36. Test condition 5 airflow velocity from diffuser measured across the face from 6 inches away from the diffus
er.

APPENDIX C - AIR DISTRIBUTION VARIATION TEST RESULTS
NCEMBT-070315
68
90 96 102 108 114 120 126 132 138 144 1500
1
2
3
4
5
6
TV15TV16TV17
100% design airflowcondition 6
Diffuser discharge velocity [m/s]
West-East Room Coordinates [in]
Distanace fromceiling [in]
0
0.5
1
1.5
2
2.5
3
3.5
TV15TV16TV17
90 96 102 108 114 120 126 132 138 144 150
West-East Room Coordinates [in]
50% design airflowcondition 6
Distanace fromceiling [in]
Diffuser discharge velocity [m/s]
Figure 37. Test condition 6 airflow velocity from diffuser measured across the face from 6 inches away from the diffuser.

APPENDIX C - AIR DISTRIBUTION VARIATION TEST RESULTS
NCEMBT-070315
69
90 96 102 108 114 120 126 132 138 144 1500
1
2
3
4
5
67.004.751.25
Distanace fromceiling [in]
100% design airflowcondition 7
West-East Room Coordinates [in]
Diffuser discharge velocity [m/s]
90 96 102 108 114 120 126 132 138 144 1500
0.5
1
1.5
2
2.5
3
3.5
7.004.751.25
50% design airflowcondition 7
Distanace fromceiling [in]
West-East Room Coordinates [in]
Diffuser discharge velocity [m/s]
Figure 38. Test condition 7 airflow velocity from diffuser measured across the face from 6 inches away from the diffuser.
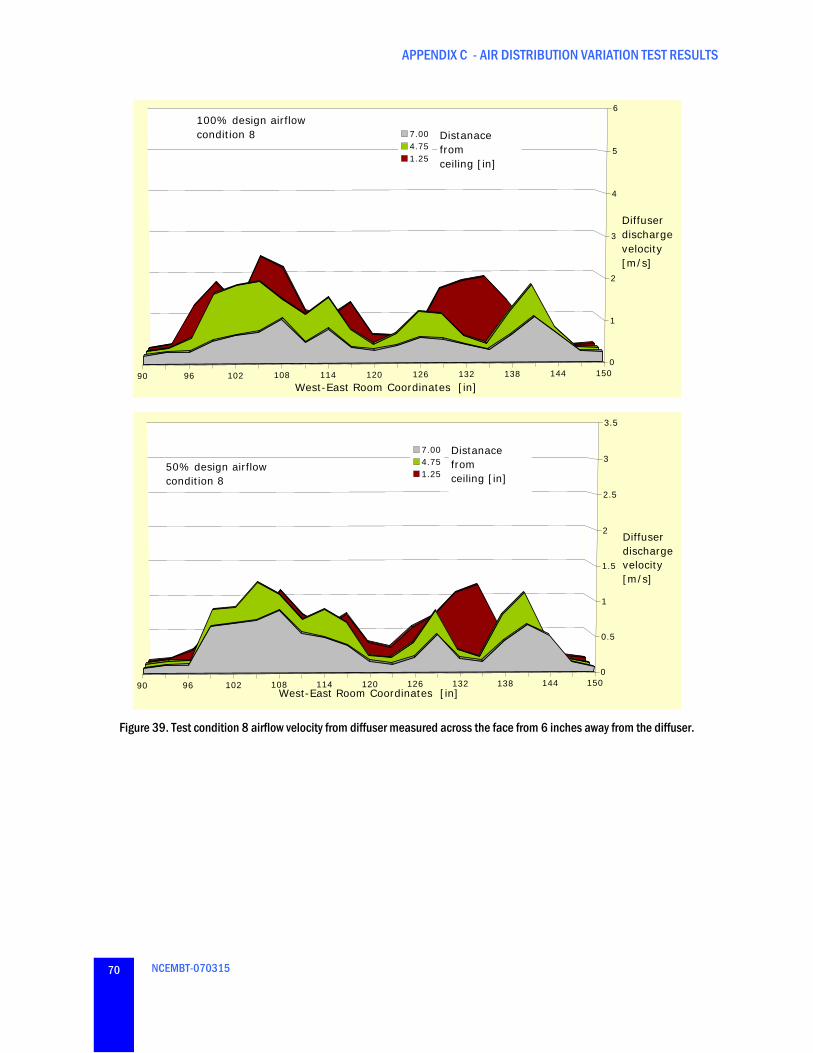
APPENDIX C - AIR DISTRIBUTION VARIATION TEST RESULTS
NCEMBT-070315
70
90 96 102 108 114 120 126 132 138 144 1500
1
2
3
4
5
6
7.004.751.25
100% design airflowcondition 8 Distanace
fromceiling [in]
West-East Room Coordinates [in]
Diffuser discharge velocity [m/s]
90 96 102 108 114 120 126 132 138 144 1500
0.5
1
1.5
2
2.5
3
3.5
7.004.751.25
Distanace fromceiling [in]
50% design airflowcondition 8
Diffuser discharge velocity [m/s]
West-East Room Coordinates [in]
Figure 39. Test condition 8 airflow velocity from diffuser measured across the face from 6 inches away from the diffuser.

APPENDIX C - AIR DISTRIBUTION VARIATION TEST RESULTS
NCEMBT-070315
71
C3. ROOM AIRFLOW BETWEEN DIFFUSERS: SQUARE DIFFUSERS
Nor
th-S
outh
dist
a nce
[in]
Velocity m/s
3.253.12.952.82.652.52.352.22.051.91.751.61.451.31.1510.850.70.550.40.25
el. = 106.5 in. el. = 104 in.
East-West dist. [in] East-West dist. [in]
110 130120
140
160
180
200
220
240
110 130120
140
160
180
200
220
240
North-South distance [in]
x=120 in.
x=144 in.
120140160180200220240
70
80
90
100
120140160180200220240
70
90
100
80
120140160180200220240
70
80
90
100
x=96 in.
x=144 in.
Figure 40. Airflow distribution between diffusers for test condition 0, Square diffusers, at 100% design airflow.
x=120 in.

APPENDIX C - AIR DISTRIBUTION VARIATION TEST RESULTS
NCEMBT-070315
72
Nor
th-S
outh
dist
a nce
[in]
el. = 106.5 in. el. = 104 in.
East-West dist. [in] East-West dist. [in]
Velocity m/s
21.91251.8251.73751.651.56251.4751.38751.31.21251.1251.03750.950.86250.7750.68750.60.51250.4250.33750.25
110 130120
140
160
180
200
220
240
110 130120
140
160
180
200
220
240
North-South distance [in]
Velocity m/s
10.96250.9250.88750.850.81250.7750.73750.70.66250.6250.58750.550.51250.4750.43750.40.36250.3250.28750.25
120140160180200220240
80
100
120140160180200220240
80
100
120140160180200220240
80
100
x=96 in.
x=120 in.
x=144 in.
Figure 41. Airflow distribution between diffusers for test condition 0, Square diffusers, at 50% design airflow.
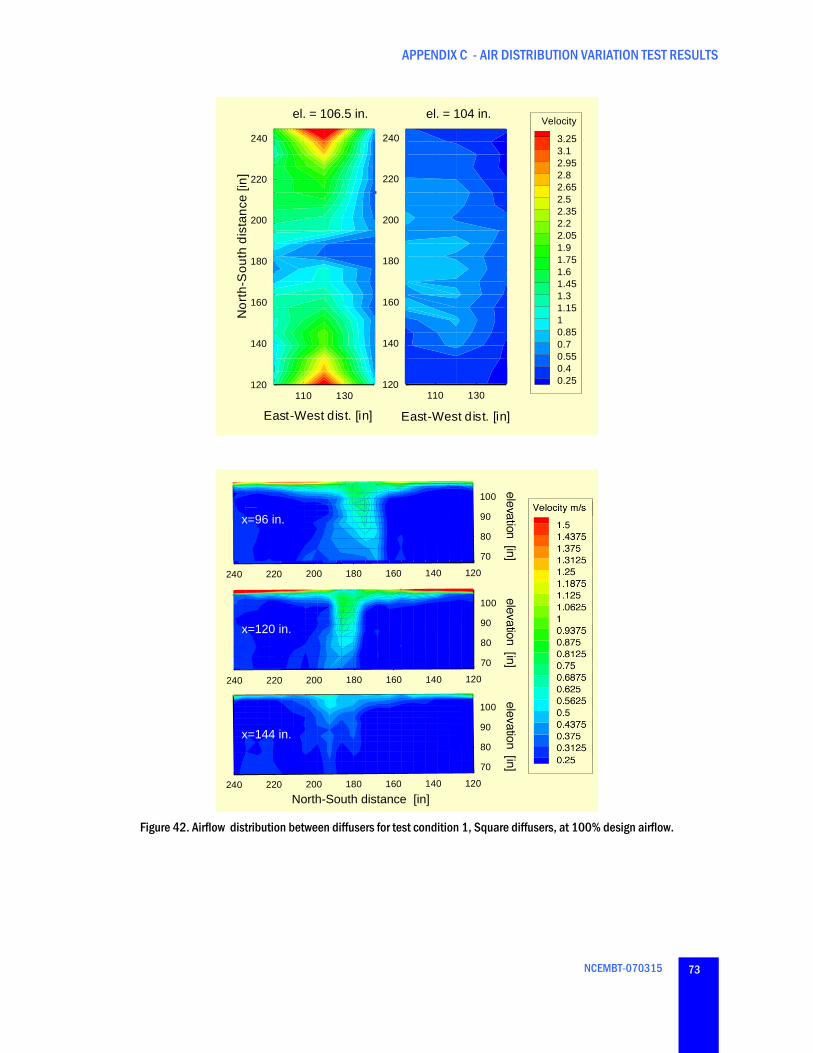
APPENDIX C - AIR DISTRIBUTION VARIATION TEST RESULTS
NCEMBT-070315
73
Nor
th-S
outh
dist
a nce
[in]
East-West dist. [in]
110 130120
140
160
180
200
220
240
Velocity
3.253.12.952.82.652.52.352.22.051.91.751.61.451.31.1510.850.70.550.40.25
East-West dist. [in]110 130
120
140
160
180
200
220
240
el. = 106.5 in. el. = 104 in.
120140160180200220240
70
80
90
100
120140160180200220240
70
80
90
100
120140160180200220240
70
80
90
100
North-South distance [in]
x=96 in.
x=120 in.
x=144 in.
Figure 42. Airflow distribution between diffusers for test condition 1, Square diffusers, at 100% design airflow.

APPENDIX C - AIR DISTRIBUTION VARIATION TEST RESULTS
NCEMBT-070315
74
Nor
th-S
outh
dist
a nce
[in]
el. = 106.5 in. el. = 104 in.
East-West dist. [in] East-West dist. [in]
Velocity m/s
21.91251.8251.73751.651.56251.4751.38751.31.21251.1251.03750.950.86250.7750.68750.60.51250.4250.33750.25
110 130120
140
160
180
200
220
240
110 130120
140
160
180
200
220
240
120140160180200220240
70
80
90
100
120140160180200220240
70
80
90
100
120140160180200220240
70
80
90
100
North-South distance [in]
x=96 in.
x=120 in.
x=144 in.
Figure 43. Airflow distribution between diffusers for test condition 1, Square diffusers, at 50% esign airflow.
d

APPENDIX C - AIR DISTRIBUTION VARIATION TEST RESULTS
NCEMBT-070315
75
Nor
th-S
outh
dist
a nce
[in]
Velocity m/s
3.253.12.952.82.652.52.352.22.051.91.751.61.451.31.1510.850.70.550.40.25
el. = 106.5 in. el. = 104 in.
110 130120
140
160
180
200
220
240
110 130120
140
160
180
200
220
240
Velocity m/s
1.51.43751.3751.31251.251.18751.1251.062510.93750.8750.81250.750.68750.6250.56250.50.43750.3750.31250.25
120140160180200220240
70
80
90
100
x=96 in.
120140160180200220240
70
80
90
100
120140160180200220240
70
80
90
100
x=120 in.
x=144 in.
Figure 44. Airflow distribution between diffusers for test condition 2, Square diffusers, at 100% design airflow.

APPENDIX C - AIR DISTRIBUTION VARIATION TEST RESULTS
NCEMBT-070315
76
Nor
th-S
outh
dist
a nce
[in]
el. = 106.5 in. el. = 104 in.
East-West dist. [in] East-West dist. [in]
Velocity m/s
21.91251.8251.73751.651.56251.4751.38751.31.21251.1251.03750.950.86250.7750.68750.60.51250.4250.33750.25
110 130120
140
160
180
200
220
240
110 130120
140
160
180
200
220
240
North-South distance [in]
Velocity m/s
10.96250.9250.88750.850.81250.7750.73750.70.66250.6250.58750.550.51250.4750.43750.40.36250.3250.28750.25
120140160180200220240
70
80
90
100
120140160180200220240
70
80
90
100
120140160180200220240
70
80
90
100
x=96 in.
x=120 in.
x=144 in.
Figure 45. Airflow distribution between diffusers for test condition 2, Square diffusers, at 50% design airflow.

APPENDIX C - AIR DISTRIBUTION VARIATION TEST RESULTS
NCEMBT-070315
77
Nor
th-S
outh
dist
a nce
[in]
Velocity m/s
3.253.12.952.82.652.52.352.22.051.91.751.61.451.31.1510.850.70.550.40.25
el. = 106.5 in. el. = 104 in.
110 130120
140
160
180
200
220
240
East-West dist. [in] East-West dist. [in]
110 130120
140
160
180
200
220
240
North-South distance [in]
120140160180200220240
70
80
90
100
120140160180200220240
70
80
90
100
120140160180200220240
70
80
90
100
x=96 in.
x=120 in.
x=144 in.
Figure 46. Airflow distribution between diffusers for test condition 3, Square diffusers, at 100% design airflow.

APPENDIX C - AIR DISTRIBUTION VARIATION TEST RESULTS
NCEMBT-070315
78
Nor
th-S
outh
dist
a nce
[in]
el. = 106.5 in. el. = 104 in.
East-West dist. [in] East-West dist. [in]
Velocity m/s
21.91251.8251.73751.651.56251.4751.38751.31.21251.1251.03750.950.86250.7750.68750.60.51250.4250.33750.25
110 130120
140
160
180
200
220
240
110 130120
140
160
180
200
220
240
North-South distance [in]
Velocity m/s
10.96250.9250.88750.850.81250.7750.73750.70.66250.6250.58750.550.51250.4750.43750.40.36250.3250.28750.25
120140160180200220240
70
80
90
100
120140160180200220240
70
80
90
100
120140160180200220240
70
80
90
100
x=96 in.
x=120 in.
x=144 in.
Figure 47. Airflow distribution between diffusers for test condition 3, Square diffusers, at 50% design airflow.

APPENDIX C - AIR DISTRIBUTION VARIATION TEST RESULTS
NCEMBT-070315
79
Nor
th-S
outh
dist
a nce
[in]
Velocity m/s
3.253.12.952.82.652.52.352.22.051.91.751.61.451.31.1510.850.70.550.40.25
el. = 106.5 in. el. = 104 in.
East-West dist. [in] East-West dist. [in]
110 130120
140
160
180
200
220
240
110 130120
140
160
180
200
220
240
North-South distance [in]120140160180200220240
70
80
90
100
120140160180200220240
70
80
90
100
120140160180200220240
70
80
90
100
x=96 in.
x=120 in.
x=144 in.
Figure 48. Airflow distribution between diffusers for test condition 4, Square diffusers, at 100% design airflow.

APPENDIX C - AIR DISTRIBUTION VARIATION TEST RESULTS
NCEMBT-070315
80
Nor
th-S
outh
dist
a nce
[in]
el. = 106.5 in. el. = 104 in.
East-West dist. [in] East-West dist. [in]
Velocity m/s
21.91251.8251.73751.651.56251.4751.38751.31.21251.1251.03750.950.86250.7750.68750.60.51250.4250.33750.25
110 130120
140
160
180
200
220
240
110 130120
140
160
180
200
220
240
North-South distance [in]120140160180200220240
70
80
90
100
120140160180200220240
70
80
90
100
120140160180200220240
70
80
90
100
x=96 in.
x=120 in.
x=144 in.
Figure 49. Airflow distribution between diffusers for test condition 4, Square diffusers, at 50% design airflow.

APPENDIX C - AIR DISTRIBUTION VARIATION TEST RESULTS
NCEMBT-070315
81
Nor
th-S
outh
dist
a nce
[in]
Velocity m/s
3.253.12.952.82.652.52.352.22.051.91.751.61.451.31.1510.850.70.550.40.25
el. = 106.5 in. el. = 104 in.
East-West dist. [in] East-West dist. [in]
110 130120
140
160
180
200
220
240
110 130120
140
160
180
200
220
240
North-South distance [in]120140160180200220240
70
80
90
100
120140160180200220240
70
80
90
100
120140160180200220240
70
80
90
100
x=96 in.
x=120 in.
x=144 in.
Figure 50. Airflow distribution between diffusers for test condition 5, Square diffusers, at 100% design airflow.

APPENDIX C - AIR DISTRIBUTION VARIATION TEST RESULTS
NCEMBT-070315
82
Nor
th-S
outh
dist
a nce
[in]
el. = 106.5 in. el. = 104 in.
East-West dist. [in] East-West dist. [in]
Velocity m/s
21.91251.8251.73751.651.56251.4751.38751.31.21251.1251.03750.950.86250.7750.68750.60.51250.4250.33750.25
110 130120
140
160
180
200
220
240
110 130120
140
160
180
200
220
240
North-South distance [in]
Velocity m/s
10.96250.9250.88750.850.81250.7750.73750.70.66250.6250.58750.550.51250.4750.43750.40.36250.3250.28750.25
120140160180200220240
80
100
120140160180200220240
80
100
120140160180200220240
80
100
x=96 in.
x=120 in.
x=144 in.
Figure 51. Airflow distribution between diffusers for test condition 5, Square diffusers, at 50% design airflow.

APPENDIX C - AIR DISTRIBUTION VARIATION TEST RESULTS
NCEMBT-070315
83
Nor
th-S
outh
dist
a nce
[in]
Velocity m/s
3.253.12.952.82.652.52.352.22.051.91.751.61.451.31.1510.850.70.550.40.25
el. = 106.5 in. el. = 104 in.
East-West dist. [in] East-West dist. [in]110 130
120
140
160
180
200
220
240
110 130120
140
160
180
200
220
240
North-South distance [in]120140160180200220240
70
80
90
100
120140160180200220240
70
80
90
100
120140160180200220240
70
80
90
100
x=96 in.
x=120 in.
x=144 in.
Figure 52. Airflow distribution between diffusers for test condition 6, Square diffusers, at 100% design airflow.

APPENDIX C - AIR DISTRIBUTION VARIATION TEST RESULTS
NCEMBT-070315
84
Nor
th-S
outh
dist
a nce
[in]
el. = 106.5 in. el. = 104 in.
East-West dist. [in] East-West dist. [in]
Velocity m/s
21.91251.8251.73751.651.56251.4751.38751.31.21251.1251.03750.950.86250.7750.68750.60.51250.4250.33750.25
110 130120
140
160
180
200
220
240
110 130120
140
160
180
200
220
240
North-South distance [in]
Velocity m/s
10.96250.9250.88750.850.81250.7750.73750.70.66250.6250.58750.550.51250.4750.43750.40.36250.3250.28750.25
120140160180200220240
80
100
120140160180200220240
80
100
120140160180200220240
80
100
x=96 in.
x=120 in.
x=144 in.
Figure 53. Airflow distribution between diffusers for test condition 6, Square diffusers, at 50% design airflow.

APPENDIX C - AIR DISTRIBUTION VARIATION TEST RESULTS
NCEMBT-070315
85
Nor
th-S
outh
dist
a nce
[in]
Velocity m/s
3.253.12.952.82.652.52.352.22.051.91.751.61.451.31.1510.850.70.550.40.25
el. = 106.5 in. el. = 104 in.
East-West dist. [in] East-West dist. [in]110 130
120
140
160
180
200
220
240
110 130120
140
160
180
200
220
240
North-South distance [in]120140160180200220240
70
80
90
100
120140160180200220240
70
80
90
100
120140160180200220240
70
80
90
100
x=96 in.
x=120 in.
x=144 in.
Figure 54. Airflow distribution between diffusers for test condition 7, Square diffusers, at 100% design airflow.

APPENDIX C - AIR DISTRIBUTION VARIATION TEST RESULTS
NCEMBT-070315
86
Nor
th-S
outh
dist
a nce
[in]
el. = 106.5 in. el. = 104 in.
East-West dist. [in] East-West dist. [in]
Velocity m/s
21.91251.8251.73751.651.56251.4751.38751.31.21251.1251.03750.950.86250.7750.68750.60.51250.4250.33750.25
110 130120
140
160
180
200
220
240
110 130120
140
160
180
200
220
240
North-South distance [in]
Velocity m/s
10.96250.9250.88750.850.81250.7750.73750.70.66250.6250.58750.550.51250.4750.43750.40.36250.3250.28750.25
120140160180200220240
80
100
120140160180200220240
80
100
120140160180200220240
80
100
x=96 in.
x=120 in.
x=144 in.
Figure 55. Airflow distribution between diffusers for test condition 7, Square diffusers, at 50% design airflow.

APPENDIX C - AIR DISTRIBUTION VARIATION TEST RESULTS
NCEMBT-070315
87
Nor
th-S
outh
dist
a nce
[in]
Velocity m/s
3.253.12.952.82.652.52.352.22.051.91.751.61.451.31.1510.850.70.550.40.25
el. = 106.5 in. el. = 104 in.
East-West dist. [in] East-West dist. [in]
110 130120
140
160
180
200
220
240
110 130120
140
160
180
200
220
240
North-South distance [in]120140160180200220240
70
80
90
100
120140160180200220240
70
80
90
100
120140160180200220240
70
80
90
100
x=96 in.
x=120 in.
x=144 in.
Figure 56. Airflow distribution between diffusers for test condition 8, Square diffusers, at 50% design airflow.

APPENDIX C - AIR DISTRIBUTION VARIATION TEST RESULTS
NCEMBT-070315
88
Nor
th-S
outh
dist
a nce
[in]
el. = 106.5 in. el. = 104 in.
East-West dist. [in] East-West dist. [in]
Velocity m/s
21.91251.8251.73751.651.56251.4751.38751.31.21251.1251.03750.950.86250.7750.68750.60.51250.4250.33750.25
110 130120
140
160
180
200
220
240
110 130120
140
160
180
200
220
240
North-South distance [in]120140160180200220240
70
80
90
100
120140160180200220240
70
80
90
100
120140160180200220240
70
80
90
100
x=96 in.
x=120 in.
x=144 in.
Figure 57. Airflow distribution between diffusers for test condition 8, Square diffusers, at 50% design airflow.

APPENDIX C - AIR DISTRIBUTION VARIATION TEST RESULTS
NCEMBT-070315
89
C4. ROOM AIRFLOW BETWEEN DIFFUSERS: SLOT DIFFUSERS
el. = 106.5 in. el. = 104.0 in.
Velocity m/s
3.002.882.752.632.502.382.252.132.001.881.751.631.501.381.251.131.000.880.750.630.500.380.25
Nor
th-S
outh
dist
a nce
[in]
East-West distance [in]
100 120 140
80
100
120
140
160
180
200
220
240
260
280
100 120 140
80
100
120
140
160
180
200
220
240
260
280
South-North distance [in]
Velocity m/s
2.502.382.252.132.001.881.751.631.501.381.251.131.000.880.750.630.500.380.25
80 100 120 140 160 180 200 220 240 260 280
80
100
80 100 120 140 160 180 200 220 240 260 280
80
100
80 100 120 140 160 180 200 220 240 260 280
80
100
x=120 in.
x= 96 in.
x=144 in.
Figure 58. Airflow velocity between diffusers for test condition 0, Slot diffusers, at 100% design airflow.

APPENDIX C - AIR DISTRIBUTION VARIATION TEST RESULTS
NCEMBT-070315
90
el. = 106.5 in. el. = 104.0 in.
Nor
th-S
outh
dist
a nce
[in]
East-West distance [in]
Velocity m/s
1.501.441.381.311.251.191.131.061.000.940.880.810.750.690.630.560.500.440.380.310.25
100 120 140
80
100
120
140
160
180
200
220
240
260
280
100 120 140
80
100
120
140
160
180
200
220
240
260
280
South-North distance [in]
Velocity m/s
1.251.201.151.101.051.000.950.900.850.800.750.700.650.600.550.500.450.400.350.300.25
80 100 120 140 160 180 200 220 240 260 280
80
100
80 100 120 140 160 180 200 220 240 260 280
80
100
80 100 120 140 160 180 200 220 240 260 280
80
100
x=120 in.
x= 96 in.
x=144 in.
Figure 59. Airflow velocity between diffusers for test condition 0, Slot diffusers, at 50% design airflow.

APPENDIX C - AIR DISTRIBUTION VARIATION TEST RESULTS
NCEMBT-070315
91
el. = 106.5 in. el. = 104.0 in.
Velocity m/s
3.002.882.752.632.502.382.252.132.001.881.751.631.501.381.251.131.000.880.750.630.500.380.25
Nor
th-S
outh
dist
a nce
[in]
East-West distance [in]
100 120 140
80
100
120
140
160
180
200
220
240
260
280
100 120 140
80
100
120
140
160
180
200
220
240
260
280
North-South distance [in]
80 100 120 140 160 180 200 220 240 260 280
80
100 Velocity m/s
2.502.382.252.132.001.881.751.631.501.381.251.131.000.880.750.630.500.380.25
80 100 120 140 160 180 200 220 240 260 280
80
100
80 100 120 140 160 180 200 220 240 260 280
80
100
x=96 in.
x=120 in.
x=144 in.
Figure 60. Airflow velocity between diffusers for test condition 1, Slot diffusers, at 100% design airflow.

APPENDIX C - AIR DISTRIBUTION VARIATION TEST RESULTS
NCEMBT-070315
92
el. = 106.5 in. el. = 104.0 in.
Nor
th-S
outh
dist
a nce
[in]
East-West distance [in]
Velocity m/s
1.501.441.381.311.251.191.131.061.000.940.880.810.750.690.630.560.500.440.380.310.25
100 120 140
80
100
120
140
160
180
200
220
240
260
280
100 120 140
80
100
120
140
160
180
200
220
240
260
280
South-North distance [in]
Velocity m/s
1.251.201.151.101.051.000.950.900.850.800.750.700.650.600.550.500.450.400.350.300.25
80 100 120 140 160 180 200 220 240 260 280
80
100
80 100 120 140 160 180 200 220 240 260 280
80
100
80 100 120 140 160 180 200 220 240 260 280
80
100
x=120 in.
x= 96 in.
x=144 in.
Figure 61. Airflow velocity between diffusers for test condition 1, Slot diffusers, at 50% design airflow.
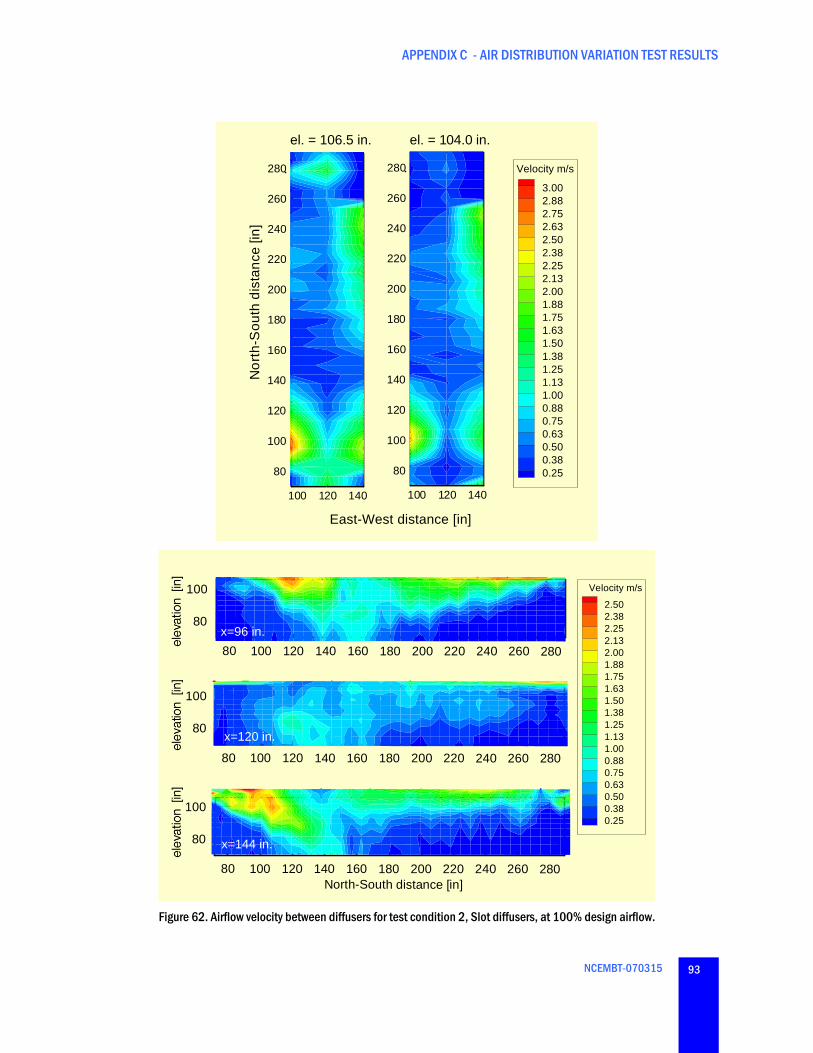
APPENDIX C - AIR DISTRIBUTION VARIATION TEST RESULTS
NCEMBT-070315
93
el. = 106.5 in. el. = 104.0 in.
Velocity m/s
3.002.882.752.632.502.382.252.132.001.881.751.631.501.381.251.131.000.880.750.630.500.380.25
Nor
th-S
outh
dist
a nce
[in]
East-West distance [in]
100 120 140
80
100
120
140
160
180
200
220
240
260
280
100 120 140
80
100
120
140
160
180
200
220
240
260
280
North-South distance [in]
80 100 120 140 160 180 200 220 240 260 280
80
100 Velocity m/s
2.502.382.252.132.001.881.751.631.501.381.251.131.000.880.750.630.500.380.25
80 100 120 140 160 180 200 220 240 260 280
80
100
80 100 120 140 160 180 200 220 240 260 280
80
100
x=96 in.
x=120 in.
x=144 in.
Figure 62. Airflow velocity between diffusers for test condition 2, Slot diffusers, at 100% design airflow.

APPENDIX C - AIR DISTRIBUTION VARIATION TEST RESULTS
NCEMBT-070315
94
el. = 106.5 in. el. = 104.0 in.
Nor
th-S
outh
dist
a nce
[in]
East-West distance [in]
Velocity m/s
1.501.441.381.311.251.191.131.061.000.940.880.810.750.690.630.560.500.440.380.310.25
100 120 140
80
100
120
140
160
180
200
220
240
260
280
100 120 140
80
100
120
140
160
180
200
220
240
260
280
South-North distance [in]
Velocity m/s
1.251.201.151.101.051.000.950.900.850.800.750.700.650.600.550.500.450.400.350.300.25
80 100 120 140 160 180 200 220 240 260 280
80
100
80 100 120 140 160 180 200 220 240 260 280
80
100
80 100 120 140 160 180 200 220 240 260 280
80
100
x=120 in.
x= 96 in.
x=144 in.
Figure 63. Airflow velocity between diffusers for test condition 2, Slot diffusers, at 50% design airflow.

APPENDIX C - AIR DISTRIBUTION VARIATION TEST RESULTS
NCEMBT-070315
95
el. = 106.5 in. el. = 104.0 in.
Velocity m/s
3.002.882.752.632.502.382.252.132.001.881.751.631.501.381.251.131.000.880.750.630.500.380.25
Nor
th-S
outh
dist
a nce
[in]
East-West distance [in]
100 120 140
80
100
120
140
160
180
200
220
240
260
280
100 120 140
80
100
120
140
160
180
200
220
240
260
280
South-North distance [in]
Velocity m/s
2.502.382.252.132.001.881.751.631.501.381.251.131.000.880.750.630.500.380.25
80 100 120 140 160 180 200 220 240 260 280
80
100
80 100 120 140 160 180 200 220 240 260 280
80
100
80 100 120 140 160 180 200 220 240 260 280
80
100
x=120 in.
x=96 in.
x=144 in.
Figure 64. Airflow velocity between diffusers for test condition 3, Slot diffusers, at 100% design airflow.

APPENDIX C - AIR DISTRIBUTION VARIATION TEST RESULTS
NCEMBT-070315
96
el. = 106.5 in. el. = 104.0 in.
Nor
th-S
outh
dist
a nce
[in]
East-West distance [in]
Velocity m/s
1.501.441.381.311.251.191.131.061.000.940.880.810.750.690.630.560.500.440.380.310.25
100 120 140
80
100
120
140
160
180
200
220
240
260
280
100 120 140
80
100
120
140
160
180
200
220
240
260
280
80 100 120 140 160 180 200 220 240 260 280
80
100
South-North distance [in]
Velocity m/s
1.251.201.151.101.051.000.950.900.850.800.750.700.650.600.550.500.450.400.350.300.25
80 100 120 140 160 180 200 220 240 260 280
80
100
80 100 120 140 160 180 200 220 240 260 280
80
100
x=120 in.
x= 96 in.
x=144 in.
Figure 65. Airflow velocity between diffusers for test condition 3, Slot diffusers, at 50% design airflow.

APPENDIX C - AIR DISTRIBUTION VARIATION TEST RESULTS
NCEMBT-070315
97
el. = 106.5 in. el. = 104.0 in.
Velocity m/s
3.002.882.752.632.502.382.252.132.001.881.751.631.501.381.251.131.000.880.750.630.500.380.25
Nor
th-S
outh
dist
a nce
[in]
East-West distance [in]
100 120 140
80
100
120
140
160
180
200
220
240
260
280
100 120 140
80
100
120
140
160
180
200
220
240
260
280
80 100 120 140 160 180 200 220 240 260 280
80
100
South-North distance [in]
Velocity m/s
2.502.382.252.132.001.881.751.631.501.381.251.131.000.880.750.630.500.380.25
80 100 120 140 160 180 200 220 240 260 280
80
100
80 100 120 140 160 180 200 220 240 260 280
80
100
x=120 in.
x=96 in.
x=144 in.
Figure 66. Airflow velocity between diffusers for test condition 4, Slot diffusers, at 100% design airflow.

APPENDIX C - AIR DISTRIBUTION VARIATION TEST RESULTS
NCEMBT-070315
98
el. = 106.5 in. el. = 104.0 in.
Nor
th-S
outh
dist
a nce
[in]
East-West distance [in]
Velocity m/s
1.501.441.381.311.251.191.131.061.000.940.880.810.750.690.630.560.500.440.380.310.25
100 120 140
80
100
120
140
160
180
200
220
240
260
280
100 120 140
80
100
120
140
160
180
200
220
240
260
280
South-North distance [in]
Velocity m/s
1.251.201.151.101.051.000.950.900.850.800.750.700.650.600.550.500.450.400.350.300.25
80 100 120 140 160 180 200 220 240 260 280
80
100
80 100 120 140 160 180 200 220 240 260 280
80
100
80 100 120 140 160 180 200 220 240 260 280
80
100
x=120 in.
x= 96 in.
x=144 in.
Figure 67. Airflow velocity between diffusers for test condition 4, Slot diffusers, at 50% design airflow.
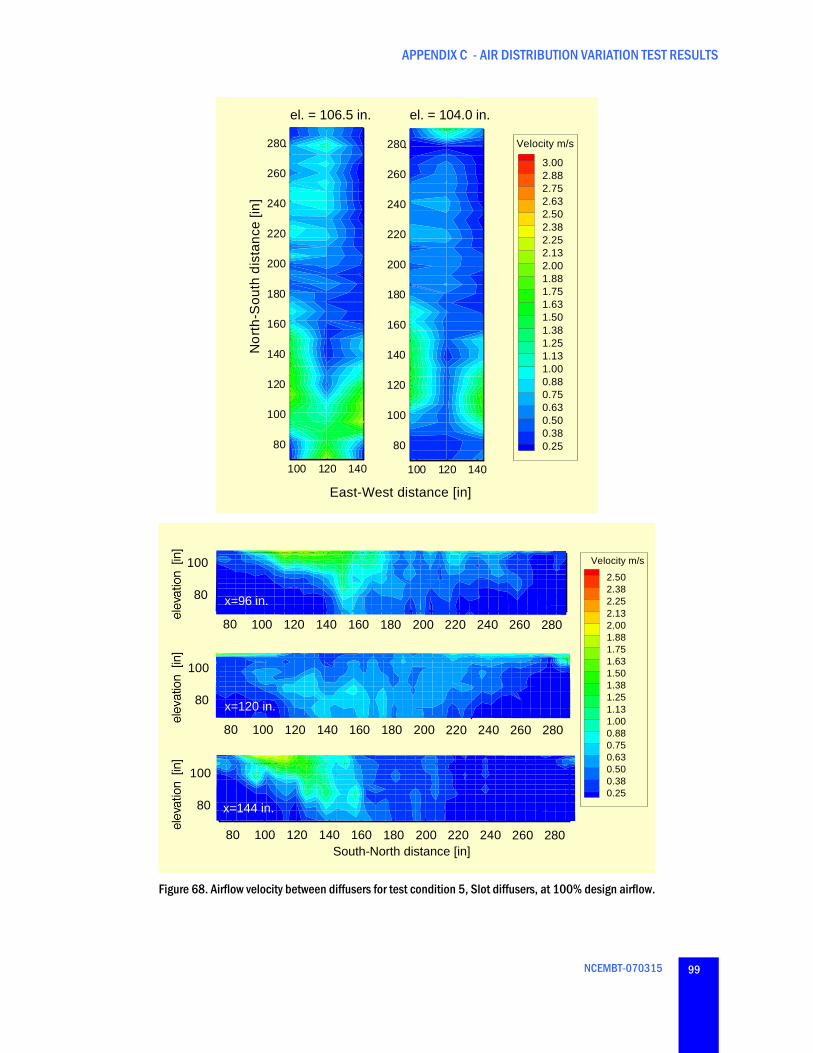
APPENDIX C - AIR DISTRIBUTION VARIATION TEST RESULTS
NCEMBT-070315
99
el. = 106.5 in. el. = 104.0 in.
Velocity m/s
3.002.882.752.632.502.382.252.132.001.881.751.631.501.381.251.131.000.880.750.630.500.380.25
Nor
th-S
outh
dist
a nce
[in]
East-West distance [in]
100 120 140
80
100
120
140
160
180
200
220
240
260
280
100 120 140
80
100
120
140
160
180
200
220
240
260
280
South-North distance [in]
Velocity m/s
2.502.382.252.132.001.881.751.631.501.381.251.131.000.880.750.630.500.380.25
80 100 120 140 160 180 200 220 240 260 280
80
100
80 100 120 140 160 180 200 220 240 260 280
80
100
80 100 120 140 160 180 200 220 240 260 280
80
100
x=120 in.
x=96 in.
x=144 in.
Figure 68. Airflow velocity between diffusers for test condition 5, Slot diffusers, at 100% design airflow.

APPENDIX C - AIR DISTRIBUTION VARIATION TEST RESULTS
NCEMBT-070315
100
el. = 106.5 in. el. = 104.0 in.
Nor
th-S
outh
dist
a nce
[in]
East-West distance [in]
Velocity m/s
1.501.441.381.311.251.191.131.061.000.940.880.810.750.690.630.560.500.440.380.310.25
100 120 140
80
100
120
140
160
180
200
220
240
260
280
100 120 140
80
100
120
140
160
180
200
220
240
260
280
South-North distance [in]
Velocity m/s
1.251.201.151.101.051.000.950.900.850.800.750.700.650.600.550.500.450.400.350.300.25
80 100 120 140 160 180 200 220 240 260 280
80
100
80 100 120 140 160 180 200 220 240 260 280
80
100
80 100 120 140 160 180 200 220 240 260 280
80
100
x=120 in.
x= 96 in.
x=144 in.
Figure 69. Airflow velocity between diffusers for test condition 5, Slot diffusers, at 50% design airflow.

APPENDIX C - AIR DISTRIBUTION VARIATION TEST RESULTS
NCEMBT-070315
101
el. = 106.5 in. el. = 104.0 in.
Velocity m/s
3.002.882.752.632.502.382.252.132.001.881.751.631.501.381.251.131.000.880.750.630.500.380.25
Nor
th-S
outh
dist
a nce
[in]
East-West distance [in]
100 120 140
80
100
120
140
160
180
200
220
240
260
280
100 120 140
80
100
120
140
160
180
200
220
240
260
280
South-North distance [in]
Velocity m/s
2.502.382.252.132.001.881.751.631.501.381.251.131.000.880.750.630.500.380.25
80 100 120 140 160 180 200 220 240 260 280
80
100
80 100 120 140 160 180 200 220 240 260 280
80
100
80 100 120 140 160 180 200 220 240 260 280
80
100
x=120 in.
x=96 in.
x=144 in.
Figure 70. Airflow velocity between diffusers for test condition 6, Slot diffusers, at 100% design airflow.

APPENDIX C - AIR DISTRIBUTION VARIATION TEST RESULTS
NCEMBT-070315
102
el. = 106.5 in. el. = 104.0 in.
Nor
th-S
outh
dist
a nce
[in]
East-West distance [in]
Velocity m/s
1.501.441.381.311.251.191.131.061.000.940.880.810.750.690.630.560.500.440.380.310.25
100 120 140
80
100
120
140
160
180
200
220
240
260
280
100 120 140
80
100
120
140
160
180
200
220
240
260
280
South-North distance [in]
Velocity m/s
1.251.201.151.101.051.000.950.900.850.800.750.700.650.600.550.500.450.400.350.300.25
80 100 120 140 160 180 200 220 240 260 280
80
100
80 100 120 140 160 180 200 220 240 260 280
80
100
80 100 120 140 160 180 200 220 240 260 280
80
100
x=120 in.
x= 96 in.
x=144 in.
Figure 71. Airflow velocity between diffusers for test condition 6, Slot diffusers, at 50% design airflow.

APPENDIX C - AIR DISTRIBUTION VARIATION TEST RESULTS
NCEMBT-070315
103
el. = 106.5 in. el. = 104.0 in.
Velocity m/s
3.002.882.752.632.502.382.252.132.001.881.751.631.501.381.251.131.000.880.750.630.500.380.25
Nor
th-S
outh
dist
a nce
[in]
East-West distance [in]
100 120 140
80
100
120
140
160
180
200
220
240
260
280
100 120 140
80
100
120
140
160
180
200
220
240
260
280
South-North distance [in]
Velocity m/s
2.502.382.252.132.001.881.751.631.501.381.251.131.000.880.750.630.500.380.25
80 100 120 140 160 180 200 220 240 260 280
80
100
80 100 120 140 160 180 200 220 240 260 280
80
100
80 100 120 140 160 180 200 220 240 260 280
80
100
x=120 in.
x=96 in.
x=144 in.
Figure 72. Airflow velocity between diffusers for test condition 7, Slot diffusers, at 100% design airflow.

APPENDIX C - AIR DISTRIBUTION VARIATION TEST RESULTS
NCEMBT-070315
104
el. = 106.5 in. el. = 104.0 in.
Nor
th-S
outh
dist
a nce
[in]
East-West distance [in]
Velocity m/s
1.501.441.381.311.251.191.131.061.000.940.880.810.750.690.630.560.500.440.380.310.25
100 120 140
80
100
120
140
160
180
200
220
240
260
280
100 120 140
80
100
120
140
160
180
200
220
240
260
280
South-North distance [in]
Velocity m/s
1.251.201.151.101.051.000.950.900.850.800.750.700.650.600.550.500.450.400.350.300.25
80 100 120 140 160 180 200 220 240 260 280
80
100
80 100 120 140 160 180 200 220 240 260 280
80
100
80 100 120 140 160 180 200 220 240 260 280
80
100
x=120 in.
x= 96 in.
x=144 in.
Figure 73. Airflow velocity between diffusers for test condition 7, Slot diffusers, at 50% design airflow.

APPENDIX C - AIR DISTRIBUTION VARIATION TEST RESULTS
NCEMBT-070315
105
el. = 106.5 in. el. = 104.0 in.
Velocity m/s
3.002.882.752.632.502.382.252.132.001.881.751.631.501.381.251.131.000.880.750.630.500.380.25
Nor
th-S
outh
dist
a nce
[in]
East-West distance [in]
100 120 140
80
100
120
140
160
180
200
220
240
260
280
100 120 140
80
100
120
140
160
180
200
220
240
260
280
South-North distance [in]
Velocity m/s
2.502.382.252.132.001.881.751.631.501.381.251.131.000.880.750.630.500.380.25
80 100 120 140 160 180 200 220 240 260 280
80
100
80 100 120 140 160 180 200 220 240 260 280
80
100
80 100 120 140 160 180 200 220 240 260 280
80
100
x=120 in.
x=96 in.
x=144 in.
Figure 74. Airflow velocity between diffusers for test condition 8, Slot diffusers, at 100% design airflow.

APPENDIX C - AIR DISTRIBUTION VARIATION TEST RESULTS
NCEMBT-070315
106
el. = 106.5 in. el. = 104.0 in.
Nor
th-S
outh
dist
a nce
[in]
East-West distance [in]
Velocity m/s
1.501.441.381.311.251.191.131.061.000.940.880.810.750.690.630.560.500.440.380.310.25
100 120 140
80
100
120
140
160
180
200
220
240
260
280
100 120 140
80
100
120
140
160
180
200
220
240
260
280
South-North distance [in]
Velocity m/s
1.251.201.151.101.051.000.950.900.850.800.750.700.650.600.550.500.450.400.350.300.25
80 100 120 140 160 180 200 220 240 260 280
80
100
80 100 120 140 160 180 200 220 240 260 280
80
100
80 100 120 140 160 180 200 220 240 260 280
80
100
x=120 in.
x= 96 in.
x=144 in.
Figure 75. Airflow velocity between diffusers for test condition 8, Slot diffusers, at 50% design airflow.

APPENDIX C - AIR DISTRIBUTION VARIATION TEST RESULTS
NCEMBT-070315
107


NATIONAL CENTER FOR ENERGY MANAGEMENT AND BUILDING TECHNOLOGIES 601 NORTH FAIRFAX STREET, SUITE 250 ALEXANDRIA, VA 22314 WWW.NCEMBT.ORG