lanl-co acrsp lco-acp-15 jean francois lucchini marian ......overview of the calculation and...
TRANSCRIPT
2013 LANL-CO ACRSP
LCO-ACP-15
Jean Francois Lucchini Marian Borkowski Hnin Khaing Michael K. Richmann Juliet S. Swanson Karen Simmons Donald T. Reed
WIPP Actinide-Relevant Brine Chemistry
LA-UR 13-20620
Page 1 of 50
WIPP Actinide-Relevant Brine Chemistry LCO-ACP-15, Rev.0
Page left intentionally blank
Page 2 of 50

WIPP Actinide-Relevant Brine Chemistry LCO-ACP-15, Rev.0
TABLE OF CONTENTS
EXECUTIVE SUMMARY ............................................................................................................ 5
ACKNOWLEDGEMENTS ............................................................................................................ 7
1. INTRODUCTION .................................................................................................................. 8
1.1 WIPP Brines ..................................................................................................................... 8
1.2 pH in High Ionic Strength Brine .................................................................................... 11
1.3 WIPP Brine pH and Stability ......................................................................................... 13
1.4 Literature Review ........................................................................................................... 14
2. EXPERIMENTAL ................................................................................................................ 16
2.1 Brines ............................................................................................................................. 16
2.2 ICP-MS Analysis ........................................................................................................... 16
2.2.1 Calibration Standards for ICP-MS .......................................................................... 17
2.2.2 Sample Preparation for ICP-MS ............................................................................. 17
2.3 IC Analysis ..................................................................................................................... 17
2.3.1 Calibration Standards for IC ................................................................................... 18
2.3.2 Sample Preparation for IC ...................................................................................... 18
2.4 Hydrogen Ion Concentration pCH+ - Titration Experiments ........................................ 19
2.5 Errors/Uncertainty .......................................................................................................... 19
3. RESULTS AND DISCUSSION ........................................................................................... 20
3.1 Stability of Unused Simulated Brines over Time (Task 1 Subtask 1) ........................... 20
3.2 Stability of Brines Used in ACRSP Solubility and Redox Experiments (Task 1 Subtask 2) .................................................................................................................... 25
Page 3 of 50

WIPP Actinide-Relevant Brine Chemistry LCO-ACP-15, Rev.0
3.2.1 Uranium Experiments ............................................................................................. 25
3.2.2 Neodymium Experiments ....................................................................................... 27
3.2.3 Plutonium Experiments ........................................................................................... 30
3.3 Composition of GWB Brine as a Function of pCH+ (Task 2 Subtask 1) ........................ 32
3.3.1 Results of GWB Full Strength Titration and Comparison with Model .................. 32
3.3.2 Formulations of WIPP Simulated Brine as a Function of pCH+ ............................. 37
4. CONCLUSIONS................................................................................................................... 39
APPENDIX 1 ................................................................................................................................ 43
APPENDIX 2 ................................................................................................................................ 47
Page 4 of 50
WIPP Actinide-Relevant Brine Chemistry LCO-ACP-15, Rev.0
EXECUTIVE SUMMARY
The actinide-relevant brine chemistry of the simulated brines used in the Waste Isolation Pilot Plant (WIPP) experimental program was investigated in three ways to establish the long-term stability of the brine components over the broad range of experimental conditions used. First, the long-term stability of the 95% simulated stock solutions1 was evaluated. Second, the effects of changes in pH, the presence of metal/actinide species, and carbonate were evaluated by analyzing the brines from the actual long-term actinide/metal solubility experiments. Third, pH titrations of saturated GWB simulated brine were performed to determine pH-specific brine compositions that provide connectivity between the two “bracketing” GWB and ERDA-6 brines used in the WIPP experimental studies. These results were interpreted in the context of geochemical modeling studies performed within the WIPP project.
The long-term stability of the unused GWB and ERDA-6 simulated brines (mostly 95% composition), which were generated since the start of the Los Alamos National Laboratory- Carlsbad Operations (LANL-CO) Actinide Chemistry and Repository Science Program (ACRSP) experimental program showed no pattern of instability or precipitation. These results confirmed that the 95% formulations of the GWB and ERDA-6 brine were stable for up to six years and that the methods used for storage were appropriate and adequate during this time.
The concentration of the brine components in the long-term uranium, neodymium and plutonium solubility and redox studies were also measured to determine their stability under the broader range of pH and experimental conditions used (pCH+ of 6-12, presence of actinides/analogs, presence of carbonate, presence of iron). Under this broader set of interactions, the only changes noted were the precipitation of borate and magnesium salts in the higher-pH ERDA-6 experiments (pCH+ > 10).
Lastly, the effect of pCH+ on WIPP simulated brines was investigated. GWB brine (100% formulation) was stepwise titrated up to pCH+ ~ 13 and the brine component concentrations were determined after 3-week equilibration. These experimental results were compared with the predicted composition of the brine from the current WIPP brine model [Brush 2011]. Good agreement was observed between the experimental data and the modeling results at pCH+ ≤ 10.5 (includes the expected pCH+ in WIPP Performance Assessment (PA)), with the exception of tetraborate. At pCH+ ≥ 10.5, which is above the expected pH in our current WIPP PA assumptions, we observed discrepancies between experimental and predicted data for Mg2+, Ca2+
and tetraborate. Specifically calcium precipitation is only observed experimentally at pCH+ > 10.5; magnesium remains in solution above pCH+ 10.5 in the experiments performed and does not precipitate to the extent predicted by the modeling; and the tetraborate concentration goes through a minimum at pCH+ = 9.75 that is also not captured in the modeling results. These discrepancies occur above the expected pH range in our current WIPP PA model and can be
1 Solution at 95% of their saturated composition. A sub-saturation solution permits sampling over long times without brine solidification (salting).
Page 5 of 50

WIPP Actinide-Relevant Brine Chemistry LCO-ACP-15, Rev.0
explained as limitations in the current database used in the WIPP model. It is important to note that the use of GWB and ERDA-6 as bracketing brines for WIPP-relevant studies was confirmed by these results. GWB brine transforms into ERDA-6 at pCH+ ~ 10.5. The composition of transitional WIPP brines in the pCH+ range [9-13], was also established to guide future and ongoing studies.
Overall, this investigation provided a confirmation of past modeling and experimental studies in the WIPP and established a better understanding of the actinide-relevant brine chemistry over a wider range of experimental conditions. This effectively increases the robustness of the current WIPP model and provides a better foundation for future and ongoing WIPP-relevant actinide solubility studies.
Page 6 of 50

WIPP Actinide-Relevant Brine Chemistry LCO-ACP-15, Rev.0
ACKNOWLEDGEMENTS
This research was performed as part of the Los Alamos National Laboratory – Carlsbad Operations Actinide Chemistry and Repository Science Program at the New Mexico State University (NMSU)-operated Carlsbad Environmental Monitoring and Research Center (CEMRC) in Carlsbad, New Mexico.
The authors wish to acknowledge the support and encouragement of Russ Patterson who is the Department of Energy (DOE) program manager. The research performed was funded by the Department of Energy, Carlsbad Field Office as part of the ongoing recertification of the Waste Isolation Pilot Plant transuranic repository.
Page 7 of 50
WIPP Actinide-Relevant Brine Chemistry LCO-ACP-15, Rev.0
WIPP ACTINIDE-RELEVANT BRINE CHEMISTRY
The stability of WIPP simulated brines over a broad range of conditions was evaluated and the results are summarized in this report. This strengthens and clarifies the experimental basis for the bracketing WIPP brines (GWB and ERDA-6) approach used in past studies and increases the robustness of the current WIPP chemistry model. The results reported herein are also the basis of a better definition of the WIPP transitional brine composition over a broad pCH+ range. These results support an improved understanding of the brine chemistry that defines the actinide solution concentrations used as a source term in brine-inundation scenarios addresses by WIPP PA and will be used as input to the WIPP Compliance Recertification Application (CRA) scheduled for 2014.
The experiments we summarize in this report were performed as part of the Test Plan entitled “WIPP Actinide-Relevant Brine Chemistry” and designated LCO-ACP-11. Specifically, the results of Subtasks 1 and 2 in Task I entitled “Chemical Stability of WIPP Simulated Brines” and Subtask 1 in Task 2 entitled “Effects of pCH+ on the Chemical Stability of the WIPP Simulated Brines” are reported. Additionally, samples from previously completed Test Plans were analyzed. These are: “Solubility/Stability of Uranium (VI) in WIPP Brines” (LCO-ACP-02), “Solubility of Neodymium (III) in WIPP Brines” (LCO-ACP-03), and “Plutonium (VI) Reduction by Iron: Limited-Scope Confirmatory Study” (LCO-ACP-04). This work was performed under the Los Alamos National Laboratory – Carlsbad Operations Quality Assurance (QA) program and is compliant with the Department of Energy Carlsbad Field Office (DOE/CBFO) Quality Assurance Program Document (QAPD) requirements.
1. INTRODUCTION
A number of simulated brines were used in WIPP-relevant research over the past ~ 25 years. A brief history and description of these brines is given in section 1.1. Section 1.2 provides an overview of the calculation and measurement of pH in high ionic strength solutions. The chemical stability and pH of the bracketing WIPP simulated brines are presented in section 1.3. Section 1.4 is a non-exhaustive literature review on the relevant brine chemistry and the effects of pH on this chemistry.
1.1 WIPP Brines
Brine, if present in the WIPP, will react with emplaced transuranic TRU waste, waste components, carbon dioxide and engineered barrier materials to establish the brine chemistry that will define actinide solubility and potential colloid formation. In this context, the composition of the brine in the repository horizon will be defined by a combination of factors, including the initial composition of the in-flow brine; reactions that control pH; and the extent to which this
Page 8 of 50
WIPP Actinide-Relevant Brine Chemistry LCO-ACP-15, Rev.0
brine is altered by equilibration with the waste material components, emplaced container materials, and the waste-derived organic chelating agents that can dissolve in the brine. Consequently, defining the composition of the brine that is most relevant in the WIPP is difficult, since it is complex and may evolve over time.
A number of brine compositions were used in WIPP-specific research over the past twenty years. The most important of these are tabulated in Table 1. The composition of brine in and around the WIPP site prior to waste emplacement was established [Popielak 1983, Molecke 1983, Snider 2003] by sampling the groundwater and intergranular inclusions in the Salado (WIPP emplacement horizon) and Castile Formations below the WIPP.
The Castile Formation in the vicinity of the WIPP site is known to contain localized brine reservoirs with sufficient pressure to force brine to the surface if penetrated by a borehole. Castile brines are predominantly saturated NaCl solutions containing Ca2+ and SO4
2- ions, as well as small concentrations of other elements, and are about eight times more concentrated than seawater (ionic strength (I) typically > 5 M).
Overlying the Salado in the vicinity of the WIPP site is the Culebra of the Rustler Formation, a fractured dolomite (CaMg(CO3)2) layer. The Culebra formation is significant because it is expected to be the most transmissive potential geologic pathway to the accessible environment. Culebra brines are generally more dilute than the Salado and Castile brines, and are predominantly NaCl with K+, Mg2+, Ca2+, SO4
2-, and CO32-.
Different simulated brines were developed over the years to represent repository-relevant brines and standardize laboratory studies. Historically, prior to and at the time of the Compliance Certification Application (CCA) [U.S. DOE 1996], Brine A was used to simulate Salado Formation brines for laboratory and modeling studies [Molecke 1983]. Brine A was developed to simulate fluids equilibrated with potassium and magnesium minerals in overlaying potash-bearing zones. The composition of Brine A (see Table 1) was based on the analyses of several brine seeps from the Salado Formation region overlaying the WIPP [Molecke 1983]. A brine formulation, called G-Seep, was also developed to represent the WIPP horizon brine. G-Seep was a near-saturated, predominantly sodium chloride brine representative of brines potentially intruding into either a domed salt repository or into relatively pure bedded halite that can be found below the WIPP horizon.
Since the CCA, however, the Generic Weep Brine (GWB) and the ERDA-6 (Energy Research and Development Administration Well 6) brine were shown to be more representative of the Salado and Castile brines than Brine A [Brush 2003, Snider 2003] and G-Seep. GWB brine simulates intergranular (grain-boundary) brines from the Salado at or near the stratigraphic horizon of the repository [Snider 2003]. ERDA-6 brine simulates brine from the ERDA-6 well, typical of fluids in Castile Formation brine reservoirs [Popielak 1983]. These two brine formulations, GWB and ERDA-6 (see Table 1), are currently used to represent Salado and Castile Formation brines respectively, in PA and in the WIPP-specific experimental studies performed by the LANL-CO/ACRSP team [CRA-2009 Appendix SOTERM]. These two brines bracket the expected compositional range in WIPP brine. These brine formulations, however, do not reflect the potential effects of reaction with the waste components and magnesium oxide
Page 9 of 50

WIPP Actinide-Relevant Brine Chemistry LCO-ACP-15, Rev.0
(MgO) on the brine composition and are not stable across the range of pH typically investigated to establish actinide solubility trends.
Table 1. Compositions of historical brines (Brine A, G-Seep), and GWB and ERDA-6 brines prior to and after equilibration with MgO [references in footnotes and Brush 2006].
Ion or propertya
Brine Ab G-Seepb
GWB
before reaction with MgO, halite,
and anhydritec
GWB after
reaction with MgO (phase 5), halite, and anhydrited
ERDA-6
before reaction
with MgO, halite, and anhydrite e
ERDA-6 after
reaction with MgO (phase 5), halite, and anhydrited
B(OH)x3-x (see
footnote f) 20 mM 144 mM 158 mM 166 mM 63 mM 62.4 mM
Na+ 1.83 M 4.11 M 3.53 M 4.35 M 4.87 M 5.24 M
Mg2+ 1.44 M 0.630 M 1.02 M 0.578 M 19 mM 157 mM
K+ 770 mM 350 mM 0.467 M 0.490 M 97 mM 96.1 mM
Ca2+ 20 mM 7.68 mM 14 mM 8.95 mM 12 mM 10.7 mM
SO42- 40 mM 303 mM 177 mM 228 mM 170 mM 179 mM
Cl- 5.35 M 5.10 M 5.86 M 5.38 M 4.8 M 5.24 M
Br- 10 mM 17.1 mM 26.6 mM 27.8 mM 11 mM 10.9 mM
Total Inorganic C (as HCO3
-) 10 mM 11.5 mM Not reported 0.350 mM 16 mM 0.428 mM
pH 6.5 6.1 Not reported 8.69 6.17 8.94
Relative Density
Not reported
Not reported 1.2 1.23 1.216 1.22
Ionic Strengthg (m)
Not reported
Not reported 8.90 7.84 5.84 6.82
Ionic Strengthg (M)
Not reported
Not reported 7.44 6.84 5.32 6.02
a Ions listed represent the total of all species with this ion.
b From [Molecke 1979] c From [Snider 2003] d From [Brush 2009] e From [Popielak 1983] f Boron species will be present in brine as boric acid, hydroxy polynuclear forms (e.g. B3O3(OH)4
-), and/or borate forms (e.g., B4O7
2-) g Calculated.
Page 10 of 50
WIPP Actinide-Relevant Brine Chemistry LCO-ACP-15, Rev.0
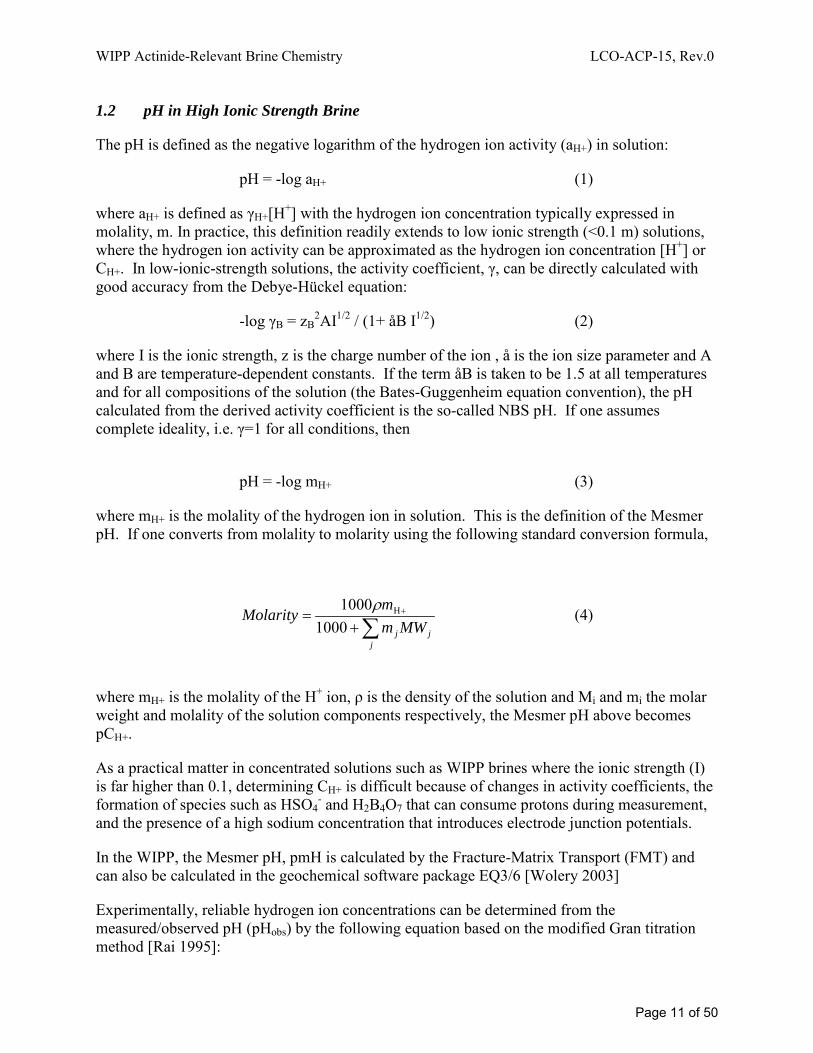
1.2 pH in High Ionic Strength Brine
The pH is defined as the negative logarithm of the hydrogen ion activity (aH+) in solution:
pH = -log aH+ (1)
where aH+ is defined as γH+[H+] with the hydrogen ion concentration typically expressed in molality, m. In practice, this definition readily extends to low ionic strength (<0.1 m) solutions, where the hydrogen ion activity can be approximated as the hydrogen ion concentration [H+] or CH+. In low-ionic-strength solutions, the activity coefficient, γ, can be directly calculated with good accuracy from the Debye-Hückel equation:
-log γB = zB2AI1/2 / (1+ åB I1/2) (2)
where I is the ionic strength, z is the charge number of the ion , å is the ion size parameter and A and B are temperature-dependent constants. If the term åB is taken to be 1.5 at all temperatures and for all compositions of the solution (the Bates-Guggenheim equation convention), the pH calculated from the derived activity coefficient is the so-called NBS pH. If one assumes complete ideality, i.e. γ=1 for all conditions, then
pH = -log mH+ (3)
where mH+ is the molality of the hydrogen ion in solution. This is the definition of the Mesmer pH. If one converts from molality to molarity using the following standard conversion formula,
∑+= +
jjj MWm
mMolarity1000
1000 Hρ (4)
where mH+ is the molality of the H+ ion, ρ is the density of the solution and Mi and mi the molar weight and molality of the solution components respectively, the Mesmer pH above becomes pCH+.
As a practical matter in concentrated solutions such as WIPP brines where the ionic strength (I) is far higher than 0.1, determining CH+ is difficult because of changes in activity coefficients, the formation of species such as HSO4
- and H2B4O7 that can consume protons during measurement, and the presence of a high sodium concentration that introduces electrode junction potentials.
In the WIPP, the Mesmer pH, pmH is calculated by the Fracture-Matrix Transport (FMT) and can also be calculated in the geochemical software package EQ3/6 [Wolery 2003]
Experimentally, reliable hydrogen ion concentrations can be determined from the measured/observed pH (pHobs) by the following equation based on the modified Gran titration method [Rai 1995]:
Page 11 of 50

WIPP Actinide-Relevant Brine Chemistry LCO-ACP-15, Rev.0
pCH+ = pHobs + K (5)
where K is an experimentally determined constant. The values of K were found to be linearly proportional to the ionic strength of the brines (Figure 1) with a correlation factor of 0.997. The values of K for the brines used in the present work (GWB, ERDA-6, NaCl) were determined according to the procedure adapted from Rai et al. [1995]. The correction factors K were (1.23 ± 0.01) for GWB, (0.94 ± 0.02) for ERDA-6 and (0.82 ± 0.06) for 5 M NaCl respectively [Borkowski 2009].
Unless otherwise mentioned, the pCH+ notation is used in the experimental work reported herein, as well as in the recent Brush report [Brush 2011].
Figure 1. Correlation between the pH shift (ΔpH) and the ionic strength (I) of the two simulated WIPP brines, GWB and ERDA-6, 5 M NaCl brine and high purity (HP) water [Borkowski 2009, Lucchini 2010]. The correction factor K is defined as -ΔpH.
0 2 4 6-1.5
-1.0
-0.5
0.0
0.5
pH S
hift
(∆pH
)
Ionic Strength (I), M
HP Water
5M NaCl
GWB
ERDA-6
Page 12 of 50
WIPP Actinide-Relevant Brine Chemistry LCO-ACP-15, Rev.0
In earlier WIPP documentation [Molecke 1979, Molecke 1983, Popielak 1983, Snider 2003, Brush 2009, Deng 2010], the reported pH in brine was calculated by the FMT code using Equation (1).
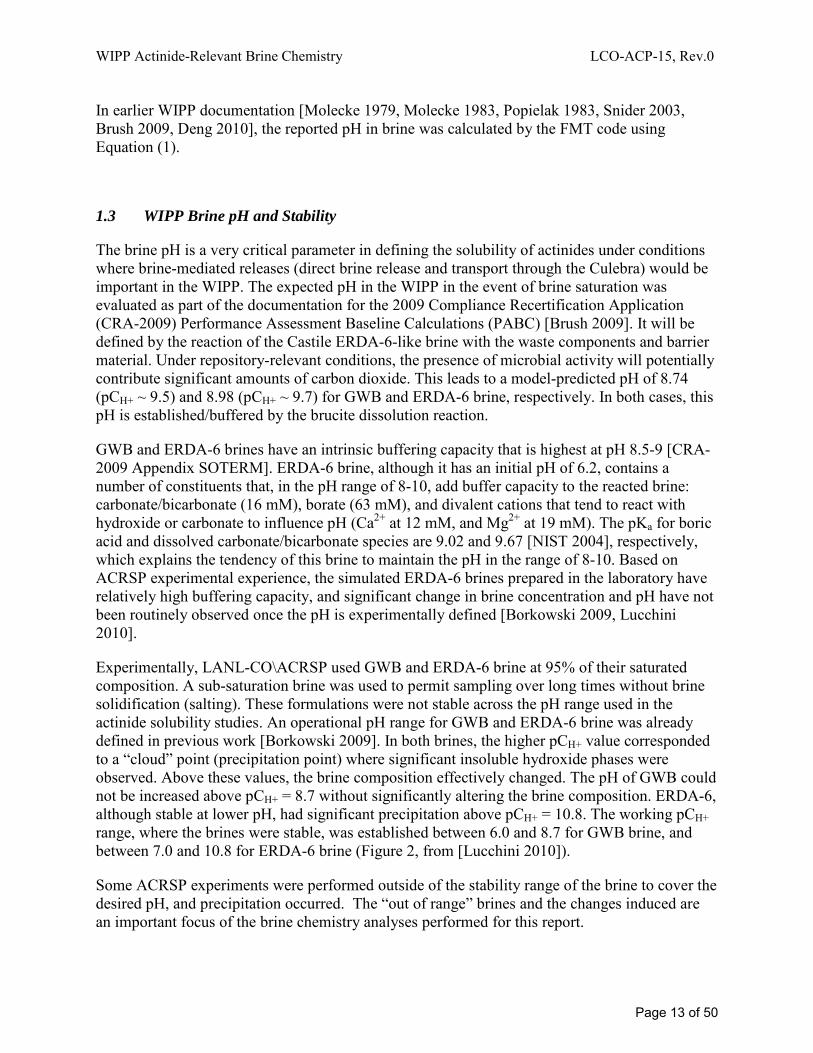
1.3 WIPP Brine pH and Stability
The brine pH is a very critical parameter in defining the solubility of actinides under conditions where brine-mediated releases (direct brine release and transport through the Culebra) would be important in the WIPP. The expected pH in the WIPP in the event of brine saturation was evaluated as part of the documentation for the 2009 Compliance Recertification Application (CRA-2009) Performance Assessment Baseline Calculations (PABC) [Brush 2009]. It will be defined by the reaction of the Castile ERDA-6-like brine with the waste components and barrier material. Under repository-relevant conditions, the presence of microbial activity will potentially contribute significant amounts of carbon dioxide. This leads to a model-predicted pH of 8.74 (pCH+ ~ 9.5) and 8.98 (pCH+ ~ 9.7) for GWB and ERDA-6 brine, respectively. In both cases, this pH is established/buffered by the brucite dissolution reaction.
GWB and ERDA-6 brines have an intrinsic buffering capacity that is highest at pH 8.5-9 [CRA-2009 Appendix SOTERM]. ERDA-6 brine, although it has an initial pH of 6.2, contains a number of constituents that, in the pH range of 8-10, add buffer capacity to the reacted brine: carbonate/bicarbonate (16 mM), borate (63 mM), and divalent cations that tend to react with hydroxide or carbonate to influence pH (Ca2+ at 12 mM, and Mg2+ at 19 mM). The pKa for boric acid and dissolved carbonate/bicarbonate species are 9.02 and 9.67 [NIST 2004], respectively, which explains the tendency of this brine to maintain the pH in the range of 8-10. Based on ACRSP experimental experience, the simulated ERDA-6 brines prepared in the laboratory have relatively high buffering capacity, and significant change in brine concentration and pH have not been routinely observed once the pH is experimentally defined [Borkowski 2009, Lucchini 2010].
Experimentally, LANL-CO\ACRSP used GWB and ERDA-6 brine at 95% of their saturated composition. A sub-saturation brine was used to permit sampling over long times without brine solidification (salting). These formulations were not stable across the pH range used in the actinide solubility studies. An operational pH range for GWB and ERDA-6 brine was already defined in previous work [Borkowski 2009]. In both brines, the higher pCH+ value corresponded to a “cloud” point (precipitation point) where significant insoluble hydroxide phases were observed. Above these values, the brine composition effectively changed. The pH of GWB could not be increased above pCH+ = 8.7 without significantly altering the brine composition. ERDA-6, although stable at lower pH, had significant precipitation above pCH+ = 10.8. The working pCH+ range, where the brines were stable, was established between 6.0 and 8.7 for GWB brine, and between 7.0 and 10.8 for ERDA-6 brine (Figure 2, from [Lucchini 2010]).
Some ACRSP experiments were performed outside of the stability range of the brine to cover the desired pH, and precipitation occurred. The “out of range” brines and the changes induced are an important focus of the brine chemistry analyses performed for this report.
Page 13 of 50

WIPP Actinide-Relevant Brine Chemistry LCO-ACP-15, Rev.0
Figure 2. Chemical stability of GWB and ERDA-6 brines versus pCH+ [Borkowski 2009, Lucchini 2010]. The lower pCH+ value is defined by the buffering capacity and range of borate in the brines. The higher pCH+ value corresponds to the “cloud” point when precipitation occurs. The pCH+ boundaries have an accuracy of ± 0.5 pH units.
1.4 Literature Review
Most of the experimental investigations on simulated WIPP brines have been performed at Sandia National Laboratories (SNL) and LANL-CO by many contributors over the years [Molecke 1979, Molecke 1983, Popielak 1983, Snider 2003, Borkowski 2009, Borkowski 2010, Deng 2010, Lucchini 2010, Reed 2010, Jang 2012, Lucchini 2012, Xiong 2012]. However, even if some of these studies were performed at pCH+ values different than the one of interest to the WIPP (~9.5 to 9.7), none of them clearly addressed the stability of the brines, and the changes in the brine composition as a function of pCH+.
It is well accepted that the composition of the brine reacted with waste and MgO will be significantly different than the composition of the bracketing GWB or ERDA-6 brines. The effect of MgO on the composition of GWB and ERDA-6 brine was investigated in a modeling study (see Table 1 and [Brush 2009]). Although the concentration of most brine constituents changed slightly, the most important changes for GWB brine were the lowering of the magnesium concentration from 1.02 to 0.463 M, a decrease in calcium concentration from 14 to 10 mM, due to an increase of pH to 8.74. For ERDA-6, there was a significant increase in the magnesium concentration from 19 to 136 mM, a decrease in total inorganic carbon from 16 to 0.448 mM, and an increase of the pH to 8.98 from 6.17. Overall, modeling calculations demonstrated that MgO establishes and buffers the brine pH by maintaining a magnesium concentration in solution that reacts with carbon dioxide (CO2) and a hydroxide concentration to buffer the pH.
Altmaier et al. experimentally measured the solubility of crystalline magnesium hydroxide (Mg(OH)2 (cr) ) and magnesium hydroxychloride (Mg2(OH)3Cl·4H2O (cr) ) in water, magnesium chloride (MgCl2) and sodium chloride (NaCl) [Altmaier 2003]. Their data show that the equilibrium pHm (-log mH) for dissolved magnesium hydroxide in 0.01 m, 0.03 m and 0.05 m MgCl2 and 0.5 m NaCl were 9.7, 9.45 and 9.35 respectively. Precipitation of Mg(OH)2 in 1.0 m
pCH+
8.7 6.0 GWB Hydroxide
precipitation
10.8 7.0 ERDA-6 Borate buffer
Page 14 of 50
WIPP Actinide-Relevant Brine Chemistry LCO-ACP-15, Rev.0
MgCl2 started at pHm ~ 9.0. The trend in these experimental results from Altmaier et al. is in good agreement with the modeling calculations [Brush 2009].
A more recent modeling analysis was performed by SNL [Brush 2011] to predict the composition of standard WIPP brines as of function of pCH+ for the ACRSP laboratory studies on the speciation and the solubilities of actinides. The geochemical software package EQ3/6, version 8.0a [Wolery 2003, Wolery 2010], and the thermodynamic database DATA0.FM1 [Xiong 2011] were used for calculations in closed-system mode. The following solid phases were suppressed (meaning prevented from precipitation) in calculations: aragonite (CaCO3), calcite (CaCO3), dolomite (CaMg(CO3)2), hydromagnesite (with the composition Mg4(CO3)3(OH)2·3H2O), and nesquehonite (MgCO3·3H2O). This was done to ensure that the analysis was consistent with the near-field chemical conceptual models [Brush 2011a]. The modeling data are presented in Table A2 of Appendix 1. They are also plotted against our experimental data, for comparison purposes, in the Results and Discussion section (section 3).
Page 15 of 50

WIPP Actinide-Relevant Brine Chemistry LCO-ACP-15, Rev.0
2. EXPERIMENTAL
The general experimental approach used was the following: each brine was prepared (if new), sampled, diluted and analyzed to establish its elemental composition by inductively coupled plasma-mass spectrometry (ICP-MS), the composition of major anions by ion chromatography (IC), and the pCH+. The general protocols for these analyses are described in this section.
2.1 Brines
The stability of two WIPP simulated brines, GWB and ERDA-6, was investigated. 95% (or less) saturated composition brines were used in most of the solubility studies to minimize precipitation due to evaporation and 100% saturated composition (full strength) brines were used in the titration experiments since evaluating the nature of the precipitates formed was a key experimental objective.
The 95% saturated brine compositions were the WIPP simulated and simplified stock brines that were generated since the start of the ACRSP experimental program. These 95% formulations were also used in the actinide solubility/redox experiments, and a select number of these were analyzed as part of Task 1 (see also Section 3.1). A list of the brines analyzed along with a general description can be found in Appendix 2.
The full strength brines (100% saturated composition) were prepared for this work, using an existing procedure: “Brine Preparation” (ACP-EXP-001) and the composition of the GWB brine given in Table 1, before reaction with MgO, halite and anhydrite. These brines were titrated across a broad pCH+ range 8.5-13, stepwise; using low carbonate content 1 M National Institute of Standards and Technology (NIST)-traceable certified 50% weight sodium hydroxide. At each desired pH step, when equilibration was achieved, an aliquot of the solution was centrifuged for 15 minutes at 13000 rpm. The precipitate was then discarded, and the supernatant was filtered using a pre-wetted Microcon® Millipore centrifugal filter with a nominal molecular weight limit of 30 000 Daltons corresponding approximately to a 5 nm pore size. The recovery of the sample at this filtration step was more than 90%. The volume of the sample was then split for ICP-MS and IC analysis.
2.2 ICP-MS Analysis
An Agilent model 7500ce ICP-MS was used to determine the elemental concentration of each of the following brine components: Na, Mg, Ca, K, B, and Li. Impurity checks were periodically performed for Al, Ti, Mn, Ba, Fe, Pb, Sr, U, and Th , but the concentrations measured were not significant (typically below detection which is ~ 10 ppb).
Page 16 of 50
WIPP Actinide-Relevant Brine Chemistry LCO-ACP-15, Rev.0
2.2.1 Calibration Standards for ICP-MS
A dilution series was generated using NIST- traceable standards (High Purity Standards). Calibration standards were analyzed according to procedure: “Analysis of Solutes in Brine Using the Agilent ICP-MS” (ACP-EXP-011), with a few exceptions:
1. Calibration range was 0, 10, 20, 50, 100, and 250 ppb for Li and B. 2. Calibration range was 0, 500, 1000, 2500 and 5000 ppb for Na, Mg, K, and Ca.
2.2.2 Sample Preparation for ICP-MS
All brine was diluted by a least a factor of 100. This was an operational consideration to minimize matrix effects that might interfere with the ICP-MS analyses and prevent an overload of the detector.
Triplicate samples were taken for each brine solution. Samples were diluted 150 fold for the impurity check, 1000 fold and 20,000 fold for the determination of major cations or elements. The dilution protocol was the following:
1. Initial 10 fold dilution was done by adding 0.10 mL of filtrate to 0.90 mL of 2% nitric acid
2. 150 fold dilution was done by adding 0.10 mL of solution obtained in step 1 to 1.355 mL of 2% nitric acid and 45 µL of 1000 ppb indium standard
3. 1000 fold dilution was done by adding 0.020 mL of solution from step 1 to 1.92 mL of 2% nitric acid and 60 µL of 1000 ppb indium standard solution
4. 20,000 fold dilution was done by adding 0.050 mL of solution from step 3 to 0.92 mL of 2% nitric acid and 30 µL of 1000 ppb indium standard.
Other volumes of sample, acid and indium standard could have been used but were proportional to the volumes listed in this protocol in order to keep the same dilution factors and concentration of indium internal standard.
The hard copy reports of ICP-MS analyses, identification of calibration standards, nitric acid and internal standard used for the ICP-MS analysis and M&TE used were reported in data packages submitted to the LANL-CO Record Center.
2.3 IC Analysis
A Dionex ICS 3000 Ion Chromatograph was used to determine the concentration of the following major anions in each brine: Br-, SO4
2-, and Cl-. Some impurities and/or contamination (e.g., NO3
-, PO43-) were measured in some cases, but they were not significant enough for the
chemistry of the brine to be reported.
Page 17 of 50
WIPP Actinide-Relevant Brine Chemistry LCO-ACP-15, Rev.0
2.3.1 Calibration Standards for IC
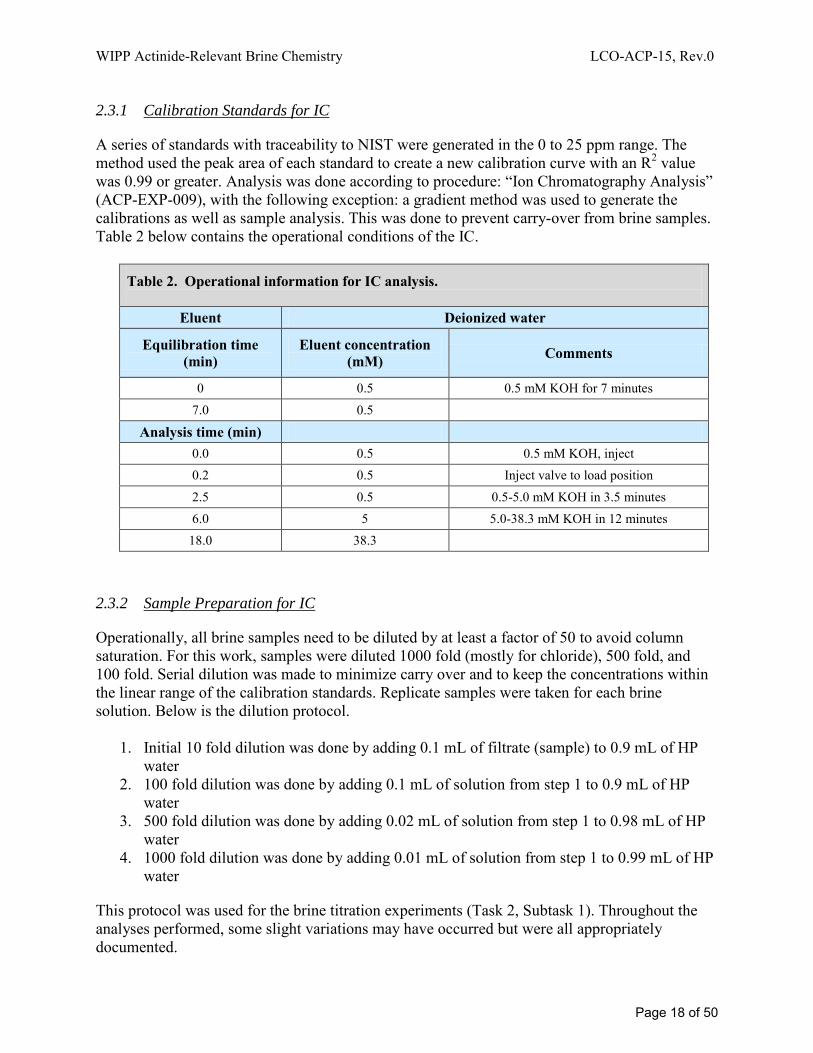
A series of standards with traceability to NIST were generated in the 0 to 25 ppm range. The method used the peak area of each standard to create a new calibration curve with an R2 value was 0.99 or greater. Analysis was done according to procedure: “Ion Chromatography Analysis” (ACP-EXP-009), with the following exception: a gradient method was used to generate the calibrations as well as sample analysis. This was done to prevent carry-over from brine samples. Table 2 below contains the operational conditions of the IC.
Table 2. Operational information for IC analysis.
Eluent Deionized water
Equilibration time (min)
Eluent concentration (mM) Comments
0 0.5 0.5 mM KOH for 7 minutes
7.0 0.5
Analysis time (min) 0.0 0.5 0.5 mM KOH, inject 0.2 0.5 Inject valve to load position
2.5 0.5 0.5-5.0 mM KOH in 3.5 minutes 6.0 5 5.0-38.3 mM KOH in 12 minutes
18.0 38.3
2.3.2 Sample Preparation for IC
Operationally, all brine samples need to be diluted by at least a factor of 50 to avoid column saturation. For this work, samples were diluted 1000 fold (mostly for chloride), 500 fold, and 100 fold. Serial dilution was made to minimize carry over and to keep the concentrations within the linear range of the calibration standards. Replicate samples were taken for each brine solution. Below is the dilution protocol.
1. Initial 10 fold dilution was done by adding 0.1 mL of filtrate (sample) to 0.9 mL of HP water
2. 100 fold dilution was done by adding 0.1 mL of solution from step 1 to 0.9 mL of HP water
3. 500 fold dilution was done by adding 0.02 mL of solution from step 1 to 0.98 mL of HP water
4. 1000 fold dilution was done by adding 0.01 mL of solution from step 1 to 0.99 mL of HP water
This protocol was used for the brine titration experiments (Task 2, Subtask 1). Throughout the analyses performed, some slight variations may have occurred but were all appropriately documented.
Page 18 of 50
WIPP Actinide-Relevant Brine Chemistry LCO-ACP-15, Rev.0
The hard copy reports of IC analyses, identification of calibration standards and M&TE used are reported in data packages submitted to the LANL-CO Record Center. All analytical data files are stored on the hard drive of the computer used for the IC data acquisition.
2.4 Hydrogen Ion Concentration pCH+ - Titration Experiments
The pH of the brine solutions was measured with a sealed Orion-Ross® combination glass electrode calibrated against NIST-certified pH buffers (3-point calibration).
In the brine titration experiments (Task 2, Subtask 1), adjustments of pH according to the desired pCH+ values were performed using 1 M NIST-traceable certified sodium hydroxide. The measured pH values were corrected using Equation (5) to obtain the corresponding pCH+ values. The correction factors used were based on the ionic strength calculated from the measured concentration of the brine components and the correction factors given in Figure 1.
2.5 Errors/Uncertainty
The majority of the errors for ICP-MS and IC analyses came from the serial dilution of the samples. The instruments/techniques themselves also have uncertainty associated with them. At the lower limit of quantitation also known as detection limit or background equivalent concentration, the error is roughly 100%. The upper limit of quantitation for both analyses is the highest level of calibration standards. Typically, the analytical uncertainty of the diluted samples, as analyzed, was < 1%. The overall precision and accuracy of both analyses were determined by having replicate samples and analyzing check standards throughout the analyses (every 10 samples analyzed). For ICP-MS an internal standard (indium) was used to account for variations in matrix effects. The replicate samples had percent relative standard deviation of less than 10% for most analytes but increased to over 100% near the lower limit of the instrument. The percent recovery for the check standards were within ±10%. Due to the high ionic strength, each sample was diluted at least 100-times and this operation contributed about 10% to the error in the ICP-MS and IC analyses.
The experimental error attributed to pipetting was approximately 1%. The pCH+ was measured with an uncertainty of ± 0.1 pH unit.
Page 19 of 50
WIPP Actinide-Relevant Brine Chemistry LCO-ACP-15, Rev.0
3. RESULTS AND DISCUSSION
The solution concentration data for all the ACRSP unused simulated brines and some selected brines used in ACRSP experiments are presented and discussed in section 3.1 and 3.2 respectively. Section 3.3 provides a summary of the measured solution concentration for the GWB brine titration experiments as a function of pCH+ and compares these results to the modeling predictions.
3.1 Stability of Unused Simulated Brines over Time (Task 1 Subtask 1)
Sixteen unused brines were analyzed by ICP-MS for elemental composition (mainly cations) and by IC for major anions. They were assigned unique sample identification numbers (SIN). The list of these brines is given in Appendix 2, Table A1. These brines were prepared over time, more than 5 years ago, and they were used as stocks for the ACRSP actinide solubility/redox studies. They were stored as prepared, at near-neutral pH, in sealed plastic bottles at room temperature in the dark.
The complete analytical results for each of the 16 brines, together with the calculated concentrations of the components (formulation), are given in the following four tables:
GWB simulated brine: Four brine preparations Table 3
ERDA-6 simulated brine: Four brine preparations Table 4
Simulated brines w/o borate: Two preparations Table 5
Simplified brines: Six preparations Table 6
There was no pattern of instability or precipitates noted in these stored stock solutions. This supports their use in the experiments and established the storage protocols as adequate. All the elements and species are within ±5% of the prepared concentrations except for batches GWB 0205 and ERDA 0205. In GWB 0205 and ERDA 0205, the analyzed concentrations for some of the elements and species are up to 20% higher than the target concentrations. These higher values are best explained as due to evaporation during the sampling or analyses but do not seem to reflect instability and precipitation in the brine solutions.
Page 20 of 50

WIPP Actinide-Relevant Brine Chemistry LCO-ACP-15, Rev.0
Table 3. Results of the determination of major components for GWB brines. All numbers listed in this table are metal and anion concentrations given in M.
Compo-nents
GWB-0107
GWB-0604
GWB-1105
GWB-0205 Average Standard
deviation Expected
formulation
Ca2+ 1.34E-02 1.32E-02 1.36E-02 1.31E-02 1.33E-02 2.22E-04 1.30E-02 st dev 3.06E-04 1.11E-04 1.17E-04 3.14E-04
K+ 4.25E-01 4.19E-01 4.64E-01 5.23E-01 4.58E-01 4.79E-02 4.38E-01 st dev 1.34E-02 1.83E-02 3.31E-03 7.11E-03
Li+ 3.92E-03 4.05E-03 5.14E-03 2.37E-03 3.87E-03 1.14E-03 4.10E-03 st dev 4.62E-05 4.54E-05 9.45E-05 2.18E-06
Mg2+ 9.28E-01 9.13E-01 9.94E-01 1.13E+00 9.91E-01 9.90E-02 9.53E-01 st dev 2.12E-02 3.50E-02 1.24E-02 8.55E-03
Na+ 3.35E+00 3.23E+00 3.27E+00 3.10E+00 3.24E+00 1.04E-01 3.31E+00 st dev 6.27E-02 1.36E-01 3.93E-02 4.27E-02
Cl- 5.26E+00 5.30E+00 5.51E+00 5.58E+00 5.41E+00 1.56E-01 5.25E+00 st dev 8.08E-02 1.07E-01 2.33E-02 5.84E-02
Br- 2.46E-02 2.59E-02 2.45E-02 2.57E-02 2.52E-02 7.27E-04 2.50E-02 st dev 4.65E-04 1.45E-03 6.01E-04 5.14E-04
SO42- 1.69E-01 1.71E-01 1.71E-01 2.00E-01
1.78E-01 1.49E-02 1.67E-01 st dev 1.62E-03 4.94E-03 3.10E-03 4.00E-03
B4O72- 3.74E-02 3.68E-02 4.02E-02 4.51E-02
3.99E-02 3.79E-03 3.70E-02 st dev 1.05E-03 1.61E-03 2.79E-04 5.81E-04
pCH+ 8.7 8.4 8.3 8.3 NA ND – not detected NA – not applicable
Page 21 of 50

WIPP Actinide-Relevant Brine Chemistry LCO-ACP-15, Rev.0
Table 4. Results of the determination of major components for ERDA-6 brines. All numbers listed in this table are metal and anion concentrations given in M.
Compo-nents
ERDA-0207
ERDA-0504
ERDA-1105
ERDA-0205
Average Standard deviation
Expected formulation
Ca2+ 1.11E-02 1.00E-02 1.16E-02 1.07E-02 1.09E-02 6.76E-04 1.14E-02 st dev 1.35E-04 1.60E-04 8.21E-05 6.74E-05
K+ 9.23E-02 9.56E-02 9.79E-02 1.24E-01 1.02E-01 1.45E-02 9.20E-02 st dev 1.35E-03 3.99E-03 1.13E-03 7.93E-04
Mg2+ 1.81E-02 1.83E-02 1.84E-02 2.57E-02 2.01E-02 3.72E-03 1.81E-02 st dev 3.68E-04 4.63E-04 1.74E-03 8.12E-05
Na+ 4.67E+00 4.75E+00 4.83E+00 5.00E+00 4.81E+00 1.41E-01 4.62E+00 st dev 2.07E-01 2.17E-01 1.45E-02 3.52E-02
Cl- 4.45E+00 4.49E+00 4.66E+00 4.94E+00 4.64E+00 2.23E-01 4.41E+00 st dev 3.62E-02 8.29E-02 1.90E-01 7.78E-03
Br- 1.02E-02 1.06E-02 9.88E-03 ND 1.02E-02 3.61E-04 1.00E-02 st dev 2.12E-04 4.49E-04 4.85E-04
SO42- 1.56E-01 1.64E-01 1.59E-01 1.85E-01
1.66E-01 1.31E-02 1.59E-01 st dev 1.63E-03 1.26E-03 6.20E-03
B4O72- 1.43E-02 1.55E-02 1.56E-02 1.60E-02
1.54E-02 7.33E-04 1.50E-02 st dev 1.04E-03 9.01E-04 2.34E-04 7.08E-05
pCH+ 8.3 8.8 8.8 8.7 NA ND – not detected NA – not applicable
Page 22 of 50
WIPP Actinide-Relevant Brine Chemistry LCO-ACP-15, Rev.0
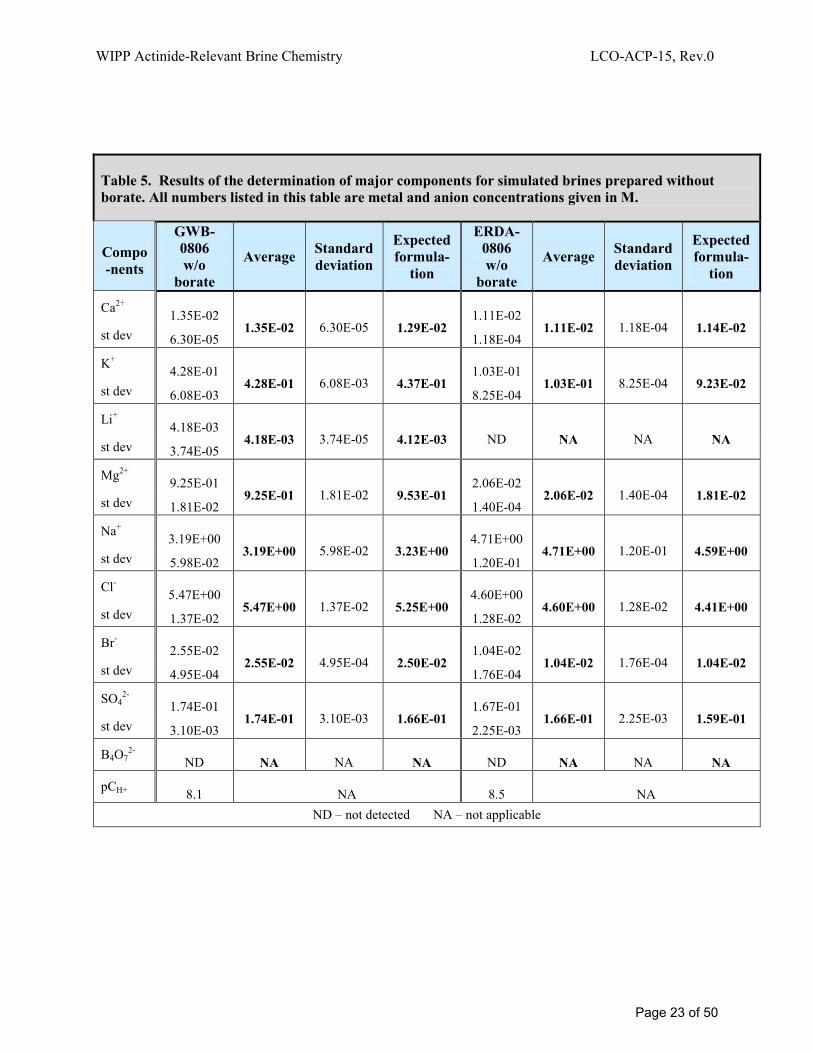
Table 5. Results of the determination of major components for simulated brines prepared without borate. All numbers listed in this table are metal and anion concentrations given in M.
Compo-nents
GWB-0806 w/o
borate
Average Standard deviation
Expected formula-
tion
ERDA-0806 w/o
borate
Average Standard deviation
Expected formula-
tion
Ca2+ 1.35E-02 1.35E-02 6.30E-05 1.29E-02
1.11E-02 1.11E-02 1.18E-04 1.14E-02 st dev 6.30E-05 1.18E-04
K+ 4.28E-01 4.28E-01 6.08E-03 4.37E-01
1.03E-01 1.03E-01 8.25E-04 9.23E-02 st dev 6.08E-03 8.25E-04
Li+ 4.18E-03 4.18E-03 3.74E-05 4.12E-03 ND NA NA NA st dev 3.74E-05
Mg2+ 9.25E-01 9.25E-01 1.81E-02 9.53E-01
2.06E-02 2.06E-02 1.40E-04 1.81E-02 st dev 1.81E-02 1.40E-04
Na+ 3.19E+00 3.19E+00 5.98E-02 3.23E+00
4.71E+00 4.71E+00 1.20E-01 4.59E+00 st dev 5.98E-02 1.20E-01
Cl- 5.47E+00 5.47E+00 1.37E-02 5.25E+00
4.60E+00 4.60E+00 1.28E-02 4.41E+00 st dev 1.37E-02 1.28E-02
Br- 2.55E-02 2.55E-02 4.95E-04 2.50E-02
1.04E-02 1.04E-02 1.76E-04 1.04E-02 st dev 4.95E-04 1.76E-04
SO42- 1.74E-01
1.74E-01 3.10E-03 1.66E-01 1.67E-01
1.66E-01 2.25E-03 1.59E-01 st dev 3.10E-03 2.25E-03
B4O72- ND NA NA NA ND NA NA NA
pCH+ 8.1 NA 8.5 NA ND – not detected NA – not applicable
Page 23 of 50
WIPP Actinide-Relevant Brine Chemistry LCO-ACP-15, Rev.0
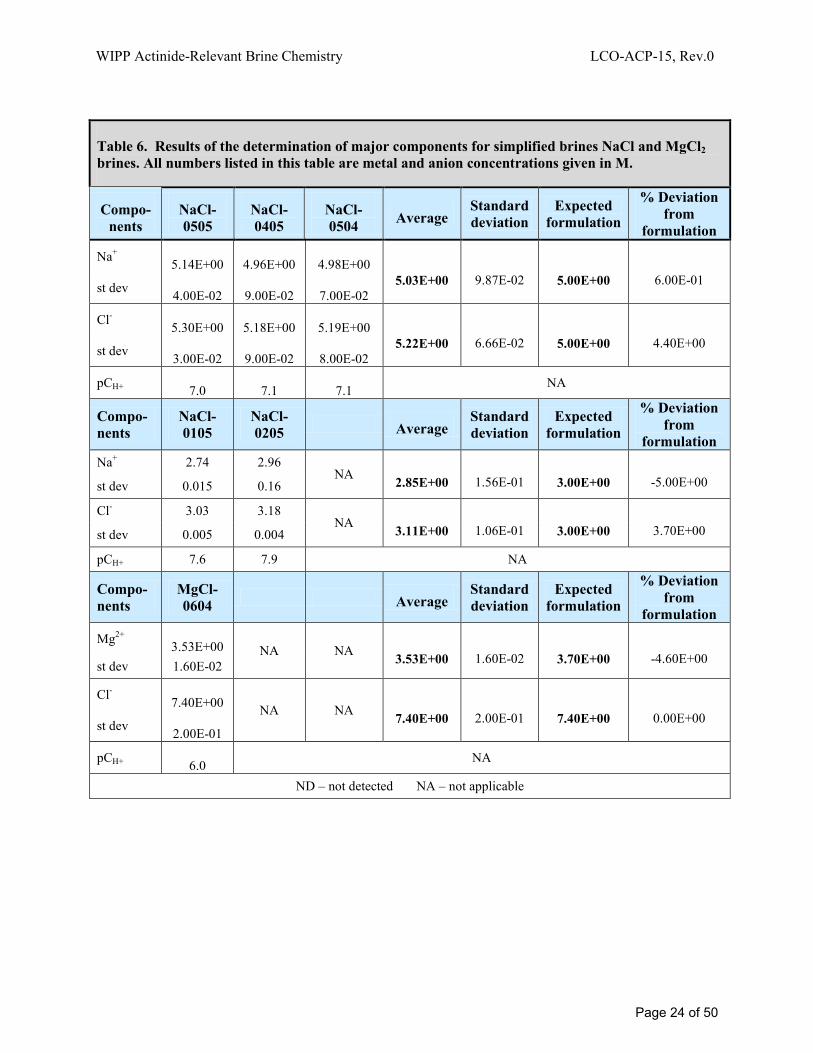
Table 6. Results of the determination of major components for simplified brines NaCl and MgCl2 brines. All numbers listed in this table are metal and anion concentrations given in M.
Compo-nents
NaCl-0505
NaCl-0405
NaCl-0504 Average
Standard deviation
Expected formulation
% Deviation from
formulation
Na+ 5.14E+00 4.96E+00 4.98E+00 5.03E+00 9.87E-02 5.00E+00 6.00E-01 st dev 4.00E-02 9.00E-02 7.00E-02
Cl- 5.30E+00 5.18E+00 5.19E+00 5.22E+00 6.66E-02 5.00E+00 4.40E+00 st dev 3.00E-02 9.00E-02 8.00E-02
pCH+ 7.0 7.1 7.1 NA
Compo-nents
NaCl-0105
NaCl-0205 Average
Standard deviation
Expected formulation
% Deviation from
formulation Na+ 2.74 2.96
NA 2.85E+00 1.56E-01 3.00E+00 -5.00E+00 st dev 0.015 0.16
Cl- 3.03 3.18 NA 3.11E+00 1.06E-01 3.00E+00 3.70E+00 st dev 0.005 0.004
pCH+ 7.6 7.9 NA
Compo-nents
MgCl-0604 Average
Standard deviation
Expected formulation
% Deviation from
formulation Mg2+ 3.53E+00 NA NA 3.53E+00 1.60E-02 3.70E+00 -4.60E+00 st dev 1.60E-02
Cl- 7.40E+00 NA NA 7.40E+00 2.00E-01 7.40E+00 0.00E+00 st dev 2.00E-01
pCH+ 6.0 NA
ND – not detected NA – not applicable
Page 24 of 50
WIPP Actinide-Relevant Brine Chemistry LCO-ACP-15, Rev.0
3.2 Stability of Brines Used in ACRSP Solubility and Redox Experiments (Task 1 Subtask 2)
The compositions of selected brines that were used in various ACRSP solubility and redox experiments were analyzed to evaluate their overall stability and establish trends of changes in brine composition where they exist. These experiments were performed under existing Test Plans: “Solubility/Stability of Uranium (VI) in WIPP Brines” (LCO-ACP-02), “Solubility of Neodymium (III) in WIPP Brines” (LCO-ACP-03), and “Plutonium (VI) Reduction by Iron: Limited-Scope Confirmatory Study” (LCO-ACP-04). The results and related discussion are presented in the next three sections.
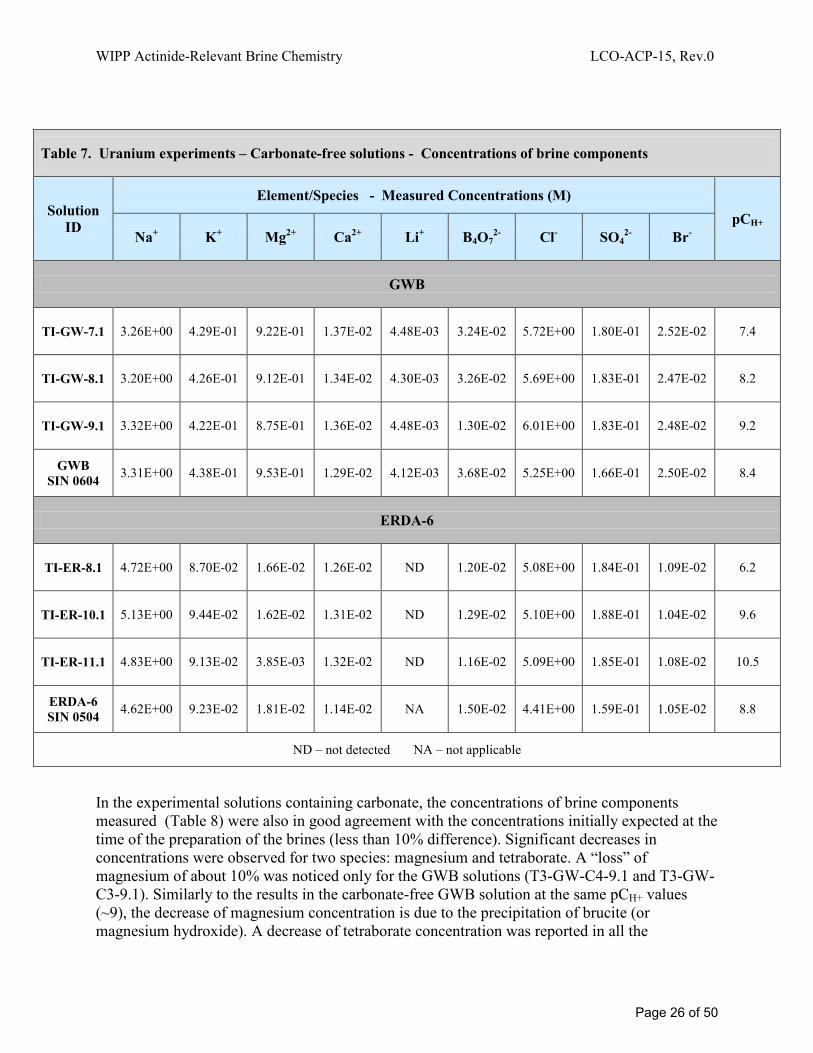
3.2.1 Uranium Experiments The concentrations of the brine components were measured for six carbonate-free uranium solutions and four uranium solutions containing carbonate. The ages of the solutions at the time of the sampling for analyses were 1973 days and 1723 days for the carbonate-free uranium solutions and the uranium solutions containing carbonate, respectively. Details on the experiments in the carbonate-free systems can be found in the LCO-ACP-10 report, “Actinide (VI) Solubility in Carbonate-free WIPP Brine: Data Summary and Recommendations” [Lucchini 2010]. Details on the experiments in the systems containing carbonate can be found in the LCO-ACP-02 test plan.
Each solution had two samples, and each sample was analyzed three times by ICP-MS and two times by IC. The results are presented in Table 7 for the selected carbonate-free solutions and in Table 8 for the uranium solutions containing carbonate. The results are an average of all the measurements performed on duplicated samples and triplicate/duplicate analyses. For each species or element, the measured concentrations presented in the tables are tabulated against the concentrations obtained during the preparation of the original brine used to make the solution.
The concentrations of brine components measured in the experimental carbonate-free solutions (Table 7) were in good agreement with the concentrations initially expected at the time of the preparation of the brines (within 10% difference). This means that the composition of the brines didn’t change significantly over the 1973 days for all of the solutions analyzed, but two. A significant “loss” of magnesium in the solutions was noticed for the solutions TI-GW-9.1 and TI-ER-11.1 (respectively ~9% and ~80%). This result is consistent with the precipitation of brucite (or magnesium hydroxide) at high pCH+. We also noticed a ~35% decrease in boron concentration in TI-GW-9.1. Titration of the brines from pCH+ 9 to 11 also gave evidence of decreasing tetraborate when pCH+ increases.
Page 25 of 50
WIPP Actinide-Relevant Brine Chemistry LCO-ACP-15, Rev.0
In the experimental solutions containing carbonate, the concentrations of brine components measured (Table 8) were also in good agreement with the concentrations initially expected at the time of the preparation of the brines (less than 10% difference). Significant decreases in concentrations were observed for two species: magnesium and tetraborate. A “loss” of magnesium of about 10% was noticed only for the GWB solutions (T3-GW-C4-9.1 and T3-GW-C3-9.1). Similarly to the results in the carbonate-free GWB solution at the same pCH+ values (~9), the decrease of magnesium concentration is due to the precipitation of brucite (or magnesium hydroxide). A decrease of tetraborate concentration was reported in all the
Table 7. Uranium experiments – Carbonate-free solutions - Concentrations of brine components
Solution ID
Element/Species - Measured Concentrations (M) pCH+
Na+ K+ Mg2+ Ca2+ Li+ B4O72- Cl- SO4
2- Br-
GWB
TI-GW-7.1 3.26E+00 4.29E-01 9.22E-01 1.37E-02 4.48E-03 3.24E-02 5.72E+00 1.80E-01 2.52E-02 7.4
TI-GW-8.1 3.20E+00 4.26E-01 9.12E-01 1.34E-02 4.30E-03 3.26E-02 5.69E+00 1.83E-01 2.47E-02 8.2
TI-GW-9.1 3.32E+00 4.22E-01 8.75E-01 1.36E-02 4.48E-03 1.30E-02 6.01E+00 1.83E-01 2.48E-02 9.2
GWB SIN 0604 3.31E+00 4.38E-01 9.53E-01 1.29E-02 4.12E-03 3.68E-02 5.25E+00 1.66E-01 2.50E-02 8.4
ERDA-6
TI-ER-8.1 4.72E+00 8.70E-02 1.66E-02 1.26E-02 ND 1.20E-02 5.08E+00 1.84E-01 1.09E-02 6.2
TI-ER-10.1 5.13E+00 9.44E-02 1.62E-02 1.31E-02 ND 1.29E-02 5.10E+00 1.88E-01 1.04E-02 9.6
TI-ER-11.1 4.83E+00 9.13E-02 3.85E-03 1.32E-02 ND 1.16E-02 5.09E+00 1.85E-01 1.08E-02 10.5
ERDA-6 SIN 0504 4.62E+00 9.23E-02 1.81E-02 1.14E-02 NA 1.50E-02 4.41E+00 1.59E-01 1.05E-02 8.8
ND – not detected NA – not applicable
Page 26 of 50
WIPP Actinide-Relevant Brine Chemistry LCO-ACP-15, Rev.0
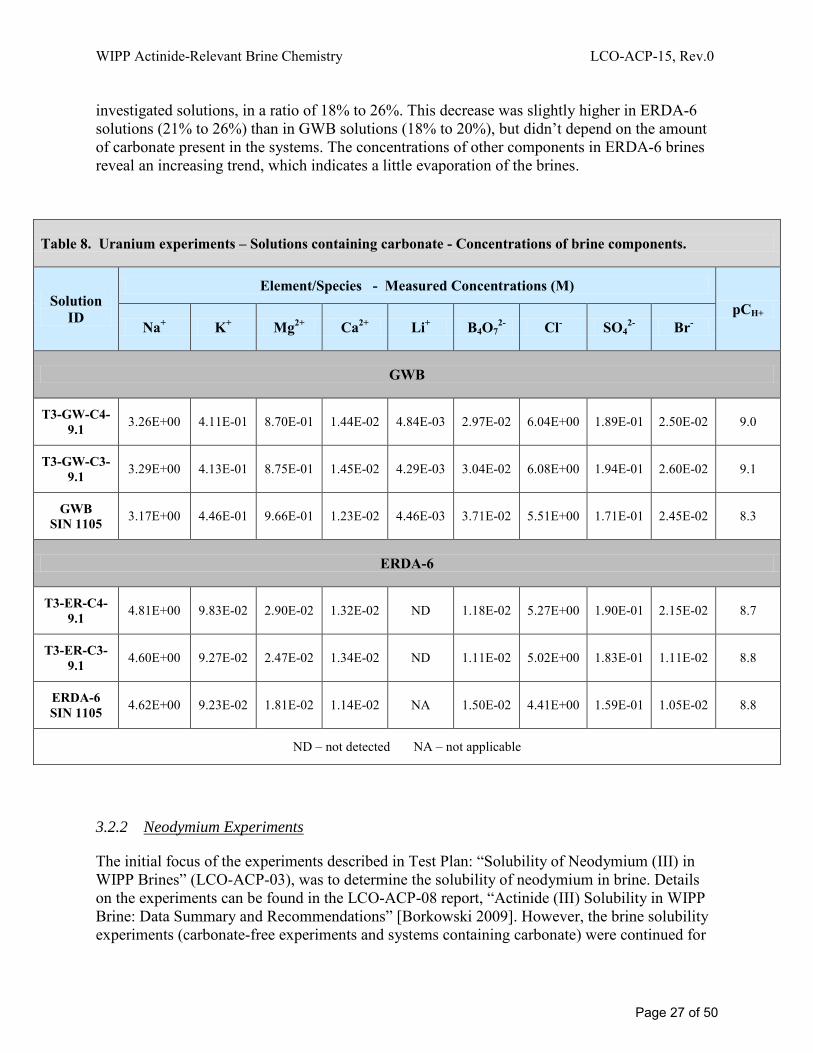
investigated solutions, in a ratio of 18% to 26%. This decrease was slightly higher in ERDA-6 solutions (21% to 26%) than in GWB solutions (18% to 20%), but didn’t depend on the amount of carbonate present in the systems. The concentrations of other components in ERDA-6 brines reveal an increasing trend, which indicates a little evaporation of the brines.
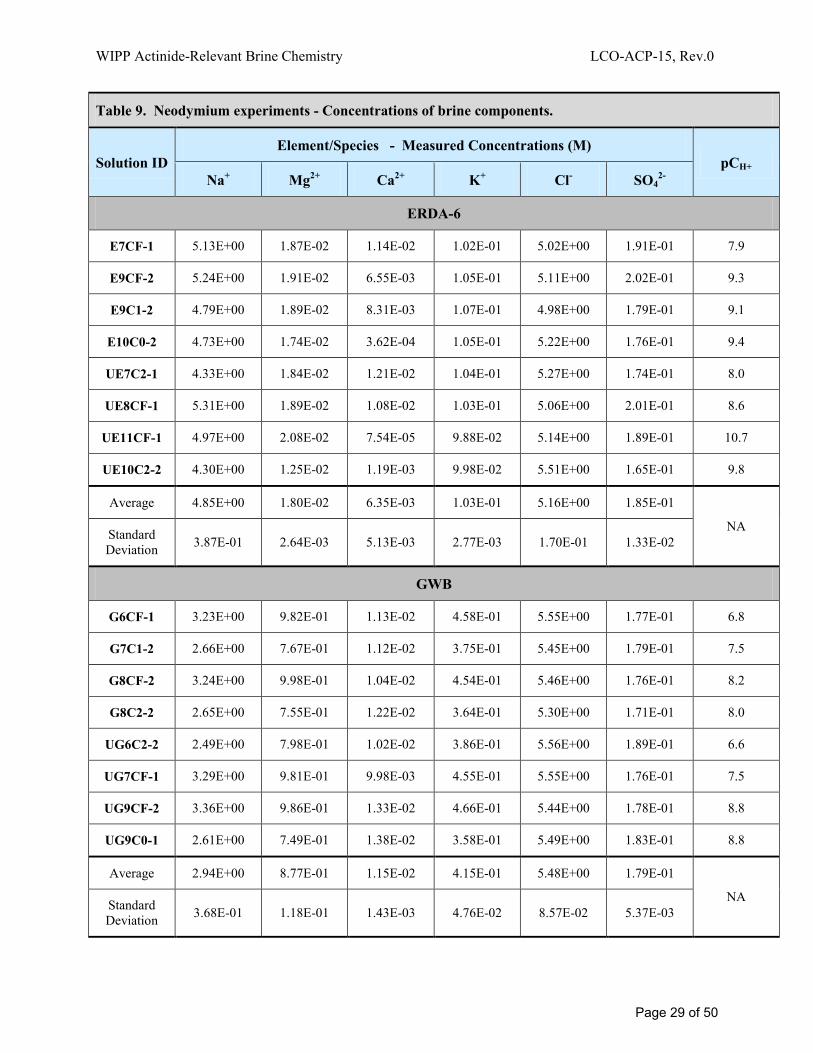
3.2.2 Neodymium Experiments
The initial focus of the experiments described in Test Plan: “Solubility of Neodymium (III) in WIPP Brines” (LCO-ACP-03), was to determine the solubility of neodymium in brine. Details on the experiments can be found in the LCO-ACP-08 report, “Actinide (III) Solubility in WIPP Brine: Data Summary and Recommendations” [Borkowski 2009]. However, the brine solubility experiments (carbonate-free experiments and systems containing carbonate) were continued for
Table 8. Uranium experiments – Solutions containing carbonate - Concentrations of brine components.
Solution ID
Element/Species - Measured Concentrations (M) pCH+
Na+ K+ Mg2+ Ca2+ Li+ B4O72- Cl- SO4
2- Br-
GWB
T3-GW-C4-9.1 3.26E+00 4.11E-01 8.70E-01 1.44E-02 4.84E-03 2.97E-02 6.04E+00 1.89E-01 2.50E-02 9.0
T3-GW-C3-9.1 3.29E+00 4.13E-01 8.75E-01 1.45E-02 4.29E-03 3.04E-02 6.08E+00 1.94E-01 2.60E-02 9.1
GWB SIN 1105 3.17E+00 4.46E-01 9.66E-01 1.23E-02 4.46E-03 3.71E-02 5.51E+00 1.71E-01 2.45E-02 8.3
ERDA-6
T3-ER-C4-9.1 4.81E+00 9.83E-02 2.90E-02 1.32E-02 ND 1.18E-02 5.27E+00 1.90E-01 2.15E-02 8.7
T3-ER-C3-9.1 4.60E+00 9.27E-02 2.47E-02 1.34E-02 ND 1.11E-02 5.02E+00 1.83E-01 1.11E-02 8.8
ERDA-6 SIN 1105 4.62E+00 9.23E-02 1.81E-02 1.14E-02 NA 1.50E-02 4.41E+00 1.59E-01 1.05E-02 8.8
ND – not detected NA – not applicable
Page 27 of 50

WIPP Actinide-Relevant Brine Chemistry LCO-ACP-15, Rev.0
5-6 years and are included in this study. The brine solutions used in the neodymium solubility experiments that were analyzed are in Table A4 in Appendix 2, and the data are reported in Table 9. The reported results are complementary to the results measured in unused batches of brines.
Results for ERDA-6
The concentrations of the major ions: sodium and chloride were stable. Changes observed in sample UE10C2-2 are very difficult to explain. In this sample the cation concentrations were the lowest while the chloride concentration was the greatest. The differences have not been significant, but they indicate analytical difficulty, and the results for this sample were excluded from the average calculations. The concentrations of magnesium, potassium and sulfate were very stable. Measured calcium concentration was lower at the high carbonate concentration and high pH which could be expected. In general the ERDA-6 brine was stable and its composition was not affected by carbonate, pH and time. Marginal calcium changes were caused by carbonate and high pH, and such behavior was expected.
Results for GWB
Changes in relative composition in GWB brine were very consistent, i.e. when sodium concentration was slightly lower the concentrations of other metals were also lower. Changes in overall metal concentrations were about ±13% and can be described as stable and independent on pH, carbonate presence and time. Small changes in metal concentrations can be explained in terms of partial water evaporation. Concentrations of anions were very stable and the changes were lower than 3%. Concentrations of chlorides and sulfates were in very good agreement with the initial brine composition.
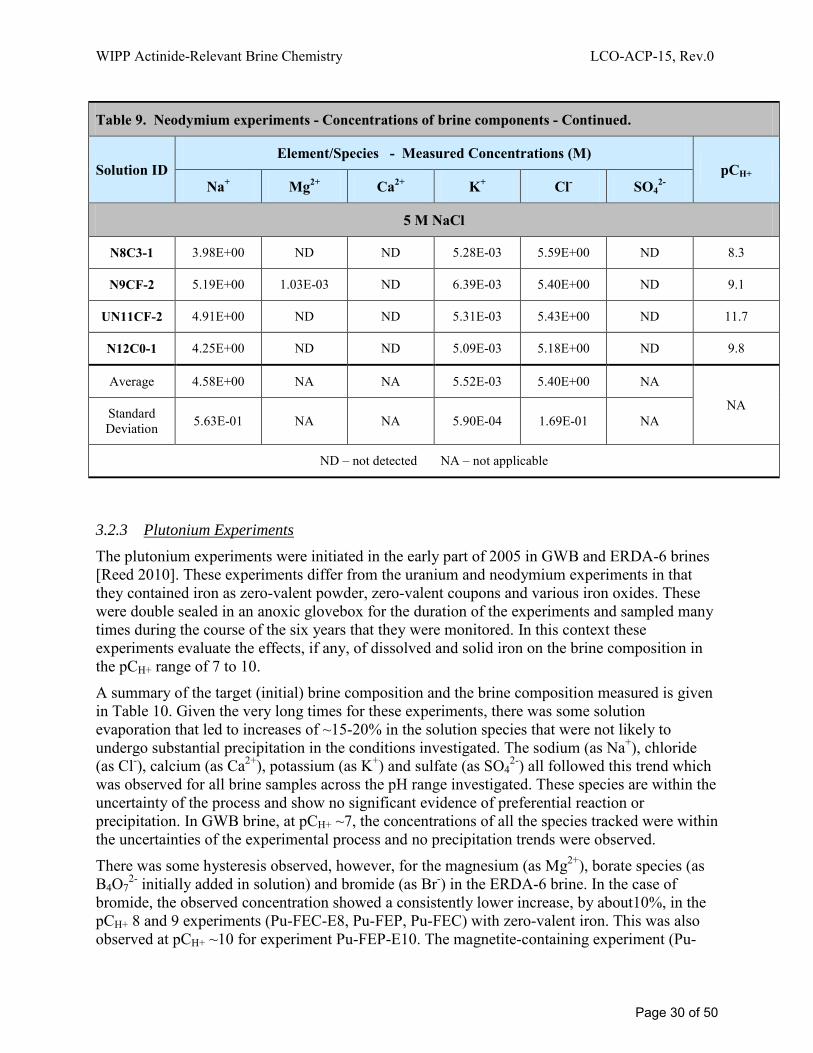
Results for NaCl simplified brine
The sodium chloride simplified brine was not expected to change. Sodium concentrations in samples N8C3-1 and N12C0-1 were lower than expected in this kind of analysis. Analysis of solutes at high concentration required significant dilution up to million times, therefore precision ranging 10-15% was assumed as good. In the two samples mentioned above this limit was exceeded. Chloride concentrations in all the samples were greater than expected but within the error limit. In 5 M NaCl samples only potassium in the amount of about 0.1% of sodium concentration was measured and no other cations were found. In samples N8C3-1 and N12C0-1 charge was not balanced indicating an analytical problem. For two other samples no changes in the 5 M NaCl simplified brine were observed.
Page 28 of 50
WIPP Actinide-Relevant Brine Chemistry LCO-ACP-15, Rev.0
Table 9. Neodymium experiments - Concentrations of brine components.
Solution ID Element/Species - Measured Concentrations (M)
pCH+ Na+ Mg2+ Ca2+ K+ Cl- SO4
2-
ERDA-6
E7CF-1 5.13E+00 1.87E-02 1.14E-02 1.02E-01 5.02E+00 1.91E-01 7.9
E9CF-2 5.24E+00 1.91E-02 6.55E-03 1.05E-01 5.11E+00 2.02E-01 9.3
E9C1-2 4.79E+00 1.89E-02 8.31E-03 1.07E-01 4.98E+00 1.79E-01 9.1
E10C0-2 4.73E+00 1.74E-02 3.62E-04 1.05E-01 5.22E+00 1.76E-01 9.4
UE7C2-1 4.33E+00 1.84E-02 1.21E-02 1.04E-01 5.27E+00 1.74E-01 8.0
UE8CF-1 5.31E+00 1.89E-02 1.08E-02 1.03E-01 5.06E+00 2.01E-01 8.6
UE11CF-1 4.97E+00 2.08E-02 7.54E-05 9.88E-02 5.14E+00 1.89E-01 10.7
UE10C2-2 4.30E+00 1.25E-02 1.19E-03 9.98E-02 5.51E+00 1.65E-01 9.8
Average 4.85E+00 1.80E-02 6.35E-03 1.03E-01 5.16E+00 1.85E-01
NA Standard Deviation 3.87E-01 2.64E-03 5.13E-03 2.77E-03 1.70E-01 1.33E-02
GWB
G6CF-1 3.23E+00 9.82E-01 1.13E-02 4.58E-01 5.55E+00 1.77E-01 6.8
G7C1-2 2.66E+00 7.67E-01 1.12E-02 3.75E-01 5.45E+00 1.79E-01 7.5
G8CF-2 3.24E+00 9.98E-01 1.04E-02 4.54E-01 5.46E+00 1.76E-01 8.2
G8C2-2 2.65E+00 7.55E-01 1.22E-02 3.64E-01 5.30E+00 1.71E-01 8.0
UG6C2-2 2.49E+00 7.98E-01 1.02E-02 3.86E-01 5.56E+00 1.89E-01 6.6
UG7CF-1 3.29E+00 9.81E-01 9.98E-03 4.55E-01 5.55E+00 1.76E-01 7.5
UG9CF-2 3.36E+00 9.86E-01 1.33E-02 4.66E-01 5.44E+00 1.78E-01 8.8
UG9C0-1 2.61E+00 7.49E-01 1.38E-02 3.58E-01 5.49E+00 1.83E-01 8.8
Average 2.94E+00 8.77E-01 1.15E-02 4.15E-01 5.48E+00 1.79E-01
NA Standard Deviation 3.68E-01 1.18E-01 1.43E-03 4.76E-02 8.57E-02 5.37E-03
Page 29 of 50
WIPP Actinide-Relevant Brine Chemistry LCO-ACP-15, Rev.0
3.2.3 Plutonium Experiments The plutonium experiments were initiated in the early part of 2005 in GWB and ERDA-6 brines [Reed 2010]. These experiments differ from the uranium and neodymium experiments in that they contained iron as zero-valent powder, zero-valent coupons and various iron oxides. These were double sealed in an anoxic glovebox for the duration of the experiments and sampled many times during the course of the six years that they were monitored. In this context these experiments evaluate the effects, if any, of dissolved and solid iron on the brine composition in the pCH+ range of 7 to 10.
A summary of the target (initial) brine composition and the brine composition measured is given in Table 10. Given the very long times for these experiments, there was some solution evaporation that led to increases of ~15-20% in the solution species that were not likely to undergo substantial precipitation in the conditions investigated. The sodium (as Na+), chloride (as Cl-), calcium (as Ca2+), potassium (as K+) and sulfate (as SO4
2-) all followed this trend which was observed for all brine samples across the pH range investigated. These species are within the uncertainty of the process and show no significant evidence of preferential reaction or precipitation. In GWB brine, at pCH+ ~7, the concentrations of all the species tracked were within the uncertainties of the experimental process and no precipitation trends were observed.
There was some hysteresis observed, however, for the magnesium (as Mg2+), borate species (as B4O7
2- initially added in solution) and bromide (as Br-) in the ERDA-6 brine. In the case of bromide, the observed concentration showed a consistently lower increase, by about10%, in the pCH+ 8 and 9 experiments (Pu-FEC-E8, Pu-FEP, Pu-FEC) with zero-valent iron. This was also observed at pCH+ ~10 for experiment Pu-FEP-E10. The magnetite-containing experiment (Pu-
Table 9. Neodymium experiments - Concentrations of brine components - Continued.
Solution ID Element/Species - Measured Concentrations (M)
pCH+ Na+ Mg2+ Ca2+ K+ Cl- SO4
2-
5 M NaCl
N8C3-1 3.98E+00 ND ND 5.28E-03 5.59E+00 ND 8.3
N9CF-2 5.19E+00 1.03E-03 ND 6.39E-03 5.40E+00 ND 9.1
UN11CF-2 4.91E+00 ND ND 5.31E-03 5.43E+00 ND 11.7
N12C0-1 4.25E+00 ND ND 5.09E-03 5.18E+00 ND 9.8
Average 4.58E+00 NA NA 5.52E-03 5.40E+00 NA
NA Standard Deviation 5.63E-01 NA NA 5.90E-04 1.69E-01 NA
ND – not detected NA – not applicable
Page 30 of 50
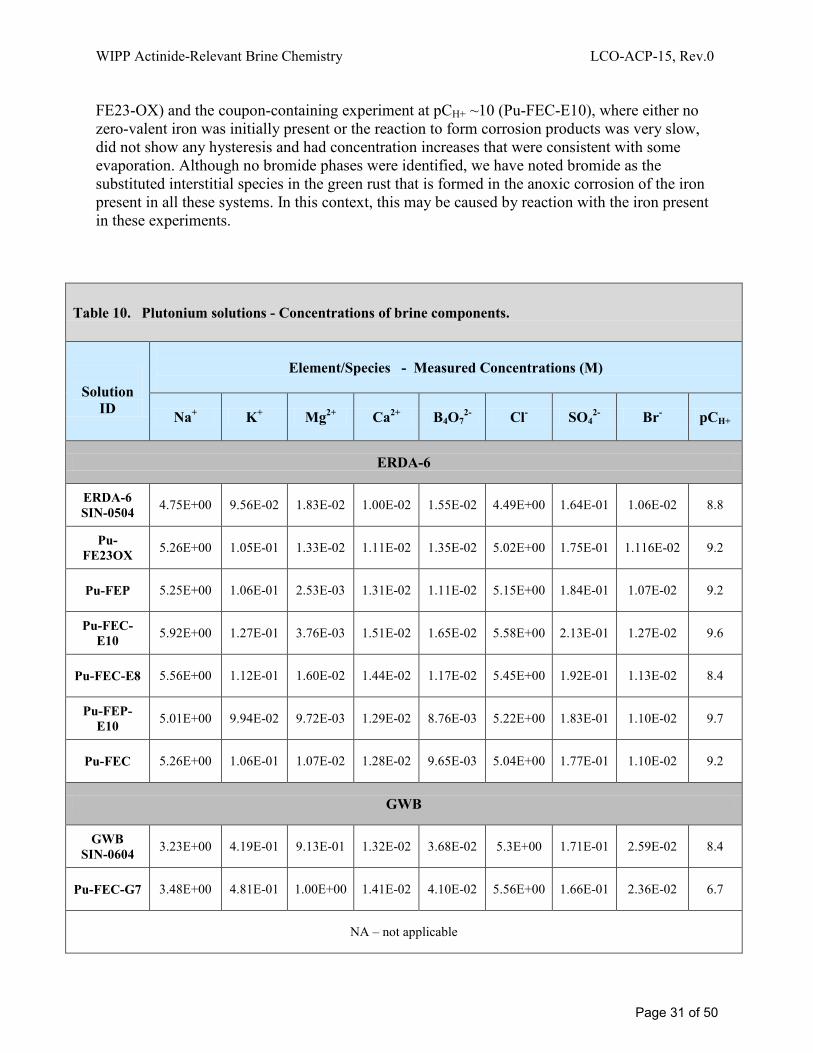
WIPP Actinide-Relevant Brine Chemistry LCO-ACP-15, Rev.0
FE23-OX) and the coupon-containing experiment at pCH+ ~10 (Pu-FEC-E10), where either no zero-valent iron was initially present or the reaction to form corrosion products was very slow, did not show any hysteresis and had concentration increases that were consistent with some evaporation. Although no bromide phases were identified, we have noted bromide as the substituted interstitial species in the green rust that is formed in the anoxic corrosion of the iron present in all these systems. In this context, this may be caused by reaction with the iron present in these experiments.
Table 10. Plutonium solutions - Concentrations of brine components.
Solution
ID
Element/Species - Measured Concentrations (M)
Na+ K+ Mg2+ Ca2+ B4O72- Cl- SO4
2- Br- pCH+
ERDA-6
ERDA-6 SIN-0504 4.75E+00 9.56E-02 1.83E-02 1.00E-02 1.55E-02 4.49E+00 1.64E-01 1.06E-02 8.8
Pu-FE23OX 5.26E+00 1.05E-01 1.33E-02 1.11E-02 1.35E-02 5.02E+00 1.75E-01 1.116E-02 9.2
Pu-FEP 5.25E+00 1.06E-01 2.53E-03 1.31E-02 1.11E-02 5.15E+00 1.84E-01 1.07E-02 9.2
Pu-FEC-E10 5.92E+00 1.27E-01 3.76E-03 1.51E-02 1.65E-02 5.58E+00 2.13E-01 1.27E-02 9.6
Pu-FEC-E8 5.56E+00 1.12E-01 1.60E-02 1.44E-02 1.17E-02 5.45E+00 1.92E-01 1.13E-02 8.4
Pu-FEP-E10 5.01E+00 9.94E-02 9.72E-03 1.29E-02 8.76E-03 5.22E+00 1.83E-01 1.10E-02 9.7
Pu-FEC 5.26E+00 1.06E-01 1.07E-02 1.28E-02 9.65E-03 5.04E+00 1.77E-01 1.10E-02 9.2
GWB
GWB SIN-0604 3.23E+00 4.19E-01 9.13E-01 1.32E-02 3.68E-02 5.3E+00 1.71E-01 2.59E-02 8.4
Pu-FEC-G7 3.48E+00 4.81E-01 1.00E+00 1.41E-02 4.10E-02 5.56E+00 1.66E-01 2.36E-02 6.7
NA – not applicable
Page 31 of 50
WIPP Actinide-Relevant Brine Chemistry LCO-ACP-15, Rev.0
The concentration of borate in the ERDA-6 experiments, as a general rule, was lower than the initial concentration even though some evaporation had occurred. This was as high as 50% lower, but typically ~25%. This can only be explained as precipitation of borate containing phases in these experiments. Similar, although less extensive, precipitation was observed in the uranium and neodymium experiment and there is a clear decrease of borate with increasing pH in all these experiments. Although the formation of iron-borate phases leading to enhanced borate precipitation cannot be excluded, the observed trends seem to link most closely with the increases in pH.
The concentration of magnesium, as expected, is also decreasing with pCH+ in the plutonium-iron experiments. At pCH+ ~8, a ~20% lower magnesium concentration is noted. This is as high as an 80% decrease in the higher pH experiments. This is also mostly explained as a pH trend that is not related to the iron present in these experiments.
3.3 Composition of GWB Brine as a Function of pCH+ (Task 2 Subtask 1)
The brine pH is a very critical parameter in defining the solubility of actinides under conditions where brine-mediated releases (direct brine release and transport through the Culebra) would be important in the WIPP. The brine pH is established by a number of highly coupled processes that will occur when the emplaced waste is inundated with brine. Concentration of hydroxyl ions is also very important for brine chemistry. The two components of brine that are most sensitive to pH and tend to be limited by hydroxide phases are magnesium and calcium. Magnesium hydroxide is only slightly soluble and its precipitation was always observed in actinide and actinide analogs solubility experiments when pH adjustments were made at high pH [Borkowski 2009, Lucchini 2010, Reed 2010]. For these reasons, pH titration experiments were performed to better establish the connectivity between the two bracketing brines used (GWB and ERDA-6) as well as provide a basis for pH-specific brine compositions for solubility studies.
3.3.1 Results of GWB Full Strength Titration and Comparison with Model
The brine-component concentrations obtained during the titration of full strength GWB brine (100% saturated composition) from pCH+ ~8.5 to 12, after a minimum of 3 weeks equilibration, are reported in this section. These experimental results are compared with those obtained by model calculations using the geochemical software package EQ3/6, version 8.0a, and reported by SNL [Brush 2011].
The concentrations of brine components measured experimentally for GWB 100% saturated brine titration, and the concentrations expected in the brine solution based on calculations by Brush, are shown versus pCH+ in the three graphs below: Na+, K+, Ca2+ and Li+ in Figure 3, Cl-, SO4
2- and Br- in Figure 4, and tetraborate and Mg2+ in Figure 5. All the numerical values corresponding to the experimental data points in these three figures are reported in Appendix 1.
Page 32 of 50
WIPP Actinide-Relevant Brine Chemistry LCO-ACP-15, Rev.0
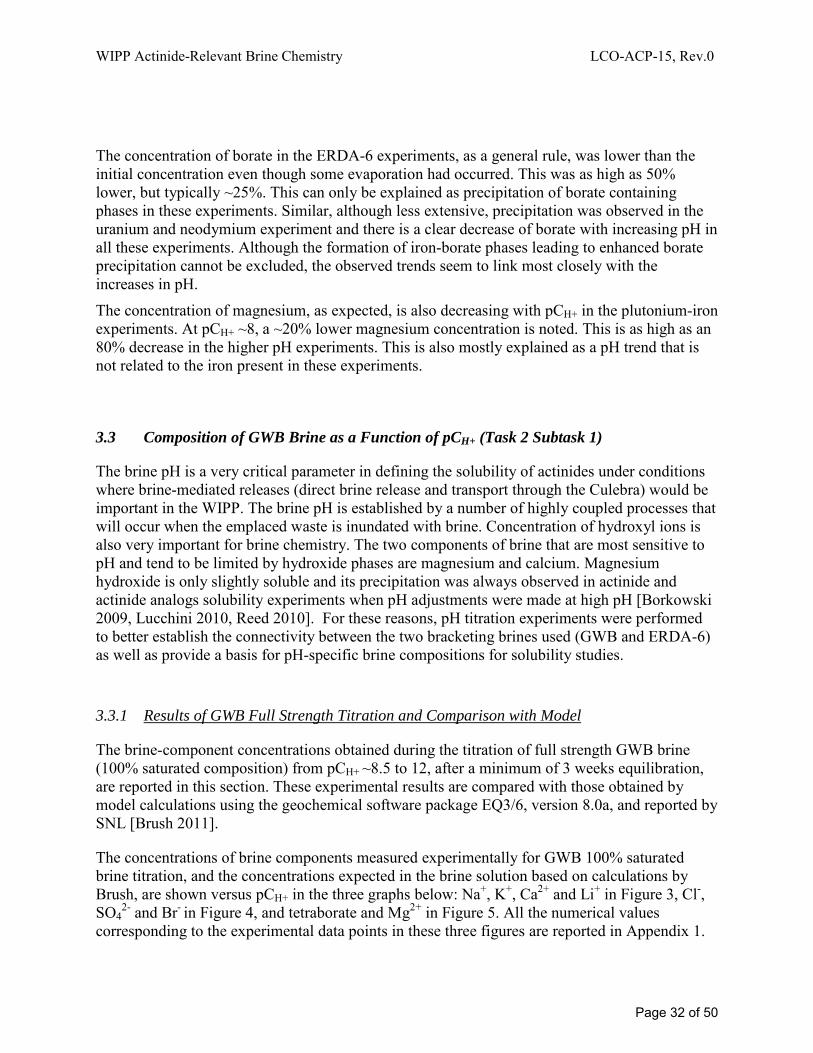
Figure 3. Concentrations of Na+, K+, Ca2+ and Li+ in GWB 100% saturated brine (respectively from the top to the bottom of the graph) as a function of pCH+. Blue square symbols represent data measured experimentally by titration of the brine stepwise [this work]. Red triangular symbols are data obtained by modeling [Brush 2011]. Li+ was not considered in the numerical simulation.
The concentrations of K+, Li+, Cl-, SO42- and Br- were stable across the pCH+ range investigated,
as expected. These ions were not affected by the increase of hydroxide ion in the systems when the pCH+ increased. A small increase of Na+ was observed between pCH+ ~9.5 and 10.5, due to the addition of sodium hydroxide to the brines. This effect was captured by experiments and modeling. As a matter of fact, excellent agreement was found between the experimental and the modeling data for most of the brine components: Na+, K+, Cl-, SO4
2- and Br-. Li+ data could not be compared with calculated values, since this cation is not included in the WIPP model. It should be noted that the conditions for model calculations and the conditions of the experimental titration were slightly different. In the calculations, the presence of some solids (MgO, halite,
7 8 9 10 11 12 131E-3
0.01
0.1
1
Li+
Ca2+
K+
[C
atio
n] (M
)
pCH+
experimental modeling
Na+
Page 33 of 50

WIPP Actinide-Relevant Brine Chemistry LCO-ACP-15, Rev.0
anhydrite, etc.) and key organic ligands (EDTA, citrate, oxalate, acetate) was considered, as well as a constant fugacity of CO2. According to the experimental results, the effect of these solids and organics on the brine composition is not significant.
Figure 4. Concentrations of Cl-, SO42-, and Br- in GWB 100% saturated brine
(respectively from the top to the bottom of the graph) as a function of pCH+. Blue square symbols represent data measured experimentally by titration of the brine stepwise [this work]. Red triangular symbols are data obtained by modeling [Brush 2011].
Data on Ca2+, Mg2+ and tetraborate showed a different trend between experiment and modeling. In the experimental work, the concentration of Ca2+ was constant at about 10-2 M until pCH+ ~10.5, and then dropped down as the pCH+ increased (Figure 3). At pCH+ ~13, the concentration of Ca2+ measured in the brine solution was down to ~10-3 M. This one order of magnitude decrease of Ca2+ at high pCH+ was not reproduced by modeling calculations. The modeling data show stable concentrations of Ca2+ across the pCH+ region investigated, with the exception of a small increase occurring between pCH+ 9 and 11. In this range of pCH+, the WIPP model predicts Ca2+concentration to increase from ~8.5×10⁻³ M to ~2×10⁻² M.
7 8 9 10 11 12 130.01
0.1
1
10
Br-
SO2-4
[A
nion
] (M
)
pCH+
experimental modeling
Cl-
Page 34 of 50
WIPP Actinide-Relevant Brine Chemistry LCO-ACP-15, Rev.0
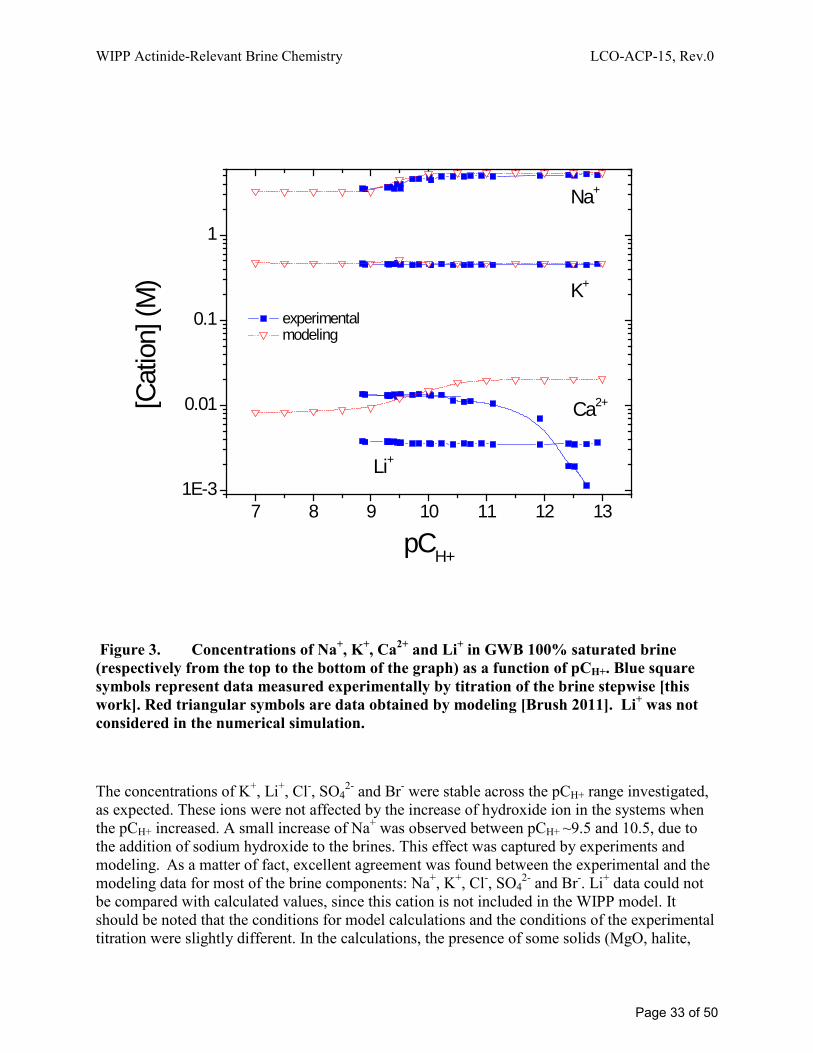
Figure 5. Concentrations of tetraborate and Mg2+in GWB 100% saturated brine as a function of pCH+. Blue square symbols and green round symbols represent data on Mg2+ and tetraborate respectively that were measured experimentally by titration of the brine stepwise [this work]. Red triangular symbols and pink star symbols are data on Mg2+ and tetraborate respectively that were obtained by modeling [Brush 2011].
There are mainly two reasons for the discrepancies in the Ca2+concentration observed between the experimental data and the modeling data. First, the decrease of Ca2+concentration experimentally observed at high pCH+ was likely caused by calcium carbonate precipitation. The solubility of calcium hydroxide Ca(OH)2 (log KSP = -5.29 at 25°C) is greater than the solubility of calcium carbonate CaCO3 (log KSP = -8.48 at 25°C) [NIST 2004]. Therefore, carbonate precipitation preferably occurs. In our experiments, carbonate in solution was constantly in equilibrium with carbon dioxide in air, since the experiments were performed on the bench top. Also, some carbonate was added by the sodium hydroxide that was added to the brines in the pH titration. Overall, the brine solutions of our titration experiments may have contained more carbonate than the amount predicted by the model at constant CO2 fugacity (log fCO2 = -5.5, which correspond to about 4×10⁻⁴ M carbonate in solution) [CRA-2009 Appendix SOTERM]. Therefore, carbonate precipitation of Ca2+ likely started at the early stage of the titration. It is
7 8 9 10 11 12 131E-7
1E-6
1E-5
1E-4
1E-3
0.01
0.1
1
10
Mg2+
Tetraborate
[Mg2+
] or [
Tetra
bora
te] (
M)
pCH+
Mg2+ - experimental Mg2+ - modeling Tetraborate - experimental Tetraborate - modeling
Page 35 of 50
WIPP Actinide-Relevant Brine Chemistry LCO-ACP-15, Rev.0
also possible that at very high pCH+ (~13) hydroxide precipitation of Ca2+ could compete with carbonate precipitation.
Second, unlike in the modeling calculations, there was a limited source of Ca2+ in the experiments, and a possible greater concentration of carbonate. The model calculations took into consideration an unlimited source of Ca2+ from the presence of Ca2+ rich rocks (e.g. anhydrite). This could explain the small increase of Ca2+concentration predicted by modeling, and counterbalance carbonate precipitation of Ca2+ that were observed in the experiments. Despite the differences observed between experimental titration and model calculations, calcium concentrations determined by the experiments and the calculations were in good agreement for the pCH+ range expected in the WIPP.
Besides Ca2+, the two other ions with observed concentration changes were Mg2+ and tetraborate. Concerning Mg2+, the experimental results established that the Mg2+ concentration linearly decreased from ~1 M to ~10-2 M when pCH+ increased from 9.5 to ~11 (Figure 5). In the same range of pCH+, the concentration of tetraborate, initially at ~4×10⁻² M at pCH+ ~9, went down to ~2×10⁻³ M at pCH+ between 10 and 10.5, and then back up to the initial value of ~4×10⁻² M. At pCH+ ≥ 11, tetraborate and Mg2+ concentrations were then stable. This persisting concentration of Mg2+ at high pCH+ was not captured by the WIPP model, neither was the tetraborate trend across the pCH+ range investigated. Modeling predicted a steady decrease of Mg2+ concentration from pCH+ ~9 and up, due to precipitation of brucite, Mg(OH)2. Similar trend was observed in Altmaier’s experiments in low MgCl2 concentration systems at pCH+ > 9 [Altmaier 2003]. Modeling calculations by Brush didn’t predict any changes in borate concentrations as a function of pCH+, because there is no Pitzer parameter for borate in the model [Brush 2011].
The concentration trends observed in the experiments for tetraborate and Mg2+ are shown on the same graph (Figure 5), because their precipitation behavior appears to be correlated. When pCH+ increased from 9 to 10-10.5, Mg2+ precipitated, more likely as hydromagnesite phase 5, Mg5(CO3)4(OH)2.4H2O, and brucite (as predicted by the WIPP model [Brush 2011]. Meanwhile, the tetraborate (or borate) concentration decreased almost linearly with Mg2+ concentration. We hypothesize that tetraborate was kept in solution as a magnesium complex, and that there was precipitation of borate (or boric acid, B(OH)3) with Mg2+ occurring at this narrow range of pCH+ [9-10.5]. This interaction between Mg2+ and borate has not been verified nor is it reported in the literature. However, experiments are already underway to investigate the chemistry of magnesium in the presence of an excess of borate, and the preliminary data confirm our observation. At pCH+ ~10.5, the conversion of tetraborate into tetrahydroxyborate ion, B(OH)4
-, could become predominant [Anderson 1964, Madea 1979]. Consequently, the borate species would re-dissolve and complex Mg2+. This would explain the constant Mg2+ concentration measured in solution at pCH+ ≥ 11. This explanation of Mg2+ and borate speciation in brine at high pCH+ is a possible interpretation of what was observed in our titration experiments. However, this needs experimental confirmation. Borate chemistry is not well known; very few papers exist in the literature. The ACRSP team has already identified the effect of borate in complexation of Nd(III) and U(VI) [Borkowski 2009, Lucchini 2012], and we continue to investigate the impact of borate species on brine chemistry and actinide solubility.
It is also important to note that the results of this titration work (this section 3.3) are in good agreement with the data obtained in the long-term solubility/reduction experiments (section 3.2),
Page 36 of 50
WIPP Actinide-Relevant Brine Chemistry LCO-ACP-15, Rev.0
despite the slight differences between the two experiments: 100% formulation versus 95% formulation brines, relatively short titration experiments (from 3 weeks to 4 months) versus several months for the long-term experiments, presence of other materials (e.g. iron, plutonium, uranium, neodymium) in the long-term experiments, which could affect the brine chemistry. Also, all the 95% formulation brines that were analyzed in the long-term experiments were within the chemical stability of the brine (no brine precipitates were observed); whereas the titration experiments went very quickly beyond the stability of GWB as the pCH+ was increased. However, these titration experiments demonstrated that chemical equilibrium could reasonably be achieved in a month timeframe.
3.3.2 Formulations of WIPP Simulated Brine as a Function of pCH+
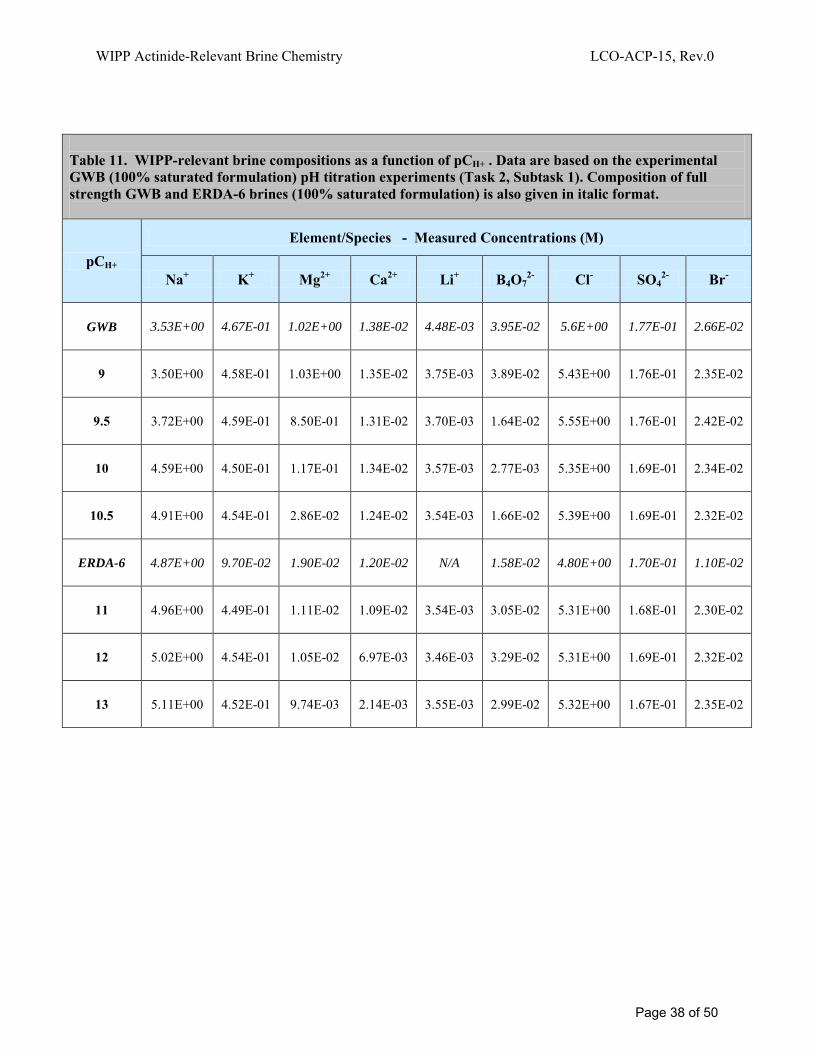
The results obtained in our titration experiments form the basis of a more robust and realistic formulation of WIPP simulated brine than GWB and ERDA-6 brines across a broader range of pCH+. Based on these results, an average of the composition of the WIPP-relevant simulated brine is given for the pCH+ range of 8-13, at one-unit intervals (Table 11). Calculated charge balances (positive from cations, negative from anions) are within 8%. The composition of the full strength GWB and ERDA-6 brines (100% saturated formulation), given in Table 1 (composition before reaction with waste components), is also reported in Table 11 for comparison purposes.
Historically in all the ACRSP experiments, GWB and ERDA-6 brines were used to bracket the standard WIPP simulated brine, because of their chemical stability. As shown in Figure 2, GWB is stable at near-neutral pCH+ and low basic conditions. The GWB composition (100% saturated formulation) was the starting brine for the brine titration experiments. When pCH+ increased, the composition of the intermediate brines shifted toward the composition of the 100% ERDA-6 brine. This was especially visible for the major ions that were impacted by the increase of hydroxide, such as Mg2+, Ca2+ and tetraborate (Table 11). This demonstrated the connectivity between the GWB and ERDA-6 simulated brines and shows them to well represent WIPP repository-relevant brine. The differences between ERDA-6 brine and GWB transforming into ERDA-6 are mainly in the concentrations of minor components, as K+ and Br-. ERDA-6 has a lower content of K+ and Br- than GWB, and these two ions don’t precipitate when pCH+ increased. Therefore, at high pCH+, the difference in the concentrations of these two ions in the two brines is still present.
Page 37 of 50
WIPP Actinide-Relevant Brine Chemistry LCO-ACP-15, Rev.0
Table 11. WIPP-relevant brine compositions as a function of pCH+ . Data are based on the experimental GWB (100% saturated formulation) pH titration experiments (Task 2, Subtask 1). Composition of full strength GWB and ERDA-6 brines (100% saturated formulation) is also given in italic format.
pCH+ Element/Species - Measured Concentrations (M)
Na+ K+ Mg2+ Ca2+ Li+ B4O72- Cl- SO4
2- Br-
GWB 3.53E+00 4.67E-01 1.02E+00 1.38E-02 4.48E-03 3.95E-02 5.6E+00 1.77E-01 2.66E-02
9 3.50E+00
4.58E-01
1.03E+00
1.35E-02
3.75E-03
3.89E-02
5.43E+00
1.76E-01
2.35E-02
9.5 3.72E+00
4.59E-01
8.50E-01
1.31E-02
3.70E-03
1.64E-02
5.55E+00
1.76E-01
2.42E-02
10 4.59E+00
4.50E-01
1.17E-01
1.34E-02
3.57E-03
2.77E-03
5.35E+00
1.69E-01
2.34E-02
10.5 4.91E+00
4.54E-01
2.86E-02
1.24E-02
3.54E-03
1.66E-02
5.39E+00
1.69E-01
2.32E-02
ERDA-6 4.87E+00
9.70E-02
1.90E-02
1.20E-02
N/A
1.58E-02
4.80E+00
1.70E-01
1.10E-02
11 4.96E+00
4.49E-01
1.11E-02
1.09E-02
3.54E-03
3.05E-02
5.31E+00
1.68E-01
2.30E-02
12 5.02E+00
4.54E-01
1.05E-02
6.97E-03
3.46E-03
3.29E-02
5.31E+00
1.69E-01
2.32E-02
13 5.11E+00
4.52E-01
9.74E-03
2.14E-03
3.55E-03
2.99E-02
5.32E+00
1.67E-01
2.35E-02
Page 38 of 50

WIPP Actinide-Relevant Brine Chemistry LCO-ACP-15, Rev.0
4. CONCLUSIONS
The actinide-relevant brine chemistry of the simulated brines used in the WIPP experimental studies was investigated.
The WIPP simulated brines, GWB and ERDA-6, which were generated since the start of the ACRSP experimental program in 2004, showed no pattern of instability or precipitation when stored at room temperature in the dark. The composition of these brines was unchanged over the six-year timeframe they were monitored. There were also no significant changes measured in the brines used in the actinide solubility/redox experiments (uranium solubility, neodymium solubility, plutonium redox), except those experiments above pCH+ 9 where some precipitation of Mg and borate was noted. These results confirmed the long-term chemical stability of the GWB and ERDA-6 brines, and supported their use in the experimental program. The analytical results also established the storage protocols as adequate.
The effect of pCH+ on WIPP simulated brines was also investigated. GWB brine was titrated up to pCH+ ~13, stepwise, and analyzed. Experimental results were compared with predicted composition of the brine from the WIPP model [Brush 2011]. The key results of this work were:
1) A general agreement was found between the experimental data and the modeling results at pCH+ ≤ 10.5 (including pCH+ of interest to the WIPP), with the exception of tetraborate. The WIPP model didn’t predict a decrease of tetraborate concentrations to ~2×10⁻³M between 10 and 10.5, because the corresponding Pitzer parameters do not exist.
2) Discrepancies between experimental and predicted data were noticed for Mg2+, Ca2+
and tetraborate at pCH+ ≥10.5. The experimental results were tentatively explained by precipitation of calcium carbonate and resolubilization of some magnesium due to a change in the speciation of tetraborate at high pCH+, but these assumptions would need to be investigated further.
3) GWB and ERDA-6 were confirmed as good “bracketing” brines for WIPP-relevant studies, as GWB brine transitions into ERDA-6 at pCH+ ~10.5. Relatively good agreement was found between the long-term experiments (using 95% formulation brines) and the titration experiments (using the 100% formulation GWB).
Based on the experimental data obtained in this brine titration work, the compositions of transitional brines in the pCH+ range 9 to13 were established. Overall, this work provides a more robust understanding of the brine chemistry to support broad-range pH studies of actinide solubility.
Page 39 of 50
WIPP Actinide-Relevant Brine Chemistry LCO-ACP-15, Rev.0
REFERENCES
[Altmaier 2003] Altmaier, M., Metz, V., Neck, V., Muller, R., Fanghanel, Th. “Solid-liquid
equilibria of Mg(OH)2 (cr) and Mg2(OH)3Cl·4H2O (cr) in the system Mg-Na-H-OH-Cl-H2O at 25ºC.” Geochimica et Cosmochimica Acta, volume 67, number 19, pages 3595-3601 (2003).
[Anderson 1964] Anderson, J.L., Eyring, E.M., Whittaker, M.P. “Temperature Jump Rate Studies of Polyborate Formation in Aqueous Boric Acid.” Journal of Physical Chemistry, volume 68, number 5, pages 1128-1132 (1964).
[Borkowski 2009] Borkowski, M., Lucchini J.F., Richmann M.K., Reed D.T. “Actinide (III) Solubility in WIPP Brine: Data Summary and Recommendations.” LCO-ACP-08, LANL-CO\ACRSP Report. LA-14360, Los Alamos, NM: Los Alamos National Laboratory (2009).
[Borkowski 2010] Borkowski, M., Richmann, M.K., Reed, D.T., Xiong, Y.-L. “Complexation of Nd (III) with Tetraborate Ion and Its Effect on Actinide(III) Solubility in WIPP Brine.” Radiochimica Acta, volume 98, pages 1-6 (2010).
[Brush 2003] Brush, L.H., Xiong, Y.-L. “Calculation of Actinide Solubilities for the WIPP Compliance Recertification Application (Rev. 1).” Analysis plan AP-098. ERMS 527714. Carlsbad, NM: Sandia National Laboratories (2003).
[Brush 2006] Brush, L.H., Xiong Y.L., Garner J.W., Ismail A., Roselle G.T. “Consumption of Carbon Dioxide by Precipitation of Carbonate Minerals Resulting from Dissolution of Sulfate Minerals in the Salado Formation in Response to Microbial Sulfate Reduction in the WIPP.” ERMS 544785. Carlsbad, NM: Sandia National Laboratories (2006).
[Brush 2009] Brush, L.H., Xiong Y.-L.“Results of the Calculations of Actinide Solubilities for the WIPP CRA-2009 PABC.” Analysis report, October 7, 2009. Carlsbad, NM: Sandia National Laboratories. ERMS 552201. (2009).
[Brush 2011] Brush, L.H., Domski, P.S., Xiong Y.-L.“Predictions of the Compositions of Standard WIPP Brines as a Function of pcH for Laboratory Studies of the Speciation and Solubilities of Actinides.” Analysis report, June 23, 2011. Carlsbad, NM: Sandia National Laboratories (2011).
[Brush 2011a] Brush, L.H., Xiong Y.-L.“Analysis Plan for WIPP Near-Field Geochemical Process Modeling.” Analysis plan, AP-153, February 11,
Page 40 of 50
WIPP Actinide-Relevant Brine Chemistry LCO-ACP-15, Rev.0
2011. ERMS 5555014. Carlsbad, NM: Sandia National Laboratories (2011).
[CRA-2009 U.S. Department of Energy (DOE) “Title 40 CFR Part 191 Subparts B and Appendix C Compliance Recertification Application 2009, Appendix PA, SOTERM] Attachment SOTERM.” DOE/WIPP 09-3424. Carlsbad, NM: Carlsbad
Field Office (2009).
[Deng 2010] Deng, H. “Analysis of MgO Hydration and Carbonation Test Results.” Analysis Plan AP-108. Carlsbad, NM: Sandia National Laboratories (2010).
[Jang 2012] Jang, J.-H., Xiong, Y.-L., Kim, S., Nemer, M.B.“Second Milestone Report on test Plan TP 08-02, Iron, Lead, Sulfide, and EDTA Solubilities.” Milestone report, March, 2012. Carlsbad, NM: Sandia National Laboratories. ERMS 557198. (2012).
[Lucchini 2010] Lucchini, J.F., Khaing H., Borkowski M., Richmann M.K., Reed D.T. “Actinide (VI) Solubility in Carbonate-free WIPP Brine: Data Summary and Recommendations.” LCO-ACP-10, LANL-CO\ACRSP Report. LA-UR-10-00497. Los Alamos, NM: Los Alamos National Laboratory (2010).
[Lucchini 2012] Lucchini, J.F., Borkowski, M., Richmann, M.K., Reed, D.T. “Uranium (VI) Solubility in Carbonate-free WIPP Brine”, to be submitted to Radiochimica Acta (2012).
[Madea 1979] Madea, M., Hirao, T., Kotaka, M., Kakihana, H. “Raman Spectra of Polyborate Ions in Aqueous Solution.” Journal of Inorganic & Nuclear Chemistry, volume 41, issue 8, pages 1217-1220 (1979).
[Molecke 1979] Molecke, M.A. “Gas Generation from Transuranic Waste Degradation: Data and Summary Interpretation.” Sandia National Laboratories Report, SAND 79-1245 (1979).
[Molecke 1983] Molecke, M.A. “A Comparison of Brines Relevant to Nuclear Waste Experimentation.” SAND83-0516. Albuquerque: Sandia National Laboratories (1983).
[NIST 2004] National Institute of Standards and Technology (NIST). 2004. “Critical Stability Constants.” Standard Reference Database 46 (Version 8.0).
[Popielak 1983] Popielak, R.S., Beauheim R.L., Black S.R., Coons W.E., Ellingson C.T., Olsen R.L. “Brine Reservoirs in the Castile Formation, Waste Isolation Pilot Plant (WIPP) Project, Southeastern New Mexico.” TME-3153. ERMS 242085. Carlsbad, NM: U.S. Department of Energy (1983).
Page 41 of 50
WIPP Actinide-Relevant Brine Chemistry LCO-ACP-15, Rev.0
[Rai 1995] Rai D., Felmy A.R., Juracich S.P., Rao L.F. “Estimating the Hydrogen Ion
Concentration in Concentrated NaCl and Na2SO4 Electrolytes.” Report SAND94-1949, Sandia National Laboratories, Albuquerque, NM. 1995
[Reed 2010] Reed D.T., Lucchini, J.F., Borkowski M., Richmann M.K. “Reduction of Higher-Valent Plutonium by Iron Under Waste Isolation Pilot Plant (WIPP)-Relevant Conditions: Data Summary and Recommendations.” LCO-ACP-09, LANL-CO\ACRSP Report. LA-UR-10-01254. Los Alamos, NM: Los Alamos National Laboratory (2010).
[Snider 2003] Snider, A.C. “Verification of the Definition of Generic Weep Brine and the Development of a Recipe for this Brine.” BOE 1.3.5.1.2. Sandia National Laboratories. Carlsbad, NM. (2003).
[U.S. DOE 1996] U.S. Department of Energy (DOE) “Title 40 CFR Part 191 Compliance Certification Application for the Waste Isolation Pilot Plant (October)” 21vols. DOE/CAO 1996-2184. Carlsbad, NM: Carlsbad Field Office (1996).
[Wolery 2003] Wolery, T.J., Jarek, R.L. “Software User’s Manual: EQ3/6, Version 8.0.” Software Document No. 10813-UM-8.0-00. Albuquerque, NM. Sandia National Laboratories (2003).
[Wolery 2010] Wolery, T.J., Xiong, Y.L., Long, J.J. “Verification and Validation Plan/Validation Document for EQ3/6 Version 8.0a for Actinide Chemistry, Document Version 8.10.” Carlsbad, NM. Sandia National Laboratories. ERMS 550239 (2010).
[Xiong 2011] Xiong, Y.-L. “ Release of EQ3/6 Database DATA0.FM1.” E-mail to Jennifer Long, March 9, 2011. Carlsbad, NM. Sandia National Laboratories. ERMS 555152 (2011).
[Xiong 2012] Xiong, Y.-L.“Second Milestone Report on test Plan TP 10-01, Experimental Study of Thermodynamic Parameters of Borate in WIPP Relevant Brines at Sandia National Laboratories Carlsbad Facility.” Milestone report, April, 2012. Carlsbad, NM: Sandia National Laboratories. ERMS 557333. (2012).
Page 42 of 50
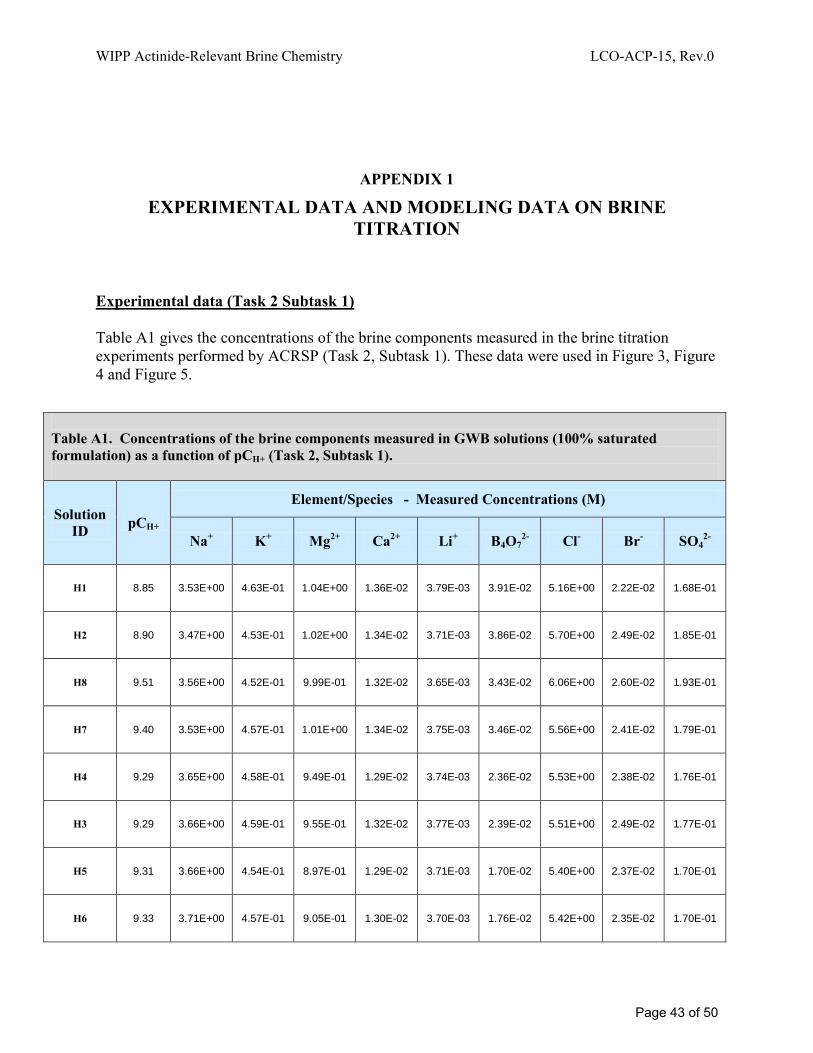
WIPP Actinide-Relevant Brine Chemistry LCO-ACP-15, Rev.0
APPENDIX 1
EXPERIMENTAL DATA AND MODELING DATA ON BRINE TITRATION
Experimental data (Task 2 Subtask 1) Table A1 gives the concentrations of the brine components measured in the brine titration experiments performed by ACRSP (Task 2, Subtask 1). These data were used in Figure 3, Figure 4 and Figure 5.
Table A1. Concentrations of the brine components measured in GWB solutions (100% saturated formulation) as a function of pCH+ (Task 2, Subtask 1).
Solution ID pCH+
Element/Species - Measured Concentrations (M)
Na+ K+ Mg2+ Ca2+ Li+ B4O72- Cl- Br- SO4
2-
H1 8.85 3.53E+00 4.63E-01 1.04E+00 1.36E-02 3.79E-03 3.91E-02 5.16E+00 2.22E-02 1.68E-01
H2 8.90 3.47E+00 4.53E-01 1.02E+00 1.34E-02 3.71E-03 3.86E-02 5.70E+00 2.49E-02 1.85E-01
H8 9.51 3.56E+00 4.52E-01 9.99E-01 1.32E-02 3.65E-03 3.43E-02 6.06E+00 2.60E-02 1.93E-01
H7 9.40 3.53E+00 4.57E-01 1.01E+00 1.34E-02 3.75E-03 3.46E-02 5.56E+00 2.41E-02 1.79E-01
H4 9.29 3.65E+00 4.58E-01 9.49E-01 1.29E-02 3.74E-03 2.36E-02 5.53E+00 2.38E-02 1.76E-01
H3 9.29 3.66E+00 4.59E-01 9.55E-01 1.32E-02 3.77E-03 2.39E-02 5.51E+00 2.49E-02 1.77E-01
H5 9.31 3.66E+00 4.54E-01 8.97E-01 1.29E-02 3.71E-03 1.70E-02 5.40E+00 2.37E-02 1.70E-01
H6 9.33 3.71E+00 4.57E-01 9.05E-01 1.30E-02 3.70E-03 1.76E-02 5.42E+00 2.35E-02 1.70E-01
Page 43 of 50
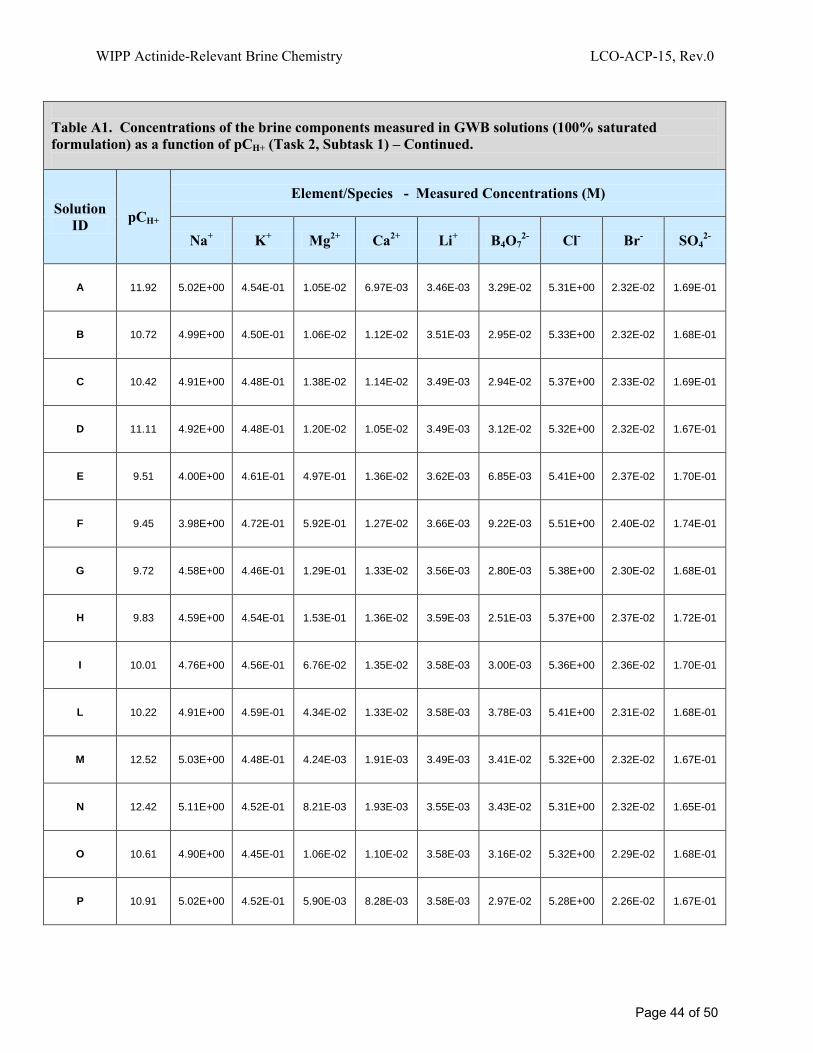
WIPP Actinide-Relevant Brine Chemistry LCO-ACP-15, Rev.0
Table A1. Concentrations of the brine components measured in GWB solutions (100% saturated formulation) as a function of pCH+ (Task 2, Subtask 1) – Continued.
Solution ID pCH+
Element/Species - Measured Concentrations (M)
Na+ K+ Mg2+ Ca2+ Li+ B4O72- Cl- Br- SO4
2-
A 11.92 5.02E+00 4.54E-01 1.05E-02 6.97E-03 3.46E-03 3.29E-02 5.31E+00 2.32E-02 1.69E-01
B 10.72 4.99E+00 4.50E-01 1.06E-02 1.12E-02 3.51E-03 2.95E-02 5.33E+00 2.32E-02 1.68E-01
C 10.42 4.91E+00 4.48E-01 1.38E-02 1.14E-02 3.49E-03 2.94E-02 5.37E+00 2.33E-02 1.69E-01
D 11.11 4.92E+00 4.48E-01 1.20E-02 1.05E-02 3.49E-03 3.12E-02 5.32E+00 2.32E-02 1.67E-01
E 9.51 4.00E+00 4.61E-01 4.97E-01 1.36E-02 3.62E-03 6.85E-03 5.41E+00 2.37E-02 1.70E-01
F 9.45 3.98E+00 4.72E-01 5.92E-01 1.27E-02 3.66E-03 9.22E-03 5.51E+00 2.40E-02 1.74E-01
G 9.72 4.58E+00 4.46E-01 1.29E-01 1.33E-02 3.56E-03 2.80E-03 5.38E+00 2.30E-02 1.68E-01
H 9.83 4.59E+00 4.54E-01 1.53E-01 1.36E-02 3.59E-03 2.51E-03 5.37E+00 2.37E-02 1.72E-01
I 10.01 4.76E+00 4.56E-01 6.76E-02 1.35E-02 3.58E-03 3.00E-03 5.36E+00 2.36E-02 1.70E-01
L 10.22 4.91E+00 4.59E-01 4.34E-02 1.33E-02 3.58E-03 3.78E-03 5.41E+00 2.31E-02 1.68E-01
M 12.52 5.03E+00 4.48E-01 4.24E-03 1.91E-03 3.49E-03 3.41E-02 5.32E+00 2.32E-02 1.67E-01
N 12.42 5.11E+00 4.52E-01 8.21E-03 1.93E-03 3.55E-03 3.43E-02 5.31E+00 2.32E-02 1.65E-01
O 10.61 4.90E+00 4.45E-01 1.06E-02 1.10E-02 3.58E-03 3.16E-02 5.32E+00 2.29E-02 1.68E-01
P 10.91 5.02E+00 4.52E-01 5.90E-03 8.28E-03 3.58E-03 2.97E-02 5.28E+00 2.26E-02 1.67E-01
Page 44 of 50
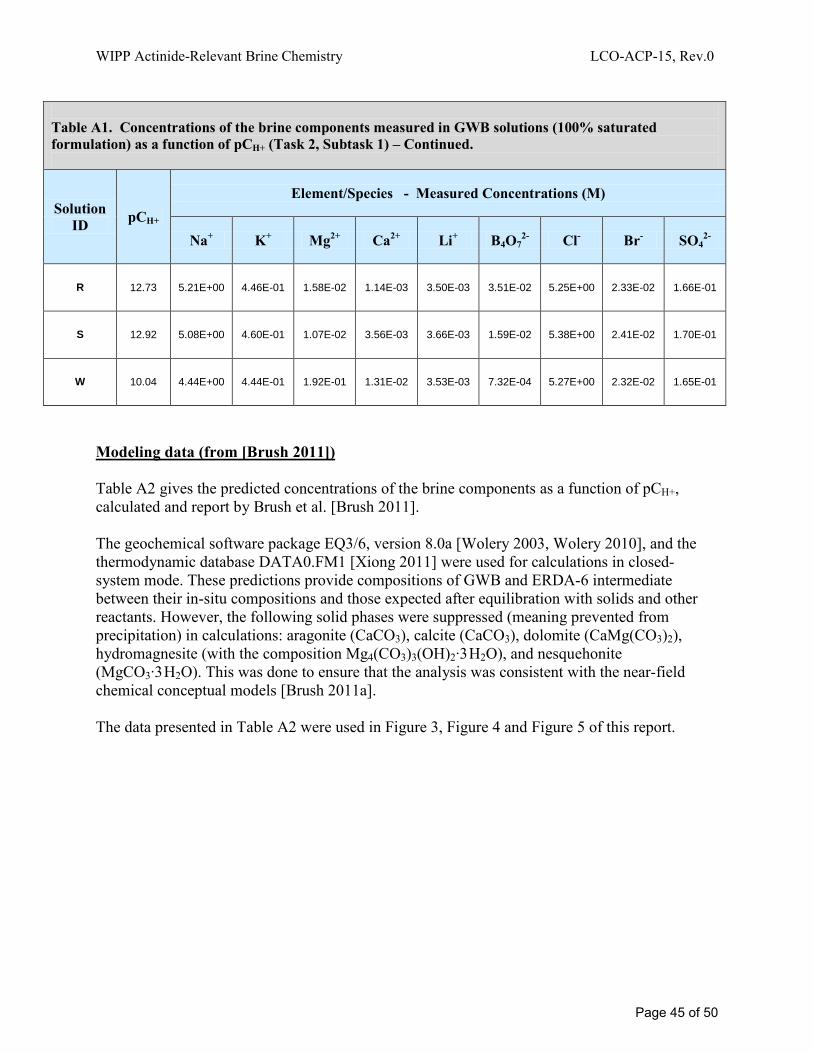
WIPP Actinide-Relevant Brine Chemistry LCO-ACP-15, Rev.0
Modeling data (from [Brush 2011]) Table A2 gives the predicted concentrations of the brine components as a function of pCH+, calculated and report by Brush et al. [Brush 2011]. The geochemical software package EQ3/6, version 8.0a [Wolery 2003, Wolery 2010], and the thermodynamic database DATA0.FM1 [Xiong 2011] were used for calculations in closed-system mode. These predictions provide compositions of GWB and ERDA-6 intermediate between their in-situ compositions and those expected after equilibration with solids and other reactants. However, the following solid phases were suppressed (meaning prevented from precipitation) in calculations: aragonite (CaCO3), calcite (CaCO3), dolomite (CaMg(CO3)2), hydromagnesite (with the composition Mg4(CO3)3(OH)2·3H2O), and nesquehonite (MgCO3·3H2O). This was done to ensure that the analysis was consistent with the near-field chemical conceptual models [Brush 2011a]. The data presented in Table A2 were used in Figure 3, Figure 4 and Figure 5 of this report.
Table A1. Concentrations of the brine components measured in GWB solutions (100% saturated formulation) as a function of pCH+ (Task 2, Subtask 1) – Continued.
Solution ID pCH+
Element/Species - Measured Concentrations (M)
Na+ K+ Mg2+ Ca2+ Li+ B4O72- Cl- Br- SO4
2-
R 12.73 5.21E+00 4.46E-01 1.58E-02 1.14E-03 3.50E-03 3.51E-02 5.25E+00 2.33E-02 1.66E-01
S 12.92 5.08E+00 4.60E-01 1.07E-02 3.56E-03 3.66E-03 1.59E-02 5.38E+00 2.41E-02 1.70E-01
W 10.04 4.44E+00 4.44E-01 1.92E-01 1.31E-02 3.53E-03 7.32E-04 5.27E+00 2.32E-02 1.65E-01
Page 45 of 50

WIPP Actinide-Relevant Brine Chemistry LCO-ACP-15, Rev.0
Table A2. Predicted concentrations of the standard WIPP brine components [Brush 2011].
pCH+ Element/Species - Measured Concentrations (M)
Na+ K+ Mg2+ Ca2+ Li+ B4O72- Cl- Br- SO4
2-
7 3.29E+00 4.74E-01 1.12E+00 8.3E-03 ND 3.95E-02 5.62E+00 2.66E-02 1.84E-01
7.5 3.26E+00 4.68E-01 1.15E+00 8.29E-03 ND 3.95E-02 5.60E+00 2.66E-02 1.86E-01
8 3.26E+00 4.67E-01 1.17E+00 8.54E-03 ND 3.95E-02 5.59E+00 2.66E-02 1.86E-01
8.5 3.25E+00 4.67E-01 1.18E+00 8.93E-03 ND 3.95E-02 5.59E+00 2.66E-02 1.86E-01
9 3.25E+00 4.67E-01 1.2E+00 9.39E-03 ND 3.95E-02 5.58E+00 2.66E-02 1.87E-01
9.5 4.56E+00 5.16E-01 3.59E-01 1.21E-02 ND 4.375E-02 5.2E+00 2.94E-02 2.11E-01
10 5.31E+00 4.65E-01 4.46E-02 1.48E-02 ND 3.925E-02 5.33E+00 2.65E-02 1.88E-01
10.5 5.39E+00 4.65E-01 5.59E-03 1.86E-02 ND 3.925E-02 5.33E+00 2.65E-02 1.84E-01
11 5.40E+00 4.65E-01 6.22E-04 1.98E-02 ND 3.925E-02 5.33E+00 2.65E-02 1.83E-01
11.5 5.40E+00 4.65E-01 7.09E-05 2E-02 ND 3.925E-02 5.33E+00 2.65E-02 1.83E-01
12 5.40E+00 4.65E-01 9.64E-06 2.01E-02 ND 3.925E-02 5.33E+00 2.65E-02 1.83E-01
12.5 5.40E+00 4.65E-01 1.77E-06 2.02E-02 ND 3.925E-02 5.32E+00 2.65E-02 1.83E-01
13 5.41E+00 4.65E-01 4.33E-07 2.05E-02 ND 3.925E-02 5.32E+00 2.65E-02 1.82E-01
ND – not detected
Page 46 of 50

WIPP Actinide-Relevant Brine Chemistry LCO-ACP-15, Rev.0
APPENDIX 2
EXPERIMENTAL MATRICES
Unused Simulated Brines (Task 1 Subtask 1) The test matrix for subtask 1 i s given in Table A3. In this subtask there were 16 b atches of brines generated using the exact or slightly modified protocols found in ACRSP procedure “ACRSP Brine Preparation Procedure” (ACP-EXP-001).
Table A3. List of the Brines Generated by ACRSP (as of March 2010).
Brine Sample Identification Number
(SIN) Brine Description Date of Generation
NaCl-0405 NaCl brine (5M) April 2004 NaCl-0504 NaCl brine (5M) May 2004 ERDA-0504 ERDA-6 brine May 2004 MgCl-0604 MgCl2 brine (3.7M chloride) June 2004 GWB-0604 GWB brine June 2004 NaCl-0105 NaCl brine (3M) January 2005 NaCl-0205 NaCl brine (3M) February 2005 ERDA-0205 ERDA-6 brine February 2005 GWB-0205 GWB brine February 2005 NaCl-0505 NaCl brine (5M) May 2005 ERDA-1105 ERDA-6 brine November 2005 GWB-1105 GWB brine November 2005 GWB-0806-no borate GWB brine without borate August 2006 ERDA-0806- no borate ERDA-6 brine without borate August 2006 GWB-0107 GWB brine January 2007 ERDA-0207 ERDA-6 brine February 2007
The GWB and ERDA-6 brine formulation used was a 95% saturated composition (see Table 1 for the saturated brine composition). Simplified brine solutions were also utilized in investigations where the complexity of the ERDA-6 and GWB brine solutions could be problematic. NaCl solutions (5M, 3M) were used as simplified ERDA-6 brines. A 3.7 M MgCl2 solution was used as a simplified GWB brine. Two simulated brines containing no borate were
Page 47 of 50

WIPP Actinide-Relevant Brine Chemistry LCO-ACP-15, Rev.0
prepared in August 2006 and used in some experiments for Test Plan: “Solubility of Neodymium (III) in WIPP Brines” (LCO-ACP-03). All of these brines were prepared at least 3 years ago, and have been stored at room temperature in the dark throughout this time. Used Simulated Brines (Task 1 Subtask 2) The test matrix for subtask 2 is given in Table A4. These correspond to selected brines from various ACRSP experiments, involving uranium, neodymium and plutonium (Test Plans: “Solubility/Stability of Uranium (VI) in WIPP Brines” (LCO-ACP-02), “Solubility of Neodymium (III) in WIPP Brines” (LCO-ACP-03), “Plutonium (VI) Reduction by Iron: Limited-Scope Confirmatory Study” (LCO-ACP-04) respectively). The initial focus of these experiments was on the solubility and concentration trends of the respective metal/actinide. In many cases these experiments include waste component interactions (e.g., Fe) or were performed at a pH that was outside the stability range of the brine. In this context, some changes in the brine composition were likely to have occurred but were not always explicitly tracked.
Table A4. Test Matrix for the ACRSP experimental solutions that were analyzed in Task 1 Subtask 2 – Continued.
Solution ID Solution description
Link to Test Plan, Task Implementation Plan,
Scientific Notebook or Relevant QA Documentation
TI-GW-7.1 GWB solution containing uranyl at pCH+ ~ 7.4 LCO-ACP-10 report TI-GW-8.1 GWB solution containing uranyl at pCH+ ~ 8.2 LCO-ACP-10 report TI-GW-9.1 GWB solution containing uranyl at pCH+ ~ 9.2 LCO-ACP-10 report TI-ER-8.1 ERDA-6 solution containing uranyl at pCH+ ~ 6.2 LCO-ACP-10 report
TI-ER-10.1 ERDA-6 solution containing uranyl at pCH+ ~ 9.6 LCO-ACP-10 report TI-ER-11.1 ERDA-6 solution containing uranyl at pCH+ ~ 10.5 LCO-ACP-10 report
T3-GW-C4-9.1 GWB solution with uranyl and low amount of carbonate at pCH+ ~ 9
LCO-ACP-02 test plan, and related SN
T3-GW-C3-9.1 GWB solution with uranyl and high amount of carbonate at pCH+ ~ 9
LCO-ACP-02 test plan, and related SN
T3-ER-C4-9.1 ERDA-6 solution with uranyl and low amount of carbonate at pCH+ ~ 8.7
LCO-ACP-02 test plan, and related SN
T3-ER-C3-9.1 ERDA-6 solution with uranyl and high amount of carbonate at pCH+ ~ 8.7
LCO-ACP-02 test plan, and related SN
E9C1-2 ERDA-6 solution containing neodymium and 10-3M carbonate at pCH+ ~ 9.1
LCO-ACP-03 test plan, and SN LCO-ACP-03/1
E10C0-1 ERDA-6 solution containing neodymium and 10-2M carbonate at pCH+ ~ 9.1
LCO-ACP-03 test plan, and SN LCO-ACP-03/1
Page 48 of 50
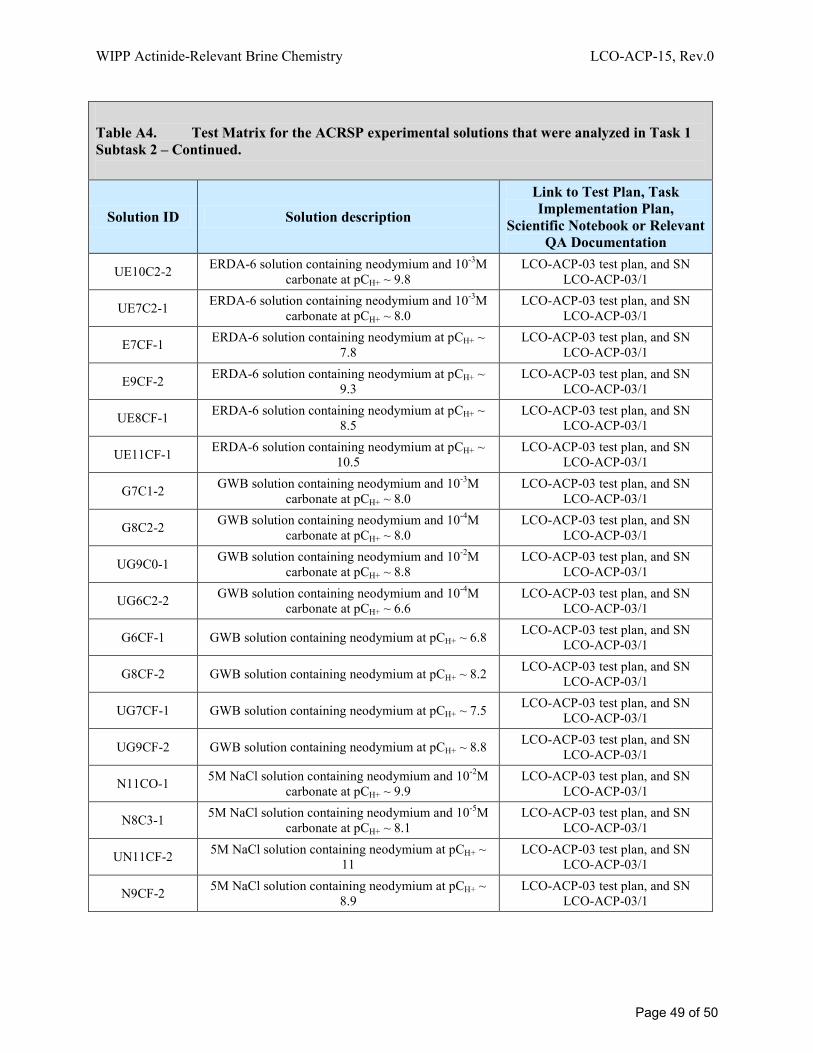
WIPP Actinide-Relevant Brine Chemistry LCO-ACP-15, Rev.0
Table A4. Test Matrix for the ACRSP experimental solutions that were analyzed in Task 1 Subtask 2 – Continued.
Solution ID Solution description
Link to Test Plan, Task Implementation Plan,
Scientific Notebook or Relevant QA Documentation
UE10C2-2 ERDA-6 solution containing neodymium and 10-3M carbonate at pCH+ ~ 9.8
LCO-ACP-03 test plan, and SN LCO-ACP-03/1
UE7C2-1 ERDA-6 solution containing neodymium and 10-3M carbonate at pCH+ ~ 8.0
LCO-ACP-03 test plan, and SN LCO-ACP-03/1
E7CF-1 ERDA-6 solution containing neodymium at pCH+ ~ 7.8
LCO-ACP-03 test plan, and SN LCO-ACP-03/1
E9CF-2 ERDA-6 solution containing neodymium at pCH+ ~ 9.3
LCO-ACP-03 test plan, and SN LCO-ACP-03/1
UE8CF-1 ERDA-6 solution containing neodymium at pCH+ ~ 8.5
LCO-ACP-03 test plan, and SN LCO-ACP-03/1
UE11CF-1 ERDA-6 solution containing neodymium at pCH+ ~ 10.5
LCO-ACP-03 test plan, and SN LCO-ACP-03/1
G7C1-2 GWB solution containing neodymium and 10-3M carbonate at pCH+ ~ 8.0
LCO-ACP-03 test plan, and SN LCO-ACP-03/1
G8C2-2 GWB solution containing neodymium and 10-4M carbonate at pCH+ ~ 8.0
LCO-ACP-03 test plan, and SN LCO-ACP-03/1
UG9C0-1 GWB solution containing neodymium and 10-2M carbonate at pCH+ ~ 8.8
LCO-ACP-03 test plan, and SN LCO-ACP-03/1
UG6C2-2 GWB solution containing neodymium and 10-4M carbonate at pCH+ ~ 6.6
LCO-ACP-03 test plan, and SN LCO-ACP-03/1
G6CF-1 GWB solution containing neodymium at pCH+ ~ 6.8 LCO-ACP-03 test plan, and SN LCO-ACP-03/1
G8CF-2 GWB solution containing neodymium at pCH+ ~ 8.2 LCO-ACP-03 test plan, and SN LCO-ACP-03/1
UG7CF-1 GWB solution containing neodymium at pCH+ ~ 7.5 LCO-ACP-03 test plan, and SN LCO-ACP-03/1
UG9CF-2 GWB solution containing neodymium at pCH+ ~ 8.8 LCO-ACP-03 test plan, and SN LCO-ACP-03/1
N11CO-1 5M NaCl solution containing neodymium and 10-2M carbonate at pCH+ ~ 9.9
LCO-ACP-03 test plan, and SN LCO-ACP-03/1
N8C3-1 5M NaCl solution containing neodymium and 10-5M carbonate at pCH+ ~ 8.1
LCO-ACP-03 test plan, and SN LCO-ACP-03/1
UN11CF-2 5M NaCl solution containing neodymium at pCH+ ~ 11
LCO-ACP-03 test plan, and SN LCO-ACP-03/1
N9CF-2 5M NaCl solution containing neodymium at pCH+ ~ 8.9
LCO-ACP-03 test plan, and SN LCO-ACP-03/1
Page 49 of 50
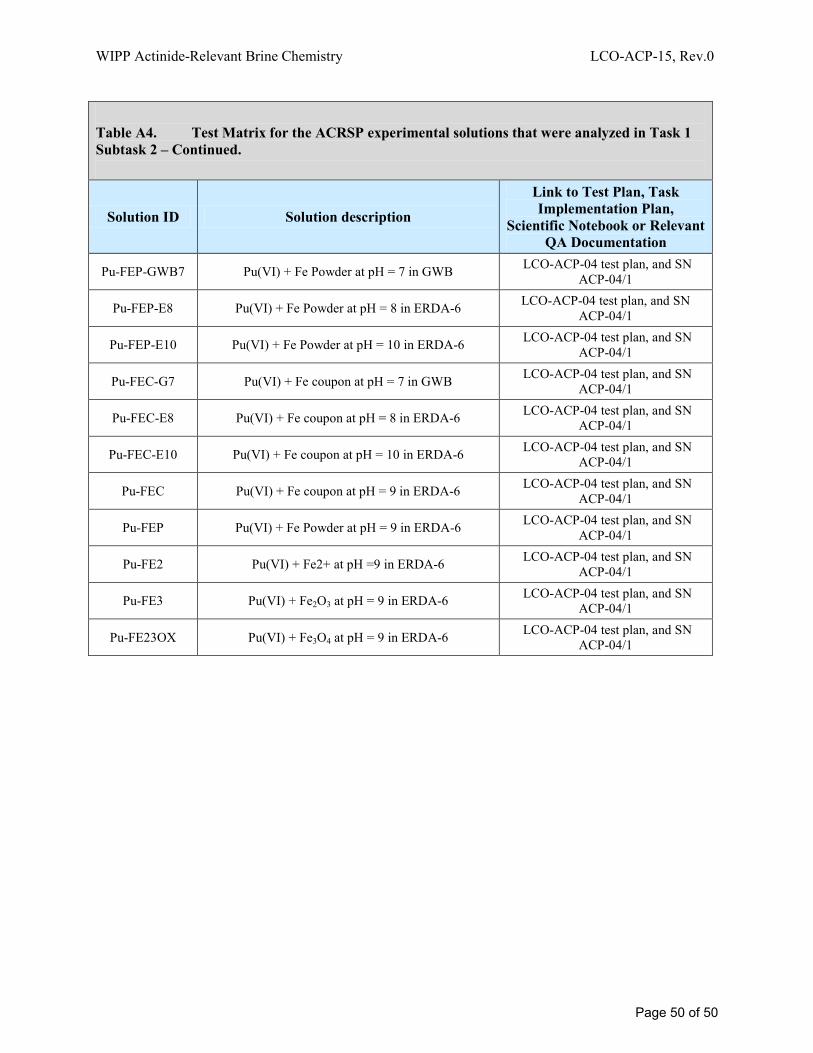
WIPP Actinide-Relevant Brine Chemistry LCO-ACP-15, Rev.0
Table A4. Test Matrix for the ACRSP experimental solutions that were analyzed in Task 1 Subtask 2 – Continued.
Solution ID Solution description
Link to Test Plan, Task Implementation Plan,
Scientific Notebook or Relevant QA Documentation
Pu-FEP-GWB7 Pu(VI) + Fe Powder at pH = 7 in GWB LCO-ACP-04 test plan, and SN ACP-04/1
Pu-FEP-E8 Pu(VI) + Fe Powder at pH = 8 in ERDA-6 LCO-ACP-04 test plan, and SN ACP-04/1
Pu-FEP-E10 Pu(VI) + Fe Powder at pH = 10 in ERDA-6 LCO-ACP-04 test plan, and SN ACP-04/1
Pu-FEC-G7 Pu(VI) + Fe coupon at pH = 7 in GWB LCO-ACP-04 test plan, and SN ACP-04/1
Pu-FEC-E8 Pu(VI) + Fe coupon at pH = 8 in ERDA-6 LCO-ACP-04 test plan, and SN ACP-04/1
Pu-FEC-E10 Pu(VI) + Fe coupon at pH = 10 in ERDA-6 LCO-ACP-04 test plan, and SN ACP-04/1
Pu-FEC Pu(VI) + Fe coupon at pH = 9 in ERDA-6 LCO-ACP-04 test plan, and SN ACP-04/1
Pu-FEP Pu(VI) + Fe Powder at pH = 9 in ERDA-6 LCO-ACP-04 test plan, and SN ACP-04/1
Pu-FE2 Pu(VI) + Fe2+ at pH =9 in ERDA-6 LCO-ACP-04 test plan, and SN ACP-04/1
Pu-FE3 Pu(VI) + Fe2O3 at pH = 9 in ERDA-6 LCO-ACP-04 test plan, and SN ACP-04/1
Pu-FE23OX Pu(VI) + Fe3O4 at pH = 9 in ERDA-6 LCO-ACP-04 test plan, and SN ACP-04/1
Page 50 of 50