lant pritchett and charles kenny pritchett and charles kenny . promoting millennium development...
TRANSCRIPT
Working Paper 338August 2013
Promoting Millennium Development Ideals: The Risks of Defining Development Down
Abstract
The approach of 2015, the target date of the Millennium Development Goals, sets the stage for a global reengagement on the question of “what is development?” We argue that the post-2015 development framework for development should include Millennium Development Ideals which put into measurable form the high aspirations countries have for the well-being of their citizens. Standing alone, low bar targets like the existing Millennium Development Goals “define development down” and put at risk both domestic and global coalitions to support to an inclusive development agenda. Measuring development progress exclusively by low bar targets creates the illusion that specific targeted programs can be an adequate substitute for a broad national and global development agenda.
www.cgdev.org
Lant Pritchett and Charles Kenny

Promoting Millennium Development Ideals: The Risks of Defining Development Down
Lant PritchettCenter for Global Development, Harvard University, World Bank
Charles KennyCenter for Global Development
The authors thank Sarah Dykstra for research support.
CGD is grateful for contributions from the UK Department for International Development and the William and Flora Hewlett Foundation in support of this work.
Lant Pritchett and Charles Kenny . 2013. "Promoting Millennium Development Ideals: The Risks of Defining Development Down." CGD Working Paper 338. Washington, DC: Center for Global Development.http://www.cgdev.org/publication/promoting-millennium-development-ideals-risks-defining-development-down
Center for Global Development1800 Massachusetts Ave., NW
Washington, DC 20036
202.416.4000(f ) 202.416.4050
www.cgdev.org
The Center for Global Development is an independent, nonprofit policy research organization dedicated to reducing global poverty and inequality and to making globalization work for the poor. Use and dissemination of this Working Paper is encouraged; however, reproduced copies may not be used for commercial purposes. Further usage is permitted under the terms of the Creative Commons License.
The views expressed in CGD Working Papers are those of the authors and should not be attributed to the board of directors or funders of the Center for Global Development.

Contents
Introduction ...................................................................................................................................... 1
Beyond The Low Bar for a Global Agenda: Development Ideals for all Countries ............. 3
Two Definitions of Development ................................................................................................. 6
The Analytics of Drive, Shift, Kink as Strategies for Progress ............................................... 10
High Aspirations: Beyond Kinky Development ....................................................................... 20
Poverty ......................................................................................................................................... 23
Health .......................................................................................................................................... 26
Conclusion ....................................................................................................................................... 28
References ....................................................................................................................................... 30
Appendix 1: Decomposition for Health Index based on Under 5 Mortality ....................... 32


1
Introduction
The approach of 2015, the target date of the Millennium Development Goals, sets the stage
for a global re-engagement on the question of “what is development?” We argue that the
post-2015 development framework for development should include Millennium
Development Ideals which put into measurable form the high aspirations citizens of the
world’s countries have for their well-being. Standing alone, low bar targets like the existing
Millennium Development Goals “define development down” and put at risk both domestic
and global coalitions to support to an inclusive development agenda. Measuring
development progress exclusively by low bar targets creates the illusion that specific targeted
programs can be an adequate substitute for a broad national and global development agenda.
The recent High Level Panel report on the Post -2015 Agenda, A New Global Partnership:
Eradicate Poverty and Transform Economies Through Sustainable Development, illustrates this issue.
The report takes welcome steps to propose goals that are not purely about absolute
deprivation, with targets in areas including gender equality, learning, sustainability, jobs,
governance and violence crafted in such a way that they are applicable to countries from
Liberia to the UK.
At the same time, with specific global poverty targets of eradicating $1.25/day poverty,
ensuring all children can read, write and count, and increasing access to household
sanitation, the Panel suggests:
“By 2030, if the transformational shifts we describe are made, the barriers that that
hold people back would be broken down, poverty and the inequality of opportunity
that blights the lives of so many on our planet would end…”
By 2030, if the targets enumerated in the report were all met, the world would be a much
better place. But billions could still be living on less than $2 a day, with only the most basic
literacy and numeracy, lacking access to basic medical care, living in houses without indoor
sanitation, working in subsistence agriculture or hawking on the street to make money.
Under any reasonable definition (including the current World Bank definition of $2 a day)
poverty would remain. And the opportunities of those born in low or lower middle income
countries would remain grossly stunted compared to those born in the OECD. To declare
the end of poverty and inequality of opportunity requires a much more ambitious list of
targets than proposed in the Panel’s report.
The objective of development is to produce sustained improvements in human well-being.
Analytically there are three ways of improving any individuated measure human well-being:
Drive towards increased national development through an inclusive four-fold transformation
towards a more prosperous and productive economy, a more capable state, a more
responsive polity, and fairer and more just societies.

2
Shift the distribution of measures of human well-being up (more or less uniformly) at any
given level of national development through broad sector wide improvements in the overall
distribution of outcomes for any given level of national development through technology
change, adaptation of new approaches or behaviors, better policies and more effective
implementation.
Kink the distribution of well-being across individuals so that the less-well off have outcomes
nearer the average.
Drive for national progress, Shift to better sector outcomes and Kink to include the poorest
and disadvantaged in progress are each individually important elements of a desirable
development agenda.
But making “development” exclusively about achievable, concrete, and non-political targets,
as with the existing MDG agenda, necessarily tends towards goals that are low (e.g. “extreme
poverty”) and limited (e.g. “completion of primary school”) and specific (e.g. a disease/cause of
death approach to health).
We argue in favor of adding to the development agenda ideals that are high (e.g. reaching
prosperity) broad (e.g. that each child enter adulthood with an education that equips them for
life) and systemic (e.g. a health system that addresses the current and emerging health
challenges in an effective and equitable manner).
Development goals frame the debate about the relative importance of the three basic
approaches of drive, shift, and kink. If development is framed exclusively in terms of low,
limited and specific targets this pushes the development agenda towards a focus on “kinky
development”: targeted transfers and narrow interventions designed to reach the poorest of
the poor in the poorest places. There is no question that these instruments are one part of
the development agenda, but, as we show, they are only a small part of the progress that is
needed over the coming decades. Levels of well-being—such as incomes, education
outcomes, health status, sanitation, access to basic infrastructure—are inadequate even for
the middle of middle income countries, not just the poorest in the poorest.
A development agenda should include both low and possibly universally achievable time-
bound goals like the eradication of extreme poverty (at a poverty line of $1.25 a day) and
universal completion of primary school but also a clear statement of ideals like reduction in
“global poverty” with a poverty line set near current OECD standards for poverty at $12.50
per day, an education goal that all children should reach current OECD standards of
learning, a health goal that addresses not just mortality but the health systems’ impact on
quality of life and financial risk and infrastructure goals (e.g. access to reliable electricity,
functional water and sanitation).

3
Such Millennium Development Ideals will require a combination of two things: shift both
increasing the quality of outcomes of all people at a given level of national development and
drive to increasing a country’s level of national development. In achieving high targets for
human well-being it is obvious that specific and sharply targeted policies and programs can
make some, but limited, contribution.
Beyond The Low Bar for a Global Agenda: Development Ideals for all Countries
The current MDGs are almost exclusively on ‘low bar’ targets.
Poverty. Target 1 was halving poverty, but with poverty defined by the penurious “dollar a
day” standard. The “dollar a day” threshold had never before been a global standard for
poverty. Moreover, it had never even been a widely used national poverty threshold, as nearly
all countries have always had higher poverty lines1.
A poverty line of $1.25 a day is only $450 dollars per person per year--which is about what a
high school drop-out in the USA makes in a week ($421). In 2005 the average of 15
European country poverty lines was $13.4 dollars a day—more than ten times the “extreme
poverty” definition. Of course, the average consumption in rich countries is much higher still.
In 2011 the consumption of the average American was $54 per day. Americans consume the
annual “extreme poverty” consumption every nine days.
In 2006 90 percent of Americans thought a car and a washing machine were necessities of life-
-and more than two thirds added air conditioning to the list of necessities2. While obviously
“necessity” is a socially constructed notion, how, in a global world, do we insist that the
citizens of the “developing” world keep their aspirations low?
There is a case for measuring and tracking “extreme” poverty—but it is hard to make the
case that the definition of poverty that is accurately characterized as “extreme” should also
be the only measure of global poverty3. Accepting exclusively a penurious poverty as the only
development goal on income or consumption gains ignores the material well-being and
aspirations of 5 billion people. Today roughly one billion people are above the poverty lines
set by rich countries. Call these people prosperous. About one billion are in “extreme
1 When the World Bank was first adopting “dollar a day” poverty as a metric for its World Development Report
on Poverty in 1990 a principal internal argument in favor of the “dollar a day” poverty line was that it was so low
no one could accuse the World Bank of padding the numbers of the poor. The “dollar a day” line was roughly
the line being used by the 10 poorest countries in the world (Ravallion, Datt and van de Walle 1991) not a
common or typical national poverty line (much less that of the rich countries). 2 http://www.pewsocialtrends.org/2006/12/14/luxury-or-necessity/ 3 The expedient of having a low global line plus national lines is an awkward compromise as with no
corresponding “high” global poverty line and one cannot aggregate a global poverty measure using each country’s
own poverty line—in part because this is in coherent and in part because many countries do not have an official
poverty line.

4
poverty.” That leaves roughly 5 billion people who are poor by the standards of rich
countries but not poor by the standards of the very poorest countries. Given the vast
majority of people worldwide want to live in a country that is prosperous—and enjoy a
decent standard of living--that means those five billion are “poor” by standards of prosperity
to which they can legitimately aspire (Pritchett 2006).
Education. The current education MDG target is worse as it is really not even an education
goal. Target 3 was “Completion of a full course of primary school” without reference to
education beyond primary, or technical skills, or higher education—and even without any
standards or measurement of the actual content of the education as learning--in terms of
capabilities, skills, dispositions or any metric of what was actually acquired during school.
Many children finish primary school having acquired few life skills. In India net primary
enrollment rates are 96% but in 2008 an independent assessment found that only 27 percent
of children who with five grades of primary school had mastered four basic skills: reading a
simple (grade 2) passage, doing a division problem, telling time and handling money.
An education goal should be an education goal and certainly everyone should be able to read
a simple paragraph and understand it. But they also ought to be able to write a letter or an
email to apply for a job, or ensure the delivery of a pension that they are owed. They should
be able to understand basic household accounting, and the village budget, and the rights they
are guaranteed by their constitution. In other words, they should have a level of functional
literacy and numeracy far in advance of the most basic reading comprehension and far in
advance of what most children currently receive out of primary education.
Nearly all industrial countries are worried that their own education systems are not
adequately preparing their youth for the 21st century. Yet on assessments of capabilities like
the OECD Programme in International Assessment (PISA) the average 15 year old scores
near 500 across OECD countries. When two of the educationally more advanced states of
India participated in 2009, their average scores on the reading assessment were 337 for Tamil
Nadu and 317 for Himachal Pradesh—scores that would put the average Indian student
performance in the bottom percentiles in any OECD country. All international assessments
find most middle income countries such as Indonesia, Brazil, Colombia, and South Africa
have average assessed outcomes almost 100 points (a full student standard deviation) behind
the OECD. Is there any reason why, in a global economy, Indian and Indonesian and
Brazilian parents should not aspire for their children to have learning on a par with children
in the now rich countries?

5
Gender. The gender goal was reduced to equal attainment in school4. It is notable that this
goal is on track to be met in countries including Egypt, India and Yemen; countries that
some may argue still face at least some challenges in gender equality.
Health. The health goals focused on diseases of the poorest countries (Malaria, HIV, TB) and
types of mortality that are particularly high in poor countries (child and maternal). When it
comes to health, beyond a basic package of preventative interventions and an adequate diet,
wouldn’t we want everyone worldwide to be able to access treatments from antibiotics
through anti-retrovirals to basic surgical procedures for emergencies?
Achieving even a new proposed 2030 ‘zero goal’ of under-five mortality of 20 per 1000
would represent incredible progress for many countries, but it would still leave those
countries with a mortality rate four times higher than the poorest quintile in Germany.
Infrastructure. Under MDG 7 of “sustainability” target number 10 was to reduce by half the
population without access to an “improved” water source and “basic sanitation” with both
defined in a very limited ways. The water target is met by people using public stand pipes or
who carry all their water from a dug well. We have never met anyone who didn’t aspire to
piped water that saves the time and effort (mostly borne by women) from the arduous task
of all the water the household uses every day.
Using improved pit latrines counts as meeting the goal of “basic” sanitation. Again, we know
of no one who regards using a pit latrine as the culmination of their sanitation related
development aspirations.
The MDGs contained nothing about other elements of infrastructure such as electricity—a
key to a modern lifestyle—or access to roads.
And, as has been widely noted, the goals did not include a range of other elements of the
quality of life including access to quality housing, measures of personal security, liberty, and
so on.
We are not against the low-bar MDGs. Achieving the low-bar development targets is
extremely important and urgent. It is obscene that in our modern world of such incredible
productivity and plenty children die of diseases that can be prevented or cured for a few
cents, and that many who survive grow up stunted from lack of nutrition or decent
sanitation, or that children are unable to attend school. One set of the global community’s
goals should be to end such avoidable deprivation.
But low bar goals cannot be the only measures of development post-2015. Reducing the most
extreme of deprivation is just the beginning, not the end, of development. Surely no one
should live on less than $1.25, but the only global goal on poverty cannot be a floor of $1.26.
4 Perhaps they were channeling Bob Dylan: “A self-ordained professor’s tongue, too serious to fool, spouted out
that liberty, was just equality in school.”

6
People who live on $1.26 a day still face unconscionable tradeoffs in everyday living,
between sending kids to primary school with the right uniform or with a full stomach, or
buying a bed net for the infant or antibiotics to cure their sibling’s illness. Surely every child
should complete primary school but that cannot be the only development goal for education.
Certainly they want to have learned something while in school. Living on $1.26 a day in
walking distance of a dug well and a functioning pit-latrine while having children with some
schooling is not a reasonable characterization of the goals of human progress for the 21st
century or even a working definition of development. A late-Victorian social agenda cannot
be the guide for international system in the 21st Century.
The risk of low bar development targets is that they do not provide a definition or measures
of development that the middle income countries of the world (and nearly all the biggest
developing countries are now in the World Bank’s “middle income” category) can adopt for
their own national agendas. In contrast, a set of Millennium Development Ideals could
frame further progress for all countries.
For example, the current goals might have resonance as a development agenda for Liberia –a
country with primary completion of only 66%, and $1.25 poverty at 84% of the population.
But these low bar goals are increasingly less relevant for the largest developing countries like
China, India, Brazil, Indonesia, Vietnam, or Egypt. Indonesia has primary enrollment rate of
109% and an extreme poverty rate of 18%. Why would the BRIC countries buy into a set of
global goals for development that are of limited relevance to their own national agendas of
development?
And of course, as global goals, $1.25 poverty or primary completion make no sense at all for
a country like the UK. With development ideals incorporated alongside minimum standards
in a goal system, it would be understood that the minimum goals are provisional –way
stations on the road to a truly ‘developed’ planet.
The post-2015 development agenda should include measures of what, in a better world,
every human should enjoy. These need not be realistic targets for every country to achieve
by 2030 but can have indicators that track and measure progress towards these aspirations.
And meeting such goals will demand a broader focus of development efforts beyond
targeted transfers to the world’s poorest, as we shall see.
Two Definitions of Development
Part of the confusion in discussing “development” is that there two fundamentally distinct
uses of the word.
One use of the word “development” takes the fundamental unit as a human being and
defines “development” as a better quality of life. These indicators can be along a single
dimension (e.g. education, health, freedom, consumption) or an omnibus measure (e.g.
reported life satisfaction or happiness) or aggregate of dimensions (e.g. multi-dimensional

7
poverty). Any full accounting of individual quality of life of course involves elements that are
intrinsically social (equal treatment by others, dignity, friendship) but these too are measured
at the level of the individual (even if only subjectively).
Nearly all of the original MDGs are fully individuated. For these measures of development
aggregation across individuals is a convenience and not an essential part of the definition.
That is, can talk about the income or education or access to water of a single person or the
average income of all households in La Paz, or the average of all households in Bolivia or the
average of all households classed as indigenous in Bolivia, or the average in Latin America—
but in each case the fundamental unit is a human being and their allocation to a category for
aggregation is conceptually arbitrary.
Any aggregation of measures of individual well-being produces a distribution of development
outcomes across individuals—some people are happy, some people sad, some have lots of
income, some have little. Many of the alternative measures of development as individual
well-being are different ways of summarizing the distribution—the proportion below some
threshold (e.g. headcount poverty) or the gap below a threshold or an average5.
The other common use of “development” takes the features of the society—usually but not
necessarily a nation-state—as the fundamental unit and the individual in this case is a
participant in this broader whole. This distinction of individual and society is clear for
measures of polity—the way in which a political sovereign is governed. One can measure the
properties of polities—such as whether the executive is popularly elected—and class them as
more or less “democratic” for instance. This is fundamentally (ontologically) about a
collection of human beings organized politically and cannot simply be added up from the
characteristics of individuals. The same is true of laws. Individuals do not have laws, they are
subject to (or not) laws. Institutions, when defined as rules and norms, are clearly something
that people participate in as a collectivity rather than exclusively a feature of individuals.
An “economy” is a set of rules that condition the transactions that individuals engage in and
how they organize their economic activities. The productivity of an economy is not the
simple sum of the intrinsic productivities of the individuals and assets but rather depends on
features like the laws and institutions and tacit “know how” that are not merely the
properties of individuals. This has been shown empirically that measure of national
economy’s physical and human capital can only account for about half of the labor
productivity differences across countries with the rest attributed to a “social capability” (Hall
and Jones 1999) or a residually defined measure of ignorance like national “total factor
productivity” (Casselli 2004). As Hausmann and Hidalgo (2011) has shown the total
capability of a society is not a linear sum of the individual capabilities but depends on how
those capabilities are networked into an aggregate. That productivity is a feature of place and
not just person is best illustrated by migration as, when an individual moves from one
5 This can also be extended to dynamics over time so that measures like “vulnerability” to poverty (or other
measure of deprivation) can be calculated (e.g. Suryahadi, Sumarto, and Pritchett 2002).

8
national economy to another their wage (which at least loosely reflects their productivity as
an individual) can increase by 10 fold or more, merely because they are participating in a
more productive national economy (Clemens, Montenegro and Pritchett 2008).
Measures of national development include economy productivity, responsiveness of the
polity to its citizens and respect for rights (e.g. measures of democracy or political and civil
rights), capability of the state to maintain and enforce rule of law and deliver on services (e.g.
measures of bureaucratic quality, lack of corruption, rule of law), and equal rights across
social groups. Features that people debate as characteristics of nation-states that are
“successful” in national development include transparency, accountability, freedom, rule of
law, property rights, low corruption, free and fair elections, and open trade—none of which
are the properties or characteristics of individuals.
Figure 1: Two different definitions of development are not competing but are of a
fundamentally different character—one is about individual and another about
societies—one can take as the only normative ranking as the individuated measure of
human well-being and the national measures as entirely instrumental
We regard measures of the (ontologically) non-individuated features of nation-states as one
definition of national development. Measures of aggregated well-being that can be measured
at the individual level and national development (even if highly correlated) are not competing
measures of the same thing but measures of conceptually distinct phenomena. That is, GDP
per capita is a spatial measure and average consumption expenditures is an individuated
measure. GDP per capita is not a good or bad measure of human well-being, it isn’t a measure
of human well-being at all. GDP per capita is a measure of the average product in a given
space (and hence can be calculated for cities, states, regions, etc) and its relationship to
Any individuated indicator of
well-being (e.g. income,
consumption, education,
security, happiness,
vulnerability, freedom,
health)
Indicators of development that apply only at an
aggregate social (e.g. national) level: (e.g. rules
systems, economic institutions, social norms, state
capability, laws, polities, economic policies)
Any relationship
between the two
is empirically
contingent and
potentially
contextual
9
measures of human well-being is empirically contingent on casual pathways into measures of
human well-being.
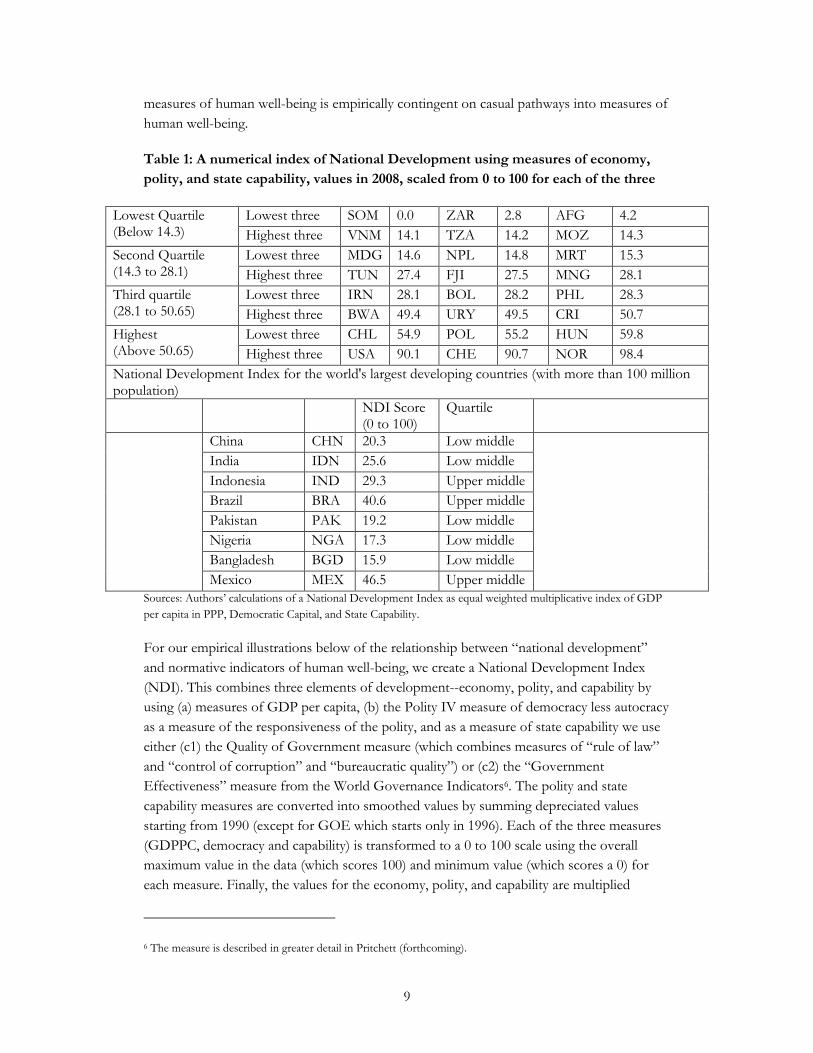
Table 1: A numerical index of National Development using measures of economy,
polity, and state capability, values in 2008, scaled from 0 to 100 for each of the three
Lowest Quartile (Below 14.3)
Lowest three SOM 0.0 ZAR 2.8 AFG 4.2
Highest three VNM 14.1 TZA 14.2 MOZ 14.3
Second Quartile (14.3 to 28.1)
Lowest three MDG 14.6 NPL 14.8 MRT 15.3
Highest three TUN 27.4 FJI 27.5 MNG 28.1
Third quartile (28.1 to 50.65)
Lowest three IRN 28.1 BOL 28.2 PHL 28.3
Highest three BWA 49.4 URY 49.5 CRI 50.7
Highest (Above 50.65)
Lowest three CHL 54.9 POL 55.2 HUN 59.8
Highest three USA 90.1 CHE 90.7 NOR 98.4
National Development Index for the world's largest developing countries (with more than 100 million population)
NDI Score (0 to 100)
Quartile
China CHN 20.3 Low middle
India IDN 25.6 Low middle
Indonesia IND 29.3 Upper middle
Brazil BRA 40.6 Upper middle
Pakistan PAK 19.2 Low middle
Nigeria NGA 17.3 Low middle
Bangladesh BGD 15.9 Low middle
Mexico MEX 46.5 Upper middle
Sources: Authors’ calculations of a National Development Index as equal weighted multiplicative index of GDP
per capita in PPP, Democratic Capital, and State Capability.
For our empirical illustrations below of the relationship between “national development”
and normative indicators of human well-being, we create a National Development Index
(NDI). This combines three elements of development--economy, polity, and capability by
using (a) measures of GDP per capita, (b) the Polity IV measure of democracy less autocracy
as a measure of the responsiveness of the polity, and as a measure of state capability we use
either (c1) the Quality of Government measure (which combines measures of “rule of law”
and “control of corruption” and “bureaucratic quality”) or (c2) the “Government
Effectiveness” measure from the World Governance Indicators6. The polity and state
capability measures are converted into smoothed values by summing depreciated values
starting from 1990 (except for GOE which starts only in 1996). Each of the three measures
(GDPPC, democracy and capability) is transformed to a 0 to 100 scale using the overall
maximum value in the data (which scores 100) and minimum value (which scores a 0) for
each measure. Finally, the values for the economy, polity, and capability are multiplied
6 The measure is described in greater detail in Pritchett (forthcoming).

10
together using equal weights. This produces an overall National Development Index (NDI)
with possible values from 0 to 100 and we only use the data for the years 2000 to 2008.
We are not proposing that this particular index of national development is the only or even
the best index—in fact we just built the simplest possible index with no experimentation or
fudging or fitting to data so it is almost certain that it isn’t the “best” for any given purpose.
But this a measure of development phenomena that are intrinsically national. This measure of
national development includes measures of how a polity is governed and the capability of the
administration of the state. We wish to avoid, at least for present purposes, the debate
between “economic growth” as an instrument for improving well being and “everything
else” which we believe is not a fruitful way to parse things. Rather we want to focus on a
three-fold distinction between “national development” (including economic product but also
polity and capability), overall sectoral performance and changes in distribution of benefits
across individuals.
The Analytics of Drive, Shift, Kink as Strategies for Progress
Development ideals set high targets for achievement of human well-being, at a level on the
low end of that already achieved in rich industrial countries with high levels of national
development. With any given target on human well being one can analytically decompose the
achievement of that target into one of three causal mechanisms:
Drive—the transformation over time towards greater national development (with our NDI as
only one possible measure) that may lead, through a variety of causal pathways, to
improvements in the level and distribution of individual well-being.
Shift. Measures of individual well-being, like health status or education or access to sanitation
or access to electricity or poverty can shift up even when the level of national development
stays the same. We define a “shift” as an improvement that affects people at all levels
equally. This “shift” can be of all countries over time (e.g. health improves at all levels of
income) or of countries relative to each other.
Kink. Some efforts to improve well-being can be targeted so that the distribution of well-
being improves more (or perhaps exclusively) for those at the low end. We call this “kink”
because, by definition, the impact is limited to those below some threshold and hence the
impact is kinked at some (or multiple) point.
Progress towards achieving any threshold goal, especially goals like “fraction of the
population below X on a measure of well-being” can be empirically decomposed into how
much progress was due to drive, shift and kink. That is, at any given point in time there is a
distribution across all individuals of any measure of well being. That distribution changes
over time, both in its central tendency (e.g. mean, median), in its dispersion (e.g. variance,
range, inequality) and in the shape of the distribution (e.g. how the lowest and highest tails of
the distribution are shaped, whether or not the distribution is symmetric). As pure accounting
for those changes, without any attribution of causality or causal pathways due to specific

11
policies or programs, the change in any indicator from one period to the next can be
decomposed into the change due to (a) the shift in central tendency of the distribution
leaving the dispersion and shape of the distribution unchanged and (b) the change in the
indicator due to the change in the distribution (which can be further divided into shifts in
dispersion and shifts in shape).
Our analytical distinction of drive and shift is just a decomposition of the shift in the central
tendency of the distribution with unchanged distribution into that part consistent with a shift
in national development (however measured) and that part which is a location of the
distribution of well-being on a particular indicator relative to the value predicted at its level
of development.
Figure 2 illustrates this simple point by taking the national level aggregates of an indicator of
schooling (the years of education of the population 15 and over) and of health (survival to
age 5). These are converting those to a zero to 100 for the year 2008. These two indices of
human well being can be compared across quartiles of NDI.
The countries with the lowest levels of the NDI (average≈10) have a median Schooling
Index of only 26 and health index of 45. The next quartile of countries has an average NDI
of about 207. The Schooling Index for those countries is 50.9—about double, an increase of
about 25 points. The Health Index for those countries is higher by 28 points—increased
from 45.5 to 73.6.
Conceptually the gain in any indicator from “drive” and improvements in an index of
national development is just the component of the improvement due to the typical causal
impacts—through multiple channels—due to improving NDI. As any indicator of national
development includes multiple elements of economy, polity, capability (and potentially other
dimensions like equality of social treatment) there will be multiple causal pathways for this
improvement and each country will likely trace out a different path. There are surely causal
relationships from some measures of individuated human development to some components
of the NDI. (We at not now making any specific assertions about causality but are just
illustrating the patterns of associations amongst these two conceptually distinct measures8.)
Figure 2 also illustrates that there is substantial dispersion even for any given level of our
National Development Index. Of course if there is a linear relationship between the two the
7 The NDI quartiles are not exactly the same because some countries have under 5 mortality but do not have
schooling data so the samples are not exactly equal. 8 While we are not going to address the causality question in any deep way (in part because there is no general
resolution as it will be very different for different indicators of well being and in part because with current
techniques there is not going to be any empirically compelling resolution) but it is worth nothing that when the
question has been addressed for health (Pritchett and Summers 1996, Johnson and Acemoglu 2007) and
education (Bils and Klenow 2000, Benhabibi and Spiegel 1994) most or all of the short to medium run (e.g. up to
10 year) causality appears to run from national measures like GDP per capita to well-being indicators if for no
other reason than the long-lags between say, schooling and child mortality improvements, and increased output.

12
grouping into quartiles exaggerates that as countries with quite different NDI values are in
the same quartile. But at any given level of any measure of national development there will
be some countries doing well on any given indicator of well-being (e.g. education, health,
happiness, rights, freedom, life satisfaction) and some countries doing worse.
It is possible to “shift” the entire distribution of well being on a given indicator up even
without any improvement in overall NDI though greater sector emphasis or improved
policies or implementation or perhaps larger budget allocations (though this might of course
come at the cost of poorer performance on other indicators).
Over time it is also possible to shift upwards the relationship between individuated elements
of the quality of life and the NDI across countries. This is perhaps easiest to see in the case
of health: new technologies like vaccines and the spread of practices like hand washing have
significantly reduced mortality in countries at a given level of income, quality of government
or polity score. This is true of other technological shifts that create differential sectoral
improvements—the advent of cell phones have, for instance, created massive advances in
telephony access at all levels of NDI.
To illustrate the potential for “kink” to improve well being of those at the bottom of the
distribution we need to show not just a single national summary statistic of well being (e.g.
average years of schooling, those below 6 years, etc) but the entire distribution.
We will do a simulation exercise where one can think of the indicator as being “schooling”
or “health” (as we will roughly calibrate it to the schooling and health index values in Figure
2) but where the general points are true of any individuated indicator of well-being (e.g.
education, health status, quality of sanitation, freedom, consumption, happiness, benefits
from infrastructure, etc.). For each of four levels of a national average (representing the four
quartiles) of the indicator we generate a distribution across individuals using, for simplicity’s
sake, a Gaussian Normal distribution with an underlying variance across individuals. Within
the same country some individuals have high levels (higher than the average in a much
higher average country) and some have low levels. We truncate this distribution below at
zero.
Relative to that distribution we can imagine three possible ways in which this distribution
gets better.
One is drive, the whole distribution, without changing shape, rises to the level of the next
highest quartile of NDI (calibrated to either the schooling or health results above).
One is shift, that the whole distribution shifts upward by the magnitude of the shift from the
median country to the 75th percentile (calibrated to the schooling or health results above)
within its quartile of NDI.
The third is kink which is to identify those below some threshold of the distribution and
bring those up by a given amount. In our simulation we take a low bar threshold as the

13
Figure 2: Illustrating the analytical decomposition of the shift in national aggregates of indicators of well-being of schooling and health into
movements upward with increased national development (Drive) and overall improvements for a given level of national development (Shift)
Source: Author’s calculations as described

14
average of the lowest quartile of countries. We then target a program/transfer/policy to
those individuals below that threshold and raise their outcome by an amount (that can be
tuned, but which in the figures below is half of the average of the lower bound).
For each of these three scenarios of drive, shift, kink we calculate the improvement in three
indicators of deprivation for each of two lines—a low bar line and an ideal goal9.
Headcount. This is the percent of the population that is below the threshold of either “low
bar” or “ideal.”
Gap. This is the average distance those below the threshold of those below the threshold.
This takes into account that in a “headcount” measure if the threshold is set at 26 then 25
and 14 both count the same—even though the person at 25 is much better off.
Squared intensity. This is the average of the square of the gap below the threshold normed by
the threshold. This gives more weight in calculating deprivation to those the furthest below
the threshold (by squaring the gap).
Figures 3a,3b and 3c present the base case and three scenarios (drive, shift, kink) for each of
a representative country at the average of the three quartiles of “developing” countries.
These simulations illustrate four key points.
First, significant progress in on low bar goals in all three types of countries can be made with
“kink” instruments. We are not calculating costs and benefits, but targeted transfers (or
programs in education, health, sanitation, etc.) can be effective (if not efficient) in increasing
the well-being in those dimensions of the least well off.
Figure 2a (with low NDI countries) illustrate the changes in the distribution with a “kink”
instrument as a simulated transfer pulls those at zero up to a positive value and creates a
lump in the distribution just above the low bar threshold by pulling people up to that level
(or just above).
But since the fraction below a low bar threshold are smaller in higher NDI countries kink
instruments affect fewer and fewer people. So the “headcount” (in these graphs below an
education threshold) is reduced by 63 percent by a “kink” in low middle NDI (quartile II)
countries—but that is from 4.3 to 1.6 percent of the population.
Second, “drive” and “shift” also produce big improvements in the well-being of those who
start below the low-bar threshold. Increases in NDI that led a country to have the typical
performance of countries with equivalent levels of national development would also be
associated with significant improvements in the well-being of the least well off. In the “low
9 These are of course the exact analogues of FGT(α) poverty indices for α=0,1,2 (Foster, Greer, Theorbecke
1984).

15
Figure 3a

16
Figure 3b

17
Figure 3c

18
income” case gains from national development of 10 (e.g. Ethiopia, Rwanda) to 20 (e.g.
Pakistan, Senegal) that produced a shift of 25 points (the difference in the education index
between these quartiles of NDI) would be associated with the fraction of the population
below a low bar threshold of 26 falling from 47 percent of the population to just 4.9 percent.
Improvements for a given quartile of NDI from the median to the 75th percentile would also
produce massive reductions in “headcount” of those below the low bar threshold.
Note this simple simulation model is not intended to assess the trade-offs between drive,
shift, and kink. These questions can only be answered in the particulars of costs and benefits
of specific instruments. Moreover, there need not be any trade-off in general as an overall
strategy for addressing the least well off globally will involve all three types of instruments.
Third, low-bar global goals are increasingly irrelevant to countries in the “middle” of the
NDI distribution. In these graphs we set the low bar threshold at the average of the bottom
quartile of countries. For lower middle NDI countries only 4.5 percent of households are
below that level, for upper middle countries less than one percent.
The policy agenda of countries cannot be defined solely, or even principally, in terms of its
impacts on less than 5 percent of their population.
Fourth, if one defines high goals or ideals, taking for instance the 25th percentile country of
the highest NDI countries as a standard (that is, getting to the low end of “developed” like
Chile or Hungary), then “kink” instruments can play little or no role in progress towards
those goals—even for the lowest income countries.
On one level this is obvious as kink instruments by definition cannot lower the headcount
for high goals at all. But this illustrates why headcount like goals are, in general, dubious
welfare metrics.
But the Squared Intensity Index is meant to give big weight to gains to the worst off (as the
gain counts in the aggregate by the square of the distance from the goal). However, even for
the poorest countries the kink instrument only produces a 13 percent reduction in the SQII
whereas the “shift” of 8 points produced a gain of 25 percent and the “drive” to the next
quartile produced a gain in the squared intensity measure of 68 percent. Again, the numerical
specifics are just illustrative but the point is that even if one puts the most importance to the
gains of the poorest within each country broad based gains still produce large reductions in
measures of deprivation. But this is asymmetric: kink instruments cannot have equivalently
large impact on high bar goals.
If developing countries have aspirations to have levels of well-being for their citizens at even
the lowest levels of the rich countries then it has to come about through broad based
improvements—either through “drive” in national development or in “shifts” in sector
performance.

19
These four points are just arithmetic. Somewhat complicated arithmetic, but the results are
nevertheless the inevitable consequences of facts about distributions and arithmetic. The
facts are that (a) levels of indicators of well-being differ massively by levels of National
Development, (b) there are big differences across countries (and time) on average in levels of
well being (even for a level of NDI) and (c) these cross-national differences are large (in our
simulation) compared to the differences across individuals within countries. Those three
facts built into any framework with any indicators of well being will (re)produce our results.
The lower the goal the more attractive are the tactics of “kinky development” of using
targeted programs to improve just the lower tail. If the target is set low enough, then only
efforts of reaching the poorest or most disadvantaged people in the poorest countries can
make any difference, as nearly everyone in most countries is already above the bar.
Conversely, if the bar is set high then it is similarly obvious that “kinky development” cannot
be enough to reach the target. That is, if the person of average income has learning
outcomes or health outcomes or infrastructure access quality or consumption expenditures
below an international target then programs that bring the poorer near the performance of
the typical person—while they do improve well-being—do not contribute enough to bring a
country towards the target. With high targets essentially only drive and shift can play a role.
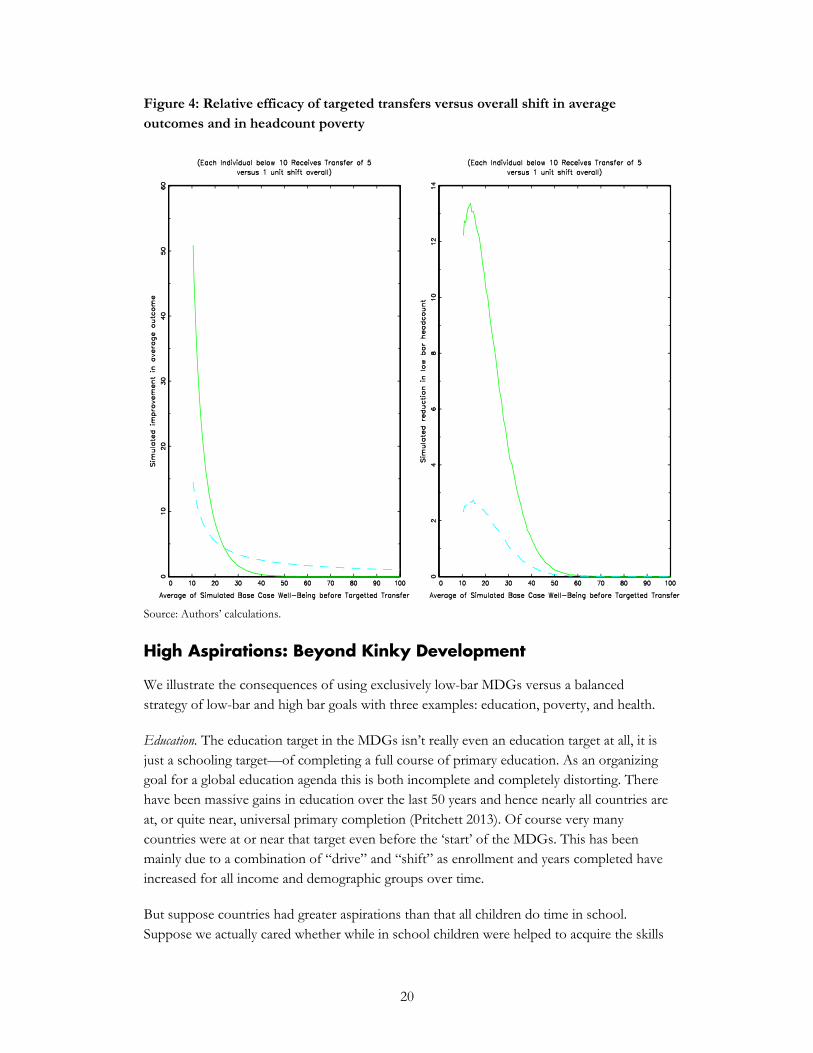
Figure 4 shows the percentage improvement in the average of our simulated well-being
measure across levels of national development (which is assumed to be the average of the
well-being indicator) from a transfer to all people below the threshold of 10 who are each
given half that magnitude. When the average is very low this obviously causes a large
increase. But even by the time the pre-transfer average is 20 the average gain is only about 5
percent.
We are trying to illustrate the distinction between “inclusive development” and “shared
prosperity” as a description of development goals—in which gains for nearly everyone in
measures of individual well-being are counted (perhaps excluding only the interests of the
globally prosperous) versus low bar development like the MDGs. Low bar targets create the
possibility of gains—and even achievement of goals—through “exclusive” means. That is, it
is possible that sharply targeted programs appear to be10 the most cost effective means of
meeting low bar goals—even though these, by construction, exclude most people from their
benefits.
10 We use the phrase “appear to be” as discussions of targeting often assume away the political economy of
budgets and assume that a given budget can be re-targeted without any dynamic feedback on the magnitude of
the budget for the program. This is naïve, at best, and simple formal models can show that “more for the poor is
less for the poor” (Gelbach and Pritchett 2000). The superiority of targeted programs at achieving objectives
cannot be made merely on the basis of static calculations of the gains from the hypothetical reallocation of a
given budget.
20
Figure 4: Relative efficacy of targeted transfers versus overall shift in average
outcomes and in headcount poverty
Source: Authors’ calculations.
High Aspirations: Beyond Kinky Development
We illustrate the consequences of using exclusively low-bar MDGs versus a balanced
strategy of low-bar and high bar goals with three examples: education, poverty, and health.
Education. The education target in the MDGs isn’t really even an education target at all, it is
just a schooling target—of completing a full course of primary education. As an organizing
goal for a global education agenda this is both incomplete and completely distorting. There
have been massive gains in education over the last 50 years and hence nearly all countries are
at, or quite near, universal primary completion (Pritchett 2013). Of course very many
countries were at or near that target even before the ‘start’ of the MDGs. This has been
mainly due to a combination of “drive” and “shift” as enrollment and years completed have
increased for all income and demographic groups over time.
But suppose countries had greater aspirations than that all children do time in school.
Suppose we actually cared whether while in school children were helped to acquire the skills

21
and capabilities and dispositions that will help them thrive in their adult roles as parents and
citizens and productive contributors. The rich industrial countries also focus on education
and engage in periodic assessments of what children know, including the Programme for
International Student Assessment (PISA) organized by the OECD. On these assessments of
the skills of 15 year olds the instrument is normed such that the average OECD student
scores 500. But suppose the developing countries only aspired that their children do as well
as the economically disadvantaged children in OECD countries. On the PISA 2009 reading scale
student the OECD students at the 25th percentile of a socio-economic index in their
country—the disadvantaged of high NDI countries--scored 432.
Yet, as Figure 5 shows, the average scores in low NDI countries are much, much lower than
the scores of even the economically disadvantaged in the OECD. Even the students from
the 75th percentile and even in upper middle NDI countries have scores substantially lower
than the OECD average: Tunisia 462, Thailand 469, Peru 432, Indonesia 447, Brazil 474.
The arrows for selected countries represent a score one student standard deviation higher
than the mean (which in a Normal distribution would be the 84th percentile of all students).
Even in a highly advanced upper middle NDI country like Argentina the 84th percentile is
less than the OECD 50th. Moreover, in many low NDI countries even the 84th percentile
(which are the education “elite”) is lower than the typical socio-economically disadvantaged
student in the OECD.
‘Kinking’ those furthest behind in each country to the country average would be completely
inadequate, although there is more scope for improvement to higher standards at a given
HDI (Honduras and Indonesia have roughly similar NDI—but learning outcomes are much
better in Indonesia). But to make progress against even modest goals in student learning or
capabilities requires either (a) shift: increases in average scores at a given level of NDI and/or
(b) drive towards a considerably higher NDI.
While certainly access to schooling and a goal of completion of primary schooling are
laudable goals, the principal problem with education in developing countries is not that “the
poor” are excluded from quality schooling—it is that there isn’t quality schooling for
(almost) anyone.
So, for instance, take a “kink” instrument that has gotten much attention in academic and
developmental circles: conditional cash transfers (CCT). This provides cash transfers to
families who are identified as poor but their continued receipt of the transfer is conditional
on compliance with certain behaviors—one of which is almost always keeping children of
the appropriate age in school. Starting with PROGRESA (now Oportunidades) in Mexico
and its widely cited randomized evaluation(s) programs of this type have spread to Brazil and
to dozens of other countries.
The CCT is a paradigm of the kinky development approach as it is focused on two low bar
goals—reduction of income/consumption poverty (through the transfer) and keeping kids
from poorer households in school (through the conditions of the transfer). Both of these are

22
Figure 5: Even children in school at age 15 in middle national development countries
typically have assessed learning far below even the socio-economically less well off in
OECD countries—and in many cases even the best students are well below the
OECD norm.
Source: Author’s calculations with TIMSS 2011 and PISA 2009+ results.
laudable and important goals and it may well be that a CCT program is a cost-effective
instrument for improving human well-being. Repeated studies suggest that CCTs can have
an impact on outcomes as diverse as earnings, assets, labor hours, health, nutrition,
enrollment and (even, in some cases though not others) test scores11.
But think about the education challenges in India (admittedly just one example, but it is one
example with over a billion people). The latest numbers from the independent ASER survey
in rural India show that 96.5 percent of children aged 6 to 14 are enrolled in school. So the
maximum possible CCT impact on enrollments affects only 3.5 percent of the total
population. Everyone else is, as they say, infra-marginal. The ASER learning assessment
shows that only 46.8 percent of children in standard V (the last year of primary school) could
11 Interestingly, the original impact evaluations of PROGRESA did not find that the “control” group showed
higher test scores even though they did have some modest increases in years of schooling completed (Behrman
et. al. 2005). A study in Malawi did find increases in scores (Baird, Mcintosh and Ozler 2011).

23
read a simple standard II level text and only 53 percent can do a simple subtraction problem.
So the maximum gain12 from a CCT that produced universal primary completion would be an
additional 1.75 percent of children able to read a grade II story and do subtraction13.
Even were an Indian CCT to take on the considerably (impractically) more ambitious goal of
keeping all Indian kids in school through to the age of fifteen, this would have a limited
impact on learning outcomes given the current quality of the education system. According to
the PISA 2009+ results the 95th percentile of 15 year old children enrolled in school (so
already a select group) in Himachal Pradesh (widely considered an educationally advanced
state) is 443. So the top 5th percentile in a well performing state of India score lower than
that of an economically disadvantaged child (25th percentile of SES) in well functioning
OECD systems (e.g. Finland, Korea, Canada, Denmark). Adequate learning is just not a
problem of “inclusion” of “the poor” or social disadvantage but affects nearly every Indian
household.
Suppose India had a national goal of reaching the level of capabilities equivalent to a PISA
score of 432. Even of CCTs did produce universal enrollment they would only play a very
small role in achieving even this modest goal for education as the problem is not that “the
rich” or “the middle class” have good schools and “the poor” have bad schools, the problem
is a system problem and requires system solutions.
Poverty
In the international discussions of goals for poverty for a post-2015 world the leaders of the
middle income developing countries should adopt a very simple approach: “We will agree to
any standard for global poverty that all national leaders are willing to apply to their own
citizens.” For instance, the High Level Panel report was produced by the leaders of Liberia,
Indonesia and the UK. Each has their own national standard for poverty, but what are the
“global” standards of poverty? Since there will a lower bound that defines “extreme” poverty
and a set of national lines that each country uses for its own purpose and an upper bound,
more specifically, what will be the upper bound poverty line? We think that David Cameron
should mean by global poverty exactly what he means when he says poverty for citizens of
the UK. More pointedly, why would President Yudhoyono accept that Indonesian citizens
are not poor in a global sense at standards of living much lower than those at which Cameron
12 This is a maximum gain as it assumes that the marginal child induced to remain in school by a CCT would have
the learning profile of the average child. Obviously if children with worse learning outcomes or in worse schools
in promoting learning drop out at higher rates then this assumption could be wildly optimistic. 13 This still may, or may not, be a cost-effective education intervention depending on how one treats the costs of
a CCT. If one assumes that the CT (cash transfer) is going to happen and the only costs is adding a C (condition)
to it then the incremental costs of adding a C to a CT can be low (just the administrative costs of following up on
the enforcement of the condition) and hence even with tiny impacts adding a C to a CT can be cost effective.
However, this doesn’t speak to whether or not the CT was itself a cost effective intervention which has to be
justified almost entirely on the cost-benefit calculus of the cash transfer itself (for a less terse explication see
Pritchett 2004).

24
claims UK citizens are poor? Are Indonesians somehow less entitled to aspirations of
material well being than British?
A global poverty line should be based on global standards. A broad development agenda
with a low and high poverty line can focus on the inclusive agenda of raising six billion
people into prosperity (and 1 billion out of destitution) as opposed to the exclusionary goal
that makes only the gains for 1 in 7 people on the planet count.
The “dollar a day” standard (which has, with inflation become the “buck and a quarter a
day” standard) was based on adopting as the global low bar poverty line a line that was the
national poverty line of only the poorest of countries (Ravallion, Datt and van de Walle 1991).
As a definition of “extreme” poverty or destitution this is an excellent definition. However
adopting this as the only globally used definition of poverty creates a low bar standard that
few countries actually accept for their own citizens as poverty lines tend to increase with
development.
If a low bar poverty line is accepted as the only global definition of poverty used in global
discussions then, as shown in the simulations above, instruments that kink the distribution
of income by making transfers to poor individuals in poor countries could in principle (and
sometimes in practice) produce significant reductions in extreme poverty or poverty relative
to a poverty line.
‘Kinking’ development has had a significant impact on the quality of life in many parts of the
developing world. For instance, Brazil has been very successful in reducing poverty even an
environment of very modest income growth because of transfer programs and because its
growth incidence has been progressive with higher percentage growth of incomes for those
in the bottom half of the income distribution (Ferreira, Leite and Ravallion 2009). The Bolsa
Familia cash transfer program in Brazil appears to have reduced the incidence and depth of
poverty in that country. Transfers from $18 to $175 per month are provided to targeted
households (and based on compliance with conditions related to health and education). The
program has been associated with higher expenditures on food, education, and children’s
clothing, higher school attendance and lower child mortality from causes including
malnutrition, diarrhea, and lower respiratory infections (Rasella et al 2013).
But even for “dollar a day” poverty nearly all (up to 95 percent) of the variation across
countries in the poverty reduction is associated with increases in average consumption (e.g.
“drive”) and very little with changes in the shape of the consumption/income distribution
across households (Kraay 2006)14.
14 The larger (and looser) question of the relationship between growth in GDP per capita and poverty is plagued
by measurement issues as poverty is often calculated from household data that doesn’t align with national
accounts data (Deaton 2005). For instance, in India much of reason that high GDP per capita growth has
translated into relatively modest progress on poverty is that the household data on which poverty is measured
shows much slower growth in average consumption expenditures than does national accounts consumption and

25
How is national development related to poverty? Not surprisingly, the answer depends
entirely on how one defines ‘poverty’. Figure 6 shows the scatter plot of headcount poverty
and NDI at various poverty lines with a linear splined regression so that the association of
NDI and poverty is allowed to be different for each quartile of NDI. At a “dollar a day”
poverty definition higher HDI is associated with sharply lower poverty but the slope falls off
for upper middle income countries. So one could say “the impact of national development
on poverty is lower the higher the starting level of national development.”
But using exactly the same data sources and headcount poverty definition but a five dollar a
day poverty line the relationship is exactly the opposite15. Increases in NDI have very little
association on headcount poverty at low levels (for the obvious arithmetic reasons clear
from the simulations above) then has nearly exactly the same relationship for all higher
quartiles of NDI. The “two dollar a day” fitted association (shown as a line but without the
individual data displayed) is intermediate between the two as the lowest quartile gets less
steep and upper quartile of NDI steeper than “dollar a day” and obviously the “ten dollar a
day” relationship would be flat over a larger range16.
It is equally obvious that transfers among individuals within countries can do little for
reducing headcount poverty at even modestly higher poverty lines, even for low NDI
countries. As Ravallion (2010) shows, transfers within “middle income” countries (like India)
can do almost nothing to cover the poverty gap. Likewise, Birdsall (2012) shows that since
nearly all Indian households are below the four dollar a day line there is no “tax/transfer”
scheme within India that can reduce poverty if poverty id defined at that level—which is still
only a third of the poverty line of richer countries.
hence has little or nothing to do with the “growth incidence” (which in the household data actually benefits the
poor more than the middle) (see Deaton and Kozell 2005). 15 Data on “five dollar a day” headcount poverty are taken by the authors from the World Bank’s PovCal website
on May 26th 2013. This is exactly the same source as the officially reported “dollar a day” and “two dollar a day”
figures.
16 This also illustrates the weaknesses in general of “headcount” as a poverty measure given its 0/1 intensity across a threshold, as a “gap” or “SQI” measure would better capture progress with higher poverty lines.

26
Figure 6: The relationship between “poverty” and national development depends
entirely on the poverty line used—increases in national development are associated
with more reduction poverty starting from high than low levels of development with a
high poverty line and the opposite with a low poverty line
Health
Across countries, aid has helped ‘kink’ developing country outcomes by helping to expand
bed-net access, for example. Gabriel Demombynes and Sofia Trommlerova (2012) of the
World Bank estimate from household survey data that the proportion of kids across the
region who died before their fifth birthday fell more than 4 percent per year from 2000 to
2010. They suggest a considerable part of that decline is linked to lower malaria deaths. In
turn, the number of insecticide-treated bed nets in use in Sub-Saharan Africa climbed from
5.6 million in 2004 to 145 million in 2010, according to UNICEF, and most were donor-
funded.
But kinking development still has limits. For all the successes of Bolsa Familia, for example,
the latest data from the World Bank still suggests an under-five mortality rate in Brazil that is
twice that in the US and that 11% of the population lives on less than $2 a day –or less than

27
one fifth of the US poverty rate. And across countries, for all of the donor efforts to reduce
child mortality through funding vaccination programs and bed net provision, low income
countries still see a 9.5% under-five mortality rate—ten times higher than the 0.6% in high
income countries17.
Compare the power of shifting outcomes in health. Over the long term, the general spread
of technology and new ideas has had a considerable impact on outcomes –especially in
health. Kenny (2008), based on data from Abouharb and Kimball (2007) estimates that the
cross-country relationship between income and infant mortality at particular times would
suggest a country with a GDP per capita of around $5,000 in 1900 would expect to have a
mortality rate of around 15%. A country with the same income in 2000 would expect an
infant mortality rate closer to 3.3%. So “shift” over time of the overall distribution of child
mortality risk for all income groups has been important for overall progress.
Driving toward national development also has a significant relationship with improved
health. The average under-five mortality rate for countries with an NDI greater than 50 is 5.7
per 1,000 live births. None of the 77 countries with an NDI less than 50 have an under-five
mortality rate less than 5.7. Only 5 countries with NDI<50 have an under-five mortality rate
of 11.4 or less (twice the average rate for countries with an NDI>50).
As seen in Figure 7 even the relatively well-off in low NDI countries (the top quintile on an
index of household assets) have fewer of their children survive than the poorest in better off
countries. Bringing the health status of the poor in India towards the middle would be great
progress, but without progress in the middle (through drive or shift) they would still have
levels of child mortality ten times as high as OECD countries.
17 Again, Kenny and Dykstra (2013) find that cumulative ODA per capita 2001-2010 has a negative relationship
to rates of progress towards various MDG targets. While that is surely linked to aid being channeled to those
countries furthest behind on the MDGs, it still suggests some limits to the power of the global community to
kink development.

28
Figure 7: Bringing the Under 5 mortality of the poor in low national development
countries would improve outcomes—but the mortality rates of the richest 20 percent
are many fold higher than of the poorest 20 percent in high NDI countries
Conclusion
Adding high-bar development targets alongside global minimums will have four benefits. It
will increase the relevance of goals to middle income countries. It will improve their ethical
basis by creating universal standards –making clear that poverty or ill health that is
unacceptable for the most disadvantaged in the US or UK is unacceptable everywhere. It will
create a set of objectives around which a viable domestic political coalition can be built.
Finally, it will improve their policy impact, (re)-focusing development efforts on systemic
change in policies and capability to implement policy rather than temporary fixes and
specific interventions.
The world should focus on ending extreme poverty, and it is important that the goals we set
in that regard are realistic–plausible to meet in the fifteen years available—but the goals
achievable with limited means in limited time should not be confused with ideals. The
rhetoric of the MDGs, while powerful for mobilizing action, may have been over-successful
in defining development down. They (inadvertently) fostered a view in which ‘development

29
success’ implies only overcoming the most extreme of deprivations. Perhaps this is why, for
example, the British aid agency, DfID could announce it was dropping financial support for
development to India—a country with perhaps the largest development challenges in the
world—amid the public sentiment that India was no longer a low-bar development priority.
Development Ideals would help broaden the discussion of what development is about.
Defeating extreme poverty is a priority --but Development Ideals would not veer to the
exclusive nature of a low bar poverty but be inclusive in making a global recognition that the
quality of life of at least six billion, not just the one billion in extreme poverty, remains far
from satisfactory. Ideals would provide a rationale for upper middle-income engagement
with the post-2015 development agenda. And they provide the rationale for a far broader
engagement with development on the behalf of rich countries than attempting to kink
progress through aid transfers. Meeting development ideals is likely to involve considerable
changes in rich world policies from trade to investment through technology policy and
migration. The Development Ideals agenda is a global development agenda going far beyond
an aid advocacy focused agenda.
Millennium Development Ideals also help to illuminate the technological and institutional
challenges that need to be overcome if everyone worldwide is to have a sustainably good
standard of living. Using Kate Raworth’s language, of ‘doughnut economics’ we want
everyone outside of the ‘doughnut hole’ of poverty, with access to things like food and
water, education, health, energy, jobs, equity and equality (2013). That’s what Raworth calls
the social foundation and we describe as millennium development ideals. But, second,
Raworth argues it is important that humanity also lives inside the doughnut’s outer ring,
what she terms the ‘environmental ceiling’ –in terms of sustainable use of fresh water, land,
the atmospheric commons and so on. Setting Millennium Development Ideals suggests
where the social floor should rest, with implications about what those already above the
social floor need to do to ensure that a world of seven (or nine billion) can join them
without breaking the environmental ceiling.
The MDGs provided a welcome focus on the world’s most deprived. Any post-2015
development agenda should retain that focus. But it should also clearly acknowledge
development doesn’t end with the defeat of extreme poverty. Development Ideals provide
that tool. One such Ideal might be a world free of $12.50 a day poverty, another might be a
universal educated capabilities measure like a PISA score of 432, but the exact language and
coverage of Ideals should rightly be a matter of worldwide debate. Now is the time to start
that discussion.

30
References
Abouharb, M. Rodwan and Anessa L. Kimball. 2007. "A New Dataset on Infant Mortality
Rates, 1816—2002." Journal of Peace Research no. 44 (6):743-754.
Acemoglu, Daron and Simon Johnson. 2007. "Disease and Development: the Effect of Life
Expectancy on Economic Growth." Journal of Political Economy no. 115 (6):925-985.
Baird, Sarah, Craig MacIntosh, and Berk Ozler. 2011. "Cash or Condition? Evidence from a
Cash Transfer Experiment." Quarterly Journal of Economics no. 126 (4):1709-1753.
Baird, Sarah, Craig McIntosh, and Berk Ozler. 2009. "Designing Cost-Effective Cash
Transfer Programs to Boost Schooling among Young Women in Sub-Saharan Africa."
World Bank Policy Research Working Paper Series (WPS5090).
Behrman, Jere R., Piyali Segupta, and Petra Todd. 2005. "Progressing Through
PROGRESA: An Impact Assessment of School Subsidy Experiment in Rural Mexico."
Economic Development and Cultural Change no. 54 (1):237-275.
Benhabib, Jess and Mark M. Spiegel. 1994. "The role of human capital in economic
development evidence from aggregate cross-country data." Journal of Monetary
Economics no. 34 (2):143-173.
Bils, Mark and Peter J Klenow. 2000. "Does Schooling Cause Growth?" American
Economic Review no. 90 (5):1160-1183.
Birdsall, Nancy. 2012. “India’s New Not-Poor Not-Middle Class – and Its Implications.”
Presentation at the Centre for Policy Research on November 6, 2012. Available at
http://www.cgdev.org/publication
Caselli, Francesco. 2004. "Accounting for Cross-Country Income Differences." Center for
Economic Policy Research Discussion Paper.
Clemens, Michael, Montenegor, Claudiao E. and Lant Pritchett. 2008. "The Place Premium:
Wage Differences for Identical Workers across the U.S. Border." Center for Global
Development Working Paper Series.
Deaton, Angus. 2005. "Measuring Poverty in a Growing World (or Measuring Growth in a
Poor World)." The Review of Economics and Statistics no. 87 (1):1-19.
———. 2008. "Income, Health, and Well-Being around the World: Evidence from the
Gallup World Poll." Journal of Economic Perspectives no. 22 (2):53-72. doi: doi:
10.1257/jep.22.2.53.
Deaton, Angus and Valerie Kozel. 2005. "Data and Dogma: The Great Indian Poverty
Debate." World Bank Research Observer no. 20 (2):177-199.
Demombynes, Gabriel and Sofia Karina Trommlerova. 2012. "What Has Driven the Decline
of Infant Mortality in Kenya?" World Bank Policy Research Working Paper No. 6057.
Ferreira, Francisco H.G. Leite, Phillippe G. and Martin Ravallion. 2009. "Poverty reduction
without economic growth?" Journal of Development Economics no. 93 (1):20-36.
Foster, James, Greer Joel, and Erik Thorbecke. 1984. "Notes and Comments: A Class of
Decomposable Poverty Measures." Econometrica no. 52 (3):761-766.
Gelbach, Jonah B., and Lant Prtichett. 2000. "Is more for the poor less for the poor? The
politics of means-tested targeting." Topics in Economic Analysis & Policy no. 2 (1).

31
Hall, Robert, and Charles I Jones. 1999. "Why do some countries produce so much more
output per capita than others?" Quarterly Journal of Economics no. 114 (1):83-116.
Hausmann, Ricardo and César A. Hidalgo. 2011. "The Network Structure of Economic
Output." Journal of Economic Growth no. 16:309-342.
Inglehart, Ronald. 1997. “Modernization and Postmodernization: Cultural, Economic, and
Political Change in 43 Societies.” Princeton, NJ: Princeton University Press.
Kahneman, Daniel, and Angus Deaton. 2010. "High income improves evaluation of life but
not emotional well-being." Proceedings of the National Academy of Sciences no. 107
(38):16489-16493. doi: 10.1073/pnas.1011492107.
Kenny, Charles. 2008. "A Century of the Infant Mortality Revolution." Available from
charleskenny.blogs.com/weblog/files/histinf.pdf
Kraay, Aart. 2006. "When is Growth Pro-Poor: Evidence from a Panel of Countries,"
Journal of Development Economics no. 80 (2): 198-227.
Pritchett, Lant. 2004. "Towards a New Consensus for Addressing the Global Challenge of
the Lack of Education." In Global Crises, Global Solutions, edited by Bjorn Lomborg.
Cambridge UK: Cambridge University Press.
———. 2013. "The Rebirth of Education: From 19th Century Schools to 21st Century
Learning." Washington DC: Brookings Institution Press for the Center for Global
Development.
Pritchett, Lant and Lawrence Summers. 1996. "Wealthier is Healthier." Journal of Human
Resources no. 31 (4).
Rasella, Davide, Aquino, Rosana, Santos, Carlos AT Paes-Sousa, Rômulo and Mauricio L
Barreto. 2013. "Effect of a conditional cash transfer programme on childhood mortality:
a nationwide analysis of Brazilian municipalities." The Lancet.
Ravallion, Martin, Gaurav Datt, and Dominique van de Walle. 1991. "Quantifying absolute
poverty in the developing world." Review of Income and Wealth no. 37 (4):345-361. doi:
10.1111/j.1475-4991.1991.tb00378.x.
Ravallion, Martin. 2010. "Do poorer countries have less capacity for redistribution?" Journal
of Globalization and Development no 1 (2).
Raworth, Kate. Doughnut Economics. 2013. Available from
http://oxfamblogs.org/doughnut/.
Stevenson, Betsy and Justin Wolfers. 2013. "Subjective well-Being and income: Is there any
evidence of satiation?" NBER Working Paper No. 14581.
Suryahadi, Asep, Sumarto,Sudarno, and Lant Pritchett. 2000. "Quantifying Vulnerability to
Poverty: A Proposed Measure, Applied to Indonesia." Social Monitoring and Early
Response Unit, Jakarta. doi: 10.1596/1813-9450-2437.
Taylor, Park, Funk, Cary, and April Clark. 2006. “Luxury or Necessity? Things We Can't
Live Without: The List Has Grown in the Past Decade.” Pew Research Center Social
Trends Report.

32
Appendix 1: Decomposition for Health Index based on Under 5 Mortality

33