large-scale distribution of ch in the western north
TRANSCRIPT

Large-scale distribution of CH4 in the western North Pacific:
Sources and transport from the Asian continent
Karen B. Bartlett,1 Glen W. Sachse,2 Thomas Slate,3 Charles Harward,4
and Donald R. Blake5
Received 24 October 2002; revised 14 May 2003; accepted 30 May 2003; published 23 September 2003.
[1] Methane (CH4) mixing ratios in the northern Pacific Basin were sampled from twoaircraft during the TRACE-P mission (Transport and Chemical Evolution over the Pacific)from late February through early April 2001 using a tunable diode laser system. Describedin more detail by Jacob et al. [2003], the mission was designed to characterize Asianoutflow to the Pacific, determine its chemical evolution, and assess changes to theatmosphere resulting from the rapid industrialization and increased energy usage on theAsian continent. The high-resolution, high-precision data set of roughly 13,800 CH4
measurements ranged between 1602 ppbv in stratospherically influenced air and2149 ppbv in highly polluted air. Overall, CH4 mixing ratios were highly correlated with avariety of other trace gases characteristic of a mix of anthropogenic industrial andcombustion sources and were strikingly correlated with ethane (C2H6) in particular.Averages with latitude in the near-surface (0–2 km) show that CH4 was elevated wellabove background levels north of 15�N close to the Asian continent. In the central andeastern Pacific, levels of CH4 were lower as continental inputs were mixed horizontallyand vertically during transport. Overall, the correlation between CH4 and otherhydrocarbons such as ethane (C2H6), ethyne (C2H2), and propane (C3H8) as well as theurban/industrial tracer perchloroethene (C2Cl4), suggests that for CH4 colocated sourcessuch as landfills, wastewater treatment, and fossil fuel use associated with urban areasdominate regional inputs at this time. Comparisons between measurements made duringTRACE-P and those of PEM-West B, flown during roughly the same time of year andunder a similar meteorological setting 7 years earlier, suggest that although the TRACE-PCH4 observations are higher, the changes are not significantly greater than the increasesseen in background air over this time interval. INDEX TERMS: 0345 Atmospheric Composition
and Structure: Pollution—urban and regional (0305); 0365 Atmospheric Composition and Structure:
Troposphere—composition and chemistry; 0368 Atmospheric Composition and Structure: Troposphere—
constituent transport and chemistry; 1610 Global Change: Atmosphere (0315, 0325); KEYWORDS: methane,
TRACE-P, Pacific Basin
Citation: Bartlett, K. B., G. W. Sachse, T. Slate, C. Harward, and D. R. Blake, Large-scale distribution of CH4 in the western North
Pacific: Sources and transport from the Asian continent, J. Geophys. Res., 108(D20), 8807, doi:10.1029/2002JD003076, 2003.
1. Introduction
[2] The increasing industrialization occurring throughoutthe Asian continent has spurred a series of research effortsover the past decade, attempting to assess how thesequantitative and qualitative changes in emissions haveaffected the global atmosphere. These efforts have includedNASA’s PEM West A and B missions, flown in 1991 and
1994, respectively, which examined the effects of seasonaldifferences in meteorology, transport, and source strengthson air quality over the Pacific Basin (see Hoell et al. [1997]for summary). The most recent research program conductedover this region is that of TRACE-P (Transport and Chem-ical Evolution over the Pacific), focused on improving ourunderstanding of how outflow from the Asian continentaffects the composition of the atmosphere over the Pacificand assessing the changes that have occurred since PEMWest, as rapid industrialization and increased energy usagehave continued [Streets et al., 2003]. TRACE-P is the latestaircraft mission flown by NASA as part of its GlobalTropospheric Experiment (GTE) which has undertaken toboth characterize the natural processes controlling thechemistry of the troposphere and to determine how anthro-pogenic perturbations have affected this chemistry. Buildingon the earlier PEM-West missions, TRACE-P was flownfrom 23 February–9 April of 2001, when continental
JOURNAL OF GEOPHYSICAL RESEARCH, VOL. 108, NO. D20, 8807, doi:10.1029/2002JD003076, 2003
1Institute for the Study of Earth, Oceans, and Space, University of NewHampshire, Durham, New Hampshire, USA.
2NASA Langley Research Center, Hampton, Virginia, USA.3Swales Aerospace, Hampton, Virginia, USA.4Science Applications International Corporation, Hampton, Virginia,
USA.5Department of Chemistry, University of California, Irvine, Irvine,
California, USA.
Copyright 2003 by the American Geophysical Union.0148-0227/03/2002JD003076$09.00
GTE 28 - 1

outflow to the Pacific Basin was expected to be near itspeak due to strong westerly transport and active convectionover Asia [Merrill et al., 1997]. Matching the timing ofTRACE-P to that of PEM-West B also provides an oppor-tunity to compare results under similar meteorologicalconditions and to focus on possible changes in emissionsover the intervening 7 years.[3] The TRACE-P mission used two NASA aircraft, a
DC-8 with a maximum sampling altitude of about 12 kmand a P-3B with a maximum sampling altitude of about7 km. Samples were taken most intensively between roughly20�N and 40�N. Flight tracks and a description of theinstrumentation and its characteristics can be found in thework of Jacob et al. [2003]. Sampling was conducted laterby several weeks than that during PEM-West B (hereafternoted as PWB), which was flown 25 January–16 March1994. As detailed by Fuelberg et al. [2003], TRACE-P wasflown during the transition between air flows characteristicof winter to those of spring. The ITCZ (IntertropicalConvergence Zone) was not well developed during themission and the Japan Jet, located at about 35�N andextending west back to Africa, was relatively strong, as istypical for this time of year. Widespread areas of precipita-tion covered the middle latitudes of the North Pacific Basinduring the mission, some in association with lightning andthe rapid vertical transport characteristic of deep convection.TRACE-P sampling occurred during neutral to weak LaNina conditions [Fuelberg et al., 2003] and flow patternsand precipitation appear to be quite similar to the meteoro-logical conditions observed during PWB.[4] Methane (CH4) is the most abundant atmospheric
hydrocarbon, with a lifetime of roughly 9 years [Prinn etal., 1995]. Although atmospheric levels of CH4 are muchlower than CO2, the fact that CH4 absorbs outgoing radia-tion more efficiently means that change in its atmosphericburden significantly impacts climate change. Methane playsimportant radiative and chemical roles in both the tropo-sphere and stratosphere and has undergone a variable andpoorly understood increase over the last several hundredyears [Etheridge et al., 1998; Dlugokencky et al., 1994,1998; Gupta et al., 1996; Francey et al., 1999; Braunlich etal., 2001]. Sources of CH4 are both natural and anthropo-genic and are linked to climate variables as well as humanpopulations and energy usage. Ongoing changes occurringover the Asian continent in population, land use, and thesources and quantity of energy used will significantlyimpact the release of CH4 [Streets et al., 2001].[5] TRACE-P was flown in the northern Asian spring.
Methane emissions from natural wetlands as well as ricepaddies, calculated to be the single largest anthropogeni-cally controlled source in this region [Streets et al., 2001],are therefore expected to be near seasonal lows. Inversemodeling of atmospheric concentrations confirm this gen-eralization and suggest that emissions from natural wetlandsin southeast Asia result in only minor increases in CH4
levels during the spring [Houweling et al., 2000]. Temper-atures and rainfall, major controls on emissions from wet-lands, are relatively low during this period and the seasonalplanting of rice is just commencing [Matthews et al., 1991;Yao et al., 1996; Khalil et al., 1998]. In China for example,Yao et al. [1996] estimate that 95% of the annual flux ofCH4 from rice paddies occurs between April and October,
with peak emissions in June. Emissions of CH4 wouldtherefore expected to be dominated by urban and industrialsources such as landfills, wastewater treatment, and fuelusage. In more rural areas, CH4 produced during entericfermentation by ruminants such as cattle makes a significantcontribution. These sources would not be expected to showlarge seasonal changes. Incomplete combustion during bio-fuel and biomass burning can also release significantamounts of CH4. Biomass burning varies seasonally andshould be decreasing from its winter seasonal maximum[Hao and Liu, 1994; Cooke et al., 1996; Randriambelo etal., 2000]. Biofuel burning, largely for cooking or energyuses [Brocard et al., 1998; Lelieveld et al., 2001], is lessseasonal. If we assume wetland and paddy emissions arenear zero during the TRACE-P time period, annual inven-tories for anthropogenic CH4 sources compiled for Chinaand southeast Asian nations compiled by Streets et al.[2003] indicate that colocated urban/industrial sources(landfills, wastewater treatment, fossil fuel usage) wouldrelease roughly 38% of total emissions. Animal populationsand coal mining, distributed more diffusely and in morerural regions, release on the order of 45%. Biomass andbiofuel burning are estimated to contribute roughly 17%.The relative importance of various CH4 sources varieswidely between countries as well as between regions inlarge nations such as China, and therefore characteristicsource trace gas signatures can vary widely for CH4 depend-ing upon individual air mass trajectories. For example,Heald et al. [2003] suggest that biomass burning in south-east Asia over the TRACE-P period of late spring was nearits seasonal peak.[6] In this report, we discuss a high-precision, high-
resolution CH4 data set sampled during the TRACE-Pmission. The roughly 13,800 measurements were sampledat altitudes from roughly 12 km to the near-surface andrange in magnitude from 1602 ppbv in stratosphericallyinfluenced air to 2149 ppbv in highly polluted air. Methanemixing ratios were highly correlated with those of a varietyof other trace gases characteristic of a mix of industrial andcombustion anthropogenic sources. Below we detail theCH4 sampling methodology, followed by a description ofthe spatial distribution of CH4 over the northern Pacificduring TRACE-P. Section 4 compares the measurements tothose made during the PEM West B mission, flown 7 yearsearlier under similar meteorological conditions.
2. Methodology
[7] Methane was measured on both the DC-8 and P-3Baircraft during TRACE-P, using the DACOM I and IIinstruments (Differential Absorption CO Measurement),respectively. These instruments are tunable diode lasersystems [Sachse et al., 1987, 1991] which simultaneouslymeasure CH4, CO, and N2O. The same instrument systemwas used during PWB. DACOM uses three lasers (4.7, 4.5,and 7.6 microns for CO, N2O, and CH4 respectively) whichare combined with optical filters and directed through a 0.3l Herriott cell containing a 36 m long optical path. Afterexiting the cell, the laser beams are spectrally isolated anddirected to separate LN2-cooled InSb and HgCdTe detec-tors. A reference cell containing several Torr of each of thegases is used to wavelength lock each of the lasers to the
GTE 28 - 2 BARTLETT ET AL.: METHANE IN THE WESTERN NORTH PACIFIC
appropriate absorption lines. After being drawn through apermeable membrane dryer to remove water vapor, ambientair enters the Herriott cell, with a flow rate equivalent totwice the cell volume each second. The Herriott cell ismaintained at 100 Torr to minimize potential spectraloverlap from other atmospheric species. For typical ambientatmospheric levels, the differential absorption signals areproportional to the mixing ratios of the three measuredgases [Sachse et al., 1987]. Calibration of instrumentresponse is performed by periodically flowing calibrationgas with known near-ambient concentrations and zero airthrough the Herriot cell. Calibrations are performed approx-imately every 12 min with NOAA/CMDL calibration gases.Accuracies of the working standards are ±1% for CH4 and±2% CO ( E. Dlugokencky and P. Novelli, personalcommunication, 2003). Consistency in the use of NOAA/CMDL standards on both the TRACE-P and PWB missionspermits direct comparison of the samples collected onthe missions, as well as with those collected as part ofthe CMDL clean air network. Although intercomparisonsbetween measurements taken on the two aircraft includeadditional sources of error, Eisele et al. [2003] confirmexcellent agreement during close proximity flight legs, with<0.1% deviation from a 1:1 regression slope.[8] Although CH4 measurements are made every 5 s, we
have averaged the data to 60 s to integrate with other datasampled on the aircraft. Measurement precisions for CH4 of±0.15% (1 standard deviation) were obtained duringTRACE-P. We estimate the overall accuracy of our mea-surements at ±1.02%, the majority of which is due toreference gas calibration. Methane data collected on thetwo aircraft are archived in their original resolution and canbe obtained from the NASA-Langley Distributed ActiveArchive Center or through the GTE homepage (available athttp://www-gte.larc.nasa.gov).[9] Instrument problems during the early part of the
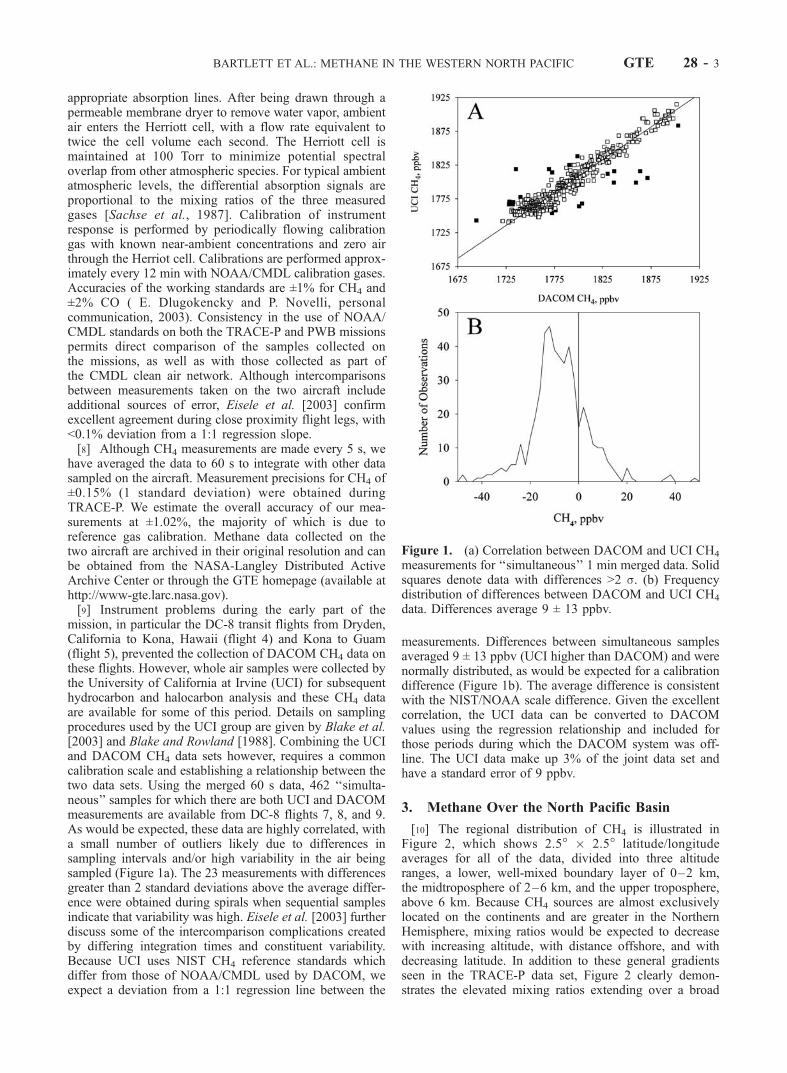
mission, in particular the DC-8 transit flights from Dryden,California to Kona, Hawaii (flight 4) and Kona to Guam(flight 5), prevented the collection of DACOM CH4 data onthese flights. However, whole air samples were collected bythe University of California at Irvine (UCI) for subsequenthydrocarbon and halocarbon analysis and these CH4 dataare available for some of this period. Details on samplingprocedures used by the UCI group are given by Blake et al.[2003] and Blake and Rowland [1988]. Combining the UCIand DACOM CH4 data sets however, requires a commoncalibration scale and establishing a relationship between thetwo data sets. Using the merged 60 s data, 462 ‘‘simulta-neous’’ samples for which there are both UCI and DACOMmeasurements are available from DC-8 flights 7, 8, and 9.As would be expected, these data are highly correlated, witha small number of outliers likely due to differences insampling intervals and/or high variability in the air beingsampled (Figure 1a). The 23 measurements with differencesgreater than 2 standard deviations above the average differ-ence were obtained during spirals when sequential samplesindicate that variability was high. Eisele et al. [2003] furtherdiscuss some of the intercomparison complications createdby differing integration times and constituent variability.Because UCI uses NIST CH4 reference standards whichdiffer from those of NOAA/CMDL used by DACOM, weexpect a deviation from a 1:1 regression line between the
measurements. Differences between simultaneous samplesaveraged 9 ± 13 ppbv (UCI higher than DACOM) and werenormally distributed, as would be expected for a calibrationdifference (Figure 1b). The average difference is consistentwith the NIST/NOAA scale difference. Given the excellentcorrelation, the UCI data can be converted to DACOMvalues using the regression relationship and included forthose periods during which the DACOM system was off-line. The UCI data make up 3% of the joint data set andhave a standard error of 9 ppbv.
3. Methane Over the North Pacific Basin
[10] The regional distribution of CH4 is illustrated inFigure 2, which shows 2.5� � 2.5� latitude/longitudeaverages for all of the data, divided into three altituderanges, a lower, well-mixed boundary layer of 0–2 km,the midtroposphere of 2–6 km, and the upper troposphere,above 6 km. Because CH4 sources are almost exclusivelylocated on the continents and are greater in the NorthernHemisphere, mixing ratios would be expected to decreasewith increasing altitude, with distance offshore, and withdecreasing latitude. In addition to these general gradientsseen in the TRACE-P data set, Figure 2 clearly demon-strates the elevated mixing ratios extending over a broad
Figure 1. (a) Correlation between DACOM and UCI CH4
measurements for ‘‘simultaneous’’ 1 min merged data. Solidsquares denote data with differences >2 s. (b) Frequencydistribution of differences between DACOM and UCI CH4
data. Differences average 9 ± 13 ppbv.
BARTLETT ET AL.: METHANE IN THE WESTERN NORTH PACIFIC GTE 28 - 3

range of latitudes off the Asian continent as material istransported from Asia and further west into the basin.Concentrations decrease as long-lived trace gases such asCH4 are transported from source regions and inputs aremixed vertically and horizontally at relatively rapid ratescompared to photochemical loss. We can divide the areasampled during TRACE-P longitudinally to examine these
gradients as continental outflow is advected across the NorthPacific Basin by the dominant westerly flow [Fuelberg et al.,2003]. Here, we break the region into two longitudinalclasses, the Western Pacific, ranging from the coast ofthe Asian continent to 160�E, and the Central/EasternPacific, from 160�E to the North American coast. AsFigure 2 illustrates, the sampling effort during TRACE-P
Figure 2. Regional distribution of CH4 during the TRACE-P expedition; 0–2 km, 2–6 km, and above6 km. Data were grouped into 2.5� latitude � 2.5� longitude areas then averaged. Number of observationswithin areas vary. See color version of this figure at back of this issue.
GTE 28 - 4 BARTLETT ET AL.: METHANE IN THE WESTERN NORTH PACIFIC

was concentrated largely within the Western Pacific class,and the majority of the data from the Central/Eastern Pacificclass was obtained during transit flights.[11] One of the primary concerns when characterizing the
distribution of an environmental variable like CH4 sampledover a large area such as the Pacific is evaluating howrepresentative the intensive, but relatively brief sampling isof the regional distribution. This evaluation is particularlycritical if the derived distributions are to be compared to othertimes or areas. As detailed by Jacob et al. [2003], flightsconducted during TRACE-P and other similar aircraft mis-sions were designed to meet a variety of objectives, only oneof which is a regional characterization. One way to approachthis problem is to compare the sampled three-dimensionaldistributions with those derived from models, integrated on avariety of temporal and spatial scales [Kiley et al., 2003;Wildet al., 2003]. The representativeness of sampled distributionsbased on the much sparser PWA and PWB data sets has beenexamined in some detail by Ehhalt et al. [1997], whoconcluded that the ethane and propane distributions werereasonable descriptions of the ‘‘true’’ average pattern ofconcentrations, despite incomplete and irregular sampling.Although thiswork dealt with shorter-lived hydrocarbons andclearly every aircraft mission differs, the use of two aircraftand the much more geographically extensive sampling per-formed during TRACE-P suggest that the derived distribu-tions, as shown in Figure 2, are an adequate representation oftrue geographic patterns over the sampling period.[12] Averages shown in Figure 2 include the entire data
set and therefore include observations which were affectedby inputs from the stratosphere. Although most frequentlyseen at altitudes above 6 km and latitudes above 35�N[Browell et al., 2003], stratospherically impacted air wasobserved at a variety of locations throughout the missionand serves as a mechanism introducing very low CH4 mixingratios to the troposphere. These significantly lower mixingratios, however, can mask the variability due to mixing andtransport that is the focus of TRACE-P. For this reason, wehave elected to remove observations identified as havingsignificant stratospheric inputs from subsequent analysis.As shown in Figure 3, air with a significant stratospheric
component has a distinctive signature, with elevated O3 andlow CH4 (as well as CO, C2H6, C2H2, and other trace gases,data not shown). Here, we removed from further analysisall observations with low CH4 and O3 levels greater thanabout 100 ppbv, or with CH4/O3 ratios less than about 20, atotal of about 450 observations (3% of the data). Ataltitudes below 6 km, air classified as having a significantstratospheric component was <1% of the data. Theseobservations appear to fall on a mixing line between clearlystratospheric air and observations more characteristic ofNorthern Hemisphere levels. They form a well definedgroup that overlaps but is distinct from the distribution ofmixing ratios at upper altitudes (Figure 4).
3.1. Variability With Latitude
[13] Methane exhibits a well-known, seasonally varyinglatitudinal trend in background surface-level mixing ratios,from high values in the Northern Hemisphere to lowerlevels in the Southern Hemisphere [Dlugokencky et al.,1994]. Monthly averages of background air measurementsat Pacific basin Climate Monitoring and Diagnostic Labo-ratory (CMDL) ground-level sites provide a way to estimatethe enhancements due to Asian outflow observed duringTRACE-P. We have derived background CH4 levels byweighting the Pacific CMDL February, March, and April2001 monthly means for the TRACE-P sampling period andthen grouping and averaging every 5� of latitude to reducesite-specific variability.[14] As shown in Figure 5a, Western Pacific average CH4
mixing ratios in the lower 2 km are elevated well abovePacific CMDL background levels north of 15�N. Theseenhancements range between 27 and 38 ppbv and back-ground levels lie well outside the 95% confidence limits forthe TRACE-P means. The largest differences betweenCMDL levels and those sampled in the Western Pacificare between 15� and 20�N and 30� and 35�N, probablyreflecting outflow from Hong Kong and Japan. Averages tothe south, between the equator and 15�N, were comparableto CMDL site values. These background levels lie withinthe TRACE-P 95% confidence limits. At higher altitudes,mixing ratios are significantly lower than surface back-
Figure 3. All TRACE-P data above 6 km. Open squares are observations classified as having asignificant stratospheric input.
BARTLETT ET AL.: METHANE IN THE WESTERN NORTH PACIFIC GTE 28 - 5

ground values and decrease with increasing altitude by avariable amount. Note that low, relatively constant concen-trations extend from 25� to 5�N above 6 km, from roughly15� to 5�N at 2–6 km, and are absent in the near-surface;differences reflecting the mixing of Northern and SouthernHemispheric air at upper altitudes and the northward pen-etration of Southern Hemispheric air with characteristicallylower mixing ratios of many trace gases. The air south of25�N and at altitudes >6 km averaged CO levels between 75and 100 ppbv, mean C2Cl4 mixing ratios of �2.4 pptv, andC2H2/CO ratios of 0.9–1.3. Latitudinal distributions for avariety of other trace gases including C2H6, C2H2, C3H8,and C2Cl4 had similar latitudinal gradients and relativedifferences with altitude as those for CH4.[15] At Central/Eastern Pacific longitudes (Figure 5b),
near-surface average CH4 mixing ratios are much lowerand more similar to CMDL background values as would beexpected as distance from sources increases. Aside from the30–35�N latitude band, however, the CMDL values areoutside the 95% confidence intervals. Central/Eastern lati-tude means are between 8 and 40 ppbv lower than WesternPacific averages, with greatest differences to the north.Average mixing ratios above 6 km, however, are significantlygreater than those at 2–6 km between 30 and 35�N and areindistinguishable from other averages at latitudes north of25�N. Between 25 and 35�N, these high altitude means aresignificantly higher than averages at these latitudes in theWestern Pacific (10 ppbv between 30 and 35�N; 7 ppbv, 25–30�N). These higher concentrations of CH4 are seen in thebottom panel of Figure 2 between 160� and roughly 180�Eand are associated with enhanced CO, C2H6, CH3Cl, andC2Cl4, among other gases. Coinciding with the most intenseposition of the Japan Jet [Fuelberg et al., 2003], thesecontinental emissions appear to be rapidly and efficientlycarried at higher altitudes to the Central Pacific.
3.2. Variability With Longitude
[16] Because CH4 sources and therefore atmospheric mix-ing ratios, change systematically with latitude [Dlugokencky
Figure 4. Frequency distribution for all TRACE-P data by altitude.
Figure 5. (a) Latitudinally averaged CH4 mixing ratios inthe Western Pacific (west of 160�E), 5� latitude classes.Averaged CMDL values are for Pacific Basin sites onlyand are calculated by weighting monthly averages forthe TRACE-P sampling period and then averaging into5� latitude classes. CMDL sites included were AmericanSamoa; Cape Grim, Australia; Cold Bay and Shemya Island,AK; Christmas Island; Easter Island; Guam; Mauna Loa andCape Kumukahi, HI; and Pacific Ocean cruise stations.(b) As for Figure 5a, Central/Eastern Pacific (east of 160�E).
GTE 28 - 6 BARTLETT ET AL.: METHANE IN THE WESTERN NORTH PACIFIC

et al., 1994], any examination of longitudinal trends mustaccount for this known source of variability. We havetherefore grouped the TRACE-P observations into latitudeclasses, which largely correspond to the trajectory-basedsource region classes developed during the PWB mission,Continental North (>20�N) and Continental South (<20�N)[Talbot et al., 1997]. The three TRACE-P latitude classes,South (<20�N, actually 7�N–20�N), Middle (20�N– 40�N),and North (>40�N, actually 40�N–46�N), subdivide thePWB Continental North group to permit examination of themost intensely sampled TRACE-P region. As shown inFigure 6a, data from the North latitude class are spatiallysparse and suggest only that mixing ratios fall offshore. Atlatitudes south of 20�N (Figure 6c), concentrations close tothe Asian continent are elevated in the near-surface onlyand decrease to CMDL background levels beyond 140�E.Five-day back trajectories for the data used in theseaverages indicate that those in the near-surface between110� and 140�E are predominantly from the north and westover central Asia, and China, while those above 2 km aredominated by oceanic pathways, more southerly flows fromsoutheast Asia, or westerly flow extending back to India orAfrica. These general trends are in agreement with thosereported by Bey et al. [2001], based on modeling PWBdata.[17] Between 20� and 40�N, elevated CH4 is most clearly
seen below 6 km and extends to roughly 160�E beforesharply falling (Figure 6b). Higher concentrations are alsoseen off the North American coast at all altitudes. Five-dayback trajectories indicate that much of the air sampled overthe east Pacific had been transported east across Asia intothe Pacific basin, then circulated around a strong highpressure system centered in this region [Fuelberg et al.,2003]. Air masses from the high northern latitudes werealso transported to eastern Pacific midlatitudes by the high.[18] Although differences in sampling effort with latitude
within the longitude band may contribute to apparentlongitudinal trends, Figure 6b and CMDL backgroundlevels in Figure 5 suggest that an average mid-Pacificmixing ratio in the near-surface between 20� and 40�N ison the order of 1785 ppbv. Near-surface levels off the Asiancontinent (below 2 km and west of 160�E) are roughly45 ppbv higher. At altitudes between 2 and 6 km, averageshave been increased on the order of 15 ppbv. Restricting thecalculation of longitudinal averages to a 10� latitude band of15–25�N (data not shown) where sampling is more consis-tent latitudinally (Figure 2), yields an average enhancementof 36 ppbv at altitudes below 2 km west of 160�E. Littlechange with longitude is seen above 2 km, suggesting thatmuch of the transport of continental inputs occurred in thenear-surface and that apparent enhancements at these alti-tudes in the broader longitude class are primarily due todifferential sampling with latitude.[19] Strong longitudinal trends are also seen in averages
for other trace gases, a subset of which is shown in Figure 7.Trends in CH4 are particularly well correlated with those ofother hydrocarbons such as ethane (C2H6; Figure 7b),ethyne (C2H2; Figure 7c), and propane (C3H8; data notshown). Longitudinal variation in CO (Figure 7a) is similarto CH4 but shows only modest elevation off the coast ofNorth America. Note that the trends in C2H2 are moresimilar to those for CO as would be expected, since
emission ratios for these gases from all types of combustionare very similar [Blake et al., 1996].[20] Also shown in Figures 6 and 7 are the enhanced levels
of CH4 and other gases above 6 km in the central Pacificfrom roughly 160�W–170�E, discussed in Section 4.1.Concentration ratios of simultaneously measured trace gasspecies such as the nonmethane hydrocarbons (NMHCs) canprovide a rough estimate of air mass aging and mixing ifthey are released concurrently, if they are photochemicallyremoved by reactions that approximate first order kinetics,if background concentrations into which they are mixed are
Figure 6. Longitudinally averaged CH4 mixing ratios bylatitude class. Error bars indicate 95% confidence intervals.Dashed line at 160�E marks the break between the WesternPacific longitude class and the Central/Eastern Pacificclass. Note that west longitudes (east of 180�E) are scaledas a continuation of east longitudes. (a) North of 40�N;(b) 20�N–40�N; (c) South of 20�N.
BARTLETT ET AL.: METHANE IN THE WESTERN NORTH PACIFIC GTE 28 - 7

negligible, and if removal rates are significantly different[McKeen et al., 1996; Parrish et al., 1992]. Ratios of C2H2/CO and C3H8/C2H6 have been used in this way by a varietyof investigators [Talbot et al., 1997; Gregory et al., 1997;Smyth et al., 1996]. Both ratios are elevated in this regionover those further to the east, and averages range from 2.3 to2.5 and from 0.12 to 0.13, respectively. These values suggestthat only several days have elapsed since emission. Theuse of tracers such as C2Cl4, indicative of urban andindustrial sources [Blake et al., 1997; Wang et al., 1995],and CH3Cl, produced predominantly during biomassburning [Rasmussen et al., 1980; Blake et al., 1996] canhelp clarify origins of these increased levels at high altitude.
Enhancements in both compounds (Figures 7d and 7e)indicate that elevated levels of trace gases at Western Pacificlongitudes have a variety of sources, as might be expected.At high altitudes over the central Pacific however, C2Cl4 isnot particularly high and CH3Cl is strongly enhanced,suggesting that emissions from biomass burning or theburning of biofuels may be the primary source. Methaneand CO are highly correlated in this air mass (r2 = 0.77;n = 177) and yield a regression slope (�CH4/�CO) of 0.39,consistent with biomass burning emission ratios [Andreaeand Merlet, 2001]. Mixing ratios of CH4, CO, C2H6, andC2H2 are also highly correlated with CH3Cl, with regressionslopes within combustion emission ranges (�CH4/�CH3Cl= 0.58 ppbv/pptv, r2 = 0.45; �CO/�CH3Cl = 1.76 ppbv/pptv, r2 = 0.85; �C2H6/�CH3Cl = 10.4, r2 = 0.76; �C2H2/�CH3Cl = 7.1, r2 = 0.82; n = 94). Five-day back trajectoriesshow that most of this air passed across southeast Asia,southern China, and northern India where biomass andbiofuel burning occurs at this time of year [Heald et al.,2003; Lelieveld et al., 2001]. Andreae and Merlet [2001]suggest that the common Indian practice of burning dungcakes for fuel results in enhanced CH3Cl release in particularfrom this region. Additional characteristics of this plume arediscussed by Blake et al. [2003] and C.L. Heald et al.(Transpacific satellite and aircraft observations of Asianpollution, submitted to Journal of Geophysical Research,2003).[21] A regional characterization of the North Pacific Basin
during TRACE-P for selected trace gases is summarized inTable 1 for the three altitude classes (0–2 km, 2–6 km, and>6 km), the three latitudinal classes (<20�N, 20�–40�N,and >40�N), and the two longitudinal classes (110�–160�Eand 160�–240�E).
3.3. Variability With Altitude
[22] In the preceding sections we have used broad altitudeclasses to group and discuss two-dimensional spatial trends.In this section we examine trends with altitude more closelywithin the more intensely sampled West Pacific and contrastthem with those from the Central/East Pacific. As shown inFigure 8a, average CH4 mixing ratios at latitudes south of20�N are relatively constant above roughly 4 km and arenot significantly different. Concentrations increase sharplybelow, reflecting surface inputs. Profile shapes are similarfor C2H6 (Figure 8b) and CO (Figure 8e). Between thelatitudes of 20�N and 40�N, averaged CH4 levels are higherand increase smoothly throughout the air column. Mixingratios below 9 km are significantly higher than those south of20�N. Aside from concentrations in the lowest km, averagesfor latitudes above 40�N are significantly higher than thoseat lower latitudes. In the Central/Eastern Pacific (Figure 8f ),concentrations are significantly lower than those in the West.Exceptions to this generalization are averages for 3–4 km(below 20�N and north of 40�N) and between 6 and 10 km(20�N–40�N), discussed in the preceding section.[23] In both the Western and Central/Eastern Pacific,
variability in CH4 concentrations with altitude are strikinglycorrelated with a number of other trace gases, most notablythose of C2H6 (Figures 8b and 8g) and C2Cl4, which hassources that are specific to urban/industrial activities such asdry cleaning and industrial degreasing (Figures 8c and 8h).Although correlations are slightly higher over the Western
Figure 7. As for Figure 6b, averages with longitude within20�N–40�N. Note that west longitudes (east of 180�E)are scaled as a continuation of east longitudes. (a) CO;(b) C2H6; (c) C2H2; (d) C2Cl4; and (e) CH3Cl.
GTE 28 - 8 BARTLETT ET AL.: METHANE IN THE WESTERN NORTH PACIFIC

Pacific, the coefficient of determination (r2) between thesespatially averaged CH4 and C2H6 mixing ratios is 0.97 andfor CH4 and C2Cl4 is 0.92 (n = 63). The slope of theregression line with C2H6 (�CH4/�C2H6) is 0.05 ppbv/pptvand with C2Cl4 is 7.37 ppbv/pptv. Although the relationshipwith CO is not as tight (r2 = 0.81; n = 65), correlationbetween the two is still excellent overall, with a CH4:COregression slope of 0.58, suggesting a mixture of urban(�CH4/�CO � 1) [Harriss et al., 1994; Harris et al., 2000;Bartlett et al., 1996] and combustion sources (�CH4/�CO0.03 � 0.1) [Scholes et al., 1996; Bartlett et al., 1996; Fereket al., 1998; Andreae and Merlet, 2001]. Major sources ofC2H6, largely dominated by emissions from the NorthernHemisphere, are believed to be natural gas losses andbiomass burning [Rudolph, 1995]. The tight correlationbetween C2H6 and CH4 (Figure 9) would suggest that thesesources also predominate for CH4 during TRACE-P or thatthe colocated mix of urban/industrial sources of the twogases is relatively constant. Enhancements of CH4 fromsources such as rice paddies and ruminant enteric fermen-tation that are not sources of C2H6 [Streets et al., 2003]were not observed and appear not to have made majorcontributions to the sampled air masses.[24] We can further breakdown the Western Pacific lon-
gitude class to examine trends in more detail close to theAsian continent. As demonstrated in Figure 10 for 20�longitude means, there is clear coherence between averagealtitude profiles of all the hydrocarbons shown. ElevatedCH4 is generally confined to altitudes <4 km west of 120�E.As air is carried away from the Asian continent, near-surface levels tend to decrease and those at high altitudestend to increase as mixing takes place vertically andhorizontally. Regression slopes between CH4 and C2H6
(�CH4/�C2H6) vary from 0.076 (r2 = 0.98) in the lower4 km west of 120�E, to 0.050–0.052 ppbv/pptv (120�–140�E and 140�–160�E) for these means. Although highthroughout the region, the slope of propane to ethane(�C3H8/�C2H6) decreases in a consistent west-to-eastpattern; 0.51 (<4 km, west of 120�E), 0.44 (120�1–140�E), 0.44 (140�–160�E), and 0.35 (160�–180�E) asair masses begin to age and the shorter lived propane is
photochemically oxidized more rapidly than ethane andmixed to lower background levels. Variability in CH4,C2H6, C2H2, and C3H8 is poorly correlated with CH3Cland emission ratios between CH4 and these NMHCs lieoutside the range reported for biomass burning [Andreaeand Merlet, 2001].
3.4. Transport Pathways and Plumes
[25] Because the majority of the TRACE-P sampling wasconducted north of 20�N, we expect that Northern Hemi-sphere anthropogenic sources should dominate emissions ofmany gases. The high correlation between CH4 and theurban/industrial tracer C2Cl4, as well as the striking corre-spondence between hydrocarbon species with predominantlyanthropogenic sources suggests that the continental outflowto the region sampled by TRACE-P has a predominantlyanthropogenic signature during the late February-earlyApril period. There were however, air masses sampled thathad a variety of trace gas signatures since source spatialheterogeneity is high and transport from regions as distantas Europe and Africa can be seasonally significant [Bey etal., 2001; Liu et al., 2003]. Because of the relatively longatmospheric lifetime of CH4, air masses can retain distantsource signatures until mixed and modified. Bey et al.[2001] characterize spring continental outflow to the Pacificas following three main pathways: lifting by southeastward-moving cold fronts, followed by eastward transport in thelower free troposphere; boundary layer transport behindcold fronts; and convective transport, primarily over south-east Asia at this time of year. In this section we examineexamples of elevated trace gases to investigate sourcevariability in somewhat more detail and to characterizeCH4 transport via the primary outflow mechanisms. Useof tracers such as C2Cl4 for industrial activities, CH3Cl andC2H2 for combustion, and C2H2/CO ratios as a generalindicator for air mass age aide in source-type and regionidentification. Correlations between selected species forplumes grouped by primary transport path are summarizedin Table 2.[26] Some of the highest CH4 mixing ratios sampled
during TRACE-P were seen during occasions when the
Table 1. TRACE-P Regional Characterization for Selected Trace Gasesa
Longitude LatitudeAltitude,
kmCO,ppbv
CH4,ppbv
CO2,ppmv
C2Cl4,pptv
CH3Cl,pptv
C2H6,pptv
C2H2,pptv
C3H8,pptv
C2H2/CO,pptv/ppbv
West(west of 160�E)
<20�N 0–2 187 ± 6 1803 ± 2 374 ± 0.1 7.0 ± 0.2 608 ± 5 1385 ± 46 579 ± 36 290 ± 17 2.4 ± 0.062–6 102 ± 1 1764 ± 1 372 ± 0.1 3.1 ± 0.1 565 ± 1 685 ± 14 155 ± 8 63 ± 4 1.3 ± 0.03>6 96 ± 1 1760 ± 1 371 ± 0.1 2.4 ± 0.04 578 ± 2 610 ± 10 122 ± 4 60 ± 3 1.2 ± 0.02
20�–40�N 0–2 232 ± 2 1838 ± 1 377 ± 0.1 14.5 ± 0.5 592 ± 2 2111 ± 16 790 ± 15 716 ± 12 3.2 ± 0.022–6 156 ± 1 1793 ± 0.4 374 ± 0.03 6.5 ± 0.1 576 ± 1 1362 ± 12 410 ± 6 294 ± 5 2.3 ± 0.02>6 120 ± 1 1769 ± 1 372 ± 0.03 3.1 ± 0.1 578 ± 1 798 ± 11 227 ± 6 109 ± 4 1.7 ± 0.02
>40�N 0–2 202 ± 7 1844 ± 2 378 ± 0.2 11.3 ± 0.4 546 ± 4 2249 ± 41 700 ± 35 779 ± 26 3.5 ± 0.042–6 169 ± 5 1817 ± 2 376 ± 0.2 9.9 ± 0.3 551 ± 2 1815 ± 50 520 ± 25 516 ± 24 3.0 ± 0.06>6 163 ± 2 1822 ± 2 376 ± 0.1 10.9 ± 0.3 541 ± 1 1899 ± 48 500 ± 21 567 ± 28 3.0 ± 0.06
Central/East(east of 160�E)
<20�N 0–2 123 ± 1 1798 ± 3 374 ± 0.1 5.8 ± 0.1 543 ± 2 1070 ± 17 187 ± 4 115 ± 4 1.5 ± 0.022–6 135 ± 4 1775 ± 2 373 ± 0.1 3.9 ± 0.2 578 ± 5 897 ± 34 277 ± 22 90 ± 8 1.9 ± 0.09>6 76 ± 1 1751 ± 3 371 ± 0.3 0.8 ± 0.3 546 ± 2 496 ± 40 71 ± 15 21 ± 5 0.9 ± 0.1
20�–40�N 0–2 137 ± 1 1798 ± 1 374 ± 0.1 7.2 ± 0.1 547 ± 1 1362 ± 20 304 ± 6 274 ± 8 2.1 ± 0.032–6 126 ± 1 1773 ± 1 373 ± 0.03 4.6 ± 0.1 565 ± 1 1008 ± 11 248 ± 5 141 ± 4 1.8 ± 0.02>6 124 ± 1 1776 ± 1 373 ± 0.04 3.7 ± 0.1 574 ± 1 892 ± 14 260 ± 8 109 ± 4 1.8 ± 0.03
> 40�N 0–2 134 ± 1 1824 ± 2 374 ± 0.1 7.7 ± 0.2 534 ± 1 1489 ± 26 380 ± 8 453 ± 15 2.8 ± 0.052–6 137 ± 9 1818 ± 3 374 ± 0.3 7.0 ± 0.5 556 ± 6 1428 ± 77 412 ± 56 376 ± 30 2.6 ± 0.1>6 178 ± 4 1819 ± 3 374 ± 0.1 6.6 ± 0.3 612 ± 8 1426 ± 49 609 ± 54 311 ± 13 3.1 ± 0.07
aAverage values and standard error of the means for broad longitude, latitude, and altitude classes.
BARTLETT ET AL.: METHANE IN THE WESTERN NORTH PACIFIC GTE 28 - 9

aircraft intercepted highly polluted air in boundary layeroutflow behind cold fronts. This occurred during DC-8 flight13 in the Shanghai area on 21 March over a period ofroughly 50 min (Figure 11). Methane levels ranged up to1983 ppbv within this air mass and averaged 1866 ppbv.
Finer resolution data using the original 5 s samplinginterval captured higher and more variable mixing ratios.Enhanced levels were correlated with a variety of otherspecies including CO, as shown in Table 2, suggesting acomplex mixture of co-located combustion, industrial, and
Figure 8. Average altitude profiles by latitude class. Error bars denote 95% confidence intervals. Forthe Western Pacific (west of 160�E): (a) CH4; (b) C2H6; (c) C2Cl4; (d) CH3Cl; (e) CO. For the Central/Eastern Pacific (east of 160�E): (f ) CH4; (g) C2H6; (h) C2Cl4; (i) CH3Cl; ( j) CO.
GTE 28 - 10 BARTLETT ET AL.: METHANE IN THE WESTERN NORTH PACIFIC

fossil fuel sources. Because levels of CH3Cl were extremelyhigh (up to 1677 pptv) and the �CH4/�CO was relativelylow (0.22), combustion inputs appear to have been sizable.Carbon monoxide was also well correlated with CH3Cl andregression yields a relatively high emission ratio (�CH3Cl/�CO = 1.24 pptv/ppbv; r2 = 0.85) but one consistent withthose reported by Lobert et al. [1991], Blake et al. [1996],and Andreae et al. [1996], particularly for smolderingcombustion. Since the source area of Shanghai is highlyurban, biofuel combustion (in cookstoves or for domesticheating, for example) or perhaps low-quality coal use ratherthan biomass burning are the more likely combustionsources. Other instances of polluted Asian boundary layeroutflow were sampled on DC-8 flight 12 and P-3B flight19, with similar characteristics (Table 2).[27] The major process transporting polluted Asian air
masses during TRACE-P is the passage of southeastward-moving cold fronts across the continent, followed byeastward transport in the lower free troposphere [Liu etal., 2003]. Frontal passage is at a seasonal high in the springand fall and occurs roughly every 2–7 days. A number ofpolluted air masses intercepted during TRACE-P had 5-daytrajectories extending back to the northwest that fall intothis class (Table 2). These plumes were generally below6 km altitude, had relatively low inputs from biomassburning, as indicated by low CH3Cl mixing ratios and pooror negative correlations between CH3Cl and other tracegases, and were enriched in C2Cl4, a northern hemisphereindustrial tracer. Although �CH4/�CO values vary, theyaverage a relatively high 0.55 ± 0.24 (Table 2) , alsosuggesting that recent combustion inputs were low.
[28] Deep convection over Southeast Asia followed bynortheast transport and frontal lifting moves biomass burn-ing emissions into the Asian midlatitudes where they aremixed with those from farther north. A variety of plumessampled off the Asian continent had back-trajectories thatextended to the west and southwest across southern China,northern southeast Asia and extending back to India and
Figure 9. Correlation between CH4 and C2H6, 60 saverages, all TRACE-P data. (a) Western Pacific (west of160�E), n = 5800; and (b) Central/Eastern Pacific (east of160�E), n = 2050.
Figure 10. Average altitude profiles for CH4 and selectedhydrocarbons, 20�N–40�N; 20� longitude classes. (a) 100–120�E; (b) 120–140�E; (c) 140–160�E; and (d) 160–180�E.
BARTLETT ET AL.: METHANE IN THE WESTERN NORTH PACIFIC GTE 28 - 11

Table
2.CorrelationsBetweenSelectedTrace
Gases
inCaseStudiesorPlumes
a
Flight
AirMass
CH4:CO,
ppbv:ppbv
CH4:CO2,
ppbv:ppmv
CH4:C
2H6,
ppbv:pptv
CH4:C
2H2,
ppbv:pptv
CH4:C
3H8,
ppbv:pptv
CH4:C
2Cl 4,
ppbv:pptv
CH4:CH3Cl,
ppbv:pptv
CO:CO2,
ppbv:ppmv
C2H6:CO
pptv:ppbv
Boundary
LayerOutflow
DC-8,13
Shanghai;N
=47,NHC=37
0.22(0.90)
8.84(0.57)
0.052(0.84)
0.021(0.81)
0.052(0.73)
1.65(0.73)
0.16(0.81)
42.7
(0.71)
3.55(0.76)
DC-8,12
Form
osa
Strait;N
=50,NHC=30
0.31(0.93)
8.64(0.91)
0.048(0.97)
0.047(0.94)
0.069(0.93)
4.87(0.95)
0.18(0.78)
27.8
(0.96)
6.39(0.93)
P-3B,19
near-surface;
N=195,NHC=91
0.27(0.84)
6.37(0.60)
0.044(0.83)
0.064(0.79)
0.052(0.71)
1.66(0.39)
0.66(0.73)
20.4
(0.52)
6.16(0.87)
Average
0.27
7.95
0.048
0.044
0.058
2.72
0.33
30.3
5.37
StandardDeviation
0.045
1.37
0.004
0.022
0.01
1.86
0.28
11.4
1.58
NW
Trajectories
DC-8,19
near-surfaceplume;
N=248,NHC=142
0.62(0.70)
16.5
(0.82)
0.050(0.70)
0.148(0.58)
0.126(0.52)
8.01(0.80)
NS
20.5
(0.71)
9.53(0.61)
DC-8,19
above�5km;N
=306,NHC=159
0.33(0.73)
12.2
(0.83)
0.048(0.79)
0.106(0.62)
0.292(0.71)
10.6
(0.71)
NS
32.3
(0.91)
7.23(0.90)
DC-8,18
below
6km;N
=279,NHC=155
0.81(0.88)
15.5
(0.90)
0.054(0.92)
0.17(0.88)
0.14(0.88)
9.39(0.91)
NS
17.8
(0.91)
14.8
(0.88)
DC-8,10
near-surface;
N=148,NHC=62
0.39(0.75)
13.6
(0.86)
0.051(0.76)
0.123(0.88)
0.087(0.34)
7.68(0.81)
1.20(0.43)
28.5
(0.91)
7.48(0.55)
DC-8,14
Low
altitudeplume;
N=203,NHC=108
0.71(0.72)
12.4
(0.72)
0.051(0.82)
0.132(0.68)
0.104(0.75)
6.98(0.75)
NS
16.2
(0.94)
12.8
(0.76)
P-3B,9
near-surfaceplume;
N=93,NHC=55
0.45(0.49)
12.6
(0.94)
0.035(0.92)
0.083(0.81)
0.049(0.89)
7.56(0.94)
�0.66(0.69)
14.0
(0.46)
17.4
(0.57)
DC-8,4
below
�4km;N
=86;NHC=87
0.89(0.79)
12.0
(0.72)
0.045(0.93)
0.13(0.89)
0.085(0.92)
8.92(0.92)
�0.90(0.56)
11.45(0.65)
19.39(0.80)
P-3B,19
plumeat
2.5–3.5
km;N
=61,NHC=37
0.21(0.84)
10.2
(0.63)
0.038(0.58)
0.060(0.70)
0.095(0.62)
8.75(0.67)
0.50(0.43)
39.3
(0.48)
3.72(0.64)
Average
0.55
13.1
0.046
0.119
0.12
8.49
0.04
22.5
11.54
StandardDeviation
0.24
2.0
0.007
0.035
0.07
1.17
0.99
9.8
5.4
Wto
SW
Trajectories
DC-8,14
plumeat
higher
altitude;
N=350,NHC=192
0.36(0.39)
13.8
(0.39)
0.078(0.67)
0.073(0.33)
0.210(0.44)
8.12(0.50)
0.40(0.21)
34.9
(0.80)
4.56(0.65)
DC-8,10
above�4km;N
=257,NHC=131
0.38(0.48)
8.7
(0.37)
0.048(0.40)
0.093(0.42)
0.190(0.42)
9.32(0.42)
0.33(0.41)
22.3
(0.75)
6.61(0.83)
P-3B,9
N=267,NHC=117
0.22(0.69)
12.8
(0.81)
0.043(0.82)
0.052(0.66)
0.148(0.82)
7.47(0.62)
0.38(0.59)
51.9
(0.90)
5.55(0.89)
DC-8,4
plume4–�10km;N
=148,NHC=161
0.41(0.85)
13.0
(0.83)
0.052(0.98)
0.082(0.88)
0.154(0.82)
7.57(0.74)
0.51(0.60)
27.6
(0.78)
7.69(0.85)
DC-8,18
plumeabove6km;N
=210,NHC=124
0.35(0.74)
12.4
(0.76)
0.063(0.68)
0.094(0.68)
0.22(0.46)
11.3
(0.60)
0.51(0.54)
34.3
(0.95)
4.88(0.76)
P-3B,6
plumeat
3km;N
=171,NHC=88
0.33(0.72)
19.4
(0.41)
0.064(0.52)
0.086(0.67)
0.212(0.21)
10.71(0.37)
0.44(0.63)
66.8
(0.73)
3.97(0.74)
DC-8,12
narrow
well-defined
layer;N
=14,NHC=13
0.43(0.97)
28.1
(0.99)
0.057(0.98)
0.075(0.95)
0.258(0.97)
16.5
(0.91)
0.84(0.91)
64.0
(0.96)
7.41(0.96)
Average
0.35
15.4
0.058
0.079
0.199
10.14
0.49
43.1
5.81
StandardDeviation
0.07
6.4
0.012
0.014
0.039
3.18
0.17
17.8
1.45
Clean/Aged
P-3B,9
tropical;N
=102,NHC=33
0.22(0.20)
NS
NS
NS
NS
NS
NS
NS
3.94(0.45)
P-3B,6
generally
low
altitude;
N=126,NHC=65
1.29(0.64)
30.2
(0.37)
0.136(0.40)
0.228(0.11)
0.481(0.24)
29.9
(0.47)
�1.07(0.11)
15.5
(0.26)
5.68(0.52)
aSlopes
(�y/�
x)andcoefficientsofdetermination(r2).Variablesaregiven
asy:x.Correlationsbelowthe95%
significance
levelaredenotedas
NS(notsignificant).Number
ofdatapointsusedin
aregressionare
given
asN
forregressionsofCH4withCO
orCO2andNHCforregressionswithhalocarbonsandother
hydrocarbons.Predominanttransportpathwaysarebased
on5day
back-trajectories
[Fuelberget
al.,2003].
GTE 28 - 12 BARTLETT ET AL.: METHANE IN THE WESTERN NORTH PACIFIC

Africa (Table 2). These plumes tended to be at higheraltitudes and had enhanced mixing ratios of CH3Cl, CO,and C2H2 as compared with those with trajectories to thenorthwest. In these air masses, CH4 mixing ratios werehighly correlated with both C2Cl4 and CH3Cl and hadgenerally lower �CH4/�CO values, within the range ofthose due to combustion [Andreae and Merlet, 2001]. Thetrace gas characteristics of these plumes are consistent withAfrican, north Indian, and southeastern Asian sourceregions derived from back-trajectories. The relationshipbetween CH4 and C2H6 displays relatively little variabilitybetween plumes and/or transport pathways (Table 2),suggesting that emission ratios from the dominant sourcesof fossil fuel usage and biomass burning at this time arerelatively constant. Similarity in source emission ratios mayin part account for the very high correlation between the twogases observed throughout the region.[29] On several TRACE-P flights, plumes with both types
of transport pathways were sampled, illustrating the com-plex mix of emissions in Asian outflow. During DC-8 flight10 in the vicinity of Hong Kong, outflow with back-trajectories to the northwest and with elevated C2Cl4, CO,CH4, and other hydrocarbons was observed below approx-imately 4 km (Figure 12). Over the course of the flight, theaircraft repeatedly intercepted this air mass as a series ofspirals were performed. Methane mixing ratios averaged1818 ppbv, ranged up to 1883 ppbv, and were wellcorrelated with a variety of trace gases with anthropogenicsources (Table 2). Above about 4 km, levels of CH3Cl wereelevated (Figure 12), and back-trajectories indicate that thisrelatively well-aged air passed across southeast Asia andregions to the west as far as India and Africa. AverageC2H2/CO and C3H8/C2H6 values in this air mass weresignificantly lower than those below 4 km (1.58 versus2.67 pptv/ppbv and 0.12 versus 0.29, respectively), suggest-ing that greater atmospheric processing (both photochemicaland mixing) had occurred than in the air below 4 km. Theslope of CH3Cl relative to CO (�CH3Cl/�CO) above 4 kmis 0.95 pptv/ppbv (r2 = 0.69), consistent with biomassburning values with a significant smoldering component[Andreae et al., 1996; Blake et al., 1996]. Although thecorrelation is also statistically significant, the �CH3Cl/
�CO slope in the near-surface air mass is much lower(0.26 pptv/ppbv; r2 = 0.67). Consistent with the lowerCH3Cl inputs in near-surface air, the calculated �CH4/�CH3Cl is higher than in air above 4 km (1.20 ppbv/pptv;r2 = 0.43, as compared with 0.33; r2 = 0.41), even though�CH4/�CO values are quite similar (Table 2).[30] At higher altitudes during the P-3B flight 9 in the
Hong Kong area, the aircraft intercepted air of largelytropical origin at several locations, with low trace gasmixing ratios (mean CO = 77 ppbv; CH4 = 1746 ppbv;C2H2/CO = 0.92). Close to the surface, an air mass with highC2Cl4 but very little CH3Cl was sampled that had 5-daytrajectories extending back to the north and west over Chinaand into Siberia (Figure 13a). This layer was characterizedby elevated CO, CH4, and other hydrocarbons (mean CH4 =1822 ppbv; C2H6 = 1877 pptv; C2Cl4 = 8.9 pptv; CH3Cl =569 pptv; and C3H8/C2H6 = 0.29). The majority of the airsampled during the flight was polluted with a complexmixture of urban/industrial and combustion sources withsource trajectories generally from the west and southwest.Both C2Cl4 and CH3Cl were enhanced (averaging 4.7 and630 pptv, respectively), as were a suite of trace gases, andC3H8/C2H6 ratios averaged 0.14, suggesting that at leastseveral days had elapsed since emission (Figure 13b).[31] During the P-3B transit flight 6 from Kona, Hawaii
(19.7�N, 156.0�W) to Wake Island (19.32�N, 166.6�E) on27 February, an extremely thin, well-defined polluted layerwas noted at approximately 3 km. The aircraft interceptedthis layer repeatedly over the entire flight path, suggesting thatit was present over a large geographic region. This air mass
Figure 11. Shanghai plume, DC-8 Flight 13. Opensquares: CH4; Closed circles: CO. For regression lines:�CH4/�CH3Cl = 0.154, r2 = 0.81; �CO/�CH3Cl = 0.69,r2 = 0.85.
Figure 12. Methane mixing ratios during DC-8, Flight 10.For CH4: (open circles) above �4 km; (solid circles) below�4 km. For CH3Cl: (open triangles) above �4 km; (greytriangles) below �4 km.
BARTLETT ET AL.: METHANE IN THE WESTERN NORTH PACIFIC GTE 28 - 13

was characterized by enhanced levels of both CH3Cl (aver-aging 623 pptv) and C2Cl4 (averaging 5.1 pptv; Figure 14),and had 5 day back trajectories extending back overJapan and into China. The calculated �CH4/�CO for thisair mass is 0.33, indicative of combustion inputs withcharacteristically low emission ratios. At altitudes of 5–6 km, the maximum altitude sampled by the aircraft, rela-tively clean air with largely tropical oceanic back trajectorieswas observed, with low CO (average = 84 ppbv), CH4
(average = 1693 ppbv), and other trace gases (Figure 14a).Dominating the near-surface altitudes sampled and mixinginto the relatively clean air is an air mass with apparently fewcombustion inputs (Figure 14b). Five-day back trajectoriesfor much of this relatively well-aged air suggests that it hadbeen over water for this time, with some flows extending tothe east, towards the North American continent. The calcu-lated �CH4/�CO for this air mass is 1.29, and is consistentwith urban emission ratios (Table 2). The slope for therelationship between CH4 and C2H6 is unusually high ascompared to others seen during the mission (0.14 ppbv/pptv;Table 2) and the correlation between the two gases, as well asthat between CH4 and other hydrocarbons, is unusually low,indicating a well aged air mass that has lost these shorter-lived gases.
4. Changes in CH4 With Time: Comparison WithPEM-West B
[32] Part of the rationale behind the TRACE-P missionwas to compare measurements over this region with those
made 7 years earlier during PEM-West B (PWB) and toassess any basin-wide changes as industrialization hasproceeded on the Asian continent [Jacobs et al., 2003].Because a major objective of both the TRACE-P and PWBmissions was to sample and characterize polluted continen-tal outflow to the Pacific, we expect trace gas mixing ratiosto be elevated well above background levels. Since thisobjective was common to both missions, they should sharea similar sampling bias and comparisons between missionsshould be possible. As shown in Figure 15, it is clear thatsignificantly different CH4 mixing ratios were sampledduring the two missions. Despite the overall change inconcentrations and sparser geographic coverage however,latitudinal and longitudinal trends similar to those discussedfor TRACE-P are apparent in Figure 15 for PWB.
4.1. Trends With Latitude
[33] In the Western Pacific below 2 km, TRACE-Pmixing ratios average 21 ± 16 ppbv above CMDL back-ground latitudinal means. For PWB, using seasonallyweighted average CH4 mixing ratios for CMDL Pacificsites, calculated as for those in section 3.1 for TRACE-P,this difference was comparable, 26 ± 19 ppbv. Enhancementover background levels is minimal south of 15�N duringTRACE-P and relatively constant north of 15�N, rangingbetween 27 and 38 ppbv (Figure 5a). Differences betweenlatitude means and background levels were somewhatdifferent for PWB than for TRACE-P. Elevated mixing
Figure 13. Methane mixing ratios for air masses sampledduring P-3B Flight 9. (a) CH4 and CH3Cl; (b) CH4 andC2Cl4. Solid triangles: Air with tropical trajectories; Solidcircles: Near-surface plume with northwest back-trajec-tories; Open circles: Air with southwest back-trajectories.
Figure 14. Methane mixing ratios for air masses sampledduring P-3B Flight 6. (a) CH4 and CO; (b) CH4 and CH3Cl.Solid triangles: Tropical oceanic trajectories; Open circles:plume at 3 km with southwest back-trajectories; Solidcircles: near-surface Asian outflow.
GTE 28 - 14 BARTLETT ET AL.: METHANE IN THE WESTERN NORTH PACIFIC
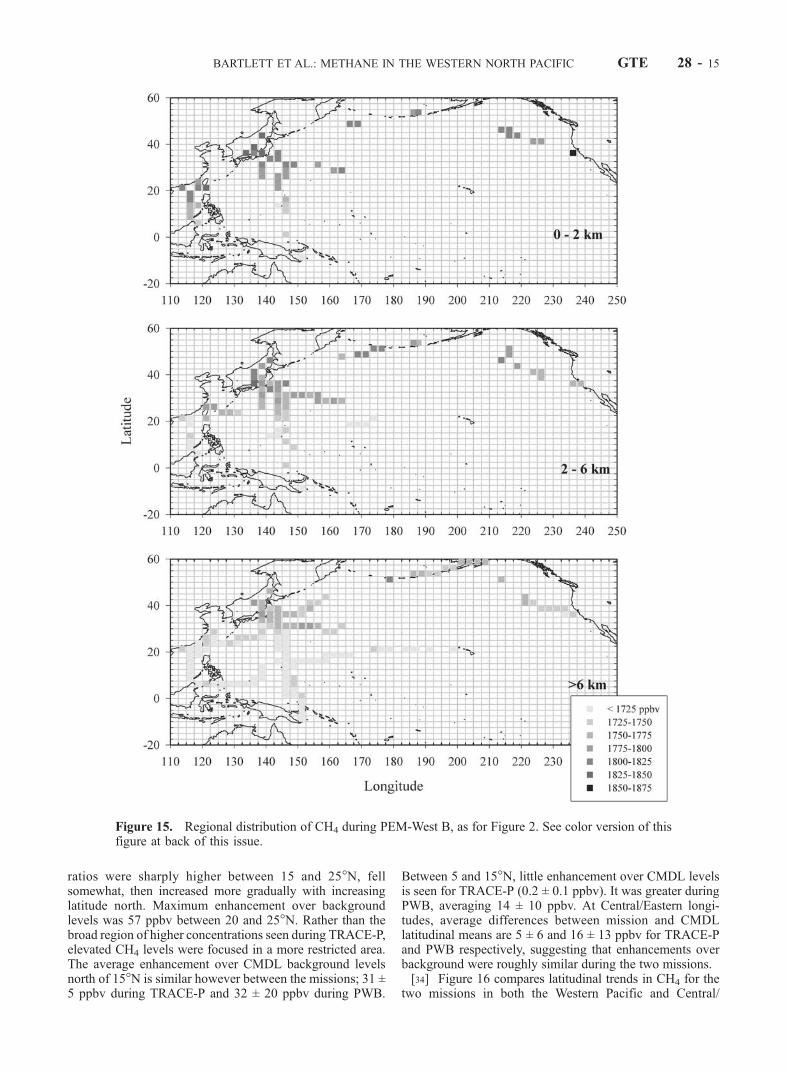
ratios were sharply higher between 15 and 25�N, fellsomewhat, then increased more gradually with increasinglatitude north. Maximum enhancement over backgroundlevels was 57 ppbv between 20 and 25�N. Rather than thebroad region of higher concentrations seen during TRACE-P,elevated CH4 levels were focused in a more restricted area.The average enhancement over CMDL background levelsnorth of 15�N is similar however between the missions; 31 ±5 ppbv during TRACE-P and 32 ± 20 ppbv during PWB.
Between 5 and 15�N, little enhancement over CMDL levelsis seen for TRACE-P (0.2 ± 0.1 ppbv). It was greater duringPWB, averaging 14 ± 10 ppbv. At Central/Eastern longi-tudes, average differences between mission and CMDLlatitudinal means are 5 ± 6 and 16 ± 13 ppbv for TRACE-Pand PWB respectively, suggesting that enhancements overbackground were roughly similar during the two missions.[34] Figure 16 compares latitudinal trends in CH4 for the
two missions in both the Western Pacific and Central/
Figure 15. Regional distribution of CH4 during PEM-West B, as for Figure 2. See color version of thisfigure at back of this issue.
BARTLETT ET AL.: METHANE IN THE WESTERN NORTH PACIFIC GTE 28 - 15

Eastern Pacific. Comparisons between missions are best forthe Western Pacific where data for both missions werecollected more intensely and there is greater temporal andspatial overlap. On average in the near-surface at theselongitudes, CH4 mixing ratios during TRACE-P are 27 ±12 ppbv greater than those of PWB, ranging from 11 to47 ppbv. The smallest difference is observed between thelatitudes of 20 and 25�N where CH4 inputs were highduring PWB and the greatest enhancement over CMDLclean air levels were seen. Average near-surface differencesbetween missions for other hydrocarbons are negative, withPWB mixing ratios higher than those for TRACE-P; by209 ± 311 pptv for C2H6, 138 ± 235 pptv for C2H2, and222 ± 275 pptv for C3H8.[35] Latitudinal trends for CH4 and C2H6 (Figures 17a–
17c) and CH3Cl and C2Cl4 (Figures 17d–17f ) in the WestPacific for the two missions illustrate some of the similar-ities between the missions. Near-surface ethane levels atlatitudes south of 20�N appear to be quite similar whilegreater mixing ratios between 20 and 25�N and north of35�N are observed during PWB (Figure 17a). Althoughmany of the objectives of the expeditions were similar, theywere not identical and the execution of objectives varied sothat differences may reflect any sampling bias between themissions. However, because TRACE-P was flown severalweeks later in the spring than PWB, seasonal changes inOH, the major atmospheric sink, would be expected toresult in lower background levels of the shorter-livedNMHCs. This effect should be greatest in the lower tropo-sphere and in the northern hemisphere, where seasonalvariability is highest. Differences in the latitudinal distribu-tion of C2H6 (Figure 17a) as well as C2H2 and C3H8 (datanot shown), are consistent with this explanation and suggestthat the spring seasonal decrease in NMHCs likely contrib-utes to between-mission differences.[36] Mixing ratios of C2Cl4 are also strikingly higher in
the near-surface of PWB, by an average of 11 ± 7 pptv,while those for CH3Cl are not significantly different,differing by an average of only 2 ± 33 pptv (Figure 17d).Above the boundary layer, (Figures 17e and 17f), averagePWB C2Cl4 levels are also greater than those of TRACE-P,although average differences are smaller than those below2 km. Differences in mixing ratios of CH3Cl remainvariable and overall, not significantly different. Althoughthese differences may suggest that PWB observed greaterindustrial inputs in the region than during TRACE-P andcomparable combustion inputs, significant differences inthe usage of C2Cl4 occurred between the two missions,accounting for at least part of this change [McCulloch etal., 1999; U.S. Environmental Protection Agency, 1994;Schettler et al., 1999]. McCulloch et al. [1999] calculate aglobal decrease in industrial emissions of C2Cl4 of 0.023 ±0.10 Tg/yr between 1988 and 1996, 6% of the baseline 1990emissions from this source. The change in latitudinaldistribution above the boundary layer (Figure 17e and17f)would suggest that the decrease in northern hemisphereC2Cl4 sources is the most likely explanation for differencesbetween missions.[37] Latitudinal CH4 means in the free troposphere
(2–6 km; Figure 17b) are on average 29 ± 9 ppbv higherfor TRACE-P, similar to the difference seen in near-surfacevalues. At these altitudes, the greatest differences are
observed south of 25�N. Above 6 km (Figure 16c), CH4
differences were somewhat greater, by 39 ± 12 ppbv. Asseen in Figure 17, average CH4 and C2H6 mixing ratioswithin the Western Pacific are highly correlated for bothmissions.
4.2. Trends With Altitude
[38] As shown in Figure 18, average altitude profilesduring PWB for CH4 and a variety of other hydrocarbonsappear to be quite similar to those seen in TRACE-P(Figure 10) and the high correlation between CH4 and thesegases was also present during the mission (�CH4/�CO =0.74, r2 = 0.79; �CH4/�C2H6 = 0.046 ppbv/pptv, r2 = 0.91;�CH4/�C2Cl4, = 4.56 ppbv/pptv, r2 = 0.85). Although quitesimilar, the relationship between CH4 and C2H6 is signifi-cantly different than that calculated for TRACE-P (0.050) atthe 95% confidence level. The PWB regression slopes forCH4 and CO and for CH4 and C2Cl4 differ at the 99% level.The regression slope of CH4 with CO is steeper in PWB(0.74 versus 0.58 for TRACE-P) and that with C2Cl4 isshallower (4.56 versus 7.37 ppbv/pptv for TRACE-P). Thelatter is likely a reflection of the significantly higher C2Cl4inputs during PWB. Liu et al. [2003] suggest that convectionover Southeast Asia may have been enhanced duringTRACE-P relative to PWB. A greater contribution from
Figure 16. Latitudinal CH4 trends by longitude class andaltitude for PEM-West B and TRACE-P. (a) 0–2 km; (b) 2–6 km; and (c) >6 km.
GTE 28 - 16 BARTLETT ET AL.: METHANE IN THE WESTERN NORTH PACIFIC

biomass burning in this region as well as changes in Asiansources between the missions may contribute to the differentrelationship between CH4 and CO.
4.3. Regional Comparisons
[39] Figures 2 and 15 highlight the significant differencein overall CH4 levels observed across the Pacific Basin overa 7 year time interval. These differences however, includecontributions from any seasonal disparities between themission and changes in the global background levels, aswell as any possible meteorological variability and sourcechanges. In order to examine any air quality changes due toindustrialization and land use change, we must account forthese other contributions.[40] Although TRACE-P and PWB were conducted at
roughly the same time of year, the several week offset couldbe a concern for CH4 as well as the NMHCs, since it has asignificant seasonal cycle. Monthly averages based onCMDL Pacific background air samples (Figure 19a) suggestthat this source of variability is relatively small for CH4 butthat the increase over the 7 years between the missions is
large. Although there can be significant longitudinal vari-ability in CH4, as shown above in section 4.3, longitudinalvariability in background levels for a long-lived trace gassuch as CH4 is much smaller than that due to differences inthe latitudinal distribution of sources [Dlugokencky et al.,1994]. Comparison of CMDL background latitudinal meansfor the two missions (Figure 19b), indicates a relativelyconstant difference between the PWB and TRACE-P timeperiods over the domain of most interest between 10�N and40�N. Latitudinal variability in background differences mayin part be due to differential growth in source types.Between 50�S and 30�N, differences in CMDL backgroundlevels range from 12 to 55 ppbv and average 41 ± 7 (1 s).Similar calculations for background sites outside of thePacific basin yield comparable differences (data not shown).Using all the CMDL sites, we derive a global backgrounddifference of 38 ± 6 ppbv for latitudes south of 30�Nbetween the two missions. North of 30�N, average differ-ences are 25 ± 10 ppbv (Pacific) and 29 ± 14 ppbv (non-Pacific), yielding a global average of 27 ± 12 ppbv.Although lower latitude sites in the Pacific Basin tend to
Figure 17. Latitudinal trends with altitude in the Western Pacific (west of 160�E) during TRACE-P andPWB. For CH4 and C2H6: (a) 0–2 km; (b) 2–6 km; and (c) >6 km. For perchloroethene (C2Cl4) andmethyl chloride (CH3Cl): (d) 0–2 km; (e) 2–6 km; and (f) >6 km.
BARTLETT ET AL.: METHANE IN THE WESTERN NORTH PACIFIC GTE 28 - 17

have slightly higher differences between missions, suggest-ing perhaps that sources may have increased there morethan in other regions, these differences are not statisticallysignificant.[41] Assuming that the meteorological setting of the two
missions is roughly similar, as indicated by Fuelberg et al.[2003], and that transport of continental outflows werecomparably sampled, calculations based on the observedchanges in background mixing ratios suggest that the aver-age changes in CH4 seen between missions, on the order of30–40 ppbv (section 5.1), are likely to be primarily a resultof an increasing background rather than a change in emis-sions due to changing land use and/or industrialization.Although our CMDL reference background concentrations
are sampled at the surface, because CH4 is a long-livedgas, upper altitude concentrations should reflect those atsurface-level since rates of mixing are rapid relative tophotochemical loss. This assumption seems reasonable sincedifferences between missions above the boundary level aresimilar to those within it. The high correlation observed forboth missions between CH4 and other hydrocarbons such asC2H6, may however, provide an additional way to examinethe change in CH4 at all altitudes between the two missionssince the NMHCs are not thought to have significant long-term background trends due to shorter atmospheric lifetimes.[42] In Figure 20, we show the correlation between
differences in CH4 and C2H6 between PWB and TRACE-Pfor highly averaged spatial data. The data used to calculatedifferences are 1 km altitude means for six large geographicregions, the broad latitude and longitude classes discussedpreviously (south of 20�N, 20–40�N, north of 40�N andeither east or west of 160�E). As shown in Figures 10 and 18and discussed above, variability in CH4 and C2H6 betweenPWB and TRACE-P are highly correlated. Based on thisrelationship and the assumption that there is relatively littlelong-term change in C2H6 in comparison to CH4 [Rinsland etal., 2000; Zhao et al., 2002], the y-intercept yields anestimate of the change in CH4 between the missions. Thiscalculation is complicated however, by the seasonal cycle inC2H6 and the offset in timing between the two missions.
Figure 18. PEM-West B average altitude profiles for CH4
and selected hydrocarbons, 20�N–40�N; 20� longitudeclasses; as for Figure 10 for TRACE-P. (a) 100–120�E;(b) 120–140�E; (c) 140–160�E; and (d) 160–180�E.
Figure 19. (a) Monthly average CH4 mixing ratios forPacific Basin CMDL sites during the PEM-West B andTRACE-P missions, by latitude. Elevated values at 36.7�Nare for the Tae-ahn Peninsula, Korea, known to have highCH4 levels. (b) As for Figure 19a, but averaged for theduration of the missions and grouped into 5� latitudeclasses.
GTE 28 - 18 BARTLETT ET AL.: METHANE IN THE WESTERN NORTH PACIFIC

Seasonal variability in C2H6 is greatest in the lower altitudesof the high northern latitudes [Rudolph, 1995; Gupta et al.,1998], a function both of greater seasonal changes in theatmospheric OH sink in the north and the latitudinaldistribution of sources. Here, we can partially compensatefor the seasonal cycle and the several week offset betweenthe missions by only using data from the <20�N and 20–40�N latitude classes. Restricting the data in Figure 20 inthis way demonstrates that much of the variability in C2H6
decrease between missions (PWB higher than TRACE-P)occurs north of 40�N. The largest of these negative valuesare observed at altitudes below 3 km. The correlationbetween changes in CH4 and C2H6 yields a change ‘‘offset’’for CH4 of 38 ppbv (r2 = 0.92). Inclusion of higher latitudedata decreases the coefficient of determination but results inlittle alteration in the calculated intercept because therelationship for all of the data is driven largely by the lowerlatitude values.[43] Dispersion along the regression line in Figure 20 is an
indirect measure of spatial variability between the missions,since we would expect points to form a cluster at 0 changefor C2H6 and roughly 38 ppbv for CH4 if transport andgeographic regions were perfectly paired. Note that forC2H6, positive and negative mission differences are roughlyequal and average a nonsignificant �41 ± 296 pptv, indicat-ing that there was relatively little sampling bias, such as adisproportionate sampling of plumes, between the missions.These calculations of course, shed little light on any effectsof sampling bias on the regional representativeness of theobservations. Similar calculations for changes between mis-sions in CH4 and C2H2 and CH4 and C3H8 yield comparable‘‘change offsets’’ of 36 ppbv (r2 = 0.81, �CH4/�C2H2 =0.089 ppbv/pptv, n = 37) and 41 ppbv (r2 = 0.84, �CH4/�C3H8 = 0.097 ppbv/pptv, n = 37) respectively.[44] Correlations between changes between missions in
CH4 and other trace gases such as CO can also be calculated.For CO, the relationship between the two is not as strong, inpart because major sources such as combustion and fossilfuel use vary in their CH4/CO ratios. Differences betweenmissions yield a ‘‘change offset’’ for CH4 of 29 ppbv
(r2 = 0.55, n = 53, �CH4/�CO = 0.45), lower thancalculated with the hydrocarbons, again suggesting thateither the relative mix of sources may be different betweenthe two missions, as discussed in section 5.3, or that theassumption of little to no long-term change in CO is invalid.Spectroscopic and tropospheric measurements indicate thatCO concentrations have either decreased somewhat [Novelliet al., 1998; Zhao et al., 2002] or remained relativelyconstant [Rinsland et al., 2000] over the last decade. As aconsequence of its relatively short atmospheric lifetime,changes in CO sources and sinks are reflected rapidly inits interannual trends. Increasing trends prior to about 1990may have been the result of industrialization while recentdecreases may be due to decreases in biomass burning[Novelli et al., 1998]. Restricting the data to latitudes southof 40�N improves the correlation between CH4 and CO (CH4
offset = 31 ppbv, r2 = 0.70, n = 39, �CH4/�CO = 0.58),probably due to latitudinal differences in the CO seasonalcycle as for C2H6. Restricting the relationship to latitudesbelow 40�N may also change the relative mix between typesof sources, as indicated by a shift in regression slope from0.45 to 0.58. Calculations using changes in C2H2/CO ratiosand CH4 yield values in agreement with those using hydro-carbons.[45] Agreement between the various hydrocarbons for
estimating a basin-wide mission difference in CH4 is excel-lent and their consistency with the calculated backgroundchange derived from CMDL surface data both confirms theassumption that there is little long-term change in theNMHCs as well as the conclusion that changes in Asianindustrialization and land use over the last 7 years are notreflected in obvious additional changes in levels of CH4
throughout the air column. Given the relatively long atmo-spheric lifetime of CH4 this may not be an unexpected findingsince changes in emissions are integrated into backgroundlevels and the response time of atmospheric mixing ratios tochanges in emissions is fairly rapid [see, e.g., Tans, 1997].
5. Summary
[46] The high-resolution, high-precision CH4 data setcollected during TRACE-P during the north Asian springhighlights the importance of continental outflow to theNorth Pacific Basin at this time. Trace gas ratios (�CH4/�CO) and source-specific tracers such as C2Cl4 for urban/industrial sources and CH3Cl for combustion indicate thatthese outflows are complex mixtures of trace gases from avariety of sources that are rapidly carried into the basin bythe strong westerly transport characteristic of this time ofyear [Fuelberg et al., 2003]. Five-day trajectories calculatedfor elevated trace gases in plume layers suggest that sourcesas far upwind as Africa, India, Southeast Asia, and Siberiamake contributions to the pollution observed during themission. Trajectories from the southwest and west (Africa,India, Southeast Asia) carry trace gas signatures indicatinghigher inputs from combustion sources than those from thenorthwest (Siberia, northern China). Overall, the highcorrelations between spatially averaged CH4 mixing ratiosand those of C2H6 and other hydrocarbons, as well asC2Cl4, indicate that urban/industrial sources dominate re-gional inputs. Comparisons between TRACE-P and PEM-West B, flown during roughly the same time of year and
Figure 20. Differences in spatially averaged CH4 andC2H6 mixing ratios between PEM-West B and TRACE-P.Data are 1 km altitude averages for three latitude classes(north of 40�N, 20�N–40�N, south of 20�N) and twolongitude classes (west of 160�E and east of 160�E). Opencircles: North of 40�N; solid circles: South of 40�N.
BARTLETT ET AL.: METHANE IN THE WESTERN NORTH PACIFIC GTE 28 - 19

under a similar meteorological setting 7 years earlier,suggest that although the TRACE-P CH4 observations aresignificantly higher, changes in CH4 largely parallel thoseseen in background air over this time interval. Althoughclearly significant changes in population, land use, andindustrialization have occurred between the two missions,these comparisons would imply that any regional emissionchanges are difficult to isolate from those upwind and arenot reflected in basin-wide changes in CH4 levels over andabove the changes already included in the baseline rise ofthis long-lived trace gas.
[47] Acknowledgments. This work was made possible by supportfrom the NASA GTE program and we wish to thank the GTE staff, led byVickie Connors, for their help. Excellent logistical support on this complexexpedition was provided by the pilots, missions managers, and crew of theWallops P-3B and the Dryden DC-8 aircraft. We greatly appreciate use ofdata on background levels of CH4, provided courtesy of Ed Dlugokenckyand the Climate Monitoring and Diagnostic Laboratory (CMDL). Weappreciate the thoughtful comments of Nicola Blake on an earlier manu-script version as well as those of three anonymous reviewers.
ReferencesAndreae, M. O., and P. Merlet, Emission of trace gases and aerosols frombiomass burning, Global Biogeochem. Cycles, 15, 955–966, 2001.
Andreae, M. O., et al., Methyl halide emissions from savanna fires insouthern Africa, J. Geophys. Res., 101, 23,603–23,613, 1996.
Bartlett, K. B., G. W. Sachse, J. E. Collins Jr., and R. C. Harriss, Methane inthe tropical South Atlantic: Sources and distribution during the late dryseason, J. Geophys. Res., 101, 24,139–24,150, 1996.
Bey, I., D. J. Jacob, J. A. Logan, and R. M. Yantosca, Asian chemicaloutflow to the Pacific in spring: Origins, pathways, and budgets, J. Geo-phys. Res., 106, 23,097–23,113, 2001.
Blake, D. R., and F. S. Rowland, Continuing world-wide increase in tropo-spheric methane, 1978–1987, Science, 239, 1129–1131, 1988.
Blake, N. J., D. R. Blake, B. C. Sive, T.-Y. Chen, F. S. Rowland, J. E.Collins Jr., G. W. Sachse, and B. E. Anderson, Biomass burning emis-sions and vertical distribution of atmospheric methyl halides and otherreduced carbon gases in the South Atlantic region, J. Geophys. Res., 101,24,151–25,164, 1996.
Blake, N. J., D. R. Blake, T.-Y. Chen, J. E. Collins Jr., G. W. Sachse, B. E.Anderson, and F. S. Rowland, Distribution and seasonality of selectedhydrocarbons and halocarbons over the western Pacific basin duringPEM-West A and PEM-West B, J. Geophys. Res., 102, 28,315 –28,331, 1997.
Blake, N. J., et al., Large-scale latitudinal and vertical distribution ofNMHCs and selected halocarbons in the troposphere over the PacificOcean during the March –April 1999 Pacific Exploratory Mission(PEM - Tropics B), J. Geophys. Res., 106, 32,627–32,644, 2001.
Blake, N. J., et al., NMHCs and halocarbons in Asian continental outflowduring TRACE-P: Comparison to PEM-West B, J. Geophys. Res.,108(D20), 8806, doi:10.1029/2002JD003367, in press, 2003.
Braunlich, M., O. Aballain, T. Marik, P. Jockel, C. A. M. Brenninkmeijer,J. Chappellaz, J.-M. Barnola, R. Mulvaney, and W. T. Sturges, Changesin the global atmospheric methane budget over the last decades inferredfrom 13C and D isotopic analysis of Antarctic firn air, J. Geophys. Res.,106, 20,465–20,481, 2001.
Brocard, D., J.-P. Lacaux, and H. Eva, Domestic biomass combustion andassociated atmospheric emissions in West Africa, Global Biogeochem.Cycles, 12, 127–139, 1998.
Browell, E. V., et al., Large-scale ozone and aerosol distributions, air masscharacterics, and ozone fluxes over the western Pacific Ocean in the late-winter/early-spring, J. Geophys. Res., 108(D20), 8805, doi:10.1029/2002JD003290, in press, 2003.
Cooke, W. F., B. Koffi, and J.-M. Gregoire, Seasonality of vegetation firesin Africa from remote sensing data and application to a global chemistrymodel, J. Geophys. Res., 101, 21,051–21,065, 1996.
Dlugokencky, E. J., L. P. Steele, P. M. Lang, and K. A. Masarie, The growthrate and distribution of atmospheric methane, J. Geophys. Res., 99,17,021–17,043, 1994.
Dlugokencky, E. J., K. A. Masarie, P. M. Lang, and P. P. Tans, Continuingdecline in the growth rate of the atmospheric methane burden, Nature,393, 447–450, 1998.
Ehhalt, D. H., F. Rohrer, A. B. Knaus, M. J. Prather, D. R. Blake, andF. S. Rowland, On the significance of regional trace gas distributions as
dervived from aircraft campaigns in PEM-West A and B, J. Geophys.Res., 102, 28,333–28,351, 1997.
Eisele, F. L., et al., Summary of measurement intercomparisons duringTRACE-P, J.Geophys.Res.,108(D20), 8791, doi:10.1029/2002JD003167,inpress, 2003.
Etheridge, D. M., L. P. Steele, R. J. Francey, and R. L. Langenfelds, Atmo-spheric methane between 1000 A.D. and present: Evidence of anthropo-genic emissions and climatic variability, J. Geophys. Res., 103, 15,979–15,993, 1998.
Ferek, R. J., J. S. Reid, P. V. Hobbs, D. R. Blake, and C. Liousse, Emissionfactors of hydrocarbons, halocarbons, trace gases and particles from bio-mass burning in Brazil, J. Geophys. Res., 103, 32,107–32,118, 1998.
Francey, R. J., M. R. Manning, C. E. Allison, S. A. Coram, D. M. Etheridge,R. L. Langenfelds, D. C. Lowe, and L. P. Steele, A history of d13C inatmospheric CH4 from the Cape Grim air archive and Antarctic firn air,J. Geophys. Res., 104, 23,631–23,643, 1999.
Fuelberg, H. E., C. M. Kiley, J. R. Hannan, D. J. Westberg, M. A. Avery,and R. E. Newell, Atmospheric transport during the Transport and Che-mical Evolution over the Pacific (TRACE-P) experiment, J. Geophys.Res., 108(D0), 8782, doi:10.1029/2002JD003092, in press, 2003.
Gupta, M., S. Tyler, and R. Cicerone, Modeling atmospheric d13CH4 andthe causes of recent changes in atmospheric CH4 amounts, J. Geophys.Res., 101, 22,923–22,932, 1996.
Gupta, M. L., R. J. Cicerone, D. R. Blake, F. S. Rowland, and I. S. A.Isaksen, Global atmospheric distributions and source strenths of lighthydrocarbons and tetrachloroethene, J. Geophys. Res., 103, 28,219–28,235, 1998.
Hao, W. M., and M.-H. Liu, Spatial and temporal distribution of tropicalbiomass burning, Global Biogeochem. Cycles, 8, 495–503, 1994.
Harris, J. M., E. J. Dlugokencky, S. J. Oltmans, P. P. Tans, T. J. Conway,P. C. Novelli, K. W. Thoning, and J. D. W. Kahl, An interpretation oftrace gas correlations during Barrow, Alaska, winter dark periods, 1986–1997, J. Geophys. Res., 105, 17,267–17,278, 2000.
Harriss, R. C., G. W. Sachse, J. E. Collins Jr., L. Wade, K. B. Bartlett, R. W.Talbot, E. V. Browell, L. A. Barrie, G. F. Hill, and L. G. Burney, Carbonmonoxide and methane over Canada: July–August 1990, J. Geophys.Res., 99, 1659–1669, 1994.
Heald, C. L., D. J. Jacob, P. I. Palmer, M. Evans, G. Sachse, D. Blake, andH. Singh, Biomass burning emission inventory with daily resolution:Application to aircraft observations of Asian outflow, J. Geophys. Res.,108(D21), 8811, doi:10.1029/2002JD003082, in press, 2003.
Hoell, J. M., D. D. Davis, S. C. Liu, R. E. Newell, H. Akimoto, R. J.McNeal, and R. J. Bendura, The Pacific Exploratory Mission-WestPhase B: February –March 1994, J. Geophys. Res., 102, 28,223 –28,239, 1997.
Houweling, S., F. Dentener, and J. Lelieveld, The modeling of troposphericmethane: How well can point measurements be reproduced by a globalmodel?, J. Geophys. Res., 105, 8981–9002, 2000.
Jacob, D. J., J. H. Crawford, M. M. Kleb, V. E. Connors, R. J. Bendura,J. L. Raper, G. W. Sachse, J. C. Gille, L. Emmons, and C. L. Heald, TheTransport and Chemical Evolution over the Pacific (TRACE-P) aircraftmission: Design, execution, and first results, J. Geophys. Res., 108(D20),8781, doi:10.1029/2002JD003276, in press, 2003.
Khalil, M. A. K., R. A. Rasmussen, M. J. Shearer, R. W. Dalluge, L. Ren,and C.-L. Duan, Factors affecting methane emissions from rice fields,J. Geophys. Res., 103, 25,219–25,231, 1998.
Lelieveld, J., et al., The Indian Ocean Experiment: Widespread pollutionfrom South and Southeast Asia, Science, 291, 1031–1036, 2001.
Liu, H., D. J. Jacob, I. Bey, R. M. Yantosca, B. N. Duncan, and G.W. Sachse,Transport pathways for Asian combustion outflow over the Pacific: Inter-annual and seasonal variations, J. Geophys. Res., 108(D20), 8786,doi:10.1029/2002JD003102, in press, 2003.
Lobert, J. M., D. H. Scharffe, W.-M. Hao, T. A. Kuhlbusch, R. Seuwen,P. Warneck, and P. J. Crutzen, Experimental evaluation of biomass burningemissions: Nitrogen and carbon containing compounds, inGlobal BiomassBurning-Atmospheric, Climatic, and Biospheric Implications, edited byJ. S. Levine, MIT Press, Cambridge, Mass., 1991.
Matthews, E., I. Fung, and J. Lerner, Methane emission from rice cultiva-tion: Geographic and seasonal distribution of cultivated areas and emis-sions, Global Biogeochem. Cycles, 5, 3–24, 1991.
McCulloch, A., M. L. Aucott, T. E. Graedel, G. Kleiman, P. M. Midgley,and Y.-F. Li, Industrial emissions of trichloroethene, tetrachloroethene,and dichloromethane: Reactive Chlorine Emissions Inventory, J. Geo-phys. Res., 104, 8417–8428, 1999.
McKeen, S. A., S. C. Liu, E.-Y. Hsie, X. Lin, J. D. Bradshaw, S. Smyth,G. L. Gregory, and D. R. Blake, Hydrocarbon ratios during PEM-West A:A model perspective, J. Geophys. Res., 101, 2087–2109, 1996.
Merrill, J. T., R. E. Newell, and A. S. Bachmeier, A meteorological over-view for the Pacific Exploratory Mission-West Phase B, J. Geophys. Res.,102, 28,241–28,253, 1997.
GTE 28 - 20 BARTLETT ET AL.: METHANE IN THE WESTERN NORTH PACIFIC

Novelli, P. C., K. A. Masarie, and P. M. Lang, Distributions and recentchanges of carbon monoxide in the lower troposphere, J. Geophys. Res.,103, 19,015–19,033, 1998.
Parrish, D. D., C. J. Hahn, E. J. Williams, R. B. Norton, F. C. Fehsenfeld,H. B. Singh, J. D. Shetter, B. W. Gandrud, and B. A. Ridley, Indicationsof photochemical histories of Pacific air masses from measurements ofatmospheric trace species at Point Arena, California, J. Geophys. Res.,97, 15,883–15,902, 1992.
Prinn, R. G., R. F. Weiss, B. R. Miller, J. Huang, F. N. Alyea, D. M.Cunnold, P. J. Fraser, D. E. Hartley, and P. G. Simmons, Atmospherictrends and lifetimes of CH3CCl3 and global OH concentrations, Science,269, 187–192, 1995.
Randriambelo, T., J.-L. Baray, and S. Baldy, Effect of biomass burning,convective venting, and transport on tropospheric ozone over the IndianOcean: Reunion Island field observations, J. Geophys. Res., 105,11,813–11,832, 2000.
Rasmussen, R. A., L. E. Rasmussen, M. A. K. Khalil, and R. W. Dalluge,Concentration distribution of methyl chloride in the atmosphere, J. Geo-phys. Res., 85, 7350–7356, 1980.
Rinsland, C. P., et al., Northern and southern hemisphere ground-basedinfrared spectroscopic measurements of tropospheric carbon monoxideand ethane, J. Geophys. Res., 103, 28,197–28,217, 1998.
Rinsland, C. P., E. Mahieu, R. Zander, P. Demoulin, J. Forrer, andB. Buchmann, Free tropospheric CO, C2H6, and HCN above centralEurope: Recent measurements from the Jungfraujoch station includingthe detection of elevated columns during 1998, J. Geophys. Res., 105,24,235–24,249, 2000.
Rudolph, J., The tropospheric distribution and budget of ethane, J. Geo-phys. Res., 100, 11,369–11,381, 1995.
Sachse, G. W., G. F. Hill, L. O. Wade, and M. G. Perry, Fast-response, high-precision carbon monoxide sensor using a tunable diode laser absorptiontechnique, J. Geophys. Res., 92, 2071–2081, 1987.
Sachse, G. W., J. E. Collins, G. F. Hill, L. O. Wade, L. G. Burney, and J. A.Ritter, Airborne tunable diode laser sensor for high precision concentra-tion and flux measurements of carbon monoxide and methane, Proc.SPIE Int. Opt. Eng., 1433, 145–156, 1991.
Schettler, T., G. Solomon, M. Valenti, and A. Huddle, Generations at Risk:Reproductive Health and the Environment, 417 pp., MIT Press, Cam-bridge, Mass., 1999.
Scholes, R. J., D. E. Ward, and C. O. Justice, Emission of trace gasesand aerosol particles due to vegetation burning in southern hemisphereAfrica, J. Geophys. Res., 101, 23,677–23,682, 1996.
Smyth, S., et al., Comparison of free tropospheric western Pacific air massclassification schemes for the PEM-West A experiment, J. Geophys. Res.,101, 1743–1762, 1996.
Streets, D. G., K. Jiang, X. Hu, J. E. Sinton, X.-Q. Zhang, D. Xu, M. Z.Jacobson, and J. E. Hansen, Recent reductions in China’s greenhouse gasemissions, Science, 294, 1835–1837, 2001.
Streets, D. G., et al., An inventory of gaseous and primary aerosol emis-sions in Asia in the year 2000, J. Geophys. Res., 108(D21), 8809,doi:10.1029/2002JD003093, in press, 2003.
Talbot, R. W., et al., Chemical characteristics of continental outflow fromAsia to the troposphere over the western Pacific Ocean during February–March 1994: Results from PEM-West B, J. Geophys. Res., 102, 28,255–28,274, 1997.
Tans, P. P., A note on isotopic ratios and the global atmospheric methanebudget, Global Biogeochem. Cycles, 11, 77–81, 1997.
U. S. Environmental Protection Agency, Chemicals in the environment:Perchloroethylene, CAS 127-18-4, Washington, D. C., 1994.
Wang, C. J.-L., D. R. Blake, and R. S. Rowland, Seasonal variations in theatmospheric distribution of a reactive chlorine compound, tetrachlor-oethene (CCl2 = CCl2), Geophys. Res. Lett., 22, 1097–1100, 1995.
Wild, O., J. K. Sundet, M. J. Prather, I. S. A. Isaksen, H. Akimoto, E. V.Browell, and S. J. Oltmans, CTM ozone simulations for spring 2001 overthe western Pacific: Comparisons with TRACE-P lidar, ozonesondes, andTOMS columns, J. Geophys. Res., 108(D21), 8826, doi:10.1029/2002JD00328, in press, 2003.
Yao, H., Y.-H. Zhuang, and Z. L. Chen, Estimation of methane emissionsfrom rice paddies in mainland China, Global Biogeochem. Cycles, 10,641–649, 1996.
Zhao,Y.,K. Strong,Y.Kondo,M.Koike,Y.Matsumi,H. Inrie,C. P.Rinsland,N. B. Jones, K. Suzuki, H. Nakajima, H. Nakane, and I. Murata,Spectroscopic measurements of tropospheric CO, C2H6, C2H2, and HCNin northern Japan, J. Geophys. Res., 107(D18), 4343, doi:10.1029/2001JD000748, 2002.
�����������������������K. B. Bartlett, Complex Systems Research Center, University of New
Hampshire, Morse Hall, Durham, NH 03824, USA. ([email protected])D. R. Blake, Department of Chemistry, University of California, Irvine,
Irvine, CA 92697, USA. ([email protected])C. Harward, Science Applications International Corporation, c/o NASA
Langley Research Center, MS 468, Hampton, VA 23681, USA.([email protected])G. W. Sachse, NASA Langley Research Center, Hampton, VA 23681,
USA. ([email protected])T. Slate, Swales Aerospace, c/o NASA Langley Research Center, MS
468, Hampton, VA 23681, USA. ([email protected])
BARTLETT ET AL.: METHANE IN THE WESTERN NORTH PACIFIC GTE 28 - 21

Figure 2. Regional distribution of CH4 during the TRACE-P expedition; 0–2 km, 2–6 km, and above6 km. Data were grouped into 2.5� latitude � 2.5� longitude areas then averaged. Number of observationswithin areas vary.
BARTLETT ET AL.: METHANE IN THE WESTERN NORTH PACIFIC
GTE 28 - 4

Figure 15. Regional distribution of CH4 during PEM-West B, as for Figure 2.
BARTLETT ET AL.: METHANE IN THE WESTERN NORTH PACIFIC
GTE 28 - 15