large scale smart meter data assessment for energy ...€¦ · large scale smart meter data...
TRANSCRIPT

LARGE SCALE SMART METER DATA ASSESSMENT FOR ENERGY BENCHMARKING AND OCCUPANT BEHAVIOUR PROFILE DEVELOPMENT
MIKLÓS HORVÁTH1*, JACQUELINE NICOLE ADAMS2, ZSÓFIA DEME BÉLAFI1, LÁSZLÓ CZÉTÁNY1, ZSUZSA SZALAY3, SZABINA VÁRNAGY4, ANDRÁS REITH4, TAMÁS CSOKNYAI1
1 BUDAPEST UNIVERSITY OF TECHNOLOGY AND ECONOMICS, FACULTY OF MECHANICAL ENGINEERING, MUEGYETEM RKP. 3-9., 1111 BUDAPEST, HUNGARY
2 THE UNIVERSITY OF TENNESSEE, KNOXVILLE, TN 37996-2250
3 BUDAPEST UNIVERSITY OF TECHNOLOGY AND ECONOMICS, FACULTY OF CIVIL ENGINEERING, MUEGYETEM RKP. 3-9., 1111 BUDAPEST, HUNGARY
4 ABUD ENGINEERING STUDIO, KISFALUDY U. 38., 1082 BUDAPEST, HUNGARY
Content
• Smart meter technology
• Smart meters in Hungary
• Methods
• Smart meter datasets
• Qualitative information
• Time series analysis
• Questionnaires and interviews
• Preliminary results

Introduction
• Building energy performance modelling:• Asset method: standard user behaviour
• Operational method: only valid under specific circumstances
• Information on real occupants’ behavior is scarce
• Smart metering (SM) technology offers new perspectives
• 700 million SM installed worldwide (2016)
• Smart meters promoted by new EPBD and other EU legislation: 80% customer penetration goal by 2020
• 72% of EU consumers expected to have smart electricity meters and 40% smart gas meters by 2020(acc to cost-benefit analysis)

Smart meters in Hungary
• Central Smart Grid Pilot Project (KOM):• To assess the possibilities of a national smart
monitoring system• 139 901 smart meters installed in 2016-2017• Residential, public, commercial and industrial buildings
• Large Scale Smart Meter Data Assessment for Energy Benchmarking and Occupant Behavior Profile Development of Building Clusters (2018-2021)• New research project to analyse the data• More precise picture on the real energy consumption
of the stock• Comparative analysis btw measured and modelled data• Establish user profiles and patterns
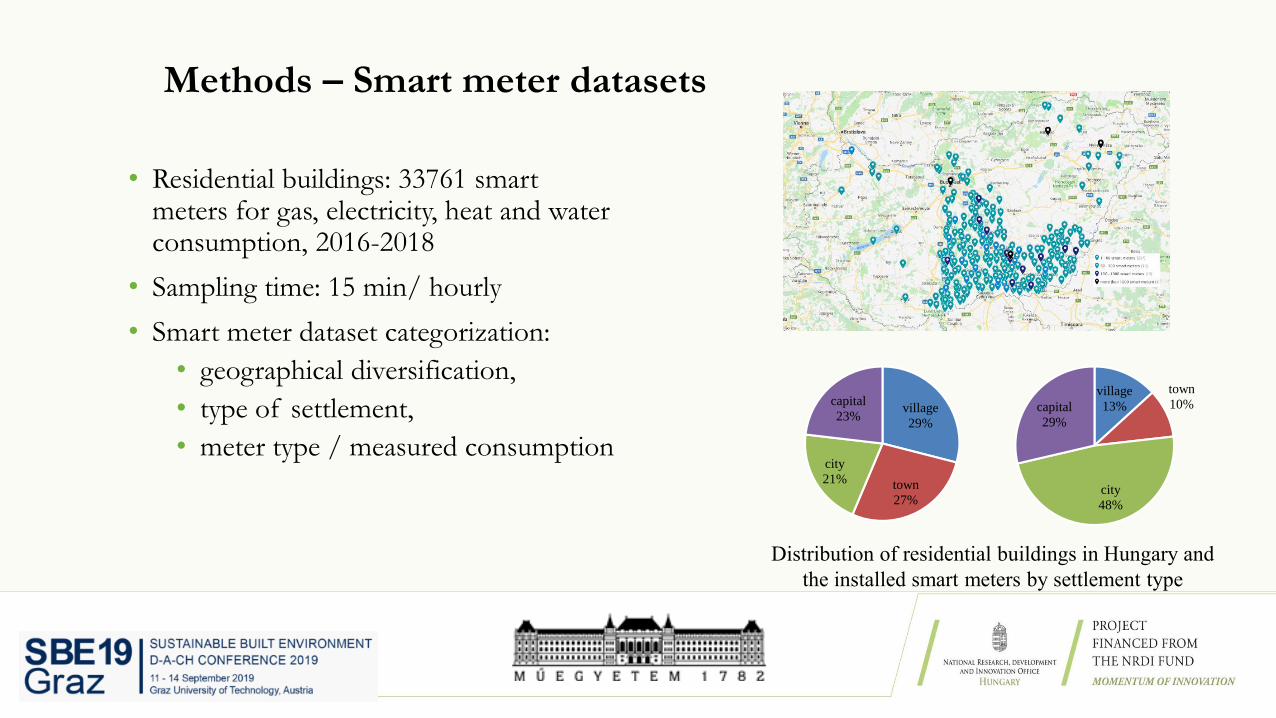
Methods – Smart meter datasets
• Residential buildings: 33761 smart meters for gas, electricity, heat and water consumption, 2016-2018
• Sampling time: 15 min/ hourly
• Smart meter dataset categorization:
• geographical diversification,
• type of settlement,
• meter type / measured consumption
village
29%
town
27%
city
21%
capital
23%
village
13%
town
10%
city
48%
capital
29%
Distribution of residential buildings in Hungary and
the installed smart meters by settlement type

Methods – Statistical Significance and Representative
Sample
𝑁𝑠 =(𝑁𝑝)(𝑝)(1−𝑝)
𝑁𝑝−1𝐵
𝐶2+(𝑝)(1−𝑝)
Size of town Nr. of apartments Geographical region Nr. of apartments
Villages and towns 1 227 110 (23%) Southern Great Plain 602 819 (11%)
Cities 1 370 964 (26%) Southern Transdanubia 409 265 (8%)
County-seat cities 925 730 (17%) Northern Great Plain 624 091 (12%)
Capital 1 832 310 (34%) Northern Hungary 509 790 (10%)
Central Hungary 2 318 556 (43%)
Western Transdanubia 435 697 (8%)
Central Transdanubia 455 896 (9%)
• Statistical significance is important to formulate statements on the Hungarian building stock
• Population groups determined:
• size of settlement and geographic regions
• necessary sample size was calculated, sampling error 3%, confidence level 95%
• Representativity ensured by preserving the ratios of population groups (e.g. in Hungary 26% of apartments located in cities)

Methods – Qualitative Information
Assigned to Smart Meter Data Points
• Only address of the buildings is available
• Additional qualitative data is needed about the buildings
• Manual approach based on GIS mapping tool was chosen: compromise btw accuracy and time spent
• Parameters: building function, type, area, number of stories, condition of building, visible retrofit measures, type of roof, presence of solar panels/ collectors
• Subcategorization based on building archetypes
• Problems: streetview images not available in some villages (available for 42% of the sample), identification of building sometimes difficult, blocked by external obstacles
?
Building typology in Hungary

Methods – Time series analysis
• Analysis of natural gas consumption and electricity
• Data filtering to discard unusable and false datasets
• Manual analysis of some series to identify typical errors
• Development of algorithms to automatically categorise the time series
• Manual investigation kept to a minimum

Methods – Questionnaires and Interviews
• Socio-demographic data will be collected
• Independent variables from four models commonly used to determine social-psychological determinants of energy efficient technology acceptance were selected for surveys
• Three rounds of data collection:
• Public buildings without SM
• Public smart buildings
• Households with SM
Model Variables
Theory of Planned Behavior Attitude towards the technology
Technology Acceptance Model Perceived usefulness
Perceived ease of use
Norm Activation Model Personal norms (moral obligations)
Sustainable Energy Technology
Acceptance (SETA)
Trust in technology providers
Knowledge
Perceived risk to privacy
Problem perception (awareness of consequences)
+ dependent demographic variables (age, gender, occupation, education level, perceived material status and building characteristics and retrofit)
+ support for SM technology, etc.
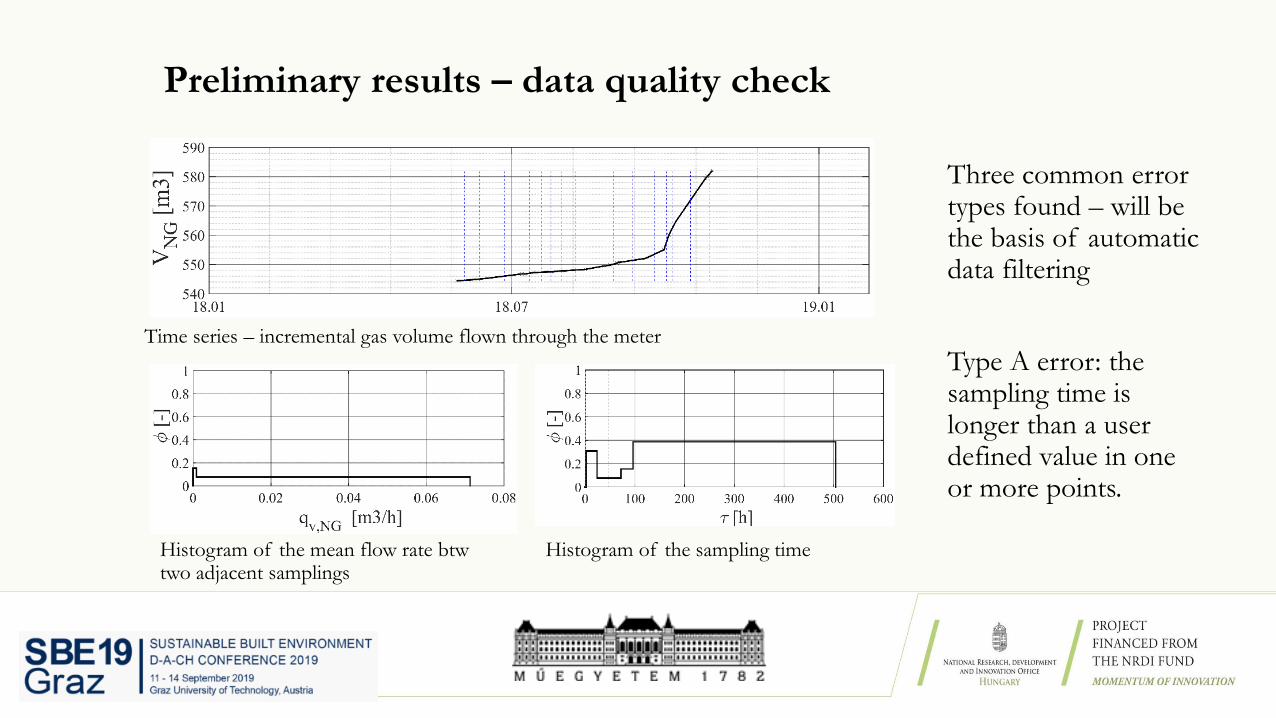
Preliminary results – data quality check
Three common error types found – will be the basis of automatic data filtering
Type A error: the sampling time is longer than a user defined value in one or more points.
Time series – incremental gas volume flown through the meter
Histogram of the mean flow rate btw two adjacent samplings
Histogram of the sampling time

Preliminary results – data quality check
Type B error: no usable data is available (the meter did not record any data, or the change in the data is almost zero –probably the building was not used)
Time series – incremental gas volume flown through the meter

Preliminary results – data quality check
Type C error: small or large breaks in the time series
Time series – incremental gas volume flown through the meter
Histogram of the mean flow rate btw two adjacent samplings
Histogram of the sampling time
Type A and C errors can be corrected in some cases
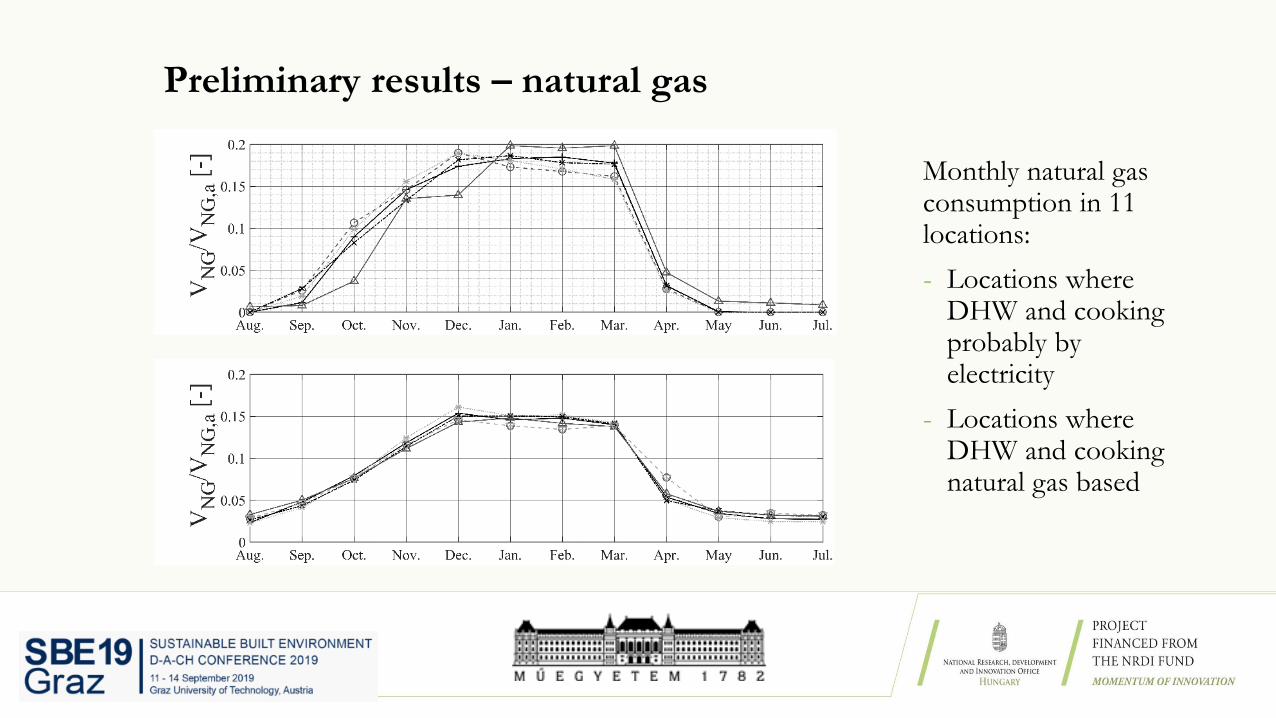
Preliminary results – natural gas
Monthly natural gas consumption in 11 locations:
- Locations where DHW and cooking probably by electricity
- Locations where DHW and cooking natural gas based
Conclusions and future plans
• Representative results can be achieved for settlement categories and building types but not for geographical distribution
• GDPR makes it challenging to collect qualitative supplementary data forresidential buildings
• Data analysis will continue for gas and electricity use, user profiles will be developed
• Public buildings will be analysed in more detail
• Socio-psychological research with questionnaires and interviews will be conducted
• Dynamic building simulation of buildings will be performed

Thank you for your attention!
Presenting author: [email protected]
Project leader: [email protected]

Acknowledgments
Results and the determined trends are being fine-tuned and extended for other building types with a geographic scope of Hungary in another research project entitled “Large Scale Smart Meter Data Assessment for Energy Benchmarking and Occupant Behavior Profile
Development of Building Clusters“. Furthermore, methods and approaches developed in the current work are being further developed for large scale data analysis. The project (no. K 128199) has been implemented with the support provided from the National Research,
Development and Innovation Fund of Hungary, financed under the K_18 funding scheme.
The monitoring data subject to analysis is being collected within the "Central Smart Grid Pilot Project" by KOM Smart Meter Ltd.
The research reported in this paper was also supported by the Higher Education Excellence Program of the Ministry of Human Capacitiesin the frame of Artificial intelligence research area of Budapest University of Technology and Economics (BME FIKP-MI).
The authors wish to acknowledge a Fulbright Visiting Student Researcher Award from the Fulbright Commission for Educational Exchange which enabled scientific exchange between Budapest University of Technology and Economics and University of Tennessee.