largeand small-scalestructureoftheintermediateand ...ngc346 kron 39 smc 302.14, –44.94 61 6825 60...
TRANSCRIPT

arX
iv:1
511.
0084
3v1
[as
tro-
ph.G
A]
3 N
ov 2
015
Mon. Not. R. Astron. Soc. 000, 000–000 () Printed 20 July 2018 (MN LaTEX style file v2.2)
Large and small-scale structure of the Intermediate and
High Velocity Clouds towards the LMC and SMC
J. V. Smoker1⋆, A. J. Fox2, F. P. Keenan31European Southern Observatory, Alonso de Cordova 3107, Casilla 19001, Vitacura, Santiago 19, Chile2 Space Telescope Science Institute, 3700 San Martin Drive, Baltimore MD 21218, USA3Astrophysics Research Centre, School of Mathematics and Physics, Queen’s University Belfast,
Belfast, BT7 1NN
Accepted Received in original form
ABSTRACT
We employ Ca ii K and Na i D interstellar absorption-line spectroscopy of early-type stars in the Large and Small Magellanic Clouds to investigate the large- andsmall-scale structure in foreground Intermediate and High Velocity Clouds (I/HVCs).These data include FLAMES-GIRAFFE Ca ii K observations of 403 stars in fouropen clusters, plus FEROS or UVES spectra of 156 stars in the LMC and SMC.The FLAMES observations are amongst the most extensive probes to date of Ca iistructures on ∼20 arcsec scales in Magellanic I/HVCs.
From the FLAMES data within a 0.5◦ field-of-view, the Ca ii K equivalent widthin the I/HVC components towards three clusters varies by factors of ≥10. Thereare no detections of molecular gas in absorption at intermediate or high velocities,although molecular absorption is present at LMC and Galactic velocities towardssome sightlines. The sightlines show variations in EW exceeding a factor ∼7 in CH+
towards NGC1761 over scales of less than 10 arcminutes.The FEROS/UVES data show Ca ii K I/HVC absorption in ∼60 per cent of
sightlines. No Na i D is found at non-Magellanic HVC velocities aside from a tentativedetection towards the star LHA 120-S 93. The range in the Ca ii/Na i ratio in I/HVCs isfrom –0.45 to +1.5 dex, similar to previous measurements for I/HVCs. In ten sightlineswe find Ca ii/O i ratios in I/HVC gas ranging from 0.2 to 1.5 dex below the solar value,indicating either dust or ionisation effects. In nine sightlines I/HVC gas is detected inboth H i and Ca ii, and shows similar Ca ii/H i ratios to typical I/HVCs, and similarvelocities, implying that in these sightlines the two elements form part of the samestructure.
Key words: ISM: general – ISM: clouds – ISM: abundances – ISM: structure –Galaxies: Magellanic Clouds – Open clusters and associations: Individual: NGC 330,NGC346, NGC 1761, NGC 2004
1 INTRODUCTION
High velocity clouds (HVCs) were discovered over 50 yearsago (Muller, Oort & Raimond 1963). Originally observed inH i, they consist of parcels of gas with velocities not com-patible with Galactic rotation; in practice this means HVCshave |vLSR| >90–100 kms−1 if they lie at at high Galacticlatitudes. Clouds with ∼40< |vLSR| < 90 kms−1 are referredto as Intermediate Velocity Clouds (IVCs). Recently it has
⋆ email: [email protected] Based on ESO programme IDs078.C-0493(A) and 171.D-0237(B).
become clear that at least some of the clouds lie within thehalo of the Milky Way; for example Complex A (van Woer-den et al. 1999), Complex WB (Thom et al. 2006), ComplexC (Wakker et al. 2007, Thom et al. 2008), as well as theCohen Stream, Complex GCP, and Complex g1 (Wakker etal. 2008).
Although some HVCs may be large clouds outside ofthe Milky Way halo (Blitz et al. 1999), the failure to detectHVCs far from their host galaxies (Pisano et al. 2004; West-meier, Bruns & Kerp 2008) and the lack of stars in manyHVCs (e.g. Simon & Blitz 2002; Siegel et al. 2005; Hopp,Schulte-Ladbeck & Kerp 2007) argues against this hypoth-
c© RAS

2 J. Smoker et al.
ysis. Likewise, comparison of the probability of detection ofionised HVCs in AGN and Galactic halo stellar sightlinesby Lehner & Howk (2011) indicate that HVCs at velocitiesbetween ∼90 and 170 kms−1 likely reside within the halo ofthe Milky Way and are not further away structures withinthe local group. These clouds may have formed by the accre-tion of primordial gas, interaction of the Milky Way with itsneighbouring galaxies via ram pressure and tidal stripping,or the Galactic Fountain (see Bregman 2004 for a review).Finally, Lehner & Howk show that HVCs at extreme veloci-ties (>170 kms−1) lie beyond the Galactic Halo and are notdiscussed further here.
I/HVCs are important to study as they may providefuel for star formation in the Milky Way (see the review byWakker & van Woerden 1997; Fox et al. 2014), and pro-vide information on close encounters and/or winds fromthe SMC and LMC (Olano 2008; Lehner, Staveley-Smith& Howk 2009).
In the present paper we employ FLAMES Ca ii Karchive spectra of four open clusters in the Large and SmallMagellanic Clouds (LMC, SMC) to investigate the small-scale (∼11 arcseconds to ∼25 arcminutes) structure of theI/HVCs in the lines-of-sight to these galaxies. We also useFEROS and UVES observations of 156 LMC and SMC stel-lar targets in Ca ii K and Na i D to probe large- (degree-)scale variations in I/HVC column density. Observations ofinterstellar Ca and Na towards the Magellanic Clouds wasfirst performed by Blades (1980), with subsequent observa-tions in different wavelength bands and theoretical work bySavage & de Boer (1981), Songaila (1981), Songaila, Cowie& York (1981), Songaila et al. (1986), Andreani & Vidal-Madjar (1988), Blades et al. (1988a,b), Wayte (1990), Mo-laro et al. (1993), Welty et al. (1997, 1999), Richter et al.(1999), Bluhm et al. (2001), Staveley-Smith et al. (2003),Andre et al. (2004), Olano (2008), Lehner et al. (2009) andWelty, Xue and Wong (2012). These and other referencesindicate that some I/HVCs contain molecular gas and dust,often show multi-component velocity structure, and haveabundance patterns sometimes consistent with those of theMagellanic Clouds and sometimes with the Milky Way. Thevelocity fields of Magellanic HVCs have been interpreted asbeing caused by spiral structure in the LMC (Blades 1980),winds from the LMC (Olano et al. 2004), or interaction ofLMC/SMC and Milky Way gas (Olano et al. 2008). Back-ground sources in the Magellanic Clouds have also been usedto study the absorption-line structure within the Milky Way(e.g. Andre et al. 2004, Nasoudi-Shoar et al. 2010, van Loonet al. 2013; Smoker, Keenan & Fox 2015).
Our paper is laid out as follows. Section 2 describesthe sample of stars towards the Magellanic Clouds and adescription of the data reduction for the optical spectra. InSect. 3 we provide the main results, including the FLAMES,FEROS and UVES spectra towards the Magellanic system.Section 4 presents the discussion which covers the velocitydependence on RA of LMC I/HVCs, abundance ratios usingoptical and previous UV data, and large- and small-scalestructure variations in Ca ii K of the I/HVCs towards theLMC and SMC. Finally, Sect. 5 gives a summary of the mainfindings.
Figure 1. Location of LMC and SMC stars observed withFLAMES-GIRAFFE.
2 THE SAMPLE, OBSERVATIONS AND DATAREDUCTION
2.1 Archival FLAMES and FEROS data towardsthe LMC and SMC
FLAMES1 observations towards four open clusters in theLMC and SMC were retrieved from the ESO archive andare used to study the I/HVCs towards these galaxies andtheir variation on small scales. Table 1 presents the basiccluster data, and Fig. 1 shows the locations of the stellarsightlines.
The FLAMES spectra use the HR2 setting, providing aspectral resolution of ∼16 km s−1 and wavelength coveragefrom ∼3850A to 4045A, covering the Ca ii K line. Full de-tails of the sample, data reduction and analysis are given inSmoker et al. (2015) where the structure of the low-velocity(Galactic) gas and its variation on small scales is investi-gated and all the spectra are presented. The S/N ratios ofthe spectra are ∼30 or 60 per pixel for the two SMC clus-ters, and 95 or 135 for the two LMC clusters. Minimum andmaximum star-star separations are 11 arcsec to 27 arcmin,14 arcsec to 20.7 arcmin, 14 arcsec to 22.2 arcmin, and 11arcsec to 20 arcmin, respectively, for NGC 330, NGC 346,NGC1761 and NGC2004. These correspond to transverseseparations of ∼3–500 pc at the distance of the Magellanicclouds.
1 FLAMES (Pasquini et al. 2002) is a multi-object, intermedi-ate and high resolution spectrograph, mounted on the VLT/UnitTelescope 2 (Kueyen) at Cerro Paranal, Chile, operated by ESO.
c© RAS, MNRAS 000, 000–000

Structure of Magellanic I/HVCs 3
Table 1. Basic data for the open clusters observed with FLAMES sorted in increasing NGC number. The distances to the LMC and SMCwere taken from Keller & Wood (2006). The “Scales probed” column corresponds to the minimum and maximum transverse star-starseparation at the distance of the cluster.
Cluster Alternative Location (l, b) Dist Exp time Median S/N Stars Scales Mag. scales
name (deg.) (kpc) (s) at Ca ii K used probed (′
) probed (pc)
NGC330 Kron 35 SMC 302.42, –44.66 61 13650 30 110 0.2 – 27.4 3.6 – 486NGC346 Kron 39 SMC 302.14, –44.94 61 6825 60 109 0.3 – 20.7 5.3 – 367NGC1761 LH09 LMC 277.23, –36.07 51 13650 135 109 0.2 – 22.3 3.0 – 331NGC2004 KMHK 991 LMC 277.45, –32.63 51 13650 95 75 0.2 – 20.0 3.0 – 297
Figure 2. Location of (a) LMC and (b) SMC stars observed withFEROS and UVES.
Additionally, FEROS2 and UVES observations towards71 early-type stars in the LMC and 85 from the SMC weredownloaded from the ESO archive. These observations havea spectral resolution of 6.3 kms−1 with a median S/N ratioof 35 per pixel in Ca ii and 75 in Na i D. The stars observedare listed in Smoker et al. (2015), with Fig. 2 showing thelocation of the stars in (l, b) coordinates. The species con-sidered in this paper are shown in Table 2.
The data were reduced using the FEROS pipeline (inMIDAS) or the reduced spectra downloaded from the ESOarchive in the case of UVES. For FEROS the reduction was
2 FEROS (Kaufer et al. 1999) is a high-resolution echelle spec-trograph, mounted on the 2.2m Telescope at La Silla, Chile, op-erated by ESO.
Table 2. Main transitions studied in this paper. Wavelengthsand oscillator strengths are from Morton (2003, 2004). Column4 gives the ionisation potential (IP) in eV. For comparison theionisation potential of H i is 13.60 eV.
Trans. λair f -value IP(A) (eV)
Ca ii K 3933.661 0.627 11.87Na i D1 5889.951 0.641 5.14Na i D2 5895.924 0.320 5.14
undertaken using both standard and optimum extraction,with and without cosmic ray removal, respectively. Agree-ment was found to be good between the two methods. Tocheck the quality of the results, the equivalent widths andvelocities of a handful of lines were compared with previousUVES3 observations of a few B-type stars taken from the on-line version of the Paranal Observatory Project (POP) sur-vey (Bagnulo et al. 2003). Agreement was found to be within1 km s−1 for velocities and within 5 per cent for equivalentwidths for strong lines.
The individual FEROS or UVES spectra were co-addedusing scombine within iraf
4, converted into ascii formatand then read into the spectral analysis software dipso forfurther analysis. Initially this included shifting to the Kine-matical Local Standard of Rest (LSR) using corrections gen-erated by the program rv (Wallace & Clayton 1996), thennormalising the spectra by fitting polynomials to the stellarcontinuum in the region of interest. The RMS of the normal-isation procedure gives the S/N ratio in the final spectra. Forthe region around Na i D, telluric spectra were removed asdescribed in Hunter et al. (2006).
Equivalent widths, velocity centroids and full width halfmaximum (FWHM) velocity values of the optical transitionswere obtained by fitting Gaussians to the normalised spectrausing the elf package within dipso (Howarth et al. 2003).These results were used as initial inputs to the vapid code(Howarth et al. 2002) which provide the final values of thecolumn densities and b-values by curve-of-growth analysis.Errors were derived as described in Hunter et al. (2006).
3 UVES (Dekker et al. 2000) is a high resolution echelle spectro-graph, mounted on the VLT/Unit Telescope 2 (Kueyen) at CerroParanal, Chile, operated by ESO.4 iraf is distributed by the National Optical Astronomy Obser-vatories, U.S.A.
c© RAS, MNRAS 000, 000–000

4 J. Smoker et al.
2.1.1 21 cm data from the GASS and LAB surveys
For the H i 21 cm spectra, we adopt measurements from theParkes Galactic All-Sky Survey (GASS) and LABS survey(Kalberla et al. 2005; McClure-Griffiths et al. 2009). Bothsurveys have spectral resolutions of ∼1 kms−1, with spatialresolutions of ∼0.5◦ and and 16 arcmin, respectively. Thevast majority of these spectra show no I/HVC detection,hence an H i map is not shown. We note that H i in I/HVCsis clumpy, with structures visible in H i emission down to theobservational limit of ∼1 arcmin in objects such as ComplexC (Smoker et al. 2001), compact HVCs (de Heij, Braun &Burton 2002), and miscellaneous IVCs (Ben Bekhti et al.2009), and additionally in absorption down to scales of arc-seconds or less for low-velocity gas (Diamond et al. 1989).Similarly, comparison of LMC hydrogen column densities de-rived from 21-cm H i observations compared with Lyα showvariations of a factor of 2–3 in some sightlines, indicatingsmall-scale H i structure (Welty et al. 2012). Hence thereare large systematic uncertainties in the derived H i to opti-cal line ratios derived in the current work (see Wakker 2001for a discussion).
3 RESULTS
3.1 FLAMES-GIRAFFE Magellanic Cloudspectra in Ca ii
Figures A1 to A5 (available online) show, for each cluster,the spectra of the 16 star-to-star pairs with the maximumdifference in equivalent width of the intermediate- or high-velocity component, to show the variation in Ca ii K I/HVCabsorption-line strength. Figure 3 shows the correspondingplots for two or three objects with the strongest and weak-est I/HVC component per cluster observed in Ca ii K withFLAMES. All of the spectra are shown in Smoker et al.(2015), in which the low-velocity component only is dis-cussed and where tables of the equivalent width measure-ments at all velocities are given.
3.2 FEROS and UVES Magellanic Cloud spectrain Ca ii/Na i
Smoker et al. (2015) present FEROS and UVES Ca ii K andNa i D1 spectra and Voigt profile fits of stars towards theMagellanic Clouds used in our analysis as well as the nearestGASS and LAB Survey H i 21 cm spectra.
4 DISCUSSION
4.1 Large-scale structure of I/HVCs toward theLMC
In this section we use the FEROS and UVES results to dis-cuss the velocity field towards the LMC IVCs, componentstructure observed in Ca ii, variation with Ca ii column den-sity with position, and finally elemental abundances usingthe current optical observations and previous UV data takenfrom Lehner et al. (2009).
4.1.1 Velocity dependence on RA for LMC I/HVCs
Due to its higher radial velocity, discriminating betweenHVC and Magellanic velocity components is easier for theLMC than for the SMC. Spectra for a total of 73 LMCstars exist in either Ca ii or Na i D, and HV componentsare present in many of them. In the LMC spectra there areI/HVC components present in Ca ii K at a range of veloc-ities from ∼+40 km s−1 up to the LMC velocity of ∼+280kms−1. Lehner et al. (2009) find that the velocity of the HVcomponents in the LMC standard of rest (LMCSR) corre-lates with Right Ascension, which they ascribe to the cloudsbeing formed by an energetic outflow from the LMC. On theother hand, Richter et al. (2014) also find UV absorption-line profiles at high velocities some degrees away from theLMC, which is inconsitent with the outflow scenario andimplies a separate origin.
The idea that some HVCs are in some way connected tothe Magellanic system is not new (Giovanelli 1981; Mirabel1981; Olano 2004 amongst others), although what fractionof them and the exact formation mechanism is still unclear(Nidever et al. 2008). Following Lehner et al., Fig. 4 showsthe velocity, plotted against their RA, of all detected com-ponents in Ca ii K from –50 to –200 km s−1 in the LMCSR,which is defined as:
vLMCSR = vGSR+(86×coslcosb)+(268×sinlcosb)−(252×sinb), (1)
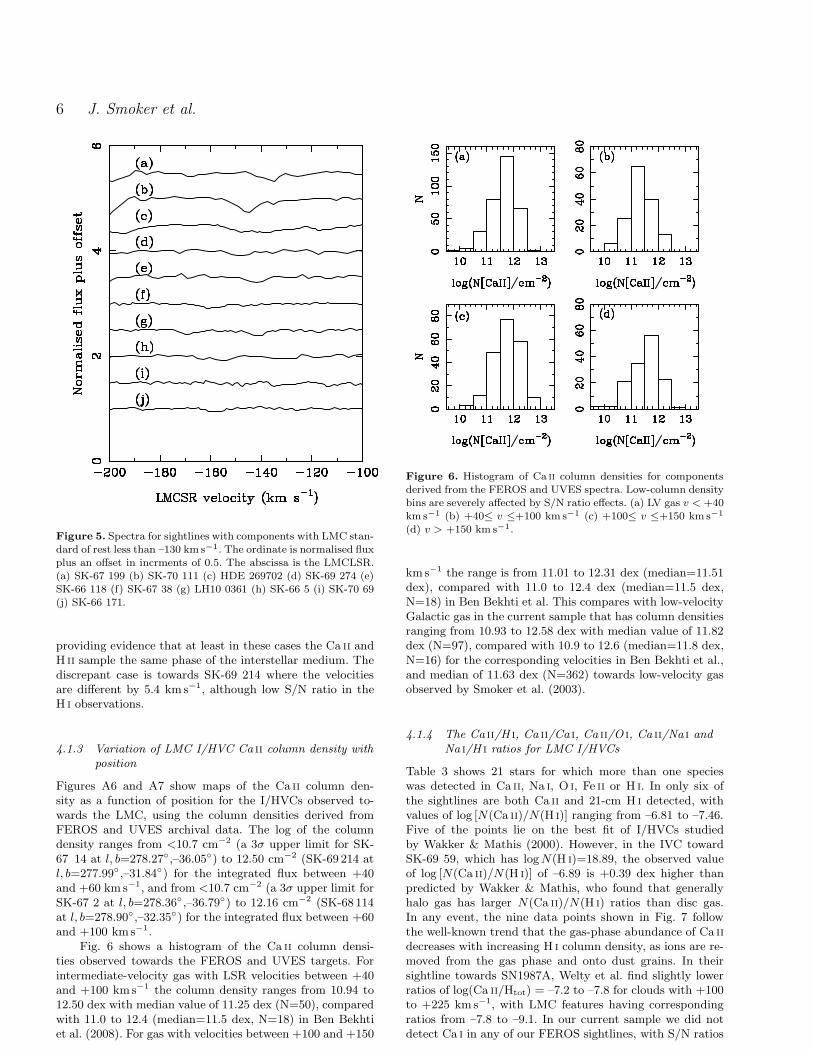
where vGSR = vLSR + v⊙sinlcosb is the velocity in theGalactic standard of rest frame, and v⊙ is the solar circu-lar rotation velocity around the Galactic centre. The solidline is the best-fit relationship of Lehner et al. (2009), andthe current observations generally are offset by about +20kms−1 from this. The scatter in the two datasets is similar.At RA=∼05h30m the range in v(LMCSR) is from ∼–100to –170 kms−1, rising to ∼–40 to –130 km s−1 at RA∼5h.A few stars (SK-66 5 and SK-70 78 marked in Fig. 4) atRA∼5h show absorption features in their spectra that wouldbe expected at higher values of RA. Figure 5 shows spectrathat have LMC LSR velocities of less than –130 kms−1. Thefeatures here are often close to the noise level.
4.1.2 Velocity component structure in Ca ii for LMCI/HVCs from FEROS observations
I/HVC component structure is observed in some sightlines.For the IVCs these include SK-67 206, SK-67 173, SK-68111, LHA 120-S 116 and SK-70 120, while for the HVCs in-clude SK-67 199 (although at low S/N), SK-68 111, SK-69 43and AzV 490 (although there is possible stellar contamina-tion). In only one case are there corresponding UV data fromLehner et al. (2009), specifically towards SK-68 111 wherethese authors only find a single component with velocitiesof +109.6±3.8 kms−1 (O i), +102.4±1.4 km s−1 (Fe ii) and+114.5±3.8 kms−1 (H i), compared with our Ca ii K ve-locities for HVC components of +96.1±1.1 and +114.6±1.2kms−1. The velocity resolution for the UV data is either 7kms−1 (STIS) or ∼20 km s−1 (FUSE) and with typical S/Nratios of ∼5–40 in the FUSE spectra, with the velocity res-olution in the Parkes data being 1.6 kms−1 although with amuch larger beam than the optical observations. In any case,we note that no component structure is listed in Table 1 ofLehner et al. (2009) in either the UV or H i data. However,
c© RAS, MNRAS 000, 000–000

Structure of Magellanic I/HVCs 5
Figure 3. Ca ii K spectra towards the four Magellanic clusters studied, showing two or three sightlines with the minimum (top panels)and maximum (bottom panels) equivalent width in the I/HVC components. The maximum star-to-star separation on the sky is 27arcminutes (the size of the FLAMES plate). It is apparent that the variation in the strength of the low-velocity Ca ii component issmaller than the variation in the I/HVC and Magellanic components.
Figure 4. Velocity of high velocity components in the LMC stan-dard of rest plotted against their RA. The solid line is the best-fitrelationship of Lehner et al. (2009). Only components with LSRvelocities in the range +90–175 km s−1 are shown.
an inspection of Fig. 1 of Lehner et al. (2009) indicates thatat least for some sightlines such structure may be difficultto determine due to low S/N ratios.
Multi-component velocity profiles have been detectedin other I/HVCs observed in absorption, including the Mag-ellanic Bridge (Misawa et al. 2009), the Magellanic Stream(Fox et al. 2005, 2010), the M15 IVC (Meyer & Lauroesch1999; Welsh, Wheatley & Lallement 2009) and SN 1987Ain the LMC (Adreani & Vidal-Madjar 1988; Blades et al1988a,b; Welty et al. 1999). This component structure in-dicates that several physical regions of absorbing gas ex-ist along the line-of-sight, and suggests but does not provethe fragmentation of initially-larger clouds. Fragmentationis also observed in deep 21 cm images of the tip of the Mag-ellanic Stream (Stanimirovic et al. 2008), and is predictedby hydrodynamic simulations of HVCs streaming througha hot corona (e.g. Bland-Hawthorn 2009). Such fragmenta-tion may be the precursor to eventual evaporation of theI/HVCs before they reach the disk of the Milky Way (e.g.Heitsch & Putman 2009; Fox et al. 2010). A mix of fragmen-tation, cooling and mixing with other gas may change theionisation structure of I/HVCs and their metalicities (Grit-ton et al. 2014), with non-equilibrium chemistry in diffuseinterstellar gas increasing cooling (Richings, Schaye & Op-penheimer 2010) and perhaps explain the detection of Na iin some I/HVCs. If I/HVCs do evaporate before reaching thedisk, then they must re-condense if they are to form the fuelneeded to sustain star formation in the disk and to repro-duce stellar abundance patterns (Kennicutt 1998, Chiappini2008).
Finally, in eight of nine sightlines where we have mea-sured the velocity of the main HVC component in Ca ii andH i, the values for both elements agree within the errors,
c© RAS, MNRAS 000, 000–000
6 J. Smoker et al.
Figure 5. Spectra for sightlines with components with LMC stan-dard of rest less than –130 km s−1. The ordinate is normalised fluxplus an offset in incrments of 0.5. The abscissa is the LMCLSR.(a) SK-67 199 (b) SK-70 111 (c) HDE 269702 (d) SK-69 274 (e)SK-66 118 (f) SK-67 38 (g) LH10 0361 (h) SK-66 5 (i) SK-70 69(j) SK-66 171.
providing evidence that at least in these cases the Ca ii andH ii sample the same phase of the interstellar medium. Thediscrepant case is towards SK-69 214 where the velocitiesare different by 5.4 kms−1, although low S/N ratio in theH i observations.
4.1.3 Variation of LMC I/HVC Ca ii column density withposition
Figures A6 and A7 show maps of the Ca ii column den-sity as a function of position for the I/HVCs observed to-wards the LMC, using the column densities derived fromFEROS and UVES archival data. The log of the columndensity ranges from <10.7 cm−2 (a 3σ upper limit for SK-67 14 at l, b=278.27◦,–36.05◦) to 12.50 cm−2 (SK-69 214 atl, b=277.99◦,–31.84◦) for the integrated flux between +40and +60 km s−1, and from <10.7 cm−2 (a 3σ upper limit forSK-67 2 at l, b=278.36◦,–36.79◦) to 12.16 cm−2 (SK-68 114at l, b=278.90◦,–32.35◦) for the integrated flux between +60and +100 kms−1.
Fig. 6 shows a histogram of the Ca ii column densi-ties observed towards the FEROS and UVES targets. Forintermediate-velocity gas with LSR velocities between +40and +100 kms−1 the column density ranges from 10.94 to12.50 dex with median value of 11.25 dex (N=50), comparedwith 11.0 to 12.4 (median=11.5 dex, N=18) in Ben Bekhtiet al. (2008). For gas with velocities between +100 and +150
Figure 6. Histogram of Ca ii column densities for componentsderived from the FEROS and UVES spectra. Low-column densitybins are severely affected by S/N ratio effects. (a) LV gas v < +40km s−1 (b) +40≤ v ≤+100 km s−1 (c) +100≤ v ≤+150 km s−1
(d) v > +150 km s−1.
kms−1 the range is from 11.01 to 12.31 dex (median=11.51dex), compared with 11.0 to 12.4 dex (median=11.5 dex,N=18) in Ben Bekhti et al. This compares with low-velocityGalactic gas in the current sample that has column densitiesranging from 10.93 to 12.58 dex with median value of 11.82dex (N=97), compared with 10.9 to 12.6 (median=11.8 dex,N=16) for the corresponding velocities in Ben Bekhti et al.,and median of 11.63 dex (N=362) towards low-velocity gasobserved by Smoker et al. (2003).
4.1.4 The Ca ii/H i, Ca ii/Ca i, Ca ii/O i, Ca ii/Na i andNa i/H i ratios for LMC I/HVCs
Table 3 shows 21 stars for which more than one specieswas detected in Ca ii, Na i, O i, Fe ii or H i. In only six ofthe sightlines are both Ca ii and 21-cm H i detected, withvalues of log [N(Ca ii)/N(H i)] ranging from –6.81 to –7.46.Five of the points lie on the best fit of I/HVCs studiedby Wakker & Mathis (2000). However, in the IVC towardSK-69 59, which has logN(H i)=18.89, the observed valueof log [N(Ca ii)/N(H i)] of –6.89 is +0.39 dex higher thanpredicted by Wakker & Mathis, who found that generallyhalo gas has larger N(Ca ii)/N(H i) ratios than disc gas.In any event, the nine data points shown in Fig. 7 followthe well-known trend that the gas-phase abundance of Ca iidecreases with increasing H i column density, as ions are re-moved from the gas phase and onto dust grains. In theirsightline towards SN1987A, Welty et al. find slightly lowerratios of log(Ca ii/Htot) = –7.2 to –7.8 for clouds with +100to +225 km s−1, with LMC features having correspondingratios from –7.8 to –9.1. In our current sample we did notdetect Ca i in any of our FEROS sightlines, with S/N ratios
c© RAS, MNRAS 000, 000–000

Structure of Magellanic I/HVCs 7
Figure 7. Ca ii/H i ratio for FEROS and UVES sightlines witha detection in both species. The solid and dashed lines are the fitfrom Wakker & Mathis (2000) and the associated RMS.
of typically 50 to 90, with corresponding 5σ column densityupper limits of ∼10.5 to 10.2 dex. The ratio of Ca ii to Ca itherefore exceeds 1.5 dex towards the HVC SK-69 59 and2.1 towards IVC SK-69 214. Finally, we note that Lehneret al. (2009) find an average metallicity in their 139 LMCsightlines of [O i/H i]=–0.51, indicating a sub-solar metallic-ity for the HV gas and similar to that of the LMC whichhas Fe/H of ∼0.5 dex (e.g. Bertelli et al. 1992, Carrera et al2008).
The Ca ii/O i ratio can be used to estimate the amountof dust present in the LMC HVCs. By studying twohalo sightlines, Richter et al. (2009) found HVCs withN(Ca ii)/N(O i) similar to the solar Ca/O abundance ra-tios, indicating that those clouds do not contain significantamounts of dust. However, in the diffuse ISM, depletion ontodust grains causes the value of Ca/O to be frequently morethan 1.5 dex lower than the solar value. Comparing the cur-rent dataset to that of Lehner et al. (2009), we find valuesof N(Ca ii)/N(O i) of <–3.39 for SK-67 256, –3.38 or –3.64(depending on whether we count one or both Ca ii compo-nents) for SK-68 111, –3.66 for HD269599, –3.06 for SK-69 50, –3.37 for SK-66 100, –3.46 for SK-67 168, –3.88 forSK-67 38, –3.09 for SK-70 60, –3.76 for SK-70 69 and –2.57 or –2.90 (depending on whether we count one or bothCa ii components) for SK-70 78. Given the solar abundances(O/H)⊙=–3.31 (Asplund et al. 2004) and (Ca/H)⊙=–5.65(Morton 2003, 2004), the solar Ca/O ratio is –2.34, henceone of the current sightlines appears to be lightly depleted,with the other nine showing depletions of ∼1 dex. This sug-gests the presence of dust grains, although we have made noionisation corrections, and in the diffuse ISM Ca ii is a tracespecies with the majority of the calcium being in the formof Ca iii (Sembach et al. 2000). Nonetheless, the presence ofdust is also indicated in some of the sightlines studied byLehner et al. (2009) that have sub-solar Si ii/S ii ratios, inagreement with the current result.
In common with earlier work (Routly & Spitzer 1952,Siluk & Silk 1974, Vallerga et al. 1993), the ratio of Ca ii/Na iD is found to increase markedly as one moves to high veloc-ities, with the vast majority of sightlines only showing HVCabsorption in Ca ii K and not in Na i D, although with some
exceptions (e.g. Richter et al. 2009). In extragalactic sight-lines the effect is less clear, with Richter et al. (2011) find-ing a range from –0.66 to 1.36, again typical of the diffusewarm interstellar medium. They note that in these condi-tions where the electron densities are less than ∼ 0.05 cm−3,in dust-free gas the Ca ii/Na i ratio is roughly constant at+1.6 (c.f. Crawford 1992). In the current sightlines the ve-locities of the two species are similar, which may be takenas evidence that the two species originate within the samephysical region. The same appears to be the case for the veryfew sightlines in the current sample that show both speciesin absorption, as displayed in Fig. 8. In the current sample,the only detections of Na i D at LSR velocities exceeding+40 kms−1 (excluding the LMC and SMC) are: at ∼+68kms−1 with column density ratio log [N(Ca ii)/N(Na i)]= –0.44±0.05 dex) and ∼+110 km s−1 with column density ra-tio log [N(Ca ii)/N(Na i)]=+0.41±0.20 dex) towards LHA120-S 93; a borderline detection at ∼+68 km s−1 towardsSK-69 214 with logN(Na I)=10.38 cm−2 but with no Ca iidetected at the same velocity; at ∼+45 kms−1 towards SK-70 111 with logN(Ca ii)=12.11 cm−2 and logN(Na i)=10.98cm−2 (a ratio of 1.13±0.07 dex); and finally at ∼+135kms−1 towards AzV 483 in the LMC. For high velocitygas, the maximum observed lower limit to the Ca ii/Na i ra-tio is towards SK-67 112, where log [N(Ca ii)/N(Na i)]>1.45dex in the feature at 101.8 kms−1. For intermediate ve-locity gas, the maximum ratio is toward SK-69 237 wherelog [N(Ca ii)/N(Na i)]>1.58 dex.
For gas with absolute LSR velocities exceeding 40kms−1, Ben Bekhti et al. (2008) have five detections of bothCa ii and Na i D, which have Ca ii/Na i ratios of –0.2 (com-plex L), 0.4, 0.4 (Magellanic Stream), 0.5 and 1.4 dex (othergas). In extra-planar gas van Loon et al. (2009) find a ra-tio of +0.4 dex with a range from 0.23 to 0.56 dex, whichis typical of low-velocity components measured by Welsh etal. (2009) and Smoker et al. (2015). We note that for IVCswith a Ca ii/Na i ratio exceeding 5 the gas is characterisedas having a temperature of ∼10,000 K and at least partiallyionised (e.g Hobbs 1975, Welsh et al. 2009). Lower values ofthis ratio are found in denser and cooler clouds.
We only have upper limits to the Na i/H i ratios in thecurrent sample. These are <
∼ 8.3 dex at an H i column densityof 19.0 dex, compared with the best-fit line from Wakker &Mathis that predicts an abundance ratio of ∼8.1 dex at thisH i column density. This may be related to beam-smearingfor the H i observations that we use. Higher S/N observationswould likely detect Na i in these sightlines.
We have decided not to include Cloudy because the Ca iiand Na i may not be physically associated with the H i (afact that Cloudy assumes is the case), and hence the derivedionisation correction using a Cloudy model will likely beincorrect. See Fox et al. (2013) for a discussion.
4.1.5 FEROS and UVES SMC sightlines
Eighty seven sightlines are present in the current sampletowards the SMC. As the SMC has a recessional LSR veloc-ity of ∼+160 kms−1, the separation of the HVC and SMCcomponents is not as marked as in the LMC. The Ca ii col-umn density ranges from <10.7 cm−2 to 11.6 cm−2 for theintegrated flux between +60 and +100 kms−1.
c© RAS, MNRAS 000, 000–000

8 J. Smoker et al.
Figure 8. (a)-(d) Ca ii K, Na i D and H i LAB and GASS spectra of sightlines with possible Na i I/HVC detections. (e) Correspondingspectra with high Ca ii/Na i ratio. Filled lines in the top panel are Ca ii with dashed lines being NaD1.
4.2 Small-scale spatial structure of I/HVCstowards the LMC and SMC fromFLAMES-GIRAFFE observations
Non-Magellanic Ca ii K absorption is detected atintermediate- or high-velocities in many sightlines. Theminimum star-star distance is 11 arcsec and the maximumis 27 arcminutes. Figure 9 shows the composite Ca ii Kspectra towards the four clusters, formed by median-combining the individual normalised spectra. The spectrahave been boxcar smoothed using a box of three pixels,which retains the full spectral resolution as the FWHMof emission features measured from the arc frames is fourpixels. For NGC330 the composite spectrum S/N ratio inthe boxcar smoothed spectrum is ∼500, being ∼1100 forNGC346, ∼1200 for NGC1761 and ∼1200 for NGC2004.Also shown in Fig. 9 are the GASS and LABS survey21 cm H i spectrum towards both clusters. These data arepresented simply to confirm the weakness in H i of theI/HVC emission – in the GASS and LAB spectra no suchemission is seen.
An immediate question to ask is whether the observedabsorption at I/HVC velocities could be stellar in nature.Figure 10 shows an example of a star in NGC2004 wherestrong I/HVC Ca ii absorption is detected at observed (raw)velocities of +63 and +116 kms−1. The FWHM of theselines is ∼17 kms−1 (most or all of which is caused by instru-mental broadening of ∼16 kms−1), compared to the widthof the N ii stellar line at 3995A of ∼60 km s−1. The nar-rowness of these I/HVC components implies they are cir-cumstellar or interstellar rather than stellar. Furthermore,the fact that I/HVC features are observed at similar LSRvelocities in both the CaK and H i lines where the latteris detected (Figs. 11 and 12) toward many different stars isvery difficult to explain if these lines are circumstellar, since
in that case the velocities would vary with the velocity ofthe star.
We now briefly discuss the Ca ii K absorption line com-ponents toward the four individual Magellanic Cloud clus-ters observed with FLAMES-GIRAFFE.
4.2.1 NGC330 (SMC)
The sightlines toward NGC330 (Figs. 3a and A8) in theSMC show Ca ii absorption at intermediate velocities be-tween ∼+60–80 kms−1, well separated from both the lowvelocity and SMC gas. Peak Ca ii equivalent widths at IVCvelocities are ∼80mA, with many sightlines having valuesof ∼60mA. A number of sightlines show no correspondingCa ii absorption with a S/N ratio of ∼60, which followingEqn. 2 gives a 3σ upper limit on the equivalent width of∼10mA, given that the instrumental resolution (∆λinstr) is0.21A for the GIRAFFE HR2 setting and assuming an un-resolved component, viz:
EWlim(X) = 3× (S/N)−1cont∆λinstr, (2)
Hence the variation in the Ca ii equivalent width forIVC components exceeds a factor of ∼8 (∼0.9 dex) overthe face of the cluster. The velocity map in Fig. A8shows no obvious large-scale structure or gradients, althoughclumps of gas at higher central velocities are for exam-ple present at (l, b)∼(302.5◦,–44.6◦) with central velocitiessome ∼20 kms−1 higher than towards the cluster core at(l, b)∼(302.4◦,–44.7◦) which is a transverse distance of ∼150pc at the distance of the SMC.
4.2.2 NGC346 (SMC)
Although I/HVC absorption is visible in many of theFLAMES NGC346 sightlines (Fig. 3b), the gas merges into
c© RAS, MNRAS 000, 000–000

Structure of Magellanic I/HVCs 9
Table 3. Measurements of I/HVC absorption in sightlines in common with Lehner et al. (2009) from which the O i, Fe ii and H i dataare taken. Components in Ca ii K and Na i D are shown when their velocity is greater than +40 km s−1. Components from Lehner et al.(2009) are shown when the velocity is from +90 to +175 km s−1. Sightlines are ordered by increasing RA.
Star v(O i) logN(O i) v(Fe ii) logN(Fe ii) v(H i) logN(H i) v(Ca ii) logN(Ca ii) logN(Na i)(km s−1) (cm−2) (km s−1) (cm−2) (km s−1) (cm−2) (km s−1) (cm−2) (cm−2 )
SK-69 43 – – – – 143.6±1.3 19.02±0.06 142.7±0.3 11.67±0.11 <10.66SK-67 28 – <14.28 – <13.19 – <18.47 – <11.32 <10.26SK-68 26 – – – <13.62 – <18.47 – <11.32 <10.36SK-69 59 175.9±0.6 15.06±0.02 173.4±1.3 13.79±0.03 172.4±2.5 18.89±0.11 170.4±0.4 12.00±0.02 <10.56SK-68 41 – <13.92 – – – <18.47 – <11.56 <10.48SK-66 106 – <14.63 – – – <18.47 – <11.38 <10.36SK-67 150 – <14.39 – – – <18.47 – <11.16 <10.38SK-67 169 – <14.11 – – – <18.47 83.5±1.0 11.01 (stellar)” – – – – 117.4±1.8 18.93±0.08 – <10.89 <10.24SK-70 78 97.2±4.4 14.27±0.15 – – – <18.44 78.5±4.9 11.43 <10.38
” – – – – – ” 91.4±0.5 11.37 <10.38HD269599 119.7±3.4 15.20±0.08 110.6±1.6 13.99±0.05 119.3±5.2 19.07±0.09 117.4±0.7 11.54±0.03 <10.56SK-71 42 – – – – 66.8±2.3 18.72±0.14 66.0±0.2 12.05±0.04 <10.45LHA-120 116 – – – – 114.9±1.2 19.11±0.07 115.9±1.1 11.66±0.18 <10.49SK-68 111 109.6±3.8 15.15±0.11 102.4±1.4 14.35±0.05 – – 96.1±1.1 11.41±0.03 <10.48” – – – – 114.54±3.8 19.01±0.06 114.6±1.2 11.51±0.03 <10.48SK-69 214 – – – – 43.9±2.0 18.90±0.09 49.3±0.2 12.50±0.06 11.60±0.02SK-69 274 – – – – 100.1±3.2 18.56±0.20 102.3±0.8 11.12±0.08 <10.36SK-70 111 – – – – 103.1±1.9 18.72±0.11 104.6±0.4 11.62±0.06 <10.36
– – – – – – 116.5±1.9 11.10±0.29 <10.36SK-67 256 144.7±1.7 14.95±0.03 138.6±1.4 13.67±0.04 141.0±6.0 18.64±0.13 – <11.56 (stellar)SK-68 171 – <14.46 – – – <18.47 79.3±0.4 11.66 <10.56SK-70 120 – – – <13.36 – <18.47 – <11.32 <10.56SK-68 63 – – – – – – 100.4±0.1 11.17±0.17 <10.19” – – – – – – 136.1±0.7 10.38±0.18 <10.19” – – – – – – 152.1±0.2 11.10±0.17 <10.19SK-65 47 – – – <12.80 – <18.47 47.9±0.6 11.39±0.17 <10.36SK-65 47 144.1±4.9 14.04±0.10 – <12.80 – <18.47 145.7±0.4 10.94±0.17 <10.36BI 128 – <14.49 130.8±2.5 14.04±0.05 – <18.61 132.1±0.8 11.06±0.30 <10.66” – <14.49 – – – 178.7±1.7 11.06±0.30 <10.66SK-66 18 – – – <13.29 – <18.47 165.6±0.0 11.51±0.17 <10.34SK-66 100 107.3±3.1 14.59±0.06 109.6±1.4 13.74±0.04 – <18.48 109.2±1.7 11.22±0.18 <10.34
– – – – – 120.4±0.4 10.87±0.18 <10.34SK-67 168 110.5±2.6 15.00±0.06 114.5±1.3 14.13±0.03 – <18.55 108.9±0.5 11.54±0.17 10.87±0.18” – – – – – – 119.3±0.6 10.74±0.17 <10.49
– – – – – – 132.3±0.3 11.36±0.18 <10.49BI 237 – – 109.6±3.0 14.01±0.05 – <18.62 103.6±0.8 11.29±0.17 <10.58
– – – – – – 131.1±0.6 11.21±0.17 <10.58SK-67 38 125.2±2.9 14.23±0.10 128.1±2.0 13.47±0.08 – <18.44 126.4±1.0 10.35±0.30 <10.58SK-67 05 – – 112.3±3.6 13.79±0.06 – <18.63 119.2±0.9 10.25±0.17 –” – – – – – – 132.5±1.0 10.89±0.17 –BI 253 – – – <13.36 – <18.47 107.1±1.0 11.05±1.07 <10.49SK-68 52 – <14.26 – <13.12 – <18.47 – – –SK-69 50 147.9±0.9 15.42±0.02 145.3±1.2 14.39±0.03 146.9±3.8 19.23±0.10 142.1±0.9 11.62±0.18 <10.55
– – – – – – 148.1±0.0 11.38±0.17 <10.55SK-70 60 123.3±1.1 14.64±0.07 128.7±1.7 13.79±0.06 – <18.45 122.7±0.3 11.55±0.17 –SK-70 69 120.5±2.9 14.71±0.07 108.7±1.7 13.63±0.07 – <18.48 111.9±0.6 10.95±0.18 <10.49
the SMC material. Hence we do not comment on the vari-ation in these components. The highest velocity gas (pre-sumably tracing the SMC itself) shows a huge variation inabsorption-line strength and number of components. This islikely explained by the cluster having a finite depth withinthe SMC.
4.2.3 NGC1761 (LMC)
NGC1761 (LH09) is an LMC cluster that displays two ap-parently discrete Ca ii absorption-line components in its in-terstellar spectra, well-separated in velocity, which are notat Milky Way or LMC velocities (Figs. 3c, A9 and A10).One is an IVC at ∼+90 km s−1 with a maximum equiva-lent width of ∼100mA, and the other is an HVC at ∼+160kms−1 with a maximum equivalent width of ∼40mA. Onesightline shows no Ca ii absorption at either of these two ve-
c© RAS, MNRAS 000, 000–000

10 J. Smoker et al.
Figure 9. Ca ii K composite GIRAFFE spectra and H i GASS and LABS survey spectra for four clusters. See Sect. 4.2 for details.
Figure 10. FLAMES-GIRAFFE spectra of star 57930 inNGC2004 (LMC). (a) Stellar absorption line of N ii (3995A)with FWHM∼60 km s−1 (b) Absorption lines around Ca ii K(3933A). The profiles uncorrected for instrumental broadeningof ∼16 km s−1 have FWHM∼17–19 km s−1, implying that thelines are narrow (possibly unresolved) and hence interstellar orcircumstellar rather than stellar.
Figure 11. Two-component FLAMES-GIRAFFE Ca iiabsorption-line structure in the I/HVCs towards NGC1761in the LMC. The full line is for CaK and the dotted line forCaH.
locities, in data with a S/N ratio of ∼90, corresponding toa 3σ equivalent width upper limit of 7mA. Thus the Ca iiequivalent widths vary across the cluster by factors of >14(IVC gas) and >6 (HVC gas). NGC1761 is hence the clus-ter in which the biggest variation in Ca ii absorption-linestrength is seen in the current sample. As in the FEROSand UVES data, there are hints of two-component velocitystructure towards a handful of sightlines, examples beingshown in Fig. 11. The velocities of the gas in Fig. ?? for theIVC between +30 and +105 kms−1 show a transverse gra-dient of ∼20 km s−1 moving from east to west in Galacticlongitude. Between +125 and +200 km s−1, two clumps ofgas are present (c.f. Fig. 11, with the lower velocity clumpto the East centred on l, b∼277.1◦,–36.05◦) having veloci-ties from ∼+140–150 km s−1 and the structure to the westshowing a larger variation in velocity.
c© RAS, MNRAS 000, 000–000

Structure of Magellanic I/HVCs 11
4.2.4 NGC2004 (LMC)
NGC2004 in the LMC shows the most complexity inintermediate- and high-velocity gas among the four clustersstudied, with at least three I/HVC components visible inCa ii, at ∼+60, ∼+120 and ∼+150 kms−1, the latter twocomponents sometimes being merged at the FLAMES res-olution (Figs. 3d, 3e, A11 and A12). The peak equivalentwidths in the first two components are 36 and 63mA, whichare ∼5 and ∼9 times stronger than the 3σ upper limits inthe cases where no I/HVC gas is detected in Ca ii absorp-tion. As in the FEROS and UVES data, there are hints oftwo-component velocity structure towards a few sightlines,an examples being shown in Fig. 12.
4.2.5 Summary of observed I/HVC EW variations
EW variations in Ca ii for Magellanic Cloud I/HVCs ex-ceed a factor of 10 (or ∼1 dex in column density) on trans-verse scales as small as ∼5 pc, assuming that the clouds lieat a distance of ∼55 kpc. If the clouds are in the halo ofthe Milky Way then the transverse scales would be reducedaccordingly. These variations are large but not comparedto previous work on the M15 IVC by Meyer & Lauroesch(1999) and Welsh et al. (2009), who found column densityvariations of a factor exceeding 10 in IVC gas on scales of<0.1 pc. In the Galactic ISM, variations of up to 2 dex arealso present on AU to pc scales in Na i (Welty & Fitzpatrick2001; Points, Lauroesch & Meyer 2004; Lauroesch 2007 andreferences therein; van Loon et al. 2009; Welsh et al. 2009amongst others). Similarly, Appendix 15 of Wakker (2001)assumes a factor 2 in variation caused by H i small-scalestructure, factors of 1.5 (Ca ii) and 2.5 (Na i) to account forvariations in depletion and further factors of 2 (Ca ii) and6 (Na i) for ionisation variations. Typically, then, pc-scalevariations in Ca ii and Na i are of the order 0.8 dex and1.5 dex, respectively, which is in line with the current work.The fact that in Milky Way extra planar gas, these varia-tions exist in material far away from supernova remnants,has been taken to imply that this small-scale structure iseither continuously regenerated or persists for long periodsof time (e.g. van Loon et al. 2009, although see Marasco &Fraternali 2011).
We have analysed the variations in Ca ii equiv-alent width towards three clusters observed withFLAMES/GIRAFFE in a total of five velocity ranges.Figure A13 shows the percentage difference in equivalentwidth plotted against the distance between the stellarsighlines, with the derived upper limits shown in opencircles with the measurements being filled circles. Table 4shows the derived mean, median and standard deviationof the variaion in the equivalent width values at a rangeof velocities. Towards NGC2004 the variation in the highvelocity component is typically a 50 to 100 percent largerthan to the intermediate velocity component. This isnaturally explained by the HVC being further away thanthe IVC and hence only the larger scales being sampled inthe HVC. However, the same behaviour is not seen towardsthe I/HVC components towards NGC1761. Likewise, thereis no clear increase in scatter in the equivalent width forany of the clusters as the scales sampled increase from 0.05to 0.4 degrees.
Figure 12. Two-component FLAMES-GIRAFFE Ca iiabsorption-line structure in the I/HVCs towards NGC2004in the LMC. The full line is for CaK and the dotted line forCaH.
FLAMES-GIRAFFE observations of the Tarantula neb-ula have been presented in Na i by van Loon et al. 2013, whofind that the standard deviation in equivalent width in theLMC gas is of the order of 25 percent, being 7 per cent forthe Milky Way gas. The relative variation in Na i absorp-tion as a function of angular sky separation increases from∼0.50 at 10 arcsecond separation to 0.65 at 100 arcseconds,although with correlation coefficient of only 0.27.
Similarly, Van Loon et al. (2009) and Smoker et al(2015) found variations in the Ca ii equivalent width in lowvelocity gas of ∼10 per cent on scales of ∼0.1, a factor of ∼10smaller than seen in the current I/HVC sightlines. Thesefluctuations were explained by a simple model of the ISMcomprised of spherical clouds of radii between 1 AU and 10-pc with filling factor of ∼0.2 (van Loon et al. 2009 AppendixB). Due to the limited spatial resolution of our study (scalesprobed from around 5-pc to 500-pc assuming the clouds areat the distance of the Magellanic Clouds) we cannot usethese observations to say much about the size of the cloudsalthough from the lack of detection of I/HVC in adjacentFLAMES-GIRAFFE fibres it is clear that the filling factoris somewhat less than unity.
4.3 Search for molecular gas towards and in theLMC in FLAMES spectra
Claims of molecular hydrogen detections in I/HVCs towardsthe LMC have been put forward by Richter et al. (1999) andBluhm et al. (2001) using ORFEUS (Orbiting RetrievableFar and Extreme Ultraviolet Spectrometer) data. Addition-ally, Richter et al. (2003) obtained FUSE observations to-wards the LMC star Sk -68 80 and found IVC absorption at∼+50 kms−1 for 30 transitions and hints of molecular Hy-drogen at HVC velocities of ∼+120 kms−1, although being”too weak to claim a firm detection”. Additionally, towardsthe LMC star Sk -68 82, Richter et al. (2003) co-added 15H2 transitions and found molecular gas at IVC and HVC ve-locities, although noting that the stellar continuum is veryirregular which complicates the interpretation of the linesobserved. Re-ananalysis of this star by Lehner et al. (2009)
c© RAS, MNRAS 000, 000–000

12 J. Smoker et al.
Table 4. Percentage variation in observed Ca ii equivalent width for I/HVCs in the FLAMES sample as a function of star-to-starseparation for three Magellanic clusters.
Cluster velocity range Separation EWMed EWAve EWsigma
(km s−1) (arcmin) variation variation variation(percent) (percent) (percent)
NGC330 45 to 85 0.05 to 0.10 64.2 98.0 104.4NGC1761 60 to 120 ” 63.2 101.4 118.5NGC1761 130 to 190 ” 69.6 127.6 156.5NGC2004 40 to 100 ” 51.6 78.0 83.0NGC2004 100 to 180 ” 108.4 174.8 193.9NGC330 45 to 85 0.10 to 0.15 63.4 103.9 121.4NGC1761 60 to 120 ” 73.1 121.8 158.2NGC1761 130 to 190 ” 97.4 148.7 161.7NGC2004 40 to 100 ” 60.5 90.6 94.4NGC2004 100 to 180 ” 56.7 108.4 193.0NGC330 45 to 85 0.15 to 0.20 71.7 113.5 133.6NGC1761 60 to 120 ” 76.8 139.4 189.2NGC1761 130 to 190 ” 98.6 146.9 165.1NGC2004 40 to 100 ” 64.7 100.1 136.7NGC2004 100 to 180 ” 110.2 179.7 216.0NGC330 45 to 85 0.20 to 0.25 75.4 102.4 100.7NGC1761 60 to 120 ” 112.0 172.6 199.1NGC1761 130 to 190 ” 88.7 144.3 148.7NGC2004 40 to 100 ” 64.2 111.2 136.7NGC2004 100 to 180 ” 112.3 183.2 236.7NGC330 45 to 85 0.25 to 0.30 49.1 102.2 190.4NGC1761 60 to 120 ” 124.7 211.2 240.6NGC1761 130 to 190 ” 95.3 156.6 182.1NGC2004 40 to 100 ” 109.8 151.1 159.0NGC2004 100 to 180 ” 104.7 157.5 176.5NGC330 45 to 85 0.30 to 0.35 42.2 72.1 78.1NGC1761 60 to 120 ” 236.2 348.2 148.7NGC1761 130 to 190 ” 92.0 123.5 98.3NGC2004 40 to 100 ” 163.5 224.0 182.0NGC2004 100 to 180 ” 315.6 259.0 168.7NGC330 45 to 85 0.35 to 0.40 52.5 69.3 65.0NGC1761 60 to 120 ” 571.8 537.8 463.0NGC1761 130 to 190 ” 55.3 72.4 82.1NGC2004 40 to 100 ” – – –NGC2004 100 to 180 ” – – –NGC330 45 to 85 0.40 to 0.45 47.3 38.2 22.4NGC1761 60 to 120 ” – – –NGC1761 130 to 190 ” – – –NGC2004 40 to 100 ” – – –NGC2004 100 to 180 ” – – –
found no HVC detection in H2. Likewise, although observa-tions by Andre et al. (2004) towards the Magellanic cloudsusing FUSE, HST and VLT observations have also shownthe presence of H2, HD and CO molecules, these detectionswere only at IVC, Milky Way or LMC/SMC velocities, withnothing seen corresponding to HVC gas. Searches for CO inemission towards HVCs have generally only given upper lim-its, (e.g. Dessauges-Zavadsky, Combes & Pfenniger 2007),possibly due to the fact that small filaments of gas are un-able to provide sufficient shielding from the ambient UV field(Richter et al. 2003). Overall, the presence of molecular gasin Magellanic HVCs is still a subject of debate.
Figures 13 and 14 show GIRAFFE spectra towardsNGC1761 and NGC2004 in the molecular lines CH+
(4232A) and CH (4300A). Tentative absorption in one orboth of these species is detected in only three sightlines to-
wards NGC1761 and one towards NGC2004 at the LMCvelocity, with no absorption detected at Galactic or I/HVCvelocities. We note that due to the relatively low gas densityin HVCs, the detection of CH and CH+ (although not H2) isa-priori unlikely in equilibrium conditions. Na i is rarely seenin absorption in HVCs, and CH is very well correlated withNa i in the range log(N(Na i) cm−2)∼12.2-14.2 (Smoker etal. 2014).
The maximum equivalent widths measured in CH+
(4232A) are 12.4 mA for NGC1761 and 6.3 mA forNGC2004, respectively. For CH (4300A), the correspond-ing values was 4.7 mA for NGC1761 with no obvious CHdetection towards NGC2004. Towards NGC1761 a few ofour sightlines have S/N ratios exceeding 400, which leads toa 3σ detection limit of 1.7 mA or a EW variation exceeding∼7 on scales of ∼10 arcminutes.
c© RAS, MNRAS 000, 000–000

Structure of Magellanic I/HVCs 13
Our detection rate is much lower than in the UVESspectra of Welty et al. (2006), who found either CH and/orCH+ in 9 out of 13 LMC stars observed with UVES, likelydue to the lower S/N ratio in many of our sightlines. How-ever, the observed equivalent widths in the two samples aresimilar, with Welty et al. finding EWs from 0.5 to 13.0 mAfor CH+ (4232A) and 0.8 to 10.5 mA for CH (4300A).
Finally we note that the absence of a strong molecularcomponent in the LMC HVCs is consistent with the cloudsbeing predominantly ionised and of a similar type to thosestudied by Lehner et al. (2009) using FUSE UV spectra.They found a lack of H2 and a high ionisation level (av-erage hydrogen ionization fraction >50%), with ≈90% oftheir sightlines also showing Ovi, indicating a diffuse, high-temperature component.
5 SUMMARY
We have presented FEROS and FLAMES optical absorptionline observations of intermediate and high velocity cloudstoward target stars within clusters in the LMC and SMC.IVC or HVC absorption in Ca ii K is detected in ∼60 percent of the FEROS and UVES sightlines and in many of theLMC FLAMES-GIRAFFE sightlines. In the I/HVCs we finda variation in the observed Ca ii equivalent width of a factorof ∼10 over ∼10 arcminutes or ∼150 pc at the distance of theLMC. Na i D is only tentatively detected at high velocitiesin one sightline, indicating the Routly-Spitzer effect. TheHV gas towards NGC2004 displays 50 to 100 percent moresmall-scale variation than the IV gas, indicating a structuraldifference between the two types of cloud. However, this islikely caused by the fact that the HV gas is further awayand in any case the same difference is not seen towards ourother LMC sightline NGC1761.
In the few sightlines with good H i data the velocitiesof Ca ii and H i are the same within the errors, indicatingthat the two species are co-spatial. The Ca ii/H i ratios arehigher in gas with velocities less than 70 kms−1 than in HVgas, likewise the sightine with lowest Ca/O ratio is the onewith the lowest velocity. These results are consistent withprevious work indicating the the metalicities of IVCs tendto be closer to solar than for HVCs. Combining these Ca iiobservations with O i measurements from the literature, weconclude that dust is present at HVC velocities in the LMCsightlines.
Finally, we detect CH or CH+ molecular gas in onlyfour sightlines (and only at Magellanic velocities and not inthe Milky Way or I/HVC components).
ACKNOWLEDGEMENTS
Data from ESO FEROS programme ID 078.C-0493(A) andFLAMES programme 171.D-0237(B) were taken from theESO archive. This research has made use of the simbad
Database, operated at CDS, Strasbourg, France and theESO Archive. JVS thanks the ESO Director General Discre-tionary Fund and Queen’s University Belfast Visiting Scien-tist Fund for financial support. We would like to thank twoanonymous referees whose comments significantly improvedthe paper.
REFERENCES
Andre M. K., et al., 2004, A&A, 422, 483
Andreani P., Vidal-Madjar A., 1988, Nature, 333, 432
Asplund M., Grevesse N., Sauva, A. J., Allende Prieto C., Kisel-man D., 2004, A&A, 47, 751
Bagnulo S., Jehin E., Ledoux C., Cabanac R., Melo C., GilmozziR., 2003, ESO Messenger no. 114, Page 10
Ben Bekhti N., Richter P., Westmeier T., Murphy, M. T., 2008,A&A, 487, 583
Ben Bekhti N., Richter P., Winkel B., Kenn F., Westmeier T.,2009, A&A, 503, 483
Bertelli G., Mateo M., Chiosi C., Bressan A., 1992, ApJ, 388, 400
Blades J. C., 1980, MNRAS, 190, 33
Blades J. C., Wheatley J. M., Panagia N., Grewing M., PettiniM., Wamsteker W., 1988a, ApJ, 332, 75
Blades J. C., Wheatley J. M., Panagia N., Grewing M., PettiniM., Wamsteker W., 1988b, ApJ, 334, 308
Bland-Hawthorn J., 2009, IAUS, 254, 241
Blitz L., Spergel D. N., Teuben P. J., Hartmann D., Burton W. B.,1999, ApJ, 514, 818
Bluhm H., de Boer K. S., Marggraf O., Richter P., 2001, A&A,367, 299
Bregman J. N. 2004, in High Velocity Clouds, eds. H. van Woer-den, B. P. Wakker, U. J. Schwarz, K. S. de Boer, Astrophys.Space Sci. Lib., 312, 341
Carrera R., Gallart C., Hardy E., Aparicio A., Zinn R., 2008, AJ,135, 836
Chiappini C., in Fumes J. G. S. J., Corsini E.M., Eds, ASP Conf.Ser. 2008, Vol. 396, Formation and Evolution of Galaxy Disks,Astron. Soc. Pac., San Francisco, p. 113
Crawford I. A., 1992, MNRAS, 259, 47
Dekker H., D’Odorico S., Kaufer A., Delabre B., & KotzlowskiH., 2000, SPIE, 4008, 534
Dessauges-Zavadsky M., Combes F., Pfenniger D., 2007, A&A,473, 863
Diamond P. J., Goss W. M., Romney J. D., Booth R. S., KalberlaP. M. W., Mebold U., 1989, ApJ, 347, 302
de Heij V., Braun R., Burton W. B., 2002, A&A, 391, 67
Fox A. J., Wakker B. P., Savage B. D., Sembach K. R., Tripp T.M., & Bland-Hawthorn J. 2005, ApJ, 630, 332
Fox A. J., Wakker B. P., Smoker J. V., Richter P., Savage B. D.,Sembach K. R., 2010, ApJ, 718, 1046
Fox A. J., Richter P., Wakker B. P., Lehner N., Howk C. J., BenBekhti N., Bland Hawthorn J., Lucas S., 2013, ApJ, 722, 110
Fox A. J., Wakker B. P., Barger K. A., et al., 2014, ApJ, 787, 147
Giovanelli R., 1981, AJ, 86, 1468
Gritton J. A., Shelton R. L., Kwak K., 2014, 795, 99
Heitsch, F., Putman, M. E. 2009, ApJ, 698, 1485
Hobbs L. M., 1975, ApJ, 202, 628
Hopp U., Schulte-Ladbeck R. E., Kerp J., 2007, MNRAS, 374,1164
Howarth I. D., Price R. J., Crawford I. A., Hawkins I., 2002,MNRAS, 335, 267
Howarth I. D., Murray J., Mills D., Berry D. S., 2003, StarlinkUser Note SUN 50, Rutherford Appleton Laboratory/CCLRC
Hunter I., Smoker J. V., Keenan F. P., Ledoux C., Jehin E., Ca-banac R., Melo C., Bagnulo S., 2006, MNRAS, 367, 1478
Kalberla P. M. W., Burton W. B., Hartmann D., Arnal E. M.,Bajaja E., Morras R., Poppel, W. G. L. 2005, A&A, 440, 775
Kaufer A., Stahl O., Tubbesing S., Nrregaard P., Avila G., Fran-cois P., Pasquini L., Pizzella A., 1999, The Messenger 95, 8
Keller S. C., Wood P. R., 2006, ApJ, 642, 834
Kennicut R. C., 1998, ApJ, 498, 541
Lauroesch J. T., 2007, in Haverkorn M., Goss W. M., eds, ASPConf. Ser. Vol. 365, Small Ionized and Neutral Structures inthe Diffuse Interstellar Medium, Astron. Soc. Pac., San Fran-cisco, p. 40
c© RAS, MNRAS 000, 000–000

14 J. Smoker et al.
Figure 13. CH+ (4232A) and CH (4300A) profiles towards NGC1761 taken with FLAMES-GIRAFFE. Only eight sightlines showmolecular line absorption at Magellanic Cloud velocities, and none show molecular absorption at Galactic or I/HVC velocities.
Lehner N., Staveley-Smith L., Howk J. C., 2009, ApJ, 702, 940
Lehner N., Howk J. C., 2011, Science, 334, 955
Marasco A., Fraternali F., 2011, A&A, 525, 134
McClure-Griffiths N. M., et al., 2009, ApJS, 181, 398
Meyer D. M., Lauroesch J. T., 1999, 520, 103
Mirabel I. F., 1981, ApJ, 250, 528
Misawa T., Charlton J. C., Kobulnicky H. A., Wakker, B. P.,Bland-Hawthorn J., 2009, ApJ, 695, 1382
Molaro P., Vladilo G., Monai S., d’Odorico S., Ferlet R., Vidal-Madjar A., Dennefeld M., 1993, A&A, 274, 505
Morton D. C., 2003, ApJS, 149, 205
Morton D. C., 2004, ApJS, 151, 403
Muller C. A., Oort J. H., Raimond E., 1963, CR Acad. Sci. Paris,257, 1661
Nasoudi-Shoar S., Richter P., de Boer K. S., Wakker B. P., 2010,A&A, 520, 26
Nidever D. L., Majewski S. R., Burton W. B., 2008, ApJ, 679,432
Olano C. A., 2004, A&A, 423, 895
Olano C. A., 2008, A&A, 485, 457
Pasquini, L. et al. 2002, The Messenger 110, 1
Pisano D. J., Barnes D. G., Gibson B. K., Staveley-Smith L.,Freeman K. C., Kilborn V. A., 2004, ApJ, 610, L17
Points S. D., Lauroesch J. T., Meyer D. M., 2004, PASP, 116, 801
Richings A. J., Schaye J, Oppenheimer B. D., 2010, MNRAS, 440,3349
Richter P., de Boer K. S., Widmann H., Kappelmann N., GringelW., Grewing M., Barnstedt J., 1999, Nature, 402, 386
Richter P., Sembach K. R., Howk J. C., 2003, A&A, 405, 1013
Richter P., Charlton J. C., Fangano A. P. M., Bekhti N. B.,Masiero J. R., 2009, ApJ, 695, 1631
Richter P., Krause F., Fechner C., Charlton J. C., Murphy M. T.,2011, A&A, 528, 12
Richter P., Fox A. J., Ben Bekhti N., Murphy M. T., Bomans D.,Frank S., AN, 335, 92
Routly P. M., Spitzer L., 1952, ApJ, 115, 227
Savage B. D., de Boer K. S., 1981, ApJ, 243, 460
Sembach K. R., Howk C. J., Ryans R. S. I., Keenan F. P., 2000,ApJ, 528, 310
Siegel M. H., Majewski S. R., Gallart C., Sohn S. T., KunkelW. E., Bran R., 2005, ApJ, 623, 181
Siluk R. S., Silk J., 1974, ApJ, 192, 51
Simon J. D., Blitz L., 2002, ApJ, 574, 726
Smoker J. V., Roger R. S., Keenan F. P., Davies R. D., LangR. H., Bates B., 2001, A&A, 380, 683
Smoker J. V., et al., 2003, MNRAS, 346, 119
Smoker J. V., Bagnulo S., Cabanac R., Ledoux C., Jehin E., MeloS., Keenan F. P., 2011, MNRAS, 414, 59
Smoker J. V., Ledoux, C. Jehin E. Keenan F. P., Kennedy M.,Cabanac R., Melo, C., 2014, MNRAS, 438, 1127
Smoker J. V., Keenan F. P., Fox A., 2015, 582, 59
Songaila A., 1981, ApJ, 243, L19
Songaila A., Cowie L. L., York D. G., 1981, ApJ, 248, 956
Songaila A., Blades J. C., Hu E. M., Cowie L. L., 1986, ApJ, 303,198
Stanimirovic S., Hoffman S., Heiles C., Douglas K. A., Putman,M., Peek J. E. G., 2008, ApJ, 680, 276
Staveley-Smith L., Kim S., Calabretta M. R., Haynes R. F.,Kesteven M., 2003, MNRAS, 339, 87
Thom C., Putman M. E., Gibson B. K., Christlieb N., Flynn C.,Beers T. C., Wilhelm R., Lee Y. S., 2006, ApJ, 638, L97
Thom C., Peek J. E. G., Putman M. E., Heiles Carl., PeekK. M. G., Wilhelm R., 2008, ApJ, 684, 364
Vallerga J. V., Vedder P. W., Craig N., Welsh B. Y., 1993, ApJ,411, 729
van Loon J. Th., Smith K. T., McDonald I., Sarre P. J., Fossey
c© RAS, MNRAS 000, 000–000

Structure of Magellanic I/HVCs 15
Figure 14. CH+ (4232A) and CH (4300A) profiles towards NGC2004. Only three sightlines show tentative molecular line absorptionat Magellanic Cloud velocities, and none show molecular absorption at Galactic or I/HVC velocities.
S. J., Sharp R. G., 2009, MNRAS, 399, 195van Loon J. Th., Bailey M., Tatton B. L., et al., 2013, A&A, 550,
108van Woerden H., Schwarz U. J., Peletier R. F., Wakker B. P.,
Kalberla P. M. W., 1999, Nat., 400, 138Wakker B. P., van Woerden H., 1997, ARA&A, 35, 217Wakker B. P., Mathis J. S., 2000, ApJ, 544, 107Wakker B. P., 2001, ApJS, 136, 463Wakker B. P., et al., 2007, ApJ, 670, 113Wakker B. P., York D. G., Wilhelm R., Barentine J. C., Richter
P., Beers T. C., Ivezic Z., Howk J. C., 2008, ApJ, 672, 298Wallace P., Clayton C., 1996, rv, Starlink User Note SUN 78,
Rutherford Appleton Laboratory/CCLRCWayte S. R., 1990, ApJ, 355, 473Wegner et al., 2000, A&AS, 143, 9Welsh B. Y., Wheatley J., Lallement R., 2009, PASP, 121, 606Welty D. E., Lauroesch J. T., Blades J. C., Hobbs L. M., York
D. G., 1997, ApJ, 489, 672Welty D. E., Frisch P. C., Sonneborn G., York D. G., 1999, ApJ,
512, 636Welty D., Fitzpatrick E. L., 2001, ApJ, 551, 175Welty D. E., Federman S. R., Gredel R., Thorburn J. A., Lambert
D. L., 2006, ApJS, 165, 138Welty D. E., Xue R., Wong T., 2012, ApJ, 745, 173Westmeier T., Bruns C., Kerp J., 2008, MNRAS, 390, 1691
c© RAS, MNRAS 000, 000–000

16 J. Smoker et al.
APPENDIX A: ONLINE MATERIAL
c© RAS, MNRAS 000, 000–000
Structure of Magellanic I/HVCs 17
Table A1. FEROS and UVES-observed stars towards the Magellanic Clouds. Stars with RA<2h are in the SMC and with RA>3h inthe LMC. S/N ratios are per pixel.
Name Alt name R.A. Dec. l b mv mb Spect. S/N S/N Inst.(J2000) (J2000) (deg.) (deg.) (mag) (mag) type CaK NaD
HV 1328 SMC V0172 00 32 54.90 -73 49 19.1 304.70 -43.24 14.17 14.116 – – 55 UHV 1333 SMC V0189 00 36 03.46 -73 55 58.8 304.39 -43.15 15.87 14.702 – – 35 UHV 1335 SMC V0193 00 36 55.70 -73 56 27.9 304.31 -43.15 15.399 14.746 – – 50 UHV 817 – 00 39 16.55 -72 01 58.4 304.26 -45.06 14.44 13.77 – – 50 UHV 1345 SMC V0214 00 40 38.60 -73 13 14.2 304.01 -43.88 15.428 14.779 – – 15 UHV 822 – 00 41 55.48 -73 32 23.7 303.86 -43.57 14.39 13.95 – – 30 UHV 1365 – 00 42 00.00 -73 44 00.0 303.84 -43.38 15.55 14.94 – – 30 USV* HV 823 – 00 43 48.50 -73 36 50.0 303.67 -43.50 13.99 13.39 – – 60 UAzV 014 Sk 9 00 46 32.63 -73 06 05.7 303.43 -44.02 13.59 13.77 O3-4V+neb 60 – UAzV 015 Sk 10 00 46 42.14 -73 24 55.7 303.40 -43.71 12.984 13.176 O6.5II(f) 60 – UAzV 018 Sk 13 00 47 12.22 -73 06 33.2 303.36 -44.01 12.52 12.48 OB 120 100 UAzV 022 Sk 15 00 47 38.70 -73 07 48.8 303.31 -44.00 12.15 12.25 B2I 70 – UAzV 023 Sk 17 00 47 38.91 -73 22 53.9 303.31 -43.74 12.324 12.236 B2I 120 200 USMC 9251 – 00 47 47.60 -73 17 28.0 303.30 -43.83 14.90 14.76 – 70 – UAzV 026 Sk 18 00 47 50.04 -73 08 21.0 303.30 -43.99 12.35 12.55 O7III+neb 250 – UAzV 047 SMC 11925 00 48 51.48 -73 25 58.5 303.19 -43.69 13.314 13.496 O8III((f)) 60 60 UAzV 065 Sk 33 00 50 06.08 -73 07 45.2 303.07 -44.00 11.12 11.00 B5I 100 200 UAzV 070 Sk 35 00 50 18.11 -72 38 10.0 303.05 -44.49 10.96 12.40 O9.5Iw 130 130 UAzV 075 Sk 38 00 50 32.39 -72 52 36.5 303.02 -44.25 12.604 12.756 O5III(f+) 75 – UAzV 80 SMC 17457 00 50 43.80 -72 47 41.5 303.01 -44.33 13.24 13.376 O4-6n(f)p 100 80 UDZ Tuc SMC 17504 00 50 44.70 -73 16 05.4 303.00 -43.86 15.37 15.44 B0-B0.5V 25 30 UAzV 95 SMC 19650 00 51 21.65 -72 44 14.4 302.94 -44.39 13.64 13.83 O7III((f)) 100 60 UAzV 104 SMC 20656 00 51 38.43 -72 48 06.1 302.91 -44.33 13.064 13.226 B0.5Ia 70 – ULIN 200 Bruck 60 14 00 51 57.74 -73 14 22.0 302.88 -43.89 17.493 17.20 – 10 50 UAzV 120 SMC 23151 00 52 15.24 -72 09 15.8 302.84 -44.97 14.14 14.43 O9.5III 120 60 UESHC 05 – 00 52 06.43 -73 06 29.4 302.86 -44.02 14.2 13.983 – – 100 UESHC 03 – 00 52 21.50 -73 13 33.0 302.84 -43.90 – – – 30 25 UESHC 02 – 00 52 32.60 -73 17 08.0 302.82 -43.84 16.957 17.012 B2IV-V 20 35 UESHC 07 – 00 52 52.60 -73 18 34.0 302.79 -43.82 15.417 15.254 – 120 250 UESHC 01 LIN 232 00 53 02.80 -73 17 59.4 302.77 -43.83 15.072 15.079 B4III 20 – U
ESHC 04 – 00 53 56.75 -73 10 29.4 302.68 -43.95 14.901 15.049 – 40 40 UOGLE 13487 – 00 54 33.22 -73 10 39.0 302.62 -43.95 15.51 15.69 – 200 – UESHC 06 LIN 264 00 54 37.60 -73 04 56.0 302.61 -44.04 15.128 15.177 – 60 30 UHV 1645 – 00 55 19.76 -73 14 42.2 302.54 -43.88 20.10 16.84 Mira – 20 ULHA 115-S 23 AzV 172 00 55 53.81 -72 08 59.0 302.45 -44.97 13.29 13.25 B8[e]Ib 10 30 FN330 ROB B18 SMC 35727 00 56 03.70 -72 27 12.8 302.44 -44.67 15.57 15.79 O9.5V 30 – UN330 ROB B28 N330 BAL 254 00 56 06.80 -72 28 34.9 302.44 -44.65 15.52 15.71 B0Ve 30 – UN330 ROB B32 N330 ELS 36 00 56 10.65 -72 28 10.1 302.43 -44.65 14.74 14.85 B2II 35 – UN330 ROB B16 – 00 56 18.56 -72 26 45.4 302.42 -44.68 13.92 13.98 A2II 60 40 UN330 ROB B13 N330 ELS 125 00 56 20.11 -72 27 02.3 302.41 -44.67 15.58 15.78 B2III/IVe 20 – UN330 ROB B38 N330 ELS 121 00 56 22.56 -72 28 35.9 302.41 -44.65 12.474 12.366 A5I – 70 UN330 ROB B04 – 00 56 30.90 -72 28 19.0 302.39 -44.65 15.41 15.58 B1.5IVe 25 – UAzV 187 Sk 68 00 57 31.73 -71 19 59.3 302.23 -45.79 11.96 12.09 OB 55 85 FN346 ELS 26 SMC 42719 00 58 14.24 -72 10 45.0 302.20 -44.94 19.15 17.98 B0IV(Nstr) – 65 UN346 ELS 12 AzV 202 00 58 14.48 -72 07 29.8 302.19 -44.99 14.18 14.34 B1Ib – 60 UN346 ELS 28 – 00 58 17.35 -72 10 50.8 302.19 -44.94 14.73 14.94 OC6Vz – 70 UAzV 207 SMC 43724 00 58 33.17 -71 55 47.0 302.15 -45.19 14.13 14.35 O7V 40 60 UAzV 210 Sk 73 00 58 35.79 -72 16 25.0 302.16 -44.84 12.63 12.66 OB 50 – UN346 ELS 18 N346 ELS 18 00 58 47.03 -72 13 01.6 302.14 -44.90 14.66 14.78 O9.5IIIe – 40 UAzV 214 SMC 44784 00 58 54.76 -72 13 17.2 302.13 -44.90 13.40 13.39 B1Ia 100 90 UAzV 215 Sk 76 00 58 55.62 -72 32 08.5 302.14 -44.58 12.65 12.75 OB 60 – UN346 ELS 07 SMC 44908 00 58 57.40 -72 10 33.5 302.12 -44.94 13.82 14.13 O4V((f)) – 110 UAzV 216 – 00 58 59.13 -72 44 34.0 302.15 -44.37 14.15 14.32 B1-3II: 40 – UN346 MPG 355 SMC 45068 00 59 00.75 -72 10 28.2 302.11 -44.94 12.61 12.80 O2III(f) – 100 UN346 MPG 368 – 00 59 01.80 -72 10 31.2 302.11 -44.94 13.95 14.18 O6:V – 120 UN346 MPG 487 – 00 59 06.71 -72 10 41.3 302.10 -44.94 14.19 14.33 O8V – 70 U
c© RAS, MNRAS 000, 000–000

18 J. Smoker et al.
Table A1. continued.
Name Alt name R.A. Dec. l b mv mb Spect. S/N S/N Inst.(J2000) (J2000) (deg.) (deg.) (mag) (mag) type CaK NaD
N346 ELS 51 SMC 45459 00 59 08.68 -72 10 14.1 302.10 -44.95 15.17 15.40 O7Vz – 30 UN346 ELS 33 N346 SSN 37 00 59 11.64 -72 09 57.6 302.09 -44.95 14.82 15.07 O8V – 30 UN346 ELS 22 SMC 45935 00 59 18.58 -72 11 10.1 302.08 -44.93 14.65 14.91 O9V – 40 UN346 ELS 10 AzV 226 00 59 20.73 -72 17 10.7 302.08 -44.83 14.12 14.19 O7IIIn((f)) – 80 UHD 5980 AzV 229 00 59 26.57 -72 09 53.9 302.07 -44.95 11.13 11.31 WN3+OB – 60 UN346 ELS 46 – 00 59 31.88 -72 13 35.2 302.06 -44.89 15.16 15.44 O7Vn – 40 UAzV 232 Sk 80 00 59 31.96 -72 10 46.3 302.06 -44.93 12.12 12.31 O7Iaf+ 120 150 UAzV 235 Sk 82 00 59 45.75 -72 44 56.5 302.07 -44.37 12.02 12.20 B0Iaw 100 – UN346 ELS 31 SMC 47478 00 59 54.08 -72 04 31.0 302.01 -45.04 14.81 15.05 O8Vz – 60 UAzV 243 Sk 84 01 00 06.71 -72 47 19.0 302.03 -44.32 13.71 13.91 O6V 80 – UAzV 242 Sk 85 01 00 06.86 -72 13 57.5 301.10 -44.88 11.7 11.5 B0.7Iaw 250 200 UAzV 304 SMC 53474 01 02 21.47 -72 39 14.7 301.79 -44.45 14.66 14.77 B0.5V 70 – UAzV 321 SMC 54958 01 02 57.07 -72 08 09.1 301.68 -44.96 13.66 13.82 O9Ib 110 70 UAzV 372 Sk 116 01 04 55.74 -72 46 48.1 301.54 -44.31 12.494 12.646 O9.5Iabw 90 – UAzV 388 SMC 62400 01 05 39.52 -72 29 27.1 301.43 -44.60 13.86 14.12 O4V 50 – UAzV 398 SMC 63413 01 06 09.81 -71 56 00.8 301.31 -45.15 13.94 13.98 O9Ia: 80 65 UMA93 1589 – 01 06 28.85 -71 52 04.9 301.27 -45.21 15.411 15.135 A5 100 – UAzV 404 Sk 128 01 06 29.27 -72 22 08.4 301.33 -44.71 11.7 11.8 OB 200 120 ULHA 115-S 52 HD 6884 01 07 18.22 -72 28 03.7 301.25 -44.61 10.32 10.23 B9Iae 45 125 FAzV 440 SMC 68756 01 08 56.01 -71 52 46.8 301.00 -45.18 14.44 14.58 O7V 60 35 UAzV 456 Sk 143 01 10 55.77 -72 42 56.3 300.91 -44.34 12.98 12.89 OB 70 200 UAzV 462 Sk 145 01 11 25.92 -72 31 20.9 300.83 -44.52 12.464 12.596 OB 30 65 FAzV 469 Sk 148 01 12 29.00 -72 29 29.1 300.71 -44.55 13.014 13.176 O8II 100 – UHV 2195 – 01 14 28.05 -72 39 53.5 300.54 -44.36 12.99 12.51 F5Ib – 50 UAzV 488 Sk 159 01 15 08.88 -73 21 24.3 300.51 -43.66 11.77 11.90 B0.5Iaw 130 130 UAzV 483 Sk 156 01 15 28.63 -73 19 50.1 300.55 -43.69 11.85 11.93 OB 50 70 FSK 160 AzV 190 01 17 05.15 -73 26 36.0 300.41 -43.56 13.12 13.30 OB: 120 150 U
SK 190 – 01 31 27.96 -73 22 14.3 299.00 -43.45 13.37 13.59 O7.5(f)np 90 65 USK-67 2 RMC 51 04 47 04.45 -67 06 53.1 278.36 -36.79 11.219 11.26 B1.5Ia 50 130 FSK -67 05 RMC 53 04 50 18.92 -67 39 38.1 278.89 -36.32 11.2 11.377 O9.7Ib 220 – USK-66 1 RMC 56 04 52 19.09 -66 43 53.3 277.72 -36.41 11.603 11.635 B2Ia 30 60 FSK-66 5 RMC 57 04 53 30.03 -66 55 28.3 277.90 -36.24 10.68 10.76 B3Iab 30 130 FSK-67 14 Sk -67 14 04 54 31.89 -67 15 24.7 278.27 -36.05 11.376 11.541 B1.5Ia 40 80 FSK -66 18 – 04 55 59.80 -65 58 29.8 276.69 -36.25 13.294 13.467 O6V((f)) 100 80 USK -69 43 HD 268809 04 56 10.46 -69 15 38.2 280.58 -35.33 11.866 11.964 OB 30 70 FLH 10-3061 – 04 56 42.46 -66 25 18.1 277.20 -36.07 13.595 13.491 ON2III(f*) 90 75 USK -66 35 HD 268732 04 57 04.47 -66 34 38.5 277.38 -35.99 11.494 11.587 OB 50 80 FSK -69 50 LMC 33053 04 57 15.09 -69 20 19.9 280.64 -35.22 13.204 13.366 O7(f)(n)p 100 80 USK -67 22 Brey 10a 04 57 27.44 -67 39 02.9 278.64 -35.67 13.314 13.496 Of 110 – ULHA 120-S 12 SK -67 23 04 57 36.80 -67 47 37.5 278.80 -35.62 12.66 12.526 B0.5Ie 35 70 FSK -69 52 HD 268867 04 57 48.90 -69 52 22.3 281.24 -35.02 11.392 11.399 OB 50 – USK -67 28 GV 135 04 58 39.24 -67 11 18.7 278.05 -35.69 12.082 12.269 B0.7Ia 35 85 FSK -68 26 GV 167 05 01 32.24 -68 10 42.9 279.14 -35.17 11.728 11.85 BC2Ia 35 70 FLHA 120-S 155 RMC 71 05 02 07.39 -71 20 13.1 282.82 -34.25 10.60 10.55 OB 35 70 FSK -69 59 HD 268960 05 03 12.70 -69 01 37.0 280.09 -34.80 12.01 12.166 B0Ia 25 45 FSK -67 38 LMC 59721 05 03 29.73 -67 52 25.1 278.72 -35.07 13.494 13.716 OB 100 80 USK -70 50 HD 269009 05 03 45.85 -70 11 57.5 281.45 -34.44 11.0 11.1 OB 50 105 FSK -70 60 LMC 64006 05 04 40.78 -70 15 34.6 281.49 -34.35 13.646 13.914 O4-O5V:n 110 – USK -68 39 – 05 04 50.17 -68 07 52.4 278.99 -34.88 11.988 12.039 B2.5Ia 50 115 FSK -70 69 LMC 65981 05 05 18.70 -70 25 49.8 281.68 -34.25 13.616 13.854 O3V(f) 75 50 USK -68 41 GV 195 05 05 27.11 -68 10 02.6 279.02 -34.82 11.868 12.01 B0.5Ia 40 100 FSK -68 45 – 05 06 07.28 -68 07 06.2 278.94 -34.77 11.92 12.007 OB 30 70 FSK -70 78 HD 269074 05 06 16.04 -70 29 35.7 281.72 -34.16 11.0 11.1 OB 50 70 FSK -68 52 HD 269050 05 07 20.41 -68 32 08.6 279.40 -34.56 11.581 11.54 B0Ia 50 – UOGLE J050724 – 05 07 24.62 -68 29 32.7 279.35 -34.56 – 16.76 Ecl. Bin 45 – USK -68 63 HIP 24080 05 10 22.79 -68 46 23.8 279.60 -34.23 10.52 10.52 B1.5eq 200 – U
c© RAS, MNRAS 000, 000–000

Structure of Magellanic I/HVCs 19
Table A1. continued.
Name Alt name R.A. Dec. l b mv mb Spect. S/N S/N Inst.(J2000) (J2000) (deg.) (deg.) (mag) (mag) type CaK NaD
BI 108 LMC 94226 05 13 43.05 -69 18 36.9 280.15 -33.82 13.222 13.332 B1:II: 130 – USK -69 83 HD 269244 05 14 29.64 -69 29 43.4 280.35 -33.72 11.435 11.612 OB 30 70 FLHA 120-S 93 GV 566 05 16 31.80 -68 22 09.1 278.98 -33.77 12.81 12.69 A0:I: 25 45 FSK -69 89 HD 269311 05 17 17.57 -69 46 44.2 280.62 -33.42 11.999 11.428 OB 40 80 FLHA 120-S 96 SK -69 94 05 18 14.35 -69 15 01.1 279.98 -33.44 9.635 9.565 A5Iaeq 50 165 FBI 128 – 05 18 19.77 -65 49 14.6 275.92 -34.06 13.447 13.745 O... 80 40 USK -67 78 HD 269371 05 20 19.08 -67 18 05.7 277.64 -33.62 11.3 11.0 OB 30 95 FLHA 120-S 30 SK -68 73 05 22 59.73 -68 01 46.3 278.45 -33.24 11.71 11.46 Bep 35 95 FSK -67 90 HD 269440 05 23 00.66 -67 11 22.1 277.46 -33.38 11.282 11.378 B1Ia 55 120 FSK -67 112 HD 269545 05 26 56.48 -67 39 35.0 277.94 -32.93 11.77 11.90 OB 30 80 FSK -66 100 – 05 27 45.47 -66 55 15.2 277.06 -32.96 12.976 13.204 O6II(f) 110 70 USK -68 92 GV 315 05 28 16.17 -68 51 45.6 279.33 -32.63 11.64 11.71 OB 45 80 FHD 269599 RMC 105 05 28 22.73 -69 08 31.7 279.66 -32.60 10.24 10.03 – 35 30 FSK -66 106 – 05 29 00.99 -66 38 27.8 276.71 -32.87 12.64 12.72 OB 55 120 FLHA 120-S 116 RMC 110 05 30 51.48 -69 02 58.6 279.51 -32.37 10.52 10.28 F0Iae 30 70 FSK -66 118 GV 341 05 30 51.91 -66 54 09.1 276.99 -32.66 11.674 11.776 OB 45 55 FSK -67 150 – 05 30 01.71 -67 00 53.4 277.13 -32.68 12.034 12.24 OB 50 110 FSK -71 42 HD 269660 05 30 47.78 -71 04 02.3 281.87 -32.06 11.15 11.19 B1Ia 55 95 FSK -68 111 HD 269668 05 31 00.84 -68 53 57.1 279.33 -32.38 10.161 12.01 OB 45 75 FSK -67 169 – 05 31 51.59 -67 02 22.3 277.14 -32.55 12.06 12.18 B1Ia 45 90 FHDE 269702 SK -67 168 05 31 52.12 -67 34 20.8 277.76 -32.48 11.69 11.99 O8I(f)p 125 70 USK -68 114 HD 269700 05 31 52.28 -68 32 38.9 278.90 -32.35 10.56 10.54 BN?2Ia+ 25 45 FSK -67 172 HD 269713 05 32 07.32 -67 29 14.0 277.66 -32.47 11.81 11.88 OB 30 70 FSK -67 173 LH 76-51 05 32 10.75 -67 40 25.0 277.88 -32.44 11.92 12.04 OB 30 45 FSK -67 199 HD 269777 05 34 18.45 -67 18 13.7 277.41 -32.28 11.05 11.06 B3Ia 40 80 FSK -67 206 – 05 34 55.11 -67 02 37.5 277.10 -32.25 9.862 12.00 OB 45 80 FBI 237 LMC 164942 05 36 14.63 -67 39 19.2 277.80 -32.06 13.790 13.830 O2V(f*) 90 60 U
SK -69 214 CPD-69 419 05 36 16.42 -69 31 27.0 279.99 -31.83 12.279 12.19 B0.7Ia 30 70 FHD 37974 SK -69 216 05 36 25.87 -69 22 55.9 279.82 -31.84 11.10 10.959 Be 25 90 FSK -66 171 HD 269889 05 37 02.42 -66 38 36.9 276.61 -32.08 10.246 12.19 OB 95 50 USK -69 228 CPD-69 436 05 37 09.18 -69 20 19.5 279.76 -31.78 12.19 12.12 BC1.5Ia 40 105 FBI 253 LMC 168644 05 37 34.46 -69 01 10.2 279.38 -31.78 13.56 13.70 O2V(f*) 105 90 USK -69 237 SK -69 237 05 38 01.31 -69 22 14.1 279.79 -31.70 12.05 12.08 B1Ia 30 90 FLHA 120-S 134 HD 38489 05 40 13.33 -69 22 46.5 279.79 -31.70 12.296 12.215 B[e] 30 70 FSK-69 270 HD 269997 05 41 21.19 -69 04 38.6 279.41 -31.44 11.36 11.20 B2.5Ia 40 110 FSK-69 274 HD 269992 05 41 27.68 -69 48 03.7 280.25 -31.35 11.27 11.22 B2.5Ia 45 120 FSK-70 111 HD 269993 05 41 36.79 -70 00 52.6 280.50 -31.32 11.78 11.516 OB 35 80 FLHA 120-S 137 – 05 41 48.00 -69 37 00.0 280.03 -31.34 14.198 14.107 BIaePCyg 5 15 FSK-69 289 CPD-69 514 05 42 49.22 -69 32 52.2 279.94 -31.26 11.4 11.3 OB 35 65 FSK-67 256 CPD-67 500 05 44 25.02 -67 13 49.6 277.22 -31.32 11.76 11.751 OB 20 85 FSK-68 171 HD 270220 05 50 22.99 -68 11 24.7 278.30 -30.69 11.960 12.001 B1Ia 20 55 FSK-70 120 HD 270196 05 51 20.78 -70 17 09.3 280.72 -30.47 11.490 11.6 B1Ia 35 60 F
c© RAS, MNRAS 000, 000–000

20 J. Smoker et al.
Figure A1. FLAMES-GIRAFFE Ca ii K spectra towards NGC330 showing the spectra of 16 star-to-star pairs in which the maximumdifference in the equivalent width was detected between a velocity of +45 and +85 km s−1 in the LSR. Each star is only plotted once.
c© RAS, MNRAS 000, 000–000

Structure of Magellanic I/HVCs 21
Figure A2. FLAMES-GIRAFFE Ca ii K spectra towards NGC346 showing the spectra of 16 star-to-star pairs in which the maximumdifference in the equivalent width was detected between a velocity of +60 and +250 km s−1 in the LSR. Each star is only plotted once.
c© RAS, MNRAS 000, 000–000

22 J. Smoker et al.
Figure A3. FLAMES-GIRAFFE Ca ii K spectra towards NGC1761 showing the spectra of 16 star-to-star pairs in which the maximumdifference in the equivalent width was detected between a velocity of +30 and +105 km s−1 in the LSR. Each star is only plotted once.
c© RAS, MNRAS 000, 000–000

Structure of Magellanic I/HVCs 23
Figure A4. FLAMES-GIRAFFE Ca ii K spectra towards NGC2004 showing the spectra of 16 star-to-star pairs in which the maximumdifference in the equivalent width was detected between a velocity of +30 and +75 km s−1 in the LSR. Each star is only plotted once.
c© RAS, MNRAS 000, 000–000

24 J. Smoker et al.
Figure A5. FLAMES-GIRAFFE Ca ii K spectra towards NGC2004 showing the spectra of 16 star-to-star pairs in which the maximumdifference in the equivalent width was detected between a velocity of +75 and +130 km s−1 in the LSR. Each star is only plotted once.
c© RAS, MNRAS 000, 000–000

Structure of Magellanic I/HVCs 25
Figure A6. Variation in the Ca ii equivalent width for I/HVCcomponents observed with FEROS towards the LMC for veloci-ties between +40 and +60 km s−1.
Figure A7. Variation in the Ca ii equivalent width for I/HVCcomponents observed with FEROS towards the LMC for veloci-ties between +60 and +100 kms−1.
Figure A8. NGC 330 equivalent width and peak velocity be-tween +45 and +85 km s−1.
Figure A9. NGC1761 equivalent width and peak velocity be-tween +30 and +105 km s−1.
c© RAS, MNRAS 000, 000–000

26 J. Smoker et al.
Figure A10. NGC1761 equivalent width and peak velocity be-tween +125 and +200 kms−1.
Figure A11. NGC2004 equivalent width and peak velocity be-tween +30 and +75 km s−1.
Figure A12. NGC2004 equivalent width and peak velocity be-tween +75 and +130 km s−1.
c© RAS, MNRAS 000, 000–000

Structure of Magellanic I/HVCs 27
Figure A13. Percentage equivalent width variation in Ca ii(100.0×(EW1/EW2)-100.0) plotted against star to star distancein degrees. (a) NGC 330: IVC from +45.0 to +85.0 km s−1 (b)NGC 1761: I/HVC from +60.0 to +120.0 km (c) NGC 1761: HVCfrom +130.0 to +190.0 km/s (d) NGC 2004: I/HVC from +40.0to +100.0 km/s (e) NGC 2004: I/HVC from +100.0 to +180.0km/s.
c© RAS, MNRAS 000, 000–000