larisa ortiz march 2014
TRANSCRIPT

Commercial District Classification
Successful district management begins with understanding district needs
About Me
Larisa Ortiz Principal, Larisa Ortiz Associates
Lead East Coast Consultant, LISC MetroEdge
Visiting Professor, Pratt Institute
Former Director, Coro Neighborhood Leadership Program (NYC)
Editor, The Commercial District Advisor
ICSC Alliance, Public Sector Co-Chair

Experience in Commercial District Revitalization
National
New York
New Jersey
Philadelphia, PA
Pittsburgh, PA
Martinsville, VA
Jacksonville, FL
Chicago, IL
Indianapolis, IN
Kansas City, MO
Houston, TX
California
• Bay Area
• San Diego
Seattle, WA
International
Puerto Rico
El Salvador
Chile

Strategic Positioning
Market Analysis
Administrative Management
• BID • CDC
Redevelopment
• public space improvements • private redevelopment/real estate
Retail Sales
• marketing/promotion • event marketing
Tenant Mix
• retail retention/attraction
STEP 1:
DIAGNOSE
STEP 2:
BUILD CAPACITY
STEP 3:
TAKE ACTION
©Larisa Ortiz Associates
Strategic Positioning
Market Analysis
Administrative Management
Redevelopment & Retail Sales
Tenant Mix
The Framework
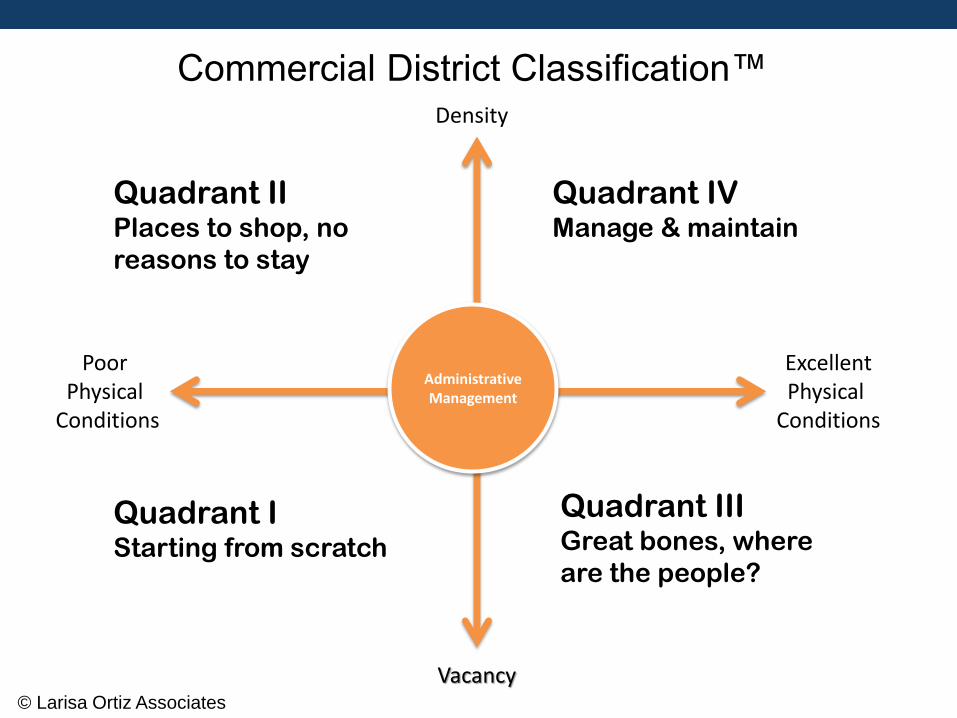
Density
Vacancy
Poor Physical
Conditions
Administrative Management
Quadrant I Starting from scratch
Quadrant II Places to shop, no
reasons to stay
Quadrant III Great bones, where
are the people?
Quadrant IV Manage & maintain
Commercial District Classification™
© Larisa Ortiz Associates
Excellent Physical
Conditions

What do shoppers want?
Source: Verde Group/ ICSC Global Research Network,

What do shoppers want?
Source: Verde Group/ ICSC Global Research Network,

Commercial District Research
• LISC commissioned, 2009
• Funded by the William Penn Foundation
• Study Overview
– 10 year time series analysis
– 264 Commercial Corridors
– Considered the impact of various investments and corridor conditions on corridor success

What characterizes a “successful” corridor?
• Tenant Mix (offerings that reflect community needs)
• Density (retail and population)
• Physical Conditions
– Street experience (i.e. physical space/amenities)
– Access/location

What characteristics enable change?
• Leadership
• Administrative Capacity

Administrative Management
Retail Sales
Tenant Mix
Redevelopment
Clean & Safe
Tenant Mix
Redevelopment
Physical Improvements
Physical Improvements
Quadrant I: Starting from scratch
Quadrant II: Places to shop, no
reasons to stay
Quadrant III: Great bones,
where are the people?
Quadrant IV: Manage & maintain
© Larisa Ortiz Associates
Commercial District Classification™ Model Density
Vacancy
Poor Physical
Conditions
Excellent Physical
Conditions

C B A
Corridor Success: A Framework for Action
Administrative Management
TIM
E
EXP
ERTI
SE N
EED
S C
HA
NG
E
Quadrant I:
Starting from scratch
Quadrant IV:
Manage & maintain
Quadrant III:
Great bones, where
are the people?
Quadrant II:
Places to shop, no
reasons to stay
Retail Sales
Tenant Mix
Redevelopment Private Property
Redevelopment Public Space
Clean & Safe
Redevelopment Public Space
Tenant Mix
Redevelopment Private Property

Moving from Quadrant to Quadrant takes…
TIME,
RESOURCES,
ABILITY TO ADAPT, AND
ABILITY TO ACQUIRE NEW AREAS OF EXPERTISE

Quadrant I: Starting from scratch
Nicetown, Philadelphia, PA
Redevelopment Private Property
Redevelopment Public Space
Administrative Management
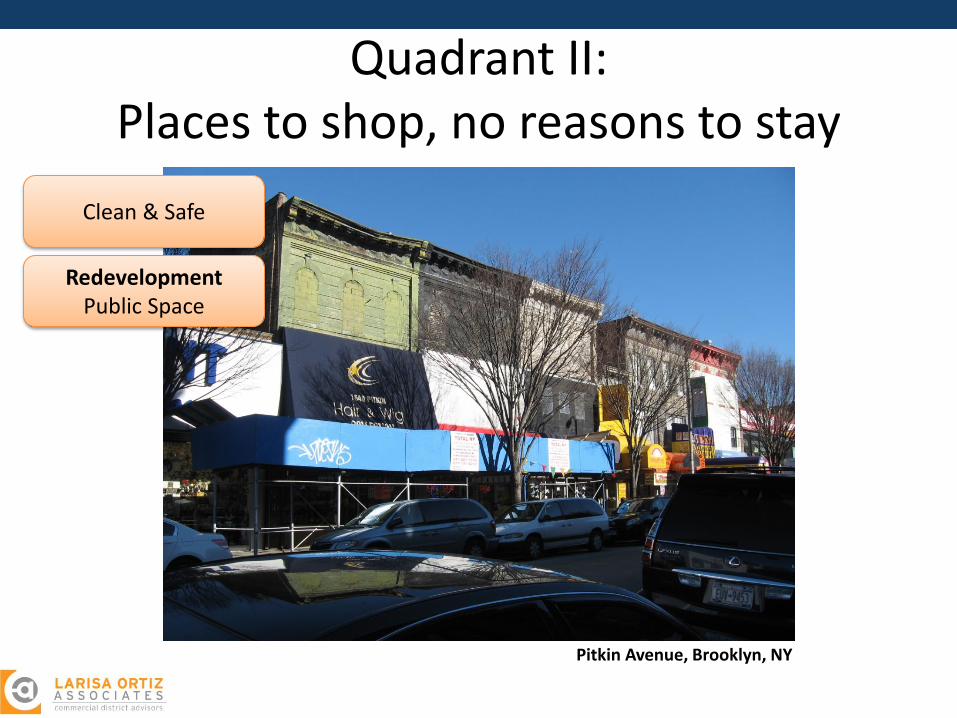
Quadrant II: Places to shop, no reasons to stay
Pitkin Avenue, Brooklyn, NY
Clean & Safe
Redevelopment Public Space

Quadrant III: Great bones, where are the people?
Uptown, Kingston, NY Administrative Management
Tenant Mix
Redevelopment Private Property

Quadrant IV: Manage & maintain
South Orange, NJ
Retail Sales
Tenant Mix
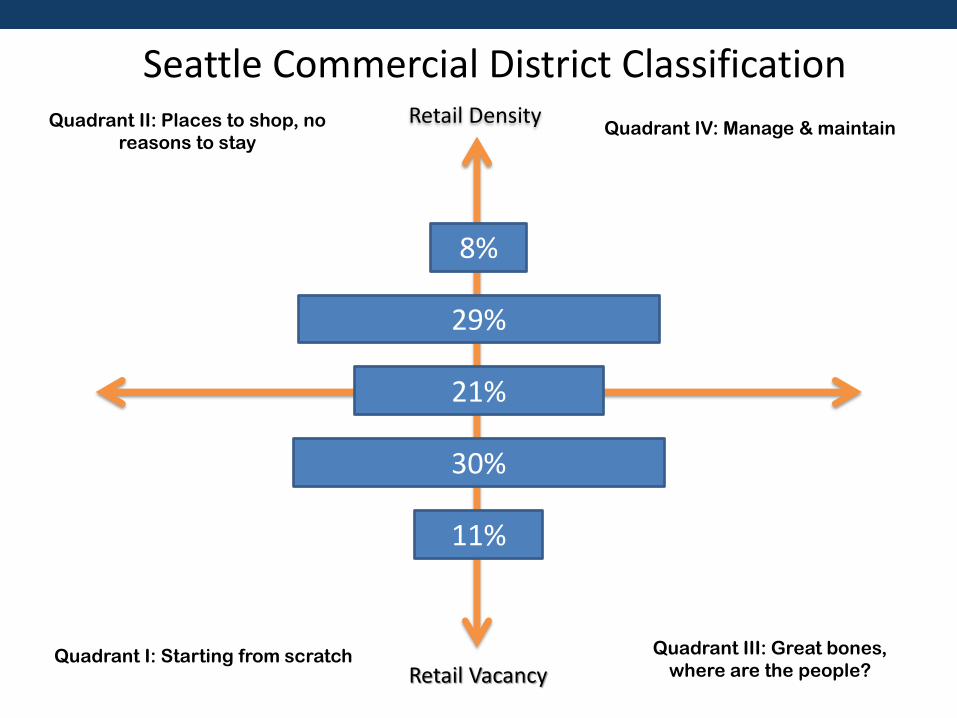
8%
21%
29%
11%
30%
Quadrant I: Starting from scratch
Quadrant II: Places to shop, no
reasons to stay
Quadrant III: Great bones,
where are the people?
Quadrant IV: Manage & maintain Retail Density
Retail Vacancy
Seattle Commercial District Classification
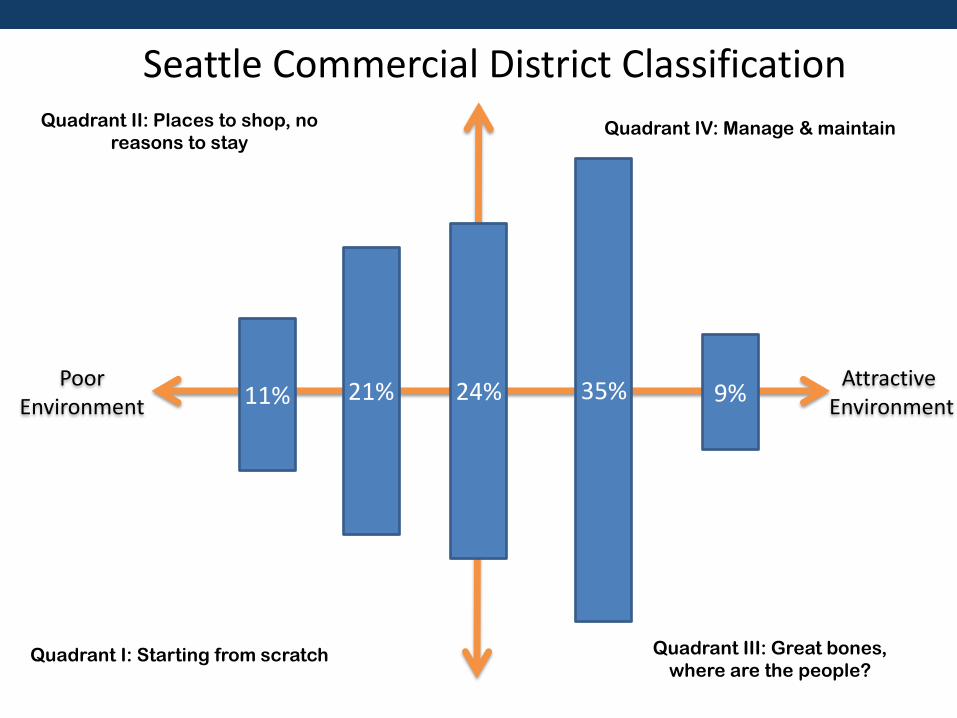
Quadrant I: Starting from scratch
Quadrant II: Places to shop, no
reasons to stay
Quadrant III: Great bones,
where are the people?
Quadrant IV: Manage & maintain
11% 21% 24% 35% 9% Poor
Environment Attractive
Environment
Seattle Commercial District Classification

Administrative Capacity
31%
12%
58%
Strong Moderate Weak
{
{
{
Seattle Commercial District Classification

Quadrant I: Starting from scratch
Quadrant II: Places to shop, no
reasons to stay
Quadrant III: Great bones,
where are the people?
Quadrant IV: Manage & maintain
Poor Environment
Attractive Environment
High Density
Low Density
First Hill
Beacon Hill
First Hill
First Hill
Fremont West Seattle Columbia City Wallingford Ballard Georgetown Roosevelt
Montlake
Roosevelt
Uptown/Lower Queen Anne
Washington State
= Lacks Admin Capacity
Participant Outcomes
Othello/Graham/MLK Lake City Rainier Beach West Seattle International District
Pioneer Square
Beacon Hill Othello/Graham/MLK

What’s your Classification? – Breakout Discussion
Identify a “recorder” and a “reporter”
• Discuss and list three major similarities between your districts
• Discuss and list three major differences between your districts
• Discuss your most successful activities – why were they successful
• Discuss your most unsuccessful activities – why were they unsuccessful
• Are there any similarities or trends with respect to the kinds of activities that are successful or not successful

The Basics of Interpreting and Using Market Data March 11, 2014
Prepared for the City of Seattle
Office of Economic Development
Learning objectives
1.Defining Trade Area
2.Understanding your District’s “Strategic Positioning”
3.Basic Market Leakage Analysis
4.Interpreting Data and Applying Analysis
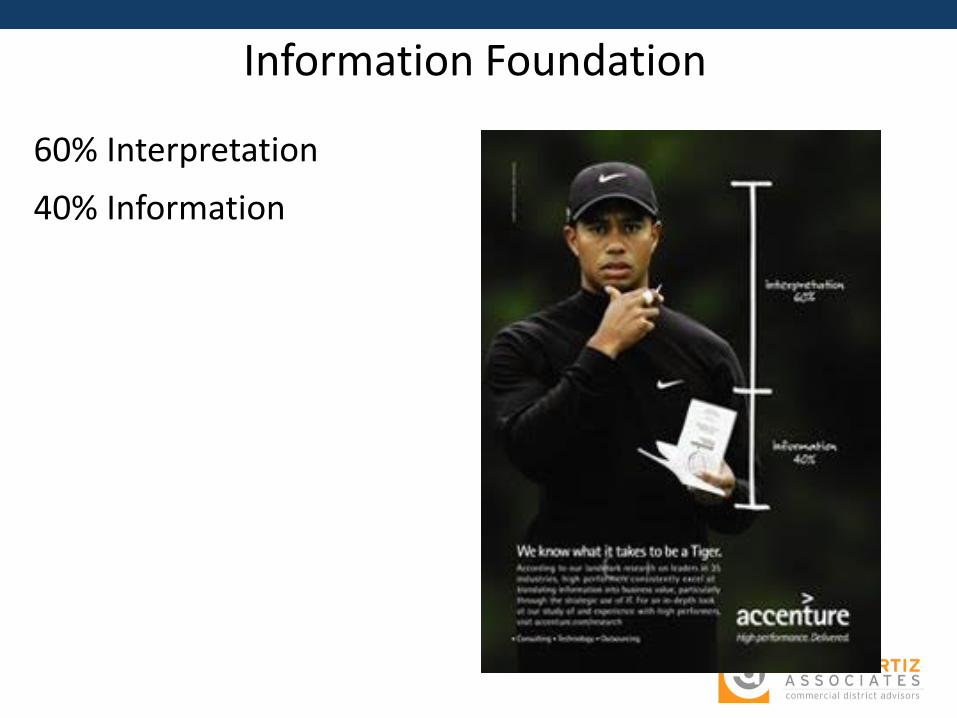
Information Foundation
60% Interpretation
40% Information

Trade Area
70%

Some thoughts on Trade Area
Primary trade area vs. secondary trade area The 1:4 ratio. Travel versus Time Expended. Districts with more shopping options typically have a
larger trade area. Why? People will travel farther for better selection and more options.
Different BUSINESSES have different trade areas. i.e Furniture versus grocery. Or destination restaurant versus local restaurant.
For a DISTRICT or SHOPPING CENTER, trade area size is typically defined by the anchor.
“Anchors” do not have to be retail stores.

Drugstore
Specialty Food Store
Department Store/Big Box Retail
Disneyworld
Convenience/Neighborhood – 5-10 min
Comparison/General – 15-30 min
Destination/Regional – 30 + min
Trade Area
International
1. Differs by retail category – but for a district it is typically defined by the anchor
2. Influenced by geography, natural and psychological boundaries
3. NOT defined by political boundaries

What is Strategic Positioning?
Trade Area Size Customer Profile Merchandise offerings Price point Lifestyle

Which best describes your commercial district?
Convenience Retail/Services – Neighborhood Center – Neighborhood Commercial District – Main Street – Necessity Retail – Convenience Retail
Comparison/General
– Main Street – Mix of Convenience and Specialty Retail
Destination Retail/Services
– Lifestyle Center – Entertainment Districts – Regional Center – Central Business District – Destination Retail
Elmora, Elizabeth, NJ
Pitkin Avenue, Brooklyn, NY
Strategic Positioning

Drugstore
Specialty Food Store
Department Store/Big Box Retail
Disneyworld
Convenience/Neighborhood – 5-10 min
Comparison/General – 15-30 min
Destination/Regional – 30 + min
What is your Trade Area?
International

Important caveats about the data you have in hand
The market data you have MAY NOT correspond with your district’s trade area. Therefore, today’s analysis MAY NOT be accurate for your district.
This is an exercise… this is only an exercise. It is not a substitute for proper market analysis.
If you need to re-pull data, you can do so for a nominal fee at Esri Business Analyst Online
There is no substitute for visiting the market.
Strategic Position defines Trade Area

11
Market Data: Secondary Sources Sources of Standard Market Data - Census
- Esri
- Claritas
Additional Market Data - Home Mortgage Disclosure Act
- New Housing Units
- Crime statistics
Esri Reports for Reference - Retail Marketplace Profile
- Demographic & Income Profile
- Retail Goods & Services
- Traffic Counts
- Business Summary

Shortcomings of Secondary Market Data - Census Undercount
- Income Underreporting
- Business Turnover
- Business Reporting
- Measures only residential demand
Market Data: Secondary Sources

How do we compensate for the failure of secondary sources?
Primary Market Data: Consumer Research Compensate for shortcomings of market data
Helps in profile non-residential customer
Identify non-demand related barriers to retail attraction and marketing
Market Data

14
Standard Sources of Consumer Data
- Consumer Surveys
- In-store
- Online (SurveyMonkey, Facebook)
- Focus Groups
- Employees
- Merchants
- Residents
- Merchant Surveys
Market Data: Primary Sources

15
Standard market analysis is typically based on secondary sources.
Primary market data can be expensive to collect and analyze.
Market Data

Market Analysis: Understanding Secondary Market Data
Demand Supply
$$
Question: If a new store
opens in the trade area,
how much of that leakage
can we reasonably
capture? This is called
“capture rate”

General Overview: Retail Marketplace Profile

Spot-check Number of Businesses
General Overview: Retail Marketplace Profile

General Overview: Retail Marketplace Profile

Workshop Exercise
How much additional square footage of new retail
can your district support in a particular retail category?
Which retail categories offer opportunities for growth and expansion
Where should you focus your efforts to improve you tenant mix?
What strategies can we use to build weak markets?

Workshop Exercise

Column A: Select a retail category • (for this exercise, select “Health + Personal Care ”)
Column A, B, C: Select Category and Determine Supply, Demand and Gap
Health + Personal Care Retail gap within .5 miles Heath + Personal Care Retail Gap within .5 miles = $3,719,740
Example: Othello/MLK
Exercise #1: Drug Store Sales Analysis
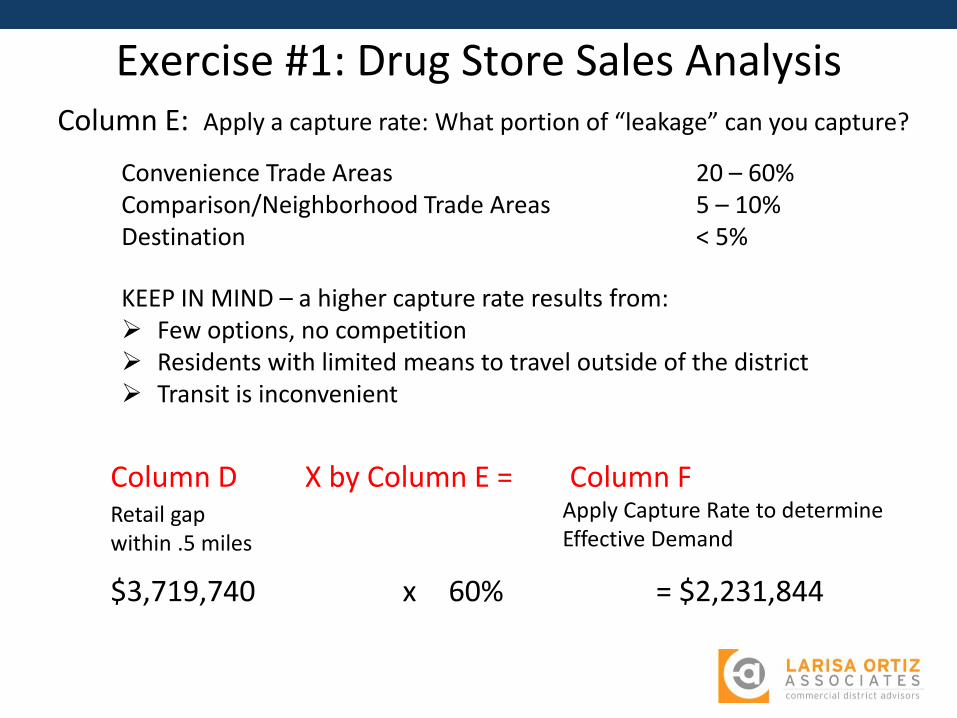
Retail gap within .5 miles
Column E: Apply a capture rate: What portion of “leakage” can you capture?
Convenience Trade Areas 20 – 60% Comparison/Neighborhood Trade Areas 5 – 10% Destination < 5%
Column D Column F Apply Capture Rate to determine Effective Demand
$3,719,740 x 60% = $2,231,844
KEEP IN MIND – a higher capture rate results from: Few options, no competition Residents with limited means to travel outside of the district Transit is inconvenient
Exercise #1: Drug Store Sales Analysis
X by Column E =
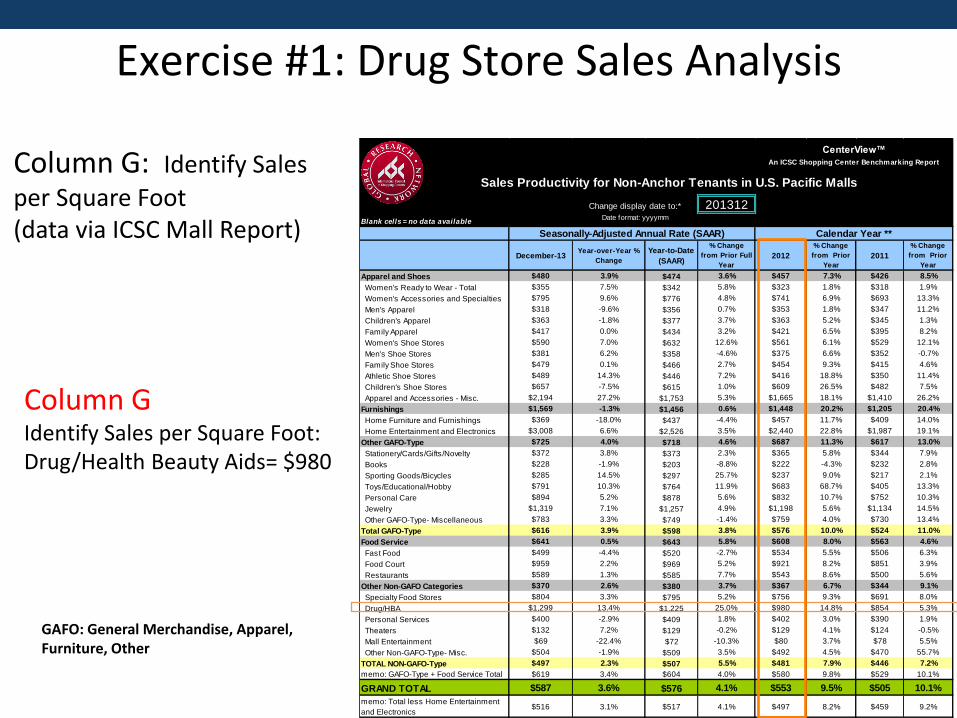
Column G: Identify Sales
per Square Foot (data via ICSC Mall Report)
Column G Identify Sales per Square Foot: Drug/Health Beauty Aids= $980
GAFO: General Merchandise, Apparel, Furniture, Other
201312
Blank cells = no data available
December-13Year-over-Year %
Change
Year-to-Date
(SAAR)
% Change
from Prior Full
Year
2012
% Change
from Prior
Year
2011
% Change
from Prior
Year
Apparel and Shoes $480 3.9% $474 3.6% $457 7.3% $426 8.5%
Women's Ready to Wear - Total $355 7.5% $342 5.8% $323 1.8% $318 1.9%
Women's Accessories and Specialties $795 9.6% $776 4.8% $741 6.9% $693 13.3%
Men's Apparel $318 -9.6% $356 0.7% $353 1.8% $347 11.2%
Children's Apparel $363 -1.8% $377 3.7% $363 5.2% $345 1.3%
Family Apparel $417 0.0% $434 3.2% $421 6.5% $395 8.2%
Women's Shoe Stores $590 7.0% $632 12.6% $561 6.1% $529 12.1%
Men's Shoe Stores $381 6.2% $358 -4.6% $375 6.6% $352 -0.7%
Family Shoe Stores $479 0.1% $466 2.7% $454 9.3% $415 4.6%
Athletic Shoe Stores $489 14.3% $446 7.2% $416 18.8% $350 11.4%
Children's Shoe Stores $657 -7.5% $615 1.0% $609 26.5% $482 7.5%
Apparel and Accessories - Misc. $2,194 27.2% $1,753 5.3% $1,665 18.1% $1,410 26.2%
Furnishings $1,569 -1.3% $1,456 0.6% $1,448 20.2% $1,205 20.4%
Home Furniture and Furnishings $369 -18.0% $437 -4.4% $457 11.7% $409 14.0%
Home Entertainment and Electronics $3,008 6.6% $2,526 3.5% $2,440 22.8% $1,987 19.1%
Other GAFO-Type $725 4.0% $718 4.6% $687 11.3% $617 13.0%
Stationery/Cards/Gifts/Novelty $372 3.8% $373 2.3% $365 5.8% $344 7.9%
Books $228 -1.9% $203 -8.8% $222 -4.3% $232 2.8%
Sporting Goods/Bicycles $285 14.5% $297 25.7% $237 9.0% $217 2.1%
Toys/Educational/Hobby $791 10.3% $764 11.9% $683 68.7% $405 13.3%
Personal Care $894 5.2% $878 5.6% $832 10.7% $752 10.3%
Jewelry $1,319 7.1% $1,257 4.9% $1,198 5.6% $1,134 14.5%
Other GAFO-Type- Miscellaneous $783 3.3% $749 -1.4% $759 4.0% $730 13.4%
Total GAFO-Type $616 3.9% $598 3.8% $576 10.0% $524 11.0%
Food Service $641 0.5% $643 5.8% $608 8.0% $563 4.6%
Fast Food $499 -4.4% $520 -2.7% $534 5.5% $506 6.3%
Food Court $959 2.2% $969 5.2% $921 8.2% $851 3.9%
Restaurants $589 1.3% $585 7.7% $543 8.6% $500 5.6%
Other Non-GAFO Categories $370 2.6% $380 3.7% $367 6.7% $344 9.1%
Specialty Food Stores $804 3.3% $795 5.2% $756 9.3% $691 8.0%
Drug/HBA $1,299 13.4% $1,225 25.0% $980 14.8% $854 5.3%
Personal Services $400 -2.9% $409 1.8% $402 3.0% $390 1.9%
Theaters $132 7.2% $129 -0.2% $129 4.1% $124 -0.5%
Mall Entertainment $69 -22.4% $72 -10.3% $80 3.7% $78 5.5%
Other Non-GAFO-Type- Misc. $504 -1.9% $509 3.5% $492 4.5% $470 55.7%
TOTAL NON-GAFO-Type $497 2.3% $507 5.5% $481 7.9% $446 7.2%
memo: GAFO-Type + Food Service Total $619 3.4% $604 4.0% $580 9.8% $529 10.1%
GRAND TOTAL $587 3.6% $576 4.1% $553 9.5% $505 10.1%
memo: Total less Home Entertainment
and Electronics$516 3.1% $517 4.1% $497 8.2% $459 9.2%
An ICSC Shopping Center Benchmarking Report
CenterView™
Calendar Year **Seasonally-Adjusted Annual Rate (SAAR)
Sales Productivity for Non-Anchor Tenants in U.S. Pacific Malls
Change display date to:*
Date format: yyyymm
Exercise #1: Drug Store Sales Analysis
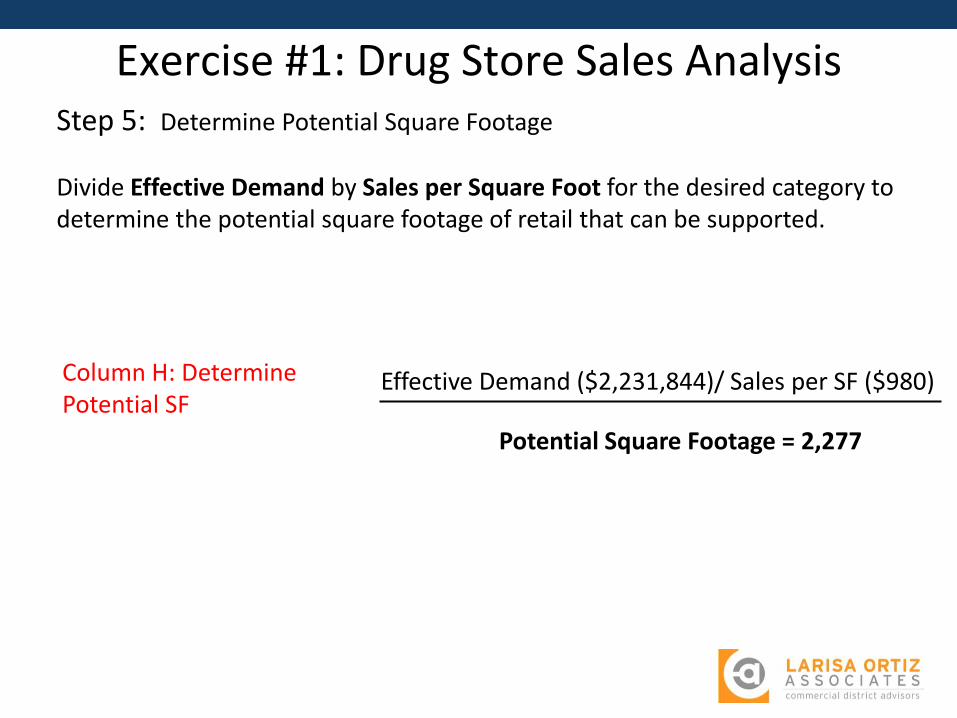
Step 5: Determine Potential Square Footage
Divide Effective Demand by Sales per Square Foot for the desired category to determine the potential square footage of retail that can be supported.
Exercise #1: Drug Store Sales Analysis
Effective Demand ($2,231,844)/ Sales per SF ($980) Column H: Determine Potential SF
Potential Square Footage = 2,277

• International Council of Shopping Centers Mall Report
• Dollars and Cents of Shopping Centers, ICSC (Used versions can be purchased at significant discount) – last version is 2008.
• Industry-specific trade associations (i.e. Food Marketing Institute)
• Local brokers
• Local retailers
• City sales data
• Google search
Resources for Sales Per Square Foot KEEP IN MIND ICSC Sales/SF data is based on primarily on suburban sites Finding local sales/SF is the most effective alternative Retailers do not like to share sales data

What does it all mean?
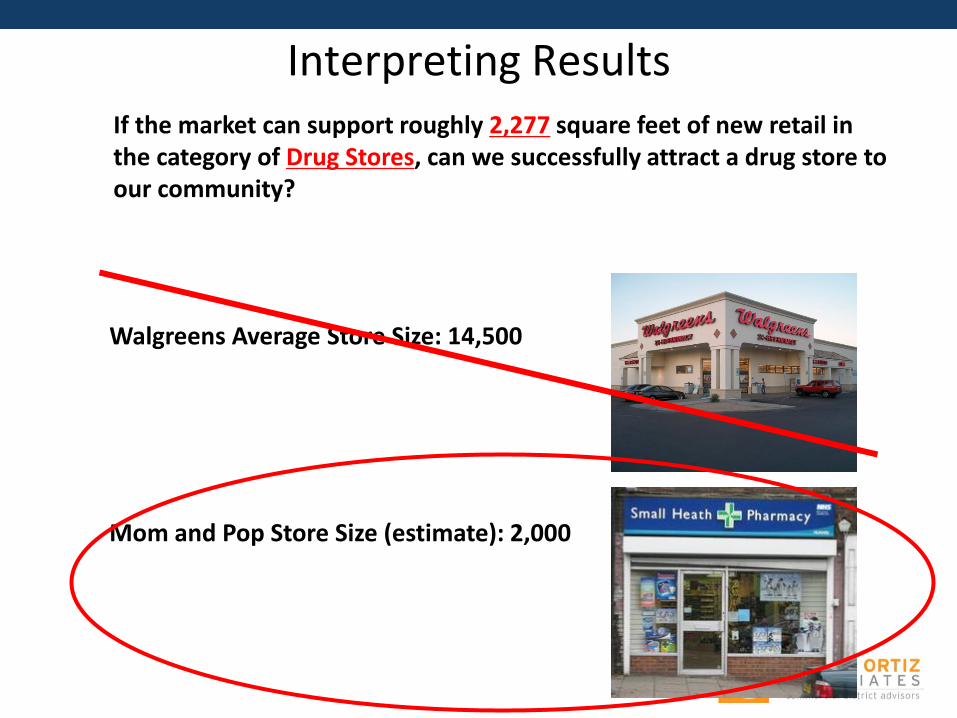
If the market can support roughly 2,277 square feet of new retail in the category of Drug Stores, can we successfully attract a drug store to our community?
Interpreting Results
Walgreens Average Store Size: 14,500
Mom and Pop Store Size (estimate): 2,000

Demand Supply Leakage
Capture
Rate*
Effective
Demand Sales PSF Potential
(Retail Potential) (Retail Sales) by Category SF
A B C D E F G H
NAICS CATEGORY Given Given B-C Given D*E Given F/G
Take 10 minutes and conduct this exercise for another retail category
Health + Personal Care $3,719,740
60% $2,231,844 $980 2,277 0 $3,719,740

• Do you have the space? • Do you have willing property owners?
• Business Expansion: Are there existing drug stores that can
improve their capture rate of existing retail leakage? • Business Attraction: Are existing drug stores servicing the
vicinity poorly? Is competition in the interest of the community?
• Is there opportunity within a larger trade area? • Look at another category
The Market Data say yes.
The Market Data say no.
The Market Data is not definitive.
Using Data to Define Strategy
Interpreting Results

Using the Data
• Attract more customers from your existing trade area (Mount Washington) – Improve “Tenant Mix” through Retail Attraction – Help Existing Businesses
• Improve Visibility/Access • Support Marketing/Promotion
– Address necessary Physical Improvements • Improve Cleanliness/Safety
– Grow the Market • Grow the trade area (add more shoppers by growing the primary
trade area) • Build density through development (add more shoppers to existing
trade area)

Using the Data: Develop a “Tenant Mix” Strategy
Develop a Retail Sales and Tenant Mix Strategy
• Springfield, Jacksonville, Fl
• Combined market data and consumer preference data to develop a “nodal” retail attraction strategy

• A Comprehensive Strategy for Improvements
• Lower Broadway, Newark, NJ
Potential grocery store site.
Five years of resources and staff time went
towards identifying and attracting a grocer to this
location
Using the Data: Recalibrate your Strategy
1 Mile Radius

Using the Data: Help Existing Merchants

Using the Data: Improve Visibility
Mt. Washington, Pittsburgh
• Challenge: – 1.5 million visitors annually
– Very few venture down Shiloh
Shiloh Street.
Curve in street reduced visibility
1.5 million visitors ride
incline annually

Using the Data: Improve Visibility Mt. Washington, Pittsburgh, PA
• Solution: Increase visibility through signage – Businesses were allocated $500 per sign
– Pedestrian counts increased by nearly 30%
– Business report increased sales
– A local business went from part time to full time hours
– Other businesses want to replicate signage

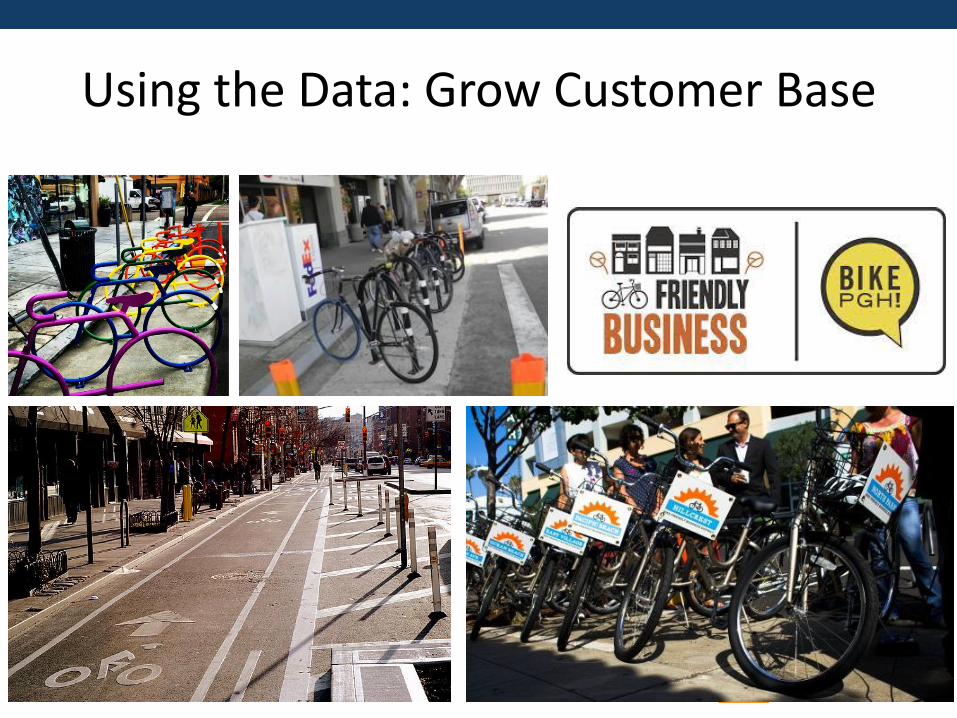
Using the Data: Grow Customer Base
• Improve access my multiple means of transportation
Jackson Heights, NY
Using the Data: Grow Customer Base

39
125th Street, Harlem, NY Map retailers, retail categories to match space configuration and availability.
Rezoning to encourage new development
Major Development Opportunities
Using the Data: Redevelopment
Opportunities for Independent Retail

Questions?
RETAIL
LEASING
Identifying and Attracting Appropriate Retailer & Developers
Instructor: Larisa Ortiz, Larisa Ortiz Associates, LLC
www.larisaortizassociates.com
www.commercialdistrictadvisor.com
Twitter: @cdadvisor

RETAIL
LEASING
INTRODUCTION
About you
urban vs. suburban?
upper-income vs. middle-income vs. lower income
years of experience
retail attraction (multi-site)
previous experience with retail attraction?

RETAIL
LEASING
Why does tenant mix matter?
There must be a reason why you are here…

RETAIL
LEASING
COURSE AGENDA
1. Develop a Strategy for Retail Attraction
2. Get “Retail Ready” – Addressing barriers to retail attraction
3. Know your Retailer
4. Turn Plans into Action – examples of successful retail attraction

RETAIL
LEASING
1. DEVELOP A STRATEGY

RETAIL
LEASING
How do we define “success”?
• Shopper choice • Retail sales • Property values
Source: Econsult , “A Strategic In vestment Framework for Philadelphia”, 2009

RETAIL
LEASING
What makes a successful commercial district?
– Density of retail
– Tenant mix
– Convenience (parking and transit accessibility)
– Condition of the physical environment

RETAIL
LEASING
Density of Retail
• The ability of a shopper to visit multiple stores in the same area
• Corridors with more stores out-perform lower density corridors and have a consistently positive impact on real estate values and retail sales
• Commercial districts with more offerings typically draw customers from a larger geographic area

RETAIL
LEASING
Density of Retail Impact Trade Area
U.S. Shopping Center Classifications
Center Type Average SF Typical # of Tenants
Trade Area Size
Travel Time
Regional Mall 400k – 800k 40-80 5 – 25 miles ≤ 30 min
Community Center
125k – 400k 15 – 40 5 – 15 miles ≤ 20 min
Neighborhood Center
30k – 125k 5 – 20 3 miles ≤ 10 min
Strip/Convenience
< 30k NA < 1 mile ~ 5 min
Size and location impact the relative distance a customer would be willing to travel
Source: International Council of Shopping Centers
RETAIL
LEASING
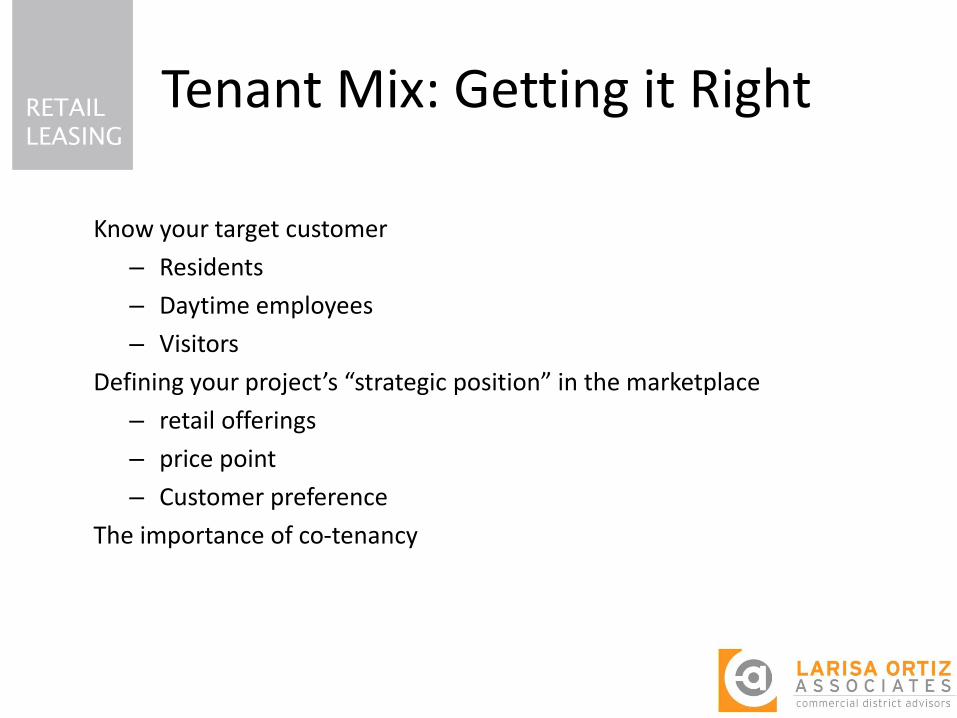
Know your target customer
– Residents
– Daytime employees
– Visitors
Defining your project’s “strategic position” in the marketplace
– retail offerings
– price point
– Customer preference
The importance of co-tenancy
Tenant Mix: Getting it Right

RETAIL
LEASING
Strategic Positioning
TJ Maxx
Brooklyn
Industries
Macy’s
Retailer Price Point and
relative Income Benchmarks.
Dollar Store
Talbots
Blink Gym
LOA Strategic Positioning Matrix
Mapping your District’s Business Mix

RETAIL
LEASING
Strategic positioning in action
Rego Park Center, Queens, NY

RETAIL
LEASING
Co-tenancy
• Retailers like to be grouped with retailers who are attracting the same customer
• Competitive retailers like to be near one another to give customers opportunities to comparison shop (apparel, jewelry, shoes, etc.)
• Some retailers include co-tenancy provisions in their leases – Co-tenancy provisions give retail tenants the right to pay reduced
rent or to terminate their leases, or both, if other specific tenants or a percentage of tenants do not open or if they leave a shopping center.

RETAIL
LEASING
Retail Clusters
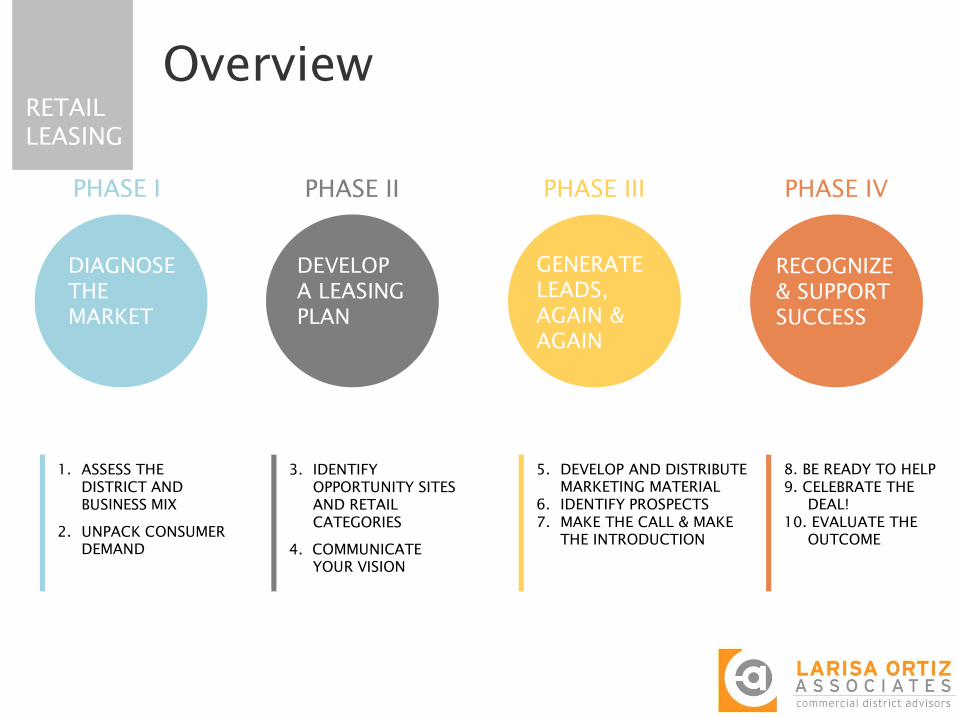
Overview
RETAIL
LEASING
PHASE I
DIAGNOSE
THE
MARKET
PHASE II
DEVELOP
A LEASING
PLAN
PHASE III
GENERATE
LEADS,
AGAIN &
AGAIN
PHASE IV
RECOGNIZE
& SUPPORT
SUCCESS
1. ASSESS THE
DISTRICT AND
BUSINESS MIX
2. UNPACK CONSUMER
DEMAND
3. IDENTIFY
OPPORTUNITY SITES
AND RETAIL
CATEGORIES
4. COMMUNICATE
YOUR VISION
5. DEVELOP AND DISTRIBUTE
MARKETING MATERIAL
6. IDENTIFY PROSPECTS
7. MAKE THE CALL & MAKE
THE INTRODUCTION
8. BE READY TO HELP
9. CELEBRATE THE
DEAL!
10. EVALUATE THE
OUTCOME

The Process
RETAIL
LEASING
PHASE I
DIAGNOSE
THE
MARKET
Walk your district and observe the existing retail mix
Assess the physical shopping environment
Identify your traffic generators
Talk to those in the know
STEP 1: ASSESS THE DISTRICT AND BUSINESS MIX

The Process
RETAIL
LEASING
PHASE I
DIAGNOSE
THE
MARKET
STEP 2: UNPACK CONSUMER DEMAND DYNAMICS
Determine trade area
Estimate leakage by category (leakage refers to
retail sales lost by a community to businesses
outside of trade area)
Consumer profile data (i.e. psychographics)

RETAIL
LEASING
PHASE II
DEVELOP
A LEASING
PLAN
TJ Maxx
Brooklyn
Industries
Macy’s
Retailer Price Point and
relative Income Benchmarks.
Dollar Store
Talbots
Blink Gym
• What is “Strategic
Positioning”?
LOA Strategic Positioning Matrix
Mapping your District’s Business Mix

The Process
RETAIL
LEASING
PHASE II
DEVELOP
A LEASING
PLAN
1. Map your Businesses
LOA Strategic Positioning Matrix
Mapping your District’s Business Mix
TJ Maxx
Brooklyn
Industries
Macy’s
Retailer Price Point and
relative Income Benchmarks.
Dollar Store
Talbots
Blink Gym

RETAIL
LEASING
PHASE II
DEVELOP
A LEASING
PLAN
Develop an opportunity site inventory
STEP 3: IDENTIFY SITES & RETAIL CATEGORIES
Lease expiration dates
Owner expectations – lease rates, uses
Owner interest - don’t engage if an owner is recalcitrant to
share information.
Typically you do not want to go to a retailer without some
assurance that you have a viable site

RETAIL
LEASING
PHASE II
DEVELOP
A LEASING
PLAN
Property Owner Engagement
Opportunity Site Identification
Identify requirements
Engage early through market
research
Communicate your strategy
Move on if recalcitrant
Don’t give up. Revisit after
successful execution
Request formal commitment
before expending
time/resources

RETAIL
LEASING
PHASE II
DEVELOP
A LEASING
PLAN
STEP 3: IDENTIFY SITES & RETAIL CATEGORIES
Identify Retail Categories to Target
Consumer demand
Community preference
Size and configuration of opportunity sites

RETAIL
LEASING
PHASE II
DEVELOP
A LEASING
PLAN
Make the commercial real estate community aware of your
targeted retail approach
STEP 4: COMMUNICATE YOUR VISION
Share your findings and vision with the stakeholders
Become a vehicle connections
• monthly real estate alerts (vacancies, new business openings,
businesses for sale, business testimonials

RETAIL
LEASING
PHASE III
GENERATE
LEADS,
AGAIN &
AGAIN
STEP 5: DEVELOP AND DISTRIBUTE MARKETING MATERIAL
Map of the district that clearly identifies major activity generators
Information about any incentives or resources for retail
Testimonials from merchants
Sales figures for your district

RETAIL
LEASING
PHASE III
GENERATE
LEADS,
AGAIN &
AGAIN
STEP 6: IDENTIFY PROSPECTS
Seek Out Prospects. National vs. Regional Independents
- Trade shows vs. brokers vs. good ‘ole shoe leather
Network, shop, and advertise
Get creative!
Keep a Prospect Database

RETAIL
LEASING
PHASE III
GENERATE
LEADS,
AGAIN &
AGAIN
PROSPECT DATABASE
Keep a Prospect Database
• Business Contact Information
• Broker Contact Information
• Lifestyle/Price point
• Square Footage Needed
• Desired Rent
• Other locations
• Strength of prospect (hot/warm/cold)
- Keep track of when to follow up
- Be persistent

RETAIL
LEASING
PHASE III
GENERATE
LEADS,
AGAIN &
AGAIN
STEP 7: MAKE THE CALL
Conduct Prospect Outreach
Invite prospects on a Choreographed Tour of your District

RETAIL
LEASING
PHASE III
GENERATE
LEADS,
AGAIN &
AGAIN
STEP 8: BE READY TO HELP
Play the mediator to negotiations , don’t be the broker (unless
you have to)
Be prepared with resources that will help tenants in
their interactions with the landlord
Don’t be discouraged, getting to “yes” can mean
hearing “no” multiple times

RETAIL
LEASING
RECOGNIZE
& MEASURE
SUCCESS
PHASE IV STEP 9: CELEBRATE THE DEAL!
A grand opening is an exciting recognition
Best way to build credibility, engage more property
owners, and attract more retail
Issue press release, invite local leaders, cut that
bright red ribbon

RETAIL
LEASING
RECOGNIZE
& MEASURE
SUCCESS
PHASE IV

RETAIL
LEASING
RECOGNIZE
& MEASURE
SUCCESS
PHASE IV STEP 10: TRACK PROGRESS, AND THEN KEEP GOING
Have a system in place to measure success as well as failure
Sharing your success will provide your organization with
valuable recognition
Rinse, wash, and repeat!
RETAIL
LEASING
2. GET “RETAIL READY”

RETAIL
LEASING
Lessons Learned: What role can you play?
• The good and bad news…. – 30/70 rule
– There is no silver bullet
• Retailers have varied approaches to site selection, get acquainted with site selection criteria for the categories you plan to pursue
– Urban communities still confound.
– Physical constraints matter (though less so where there is density)
• Access/Parking
• Visibility
• Retail density and a reliance on individual property owners participation

RETAIL
LEASING
Setting the Stage: Clean and Safe
P. 34
Source: John Skinner, Verde Group/ ICSC Global Research Network
Summary of Strategies

RETAIL
LEASING
Setting the Stage: Clean and Safe
P. 35
Source: John Skinner, Verde Group/ ICSC Global Research Network
Summary of Strategies
RETAIL
LEASING
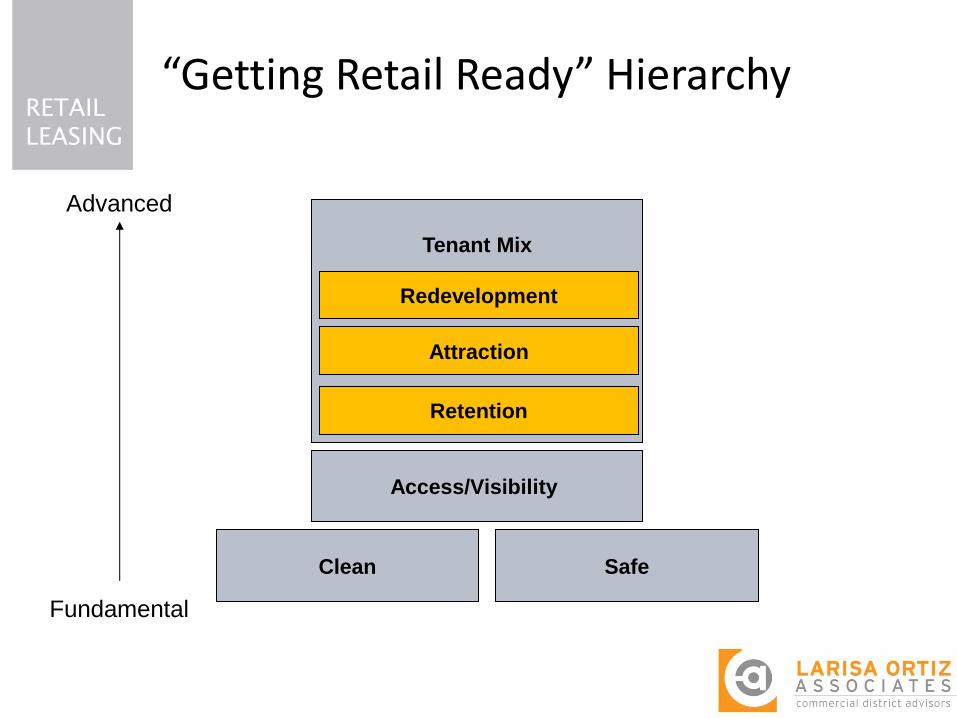
“Getting Retail Ready” Hierarchy
P. 36
Tenant Mix
Safe Clean
Access/Visibility
Attraction
Retention
Fundamental
Advanced
Summary of Strategies
Redevelopment

RETAIL
LEASING
3. KNOW YOUR MARKET

RETAIL
LEASING
What indicators matter to retailers?
Generally…
– Median Household Income (not average)
– Total number of households

RETAIL
LEASING
Specifically…
Source: ICSC, Social Compact, “Inside Site Selection.
Retailers’ search for strategic business locations”, 2008
Site Selection Indicators
1. Average Household Size
2. Average Income
3. Competition (presence, type, location)
4. Crime
5. Daytime Population
6. Educational Attainment
7. Ethnic Composition
8. Homeownership
9. Home Sales Values
10. Income Change
11. Major Employers in the Area
12. Median Income
13. Neighborhood Orientation
14. Number of Households
15. Pedestrian Traffic
16. Population Change
17. Population Size
18. Visibility
What indicators matter to retailers?

RETAIL
LEASING
Industry Research
Characteristics Duane-Reade CVS Walgreens
Trade Area Size 3-5 miles
Trade Area Population 25,000 18,000 20,000
Store Size SF 12,900 (96 x 137) 14,560sf (112 x 130)
Site Preferences High visibility, high traffic count Signalized intersection with heavy traffic count
Parking Requirements 75-80 cars 70+ cars
DRUGSTORE
GROCERY STORE

RETAIL
LEASING
What indicators matter to retailers?
Specialized retailers rely on additional indicators…

RETAIL
LEASING
Do you have the
right kind of
space?
Do you have the enough
of the “right” residents?

RETAIL
LEASING
Do your homework before making the pitch…
• Tenant Specific Research
– Do you have the right people? • Einstein Bros. Bagels 70% some college education
• Mandee’s trendy young women with mod/low incomes
– Do you have enough pedestrian traffic? • Auntie Anne’s 30 pp. every 5 minutes during off-peak
– Do you have the right space?
• CB2 6,000 – 9,000 sf stores targeting young professionals
• Pinkberry 600 – 1,600 sf

RETAIL
LEASING
Prospect Research
Where do you find tenant specific information?
– Websites
– Tradeshows
– Brokers/Leasing Agents
– Regional Real Estate Reps
– Networking
– Industry publications
• Shopping Centers Today
• Retail Traffic
• Reference USA (sales psf)
44

RETAIL
LEASING
Data retailers want but struggle to get…
• Generally includes data NOT captured by the census
• Short-term change at the neighborhood level (one year, two years, five years) – Retailers unaware of new data sets, notably the Home Mortgage
Disclosure Act (HMDA)
• Daytime population information
• Visitor population information
• Pedestrian traffic counts
• Detailed ethnic composition (i.e. Latino market)
Hint, Hint. This is where you come in….
RETAIL
LEASING
Barriers to Retail Development
• Land availability
• Market demand to support a particular business
• Evidence of that market demand

RETAIL
LEASING
What can economic development professionals do?
• Do your homework. Know the retailers perspective.
• Offer information on future neighborhood change, i.e. development plans, new housing
• Demonstrate a commitment and willingness to overcome obstacles, i.e. licensing, permitting, incentives, etc.
• Stir up the competitive juices
Harvey Gutman, Brookside Advisors
ICSC , “Inside Site Selection”

RETAIL
LEASING
Offer evidence of market demand
• Marketing Material – they will do their own research. So don’t stress too much about this.
• Sometimes its about getting on their radar
• Site Visit
RETAIL
LEASING
4. TURN PLANS INTO ACTION

RETAIL
LEASING
Downtown Brooklyn. Nightlife.

RETAIL
LEASING
South Bronx. Aspirational Staging
Vacancy: Before
RETAIL
LEASING
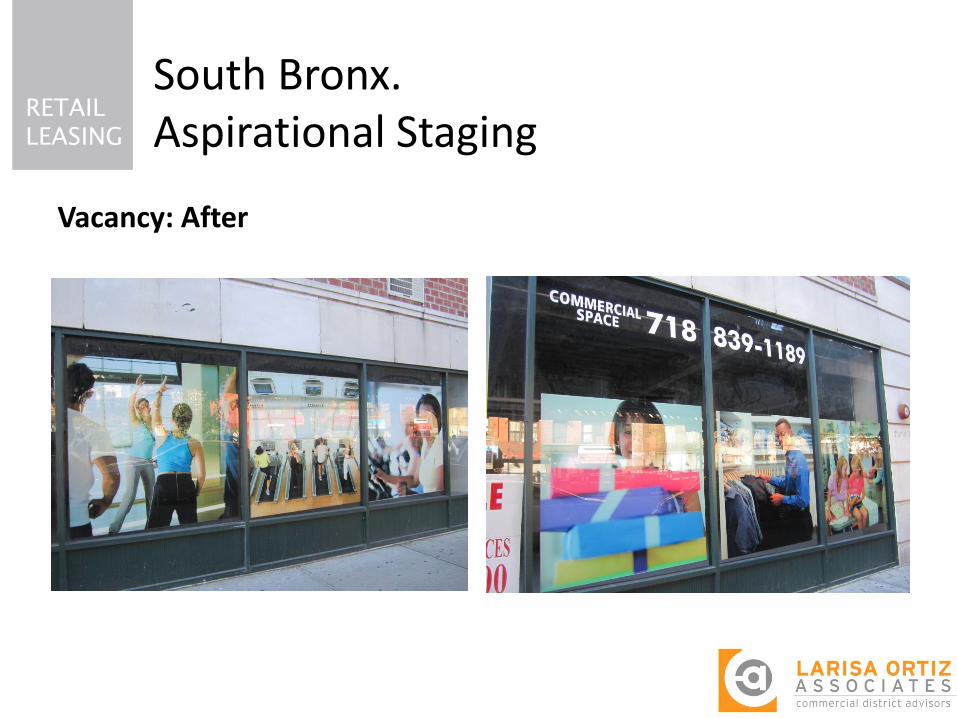
South Bronx. Aspirational Staging
Vacancy: After

RETAIL
LEASING
Woonsocket, RI. Main Street Open House

RETAIL
LEASING
Bed-Stuy Social Media
It takes a team… Grand Opening!

RETAIL
LEASING
Parting Words
• Retail attraction efforts are not a “quick fix”
• Relationships are key to successful leasing
• Engage your board and local residents to serve as district ambassadors
• Don’t get discouraged – there may be many “no’s” before a “yes”

RETAIL
LEASING
THANK YOU!
Larisa Ortiz
718-205-5116
Twitter: @cdadvisor
Facebook: Commercial District Advisor
Blog: www.commercialdistrictadvisor.com