laser-aided tomography: a tool for … · crushed optical glass are heaped in a water ......
TRANSCRIPT

See discussions, stats, and author profiles for this publication at: https://www.researchgate.net/publication/270434023
Laser-aided tomography: A tool for visualization of changes in the
fabric of granular assemblage
Article · October 1992
DOI: 10.2208/jscej.1992.455_25
CITATIONS
36
4 authors, including:
Some of the authors of this publication are also working on these related projects:
seismic risk assessment of urban areas View project
Japan Railway (JR) Shinkansen Bridge Project View project
Kazuo Konagai
Yokohama National University
125 PUBLICATIONS 860 CITATIONS
SEE PROFILE
Peter Rangelow
AREVA
4 PUBLICATIONS 36 CITATIONS
SEE PROFILE
Takashi Matsushima
University of Tsukuba
76 PUBLICATIONS 789 CITATIONS
SEE PROFILE
All content following this page was uploaded by Takashi Matsushima on 10 June 2016.
The user has requested enhancement of the downloaded file.
Structural Eng. Earthquake Eng. Vol. 9, No. 3, 193s-201s, October 1992 Japan Society of Civil Engineers (Proc. of JSCE No. 455/ 1-21)
LASER-AIDED TOMOGRAPHY: A TOOL FOR
VISUALIZATION OF CHANGES IN THE FABRIC OF GRANULAR ASSEMBLAGE
Kazuo KONAGAI1, Choshico TAMURA*1, Peter RANGELOW *** and Takashi MATSSHIMA***
A new experimental technique to visualize the dynamic behavior of particle assemblage is developed. According to the proposed method, a granular structure model, made of
particles of crushed glass and immersed in liquid with the same refractive index, consequently becomes invisible. An intense laser-light "sheet" (LLS) is then passed through it, illuminating the contour lines of all the particles within a cross-section. Scanning the model with LLS allows a 3D image of every discrete particle's shape and motion to be obtained as well as the whole-field deformation of the model. Keywords: visualization, dynamic behavior, granular structure.
1. INTRODUCTION
Model experiments are a common and powerful tool
for the study of the dynamic behavior and stability of
such granular underwater structures as rockfill dams,
artificial islands made of gravel and sand, the masonry
foundations of offshore and near-shore structures and
so on. Though they provide us with important findings
about the dynamic failure mechanism through sensors
placed within a three-dimensional model, it is not easy to get a clear whole-field image of the deformation,
because the discrete particles that make up those
structures are not strongly bonded, and thus, never
behave like a continuous medium.
Visualization techniques help to overcome this
problem and there are several methods available at
present. These include the "x-ray technique" and the "immersion method". The former is a technique to take
x-ray photographs of a soil model within which lead
bullets are buried as targetsl. According to this
method, not only the bullets but also a change of density in the model material can be visualized
through x-rays. Thus, it is possible to observe vague
shade associated with dilatation and shear band
formation. Since this technique yields only two-
dimensional information, photographs taken from different angles are necessary in order to obtain three-
dimensional deformation images. As this process is
tedious, a computer is often utilized as an aid to
analyze the graphic data (Computed Tomography). The "immersion method" is another powerful
technique. According to this method, a model made of
glass particles is immersed in a liquid with the same refractive index, thus becoming transparent. Opaque or
colored particles are placed in the model and serve as markers. The motion of the markers is observed. The "immersion technique", originally and independently
developed by Wakabayashi, T. 4, and by Dantu p5) in
the first half of 1950's, is well-known in the field of
photo-elasticity and many researchers such as Allersma, H. G. B. 2, Ura T., 3 have used and improved it since then.
Though these methods are useful in observing the
whole-field of a model, they provide only two-
dimensional stress information or the motion of the markers, which is usually not enough to define the
changes in the particle assemblage perfectly.
Konagai and Tamura have developed a new
Member of JSCE, Dr. Eng., Associate Professor, institute of industrial Science, University of Tokyo,
(7-22-1, Roppongi, Minato-ku, Tokyo 106, JAPAN).
# Member of JSCE, Dr. Eng. Professor, College of
Industrial Technology, Nihon University,
(Izumichou 1-2-1, Narashino City, Chiba 275, JAPAN).
# Member of JSCE, M. S., Graduate Student, Institute of
Industrial Science, University of Tokyo, (7-22-1, Roppongi, Minato-ku, Tokyo 106, JAPAN).
25 (I93s)

LASER-AIDED TOMOGRAPHY: A TOOL FOR VISUALIZATION OF CHANGES IN THE FABRIC OF GRANULAR ASSEMBLAGE/KONAGAI TAMURA RANGELOW MATSUSHIMA
experimental method; Laser-Aided Tomography
(LAT), which enables the visualization of all particles interlocking one another in a three-dimensional model68. The first half of this paper describes in detail the proposed method and its application with reducing the grain size. The latter half describes some findings on the failure process of embankment-shaped models made in the course of performed LAT experiments.
2. PROPOSED METHOD
According to the proposed method, particles of crushed optical glass are heaped in a water tank full of liquid. Consequently, the model becomes invisible because the liquid's refractive index has been tuned to that of the glass material. An intense laser-light sheet (LLS) which is then passed through the model
illuminates the contours of all particles within the "cut"cross-section because the chemically active fracture surfaces of the grains change their optical properties slightly in comparison to their pre-crushing state
(Fig. 1). The liquid should fulfill some basic requirements in order to be used in the experiments. It should be: (1) colorless; (2) transparent; (3) of low volatility and (4) of low viscosity, i. e. it is eligible for dynamic experiments where a large Reynold s number is required. The authors used a mixture of turpentine and tetralin oils. Table I provides information about some index
properties of the two solvents. Since the refractive index of the optical glass (BK-7) used in our experiment lies within the range formed by the two solvents' indices, it is possible to tune the refractive
index of the mixture to that of glass. The refractive
index of the mixture is governed by the Clausius-
Mosotti's formula:
(1)
where n, p =refractive index and density of the mixture,
n1, p1=refractive index and density of turpentine oil, n2, p2=refractive index and density of tetralin oil, c=percentage of tetralin content.
The refractive index can also be tuned by altering the liquid's temperature because both density and refractive index vary with temperature as shown in Figs. 2 and 3. The average rate of change of the refractive index with respect to temperature in the interval from 20C to 30C is about -0. 00028/deg for green laser light
(wavelength=14.5nm). Thus, the simplest way to fine-tune the refractive index is with temperature control. However, this process leads to volatilization of
pinene oil which is the major ingredient of turpentine oil. Thus, turpentine oil must be added occasionally to the mixture. As already mentioned above, the refractive index of the glass should lie between those of the two solvents. There are many kinds of glass commercially available. Among the optical glasses, BK-7 is one of the most inexpensive. Its refractive index is 1. 5194 for monochromatic laser light with a wavelength of 514. 5 nm. Strip blocks of the glass were broken into particles by a jaw-crusher. Two kinds of marks are seen on the
grains fracture surface; "rib marks" and "hackle marksi9. Dense curved lines running in the transverse
Fig. 1 Visualization method.
Table. I Properties of turpentine & tetralin oils.
26 (194s)

Structural Eng. Earthquake Eng. Vol. 9, No. 3, 193s-201s, October 1992 Japan Society of Civil Engineers (Proc. of JSCE No. 455/I-21)
direction of fracture travel are called "rib marks". They
give a shell-like luster on fracture surfaces. "Hackle
marks" appear as radial lines showing the direction of
fracture travel. Fig. 4 is a microphotograph of the
hackle marks on the fracture surface of BK-7. These
marks are traces of an intense strain induced at the
exact time of fracture. Residual strain will be another
cause of slight change in the optical properties of the
surface.
The refractive indices of both the glass and the liquid
vary with color as shown in Fig. 5. The curve showing
the refractive index variation of the glass does not fit
into the liquid one. Thus, monochromatic light must be
used in the proposed method in order to avoid color
dispersion. An Argon laser of 4 W-power type is used
in the experiments. It is possible to emit several types
Fig. 2 Variation of specific gravity of solvents with
temperature.
Fig. 3 Variation of refractive index of solvents with
temperature.
Fig. 4 Hackle Marks on a surface of BK-7
(Magnification:100).
Fig. 5 Variation of refractive index with wave length.
O Tetralin Turpentine oil
(23. 3c) o BK 1
Fig. 6 Step function generator.
27095s)

LASER-AIDED TOMOGRAPHY: A TOOL FOR VISUALIZATION OF CHANGES IN THE FABRIC OF GRANULAR ASSEMBLAGE/KONAGAI TAMURA RANGELOW MATSUSHIMA
of monochromatic light simply by adjusting the angle of the built-in prism. Green light of 514. 5 nm is used
in the experiments because it is the most intense and
can reach a power of 1. 7 W.
High-speed scanning and exact positioning of the laser-light "sheet" (LLS) is an essential part of the
technique which enables us to observe the three-
dimensional shape and motion of an arbitrarily chosen
particle within a model. A high-speed framing camera is a powerful tool to record any sudden change in the
structural configuration. The authors devised an instrument for scanning the model with LLS in unison
with high-speed framing. Fig. 6 shows the schematic
wiring diagram of this instrument. A disk shutter with
a slit revolves in the camera. The disk has a small mirror on it. A reflecting photo-interrupter is set close
to this disk shutter, and consequently, generates pulses,
the number of which coincides with the number of
frame advances. Thus, counting the pulses by a digital
counter and converting the number into an analogue voltage, a step function is obtained with which a
galvanic mirror is rotated to scan the model with the laser-light "sheet". This voltage, increasing step by
step, is compared with the reference voltage V, f, and the counter is reset when the stepped-up voltage
exceeds V. f. Thus, we can change the number of cross
sections only by changing the reference voltage. Fig. 7
is a photograph taken with an ordinary reflex camera.
The picture shows a cross section of an embankment model with a cylinder in it. The model is scanned with
LLS at intervals of 2 mm by means of this instrument
(200 frames/s). Three cross-sections are photographed and superimposed on one film frame. We can observe
the spacial variation of the grain shape of all particles
on the LLS.
Fig. 8(a) shows a model of a rock mound made of
fairly coarse particles set in the water tank. An expanded aluminum plate (very porous), whose rough
surface enhances frictional resistance, underlies the
model. The height and slope of this model are 20 cm
and 1:1. 5, respectively. After filling the tank with the liquid, three different cross sections A, B and C on
Fig. 8(a) are photographed (Fig. 8 (b), (c) and (d)). The
shapes of all particles on the LLS are clearly seen in
these prints. There are some particles whose contours
are not in contact with the others. It goes without
saying that the points where there is contact are out of the LLS plane.
Fig. 7 Overlapped cross-sections or emnankment
model.
Fig. 8, a Embankment model.
Fig. 8, b Cross-section A.
Fig. 8, c Cross-section B.
Fig. 8, d Cross-section C.
Fig. 8 Cross-section of embankment.
28 (r96s)

Structural Eng. Earthquake Eng. Vol. 9, No. 3, 193s-201s, October 1992 Japan Society of Civil Engineers (Proc. of JSCE No. 455/1-21)
3. VISUALIZATION OF DEFORMATION
OF FINER PARTICLE ASSEMBLAGE
Utilizing this method for smaller particle sizes will
expand its application to analyses of structures made
up of finer grains such as sand. However, the finer the
glass particles are, the more difficult it is to obtain a clear picture of the cross-section. Glass beads with
various sizes are commercially available. However,
since they are made by dripping melted glass into cold
water, they contain entrapped air bubbles and their surfaces are optically deteriorated. Consequently, they
can not be used in the proposed method, and crushing
glass blocks is, at present, the only sure way to obtain fairly high-quality, fine particles. The glass, BK-7 used in the experiments, is not so brittle as tempered
glass. Thus it is liable to break into thin sharp-pointed
pieces, and sometimes, cracks are observed in the
grain's interior. These cracks are hardly permeated by the liquid, and air remains in them. This leads to a
serious reduction of transparency of a grain assemblage. Thus, an increase of crushing power
improves their optical quality10. Based on empirical
knowledge gained, we were able to reduce the grain
size of the employed glass material to 1 mm or smaller in our experiments. Fig. 9 shows the particle-size
accumulation curve for the crushed glass together with
those for Silver Leighton Buzzard (SLB)11) and
Toyoura sand11. Fig. 10 shows a micrograph of the
glass grains at a magnification of 10 times. They are angular in shape. After close examination, one can
again find the "rib marks" and "hackle marks" even on
these small surfaces. It goes without saying that the
grain shape and the surface roughness greatly affect the mechanical properties of the grain assemblage. Table 2 provides information about some index properties of
the above mentioned materials. The glass material
shows relatively high values of minimum and
maximum void ratios.
Glass particles whose properties are cited in Figs. 9, 10 and Table II and which serve as a model for
surface deposit, were submerged in a water tank
(W390xD140xH150) containing a mixture of tetralin and turpentine oils. The deposit consists of 7 layers.
They were heaped one upon another to a total depth of 90 mm after each layer had been compacted with a
weight of 15 kgf. When particles with a representative
size of about 1 mm or smaller are used, it is not easy
to have a clear look at each particle on the LLS. Thus,
6 thin strips of very fine glass powder were
sandwiched between the layers10 for better
visualization.
A glass cylinder (diameter=50 mm) was driven at a speed of 5 mm/min as shown in Figs. 11(a), (b), (c) and
(d). The thin strips sandwiched between the particle layers were brightly illuminated by the diffused laser
light and contribute to a better visualization of the deformation process. These thin strips were gently bent
without drastic dislocation, and no clear shear band
was observed. The observed surface heaving represents
a large volume increase in the granular assemblage.
Formation of shear band is closely related to its thickness. In order to study shear band formation in the
glass grain assemblage, a plane strain compression
(PSC) test was conducted. It is desirable that the glass
particles are saturated with the same liquid used in the LAT model experiment. However, this is impossible
because the mixture of tetralin and turpentine oil is
chemically active and would damage the rubber
membrane used in the PSC test. Thus, under dry
conditions, a rectangular specimen (W75xD160xH2O0) of glass particles was isotropically consolidated to the
stress level of 0. 05 kgf/cm2 and steadily compressed at
a constant axial straining of 0. 125% per minute.
Confining pressure cry was set at 0. 05 kgf/cm2 taking
into account the low confining pressure in the LAT model experiment. At the end of the PSC test, at an
axial strain level of Ca =12%, a shear band, shown in
Fig. 12, was observed. The shear band had a width of
about 23 mm or approximately 20 times as thick as the
Fig. 9 Particle size distribution curves.
29 (I97s)

LASER-AIDED TOMOGRAPHY: A TOOL FOR VISUALIZATION OF CHANGES IN THE FABRIC OF GRANULAR ASSEMBLAGE/KONAGAI TAMURA RANGELOW MATSUSHIMA
particle's size. This width will differ in different conditions of packing, boundary conditions and so on.
However, since the observed width was not small and
not negligible when compared, on one hand with the
depth of the particle deposit, and on the other hand
with the diameter of the glass cylinder, this thickness
should be considered when the deformation process of
the grain deposit is studied.
4. DYNAMIC FAILURE IN EMBANK-
MENT-SHAPED MODEL
Dynamic failure tests of embankment-shaped models
were conducted using the proposed technique. Fig. 13
shows the experimental apparatus. If the water tank
with the model in it is shaken, the liquid within it
sloshes. In order to avoid the effect of the sloshing on
the model's behavior during a study on the structural
response to an earthquake, the model, not the water
tank, should be shaken. Thus, the model was put in a
basket which was immersed in the water tank. This
basket was hung from a steel frame which moved with
the shaking table, while the water tank spanning the
shaking table did not move, i. e. only the basket was
shaken in the liquid. The front and rear of the basket
are glazed, while both lateral sides are open. Thus, the
motion of the basket does not stir the liquid much. A
reflex camera with a successive-film-advance function
was put on the floor with its optical axis parallel to the
excited direction as shown in the figure. Since the
basket sways during shaking it is rather difficult to
take a clear picture of the model. In order to overcome
Fig. 10 Micrograph of the glass grains at magnification
of 10 times.
Table. II Index properties of materials
Fig. 11, a Settlement, s=0mm.
Fig. 11, b Settlement, s=5mm.
Fig. 11, c Settlement, s=10mm.
Fig. 11, d Settlement, s=15mm.
Fig. 11 Penetration of cylinder into particles deposit.
30 (i98s)

Structural Eng. /Earthquake Eng. Vol. 9, No. 3, 193s-201s, October 1992 Japan Society of Civil Engineers (Proc. of JSCE No. 455/ I-21)
this problem a flat mirror was mounted on the shaking
table at an angle of 45 with respect to the camera's
optical axis. By doing so the mirror on which the
model's image is portrayed oscillates in a direction
parallel to the camera's axis. This oscillation does not deteriorate the image quality and so it becomes
possible to take a clear picture of the particle assemblage moving within the basket. The dynamic change in configuration was photographed as streaks.
The shutter time of the camera was set at 1 s. Screened particles (2 mm<grain<5 mm) serving as
a model were heaped to a height of 90 mm. The slope
of this isosceles embankment model is 1:2. 72. The
model was shaken sinusoidally in the horizontal
direction normal to the embankment axis. The
amplitude of oscillation was increased linearly with
time using a personal computer with a D/A converter. This computer also generates trigger pulses to operate
the shutter of the camera.
Figs. 14(a) and (b) show the collapse of the model's surface for different excitement frequency. LLS travels
through the middle of the embankment thickness. The
surface slipped down as an individual body, while the
particles interlocked in the depth of the model experienced little relative motion. Each streak in Fig. 14(a) represents a particle slide and seems to be a
series of dots whose number coincides with the value of the excitement frequency. This indicates that the
surface slipped down step by step, repeatedly slipping
and sticking. The surface of the model began to slide
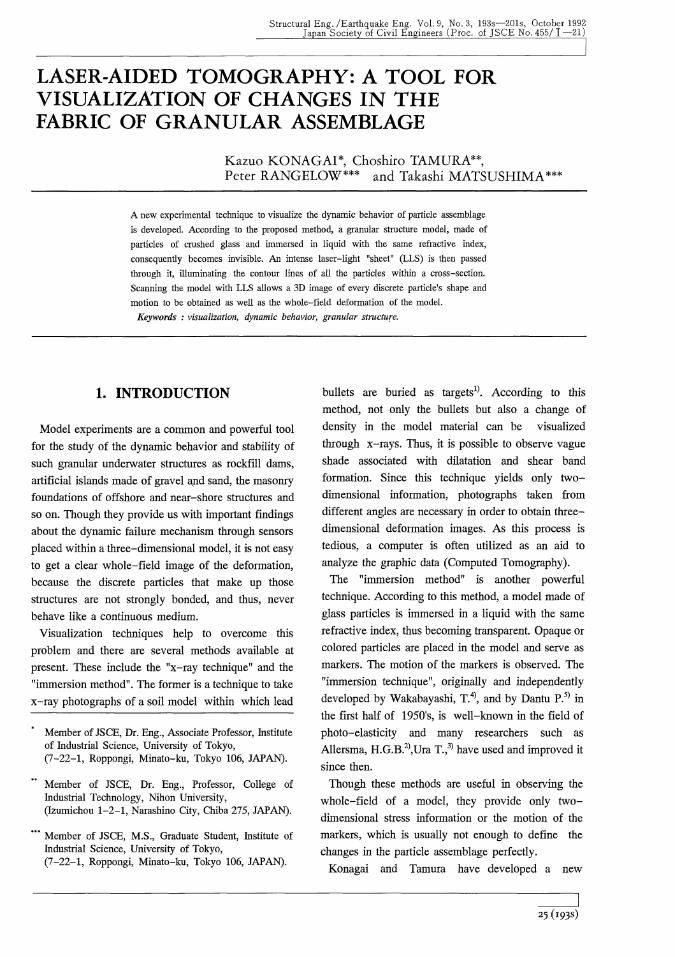
when the acceleration amplitude exceeded a threshold.
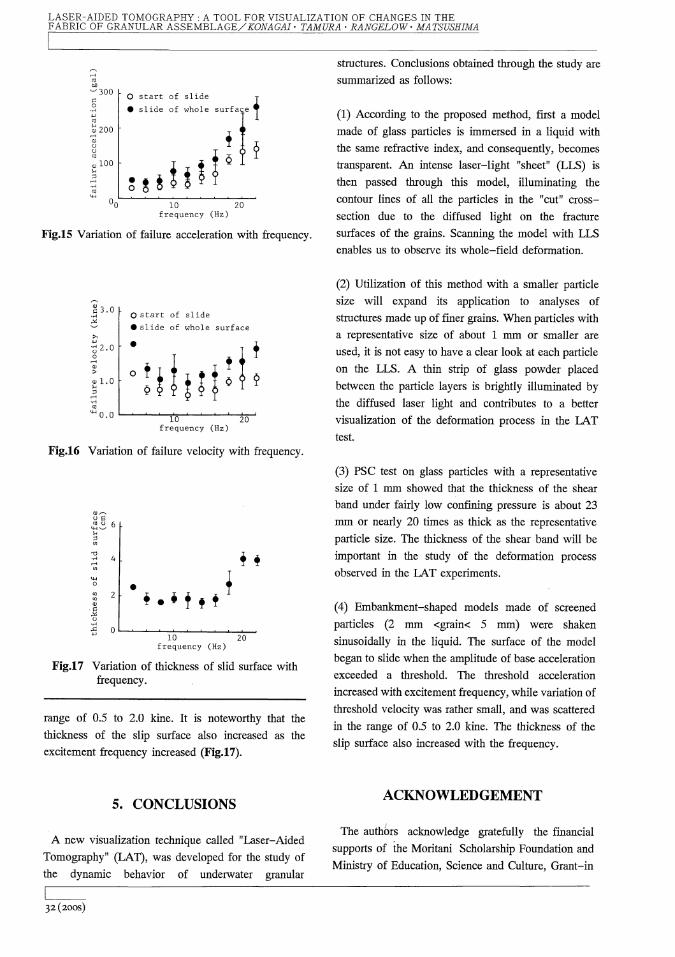
Figs. 15 and 16 show the variations with frequency of threshold acceleration and of threshold velocity,
respectively. The threshold acceleration increased with
increasing frequency, while variation of threshold
velocity was rather small, and was scattered in the
Fig. 12 ranure pattern of the glass particles in PSC
test, at ea=12%, a=0.05 kgf/cm2 and
e=0.840.
Fig. 13 Apparatus for dynamic failure test.
Fig. 14, a Excitement frequency=4Hz,
base acceleration=51.2-54.0gal.
Fig. 14, b Excitement frequency=22Hz,
base acceleration=153.4-162.3gal.
Fig. 14 Slope failure of a model.
31(199s)
LASER-AIDED TOMOGRAPHY: A TOOL FOR VISUALIZATION OF CHANGES IN THE FABRIC OF GRANULAR ASSEMBLAGE/KONAGAI TAMURA RANGELOW MATSUSHIMA
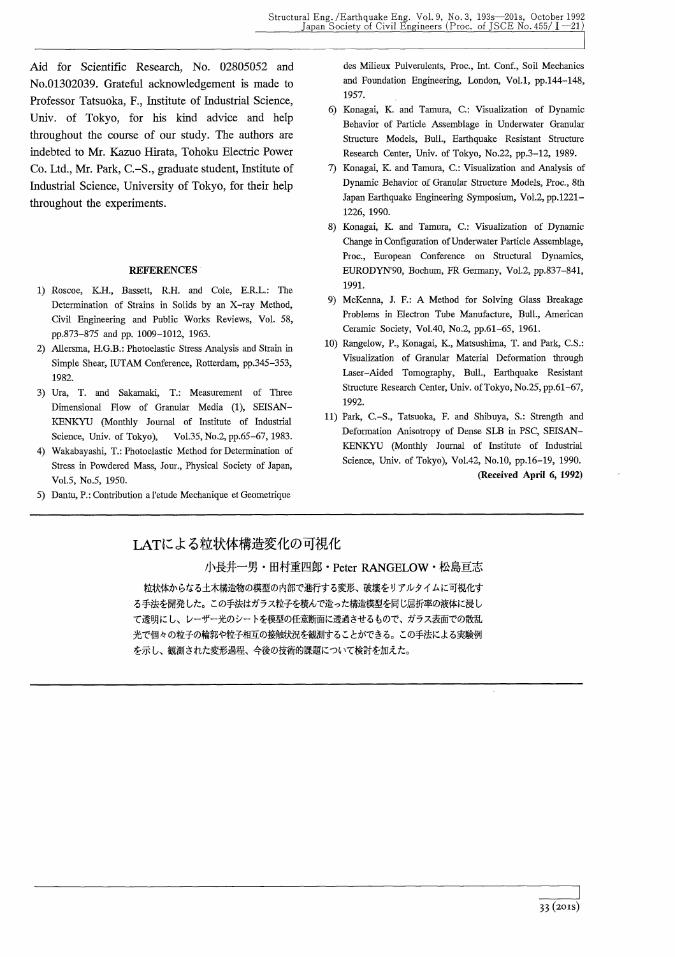
range of 0. 5 to 2. 0 kine. It is noteworthy that the thickness of the slip surface also increased as the
excitement frequency increased (Fig. 17).
5. CONCLUSIONS
A new visualization technique called "Laser-Aided
Tomography" (LAT), was developed for the study of
the dynamic behavior of underwater granular
structures. Conclusions obtained through the study are
summarized as follows:
(1) According to the proposed method, first a model made of glass particles is immersed in a liquid with the same refractive index, and consequently, becomes
transparent. An intense laser-light "sheet" (LLS) is
then passed through this model, illuminating the contour lines of all the particles in the "cut" cross-
section due to the diffused light on the fracture
surfaces of the grains. Scanning the model with LLS
enables us to observe its whole-field deformation.
(2) Utilization of this method with a smaller particle size will expand its application to analyses of
structures made up of finer grains. When particles with a representative size of about 1 mm or smaller are
used, it is not easy to have a clear look at each particle
on the LLS. A thin strip of glass powder placed
between the particle layers is brightly illuminated by
the diffused laser light and contributes to a better
visualization of the deformation process in the LAT test.
(3) PSC test on glass particles with a representative size of 1 mm showed that the thickness of the shear band under fairly low confining pressure is about 23 mm or nearly 20 times as thick as the representative
particle size. The thickness of the shear band will be important in the study of the deformation process observed in the LAT experiments.
(4) Embankment-shaped models made of screened particles (2 mm <grain< 5 mm) were shaken sinusoidally in the liquid. The surface of the model began to slide when the amplitude of base acceleration exceeded a threshold. The threshold acceleration increased with excitement frequency, while variation of threshold velocity was rather small, and was scattered in the range of 0. 5 to 2. 0 kine. The thickness of the slip surface also increased with the frequency.
ACKNOWLEDGEMENT
The authors acknowledge gratefully the financial supports of the Moritani Scholarship Foundation and Ministry of Education, Science and Culture, Grant-in
Fig. 15 Variation of failure acceleration with frequency.
o start of slide
slide of whole surface
Fig. 16 Variation of failure velocity with frequency.
o start of slide
slide of whole surface
Fig. 17 Variation of thickness of slid surface with
frequency.
32 (loos)
Structural Eng. Earthquake Eng. Vol. 9, No. 3, 193s-201s, October 1992 Japan Society of Civil Engineers (Proc. of JSCE No. 455/ 1-21)
Aid for Scientific Research, No. 02805052 and
No. 01302039. Grateful acknowledgement is made to
Professor Tatsuoka, F., Institute of Industrial Science,
Univ. of Tokyo, for his kind advice and help
throughout the course of our study. The authors are
indebted to Mr. Kazuo Hirata, Tohoku Electric Power
Co. Ltd., Mr. Park, C. -S., graduate student, Institute of
Industrial Science, University of Tokyo, for their help
throughout the experiments.
REFERENCES
1) Roscoe, K. H., Bassett, R. H. and Cole, E. R. L.: The Determination of Strains in Solids by an X-ray Method, Civil Engineering and Public Works Reviews, Vol. 58,
pp. 873-875 and pp. 1009-1012, 1963. 2) Allersma, H. G. B.: Photoelastic Stress Analysis and Strain in
Simple Shear, IUTAM Conference, Rotterdam, pp. 345-353,
1982. 3) Ura, T, and Sakamaki, T.: Measurement of Three
Dimensional Flow of Granular Media (1), SEISAN- KENKYU (Monthly Journal of Institute of Industrial Science, Univ. of Tokyo), Vo1. 35, No. 2, pp. 65-67, 1983.
4) Wakabayashi, T.: Photoelastic Method for Determination of Stress in Powdered Mass, Jour., Physical Society of Japan, Vol. 5, No. 5, 1950.
5) Dantu, P.: Contribution a 1'etude Mechanique et Geometrique
des Milieux Pulverulents, Proc., Int. Conf., Soil Mechanics
and Foundation Engineering, London, Vol. 1, pp. 144-148,
1957.
6) Konagai, K. and Tamura, C.: Visualization of Dynamic
Behavior of Particle Assemblage in Underwater Granular
Structure Models, Bull., Earthquake Resistant Structure
Research Center, Univ. of Tokyo, No. 22, pp. 3-12, 1989.
7) Konagai, K and Tamura, C.: Visualization and Analysis of
Dynamic Behavior of Granular Structure Models, Proc., 8th
Japan Earthquake Engineering Symposium, Vol. 2, pp. 1221-
1226, 1990.
8) Konagai, K. and Tamura, C.: Visualization of Dynamic
Change in Configuration of Underwater Particle Assemblage,
Proc., European Conference on Structural Dynamics,
EURODYN'90, Bochum, FR Germany, Vol. 2, pp. 837-841,
1991.
9) McKenna, J. F.: A Method for Solving Glass Breakage
Problems in Electron Tube Manufacture, Bull., American
Ceramic Society, Vo1. 40, No. 2, pp. 61-65, 1961.
10) Rangelow, P., Konagai, K., Matsushima, T. and Park, C. S.:
Visualization of Granular Material Deformation through
Laser-Aided Tomography, Bull., Earthquake Resistant
Structure Research Center, Univ. of Tokyo, No. 25, pp. 61-67,
1992.
11) Park, C. -S., Tatsuoka, F. and Shibuya, S.: Strength and
Deformation Anisotropy of Dense SLB in PSC, SEISAN-
KENKYU (Monthly Journal of Institute of Industrial
Science, Univ. of Tokyo), Vol. 42, No. 10, pp. 16-19, 1990.
(Received April 6, 1992)
LATに よ る粒 状 体 構 造 変 化 の 可 視 化
小長井一男 ・田村重 四郎 ・peterRANGELOW・ 松 島亘志
粒状体からなる土木構造物の模型の内部で進行する変形、破壊をリアルタイムに可視化す
る手法を開発した。この手法はガラス粒子を積んで造った構造模型を同じ屈折率の液体に浸し
て透明にし、レーザー光のシートを模型の任意断面に透過させるもので、ガラス表面での散乱
光で個々の粒子の輪郭や粒子相互の接触状況を観測することができる。この手法による実験例
を示し、観測された変形過程、今後の技術的課題について検討を加えた。
33(20is)
View publication statsView publication stats