lazard european roadshow july 2009
TRANSCRIPT
7/29/2019 Lazard European Roadshow July 2009
http://slidepdf.com/reader/full/lazard-european-roadshow-july-2009 1/17
Capst one Managem ent Presenta t ion
July 2009

7/29/2019 Lazard European Roadshow July 2009
http://slidepdf.com/reader/full/lazard-european-roadshow-july-2009 2/17
7/29/2019 Lazard European Roadshow July 2009
http://slidepdf.com/reader/full/lazard-european-roadshow-july-2009 3/17
2
2
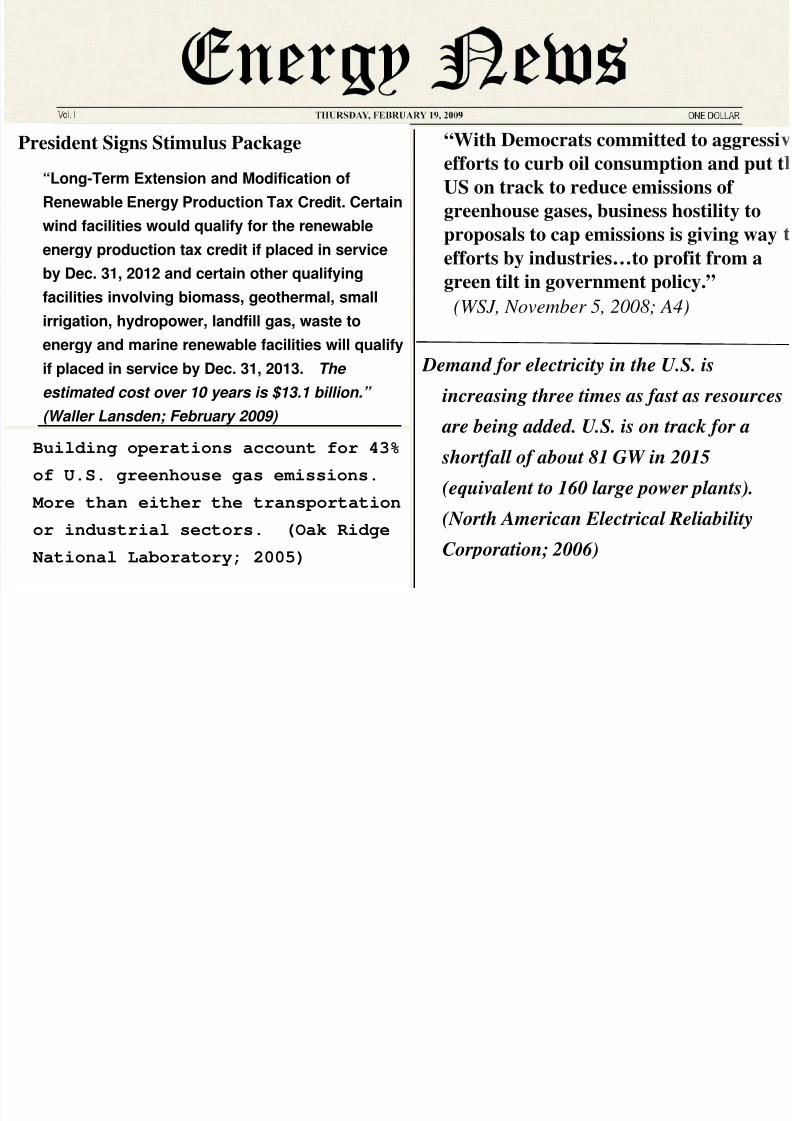
“With Democrats committed to aggressi
efforts to curb oil consumption and put t
US on track to reduce emissions of
greenhouse gases, business hostility toproposals to cap emissions is giving way
efforts by industries…to profit from a
green tilt in government policy.”
(WSJ, November 5, 2008; A4)
Demand for electricity in the U.S. is
increasing three times as fast as resources
are being added. U.S. is on track for a
shortfall of about 81 GW in 2015
(equivalent to 160 large power plants).
(North American Electrical Reliability
Corporation; 2006)
Building operations account for 43%
of U.S. greenhouse gas emissions.
More than either the transportation
or industrial sectors. (Oak Ridge
National Laboratory; 2005)
President Signs Stimulus Package
“Long-Term Extension and Modification of
Renewable Energy Production Tax Credit. Certainwind facilities would qualify for the renewable
energy production tax credit if placed in service
by Dec. 31, 2012 and certain other qualifying
facilities involving biomass, geothermal, small
irrigation, hydropower, landfill gas, waste to
energy and marine renewable facilities will qualify
if placed in service by Dec. 31, 2013. The
estimated cost over 10 years is $13.1 billion.”
(Waller Lansden; February 2009)

7/29/2019 Lazard European Roadshow July 2009
http://slidepdf.com/reader/full/lazard-european-roadshow-july-2009 4/173
• 96 U.S. technology patents• Air bearing technology
• One moving part
• No coolants, oils or grease
• Flexible and economic clean technology• Flexible configuration
• Lightweight & small footprint• Multi-fuel capability
• Ultra-low emissions
• Capstone’s product family• C30 – 30kW• C65 – 65kW• C200 – 200kW (First shipment August 2008)
• C1000 Series – 600kW, 800kW, 1,000kW
(First shipment January 2009)
Capst one’s Mic rot urb ine

7/29/2019 Lazard European Roadshow July 2009
http://slidepdf.com/reader/full/lazard-european-roadshow-july-2009 5/174
Mic roTurbine Com pet i t ion
IngersollIngersoll--RandRand
(250kW)(250kW)
Elliott EnergyElliott Energy
Systems (100kW)Systems (100kW)
TurbecTurbec
(100kW)(100kW)
MicroTurbine Industry Leader With Majority Market Share

7/29/2019 Lazard European Roadshow July 2009
http://slidepdf.com/reader/full/lazard-european-roadshow-july-2009 6/175
Current Mark et Segm ent s
Hospitals
Data CentersHotels & Schools
Large Retailers
Oil & Gas
U.S. Gov’t
Waste Water Plants
Telecom
DigestersLandfills
Hybrid EV
Office Buildings

7/29/2019 Lazard European Roadshow July 2009
http://slidepdf.com/reader/full/lazard-european-roadshow-july-2009 7/176
New C200 & C1000 Produc t s
• Competitive Pricing
• Low maintenance
• High reliability
• High efficiency
• Ultra low emissions
• Built-in redundancy
• Small Footprint
Piston Engine Price, Fuel Cell Emissions, Turbine Reliability
0
500
1,000
1,500
2,000
2,500
3,000
3,500
M
a r k e t P o t e n t i a l $ M
i l l i o n s
28-300 kW .3-1 MW 1-5 MW 5-10 MW 10-20 MW 20-50 MW
Source: Resource Dynamics Corporation (extrapolated based on industrial uses)
Microturbine Market
C200/C1000 Market Expansion

7/29/2019 Lazard European Roadshow July 2009
http://slidepdf.com/reader/full/lazard-european-roadshow-july-2009 8/177
Uni t ed Tec hnologies (NYSE: UTX)
• Worldwide OEM Partner for PureComfort
– Private labeling Capstone Microturbines
– Match with Carrier Absorption Chiller forCHP/CCHP Markets
– Focus on big customers:• Wal-Mart
• Tesco
• Marriot International/Ritz Carlton
– Development Partner for C200 Systems
• $12.8 in cash and engineering support

7/29/2019 Lazard European Roadshow July 2009
http://slidepdf.com/reader/full/lazard-european-roadshow-july-2009 9/178
Value Com par ison First Cost
$-
$1,000
$2,000
$3,000
$4,000
$5,000
$6,000
$7,000
$8,000
$9,000
$10,000
Solar PV Fuel Cells Wind Microturbine Recip
$ P e r
Equivalent Cars Removed (CO2) for 1 MW Project
0
200
400
600
800
1,000
1,200
Solar PV Wind Recip Fuel Cells Microturbine
N u m b e r o f C a r s
Assumptions: Capstone C200 System, Combined Heat and Power Systems, Natural Gas Fueled,
California Emission Standards, Initial Investment Data: CA Statewide SGIP Program
Statistics through Q4 2007, Analysis assumes no incentives
Total Cost of Ownership
$(6,000)
$(5,000)
$(4,000)
$(3,000)
$(2,000)
$(1,000)
$-
$1,000
$2,000
$3,000
$4,000
Solar PV Fuel Cells Wind Recip CHP Microturbine CHP
$ P e r k
Source: CA Statewide SGIP Program Statistics
Best Value Proposition
1. Microturbine Combined Heat & Power2. Reciprocating Combined Heat & Power
3. Wind Turbine
4. Fuel Cells
5. Solar PV

7/29/2019 Lazard European Roadshow July 2009
http://slidepdf.com/reader/full/lazard-european-roadshow-july-2009 10/179
Gas Turb ine Com par ison
Solar Turbines Mercury 50
Kawasaki GPB30D
Dresser-Rand KG2-3E
Capstone C200 Capstone C1000
Siemens SGT-100
Ingersol Rand MT250
Elliott TA100R
Rolls Royce 501-KB5S
Kawasaki GPB15
OPRA Turbines OP16-3B
(DLE)
Solar Turbines Saturn 20
Solar Turbines Centaur 40
Solar Turbines Centaur 50
Kawasaki GPB60D
Rolls Royce 501-KB7S
Dresser-Rand KG2-3
General Electric GE5-1 (DLN)
14
16
18
20
22
24
26
28
30
32
34
36
38
40
0 1 2 3 4 5 6
Power Output (MW)
E l e c t r i c a l E f f i c i e n
Capstone offers the highest efficiency alternatives below 4.5 MW Source: Company Websites. Data and results are based on publicly available information from manufacturers and except for Capstone’s products, not from Capstone tests.

7/29/2019 Lazard European Roadshow July 2009
http://slidepdf.com/reader/full/lazard-european-roadshow-july-2009 11/1710
Capst one Value Proposi t ion
• 120 hrs planned maintenance per year• Scheduled/unscheduled maintenance
$0.018 to 0.022 / kW-hr
• Average uptime 82%
Op. Hours Item Action
1,000 – 2,000Air & Oil Filters, Oil,
Spark PlugsInspect orReplace
1,500 Top End Inspect
20,000 Top End Overhaul
40,000 Bottom End Overhaul
• 6 hrs planned maintenance per year• Scheduled/unscheduled maintenance
$0.015 / kW-hr
• Average uptime 99%
Op. Hours Item Action
8,000 Air/Fuel Filters, IgniterInspect,Replace
20,000 Injectors, Batteries Replace
40,000Engine/Generator,
Injectors, BatteriesOverhaul
Maintenance Costs 25% Lower on Average = Lower TCO

7/29/2019 Lazard European Roadshow July 2009
http://slidepdf.com/reader/full/lazard-european-roadshow-july-2009 12/17
11
• CARB 2007 - extremely stringentemissions standard that exceeds therequirements of federal standards
• CARB 2010 – C30 internal testingcomplies with standard
• Only Microturbines, Fuel Cells, Solar and
Wind meet standard
Capst one Value Propos i t ion
Units 2003 2007 Reduction
NOx lb/MWh 0.5 0.07 86%
CO lb/MWh 6.0 0.10 98%
VOC lb/MWh 1.0 0.02 98%
CARB Natural Gas Emission Standard
Relative NOx Emissions
US Grid
Avg
NG
Recip
C200
Source: EPA and ASME
Capstone Emissions Less Than 1/10th of Internal Combustion Engines

7/29/2019 Lazard European Roadshow July 2009
http://slidepdf.com/reader/full/lazard-european-roadshow-july-2009 13/17
12
Grow ing Produc t Bac k log
0
10
20
3040
50
60
70
80
Q1'08 Q2'08 Q3'08 Q4'08 Q1'09 Q2'09 Q3'09 Q4'09
M w
C30 C60 SeriesC200 C1000 Series

7/29/2019 Lazard European Roadshow July 2009
http://slidepdf.com/reader/full/lazard-european-roadshow-july-2009 14/17
Y/Y Net Revenue Grow t h
$5.6
$7.2
$9.2 $9.3
$7.5
$13.1$11.5 $11.8
Q1 Q2 Q3 Q4
FY'08 FY'09
7/29/2019 Lazard European Roadshow July 2009
http://slidepdf.com/reader/full/lazard-european-roadshow-july-2009 15/17
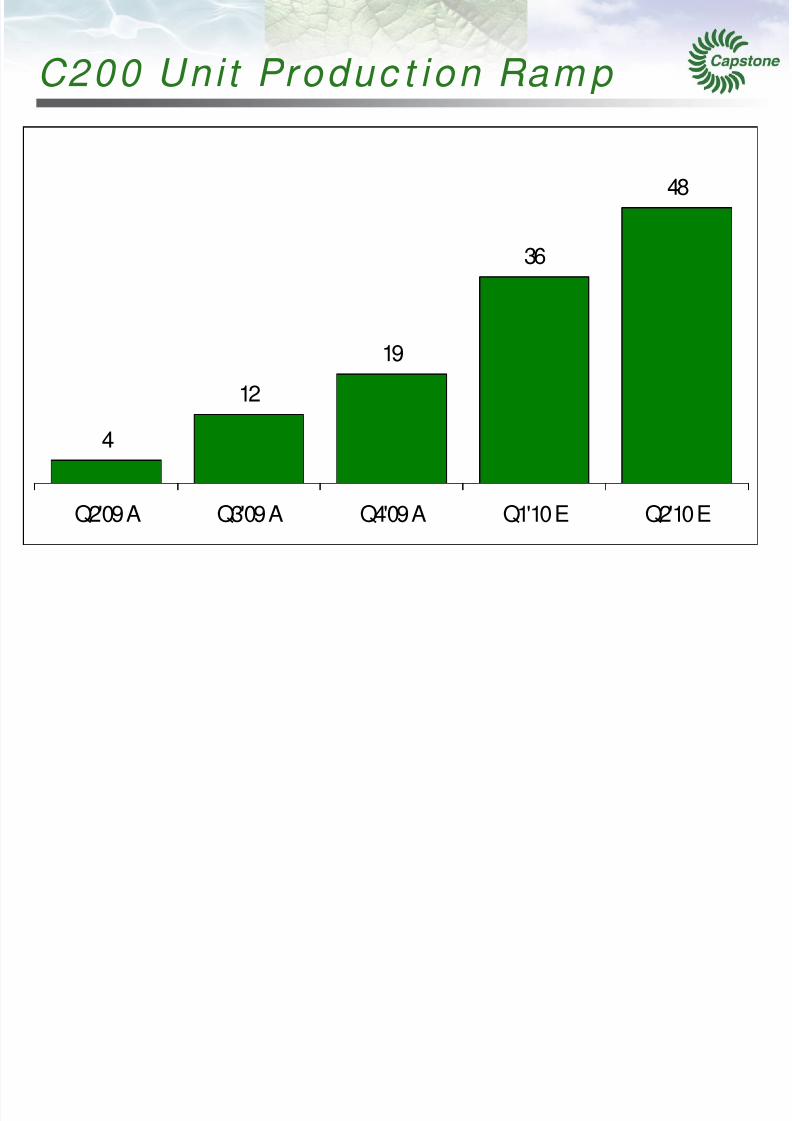
C200 Uni t Produc t ion Ram p
4
12
19
36
48
Q2'09 A Q3'09 A Q4'09 A Q1'10 E Q2'10 E

7/29/2019 Lazard European Roadshow July 2009
http://slidepdf.com/reader/full/lazard-european-roadshow-july-2009 16/17
15
Clear Pat h t o Prof i t ab i l i t y
Increased
ProductionProfitability
ProductAcceptance
• C200/C1000 production rates
• Increased Robotics
• Tier One Suppliers
• Just in Time Deliveries
• Significant Inventory Reduction
• 4,000 unit maximum capacity
• FY09 Backlog $61.5
million
• Y/Y Revenue 40%
growth
• Multiple Markets
• Not experiencingorder cancellations
• C200/C1000 direct material
improvement of 30% through
FY2010
• Overhead reductions in FY2010
• Gross margin 35-40% by end
FY2010
• Operating expense lower by
15% in FY2010
7/29/2019 Lazard European Roadshow July 2009
http://slidepdf.com/reader/full/lazard-european-roadshow-july-2009 17/17
16
Posi t ioned For Grow t h
• Strong International market drivers
• U.S. Policy now focusing on energy efficiencyand renewable power
• Positioned as Green ultra low emission andhighly efficient technology
• New C200/C1000 product enables megawattsolutions in a $4 Billion Annual Market
• Backlog as of March 31, 2009, up 120% from
March 31, 2008