l.b. foster presentation singular research midwestern
TRANSCRIPT
L.B. Foster PresentationSingular Research Midwestern Values ConferenceSeptember 16, 2021
Bill Thalman – Senior Vice President and Chief Financial OfficerJim Kempton – Corporate Controller and Principal Accounting Officer
Safe Harbor Disclaimer
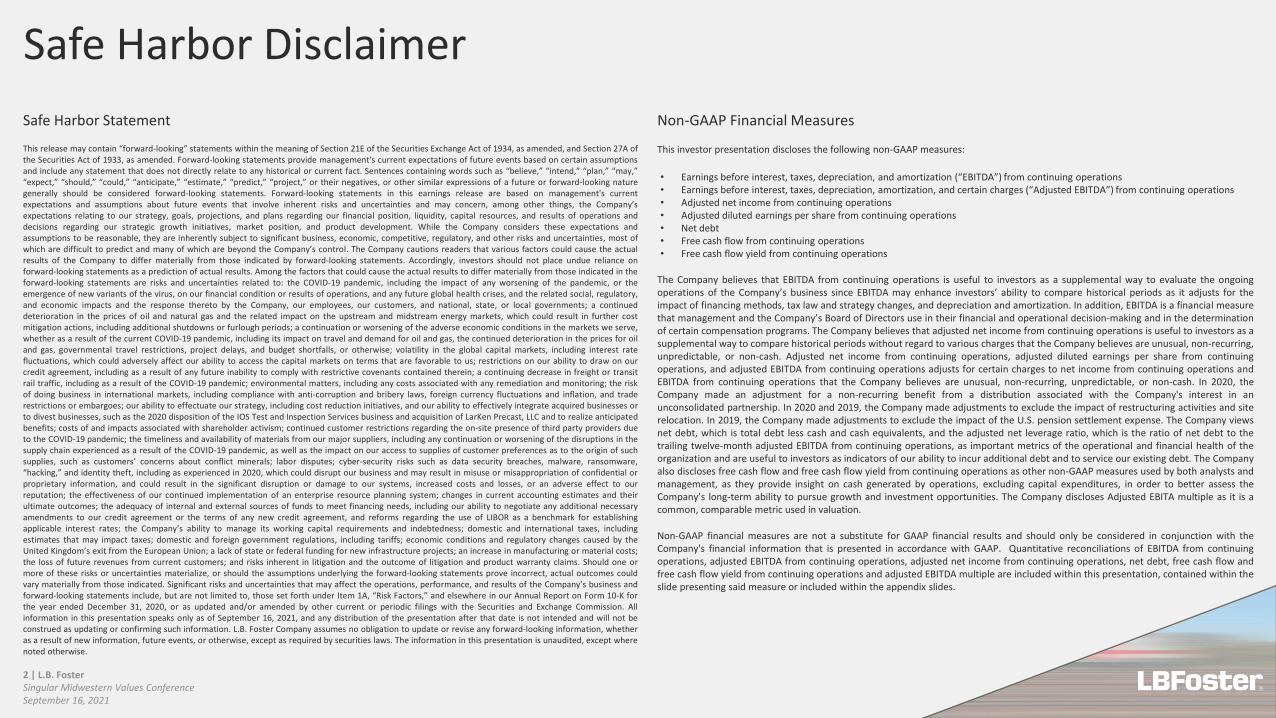
Safe Harbor Statement
This release may contain “forward-looking” statements within the meaning of Section 21E of the Securities Exchange Act of 1934, as amended, and Section 27A ofthe Securities Act of 1933, as amended. Forward-looking statements provide management's current expectations of future events based on certain assumptionsand include any statement that does not directly relate to any historical or current fact. Sentences containing words such as “believe,” “intend,” “plan,” “may,”“expect,” “should,” “could,” “anticipate,” “estimate,” “predict,” “project,” or their negatives, or other similar expressions of a future or forward-looking naturegenerally should be considered forward-looking statements. Forward-looking statements in this earnings release are based on management's currentexpectations and assumptions about future events that involve inherent risks and uncertainties and may concern, among other things, the Company’sexpectations relating to our strategy, goals, projections, and plans regarding our financial position, liquidity, capital resources, and results of operations anddecisions regarding our strategic growth initiatives, market position, and product development. While the Company considers these expectations andassumptions to be reasonable, they are inherently subject to significant business, economic, competitive, regulatory, and other risks and uncertainties, most ofwhich are difficult to predict and many of which are beyond the Company’s control. The Company cautions readers that various factors could cause the actualresults of the Company to differ materially from those indicated by forward-looking statements. Accordingly, investors should not place undue reliance onforward-looking statements as a prediction of actual results. Among the factors that could cause the actual results to differ materially from those indicated in theforward-looking statements are risks and uncertainties related to: the COVID-19 pandemic, including the impact of any worsening of the pandemic, or theemergence of new variants of the virus, on our financial condition or results of operations, and any future global health crises, and the related social, regulatory,and economic impacts and the response thereto by the Company, our employees, our customers, and national, state, or local governments; a continueddeterioration in the prices of oil and natural gas and the related impact on the upstream and midstream energy markets, which could result in further costmitigation actions, including additional shutdowns or furlough periods; a continuation or worsening of the adverse economic conditions in the markets we serve,whether as a result of the current COVID-19 pandemic, including its impact on travel and demand for oil and gas, the continued deterioration in the prices for oiland gas, governmental travel restrictions, project delays, and budget shortfalls, or otherwise; volatility in the global capital markets, including interest ratefluctuations, which could adversely affect our ability to access the capital markets on terms that are favorable to us; restrictions on our ability to draw on ourcredit agreement, including as a result of any future inability to comply with restrictive covenants contained therein; a continuing decrease in freight or transitrail traffic, including as a result of the COVID-19 pandemic; environmental matters, including any costs associated with any remediation and monitoring; the riskof doing business in international markets, including compliance with anti-corruption and bribery laws, foreign currency fluctuations and inflation, and traderestrictions or embargoes; our ability to effectuate our strategy, including cost reduction initiatives, and our ability to effectively integrate acquired businesses orto divest businesses, such as the 2020 disposition of the IOS Test and Inspection Services business and acquisition of LarKen Precast, LLC and to realize anticipatedbenefits; costs of and impacts associated with shareholder activism; continued customer restrictions regarding the on-site presence of third party providers dueto the COVID-19 pandemic; the timeliness and availability of materials from our major suppliers, including any continuation or worsening of the disruptions in thesupply chain experienced as a result of the COVID-19 pandemic, as well as the impact on our access to supplies of customer preferences as to the origin of suchsupplies, such as customers’ concerns about conflict minerals; labor disputes; cyber-security risks such as data security breaches, malware, ransomware,“hacking,” and identity theft, including as experienced in 2020, which could disrupt our business and may result in misuse or misappropriation of confidential orproprietary information, and could result in the significant disruption or damage to our systems, increased costs and losses, or an adverse effect to ourreputation; the effectiveness of our continued implementation of an enterprise resource planning system; changes in current accounting estimates and theirultimate outcomes; the adequacy of internal and external sources of funds to meet financing needs, including our ability to negotiate any additional necessaryamendments to our credit agreement or the terms of any new credit agreement, and reforms regarding the use of LIBOR as a benchmark for establishingapplicable interest rates; the Company’s ability to manage its working capital requirements and indebtedness; domestic and international taxes, includingestimates that may impact taxes; domestic and foreign government regulations, including tariffs; economic conditions and regulatory changes caused by theUnited Kingdom’s exit from the European Union; a lack of state or federal funding for new infrastructure projects; an increase in manufacturing or material costs;the loss of future revenues from current customers; and risks inherent in litigation and the outcome of litigation and product warranty claims. Should one ormore of these risks or uncertainties materialize, or should the assumptions underlying the forward-looking statements prove incorrect, actual outcomes couldvary materially from those indicated. Significant risks and uncertainties that may affect the operations, performance, and results of the Company’s business andforward-looking statements include, but are not limited to, those set forth under Item 1A, “Risk Factors,” and elsewhere in our Annual Report on Form 10-K forthe year ended December 31, 2020, or as updated and/or amended by other current or periodic filings with the Securities and Exchange Commission. Allinformation in this presentation speaks only as of September 16, 2021, and any distribution of the presentation after that date is not intended and will not beconstrued as updating or confirming such information. L.B. Foster Company assumes no obligation to update or revise any forward-looking information, whetheras a result of new information, future events, or otherwise, except as required by securities laws. The information in this presentation is unaudited, except wherenoted otherwise.
Non-GAAP Financial Measures
This investor presentation discloses the following non-GAAP measures:
• Earnings before interest, taxes, depreciation, and amortization (“EBITDA”) from continuing operations• Earnings before interest, taxes, depreciation, amortization, and certain charges (“Adjusted EBITDA”) from continuing operations• Adjusted net income from continuing operations• Adjusted diluted earnings per share from continuing operations• Net debt• Free cash flow from continuing operations• Free cash flow yield from continuing operations
The Company believes that EBITDA from continuing operations is useful to investors as a supplemental way to evaluate the ongoingoperations of the Company’s business since EBITDA may enhance investors’ ability to compare historical periods as it adjusts for theimpact of financing methods, tax law and strategy changes, and depreciation and amortization. In addition, EBITDA is a financial measurethat management and the Company’s Board of Directors use in their financial and operational decision-making and in the determinationof certain compensation programs. The Company believes that adjusted net income from continuing operations is useful to investors as asupplemental way to compare historical periods without regard to various charges that the Company believes are unusual, non-recurring,unpredictable, or non-cash. Adjusted net income from continuing operations, adjusted diluted earnings per share from continuingoperations, and adjusted EBITDA from continuing operations adjusts for certain charges to net income from continuing operations andEBITDA from continuing operations that the Company believes are unusual, non-recurring, unpredictable, or non-cash. In 2020, theCompany made an adjustment for a non-recurring benefit from a distribution associated with the Company's interest in anunconsolidated partnership. In 2020 and 2019, the Company made adjustments to exclude the impact of restructuring activities and siterelocation. In 2019, the Company made adjustments to exclude the impact of the U.S. pension settlement expense. The Company viewsnet debt, which is total debt less cash and cash equivalents, and the adjusted net leverage ratio, which is the ratio of net debt to thetrailing twelve-month adjusted EBITDA from continuing operations, as important metrics of the operational and financial health of theorganization and are useful to investors as indicators of our ability to incur additional debt and to service our existing debt. The Companyalso discloses free cash flow and free cash flow yield from continuing operations as other non-GAAP measures used by both analysts andmanagement, as they provide insight on cash generated by operations, excluding capital expenditures, in order to better assess theCompany’s long-term ability to pursue growth and investment opportunities. The Company discloses Adjusted EBITA multiple as it is acommon, comparable metric used in valuation.
Non-GAAP financial measures are not a substitute for GAAP financial results and should only be considered in conjunction with theCompany's financial information that is presented in accordance with GAAP. Quantitative reconciliations of EBITDA from continuingoperations, adjusted EBITDA from continuing operations, adjusted net income from continuing operations, net debt, free cash flow andfree cash flow yield from continuing operations and adjusted EBITDA multiple are included within this presentation, contained within theslide presenting said measure or included within the appendix slides.
2 | L.B. FosterSingular Midwestern Values ConferenceSeptember 16, 2021
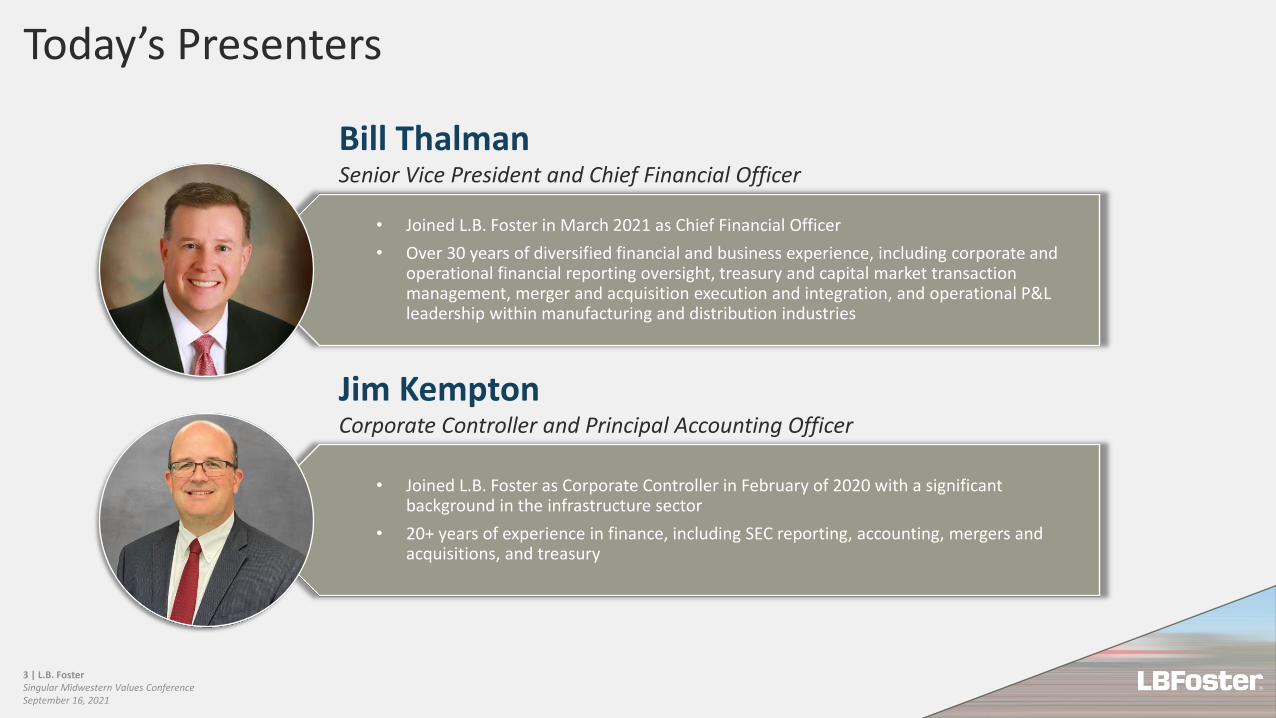
• Joined L.B. Foster in March 2021 as Chief Financial Officer
• Over 30 years of diversified financial and business experience, including corporate and operational financial reporting oversight, treasury and capital market transaction management, merger and acquisition execution and integration, and operational P&L leadership within manufacturing and distribution industries
Bill ThalmanSenior Vice President and Chief Financial Officer
Today’s Presenters
• Joined L.B. Foster as Corporate Controller in February of 2020 with a significant background in the infrastructure sector
• 20+ years of experience in finance, including SEC reporting, accounting, mergers and acquisitions, and treasury
Jim KemptonCorporate Controller and Principal Accounting Officer
3 | L.B. FosterSingular Midwestern Values ConferenceSeptember 16, 2021
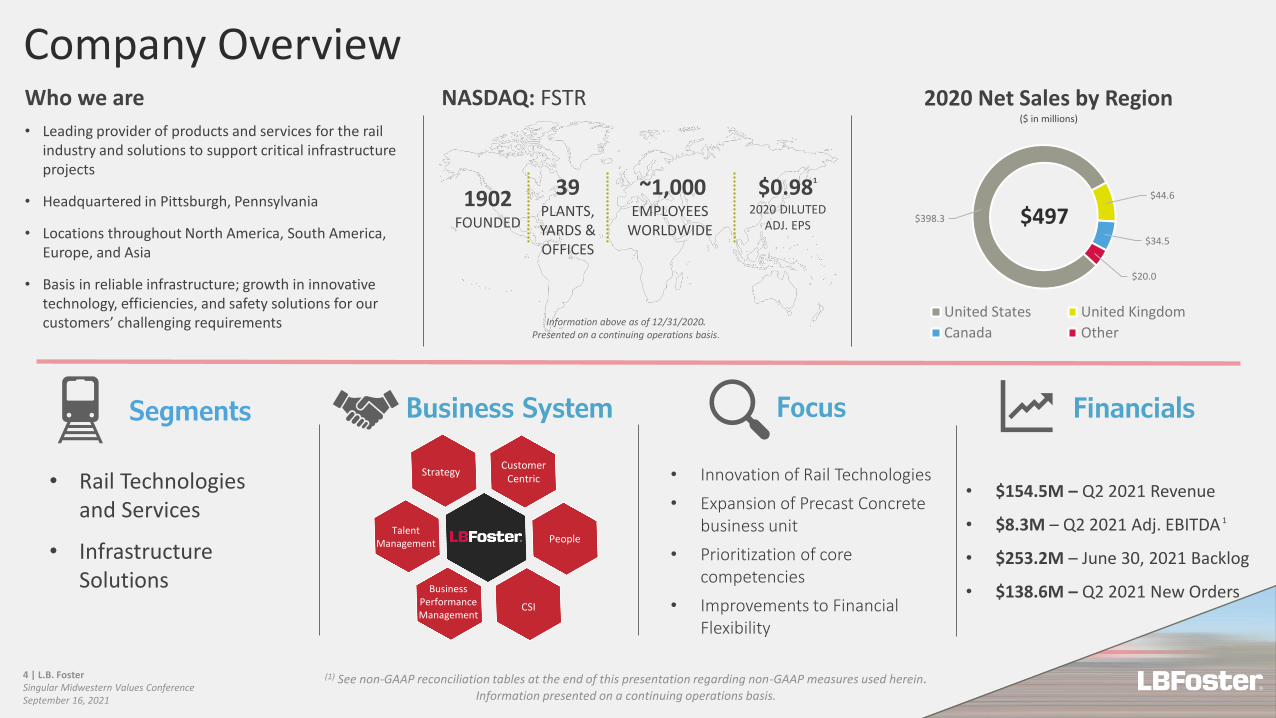
$398.3
$44.6
$34.5
$20.0
2020 Net Sales by Region($ in millions)
United States United Kingdom
Canada Other
Who we are
• Leading provider of products and services for the rail industry and solutions to support critical infrastructure projects
• Headquartered in Pittsburgh, Pennsylvania
• Locations throughout North America, South America, Europe, and Asia
• Basis in reliable infrastructure; growth in innovative technology, efficiencies, and safety solutions for our customers’ challenging requirements
Segments
• Rail Technologies and Services
• Infrastructure Solutions
Business System Financials
$497
NASDAQ: FSTR
39PLANTS,YARDS &OFFICES
~1,000EMPLOYEES
WORLDWIDE
$0.981
2020 DILUTEDADJ. EPS
StrategyCustomer
Centric
PeopleTalent
Management
BusinessPerformanceManagement
CSI
• $154.5M – Q2 2021 Revenue
• $8.3M – Q2 2021 Adj. EBITDA 1
• $253.2M – June 30, 2021 Backlog
• $138.6M – Q2 2021 New Orders
Focus
• Innovation of Rail Technologies
• Expansion of Precast Concrete business unit
• Prioritization of core competencies
• Improvements to Financial Flexibility
(1) See non-GAAP reconciliation tables at the end of this presentation regarding non-GAAP measures used herein. Information presented on a continuing operations basis.
Information above as of 12/31/2020. Presented on a continuing operations basis.
Company Overview
1902FOUNDED
4 | L.B. FosterSingular Midwestern Values ConferenceSeptember 16, 2021
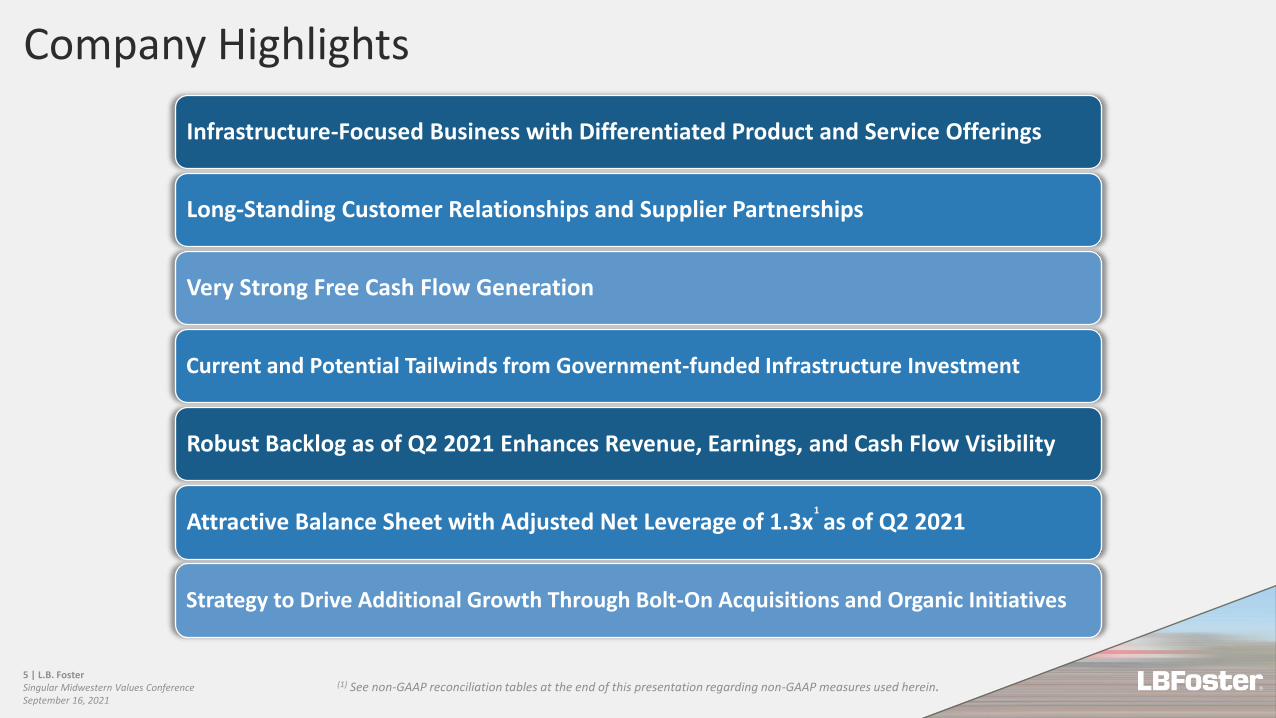
Company Highlights
Infrastructure-Focused Business with Differentiated Product and Service Offerings
Long-Standing Customer Relationships and Supplier Partnerships
Very Strong Free Cash Flow Generation
Current and Potential Tailwinds from Government-funded Infrastructure Investment
Robust Backlog as of Q2 2021 Enhances Revenue, Earnings, and Cash Flow Visibility
Attractive Balance Sheet with Adjusted Net Leverage of 1.3x1
as of Q2 2021
Strategy to Drive Additional Growth Through Bolt-On Acquisitions and Organic Initiatives
(1) See non-GAAP reconciliation tables at the end of this presentation regarding non-GAAP measures used herein. 5 | L.B. FosterSingular Midwestern Values ConferenceSeptember 16, 2021

Markets Served
Transportation Infrastructure General Infrastructure Energy Infrastructure
Segment Rail Technologies and Services Infrastructure Solutions
RevenueFull Year
2020$ in millions
Strategic Emphasis
• Continued expansion of Rail Technologies; expected to be among the faster growing portion of the market served
• Growth of on-track services, specifically solutions to deliver benefits to operating efficiencies and safety, while minimizing disruptions and enhancing digital railway enablement
• Expanding precast products and geographical footprint
• Leveraging the Company’s expertise in fabricated steel, precast concrete, measurement solutions and corrosion protection enabled by its core competencies of managing large, custom projects
Rail Technologies and Services Infrastructure Solutions
Note: Figures may not foot due to rounding.
Business Profile
$276, 56%
Rail Technologies and Services
Infrastructure Solutions
$221, 44%
Rail Technologies and Services
Infrastructure Solutions
6 | L.B. FosterSingular Midwestern Values ConferenceSeptember 16, 2021
Note: Figures may not foot due to rounding.
Rai
l Tec
hn
olo
gies
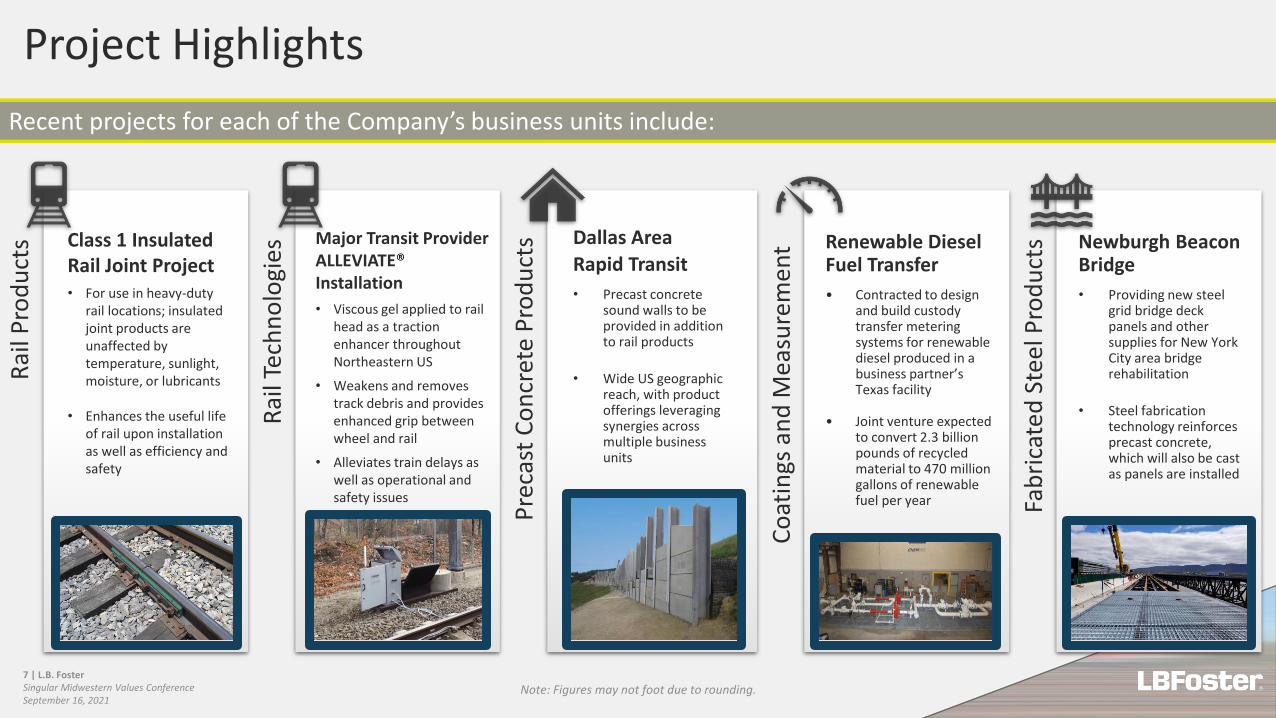
Major Transit Provider ALLEVIATE®Installation
• Viscous gel applied to rail head as a traction enhancer throughout Northeastern US
• Weakens and removes track debris and provides enhanced grip between wheel and rail
• Alleviates train delays as well as operational and safety issues
Co
atin
gs a
nd
Mea
sure
men
t Renewable Diesel Fuel Transfer
• Contracted to design and build custody transfer metering systems for renewable diesel produced in a business partner’s Texas facility
• Joint venture expected to convert 2.3 billion pounds of recycled material to 470 million gallons of renewable fuel per year
Pre
cast
Co
ncr
ete
Pro
du
cts Dallas Area
Rapid Transit
• Precast concrete sound walls to be provided in addition to rail products
• Wide US geographic reach, with product offerings leveraging synergies across multiple business units
Fab
rica
ted
Ste
el P
rod
uct
s Newburgh Beacon Bridge
• Providing new steel grid bridge deck panels and other supplies for New York City area bridge rehabilitation
• Steel fabrication technology reinforces precast concrete, which will also be cast as panels are installed
Rai
l Pro
du
cts Class 1 Insulated
Rail Joint Project• For use in heavy-duty
rail locations; insulated joint products are unaffected by temperature, sunlight, moisture, or lubricants
• Enhances the useful life of rail upon installation as well as efficiency and safety
Project Highlights
Recent projects for each of the Company’s business units include:
7 | L.B. FosterSingular Midwestern Values ConferenceSeptember 16, 2021
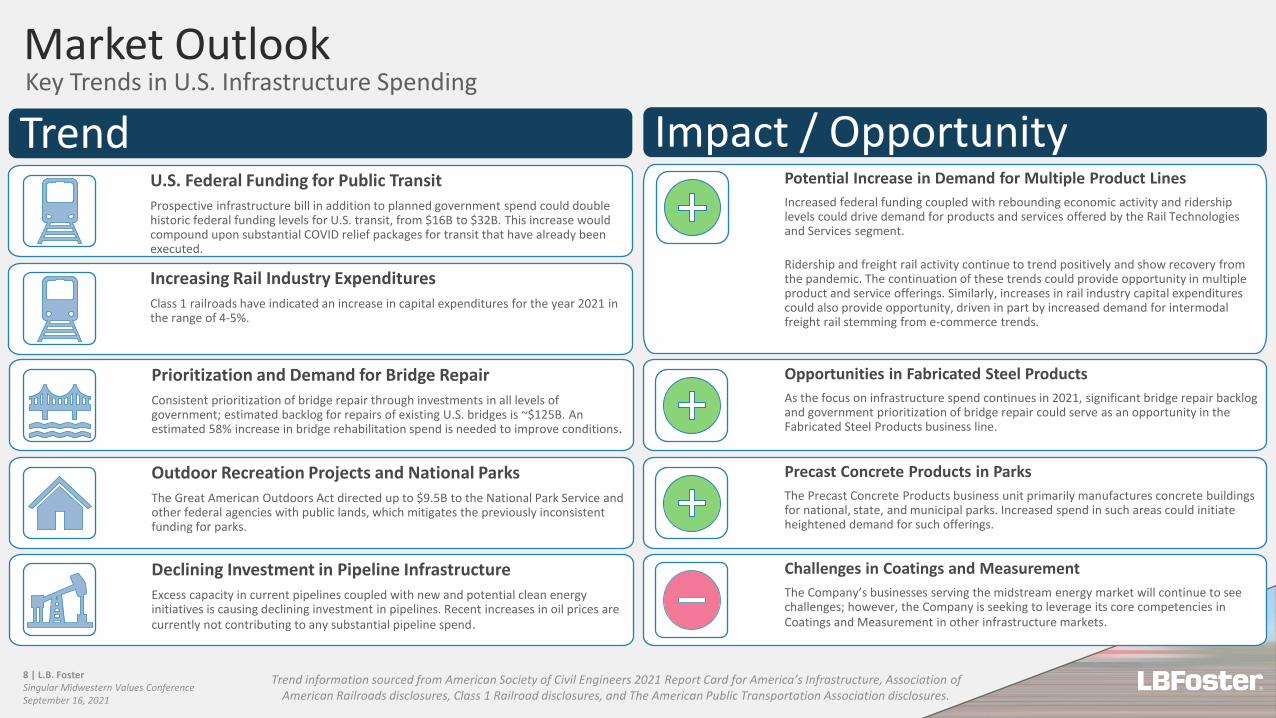
Trend information sourced from American Society of Civil Engineers 2021 Report Card for America’s Infrastructure, Association ofAmerican Railroads disclosures, Class 1 Railroad disclosures, and The American Public Transportation Association disclosures.
U.S. Federal Funding for Public Transit
Prospective infrastructure bill in addition to planned government spend could double historic federal funding levels for U.S. transit, from $16B to $32B. This increase would compound upon substantial COVID relief packages for transit that have already been executed.
Prioritization and Demand for Bridge Repair
Consistent prioritization of bridge repair through investments in all levels of government; estimated backlog for repairs of existing U.S. bridges is ~$125B. An estimated 58% increase in bridge rehabilitation spend is needed to improve conditions.
Outdoor Recreation Projects and National Parks
The Great American Outdoors Act directed up to $9.5B to the National Park Service and other federal agencies with public lands, which mitigates the previously inconsistent funding for parks.
Declining Investment in Pipeline Infrastructure
Excess capacity in current pipelines coupled with new and potential clean energy initiatives is causing declining investment in pipelines. Recent increases in oil prices are currently not contributing to any substantial pipeline spend.
TrendPotential Increase in Demand for Multiple Product Lines
Increased federal funding coupled with rebounding economic activity and ridership levels could drive demand for products and services offered by the Rail Technologies and Services segment.
Ridership and freight rail activity continue to trend positively and show recovery from the pandemic. The continuation of these trends could provide opportunity in multiple product and service offerings. Similarly, increases in rail industry capital expenditures could also provide opportunity, driven in part by increased demand for intermodal freight rail stemming from e-commerce trends.
Opportunities in Fabricated Steel Products
As the focus on infrastructure spend continues in 2021, significant bridge repair backlog and government prioritization of bridge repair could serve as an opportunity in the Fabricated Steel Products business line.
Precast Concrete Products in Parks
The Precast Concrete Products business unit primarily manufactures concrete buildings for national, state, and municipal parks. Increased spend in such areas could initiate heightened demand for such offerings.
Challenges in Coatings and Measurement
The Company’s businesses serving the midstream energy market will continue to see challenges; however, the Company is seeking to leverage its core competencies in Coatings and Measurement in other infrastructure markets.
Impact / Opportunity
Increasing Rail Industry Expenditures
Class 1 railroads have indicated an increase in capital expenditures for the year 2021 in the range of 4-5%.
Market OutlookKey Trends in U.S. Infrastructure Spending
8 | L.B. FosterSingular Midwestern Values ConferenceSeptember 16, 2021
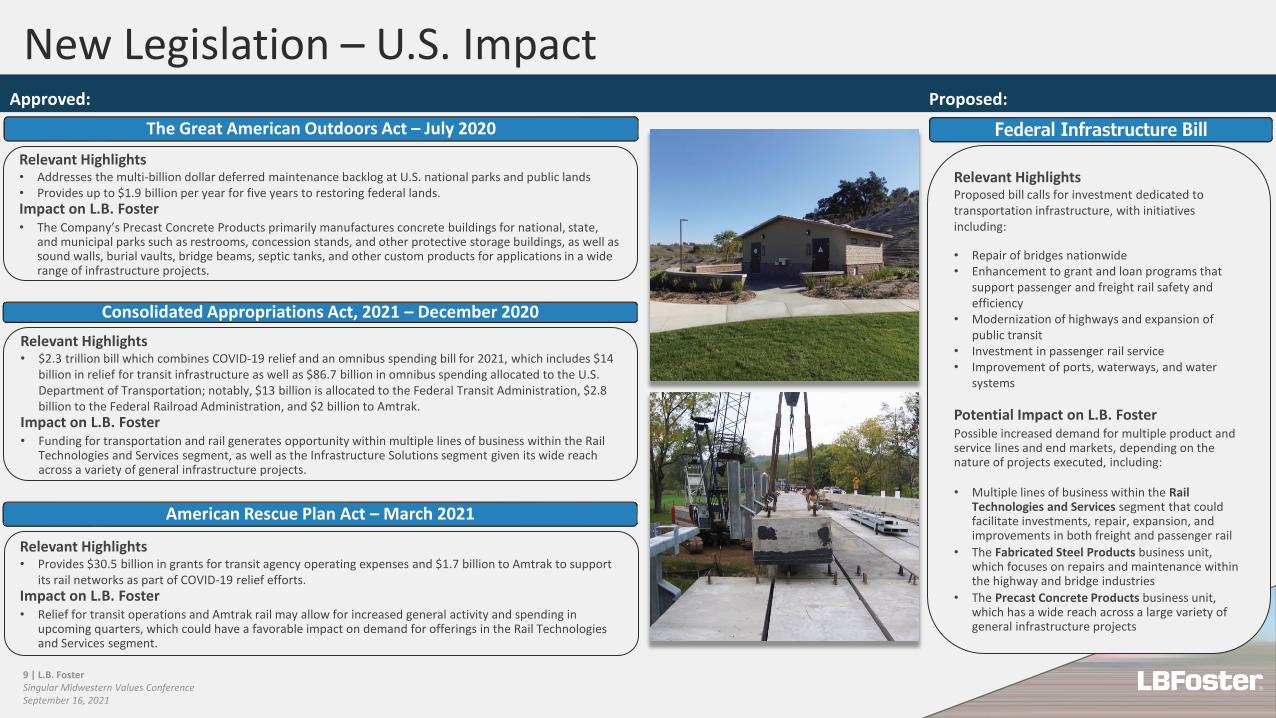
Relevant HighlightsProposed bill calls for investment dedicated to transportation infrastructure, with initiatives including:
• Repair of bridges nationwide• Enhancement to grant and loan programs that
support passenger and freight rail safety and efficiency
• Modernization of highways and expansion of public transit
• Investment in passenger rail service• Improvement of ports, waterways, and water
systems
Potential Impact on L.B. FosterPossible increased demand for multiple product and service lines and end markets, depending on the nature of projects executed, including:
• Multiple lines of business within the Rail Technologies and Services segment that could facilitate investments, repair, expansion, and improvements in both freight and passenger rail
• The Fabricated Steel Products business unit, which focuses on repairs and maintenance within the highway and bridge industries
• The Precast Concrete Products business unit, which has a wide reach across a large variety of general infrastructure projects
Federal Infrastructure Bill
Relevant Highlights• Addresses the multi-billion dollar deferred maintenance backlog at U.S. national parks and public lands • Provides up to $1.9 billion per year for five years to restoring federal lands.
Impact on L.B. Foster• The Company’s Precast Concrete Products primarily manufactures concrete buildings for national, state,
and municipal parks such as restrooms, concession stands, and other protective storage buildings, as well as sound walls, burial vaults, bridge beams, septic tanks, and other custom products for applications in a wide range of infrastructure projects.
The Great American Outdoors Act – July 2020
Approved: Proposed:
Relevant Highlights• $2.3 trillion bill which combines COVID-19 relief and an omnibus spending bill for 2021, which includes $14
billion in relief for transit infrastructure as well as $86.7 billion in omnibus spending allocated to the U.S. Department of Transportation; notably, $13 billion is allocated to the Federal Transit Administration, $2.8 billion to the Federal Railroad Administration, and $2 billion to Amtrak.
Impact on L.B. Foster• Funding for transportation and rail generates opportunity within multiple lines of business within the Rail
Technologies and Services segment, as well as the Infrastructure Solutions segment given its wide reach across a variety of general infrastructure projects.
Consolidated Appropriations Act, 2021 – December 2020
Relevant Highlights• Provides $30.5 billion in grants for transit agency operating expenses and $1.7 billion to Amtrak to support
its rail networks as part of COVID-19 relief efforts.
Impact on L.B. Foster• Relief for transit operations and Amtrak rail may allow for increased general activity and spending in
upcoming quarters, which could have a favorable impact on demand for offerings in the Rail Technologies and Services segment.
American Rescue Plan Act – March 2021
New Legislation – U.S. Impact
9 | L.B. FosterSingular Midwestern Values ConferenceSeptember 16, 2021

$0
$50
$100
$150
YTD Q2 2020 YTD Q2 2021
$145 $155
$28 $29
Revenue and Gross Profit($ in millions)
Revenue Gross Profit
$0
$50
$100
$150
YTD Q2 2020 YTD Q2 2021
$149 $140
New Orders($ in millions)
Key Offerings• Track infrastructure products and
services offering advanced rail technologies
• Managing the wheel-rail interface with friction management solutions
• Automation, telecoms, and condition monitoring
Competitive Advantage• Expertise in product innovation
that reduces rail maintenance costs and increases asset life and return on investment for network owners
Business Highlights• Strong 2021 sales growth; backlog
remains above pre-pandemic levels
• Rail service projects driving COVID-19 recovery within the segment
• Both domestic and international opportunity for the expansion of Rail Technologies focused on enhanced safety and new efficiencies for end users
$0
$50
$100
Q22020
Q22021
$106 $103
Backlog($ in millions)
7%
7%
(6%) (3%)
19% 19% $155
YTD Q2 2021 Net Sales by Segment
($ in millions)
Rail Technologies and Services
Infrastructure Solutions
Rail Technologies and Services
10 | L.B. FosterSingular Midwestern Values ConferenceSeptember 16, 2021
Rail Technologies Totems
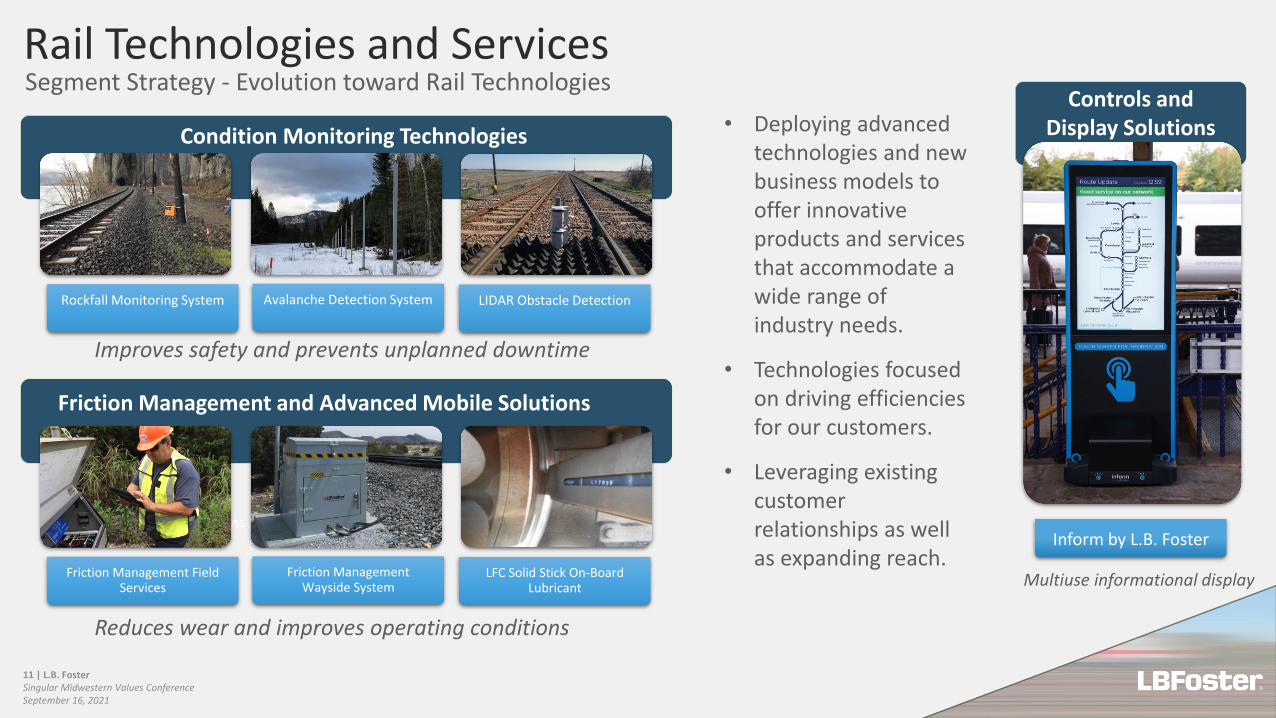
Rockfall Monitoring System Avalanche Detection System LIDAR Obstacle Detection
Friction Management Field Services
Friction Management Wayside System
LFC Solid Stick On-Board Lubricant
Condition Monitoring Technologies
Improves safety and prevents unplanned downtime
Friction Management and Advanced Mobile Solutions
Reduces wear and improves operating conditions
Inform by L.B. Foster
Controls and Display Solutions• Deploying advanced
technologies and new business models to offer innovative products and services that accommodate a wide range of industry needs.
• Technologies focused on driving efficiencies for our customers.
• Leveraging existing customer relationships as well as expanding reach.
Multiuse informational display
Rail Technologies and Services
11 | L.B. FosterSingular Midwestern Values ConferenceSeptember 16, 2021
Segment Strategy - Evolution toward Rail Technologies
$0
$25
$50
$75
$100
$125
YTD Q2 2020 YTD Q2 2021
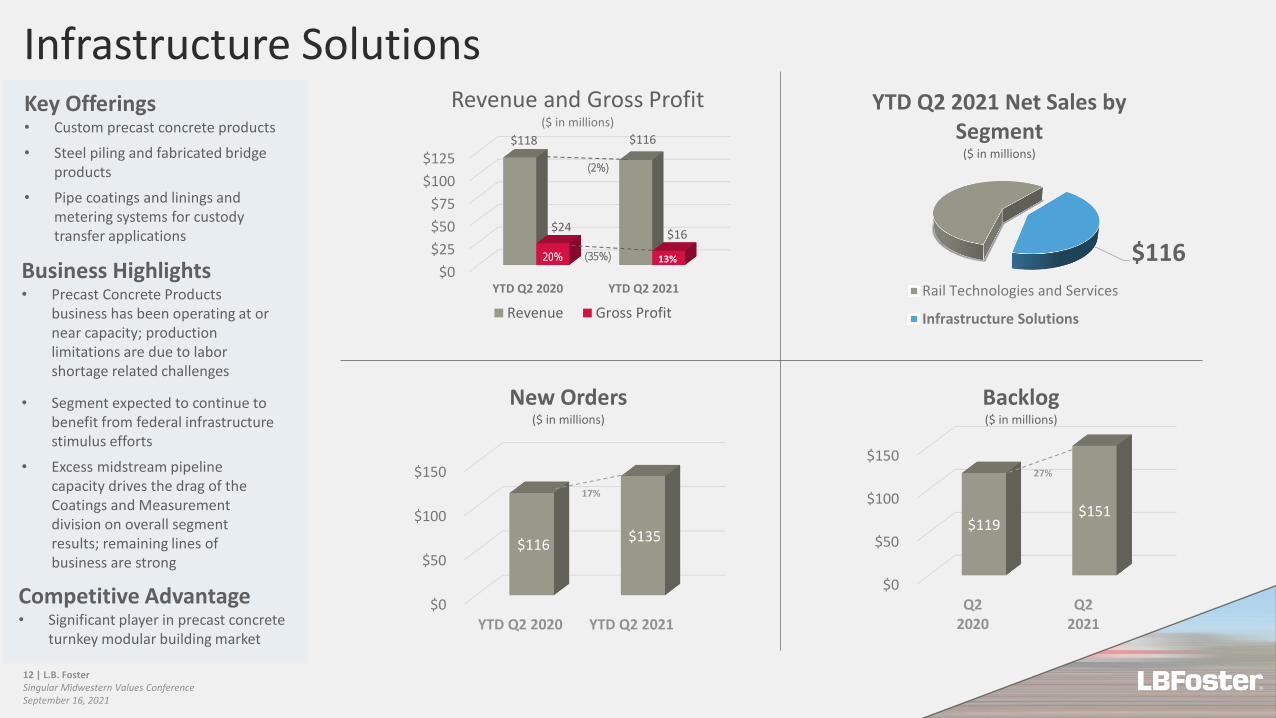
$118 $116
$24$16
Revenue and Gross Profit($ in millions)
Revenue Gross Profit
$0
$50
$100
$150
YTD Q2 2020 YTD Q2 2021
$116 $135
New Orders($ in millions)
Key Offerings• Custom precast concrete products
• Steel piling and fabricated bridge products
• Pipe coatings and linings and metering systems for custody transfer applications
Competitive Advantage• Significant player in precast concrete
turnkey modular building market
Business Highlights• Precast Concrete Products
business has been operating at or near capacity; production limitations are due to labor shortage related challenges
• Segment expected to continue to benefit from federal infrastructure stimulus efforts
• Excess midstream pipeline capacity drives the drag of the Coatings and Measurement division on overall segment results; remaining lines of business are strong
$0
$50
$100
$150
Q22020
Q22021
$119$151
Backlog($ in millions)
(2%)
(35%)
17%
27%
20% 13% $116
YTD Q2 2021 Net Sales by Segment
($ in millions)
Rail Technologies and Services
Infrastructure Solutions
Infrastructure Solutions
12 | L.B. FosterSingular Midwestern Values ConferenceSeptember 16, 2021

$16.4 $20.1
$25.6$32.2
$24.6$13.4
$0
$20
$40
$60
Q2 2020 Q2 2021
Quarterly Revenue – Q2 vs Q2($ in millions)
$3.0 $3.9
$3.1$3.8
$7.0$1.9
$0
$5
$10
$15
Q2 2020 Q2 2021
Quarterly Gross Profit – Q2 vs Q2($ in millions)
Precast Concrete Products Fabricated Steel Products Coatings and Measurement
$66.6 $65.7 $13.1
$9.5
Note figures may not foot due to rounding. Data presented on a continuing operations basis.
• Both the Precast Concrete Products and Fabricated Steel Products business units have reported increases in revenue and gross profit when compared to the prior year quarter and prior year-to-date period ended June 30, an indication of a recovery from unfavorable conditions in 2020.
• Declines in sales volumes within the Coatings and Measurement business unit drive sharper declines in gross profit within the business unit.
• Weakness in Coatings and Measurement has continued to be a drag on overall segment results, offsetting strength in the remaining business units.
$27.1 $32.8
$44.0$59.9
$47.3$22.9
$0
$25
$50
$75
$100
$125
YTD Q2 2020 YTD Q2 2021
YTD Revenue – YoY($in millions)
$118.3 $115.6
$4.2 $6.4
$6.0$6.1
$13.6$3.1
$0
$5
$10
$15
$20
$25
YTD Q2 2020 YTD Q2 2021
YTD Gross Profit – YoY($ in millions)
$23.7
$15.5
Q2 2020 versus Q2 2021 Results
YTD Q2 2020 versus YTD Q2 2021 Results
Infrastructure SolutionsBusiness Unit Detail
13 | L.B. FosterSingular Midwestern Values ConferenceSeptember 16, 2021
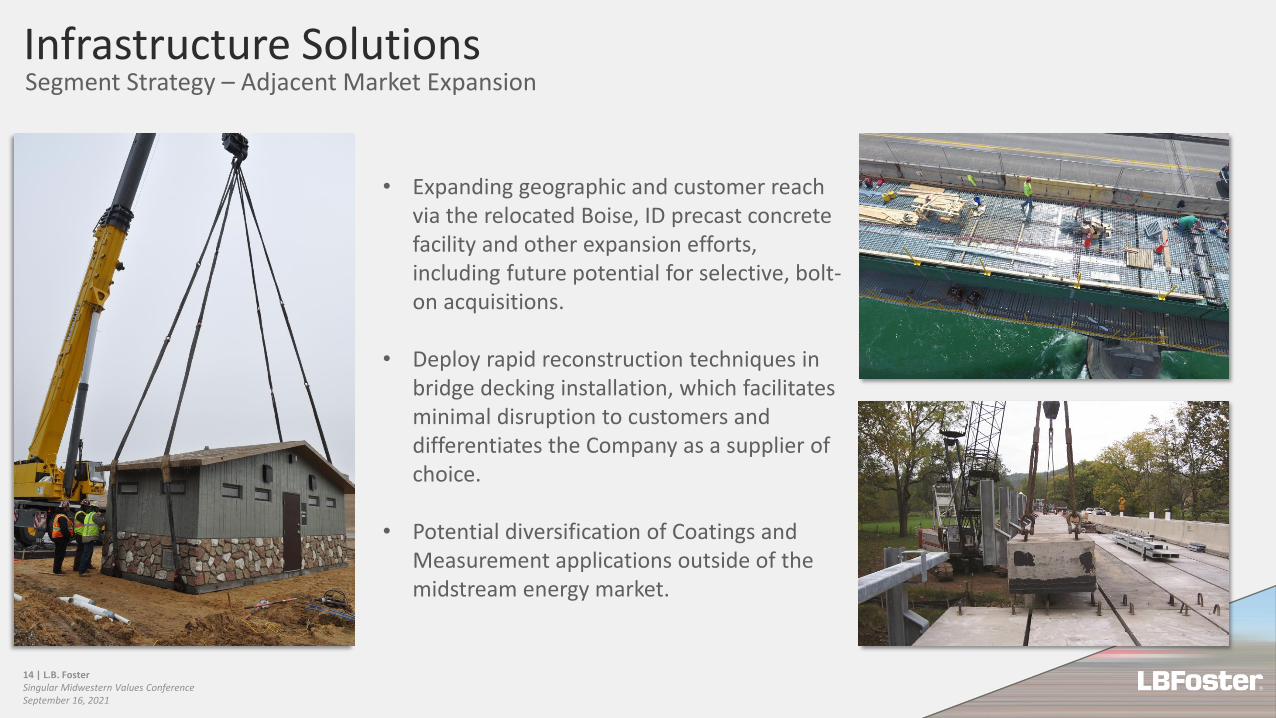
• Expanding geographic and customer reach via the relocated Boise, ID precast concrete facility and other expansion efforts, including future potential for selective, bolt-on acquisitions.
• Deploy rapid reconstruction techniques in bridge decking installation, which facilitates minimal disruption to customers and differentiates the Company as a supplier of choice.
• Potential diversification of Coatings and Measurement applications outside of the midstream energy market.
Infrastructure SolutionsSegment Strategy – Adjacent Market Expansion
14 | L.B. FosterSingular Midwestern Values ConferenceSeptember 16, 2021
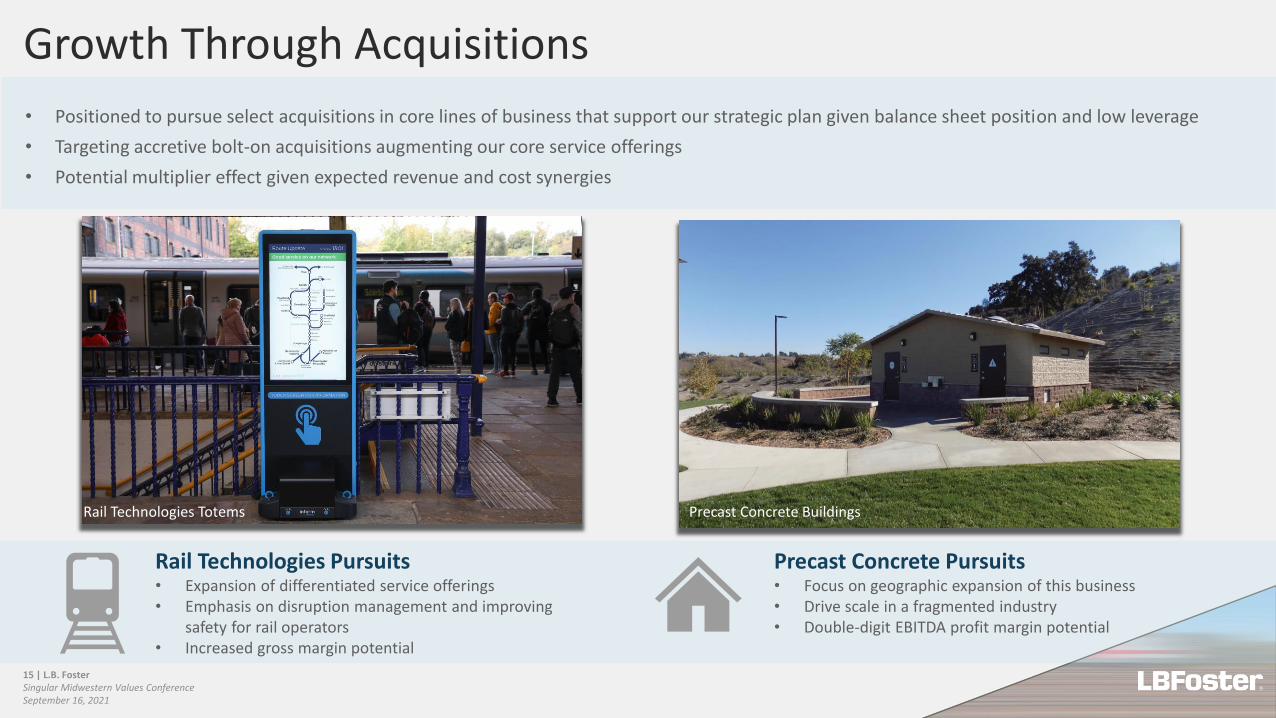
Rail Technologies Pursuits• Expansion of differentiated service offerings• Emphasis on disruption management and improving
safety for rail operators• Increased gross margin potential
Precast Concrete Pursuits• Focus on geographic expansion of this business• Drive scale in a fragmented industry• Double-digit EBITDA profit margin potential
• Positioned to pursue select acquisitions in core lines of business that support our strategic plan given balance sheet position and low leverage
• Targeting accretive bolt-on acquisitions augmenting our core service offerings
• Potential multiplier effect given expected revenue and cost synergies
Rail Technologies Totems Precast Concrete Buildings
Growth Through Acquisitions
15 | L.B. FosterSingular Midwestern Values ConferenceSeptember 16, 2021
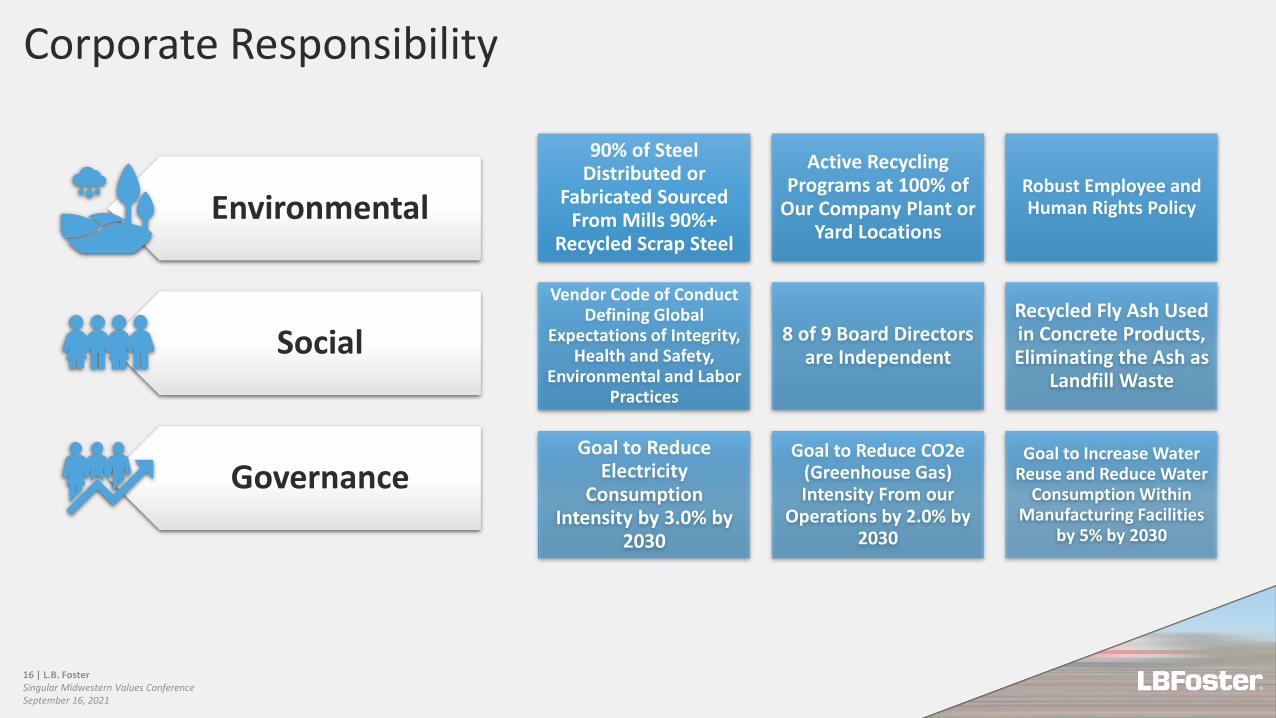
Environmental
Social
Governance
90% of Steel Distributed or
Fabricated Sourced From Mills 90%+
Recycled Scrap Steel
Active Recycling Programs at 100% of
Our Company Plant or Yard Locations
Robust Employee and Human Rights Policy
Vendor Code of Conduct Defining Global
Expectations of Integrity, Health and Safety,
Environmental and Labor Practices
8 of 9 Board Directors are Independent
Recycled Fly Ash Used in Concrete Products, Eliminating the Ash as
Landfill Waste
Goal to Reduce Electricity
Consumption Intensity by 3.0% by
2030
Goal to Reduce CO2e (Greenhouse Gas) Intensity From our
Operations by 2.0% by 2030
Goal to Increase Water Reuse and Reduce Water
Consumption Within Manufacturing Facilities
by 5% by 2030
Corporate Responsibility
16 | L.B. FosterSingular Midwestern Values ConferenceSeptember 16, 2021

17 | L.B. FosterSingular Midwestern Values ConferenceSeptember 16, 2021
Driving Shareholder Value
Focus on Rail Technologies Precast Concrete Expansion
Sustain Organic Company Growth Through Margin and
Profit Improvement and Expanding Customer Reach
Maintain Strong Operating Cash Flow and Free Cash Flow
Through Working Capital Management
Continued Focus On Debt Paydown and Sustaining Our
Strong Balance Sheet and Modest Leverage Ratio
Deploy Cash to Execute Bolt-On Acquisitions, With a Focus
On Rail Technologies and Precast Concrete
Drive Shareholder Value

Financial Highlights
19 | L.B. FosterSingular Midwestern Values ConferenceSeptember 16, 2021
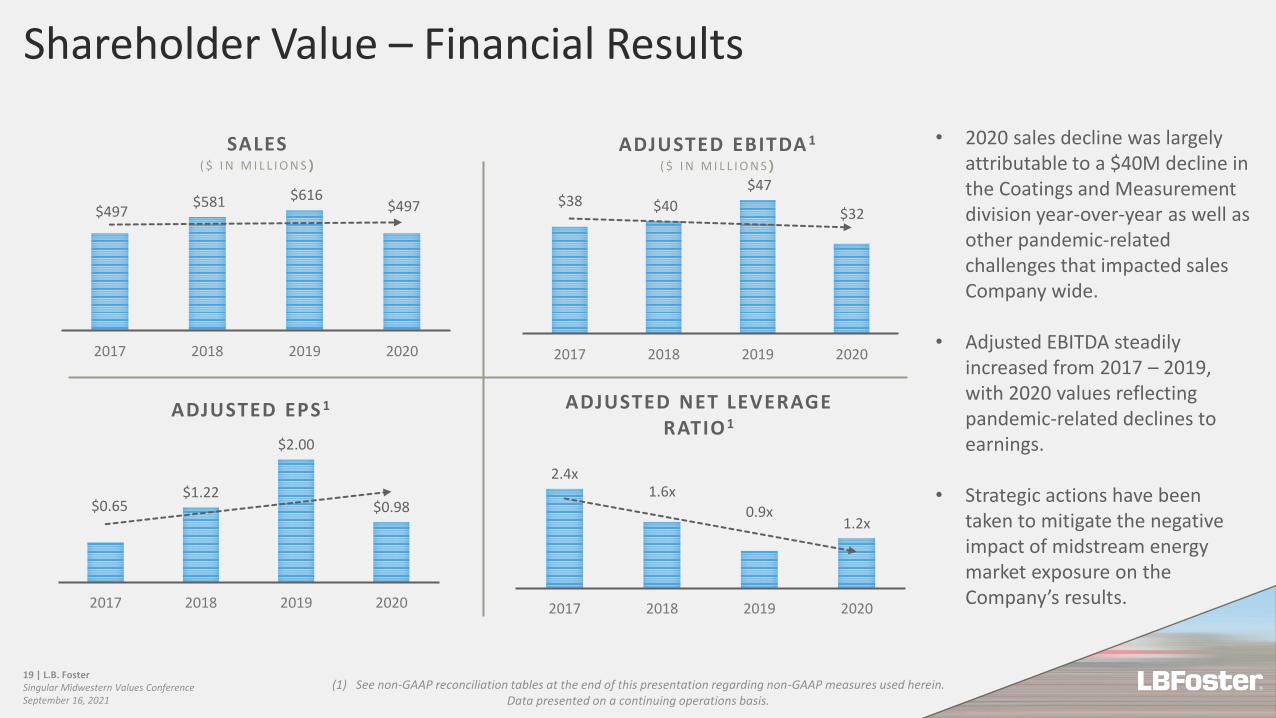
2.4x1.6x
0.9x1.2x
2017 2018 2019 2020
ADJUSTED NET LEVERAGE RATIO 1
$497 $581 $616
$497
2017 2018 2019 2020
SALES( $ I N M I L L I O N S )
$38 $40
$47
$32
2017 2018 2019 2020
ADJUSTED EBITDA 1
( $ I N M I L L I O N S )
• 2020 sales decline was largely attributable to a $40M decline in the Coatings and Measurement division year-over-year as well as other pandemic-related challenges that impacted sales Company wide.
• Adjusted EBITDA steadily increased from 2017 – 2019, with 2020 values reflecting pandemic-related declines to earnings.
• Strategic actions have been taken to mitigate the negative impact of midstream energy market exposure on the Company’s results.
$0.65$1.22
$2.00
$0.98
2017 2018 2019 2020
ADJUSTED EPS 1
(1) See non-GAAP reconciliation tables at the end of this presentation regarding non-GAAP measures used herein.Data presented on a continuing operations basis.
Shareholder Value – Financial Results
20 | L.B. FosterSingular Midwestern Values ConferenceSeptember 16, 2021
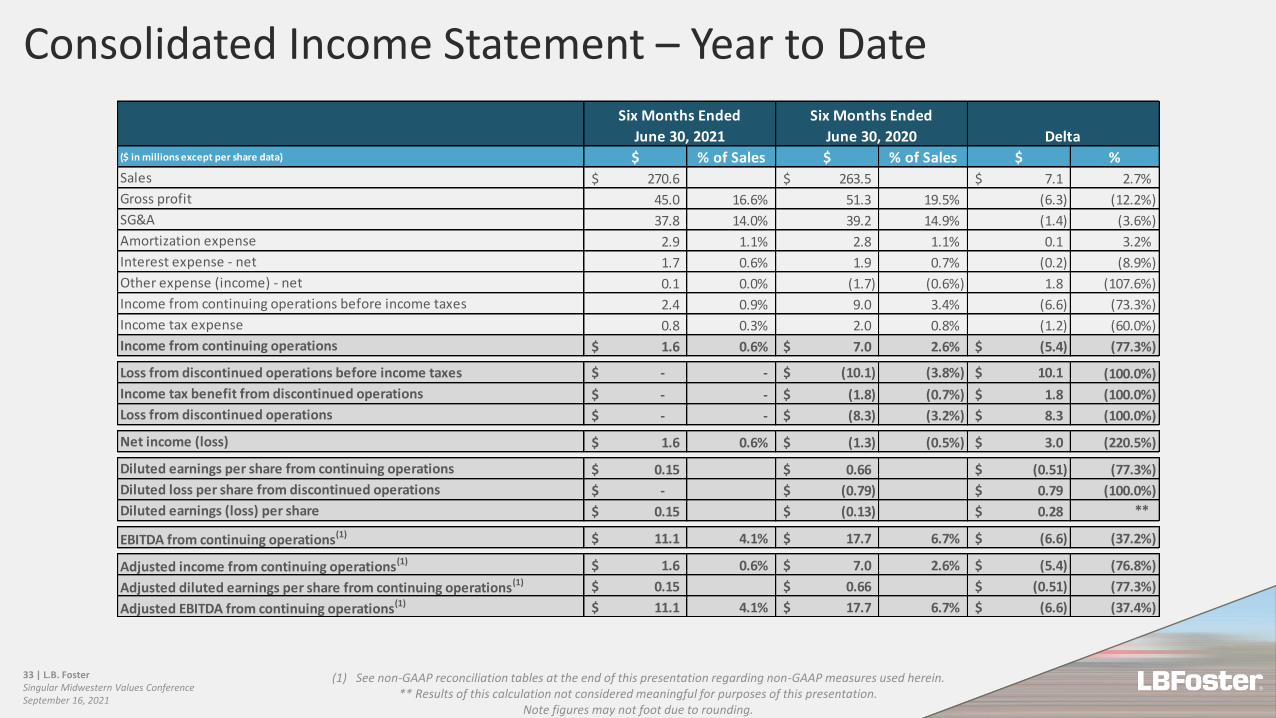
Year to Date Results
(1) See non-GAAP reconciliation tables at the end of this presentation regarding non-GAAP measures used herein.** Results of this calculation are not considered to be meaningful for purposes of this presentation.
Note figures may not foot due to rounding. Data presented on a continuing operations basis.
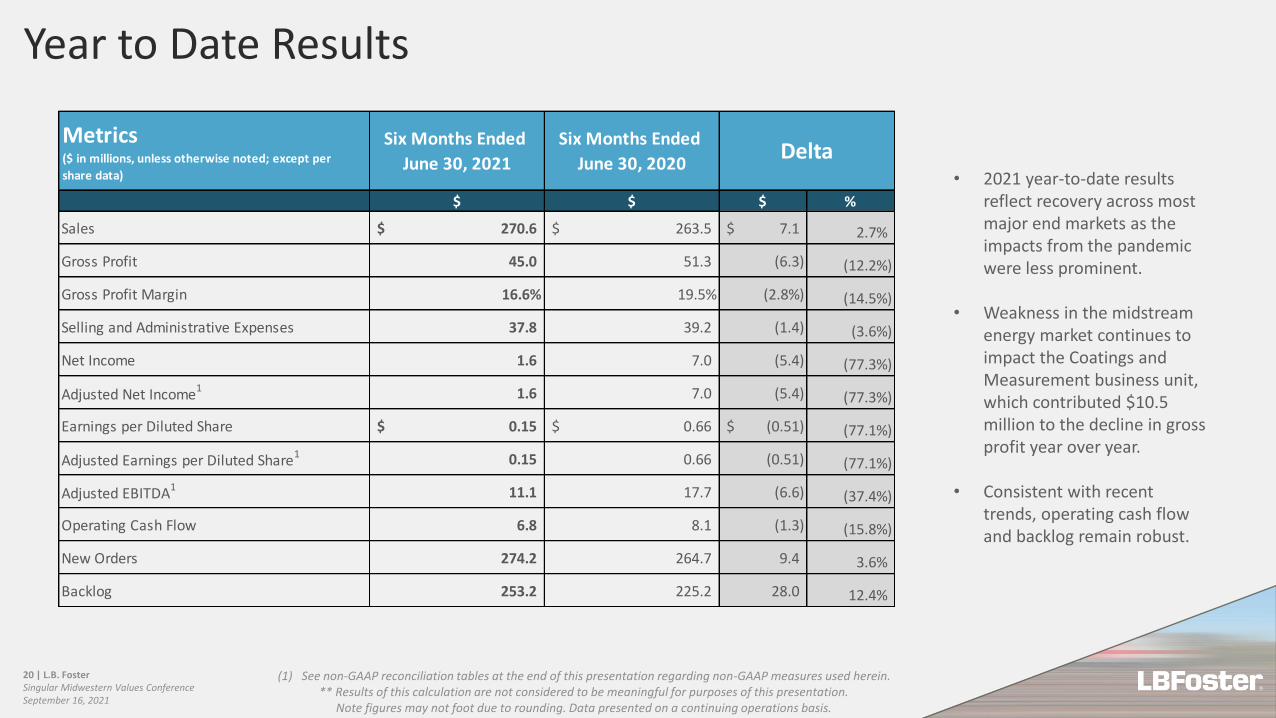
• 2021 year-to-date results reflect recovery across most major end markets as the impacts from the pandemic were less prominent.
• Weakness in the midstream energy market continues to impact the Coatings and Measurement business unit, which contributed $10.5 million to the decline in gross profit year over year.
• Consistent with recent trends, operating cash flow and backlog remain robust.
Metrics($ in millions, unless otherwise noted; except per
share data)
Six Months Ended
June 30, 2021
Six Months Ended
June 30, 2020
$ $ $ %
Sales 270.6$ 263.5$ 7.1$ 2.7%
Gross Profit 45.0 51.3 (6.3) (12.2%)
Gross Profit Margin 16.6% 19.5% (2.8%) (14.5%)
Selling and Administrative Expenses 37.8 39.2 (1.4) (3.6%)
Net Income 1.6 7.0 (5.4) (77.3%)
Adjusted Net Income1 1.6 7.0 (5.4) (77.3%)
Earnings per Diluted Share 0.15$ 0.66$ (0.51)$ (77.1%)
Adjusted Earnings per Diluted Share1 0.15 0.66 (0.51) (77.1%)
Adjusted EBITDA1 11.1 17.7 (6.6) (37.4%)
Operating Cash Flow 6.8 8.1 (1.3) (15.8%)
New Orders 274.2 264.7 9.4 3.6%
Backlog 253.2 225.2 28.0 12.4%
Delta
21 | L.B. FosterSingular Midwestern Values ConferenceSeptember 16, 2021
Second Quarter Results
(1) See non-GAAP reconciliation tables at the end of this presentation regarding non-GAAP measures used herein.** Results of this calculation are not considered to be meaningful for purposes of this presentation.
Note figures may not foot due to rounding. Data presented on a continuing operations basis.
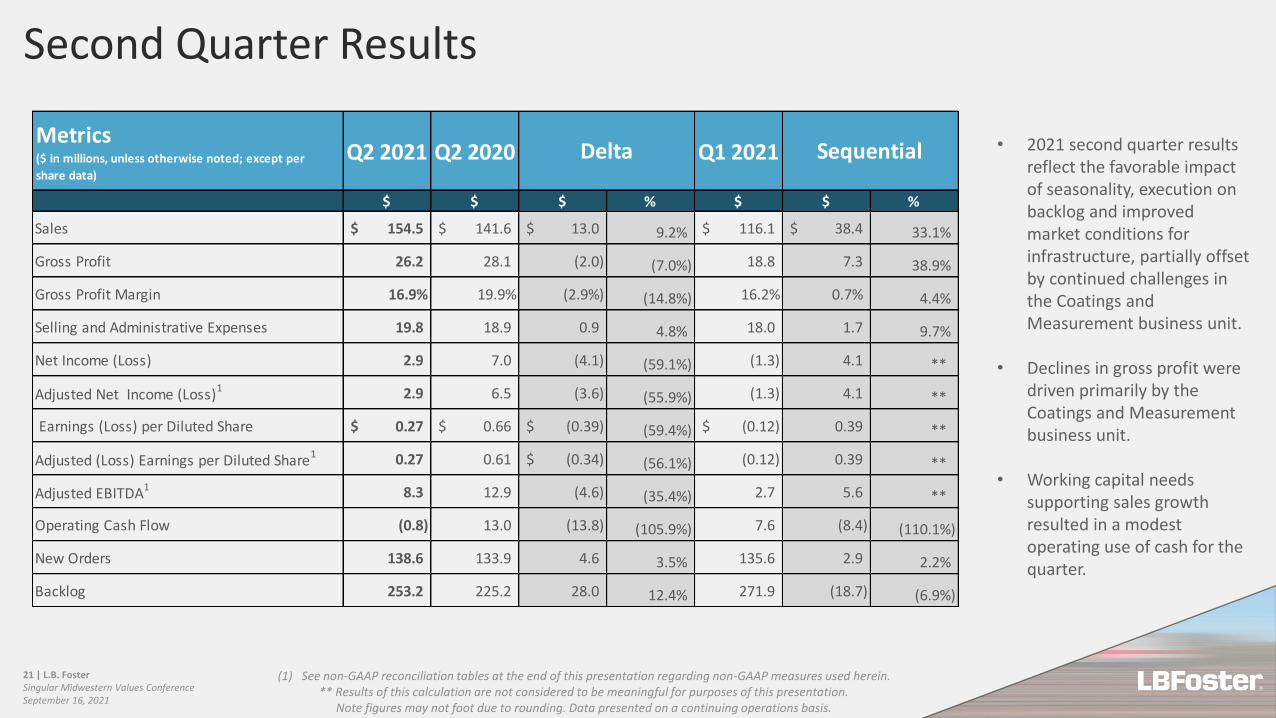
• 2021 second quarter results reflect the favorable impact of seasonality, execution on backlog and improved market conditions for infrastructure, partially offset by continued challenges in the Coatings and Measurement business unit.
• Declines in gross profit were driven primarily by the Coatings and Measurement business unit.
• Working capital needs supporting sales growth resulted in a modest operating use of cash for the quarter.
Metrics($ in millions, unless otherwise noted; except per
share data)
Q2 2021 Q2 2020 Q1 2021
$ $ $ % $ $ %
Sales 154.5$ 141.6$ 13.0$ 9.2% 116.1$ 38.4$ 33.1%
Gross Profit 26.2 28.1 (2.0) (7.0%) 18.8 7.3 38.9%
Gross Profit Margin 16.9% 19.9% (2.9%) (14.8%) 16.2% 0.7% 4.4%
Selling and Administrative Expenses 19.8 18.9 0.9 4.8% 18.0 1.7 9.7%
Net Income (Loss) 2.9 7.0 (4.1) (59.1%) (1.3) 4.1 **
Adjusted Net Income (Loss)1 2.9 6.5 (3.6) (55.9%) (1.3) 4.1 **
Earnings (Loss) per Diluted Share 0.27$ 0.66$ (0.39)$ (59.4%) (0.12)$ 0.39 **
Adjusted (Loss) Earnings per Diluted Share1 0.27 0.61 (0.34)$ (56.1%) (0.12) 0.39 **
Adjusted EBITDA1 8.3 12.9 (4.6) (35.4%) 2.7 5.6 **
Operating Cash Flow (0.8) 13.0 (13.8) (105.9%) 7.6 (8.4) (110.1%)
New Orders 138.6 133.9 4.6 3.5% 135.6 2.9 2.2%
Backlog 253.2 225.2 28.0 12.4% 271.9 (18.7) (6.9%)
SequentialDelta
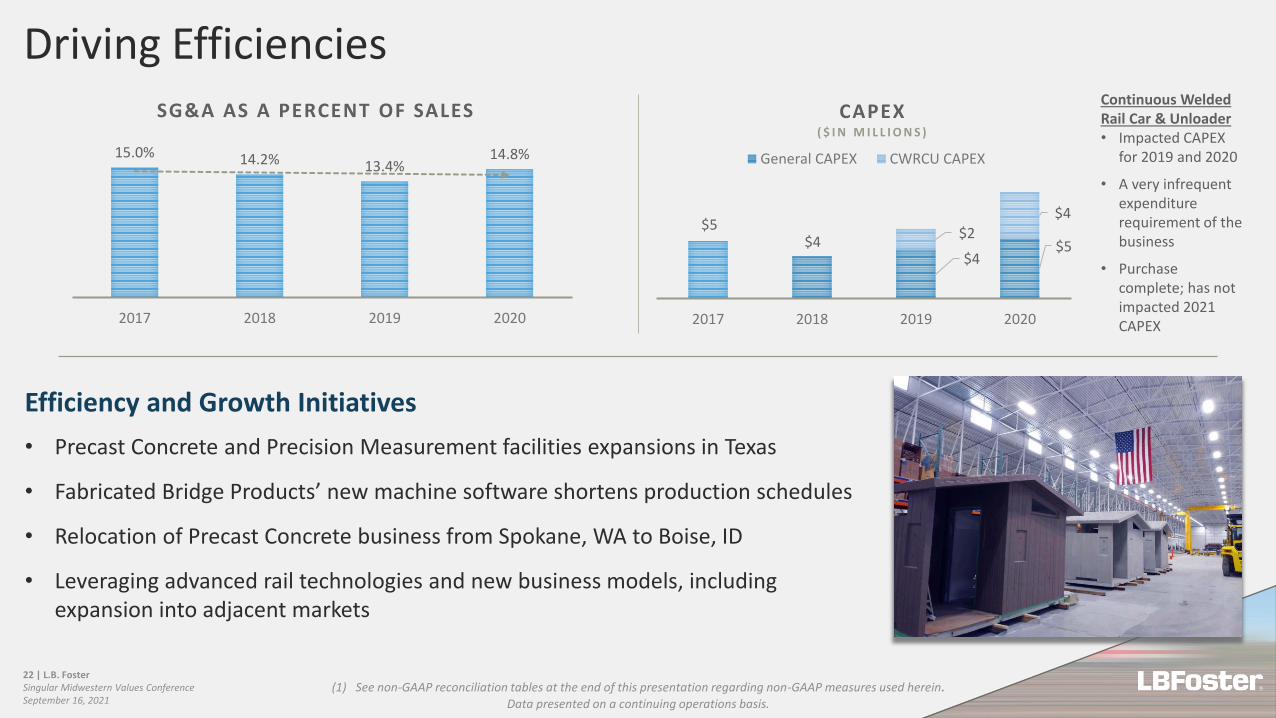
$5$4
$4$5
$2
$4
2017 2018 2019 2020
CAPEX( $ I N M I L L I O N S )
General CAPEX CWRCU CAPEX
Efficiency and Growth Initiatives
• Precast Concrete and Precision Measurement facilities expansions in Texas
• Fabricated Bridge Products’ new machine software shortens production schedules
• Relocation of Precast Concrete business from Spokane, WA to Boise, ID
• Leveraging advanced rail technologies and new business models, including expansion into adjacent markets
15.0% 14.2% 13.4%14.8%
2017 2018 2019 2020
SG&A AS A PERCENT OF SALESContinuous Welded Rail Car & Unloader• Impacted CAPEX
for 2019 and 2020
• A very infrequent expenditure requirement of the business
• Purchase complete; has not impacted 2021 CAPEX
(1) See non-GAAP reconciliation tables at the end of this presentation regarding non-GAAP measures used herein.Data presented on a continuing operations basis.
Driving Efficiencies
22 | L.B. FosterSingular Midwestern Values ConferenceSeptember 16, 2021

(1) Closing share prices as December 31, 2020, December 31, 2019, and December 31, 2018, respectively.(2) See reconciliation included in this slide for this displayed non-GAAP measure. This measure calculated on a continuing operations basis.
Note: Figures may not foot due to rounding.
• Consistent, positive trend of solid free cash flow in recent years.
• Capital expenditures expected to be in a range of $6M to $8M per annum.
• Increased working capital needs supporting an improving commercial outlook impacted cash flow in Q2 of 2021.
Free Cash FlowNon-GAAP Measure
23 | L.B. FosterSingular Midwestern Values ConferenceSeptember 16, 2021

24 | L.B. FosterSingular Midwestern Values ConferenceSeptember 16, 2021
2.4x
1.6x
0.9x
1.3x1.2x
1.3x
$92.3
$64.7
$44.0 $48.2
$37.5 $33.1
$-
$10
$20
$30
$40
$50
$60
$70
$80
$90
$100
0.0x
0.5x
1.0x
1.5x
2.0x
2.5x
3.0x
3.5x
4.0x
2017 2018 2019 TTM Q2 2020 2020 TTM Q2 2021
Ne
t D
ebt
(in
mill
ion
s)
CHANGE IN ADJUSTED NET LEVERAGE RATIO 1
Adjusted Net Leverage Ratio Net Debt (in millions)
(1) See non-GAAP reconciliation tables at the end of this presentation regarding non-GAAP measures used herein.
• Net Debt1 as of June 30, 2021 declined $15.1 million compared to the prior year quarter end and declined by $4.4 million compared December 31, 2020.
• Over the longer term, the Company’s systematic approach to reducing Net Debt1 has resulted in an improving Adjusted Net Leverage Ratio and enhanced financial flexibility.
Leverage Trends

(1) See non-GAAP reconciliation tables at the end of this presentation regarding non-GAAP measures used herein.(2) Subject to covenant restrictions.
Note figures may not foot due to rounding.
• In August of 2021, the Company expanded and extended its credit agreement on more favorable terms, including a $15M increase in borrowing capacity.
• Total available funding capacity2 expanded $10.5M during the second quarter, finishing at $81.6M at quarter end.
• Net Debt1 is down $15.1M versus the comparable prior-year quarter end, with the Company’s Adjusted Net Leverage Ratio1 remaining unchanged at 1.3x year-over-year.
Focus on Liquidity
25 | L.B. FosterSingular Midwestern Values ConferenceSeptember 16, 2021
4.1$ 7.6$ 7.4$
115.0 115.0 120.0
Outstanding Borrowings on Revolving Credit Facility (37.0) (44.8) (55.3)
Letters of Credit Outstanding (0.5) (0.9) (1.0)
77.5$ 69.3$ 63.7$
81.6$ 76.8$ 71.1$
Outstanding Borrowings on Revolving Credit Facility 37.0 44.8 55.3
Finance Leases and Financing Agreements 0.2 0.2 0.3
$ 37.2 $ 45.0 $ 55.6
$ 33.1 $ 37.5 $ 48.2
25.4 32.0 37.8
1.3 x 1.2 x 1.3 x
Total Net Debt Outstanding1
LTM Adjusted EBITDA1
Adjusted Net Leverage Ratio1
($ in millions, unless otherwise noted)
Cash & Cash Equivalents
Total Availability Under the Credit Facility
Net Availability Under the Revolving Credit Facility2
December 31,
2020
Total Available Funding Capacity2
Total Debt Outstanding
June 30,
2021
June 30,
2020

$134 $131 $134 $136 $139 $142
$118 $116 $116
$155
$0
$25
$50
$75
$100
$125
$150
Q2 2020 Q3 2020 Q4 2020 Q1 2021 Q2 2021
Total New Orders and Revenue Levels($ in millions)
Total New Orders Total Revenue
$74$68
$81
$69 $71$75
$64 $67 $66
$89
$0
$25
$50
$75
Q2 2020 Q3 2020 Q4 2020 Q1 2021 Q2 2021
Rail Technologies & Services($ in millions)
New Orders Revenue
$60 $62
$54
$67 $68 $67
$54 $48 $50
$66
$0
$25
$50
$75
Q2 2020 Q3 2020 Q4 2020 Q1 2021 Q2 2021
Infrastructure Solutions($ in millions)
New Orders Revenue
Data presented on a continuing operations basis.(1) Defined as new orders divided by revenue.
• The Company continues to see strong order activity for infrastructure projects, with the 2021 second quarter producing the highest level of order activity for the Company since the fourth quarter of 2019.
• The Company has a LTM book-to-bill ratio1 1.07 as of June 30, 2021.
• For the LTM ended June 30, 2021, Rail Technologies and Services and Infrastructure Solutions had a book-to-bill ratio1 of 1.01 and 1.15, respectively.
Orders and Revenue
26 | L.B. FosterSingular Midwestern Values ConferenceSeptember 16, 2021

Recent Significant OrdersCanadian Pacific Trackside Systems• Installation of several dozen trackside
friction management systems along Canadian Pacific Railway’s Mountain Subdivision in Illecillewaet, British Columbia
• Anticipated to drastically reduce rail wear rates in this region as well as reduce site maintenance visits by 50%
Texas Highway Project• Texas Department of Transportation
project for mechanically stabilized earth wall in Dallas along a major highway
• Supplying precast concrete panels with various textures and concrete coping to support the 36-month project
Newburgh-Beacon Bridge• Providing new roadway decking and other
supplies for the rehabilitation of the north span of New York State Bridge Authority’s Newburgh-Beacon Bridge
27 | L.B. FosterSingular Midwestern Values ConferenceSeptember 16, 2021
$225.2
$253.2$31.6
$3.6
0
50
100
150
200
250
300
June 30, 2020 Rail Technologies and Services Infrastructure Solutions June 30, 2021
Backlog as of June 30, 2021($ in millions)
Period Total Increase Decrease
Data presented on a continuing operations basis. Note figures may not foot due to rounding.
12% Consolidated Increase
Driving Organic Growth
Note the above does not consider order commitments from Union Pacific Railroad of approximately $40M over the next five years.
28 | L.B. FosterSingular Midwestern Values ConferenceSeptember 16, 2021
(1) See non-GAAP reconciliation tables at the end of this presentation regarding non-GAAP measures used herein.Data presented on a continuing operations basis.
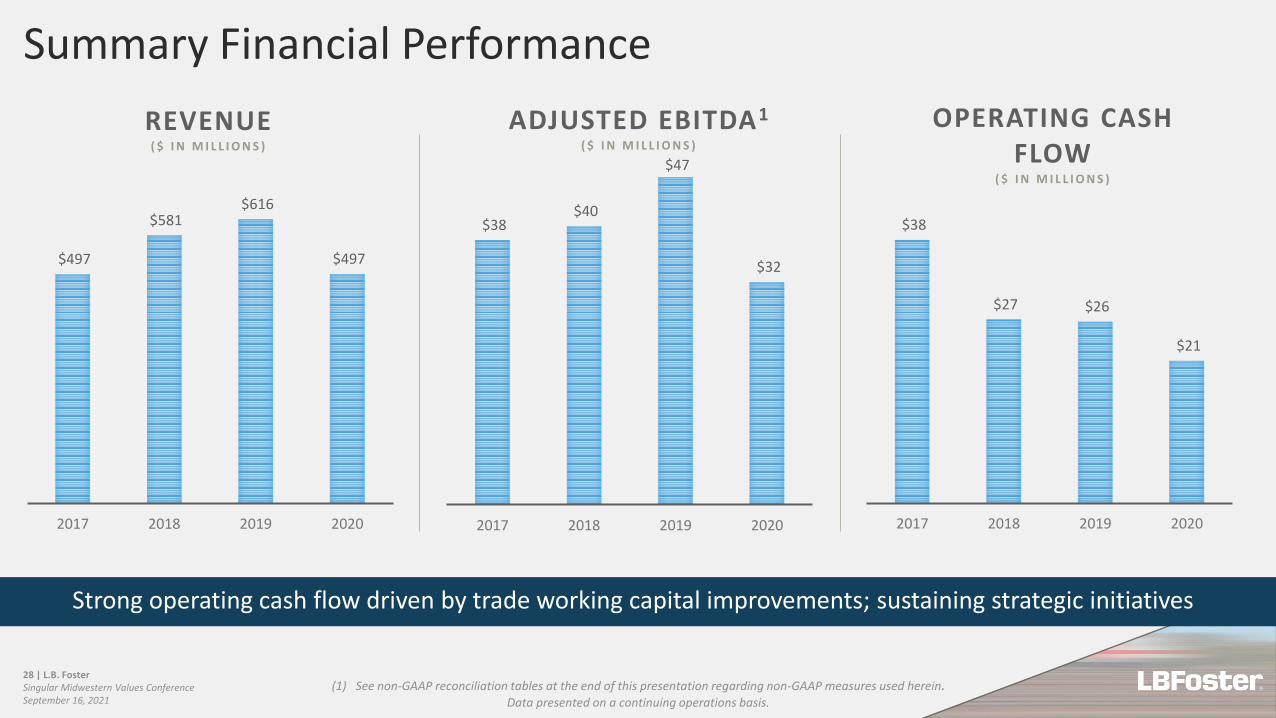
$497
$581 $616
$497
2017 2018 2019 2020
REVENUE( $ I N M I L L I O N S )
$38 $40
$47
$32
2017 2018 2019 2020
ADJUSTED EBITDA1
( $ I N M I L L I O N S )
$38
$27 $26
$21
2017 2018 2019 2020
OPERATING CASH FLOW
( $ I N M I L L I O N S )
Strong operating cash flow driven by trade working capital improvements; sustaining strategic initiatives
Summary Financial Performance
29 | L.B. FosterSingular Midwestern Values ConferenceSeptember 16, 2021
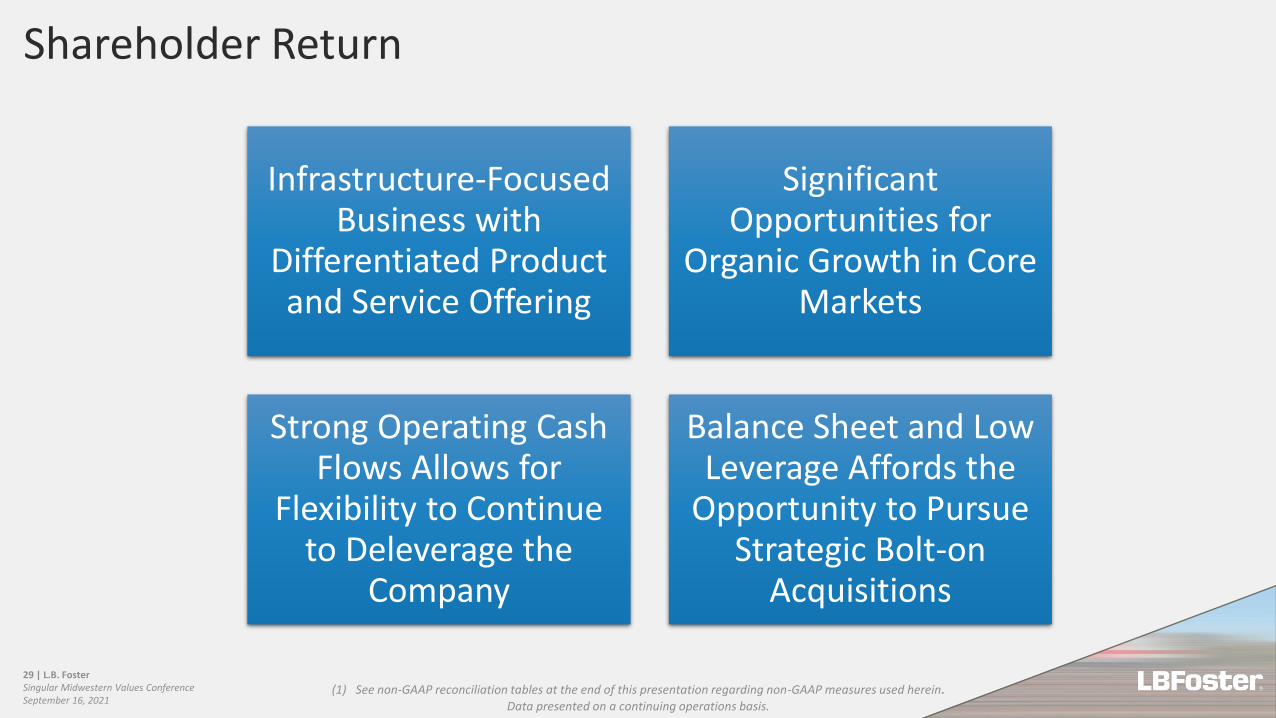
Infrastructure-Focused Business with
Differentiated Product and Service Offering
Significant Opportunities for
Organic Growth in Core Markets
Strong Operating Cash Flows Allows for
Flexibility to Continue to Deleverage the
Company
Balance Sheet and Low Leverage Affords the
Opportunity to Pursue Strategic Bolt-on
Acquisitions
(1) See non-GAAP reconciliation tables at the end of this presentation regarding non-GAAP measures used herein.Data presented on a continuing operations basis.
Shareholder Return

Thank You
Appendix

(1) See non-GAAP reconciliation tables at the end of this presentation regarding non-GAAP measures used herein.** Results of this calculation not considered meaningful for purposes of this presentation.
Note figures may not foot due to rounding.
($ in millions except per share data) $ % of Sales $ % of Sales $ %Sales 154.5$ 141.6$ 13.0$ 9.2%
Gross profit 26.2 16.9% 28.1 19.9% (2.0) (7.0%)
SG&A 19.8 12.8% 18.9 13.3% 0.9 4.8%
Amortization expense 1.5 1.0% 1.4 1.0% 0.1 4.0%
Interest expense - net 0.9 0.6% 1.1 0.8% (0.2) (20.9%)
Other expense (income) - net 0.1 0.0% (2.3) (1.6%) 2.4 (103.0%)
Income from continuing operations before income taxes 4.0 2.6% 9.1 6.4% (5.1) (56.0%)
Income tax expense 1.1 0.7% 2.1 1.5% (1.0) (45.8%)
Income from continuing operations 2.9$ 1.8% 7.0$ 4.9% (4.1)$ (59.1%)
Loss from discontinued operations before income taxes -$ - (7.5)$ (5.3%) 7.5$ (100.0%)
Income tax benefit from discontinued operations -$ - (1.0)$ (0.7%) 1.0$ (100.0%)
Loss from discontinued operations -$ - (6.4)$ (4.6%) 6.4$ (100.0%)
Net income 2.9$ 1.9% 0.5$ 0.4% 2.4$ 449.9%
Diluted earnings per share from continuing operations 0.27$ 0.66$ (0.39)$ (59.1%)
Diluted (loss) per share from discontinued operations -$ (0.61)$ 0.61$ (100.0%)
Diluted earnings per share 0.27$ 0.05$ 0.22$ **
EBITDA from continuing operations(1) 8.3$ 5.4% 13.5$ 9.6% (5.2)$ (38.4%)
Adjusted income from continuing operations(1) 2.9$ 1.9% 6.5$ 4.6% (3.6)$ (55.5%)
Adjusted diluted earnings per share from continuing operations(1) 0.27$ 0.61$ (0.34)$ (55.7%)
Adjusted EBITDA from continuing operations(1) 8.3$ 5.4% 12.9$ 9.1% (4.6)$ (35.4%)
Three Months Ended
June 30, 2021
Three Months Ended
June 30, 2020 Delta
Consolidated Income Statement – Q2
32 | L.B. FosterSingular Midwestern Values ConferenceSeptember 16, 2021
(1) See non-GAAP reconciliation tables at the end of this presentation regarding non-GAAP measures used herein.** Results of this calculation not considered meaningful for purposes of this presentation.
Note figures may not foot due to rounding.
($ in millions except per share data) $ % of Sales $ % of Sales $ %Sales 270.6$ 263.5$ 7.1$ 2.7%
Gross profit 45.0 16.6% 51.3 19.5% (6.3) (12.2%)
SG&A 37.8 14.0% 39.2 14.9% (1.4) (3.6%)
Amortization expense 2.9 1.1% 2.8 1.1% 0.1 3.2%
Interest expense - net 1.7 0.6% 1.9 0.7% (0.2) (8.9%)
Other expense (income) - net 0.1 0.0% (1.7) (0.6%) 1.8 (107.6%)
Income from continuing operations before income taxes 2.4 0.9% 9.0 3.4% (6.6) (73.3%)
Income tax expense 0.8 0.3% 2.0 0.8% (1.2) (60.0%)
Income from continuing operations 1.6$ 0.6% 7.0$ 2.6% (5.4)$ (77.3%)
Loss from discontinued operations before income taxes -$ - (10.1)$ (3.8%) 10.1$ (100.0%)
Income tax benefit from discontinued operations -$ - (1.8)$ (0.7%) 1.8$ (100.0%)
Loss from discontinued operations -$ - (8.3)$ (3.2%) 8.3$ (100.0%)
Net income (loss) 1.6$ 0.6% (1.3)$ (0.5%) 3.0$ (220.5%)
Diluted earnings per share from continuing operations 0.15$ 0.66$ (0.51)$ (77.3%)
Diluted loss per share from discontinued operations -$ (0.79)$ 0.79$ (100.0%)
Diluted earnings (loss) per share 0.15$ (0.13)$ 0.28$ **
EBITDA from continuing operations(1) 11.1$ 4.1% 17.7$ 6.7% (6.6)$ (37.2%)
Adjusted income from continuing operations(1) 1.6$ 0.6% 7.0$ 2.6% (5.4)$ (76.8%)
Adjusted diluted earnings per share from continuing operations(1) 0.15$ 0.66$ (0.51)$ (77.3%)
Adjusted EBITDA from continuing operations(1) 11.1$ 4.1% 17.7$ 6.7% (6.6)$ (37.4%)
Six Months Ended
June 30, 2021
Six Months Ended
June 30, 2020 Delta
Consolidated Income Statement – Year to Date
33 | L.B. FosterSingular Midwestern Values ConferenceSeptember 16, 2021
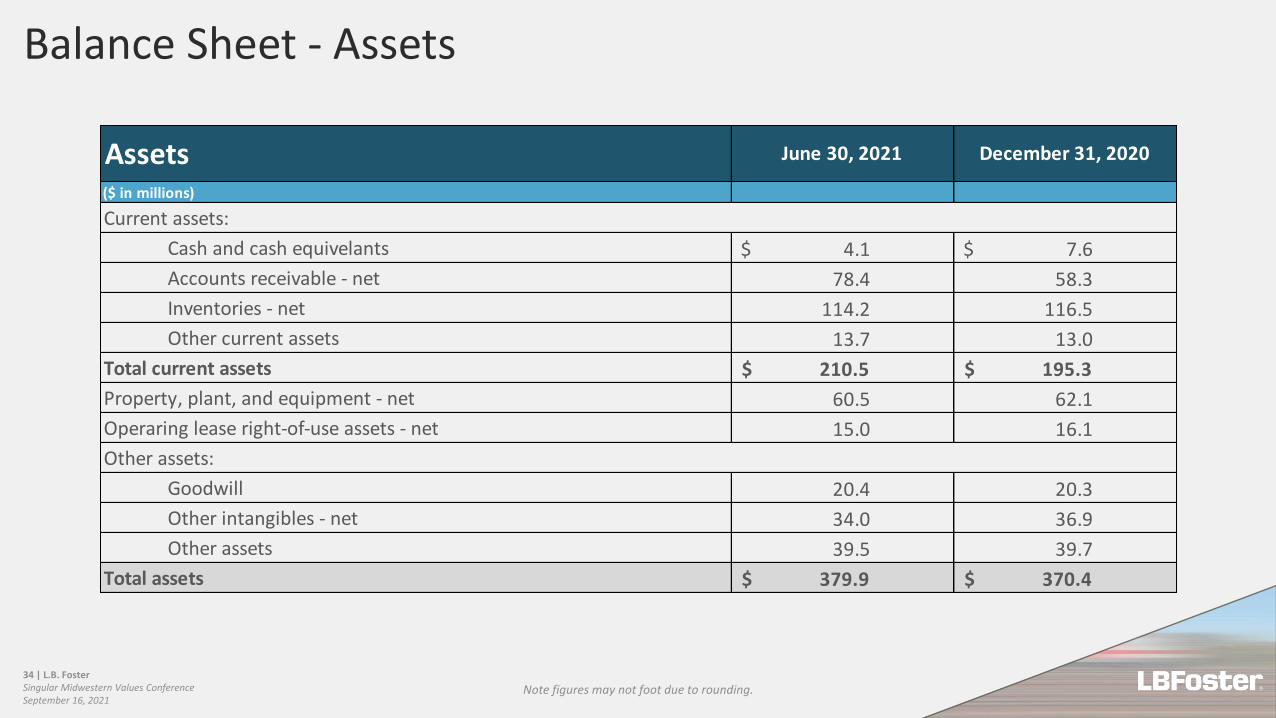
Note figures may not foot due to rounding.
Current assets:
Cash and cash equivelants 4.1$ 7.6$
Accounts receivable - net 78.4 58.3
Inventories - net 114.2 116.5
Other current assets 13.7 13.0
Total current assets 210.5$ 195.3$
Property, plant, and equipment - net 60.5 62.1
Operaring lease right-of-use assets - net 15.0 16.1
Other assets:
Goodwill 20.4 20.3
Other intangibles - net 34.0 36.9
Other assets 39.5 39.7
Total assets 379.9$ 370.4$
Assets($ in millions)
June 30, 2021 December 31, 2020
Balance Sheet - Assets
34 | L.B. FosterSingular Midwestern Values ConferenceSeptember 16, 2021
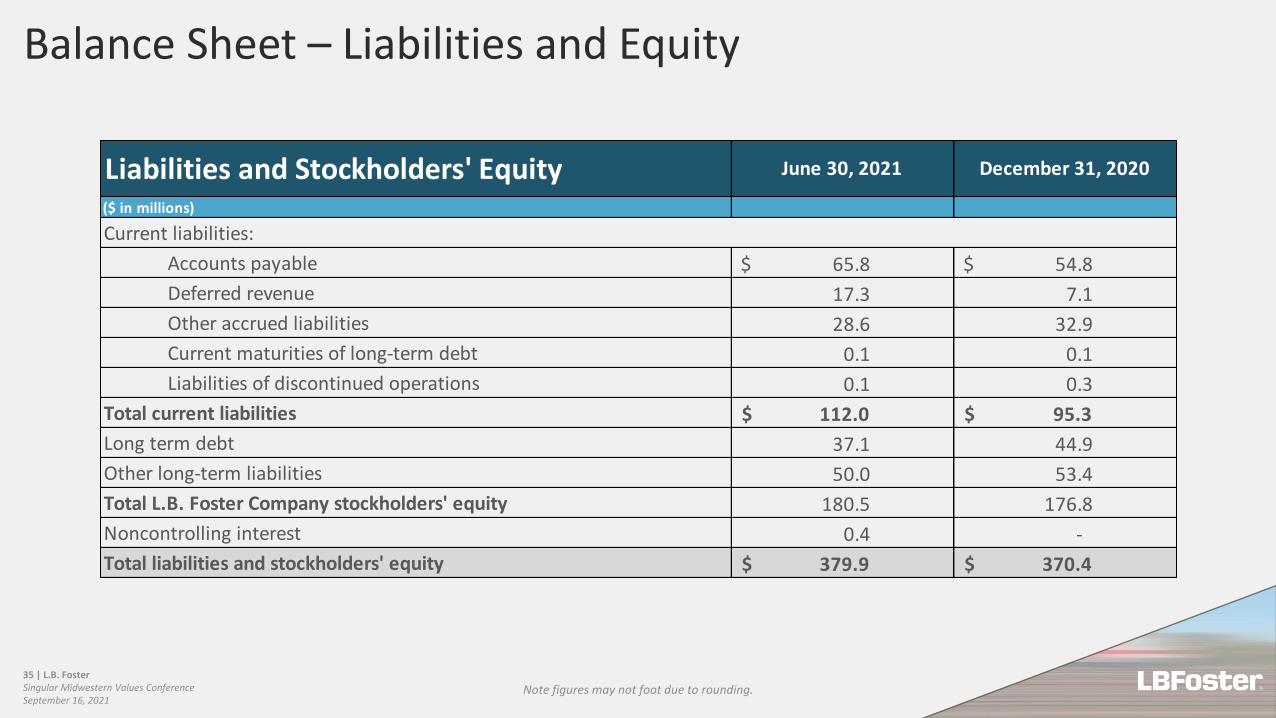
Note figures may not foot due to rounding.
Current liabilities:
Accounts payable 65.8$ 54.8$
Deferred revenue 17.3 7.1
Other accrued liabilities 28.6 32.9
Current maturities of long-term debt 0.1 0.1
Liabilities of discontinued operations 0.1 0.3
Total current liabilities 112.0$ 95.3$
Long term debt 37.1 44.9
Other long-term liabilities 50.0 53.4
Total L.B. Foster Company stockholders' equity 180.5 176.8
Noncontrolling interest 0.4 -
Total liabilities and stockholders' equity 379.9$ 370.4$
June 30, 2021 December 31, 2020Liabilities and Stockholders' Equity($ in millions)
Balance Sheet – Liabilities and Equity
35 | L.B. FosterSingular Midwestern Values ConferenceSeptember 16, 2021
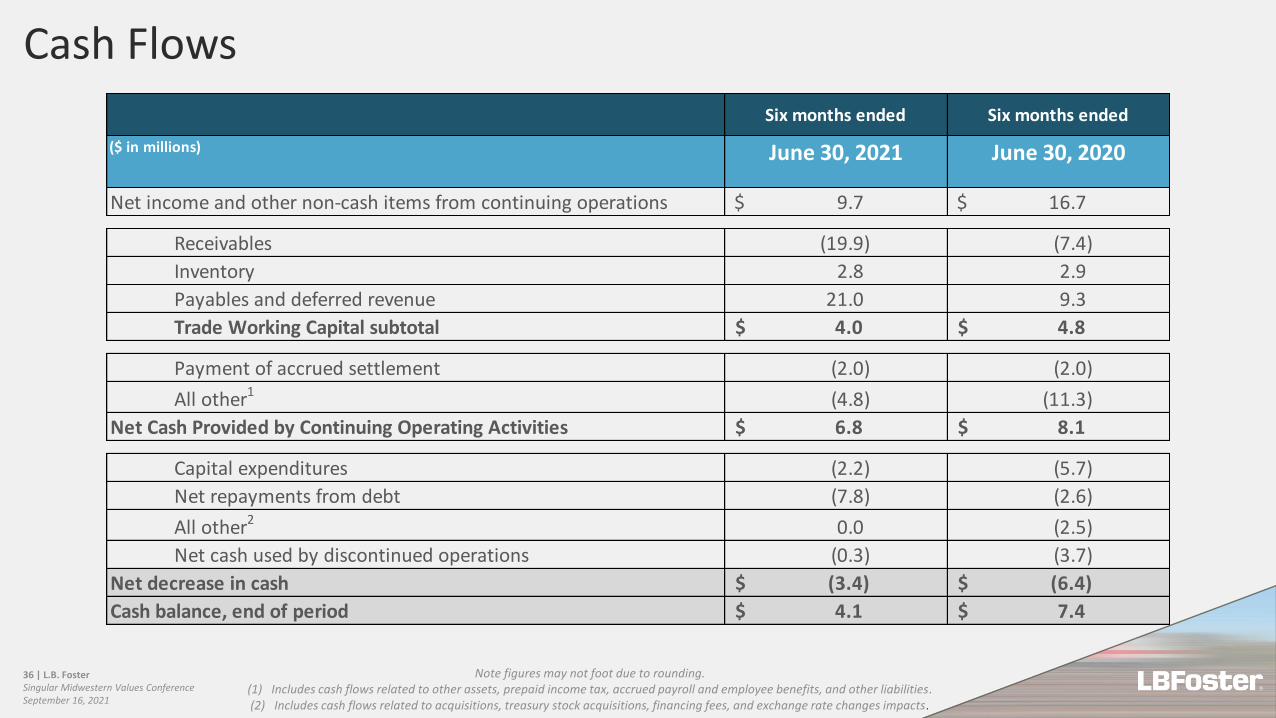
Note figures may not foot due to rounding.(1) Includes cash flows related to other assets, prepaid income tax, accrued payroll and employee benefits, and other liabilities.(2) Includes cash flows related to acquisitions, treasury stock acquisitions, financing fees, and exchange rate changes impacts.
Net income and other non-cash items from continuing operations 9.7$ 16.7$
Receivables (19.9) (7.4)
Inventory 2.8 2.9
Payables and deferred revenue 21.0 9.3
Trade Working Capital subtotal 4.0$ 4.8$
Payment of accrued settlement (2.0) (2.0)
All other1 (4.8) (11.3)
Net Cash Provided by Continuing Operating Activities 6.8$ 8.1$
Capital expenditures (2.2) (5.7)
Net repayments from debt (7.8) (2.6)
All other2 0.0 (2.5)
Net cash used by discontinued operations (0.3) (3.7)
Net decrease in cash (3.4)$ (6.4)$
Cash balance, end of period 4.1$ 7.4$
Six months ended Six months ended
June 30, 2021 June 30, 2020($ in millions)
Cash Flows
36 | L.B. FosterSingular Midwestern Values ConferenceSeptember 16, 2021

Note figures may not foot due to rounding.
($ in millions)
Net income (loss) from continuing operations, as reported 2.9$ (1.3)$ 7.0$ 1.6$ 7.0$ 20.4$ 40.9$
Interest expense, net 0.9 0.9 1.1 1.7 1.9 3.6 3.9
Income tax expense (benefit) 1.1 (0.3) 2.1 0.8 2.0 (13.1) (24.8)
Depreciation expense 2.0 2.0 2.0 4.0 3.9 8.0 7.9
Amortization expense 1.5 1.5 1.4 2.9 2.8 5.8 6.0
Total EBITDA from continuing operations 8.3$ 2.7$ 13.5$ 11.1$ 17.7$ 24.7$ 33.8$
Relocation and restructuring costs - - 1.2 - 1.9 0.6 3.7
Distribution from unconsolidated partnership - - (1.9) - (1.9) - (1.9)
U.S. pension settlement expense - - - - - - 2.2
Adjusted EBITDA from continuing operations 8.3$ 2.7$ 12.9$ 11.1$ 17.7$ 25.4$ 37.8$
June 30,
2021
June 30,
2021
June
30, 2020
Three Months Ended
June
30, 2020
Twelve Months Ended
March 31,
2021
Six Months Ended
June 30,
2021
June
30, 2020
EBITDA from Continuing OperationsNon-GAAP Financial Measure
37 | L.B. FosterSingular Midwestern Values ConferenceSeptember 16, 2021

Note figures may not foot due to rounding.
($ in millions)
Net income (loss) from continuing operations, as reported 6.8$ (30.6)$ 48.0$ 25.8$
Interest expense, net 8.1 6.1 4.9 3.8
Income tax expense (benefit) 7.2 6.0 (23.8) (11.8)
Depreciation expense 9.3 8.1 7.9 7.9
Amortization expense 6.9 7.0 6.4 5.7
Total EBITDA from continuing operations 38.3$ (3.4)$ 43.4$ 31.3$
Litigation Settlement - 43.4 - -
Relocation and restructuring costs - - 1.8 2.5
Distribution from unconsolidated partnership - - - (1.9)
U.S. pension settlement expense - - 2.2 -
Adjusted EBITDA from continuing operations 38.3$ 40.0$ 47.4$ 32.0$
December 31,
2017
December 31,
2018
December 31,
2019
December 31,
2020
Year Ended
EBITDA from Continuing OperationsNon-GAAP Financial Measure
38 | L.B. FosterSingular Midwestern Values ConferenceSeptember 16, 2021
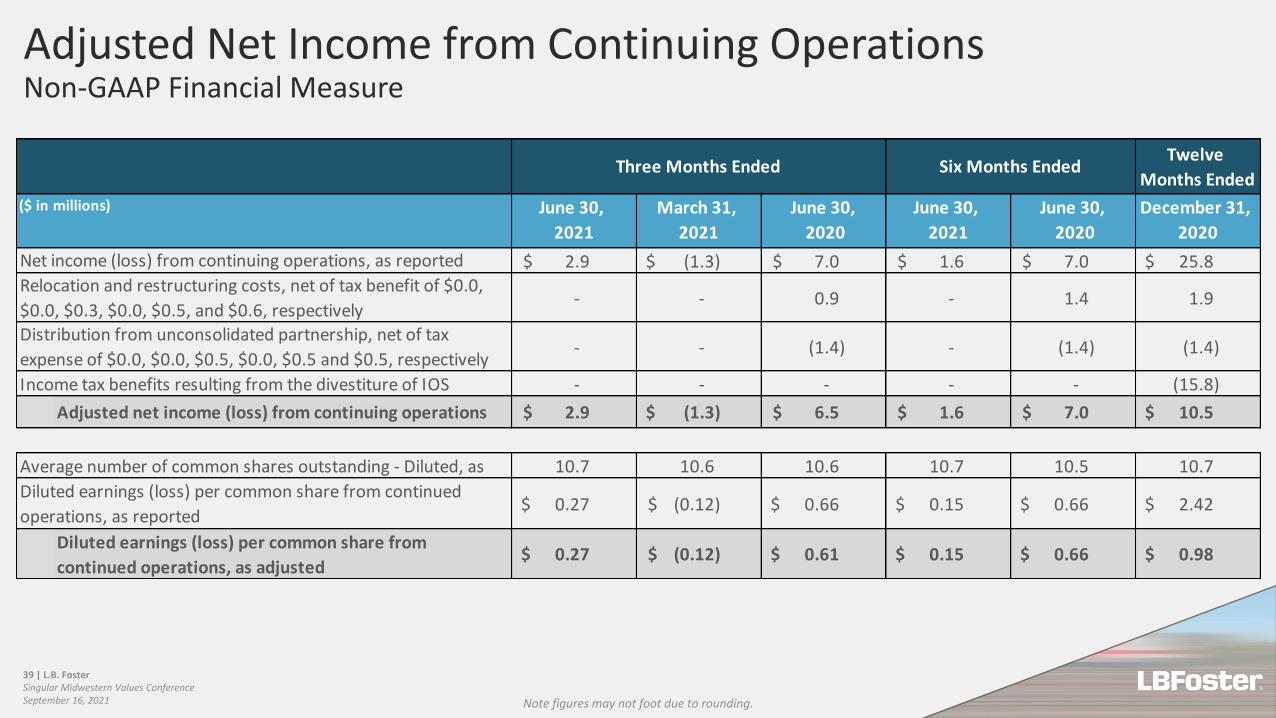
2.9$ (1.3)$ 7.0$ 1.6$ 7.0$ 25.8$
- - 0.9 - 1.4 1.9
- - (1.4) - (1.4) (1.4)
- - - - - (15.8)
Adjusted net income (loss) from continuing operations 2.9$ (1.3)$ 6.5$ 1.6$ 7.0$ 10.5$
10.7 10.6 10.6 10.7 10.5 10.7
0.27$ (0.12)$ 0.66$ 0.15$ 0.66$ 2.42$
Diluted earnings (loss) per common share from
continued operations, as adjusted0.27$ (0.12)$ 0.61$ 0.15$ 0.66$ 0.98$
June 30,
2021
June 30,
2020
December 31,
2020
Three Months EndedTwelve
Months Ended
March 31,
2021
Six Months Ended
June 30,
2021
June 30,
2020
Income tax benefits resulting from the divestiture of IOS
Average number of common shares outstanding - Diluted, as
Diluted earnings (loss) per common share from continued
operations, as reported
($ in millions)
Net income (loss) from continuing operations, as reported
Relocation and restructuring costs, net of tax benefit of $0.0,
$0.0, $0.3, $0.0, $0.5, and $0.6, respectively
Distribution from unconsolidated partnership, net of tax
expense of $0.0, $0.0, $0.5, $0.0, $0.5 and $0.5, respectively
Adjusted Net Income from Continuing OperationsNon-GAAP Financial Measure
Note figures may not foot due to rounding.
39 | L.B. FosterSingular Midwestern Values ConferenceSeptember 16, 2021
Adjusted Net Income from Continuing OperationsNon-GAAP Financial Measure
Note figures may not foot due to rounding.
40 | L.B. FosterSingular Midwestern Values ConferenceSeptember 16, 2021
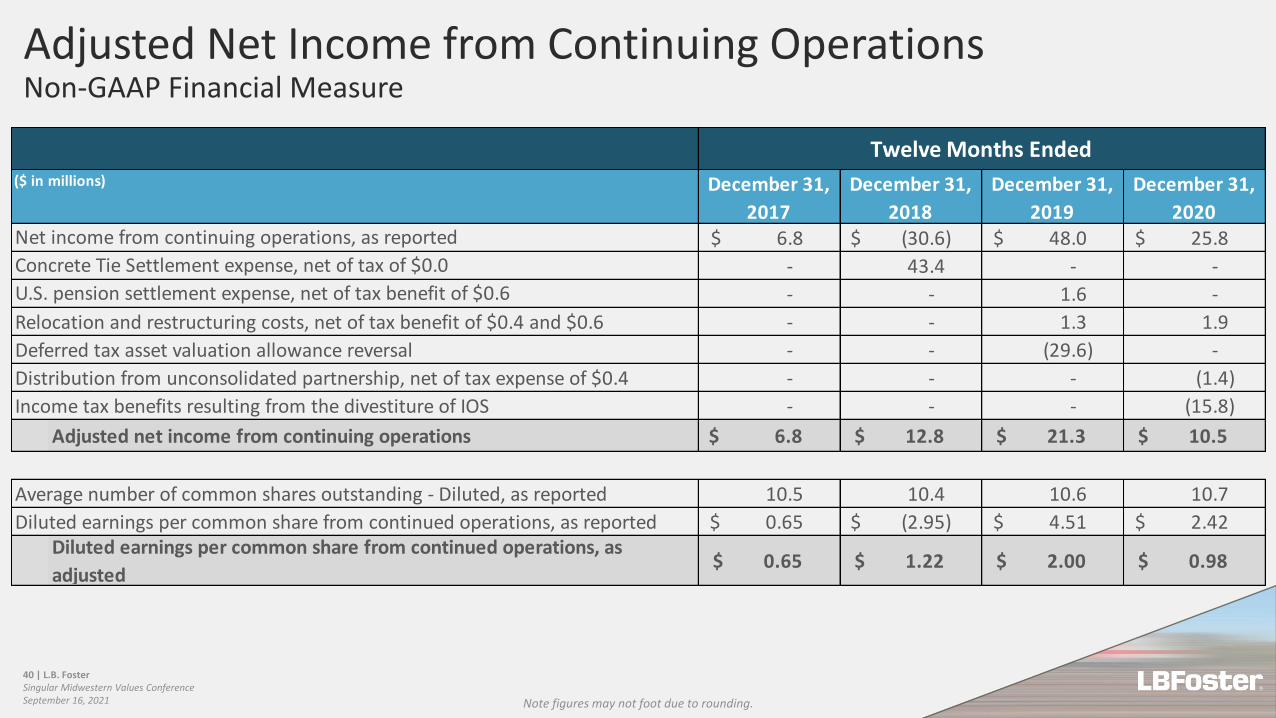
6.8$ (30.6)$ 48.0$ 25.8$
- 43.4 - -
- - 1.6 -
- - 1.3 1.9
- - (29.6) -
- - - (1.4)
- - - (15.8)
Adjusted net income from continuing operations 6.8$ 12.8$ 21.3$ 10.5$
10.5 10.4 10.6 10.7
0.65$ (2.95)$ 4.51$ 2.42$ Diluted earnings per common share from continued operations, as
adjusted0.65$ 1.22$ 2.00$ 0.98$
Income tax benefits resulting from the divestiture of IOS
Average number of common shares outstanding - Diluted, as reported
Diluted earnings per common share from continued operations, as reported
Net income from continuing operations, as reported
Concrete Tie Settlement expense, net of tax of $0.0
U.S. pension settlement expense, net of tax benefit of $0.6
Relocation and restructuring costs, net of tax benefit of $0.4 and $0.6
Deferred tax asset valuation allowance reversal
Distribution from unconsolidated partnership, net of tax expense of $0.4
Twelve Months Ended($ in millions) December 31,
2017
December 31,
2018
December 31,
2019
December 31,
2020

Outstanding Borrowings on Revolving Credit Facility 37.0$ 44.8$ 55.3$ 33.9$ 74.0$ 128.5$
Term Loan Outstanding - - - 23.8 - -
Financing Leases and Financing Arrangements 0.2 0.2 0.3 0.6 1.0 1.5
Total debt 37.2$ 45.0$ 55.6$ 58.2$ 75.0$ 130.0$
Less cash and cash equivalents (4.1) (7.6) (7.4) (14.2) (10.3) (37.7)
Total net debt 33.1$ 37.5$ 48.2$ 44.0$ 64.7$ 92.3$
LTM Adjusted EBITDA1 25.4$ 32.0$ 37.8$ 47.4$ 40.0$ 38.3$
Adjusted Net Leverage Ratio 1.3x 1.2x 1.3x .9x 1.6x 2.4x
December 31,
2018
December 31,
2017
December 31,
2020
December 31,
2019($ in millions)
June 30,
2021
June 30,
2020
Adjusted Leverage RatioNon-GAAP Financial Measure
Note figures may not foot due to rounding.
41 | L.B. FosterSingular Midwestern Values ConferenceSeptember 16, 2021