lbg 2016 full year news release - final 21.2.17 · – net interest income of £11.4 billion (2015:...
TRANSCRIPT

2016 RESULTSNews Release

BASIS OF PRESENTATION
This release covers the results of Lloyds Banking Group plc together with its subsidiaries (the Group) for the year
ended 31 December 2016.
Statutory basis: Statutory information is set out on pages 33 to 46. However, a number of factors have had a
significant effect on the comparability of the Group’s financial position and results. Accordingly, the results are also
presented on an underlying basis.
Underlying basis: The statutory results are adjusted for certain items which are listed below, to allow a comparison
of the Group’s underlying performance.
− losses on redemption of the Enhanced Capital Notes and the volatility in the value of the embedded equity
conversion feature;
− market volatility and asset sales, which includes the effects of certain asset sales, the volatility relating to the
Group’s own debt and hedging arrangements and that arising in the insurance businesses and insurance gross up;
− the unwind of acquisition-related fair value adjustments and the amortisation of purchased intangible assets;
− restructuring costs, comprising severance related costs relating to the Simplification programme, the costs of
implementing regulatory reform and ring-fencing and the rationalisation of the non-branch property portfolio;
− TSB build and dual-running costs and the loss relating to the TSB sale in 2015; and
− payment protection insurance and other conduct provisions.
Unless otherwise stated, income statement commentaries throughout this document compare the 12 months ended
31 December 2016 to the 12 months ended 31 December 2015, and the balance sheet analysis compares the Group
balance sheet as at 31 December 2016 to the Group balance sheet as at 31 December 2015.
Alternative performance measures: The Group uses a number of alternative performance measures, including
underlying profit, in the discussion of its business performance and financial position on page 2 and pages 5 to 25.
Further information on these measures is set out on page 47.
Restatement: With effect from 1 January 2016 the unsecured personal loans business was transferred from Retail to
Consumer Finance and elements of the Group’s business in the Channel Islands and Isle of Man were transferred
from Retail to Commercial Banking. In addition, certain mortgage lending has been reclassified as closed to new
business. The results for the year ended 31 December 2016 and the comparative periods are reported on the new
basis.
FORWARD LOOKING STATEMENTS
This document contains certain forward looking statements with respect to the business, strategy and plans of Lloyds Banking Group and its current goals and expectations relating to its future financial condition and performance. Statements that are not historical facts, including statements about Lloyds Banking Group's or its directors' and/or management's beliefs and expectations, are forward looking statements. By their nature, forward looking statements involve risk and uncertainty because they relate to events and depend upon circumstances that will or may occur in the future. Factors that could cause actual business, strategy, plans and/or results (including but not limited to the payment of dividends) to differ materially from the plans, objectives, expectations, estimates and intentions expressed in such forward looking statements made by the Group or on its behalf include, but are not limited to: general economic and business conditions in the UK and internationally; market related trends and developments; fluctuations in interest rates (including low or negative rates), exchange rates, stock markets and currencies; the ability to access sufficient sources of capital, liquidity and funding when required; changes to the Group's credit ratings; the ability to derive cost savings and other benefits including, but without limitation as a result of any acquisitions, disposals and other strategic transactions; changing customer behaviour including consumer spending, saving and borrowing habits; changes to borrower or counterparty credit quality; instability in the global financial markets, including Eurozone instability, the exit by the UK from the European Union (EU) and the potential for one or more other countries to exit the EU or the Eurozone and the impact of any sovereign credit rating downgrade or other sovereign financial issues; technological changes and risks to cyber security; natural, pandemic and other disasters, adverse weather and similar contingencies outside the Group's control; inadequate or failed internal or external processes or systems; acts of war, other acts of hostility, terrorist acts and responses to those acts, geopolitical, pandemic or other such events; changes in laws, regulations, accounting standards or taxation, including as a result of the exit by the UK from the EU, or a further possible referendum on Scottish independence; changes to regulatory capital or liquidity requirements and similar contingencies outside the Group's control; the policies, decisions and actions of governmental or regulatory authorities or courts in the UK, the EU, the US or elsewhere including the implementation and interpretation of key legislation and regulation; the ability to attract and retain senior management and other employees; requirements or limitations on the Group as a result of HM Treasury's investment in the Group; actions or omissions by the Group's directors, management or employees including industrial action; changes to the Group's post-retirement defined benefit scheme obligations; the extent of any future impairment charges or write-downs caused by, but not limited to, depressed asset valuations, market disruptions and illiquid markets; the value and effectiveness of any credit protection purchased by the Group; the inability to hedge certain risks economically; the adequacy of loss reserves; the actions of competitors, including non-bank financial services, lending companies and digital innovators and disruptive technologies; and exposure to regulatory or competition scrutiny, legal, regulatory or competition proceedings, investigations or complaints. Please refer to the latest Annual Report on Form 20-F filed with the US Securities and Exchange Commission for a discussion of certain factors together with examples of forward looking statements. Except as required by any applicable law or regulation, the forward looking statements contained in this document are made as of today's date, and Lloyds Banking Group expressly disclaims any obligation or undertaking to release publicly any updates or revisions to any forward looking statements. The information, statements and opinions contained in this document do not constitute a public offer under any applicable law or an offer to sell any securities or financial instruments or any advice or recommendation with respect to such securities or financial instruments.

CONTENTS
Page
Key highlights 1
Consolidated income statement 2
Balance sheet and key ratios 2
Group Chief Executive’s statement 3
Summary of Group results 4
Divisional results
Retail 13
Commercial Banking 15
Consumer Finance 17
Insurance 19
Run-off and Central items 21
Other financial information
Reconciliation between statutory and underlying basis results 22
Banking net interest margin 23
Volatility arising in insurance businesses 24
Return measures 24
Tangible net assets per share 25
Group credit risk portfolio 26
Funding and liquidity management 28
Capital management 29
Statutory information
Primary statements
Consolidated income statement 33
Consolidated statement of comprehensive income 34
Consolidated balance sheet 35
Consolidated statement of changes in equity 37
Notes to the consolidated financial statements 39
Summary of alternative performance measures 47
Contacts 48

LLOYDS BANKING GROUP PLC 2016 RESULTS
Page 1 of 48
RESULTS FOR THE FULL YEAR
‘We have delivered strong financial performance in 2016 as we continue to make good progress against our strategic priorities. Underlying profit was £7.9 billion and statutory profit has more than doubled to £4.2 billion. We continue to improve our customers’ experience, simplifying the business whilst growing in targeted areas and in December announced the acquisition of MBNA’s prime UK credit card business. Strong capital generation, which is a consequence of our business model, has enabled us to fully cover the expected capital impact of the MBNA acquisition, increase our ordinary dividend by 13 per cent and pay a special dividend. As a simple, low risk, UK focused bank we are committed and well positioned to help Britain prosper and become the best bank for customers and shareholders.’
António Horta-Osório Group Chief Executive
Good underlying performance with strong improvement in statutory profit
Underlying profit of £7.9 billion (2015: £8.1 billion); underlying RoRE of 13.2 per cent and RoTE of 14.1 per cent
Total income of £17.5 billion (2015: £17.6 billion)
– Net interest income of £11.4 billion (2015: £11.5 billion) with improved margin of 2.71 per cent
– Other income at £6.1 billion, up in the fourth quarter but slightly lower (1 per cent) than in 2015 (£6.2 billion)
Operating costs 3 per cent lower at £8.1 billion. Market-leading cost:income ratio improved to 48.7 per cent with positive operating jaws
Asset quality remains strong with no deterioration in underlying portfolio. Asset quality ratio of 15 basis points
Conduct charges of £2.1 billion include £1.0 billion provision for PPI taken in the third quarter
Statutory profit before tax of £4.2 billion, more than double the £1.6 billion statutory profit in 2015
Strong balance sheet and capital generation
Strong balance sheet with a pro forma common equity tier 1 (CET1) ratio of 13.8 per cent (31 December 2015: 13.0 per cent) after dividends; 14.9 per cent pre dividend. Prudently retaining c.80 basis points of capital for the announced MBNA acquisition
CET1 capital generation of c.190 basis points, pre dividend, ahead of guidance due to underlying performance and lower risk-weighted assets
PRA Buffer reduced reflecting de-risking of the balance sheet. The Group will continue to target a CET1 ratio of c.13 per cent given expected future regulatory capital developments
Leverage ratio on a pro forma basis increased to 5.0 per cent (30 September 2016: 4.8 per cent; 31 December 2015: 4.8 per cent)
Tangible net assets per share of 54.8 pence (30 September 2016: 54.9 pence; 31 December 2015: 52.3 pence)
Our differentiated UK focused business model continues to deliver for customers and shareholders
Cost discipline and low risk business model providing competitive advantage
Good progress in improving products and propositions to better meet customers’ evolving needs and preferences
Helping Britain prosper through continued support to SMEs, first-time buyers and growth in consumer finance
Acquisition of MBNA prime UK credit card business will support strategic goal to grow in consumer finance; expected to deliver strong financial returns and create significant shareholder value
UK government continues to reduce its shareholding through trading plan, with stake now below 5 per cent
Guidance reflects confidence in the Group’s future prospects
Net interest margin for 2017 expected to be greater than 2.70 per cent (before impact of MBNA)
Asset quality ratio for the full year 2017 expected to be around 25 basis points (before impact of MBNA)
Continue to target a cost:income ratio of around 45 per cent exiting 2019, with reductions every year
Now expect RoRE of between 12.0 and 13.5 per cent and RoTE of between 13.5 and 15.0 per cent in 2019
Group now expects to generate 170−200 basis points of CET1 capital per annum, pre dividend
Increased ordinary dividend and payment of special dividend
The Board has recommended a final ordinary dividend of 1.7 pence per share, making a total ordinary dividend of 2.55 pence per share, an increase of 13 per cent on 2015 and in line with our progressive and sustainable ordinary dividend policy
In addition, the Board has recommended a special dividend of 0.5 pence per share

LLOYDS BANKING GROUP PLC 2016 RESULTS
Page 2 of 48
CONSOLIDATED INCOME STATEMENT − UNDERLYING BASIS 2016 2015 Change £ million £ million %Net interest income 11,435 11,482 –
Other income 6,065 6,155 (1)
Total income 17,500 17,637 (1)
Operating lease depreciation (895) (764) (17)
Net income 16,605 16,873 (2)
Operating costs (8,093) (8,311) 3
Impairment (645) (568) (14)
TSB – 118
Underlying profit 7,867 8,112 (3) Volatility and other items (1,544) (1,631)
Payment protection insurance provision (1,000) (4,000)
Other conduct provisions (1,085) (837)
Statutory profit before tax 4,238 1,644 158
Taxation (1,724) (688)
Profit for the year 2,514 956 163 Earnings per share 2.9p 0.8p 263 Dividends per share − ordinary 2.55p 2.25p 13
− special 0.50p 0.50p −
Total dividends 3.05p 2.75p 11 Banking net interest margin 2.71% 2.63% 8bp
Average interest-earning banking assets £436bn £442bn (1)
Cost:income ratio 48.7% 49.3% (0.6)pp
Asset quality ratio 0.15% 0.14% 1bp
Return on risk-weighted assets 3.55% 3.53% 2bp
Underlying return on required equity 13.2% 15.0% (1.8)pp
Return on required equity 5.3% 1.5% 3.8pp
Underlying return on tangible equity 14.1% 16.0% (1.9)pp
Return on tangible equity 6.6% 2.6% 4.0pp
BALANCE SHEET AND KEY RATIOS At 31 Dec At 31 Dec Change 2016 2015 %Loans and advances to customers1 £450bn £455bn (1)
Customer deposits2 £413bn £418bn (1)
Loan to deposit ratio 109% 109% –
Total assets £818bn £807bn 1
Pro forma common equity tier 1 ratio3 13.8% 13.0% 0.8pp
Pro forma common equity tier 1 ratio pre dividend3 14.9%
Transitional total capital ratio 21.4% 21.5% (0.1)pp
Pro forma leverage ratio3 5.0% 4.8% 0.2pp
Risk-weighted assets £216bn £223bn (3)
Tangible net assets per share 54.8p 52.3p 2.5p 1 Excludes reverse repos of £8.3 billion (31 December 2015: £nil). 2 Excludes repos of £2.5 billion (31 December 2015: £nil). 3 The common equity tier 1 and leverage ratios at 31 December 2016 and 2015 are reported on a pro forma basis, including the
dividends paid by the Insurance business in February 2017 and February 2016 respectively, in relation to prior year earnings.

LLOYDS BANKING GROUP PLC 2016 RESULTS
Page 3 of 48
GROUP CHIEF EXECUTIVE’S STATEMENT We have delivered strong financial performance in 2016 as we continue to make good progress against our strategic priorities. Underlying profit was £7.9 billion and statutory profit has more than doubled to £4.2 billion. We continue to improve our customers’ experience, simplifying the business whilst growing in targeted areas and in December announced the acquisition of MBNA’s prime UK credit card business. Strong capital generation, which is a consequence of our business model, has enabled us to fully cover the expected capital impact of the MBNA acquisition, increase our ordinary dividend by 13 per cent and pay a special dividend. As a simple, low risk, UK focused bank we are committed and well positioned to help Britain prosper and become the best bank for customers and shareholders.
Operating environment
Given our UK focus, our performance is inextricably linked to the health of the UK economy which has been more resilient than the market expected post referendum, with GDP growth of 2 per cent in 2016. The UK’s decision to leave the European Union means the exact nature of our relationship with Europe going forward remains unclear and the economic outlook is uncertain. However, the recovery in recent years with low unemployment, reduced levels of household and corporate indebtedness and increased house prices means the UK is well positioned.
The regulatory environment also continues to evolve and there are a number of areas on which we await further clarity but, given the strength of our balance sheet and the capital generative nature of our business model, we are well placed to meet these regulatory requirements and the economic uncertainty. Following the de-risking of the balance sheet in recent years our PRA Buffer has been reduced but, in light of expected future regulatory capital developments, the Group will continue to target a CET1 ratio of around 13.0 per cent. Financial performance The Group has delivered strong financial performance in the year. Underlying profit was £7.9 billion with an underlying return on required equity of 13.2 per cent (return on tangible equity of 14.1 per cent). Income was slightly lower which was more than offset by lower operating costs, resulting in an improved cost:income ratio of 48.7 per cent. Impairment increased, primarily due to lower releases and write-backs, but asset quality remains strong with no signs of deterioration in the portfolio. The difference between underlying profit and statutory profit reduced significantly in 2016, as statutory profit before tax more than doubled to £4.2 billion, largely due to lower PPI provisions, and this enabled the Group to generate approximately 190 basis points of CET1 capital during the year.
Our balance sheet remains strong with a pro forma CET1 ratio of 13.8 per cent, a total capital ratio of 21.4 per cent and a pro forma leverage ratio of 5.0 per cent. In line with our progressive and sustainable ordinary dividend policy, the Board has recommended a final ordinary dividend of 1.7 pence per share, taking the total ordinary dividend for the year to 2.55 pence per share, an increase of 13 per cent on 2015. The Group has held back c.80 basis points of CET1 capital to cover the estimated capital impact of the MBNA acquisition; however, given our strong capital generation in the year, the Board has also recommended a special dividend of 0.5 pence per share. Strategic progress We have continued to make good progress on our strategic priorities in 2016. Creating the best customer experience We are committed to meeting our customers’ evolving needs and preferences through our multi-brand and multi-channel approach. We operate the UK’s largest branch network and the largest digital bank with over 12.5 million active online users. We have more than 8 million mobile banking users and for the second consecutive year, the Lloyds Bank app has been rated the best banking app of all the UK major banks for functionality.
Customer migration to digital channels continues at pace with more than 60 per cent of our simple customer needs now met online and digital is now the number one channel for new loans and credit cards. We continue to invest in our customer propositions to improve processes and the way our customers interact with us. In Commercial Banking we have continued to improve the online banking platform and in Retail Business Banking we are now able to open new customer accounts in 5-6 days, down from 21 days previously, with a best-in-class automated digital ID and verification process. In Consumer Finance, Black Horse has reduced processing times for new loans, while increasing security and protection for customers. In Insurance we have introduced online tools which will allow customers to consolidate their workplace pension assets and employers to process employee monthly pension contributions on the same day, down from 22 days in 2014.

LLOYDS BANKING GROUP PLC 2016 RESULTS
Page 4 of 48
This progress has been reflected in further reductions in the level of customer complaints and our net promoter score, which continued to improve in 2016 and is now nearly 50 per cent higher than at the end of 2011. Our latest ‘Building the Best Team’ survey results show that colleague engagement is at an all-time high and in line with top performing UK corporates. Our strong performance in 2016 reflects the hard work undertaken by colleagues across the Group and I would like to thank everyone for their significant efforts and commitment. Becoming simpler and more efficient Our cost leadership is a significant source of competitive advantage and cost management remains a strategic priority. In response to the lower rate environment we have accelerated the delivery of our cost initiatives, and announced at the half year an increase to the Simplification run-rate savings target and a reduction in our non-branch property portfolio. We remain on track to deliver both, having already achieved £0.9 billion of the increased £1.4 billion Simplification run-rate target. As a result of the continued focus on costs, our market-leading cost:income ratio has improved and we continue to target further reductions. Delivering sustainable growth The Group aims to deliver sustainable growth in line with its low risk business model. We have continued to make good progress in growing market share in areas where we are underrepresented, and have grown lending to SME and Mid Markets clients by around £2 billion in the year. In Consumer Finance we have continued to grow our motor finance and credit card portfolios organically and the agreement to acquire MBNA’s prime UK credit card business will give us the opportunity to create a best-in-class credit card operation. In Insurance, we will continue to invest in developing the brand and the business, including our financial planning and retirement capabilities, and have also completed four bulk annuity deals. In addition, we are committed to supporting first-time home buyers and remain the largest lender to this customer group. Helping Britain prosper We remain committed to supporting the people, businesses and communities in the UK through our Helping Britain Prosper Plan. Notably, we have provided £1.2 billion of new funding to manufacturing businesses, supported 121,000 start-ups and helped 10,000 clients to start exporting in 2016. Our economic contribution to Britain extends beyond the products and services we offer and the funding we provide to our customers and clients. Since we launched our Apprenticeship Scheme we have created more than 4,000 roles, including 1,000 in 2016 and we have committed to creating 8,000 by 2020. We have also exceeded our target to create 20,000 digital champions, a year earlier than expected. Furthermore, we are the highest payer of UK tax in the most recent PwC Total Tax Contribution Survey for the 100 Group, having paid £1.8 billion in 2015. Our tax payment in 2016 was £2.3 billion. The combination of the progress we have made towards our strategic priorities and our strong financial performance has enabled the UK government to further reduce its stake in the Group to less than 5 per cent, at a profit, returning over £18.5 billion to the UK taxpayer since 2009. Outlook Our financial targets reflect our confidence in the future prospects of the Group. In 2017 we expect the net interest margin to be greater than 2.70 per cent and the asset quality ratio to increase to around 25 basis points (before MBNA). We continue to target a cost:income ratio of around 45 per cent exiting 2019, with reductions every year. We now expect a return on required equity of between 12.0 and 13.5 per cent and a return on tangible equity of between 13.5 and 15.0 per cent in 2019. Going forward, the Group expects to generate between 170 and 200 basis points of CET1 capital per annum, pre dividend. Summary Following the simplification and transformation of our business in recent years, the Group is now focused on delivering the best customer experience and on continuing to develop our digital capabilities. Our cost leadership and lower risk positioning provide competitive advantage which enables us to deliver superior returns to shareholders. We continue to believe that our simple, low risk business model is the right one, and our strategic progress and strong financial performance position us well for future success. António Horta-Osório Group Chief Executive

LLOYDS BANKING GROUP PLC 2016 RESULTS
Page 5 of 48
SUMMARY OF GROUP RESULTS
Good underlying performance with strong improvement in statutory profit
The Group’s underlying profit was £7,867 million, 3 per cent lower than 2015, with slightly lower income and higher
impairments, partly offset by lower costs. The underlying return on required equity was 13.2 per cent and the underlying
return on tangible equity was 14.1 per cent. Statutory profit before tax more than doubled to £4,238 million, compared
with £1,644 million in 2015, as the level of PPI provisions reduced significantly.
Total loans and advances to customers were £450 billion, compared with £455 billion at 31 December 2015, and
customer deposits were similarly £5 billion lower than a year ago at £413 billion.
The balance sheet remains strong and the CET1 ratio at 31 December 2016 was 13.8 per cent on a pro forma basis and
reflects the retention of c.80 basis points of CET1 capital to cover the estimated capital impact of the MBNA acquisition.
The Group generated c.190 basis points of CET1 capital, pre dividends, in the period and tangible net asset value per
share increased to 54.8 pence (31 December 2015: 52.3 pence).
Given the significant amount of capital generated in the year, the Board has recommended a final ordinary dividend of
1.7 pence per share, making a total ordinary dividend of 2.55 pence per share, an increase of 13 per cent on 2015 and in
line with our progressive and sustainable ordinary dividend policy. In addition, the Board has recommended a special
dividend of 0.5 pence per share.
Total income
2016 2015 Change £ million £ million %
Net interest income 11,435 11,482 –
Other income 6,065 6,155 (1)
Total income 17,500 17,637 (1)
Operating lease depreciation1 (895) (764) (17)
Net income 16,605 16,873 (2)
Banking net interest margin 2.71% 2.63% 8bp
Average interest-earning banking assets £435.9bn £441.9bn (1) 1 Net of gains on disposal of leased assets.
Total income of £17,500 million was 1 per cent lower than 2015, with a small reduction in net interest income and a 1 per
cent fall in other income.
Net interest income fell by £47 million to £11,435 million. The net interest margin increased to 2.71 per cent (2015:
2.63 per cent), with lower deposit and wholesale funding costs, including the benefit from the ECN redemptions in the
first quarter, more than offsetting the continuing pressure on asset pricing. Average interest-earning banking assets
reduced by 1 per cent with growth in SME and Consumer Finance balances more than offset by reductions in the
mortgage and run-off portfolios. The Group expects that the net interest margin for 2017 will be greater than 2.70 per
cent (before MBNA).
The Group manages the risk to its capital and earnings from adverse movements in interest rates centrally by hedging
liabilities which are deemed to be stable or less sensitive to change in market interest rates. As at 31 December 2016,
the balance hedged was c.£111 billion with an average duration of c.3 years and an earning rate of approximately
1.6 per cent over LIBOR. In 2016, the benefit from the structural hedge totalled £1.7 billion over LIBOR (2015:
£1.8 billion).

LLOYDS BANKING GROUP PLC 2016 RESULTS
Page 6 of 48
Other income was £6,065 million in 2016 (2015: £6,155 million). Other income increased in the fourth quarter compared
with the same period last year largely as a result of improved Insurance income and was higher than the third quarter of
2016, largely due to increased Commercial Banking fees and commissions and improved Insurance income. The
year-on-year reduction of 1 per cent was largely due to continued pressure on fees and commissions, including the
impact of the market-wide cap on card interchange fees introduced in late 2015, lower returns in the Insurance business
and reduced income from the run-off portfolio.
Operating lease depreciation increased 17 per cent to £895 million due to continued growth in the Lex Autolease
business and additional charges in Commercial Banking related to certain leasing assets.
Operating costs
2016 2015 Change £ million £ million % Operating costs 8,093 8,311 3
Cost:income ratio 48.7% 49.3% (0.6)pp
Operating jaws 1.0% 1.0% –
Simplification savings annual run-rate 947 373
Operating costs were £8,093 million, 3 per cent lower than 2015, driven by the continued focus on cost management and
actions to simplify the business. Investment in the business continues to increase, particularly in digital, and in 2016 the
Group made further improvements to the branch network to meet changing customer preferences, investing in new
distribution technology, designing new branch formats and upgrading call centre technology.
The Simplification programme remains on track to deliver the increased target of £1.4 billion of annual run-rate savings
by the end of 2017, with £0.9 billion of run-rate savings delivered to date. The total spent on the Simplification
programme to date is £1.6 billion with an expected further spend of £0.6 billion by the end of 2017, of which around
£0.2 billion will be included in restructuring costs.
The Group’s market-leading cost:income ratio improved to 48.7 per cent (2015: 49.3 per cent) with positive operating
jaws of 1 per cent. The Group remains committed to achieving annual improvements in the cost:income ratio and
continues to target a cost:income ratio of around 45 per cent exiting 2019.

LLOYDS BANKING GROUP PLC 2016 RESULTS
Page 7 of 48
Impairment
2016 2015 Change £ million £ million % Total impairment charge 645 568 (14)
Asset quality ratio 0.15% 0.14% 1bp
Gross asset quality ratio 0.28% 0.28% –
Impaired loans as a % of closing advances 1.8% 2.1% (0.3)pp
Provisions as a % of impaired loans 43.4% 46.1% (2.7)pp
Provisions as a % of impaired loans excluding run-off 41.2% 43.0% (1.8)pp
Asset quality remains strong with no deterioration in the underlying portfolio. The impairment charge increased to
£645 million from £568 million in 2015 with the asset quality ratio increasing slightly to 15 basis points. This increase was
largely due, as expected, to a reduction in the level of provision releases and write-backs. The gross asset quality ratio
(excluding releases and write-backs) remained unchanged at 28 basis points. Looking forward the Group expects a
further reduction in releases and write-backs in 2017 and, as a result, the asset quality ratio to increase to around
25 basis points.
The average indexed loan to value (LTV) of the Retail mortgage portfolio improved to 44.0 per cent (31 December 2015:
46.1 per cent) and the percentage of lending with an indexed LTV of greater than 100 per cent improved to 0.7 per cent
(31 December 2015: 1.1 per cent).
Impaired loans continued to fall and at 31 December 2016 were £8.5 billion, 1.8 per cent of total loans and advances
compared with £9.6 billion, and 2.1 per cent at 31 December 2015.
Statutory profit
2016 2015 Change £ million £ million % Underlying profit 7,867 8,112 (3)
Volatility and other items
Enhanced Capital Notes (790) (101)
Market volatility and asset sales 439 (81)
Amortisation of purchased intangibles (340) (342)
Restructuring costs (622) (170)
Fair value unwind and other items (231) (192)
TSB costs – (745)
(1,544) (1,631)
Payment protection insurance provision (1,000) (4,000)
Other conduct provisions (1,085) (837)
Statutory profit before tax 4,238 1,644 158
Taxation (1,724) (688)
Profit for the year 2,514 956 163
Statutory profit before tax more than doubled to £4,238 million (2015: £1,644 million) primarily due to lower PPI
provisions of £1,000 million (2015: £4,000 million).
The charge of £790 million for Enhanced Capital Notes in 2016 represented the write-off of the embedded derivative and
the premium paid on the redemption of the remaining notes in the first quarter.

LLOYDS BANKING GROUP PLC 2016 RESULTS
Page 8 of 48
Market volatility and asset sales of £439 million included a gain on sale of the Group’s interest in Visa Europe of
£484 million and negative insurance volatility of £91 million. The main item in the 2015 charge of £81 million was
negative insurance volatility of £105 million.
Restructuring costs were £622 million in 2016 and comprised costs relating to the Simplification programme, the
announced rationalisation of the non-branch property portfolio and the work on implementing the ring-fencing
requirements.
A provision of £1 billion to cover further operating costs and redress relating to PPI was recognised in the third quarter
and complaint levels in the second half have been around 8,300 per week on average. The Group’s current PPI provision
reflects our interpretation of the Financial Conduct Authority’s (FCA) consultation paper regarding a potential time bar of
the end of June 2019 and the Plevin case.
In addition there was a charge of £1,085 million to cover a range of other conduct issues of which £475 million was
recognised in the fourth quarter. The charge for the year included £280 million in respect of complaints relating to
packaged bank accounts, £261 million in respect of arrears-related activities on secured and unsecured retail products
and £94 million related to insurance products sold in Germany, together with a number of other conduct risk provisions
totalling £450 million across all divisions.
Statutory profit in 2015 included a charge of £745 million, comprising £660 million relating to the sale of TSB and
£85 million of TSB dual-running costs.
Taxation
The tax charge was £1,724 million (2015: £688 million) representing an effective tax rate of 41 per cent (2015: 42 per
cent). The high effective tax rate in 2016 was due to the banking surcharge, restrictions on the deductibility of conduct
provisions, and the negative impact on the net deferred tax asset of both the change in corporation tax rate and the
expected utilisation by the insurance business. The Group continues to expect a medium term effective tax rate of
around 27 per cent.
Return on required equity and tangible equity
The underlying return on required equity was 13.2 per cent (2015: 15.0 per cent) and the underlying return on tangible
equity was 14.1 per cent (2015: 16.0 per cent). The reduction in both return measures reflects the lower underlying profit
and higher underlying tax charge following implementation of the banking tax surcharge.
The return on required equity increased to 5.3 per cent (2015: 1.5 per cent) and the return on tangible equity increased to
6.6 per cent (2015: 2.6 per cent) both largely reflecting the lower PPI provision made in the year.
Going forward, the Group remains confident in its future prospects and now expects to deliver a return on required equity
of between 12.0 and 13.5 per cent and a return on tangible equity of between 13.5 and 15.0 per cent in 2019.

LLOYDS BANKING GROUP PLC 2016 RESULTS
Page 9 of 48
Balance sheet
At At 31 Dec 31 Dec Change 2016 2015 %
Loans and advances to customers1 £450bn £455bn (1)
Customer deposits2 £413bn £418bn (1)
Loan to deposit ratio 109% 109% –
Wholesale funding £111bn £120bn (8)
Wholesale funding <1 year maturity £35bn £38bn (7)
Of which money-market funding <1 year maturity3 £14bn £22bn (36)
Liquidity coverage ratio – eligible assets £121bn £123bn (2) 1 Excludes reverse repos of £8.3 billion (31 December 2015: £nil). 2 Excludes repos of £2.5 billion (31 December 2015: £nil). 3 Excludes balances relating to margins of £3.2 billion (31 December 2015: £2.5 billion) and settlement accounts of £1.8 billion
(31 December 2015: £1.4 billion). Loans and advances to customers were £450 billion compared with £455 billion at 31 December 2015. The reduction
reflects continued strong growth in Consumer Finance, up 11 per cent, and SME lending, up 3 per cent, with both
segments outperforming the market. This was offset by further reductions in ‘closed’ portfolios, reduced lending to
financial institutions and lower ‘open book’ mortgage balances, reflecting the Group’s prudent stance on risk and its focus
on protecting margin in the current competitive low growth market. Mortgage open book balances fell by £4.5 billion to
£266 billion during the year, of which £3.4 billion was in the first half and £1.1 billion was in the second half. Mortgage
open book balances are expected to be broadly stable in 2017. Deposits fell 1 per cent to £413 billion, with increased high quality deposits from Commercial clients offset by lower Retail
and Consumer Finance tactical balances, largely in response to the active management of deposit and funding
requirements. The Group has maintained its strong funding position with a loan to deposit ratio of 109 per cent
(2015: 109 per cent). Wholesale funding decreased by £9 billion to £111 billion as excess liquidity is managed down. Wholesale funding with a
residual maturity of less than one year was £35 billion (2015: £38 billion), and the Group’s term funding ratio was
unchanged at 68 per cent. The Group’s liquidity position remains strong, with the liquidity coverage ratio comfortably meeting regulatory
requirements.
Capital ratios and risk-weighted assets
At 31 Dec At 31 Dec Change 2016 2015 % Pro forma common equity tier 1 ratio1 13.8% 13.0% 0.8pp
Pro forma common equity tier 1 ratio pre dividend1 14.9%
Transitional tier 1 capital ratio 17.0% 16.4% 0.6pp
Transitional total capital ratio 21.4% 21.5% (0.1)pp
Pro forma leverage ratio1 5.0% 4.8% 0.2pp
Risk-weighted assets £216bn £223bn (3)
Shareholders’ equity £43bn £41bn 4
Tangible net assets per share 54.8p 52.3p 2.5p 1 The CET1 and leverage ratios at 31 December 2016 and 31 December 2015 are reported on a pro forma basis, including dividends
paid by the Insurance business in February 2017 and February 2016 respectively, in relation to prior year earnings.
LLOYDS BANKING GROUP PLC 2016 RESULTS
Page 10 of 48
The CET1 ratio improved to 13.8 per cent (2015: 13.0 per cent) on a pro forma basis and reflects the retention of
c.80 basis points of CET1 capital to cover the estimated capital impact of the MBNA acquisition. The pro forma ratio
includes the 2016 dividend paid by the Insurance business in February 2017.
The Group continues to be strongly capital generative and over the year generated c.190 basis points of CET1 capital,
pre dividend. This largely comprised c.220 basis points of underlying capital generation, along with benefits from a
reduction in risk-weighted assets (c.40 basis points) and the insurance dividend (c.20 basis points) partially offset by
conduct (c.100 basis points) and other items. This strong capital generation has enabled us to fully cover the expected
CET1 capital impact of the MBNA acquisition, increase the ordinary dividend and pay a special dividend. Going forward
we now expect to generate 170 to 200 basis points of capital per annum pre dividends. This will enable us to support
sustainable growth in the business and help Britain prosper whilst delivering sustainable returns to shareholders. The Group is pleased to announce that following their annual review the PRA has reduced our PRA Buffer to reflect the significant de-risking undertaken by the Group in recent years. Going forward however, there remain a number of potential regulatory capital developments (including the introduction of the systemic risk buffer in 2019) and as a result the Board’s view of the current level of CET1 capital required to grow the business, meet regulatory requirements and cover uncertainties remains unchanged at around 13 per cent. The amount of capital we believe is appropriate to hold is likely to vary from time to time depending on circumstances and the Board will continue to give due consideration, subject to the situation at the time, to the distribution of any surplus capital through the use of special dividends or share buy backs.
The Group’s total capital ratio remains strong at 21.4 per cent, significantly in excess of regulatory requirements.
Risk-weighted assets fell by 3 per cent to £216 billion with the reduction mainly arising in the fourth quarter primarily as a
result of active balance sheet management including securitisations.
The leverage ratio on a pro forma basis increased to 5.0 per cent (2015: 4.8 per cent), largely reflecting the increase in
tier 1 capital.
The tangible net asset value per share increased to 54.8 pence (31 December 2015: 52.3 pence) after payment of the
2015 final and 2016 interim dividends totalling 2.85 pence. The increase reflects good underlying profitability partly offset
by tax and other statutory items.
Dividend
The Board has recommended a final ordinary dividend of 1.7 pence per share, together with a capital distribution in the
form of a special dividend of 0.5 pence per share. This is in addition to the interim ordinary dividend of 0.85 pence per
share that was announced at the 2016 half year results.
The total ordinary dividend per share for 2016 of 2.55 pence per share has increased by 13 per cent, from 2.25 pence
per share in 2015 and is in line with our progressive and sustainable ordinary dividend policy. We continue to expect
ordinary dividends to increase over the medium term with a dividend payout ratio of at least 50 per cent of sustainable
earnings.
The special dividend of 0.5 pence per share represents the distribution of capital over and above the Board’s view of the
current level of capital required to grow the business, meet regulatory requirements and cover uncertainties, and allows
for the estimated capital impact of the MBNA acquisition.

LLOYDS BANKING GROUP PLC 2016 RESULTS
Page 11 of 48
UNDERLYING BASIS – SEGMENTAL ANALYSIS Run-off and Commercial Consumer Central 2016 Retail Banking Finance Insurance items Group £m £m £m £m £m £m Net interest income 6,497 2,735 1,941 (146) 408 11,435
Other income 1,053 1,987 1,338 1,755 (68) 6,065
Total income 7,550 4,722 3,279 1,609 340 17,500
Operating lease depreciation – (105) (775) – (15) (895)
Net income 7,550 4,617 2,504 1,609 325 16,605
Operating costs (4,174) (2,133) (939) (772) (75) (8,093)
Impairment (373) (16) (282) – 26 (645)
Underlying profit 3,003 2,468 1,283 837 276 7,867
Banking net interest margin 2.20% 3.26% 5.88% 2.71%Average interest-earning banking assets £302.7bn £88.6bn £33.9bn £10.7bn £435.9bnAsset quality ratio 0.12% 0.02% 0.83% 0.15%
Return on risk-weighted assets 5.45% 2.44% 4.09% 3.55%Loans and advances to customers1 £297.7bn £100.4bn £35.1bn £16.5bn £449.7bnCustomer deposits2 £271.0bn £132.6bn £7.9bn £1.5bn £413.0bn
Run-off
and Commercial Consumer Central 2015 Retail3 Banking3 Finance3 Insurance items Group £m £m £m £m £m £m Net interest income 6,664 2,576 1,954 (163) 451 11,482
Other income 1,115 2,072 1,359 1,827 (218) 6,155
Total income 7,779 4,648 3,313 1,664 233 17,637
Operating lease depreciation – (30) (720) – (14) (764)
Net income 7,779 4,618 2,593 1,664 219 16,873
Operating costs (4,339) (2,162) (977) (702) (131) (8,311)
Impairment (349) 22 (235) – (6) (568)
TSB – – – – 118 118
Underlying profit 3,091 2,478 1,381 962 200 8,112
Banking net interest margin 2.22% 2.98% 6.61% 2.63%
Average interest-earning banking assets £307.0bn £90.0bn £30.5bn £14.4bn £441.9bnAsset quality ratio 0.11% 0.01% 0.77% 0.14%
Return on risk-weighted assets 5.71% 2.36% 4.27% 3.53%
Loans and advances to customers1 £305.6bn £102.0bn £31.5bn £16.1bn £455.2bnCustomer deposits2 £273.7bn £131.9bn £11.1bn £1.6bn £418.3bn 1 Excludes reverse repos of £8.3 billion (31 December 2015: £nil). 2 Excludes repos of £2.5 billion (31 December 2015: £nil). 3 Restated. See basis of presentation on the inside front cover.
LLOYDS BANKING GROUP PLC 2016 RESULTS
Page 12 of 48
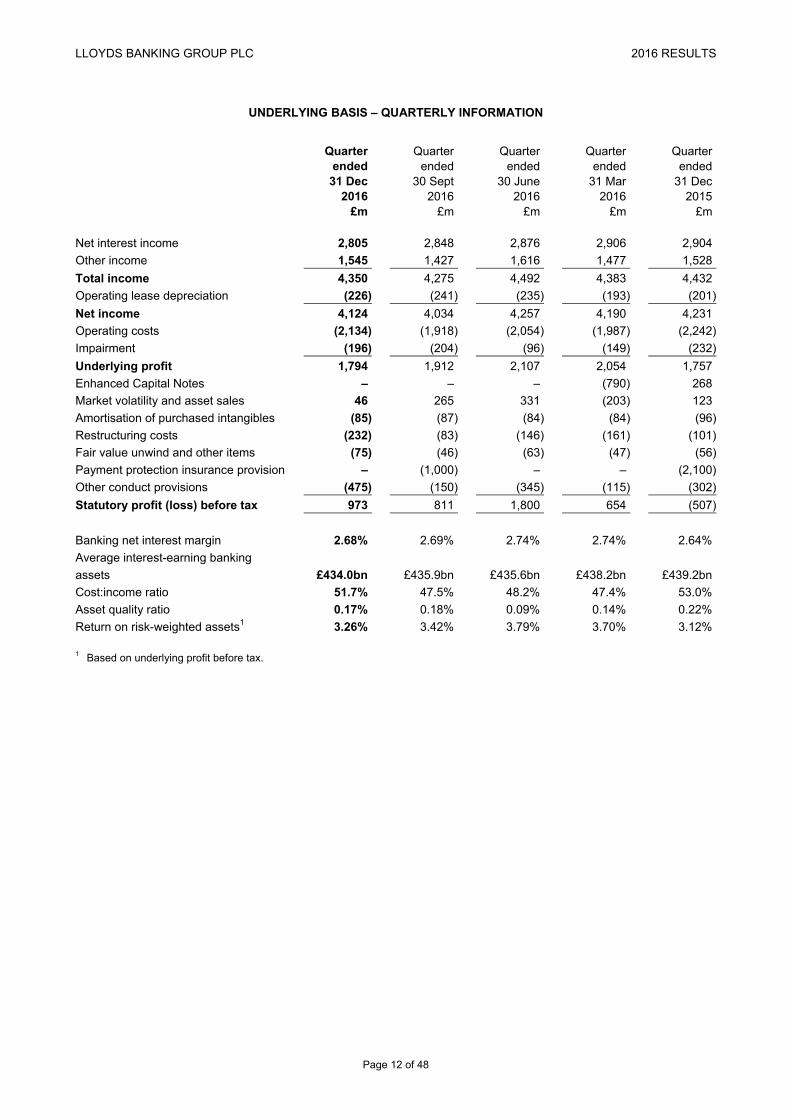
UNDERLYING BASIS – QUARTERLY INFORMATION
Quarter Quarter Quarter Quarter Quarter ended ended ended ended ended 31 Dec 30 Sept 30 June 31 Mar 31 Dec 2016 2016 2016 2016 2015 £m £m £m £m £m Net interest income 2,805 2,848 2,876 2,906 2,904
Other income 1,545 1,427 1,616 1,477 1,528
Total income 4,350 4,275 4,492 4,383 4,432
Operating lease depreciation (226) (241) (235) (193) (201)
Net income 4,124 4,034 4,257 4,190 4,231
Operating costs (2,134) (1,918) (2,054) (1,987) (2,242)
Impairment (196) (204) (96) (149) (232)
Underlying profit 1,794 1,912 2,107 2,054 1,757
Enhanced Capital Notes – – – (790) 268
Market volatility and asset sales 46 265 331 (203) 123
Amortisation of purchased intangibles (85) (87) (84) (84) (96)
Restructuring costs (232) (83) (146) (161) (101)
Fair value unwind and other items (75) (46) (63) (47) (56)
Payment protection insurance provision – (1,000) – – (2,100)
Other conduct provisions (475) (150) (345) (115) (302)
Statutory profit (loss) before tax 973 811 1,800 654 (507)
Banking net interest margin 2.68% 2.69% 2.74% 2.74% 2.64%
Average interest-earning banking
assets £434.0bn £435.9bn £435.6bn £438.2bn £439.2bn
Cost:income ratio 51.7% 47.5% 48.2% 47.4% 53.0%
Asset quality ratio 0.17% 0.18% 0.09% 0.14% 0.22%
Return on risk-weighted assets1 3.26% 3.42% 3.79% 3.70% 3.12%
1 Based on underlying profit before tax.

LLOYDS BANKING GROUP PLC 2016 RESULTS
Page 13 of 48
DIVISIONAL RESULTS
RETAIL Retail offers a broad range of financial service products, including current accounts, savings and mortgages, to UK personal customers, including Wealth and small business customers. It is also a distributor of insurance, and a range of long-term savings and investment products. Its aim is to be the best bank for customers in the UK, by building deep and enduring relationships that deliver value to customers, and by providing them with greater choice and flexibility. It will maintain its multi-brand and multi-channel strategy, and continue to simplify the business and provide more transparent products, helping to improve service levels and reduce conduct risks.
Progress against strategic initiatives The division has made good progress against its strategic objectives; improving the customer experience and realigning branch and other capabilities in line with changing customer needs.
Creating the best customer experience
Largest UK digital bank with over 12.5 million active online users including over 8 million mobile users.
55 per cent of approved mortgage applications proceed to offer within 14 days compared to 37 per cent in 2015.
Instant mortgage lending decisions through the online Agreement in Principle.
Customers can now complete their full remortgage application online.
Reduced appointment times for opening a new savings account by 44 per cent and matured savings accounts can
now be renewed in just a few minutes.
Extended online and mobile phone application processes to all current accounts.
Lloyds Bank and Bank of Scotland current account online journeys have been rated #1 and #2 respectively by
industry researcher eBenchmarkers. Becoming simpler and more efficient Continued the branch network optimisation programme in response to changing customer behaviour.
− Investing in new distribution technology and rolling out WIFI and tablet solutions.
− Designing new branch formats and upgrading call centre technology.
− Closed further branches, but maintaining the UK’s largest branch network with a 21 per cent market share. Delivering sustainable growth
Continued to attract new customers through positive switching activity, accounting for more than 1 in 5 switchers in
2016.
Since the launch of the Group’s Helping Britain Prosper Plan in 2014 the Group has continued to be the leading
supporter of first-time house buyers, with £11.7 billion lent in 2016.
Exceeded Helping Britain Prosper target by supporting over 121,000 start-up businesses whilst also launching a
range of new products and services to improve the customer experience for small businesses. Financial performance Underlying profit decreased 3 per cent to £3,003 million reflecting the challenging interest rate environment,
continued pressure on other operating income and increased investment in the business. Net interest income decreased 3 per cent driven largely by a reduction in mortgage balances reflecting the focus on
protecting margins. Banking margin fell by just 2 basis points despite the continuing low interest rate environment. Other income 6 per cent lower than 2015 driven by changing customer behaviour and improvements to the customer
proposition. Operating costs decreased 4 per cent to £4,174 million as efficiency savings more than covered an increase in
investment. Staff numbers have reduced by 11 per cent in the year. Impairment charge increased 7 per cent to £373 million, however underlying credit quality remains stable. Loans and advances to customers fell 3 per cent to £297.7 billion, with the open mortgage book (excluding specialist
mortgage books and Intelligent Finance) reducing by £4.5 billion to £266 billion during the year, of which £3.4 billion was in the first half and £1.1 billion in the second half. The fall reflects the decision to protect net interest margin in the current competitive low growth market.
Customer deposits decreased 1 per cent to £271.0 billion, driven by the decision to reduce tactical balances. Risk-weighted assets increased £0.6 billion to £55.2 billion reflecting the Group’s focus on balancing margin and risk
considerations offset by a more prudent approach to secured risk-weighted asset modelling.

LLOYDS BANKING GROUP PLC 2016 RESULTS
Page 14 of 48
Performance summary
2016 2015¹ Change £m £m % Net interest income 6,497 6,664 (3)
Other income 1,053 1,115 (6)
Total income 7,550 7,779 (3)
Operating lease depreciation – –
Net income 7,550 7,779 (3)
Operating costs (4,174) (4,339) 4
Impairment (373) (349) (7)
Underlying profit 3,003 3,091 (3)
Banking net interest margin 2.20% 2.22% (2)bp
Average interest-earning banking assets £302.7bn £307.0bn (1)
Asset quality ratio 0.12% 0.11% 1bp
Impaired loans as % of closing advances 1.5% 1.3% 0.2pp
Return on risk-weighted assets 5.45% 5.71% (26)bp
Return on assets 0.99% 1.00% (1)bp
Key balance sheet items
At 31 Dec At 31 Dec 2016 20151 Change £bn £bn % Loans and advances excluding closed portfolios 271.0 275.5 (2)
Closed portfolios 26.7 30.1 (11)
Loans and advances to customers 297.7 305.6 (3)
Relationship balances 253.8 249.3 2
Tactical balances 17.2 24.4 (30)
Customer deposits 271.0 273.7 (1)
Risk-weighted assets 55.2 54.6 1
1 Restated. See basis of presentation on the inside front cover.

LLOYDS BANKING GROUP PLC 2016 RESULTS
Page 15 of 48
COMMERCIAL BANKING
Commercial Banking has a client-led, low risk, capital efficient strategy, helping UK-based clients and international clients with a link to the UK. Through its four client facing divisions – SME, Mid Markets, Global Corporates and Financial Institutions – it provides clients with a range of products and services such as lending, transactional banking, working capital management, risk management, debt capital markets services, as well as access to private equity through Lloyds Development Capital.
Progress against strategic initiatives
The division has made significant progress against its strategic objectives; delivering a return on risk-weighted assets of 2.44 per cent, exceeding the investor commitment of returns greater than 2.40 per cent by the end of 2017 while continuing to grow lending in key client segments.
Creating the best customer experience
Awarded Business Bank of the Year at the FD’s Excellence Awards for the 12th consecutive year.
Increased net promoter scores across all client divisions surveyed in 2016.
Supported over 10,000 first time exporters which is helping the UK government achieve its ambition to deliver
100,000 new exporters by 2020.
Becoming simpler and more efficient
Reduced SME relationship manager hours spent on business account opening from seven to two hours, enabling
more time to be spent face to face with clients.
Continued to invest in next generation digital capabilities and client analytics to transform clients’ experiences. The
‘CB Online’ transaction banking platform now has over 2,000 clients registered. Delivering sustainable growth
Increased lending in SME and Mid Markets by around £2 billion in 2016 and provided UK manufacturers with over
£1 billion of funding support in 2016.
Facilitated over £10.5 billion of financing to support UK government infrastructure projects, including the creation of a
wood pellet power plant in Teesside which will provide energy to 600,000 homes and Race Bank Offshore Windfarm
which will play a key part in the UK’s green energy future.
Financial performance
Underlying profit in line with prior year at £2,468 million.
Return on risk-weighted assets of 2.44 per cent with a 7 per cent reduction in risk-weighted assets, total income
growth and disciplined cost management.
Total income up 2 per cent with growth across SME, Mid Markets and Financial Institutions.
Net interest income up 6 per cent with a 28 basis points improvement in net interest margin, supported by high quality
deposit growth, disciplined deposit pricing and reduced funding costs. Other income down 4 per cent due to
non-recurring income recognised in 2015 relating to refinancing support of Global Corporates clients. This has been
partially offset by growth in CB Markets of 8 per cent and increased momentum in the second half of the year with
other income up 9 per cent against the first half of 2016.
Operating lease depreciation increased due to additional charges relating to certain leasing assets.
Operating costs down 1 per cent with performance reflecting disciplined cost management and headcount
rationalisation, supported by efficiency initiatives resulting in positive jaws.
Impairment charge of £16 million reflects the benefit of active risk management and the continued low interest rate
environment. Asset quality ratio remains low at 2 basis points.
Risk-weighted assets decreased by £7.2 billion, reflecting the disciplined approach to capital, including capital
efficient securitisation activity and credit management. This has received global recognition through the award of
Credit Portfolio Manager of the Year at the 2016 Risk Awards.
Loans and advances to customers fell by 2 per cent to £100.4 billion. Above market growth in SME lending and
increases in Mid Markets and Global Corporates offset by lower lending in Financial Institutions.
Deposits increased 1 per cent to £132.6 billion. Strong momentum in attracting high quality deposits with Global Transactional Banking balances up 10 per cent, further optimising the portfolio and strengthening the Group balance sheet.

LLOYDS BANKING GROUP PLC 2016 RESULTS
Page 16 of 48
Performance summary
2016 20151 Change £m £m % Net interest income 2,735 2,576 6
Other income 1,987 2,072 (4)
Total income 4,722 4,648 2
Operating lease depreciation (105) (30)
Net income 4,617 4,618 –
Operating costs (2,133) (2,162) 1
Impairment (charge) release (16) 22
Underlying profit 2,468 2,478 –
Banking net interest margin 3.26% 2.98% 28bp
Average interest-earning banking assets £88.6bn £90.0bn (2)
Asset quality ratio 0.02% 0.01% 1bp
Impaired loans as % of closing advances 2.2% 2.5% (0.3)pp
Return on risk-weighted assets 2.44% 2.36% 8bp
Return on assets 1.29% 1.18% 11bp
Key balance sheet items
At 31 Dec At 31 Dec 2016 20151 Change £bn £bn % Loans and advances to customers 100.4 102.0 (2)
Customer deposits 132.6 131.9 1
Risk-weighted assets 96.0 103.2 (7)
1 Restated. See basis of presentation on the inside front cover.

LLOYDS BANKING GROUP PLC 2016 RESULTS
Page 17 of 48
CONSUMER FINANCE Consumer Finance comprises all the Group’s consumer lending products including motor finance, credit cards, and unsecured personal loans along with its European business. Its aim is to deliver sustainable growth, within a prudent risk appetite in these markets through its multi-brand, multi-channel distribution model. Progress against strategic initiatives The division continues to make significant progress against its strategic objectives, and has delivered its original target of increasing UK customer assets by £6 billion a year ahead of target, whilst maintaining a prudent approach to new business and managing residual value risk conservatively. In line with its strategy to grow in consumer finance the Group has entered into an agreement to acquire MBNA’s prime UK credit card business with £7.0 billion of assets and c.2.8 million customers, which will give us the opportunity to create a best-in-class credit card operation. Creating the best customer experience Credit Cards launched the innovative Halifax FlexiCard, giving customers more control, with dedicated repayment
plans. In the Motor business, Black Horse launched a personal contract purchase (PCP) product for caravans and
motorhomes, which now accounts for 11 per cent of applications in this sector.
Lex Autolease built a bespoke system to manage vehicle servicing and maintenance, including online self-service
functionality and has been used by over 10,000 customers since May.
Loans have significantly enhanced the digital sales process with the introduction of an upfront eligibility checker. Becoming simpler and more efficient Consumer Finance continues to focus on efficiency with further significant improvements to processes implemented
in the year. This has also helped reduce customer complaints by 11 per cent. Lex Autolease simplified the way it sells c.80,000 vehicles per annum at end of contract, reducing the number of
operating sites and associated costs, whilst increasing speed of vehicle disposals.
Black Horse launched the Mobile Finance Calculator across the dealer network, allowing dealers to provide more
accurate indicative customer pricing early on in the process. Delivering sustainable growth
Black Horse balances have grown by 20 per cent in the year, ahead of market growth, and continue to benefit from partnerships with key manufacturers such as Jaguar Land Rover.
Credit card balances grew broadly in line with the market at 4 per cent, and the Group was the number one issuer of new cards in the UK.
The acquisition of MBNA will enable the Group to enhance its position and offering within the UK prime credit card market and brings capabilities including data analytics and digital expertise in addition to a well-recognised brand. This will be complementary to the Group’s existing operation and provides further opportunities for growth and delivering excellent customer service.
Unsecured loan balances contracted marginally in the year as the Group continues to focus on low risk franchise customers.
Financial performance Underlying profit at £1,283 million was down 7 per cent, driven by slightly lower income and increased impairment,
but return on risk-weighted assets remained strong at 4.09 per cent. Net interest income at £1,941 million was down 1 per cent with strong asset growth offset by the 73 basis point
reduction in net interest margin. This was largely due to the focus on high quality, lower margin motor finance business, with the margin also impacted by lower Euribor and planned reductions in deposits, in line with the Group’s funding strategy.
Other income was down 2 per cent at £1,338 million due to the market-wide reduction in card interchange fees. Excluding this, other income was 3 per cent higher driven by continued fleet growth in Lex Autolease.
Operating costs fell 4 per cent to £939 million with continued investment in the business more than offset by underlying efficiency savings. The division maintained a strong cost:income ratio, in line with 2015 at 37.4 per cent.
The impairment charge of £282 million increased by £47 million, primarily due to overall growth and the non-recurrence of a favourable one-off release in 2015. Credit quality remains good with new business written within the Group’s prudent credit and conduct appetite.
UK customer assets were up 9 per cent year-on-year, driven primarily by growth in Black Horse. Customer deposits were down 29 per cent to £7.9 billion driven by re-pricing activity and the Group’s deposit
strategy.

LLOYDS BANKING GROUP PLC 2016 RESULTS
Page 18 of 48
Performance summary
2016 20151 Change £m £m % Net interest income 1,941 1,954 (1)
Other income 1,338 1,359 (2)
Total income 3,279 3,313 (1)
Operating lease depreciation (775) (720) (8)
Net income 2,504 2,593 (3)
Operating costs (939) (977) 4
Impairment (282) (235) (20)
Underlying profit 1,283 1,381 (7)
Banking net interest margin 5.88% 6.61% (73)bp
Average interest-earning banking assets £33.9bn £30.5bn 11
Asset quality ratio 0.83% 0.77% 6bp
Impaired loans as % of closing advances 2.1% 2.9% (0.8)pp
Return on risk-weighted assets 4.09% 4.27% (18)bp
Return on assets 3.29% 3.95% (66)bp
Key balance sheet items
At 31 Dec At 31 Dec 2016 20151 Change £bn £bn % Loans and advances to customers 35.1 31.5 11
Operating lease assets 4.1 3.5 17
Total customer assets 39.2 35.0 12
Of which UK 32.8 30.0 9
Customer deposits 7.9 11.1 (29)
Risk-weighted assets 32.1 30.7 5
1 Restated. See basis of presentation on the inside front cover.

LLOYDS BANKING GROUP PLC 2016 RESULTS
Page 19 of 48
INSURANCE
The Insurance division is committed to providing a range of trusted and value-for-money protection, pension and investment products to meet the needs of its customers. With over £110 billion of funds under management, Scottish Widows is helping six million customers protect what they value most and plan financially for the future. In addition, the general insurance business is protecting the homes, belongings, cars and businesses of over three million customers. Progress against strategic initiatives
The Group will continue to invest in developing the Insurance business and will seek to grow in areas where it has competitive advantage and is underrepresented, for the benefit of both customers and shareholders. Creating the best customer experience Regained ‘5 star’ Service Awards in both Life & Pensions and Investment categories at the 2016 Financial Adviser
Service Awards together with ‘Most Improved Provider’ award. These accolades are voted on by 5,000 UK financial advisers and reflect improved customer service alongside simplified and streamlined processes.
Strengthened the general insurance business with the launch of a flexible online home insurance offering, delivering increased direct sales, significant new functionality and more choice for customers.
A founder member of the UK government’s Flood Re initiative and played a lead role in setting up the scheme, which has enabled customers in high flood risk areas to secure affordable home insurance.
Becoming simpler and more efficient Launched a new digital service for employers, significantly reducing processing times for monthly corporate pension
scheme management. Introduced an online tool allowing customers to consolidate other workplace pensions assets into the Group. This
builds on the existing ‘5 Steps to Retirement’ website, enabling customers to take control of their retirement plans. Delivering sustainable growth Successfully completed four bulk annuity transactions in 2016, taking the combined external deal size to over
£1.85 billion since entering the market in late 2015. Continued to leverage Group capabilities to source attractive, low risk, higher yielding assets to back annuity
liabilities. Total assets acquired to date are £7 billion.
Growth in corporate pension sales in a competitive environment, driven by increased uptake of new schemes.
Scottish Widows Protect monthly applications have increased almost tenfold, providing £2.4 billion of life assurance and critical illness cover to individuals and businesses across the UK.
Corporate pension, planning and retirement funds under management increased to over £42 billion reflecting net inflows and positive market movements.
Financial performance
Underlying profit decreased by 13 per cent to £837 million. A 17 per cent increase in new business income was more
than offset by adverse economics impacting existing business income together with increased investment costs.
Life and pensions sales (PVNBP) decreased by 6 per cent. Excluding the internal With-Profits fund bulk annuity
transfers in 2015 and 2016, PVNBP increased 23 per cent reflecting the four bulk annuity deals secured, growth in
corporate pensions and increased momentum in both planning and retirement and protection.
General insurance gross written premiums (GWP) decreased by 3 per cent, reflecting the continued softening of the
Home market and the run off of legacy products.
Costs increased by 10 per cent to £772 million, reflecting increased investment and £28 million annual levy
associated with the Flood Re scheme. Capital
The estimated pre dividend Solvency II ratio of 160 per cent (1 January 2016 pre dividend position: 160 per cent)
represents the shareholder view of Solvency II surplus. Benefits from capital optimisation initiatives have been offset
by adverse interest rate volatility and the payment of a £500 million dividend in February 2016.
Paid a further £500 million to the Group in February 2017, bringing total dividends paid since the formation of the Group in 2009, to £7.1 billion.

LLOYDS BANKING GROUP PLC 2016 RESULTS
Page 20 of 48
Performance summary
2016 2015 Change £m £m % Net interest income (146) (163) 10
Other income 1,755 1,827 (4)
Total income 1,609 1,664 (3)
Operating costs (772) (702) (10)
Underlying profit 837 962 (13)
Life and pensions sales (PVNBP)1 8,919 9,460 (6)
New business income 381 326 17
General insurance total gross written premiums 1,108 1,148 (3)
General insurance combined ratio 85% 83% 2pp
Solvency II ratio (pre dividend) 160% 160% – 1 Present value of new business premiums. With-Profit fund bulk annuity transfer sales were £2,386 million in 2015 and £243 million in
2016. Excluding these transfers, LP&I sales have improved 23 per cent in 2016.
Profit by product group
2016 2015 New Existing New Existing business business Total business business Total income income income income income income £m £m £m £m £m £m Corporate pensions 123 135 258 140 175 315
Bulk annuities 121 16 137 125 – 125
Planning and retirement 109 95 204 40 94 134
Protection 19 33 52 12 37 49
Longstanding LP&I 9 393 402 9 467 476
381 672 1,053 326 773 1,099
Life and pensions experience and
other items 223 235
General insurance 354 323
Net interest income and free
asset return (21) 7
Total costs (772) (702)
Underlying profit 837 962
New business income has increased by £55 million, or 17 per cent, driven by growth in planning and retirement and protection propositions. This has more than offset lower income from corporate pensions.
Existing business income has decreased by £101 million, primarily driven by adverse economics. There was a net benefit of £223 million (2015: £235 million) as a result of experience and other items. This included one off benefits following an update to the methodology for calculating the illiquidity premium and the addition of a new death benefit to legacy pension contracts, to align terms with other pensions products. These were partly offset by the effect of recent reforms on activity within the pensions market.
General insurance income net of claims has increased by £31 million primarily driven by lower weather related claims.

LLOYDS BANKING GROUP PLC 2016 RESULTS
Page 21 of 48
RUN-OFF AND CENTRAL ITEMS
RUN-OFF
2016 2015 Change £m £m %
Net interest income (110) (88) (25)
Other income 120 145 (17)
Total income 10 57 (82)
Operating lease depreciation (15) (14) (7)
Net income (5) 43
Operating costs (77) (150) 49
Impairment release / (charge) 26 (8)
Underlying loss (56) (115) 51
2016 2015 Change £bn £bn %
Loans and advances to customers 9.6 10.3 (7)
Total assets 11.3 12.2 (7)
Risk-weighted assets 8.5 10.2 (17)
The lower income and costs reflect further reductions in the run-off portfolios.
CENTRAL ITEMS
2016 2015 £m £m Total income 330 176
Costs 2 19
Impairment release – 2
TSB – 118
Underlying profit 332 315
Central items includes income and expenditure not attributed to divisions, including the costs of certain central and head
office functions.
Total income increased to £330 million (2015: £176 million) largely as a result of sales of liquid assets including gilts, and
the timing of dividends from the Group’s strategic investments.
The results in 2015 include TSB for the first quarter only.

LLOYDS BANKING GROUP PLC 2016 RESULTS
Page 22 of 48
OTHER FINANCIAL INFORMATION
1. Reconciliation between statutory and underlying basis results
The tables below set out the reconciliation from the statutory results to the underlying basis results, the principles of
which are set out on the inside front cover.
Removal of: Lloyds Banking Volatility Other Group and other Insurance conduct Underlying statutory items1 gross up2 PPI provisions basis2016 £m £m £m £m £m £m
Net interest income 9,274 263 1,898 – – 11,435
Other income, net of insurance claims 7,993 121 (2,110) – 61 6,065
Total income 17,267 384 (212) – 61 17,500
Operating lease depreciation (895) – – – (895)
Net income 17,267 (511) (212) – 61 16,605
Operating expenses3 (12,277) 1,948 212 1,000 1,024 (8,093)
Impairment (752) 107 – – – (645)
Profit before tax 4,238 1,544 – 1,000 1,085 7,867
Removal of: Lloyds Banking Volatility Other Group and other Insurance conduct Underlying statutory items4 TSB gross up2 PPI provisions basis2015 £m £m £m £m £m £m £m
Net interest income 11,318 318 (192) 38 – – 11,482
Other income, net of insurance claims 6,103 209 (31) (126) – – 6,155
Total income 17,421 527 (223) (88) – – 17,637
Operating lease depreciation (764) – – – – (764)
Net income 17,421 (237) (223) (88) – – 16,873
Operating expenses3 (15,387) 2,065 86 88 4,000 837 (8,311)
Impairment (390) (197) 19 – – – (568)
TSB5 – – 118 – – – 118
Profit before tax 1,644 1,631 – – 4,000 837 8,112
1 Comprises the write-off of the ECN embedded derivative and premium paid on redemption of the remaining notes in the first quarter(loss of £790 million); the effects of asset sales (gain of £217 million); volatile items (gain of £99 million); liability management (gain of£123 million); the amortisation of purchased intangibles (£340 million); restructuring costs (£622 million, principally comprising theseverance related costs under phase II of the Simplification programme); and the fair value unwind and other items (loss of £231 million).
2 The Group’s insurance businesses’ income statements include income and expenditure which are attributable to the policyholders ofthe Group’s long-term assurance funds. These items have no impact in total upon the profit attributable to equity shareholders and, inorder to provide a clearer representation of the underlying trends within the business, these items are shown net within the underlyingresults.
3 The statutory basis figure is the aggregate of operating costs and operating lease depreciation. 4 Comprises market movements on the ECN embedded derivative (loss of £101 million); the effects of asset sales (gain of £54 million);
volatile items (loss of £107 million); liability management (loss of £28 million); the amortisation of purchased intangibles (£342 million);restructuring costs (£170 million); TSB costs (£745 million); and the fair value unwind and other items (loss of £192 million).
5 Comprises the underlying results of TSB.

LLOYDS BANKING GROUP PLC 2016 RESULTS
Page 23 of 48
2. Banking net interest margin The banking net interest margin is calculated by dividing banking net interest income by average interest-earning banking assets. Non-banking net interest income includes the net interest expense reported by the Insurance business, net interest income earned from non-banking assets, negative fair value adjustments relating to certain past liability management exercises and consolidation adjustments between net interest and other income to eliminate the impact of certain intragroup transactions. Non-banking assets include loans and advances within Commercial Banking where the predominant income stream is fees rather than net interest, and loans sold by Commercial Banking and Retail to Insurance to back annuitant liabilities. The table below shows the reconciliation between the statutory net interest income and the underlying net interest
income.
2016 2015 £m £m Group net interest income – statutory basis 9,274 11,318
Insurance gross up 1,898 38
Volatility and other items 263 318
TSB – (192)
Group net interest income – underlying basis 11,435 11,482
Insurance division net interest expense 146 163
Other non-banking net interest expense / (income) 245 (15)
Banking net interest income – underlying basis 11,826 11,630 Average interest-earning banking assets £435.9bn £441.9bn Banking net interest margin 2.71% 2.63% Other non-banking net interest expense was £245 million (2015: net interest income £15 million). The change in the year was largely driven by a reduction in the net interest income reported by the non-banking businesses, the continued reduction in run-off non-banking assets together with a change to the funding cost charged to the remaining run-off non-banking assets to better reflect their maturity profile. The insurance gross up of £1,898 million (2015: £38 million) largely represents amounts payable to unitholders in consolidated open-ended investment vehicles managed by the Insurance business. The increased expense in the year reflects strong market performance in the second half of 2016. The table below shows the reconciliation between net loans and advances and average interest-earning banking assets.
Quarter Quarter Quarter Quarter ended ended ended ended 31 Dec 30 Sept 30 Jun 31 Mar 2016 2016 2016 2016 £bn £bn £bn £bn Net loans and advances to customers 449.7 451.7 453.0 456.7
Impairment provision and fair value adjustments 3.7 3.8 4.1 4.3Non-banking items:
Fee based loans and advances (9.4) (8.7) (9.1) (10.9)
Sale of assets to Insurance (6.7) (6.2) (6.1) (5.7)
Other non-banking (5.0) (5.5) (4.9) (5.3)
Gross banking loans and advances 432.3 435.1 437.0 439.1
Averaging 1.7 0.8 (1.4) (0.9)
Average interest-earning banking assets (qtr) 434.0 435.9 435.6 438.2
Average interest-earning banking assets (ytd) 435.9 436.6 436.9 438.2

LLOYDS BANKING GROUP PLC 2016 RESULTS
Page 24 of 48
3. Volatility arising in insurance businesses
Volatility included in the Group’s statutory results before tax comprises the following:
2016 2015 £m £m
Insurance volatility (152) (303)
Policyholder interests volatility 241 87
Total volatility 89 (216)
Insurance hedging arrangements (180) 111
Total (91) (105)
Insurance volatility
The Group’s insurance business has policyholder liabilities that are supported by substantial holdings of investments.
IFRS requires that the changes in both the value of the liabilities and investments are reflected within the income
statement. The value of the liabilities does not move exactly in line with changes in the value of the investments. As the
investments are substantial, movements in their value can have a significant impact on the profitability of the Group.
Management believes that it is appropriate to disclose the division’s results on the basis of an expected return in addition
to results based on the actual return. The impact of the actual return on these investments differing from the expected
return is included within insurance volatility.
4. Return measures
The Group’s underlying return on required equity for 2016 was 13.2 per cent (2015: 15.0 per cent) and the underlying
return on tangible equity was 14.1 per cent (2015: 16.0 per cent). The reduction in both return measures was as a result
of lower underlying profit and higher tax.
2016 2015 £bn £bnUnderlying return on required equity
Average shareholders' equity 42.7 42.8
Average non-controlling interests 0.4 0.6
Excess equity based on 12 per cent CET 1 requirement (2.4) (2.7)
Average required equity 40.7 40.7
Underlying profit after tax and profits attributable to other equity holders (£m) 5,410 6,155
Notional earnings on excess equity (£m) (24) (37)
5,386 6,118
Underlying return on required equity 13.2% 15.0%
Underlying return on tangible equity Average shareholders' equity 42.7 42.8
Average intangible assets (3.8) (4.0)
Average tangible equity 38.9 38.8
Underlying profit after tax and profits attributable to other equity holders (£m) 5,410 6,155
Amortisation of intangible assets (post tax) (£m) 174 156
Profit attributable to non-controlling interests (£m) (101) (96)
5,483 6,215
Underlying return on tangible equity 14.1% 16.0%

LLOYDS BANKING GROUP PLC 2016 RESULTS
Page 25 of 48
5. Tangible net assets per share
The table below sets out a reconciliation of the Group’s shareholders’ equity to its tangible net assets.
2016 2015 £m £m Shareholders' equity 43,020 41,234
Goodwill (2,016) (2,016)
Intangible assets (1,681) (1,838)
Purchased value of in-force business (340) (377)
Other, including deferred tax effects 170 264
Tangible net assets 39,153 37,267
Ordinary shares in issue, excluding Own shares 71,413m 71,263m
Tangible net assets per share 54.8p 52.3p

LLOYDS BANKING GROUP PLC 2016 RESULTS
Page 26 of 48
GROUP CREDIT RISK PORTFOLIO
Overview
Asset quality remains strong with portfolios continuing to benefit from the Group’s pro-active approach to risk
management, continued low interest rates, and a resilient UK economic environment.
The impairment charge increased by 14 per cent to £645 million in 2016 compared to £568 million in 2015. Gross
charges remained broadly flat with the increase in net charges largely due to lower levels of releases and write-backs.
The asset quality ratio for 2016 was 15 basis points compared to 14 basis points during 2015 and the gross asset
quality ratio (excluding releases and write-backs) was stable at 28 basis points.
Looking forward the 2017 full year asset quality ratio is expected to increase to around 25 basis points primarily reflecting
lower releases and write-backs.
Impaired loans as a percentage of closing loans and advances reduced to 1.8 per cent at 31 December 2016, from
2.1 per cent at 31 December 2015, with impaired loans reducing by £1.1 billion to £8.5 billion during the period, due
to further reductions in the Commercial Banking, Consumer Finance and run-off portfolios.
Low risk culture and prudent risk appetite
The Group continues to operate a prudent approach to credit risk, with the portfolios benefiting from the focus on
credit at origination and a prudent through the cycle approach to credit risk appetite. The Group’s portfolios are well
positioned against current economic concerns and market volatility.
The Group’s credit processes and controls ensure effective risk management, including early identification and
management of customers and counterparties who may be showing signs of distress.
The Group has delivered lending growth in key segments without relaxing credit criteria despite terms and conditions in
some of the Group’s markets being impacted by increased competition and, in Commercial Banking, uncertainty in
some sectors.
Sector concentrations within the lending portfolios are closely monitored and controlled, with mitigating actions taken
where appropriate. Sector and product caps limit exposure to certain higher risk and vulnerable sectors and asset
classes. In particular:
− The average indexed LTV of the Retail UK Secured portfolio at 31 December 2016 was 44.0 per cent
(31 December 2015: 46.1 per cent). The percentage of closing loans and advances with an indexed LTV greater
than 100 per cent was 0.7 per cent (31 December 2015: 1.1 per cent).
− Total UK Direct Real Estate gross lending across the Group was £19.9 billion at 31 December 2016 (31 December 2015:
£19.7 billion). This mainly includes Commercial Banking lending of £18.5 billion, £0.5 billion booked in the Islands
Commercial business and £0.2 billion within Retail Business Banking (within Retail Division) with the Group
continuing to write new business within conservative risk appetite parameters. The Group’s significantly reduced
legacy run-off direct real estate portfolio has continued to fall to £0.7 billion at 31 December 2016 (31 December
2015: £1.1 billion), and now represents a very modest element of the total UK Direct Real Estate lending portfolio.
Run-off net external assets stood at £11.3 billion at 31 December 2016, down from £12.2 billion at 31 December
2015. The portfolio represents only 2.1 per cent of the overall Group’s loans and advances (31 December 2015:
2.3 per cent).

LLOYDS BANKING GROUP PLC 2016 RESULTS
Page 27 of 48
Impairment charge by division
Loans and
advances to
customers
Debt securities
classified as
loans and
receivables
Available
-for-sale
financial
assets
Other
credit risk
provisions Total 20151
2016 £m £m £m £m £m £m Retail 373 – – – 373 349
Commercial Banking 21 – – (5) 16 (22)
Consumer Finance 282 – – – 282 235
Run-off (17) – – (9) (26) 8
Central items (2) – – 2 – (2)
Total impairment charge 657 – – (12) 645 568
Asset quality ratio 0.15% 0.14%
Gross asset quality ratio 0.28% 0.28% 1 Restated.
Group impaired loans and provisions Impairment
Impaired provision
Loans and loans as % as % of
advances to Impaired of closing Impairment impaired
customers loans advances provisions1 loans2
£m £m % £m %At 31 December 2016 Retail 299,493 4,354 1.5 1,630 38.2
Commercial Banking 101,176 2,179 2.2 824 37.8
Consumer Finance 35,494 745 2.1 396 85.0
Run-off 10,259 1,217 11.9 682 56.0
Reverse repos and other items3 15,249
Total gross lending 461,671 8,495 1.8 3,532 43.4
Impairment provisions (3,532)
Fair value adjustments4 (181)
Total Group 457,958 At 31 December 20155
Retail 307,500 4,112 1.3 1,564 39.2
Commercial Banking 103,082 2,543 2.5 1,091 42.9
Consumer Finance 31,827 910 2.9 367 75.5
Run-off 11,422 2,025 17.7 1,150 56.8
Reverse repos and other items3 5,798
Total gross lending 459,629 9,590 2.1 4,172 46.1
Impairment provisions (4,172)
Fair value adjustments4 (282)
Total Group 455,175 1 Impairment provisions include collective unidentified impairment provisions. 2 Impairment provisions as a percentage of impaired loans are calculated excluding loans in recoveries in Retail (31 December 2016:
£86 million; 31 December 2015: £118 million) and in Consumer Finance (31 December 2016: £279 million; 31 December 2015:£424 million).
3 Includes £6.7 billion (December 2015: £5.7 billion) of lower risk loans sold by Commercial Banking and Retail to Insurance to backannuitant liabilities.
4 The fair value adjustments relating to loans and advances were those required to reflect the HBOS assets in the Group’s consolidatedfinancial records at their fair value and took into account both the expected losses and market liquidity at the date of acquisition. Thefair value unwind in respect of impairment losses incurred was £70 million for the year ended 31 December 2016 (31 December 2015:£97 million). The fair value unwind in respect of loans and advances is expected to continue to decrease in future years and willreduce to zero over time.
5 Restated. See basis of presentation on the inside front cover.

LLOYDS BANKING GROUP PLC 2016 RESULTS
Page 28 of 48
FUNDING AND LIQUIDITY MANAGEMENT
During 2016, the Group has maintained its strong funding and liquidity position, with a loan to deposit ratio of 108.9 per
cent.
Total funded assets reduced by £5.8 billion to £465.4 billion during 2016. Loans and advances to customers, excluding
reverse repos, reduced by £5.5 billion. Growth in Consumer Finance was strong at 11 per cent and SME lending growth
was 3 per cent, both outperforming the market. This was offset by a reduction in mortgage balances as the Group
continues to balance risk and margin considerations versus volumes in a competitive low growth market. Total customer
deposits fell by £5.3 billion to £413.0 billion at 31 December 2016, largely due to lower Retail and Consumer Finance
tactical balances.
Wholesale funding has decreased by £9.1 billion to £110.8 billion as excess liquidity is managed down; the amount with
a residual maturity less than one year fell to £35.1 billion (£37.9 billion at 31 December 2015). The Group’s term funding
ratio (wholesale funding with a remaining life of over one year as a percentage of total wholesale funding) is unchanged
at 68 per cent.
Gross term issuance for 2016 totalled £10.4 billion. The Group maintained a diversified approach to funding markets with
trades in public and private format, secured and unsecured products and a wide range of currencies and markets. In
2016, the Group drew down £1.0 billion under the Funding for Lending Scheme (FLS), taking peak usage to £33.1 billion,
with £3.0 billion of maturities during the year. A further £4.5 billion was drawn under the Bank of England’s Term Funding
Scheme (TFS), underlining the Group’s support to the UK economy. The maturities for the FLS and TFS are fully
factored into the Group’s funding plan.
During 2016, the Group’s term issuance costs have remained broadly in line with other post-crisis years and significantly
lower than levels seen during the economic downturn. The Group’s overall cost of wholesale funding has reduced as
more expensive funding raised in previous years mature. The Group’s market capacity for term funding is considered
across the planning horizon as part of the funding plan and the Group expects term funding requirements to remain
stable.
The credit ratings on Lloyds Bank were unchanged over 2016, and the median credit rating among the three major credit
rating agencies remains ‘A+’. Following the EU referendum in June, both S&P and Moody’s revised their outlooks on
Lloyds Bank, among other UK banks, in order to reflect increased macroeconomic uncertainty. S&P revised the outlook
on Lloyds Bank’s ‘A’ rating to ‘Negative’ from ‘Stable’ whilst Moody’s revised the outlook on Lloyds Bank’s ‘A1’ rating to
‘Stable’ from ‘Positive’. Moody’s also revised their outlook on the UK banking system to ‘Negative’ from ‘Stable’. Fitch’s
outlook on Lloyds Bank’s ‘A+’ rating remained ‘Stable’ as Fitch expect the economic effects of the referendum to be
manageable. The effects of a potential downgrade from all three credit rating agencies are included in Group liquidity
stress testing.
The LCR became the Pillar 1 standard for liquidity in the UK in October 2015. The Group comfortably meets the
requirements. Liquid asset holdings have fallen during the second half of 2016 as excess liquidity held during the
EU referendum is managed down. The Group continues to monitor the Net Stable Funding Ratio (NSFR) requirements
and expects to meet them once confirmed by the PRA.

LLOYDS BANKING GROUP PLC 2016 RESULTS
Page 29 of 48
CAPITAL MANAGEMENT
Analysis of capital position
During 2016 the Group continued to strengthen its capital position with a fully loaded CET1 ratio, after accruing for
foreseeable dividends, of 13.6 per cent and 13.8 per cent on a pro forma basis upon recognition of the dividend paid by
the Insurance business in February 2017 in relation to its 2016 earnings (31 December 2015: 13.0 per cent pro forma).
The accrual for foreseeable dividends includes both the recommended full year ordinary dividend of 2.55 pence per
ordinary share and a special dividend of 0.5 pence per ordinary share.
The CET1 ratio on a pro forma basis reflects the prudent retention of circa 0.8 per cent of capital, above the current
target level, to cover the estimated capital impact of the MBNA acquisition that was announced in December 2016.
Over the year the Group generated around 1.9 per cent of CET1 capital on a pro forma basis, pre dividend, primarily as a
result of the following:
Strong underlying capital generation of 2.2 per cent, largely driven by underlying profits;
The dividend paid by the Insurance business in February 2017 in relation to its 2016 earnings of 0.2 per cent;
Impact of conduct charges of (1.0) per cent;
Impact of market movements, netting to 0.2 per cent. This included 0.8 per cent from the impact of the accounting
reclassification of c.£20 billion of gilts within the liquidity portfolio from ‘held-to-maturity’ to ‘available-for-sale’, offset
by a number of market related movements, including an adverse impact of movements in the defined benefit
pension schemes of (0.4) per cent;
Other items largely representing a reduction in risk-weighted assets, most notably in the fourth quarter, largely
relating to active portfolio management, disposals, an improvement in credit quality and capital efficient
securitisation activity, partially offset by model updates related to UK mortgage portfolios and the impact of the
redemption of the remaining series of Enhanced Capital Notes in the first quarter.
After accruing for foreseeable dividends, the transitional total capital ratio reduced by 0.1 percentage points to 21.4 per
cent, primarily reflecting managed reductions in tier 2 capital, largely due to calls and redemptions, offset by the increase
in CET1 capital and the reduction in risk-weighted assets.
In 2020 the Group will have to meet a Minimum Requirement for Own Funds and Eligible Liabilities (MREL). During 2016
the Group commenced issuance of senior unsecured securities from Lloyds Banking Group plc which, while not included
in total capital, are eligible to meet MREL. £2.5 billion (Sterling equivalent) was issued in 2016 and a further £2.2 billion
(Sterling equivalent) was issued in January 2017 leaving the Group well positioned to meet MREL requirements from
2020.
The leverage ratio, after accruing for foreseeable dividends, increased from 4.8 per cent to 4.9 per cent (5.0 per cent on
a pro forma basis), largely reflecting the increase in tier 1 capital.
An analysis of the Group’s capital position as at 31 December 2016 is presented in the following section applying CRD IV
transitional arrangements and also on a fully loaded CRD IV basis, both as implemented in the UK by the PRA.
The table below summarises the consolidated capital position of the Group.

LLOYDS BANKING GROUP PLC 2016 RESULTS
Page 30 of 48
Transitional Fully loaded At 31 Dec At 31 Dec At 31 Dec At 31 DecCapital resources 2016 20151 2016 2015¹ £m £m £m £mCommon equity tier 1 Shareholders’ equity per balance sheet 43,020 41,234 43,020 41,234
Adjustment to retained earnings for foreseeable dividends (1,568) (1,427) (1,568) (1,427)Deconsolidation adjustments1 1,342 1,119 1,342 1,119
Adjustment for own credit 87 67 87 67
Cash flow hedging reserve (2,136) (727) (2,136) (727)
Other adjustments1 (276) (97) (276) (97)
40,469 40,169 40,469 40,169less: deductions from common equity tier 1 Goodwill and other intangible assets (1,623) (1,719) (1,623) (1,719)
Prudent valuation adjustment (630) (372) (630) (372)Excess of expected losses over impairment provisions and value adjustments (602) (270) (602) (270)Removal of defined benefit pension surplus (267) (721) (267) (721)
Securitisation deductions (217) (169) (217) (169)
Significant investments1 (4,282) (4,500) (4,282) (4,529)
Deferred tax assets (3,564) (3,874) (3,564) (3,884)
Common equity tier 1 capital 29,284 28,544 29,284 28,505Additional tier 1 Other equity instruments 5,320 5,355 5,320 5,355
Preference shares and preferred securities2 4,998 4,728 – –
Transitional limit and other adjustments (1,692) (906) – – 8,626 9,177 5,320 5,355less: deductions from tier 1 Significant investments1 (1,329) (1,177) – –
Total tier 1 capital 36,581 36,544 34,604 33,860Tier 2 Other subordinated liabilities2 14,833 18,584 14,833 18,584
Deconsolidation of instruments issued by insurance entities1 (1,810) (1,665) (1,810) (1,665)Adjustments for transitional limit and non-eligible instruments 1,351 (52) (1,694) (3,066)Amortisation and other adjustments (3,447) (3,880) (3,597) (4,885)
10,927 12,987 7,732 8,968
Eligible provisions 186 221 186 221less: deductions from tier 2 Significant investments1 (1,571) (1,756) (2,900) (2,933)
Total capital resources 46,123 47,996 39,622 40,116 Risk-weighted assets 215,534 222,845 215,534 222,747 Common equity tier 1 capital ratio3 13.6% 12.8% 13.6% 12.8%
Tier 1 capital ratio 17.0% 16.4% 16.1% 15.2%
Total capital ratio 21.4% 21.5% 18.4% 18.0% 1 For regulatory capital purposes, the Group’s Insurance business is deconsolidated and replaced by the amount of the Group’s
investment in the business. A part of this amount is deducted from capital (shown as ‘significant investments’ in the table above) andthe remaining amount is risk-weighted, forming part of threshold risk-weighted assets. The presentation of the deconsolidation of theGroup’s insurance entities has been amended for 2016 with comparative figures restated accordingly.
2 Preference shares, preferred securities and other subordinated liabilities are categorised as subordinated liabilities in the balancesheet.
3 The common equity tier 1 ratio is 13.8 per cent on a pro forma basis upon recognition of the dividend paid by the Insurance businessin February 2017 in relation to its 2016 earnings (31 December 2015: 13.0 per cent pro forma).

LLOYDS BANKING GROUP PLC 2016 RESULTS
Page 31 of 48
Risk-weighted assets
At 31 Dec At 31 Dec 2016 2015 £m £m
Foundation Internal Ratings Based (IRB) Approach 64,907 68,990
Retail IRB Approach 64,970 63,912
Other IRB Approach 17,788 18,661
IRB Approach 147,665 151,563
Standardised (STA) Approach 18,956 20,443
Credit risk 166,621 172,006
Counterparty credit risk 8,419 7,981
Contributions to the default fund of a central counterparty 340 488
Credit valuation adjustment risk 864 1,684
Operational risk 25,292 26,123
Market risk 3,147 3,775
Underlying risk-weighted assets 204,683 212,057
Threshold risk-weighted assets1 10,851 10,788
Total risk-weighted assets 215,534 222,845
Movement to fully loaded risk-weighted assets2 – (98)
Fully loaded risk-weighted assets 215,534 222,747 1 Threshold risk-weighted assets reflect the element of significant investments and deferred tax assets that are permitted to be
risk-weighted instead of being deducted from CET1 capital. Significant investments primarily arise from investment in the Group’sInsurance business.
2 Differences may arise between transitional and fully loaded threshold risk-weighted assets where deferred tax assets reliant on futureprofitability and arising from temporary timing differences and significant investments exceed the fully loaded threshold limit, resultingin an increase in amounts deducted from CET1 capital rather than being risk-weighted.
Stress testing
The Group undertakes a wide ranging programme of stress testing providing a comprehensive view of the potential
impacts arising from the risks to which the Group is exposed. One of the most important uses of stress testing is to
assess the resilience of the operational and strategic plans of the Group to adverse economic conditions and other key
vulnerabilities. As part of that the Group participates in the UK-wide concurrent stress test run by the Bank of England.
During 2016, the Group was subject to the European Banking Authority’s Europe-wide stress test with the Group’s
results significantly above our minimum capital requirements. The concurrent UK stress test run by the Bank of England
was also undertaken in 2016. As announced in November, the Group comfortably exceeded the capital thresholds set by
the PRA and was not required to take any action as a result of this test.

LLOYDS BANKING GROUP PLC 2016 RESULTS
Page 32 of 48
Leverage ratio
Fully loaded At 31 Dec At 31 Dec 2016 2015 £m £mTotal tier 1 capital for leverage ratio
Common equity tier 1 capital 29,284 28,505
Additional tier 1 capital 5,320 5,355
Total tier 1 capital 34,604 33,860 Exposure measure Statutory balance sheet assets Derivative financial instruments 36,138 29,467
Securities financing transactions (SFTs) 42,285 34,136
Loans and advances and other assets 739,370 743,085
Total assets 817,793 806,688 Deconsolidation adjustments1
Derivative financial instruments (2,403) (1,510)
Securities financing transactions (SFTs) 112 (441)
Loans and advances and other assets (142,955) (133,975)
Total deconsolidation adjustments (145,246) (135,926) Derivatives adjustments Adjustments for regulatory netting (20,490) (16,419)
Adjustments for cash collateral (8,432) (6,464)
Net written credit protection 699 682
Regulatory potential future exposure 13,188 12,966
Total derivatives adjustments (15,035) (9,235) SFT adjustments 39 3,361 Off-balance sheet items 58,685 56,424 Regulatory deductions and other adjustments (9,128) (9,112) Total exposure 707,108 712,200 Leverage ratio2 4.9% 4.8%
Average leverage ratio3 4.9%
Average leverage ratio exposure measure4 718,926 1 Deconsolidation adjustments predominantly reflect the deconsolidation of assets related to Group subsidiaries that fall outside the
scope of the Group’s regulatory capital consolidation (primarily the Group’s Insurance entities). 2 The countercyclical leverage ratio buffer is currently nil. 3 The average leverage ratio is based on the average of the month end tier 1 capital and exposure measures over the quarter
(30 September 2016 to 31 December 2016). The average of 4.9 per cent compares to 4.8 per cent at the start and 4.9 per cent at theend of the quarter.
4 The average leverage ratio exposure measure is based on the average of the month end exposure measures over the quarter(30 September 2016 to 31 December 2016).
Modified UK leverage ratio The Group’s leverage ratio on a modified basis, excluding qualifying central bank claims from the leverage exposure
measure, is 5.2 per cent. This follows the rule modification applied to the UK Leverage Ratio Framework by the PRA in
August 2016 as a result of recommendations made by the Financial Policy Committee. The Financial Policy Committee has indicated that it intends to recalibrate the UK framework in 2017 in order to adjust for
the impact of the rule modification, thereby ensuring that levels of capital currently required to meet leverage ratio
minimums are maintained. The modified UK leverage ratio should therefore be considered in the context of the proposed
recalibration.

LLOYDS BANKING GROUP PLC 2016 RESULTS
Page 33 of 48
CONDENSED CONSOLIDATED FINANCIAL STATEMENTS
CONSOLIDATED INCOME STATEMENT
2016 2015
Note £ million £ million
Interest and similar income 16,620 17,615
Interest and similar expense (7,346) (6,297)
Net interest income 9,274 11,318
Fee and commission income 3,045 3,252
Fee and commission expense (1,356) (1,442)
Net fee and commission income 1,689 1,810
Net trading income 18,545 3,714
Insurance premium income 8,068 4,792
Other operating income 2,035 1,516
Other income 30,337 11,832
Total income 39,611 23,150
Insurance claims (22,344) (5,729)
Total income, net of insurance claims 17,267 17,421
Regulatory provisions (2,024) (4,837)
Other operating expenses (10,253) (10,550)
Total operating expenses (12,277) (15,387)
Trading surplus 4,990 2,034
Impairment (752) (390)
Profit before tax 4,238 1,644
Taxation 2 (1,724) (688)
Profit for the year 2,514 956
Profit attributable to ordinary shareholders 2,001 466
Profit attributable to other equity holders1 412 394
Profit attributable to equity holders 2,413 860
Profit attributable to non-controlling interests 101 96
Profit for the year 2,514 956
Basic earnings per share 3 2.9p 0.8p
Diluted earnings per share 3 2.9p 0.8p
1 The profit after tax attributable to other equity holders of £412 million (2015: £394 million) is offset in reserves by a tax credit
attributable to ordinary shareholders of £91 million (2015: £80 million).

LLOYDS BANKING GROUP PLC 2016 RESULTS
Page 34 of 48
CONSOLIDATED STATEMENT OF COMPREHENSIVE INCOME
2016 2015
£ million £ million
Profit for the year 2,514 956
Other comprehensive income
Items that will not subsequently be reclassified to profit or loss:
Post-retirement defined benefit scheme remeasurements:
Remeasurements before taxation (1,348) (274)
Taxation 320 59
(1,028) (215)
Items that may subsequently be reclassified to profit or loss:
Movements in revaluation reserve in respect of available-for-sale financial assets:
Adjustment on transfer from held-to-maturity portfolio 1,544 –
Change in fair value 356 (318)
Income statement transfers in respect of disposals (575) (51)
Income statement transfers in respect of impairment 173 4
Taxation (301) (6)
1,197 (371)
Movements in cash flow hedging reserve:
Effective portion of changes in fair value 2,432 537
Net income statement transfers (557) (956)
Taxation (466) 7
1,409 (412)
Currency translation differences (tax: nil) (4) (42)
Other comprehensive income for the year, net of tax 1,574 (1,040)
Total comprehensive income for the year 4,088 (84)
Total comprehensive income attributable to ordinary shareholders 3,575 (574)
Total comprehensive income attributable to other equity holders 412 394
Total comprehensive income attributable to equity holders 3,987 (180)
Total comprehensive income attributable to non-controlling interests 101 96
Total comprehensive income for the year 4,088 (84)

LLOYDS BANKING GROUP PLC 2016 RESULTS
Page 35 of 48
CONSOLIDATED BALANCE SHEET
At 31 Dec At 31 Dec
2016 2015
£ million £ million
Assets
Cash and balances at central banks 47,452 58,417
Items in course of collection from banks 706 697
Trading and other financial assets at fair value through profit or loss 151,174 140,536
Derivative financial instruments 36,138 29,467
Loans and receivables:
Loans and advances to banks 26,902 25,117
Loans and advances to customers 457,958 455,175
Debt securities 3,397 4,191
488,257 484,483
Available-for-sale financial assets1 56,524 33,032
Held-to-maturity investments1 – 19,808
Goodwill 2,016 2,016
Value of in-force business 5,042 4,596
Other intangible assets 1,681 1,838
Property, plant and equipment 12,972 12,979
Current tax recoverable 28 44
Deferred tax assets 2,706 4,010
Retirement benefit assets 342 901
Other assets 12,755 13,864
Total assets 817,793 806,688
1 The Group has reviewed its holding of government securities classified as held-to-maturity in light of the current low interest rate
environment and they have been reclassified as available-for-sale; this has resulted in a credit of £1,544 million to the available-for-sale revaluation reserve (£1,127 million after tax).

LLOYDS BANKING GROUP PLC 2016 RESULTS
Page 36 of 48
At 31 Dec At 31 Dec
2016 2015
Equity and liabilities £ million £ million
Liabilities
Deposits from banks 16,384 16,925
Customer deposits 415,460 418,326
Items in course of transmission to banks 548 717
Trading and other financial liabilities at fair value through profit or loss 54,504 51,863
Derivative financial instruments 34,924 26,301
Notes in circulation 1,402 1,112
Debt securities in issue 76,314 82,056
Liabilities arising from insurance contracts and participating investment
contracts 94,390 80,294
Liabilities arising from non-participating investment contracts 20,112 22,777
Other liabilities 29,193 29,661
Retirement benefit obligations 822 365
Current tax liabilities 226 279
Deferred tax liabilities – 33
Other provisions 4,868 5,687
Subordinated liabilities 19,831 23,312
Total liabilities 768,978 759,708
Equity
Share capital 7,146 7,146
Share premium account 17,622 17,412
Other reserves 14,652 12,260
Retained profits 3,600 4,416
Shareholders’ equity 43,020 41,234
Other equity instruments 5,355 5,355
Total equity excluding non-controlling interests 48,375 46,589
Non-controlling interests 440 391
Total equity 48,815 46,980
Total equity and liabilities 817,793 806,688

LLOYDS BANKING GROUP PLC 2016 RESULTS
Page 37 of 48
CONSOLIDATED STATEMENT OF CHANGES IN EQUITY
Attributable to equity shareholders Share capital Other Non- and Other Retained equity controlling premium reserves profits Total instruments interests Total £ million £ million £ million £ million £ million £ million £ million Balance at 1 January 2016 24,558 12,260 4,416 41,234 5,355 391 46,980
Comprehensive income
Profit for the year – – 2,413 2,413 – 101 2,514
Other comprehensive income
Post-retirement defined benefit
scheme remeasurements, net of
tax – – (1,028) (1,028) – – (1,028)
Movements in revaluation reserve
in respect of available-for-sale
financial assets, net of tax – 1,197 – 1,197 – – 1,197
Movements in cash flow hedging
reserve, net of tax – 1,409 – 1,409 – – 1,409
Currency translation differences
(tax: nil) – (4) – (4) – – (4)
Total other comprehensive
income – 2,602 (1,028) 1,574 – – 1,574
Total comprehensive income – 2,602 1,385 3,987 – 101 4,088
Transactions with owners
Dividends – – (2,014) (2,014) – (29) (2,043)
Distributions on other equity
instruments, net of tax – – (321) (321) – – (321)
Redemption of preference shares 210 (210) – – – – –
Movement in treasury shares – – (175) (175) – – (175)
Value of employee services:
Share option schemes – – 141 141 – – 141
Other employee award schemes – – 168 168 – – 168
Other changes in non-controlling
interests – – – – – (23) (23)
Total transactions with owners 210 (210) (2,201) (2,201) – (52) (2,253)
Balance at 31 December 2016 24,768 14,652 3,600 43,020 5,355 440 48,815

LLOYDS BANKING GROUP PLC 2016 RESULTS
Page 38 of 48
Attributable to equity shareholders
Share capital Other Non- and Other Retained equity controlling premium reserves profits Total instruments interests Total £ million £ million £ million £ million £ million £ million £ million
Balance at 1 January 2015 24,427 13,216 5,692 43,335 5,355 1,213 49,903
Comprehensive income
Profit for the year – – 860 860 – 96 956
Other comprehensive income
Post-retirement defined benefit scheme
remeasurements, net of tax – – (215) (215) – – (215)
Movements in revaluation reserve in
respect of available-for-sale financial
assets, net of tax – (371) – (371) – – (371)
Movements in cash flow hedging reserve,
net of tax – (412) – (412) – – (412)
Currency translation differences (tax: nil) – (42) – (42) – – (42)
Total other comprehensive income – (825) (215) (1,040) – – (1,040)
Total comprehensive income – (825) 645 (180) – 96 (84)
Transactions with owners
Dividends – – (1,070) (1,070) – (52) (1,122)
Distributions on other equity instruments,
net of tax – – (314) (314) – – (314)
Redemption of preference shares 131 (131) – – – – –
Movement in treasury shares – – (816) (816) – – (816)
Value of employee services:
Share option schemes – – 107 107 – – 107
Other employee award schemes – – 172 172 – – 172
Adjustment on sale of non-controlling
interest in TSB – – – – – (825) (825)
Other changes in non-controlling interests – – – – – (41) (41)
Total transactions with owners 131 (131) (1,921) (1,921) – (918) (2,839)
Balance at 31 December 2015 24,558 12,260 4,416 41,234 5,355 391 46,980

LLOYDS BANKING GROUP PLC 2016 RESULTS
Page 39 of 48
NOTES TO THE FINANCIAL STATEMENTS
1. Accounting policies, presentation and estimates
These condensed consolidated financial statements as at and for the year to 31 December 2016 comprise the results of
Lloyds Banking Group plc (the Company) together with its subsidiaries (the Group). They do not include all of the
information required for full annual financial statements. Copies of the 2016 Annual Report and Accounts will be available
on the Group’s website and upon request from Investor Relations, Lloyds Banking Group plc, 25 Gresham Street,
London EC2V 7HN.
The accounting policies are consistent with those applied by the Group in its 2015 Annual Report and Accounts, and
there have been no significant changes in the basis upon which estimates have been determined, compared to that
applied at 31 December 2015.
2. Taxation
A reconciliation of the tax charge that would result from applying the standard UK corporation tax rate to the profit before
tax, to the actual tax charge, is given below:
2016 2015
£m £m
Profit before tax 4,238 1,644 Tax charge thereon at UK corporation tax rate of 20 per cent
(2015: 20.25 per cent) (848) (333)
Factors affecting charge:
Impact of bank surcharge (266) –
Impact of changes in UK corporation tax rates (201) (27)
Disallowed items1 (394) (630)
Non-taxable items 75 162
Overseas tax rate differences 10 (4)
Gains exempted 19 67
Policyholder tax2 (241) 3
Tax losses not previously recognised 59 42
Adjustments in respect of previous years 64 33
Effect of results of joint ventures and associates (1) (1)
Tax charge on profit on ordinary activities (1,724) (688) 1 The Finance (No.2) Act 2015 introduced restrictions on the tax deductability of provisions for conduct charges arising on or after
8 July 2015. This has resulted in an additional income statement tax charge of £219 million (2015: £459 million). 2 In 2016 this includes a £231 million write down of the deferred tax asset held within the life business, reflecting the Group’s utilisation
estimate which has been restricted by the current economic environment.
The Finance (No. 2) Act 2015 introduced an additional surcharge of 8 per cent on banking profits from 1 January 2016. The Finance Act 2016 was enacted on 15 September 2016. The Act further reduced the corporation tax rate applicable
from 1 April 2020 to 17 per cent and further restricts the amount of banks’ profits that can be offset by carried forward
losses for the purposes of calculating corporation tax liabilities from 50 per cent to 25 per cent with effect from 1 April
2016. The corporation tax changes enacted have resulted in a reduction in the Group’s net deferred tax asset at 31 December
2016 of £158 million, comprising a £201 million charge included in the income statement and a £43 million credit
included in equity.

LLOYDS BANKING GROUP PLC 2016 RESULTS
Page 40 of 48
3. Earnings per share
2016 2015
£m £m
Profit attributable to equity shareholders – basic and diluted 2,001 466
Tax credit on distributions to other equity holders 91 80
2,092 546
2016 2015
million million
Weighted average number of ordinary shares in issue – basic 71,234 71,272
Adjustment for share options and awards 790 1,068
Weighted average number of ordinary shares in issue – diluted 72,024 72,340
Basic earnings per share 2.9p 0.8p
Diluted earnings per share 2.9p 0.8p

LLOYDS BANKING GROUP PLC 2016 RESULTS
Page 41 of 48
4. Provisions for liabilities and charges
Payment protection insurance
The Group increased the provision for PPI costs by a further £1,000 million in 2016, all in the third quarter, bringing the
total amount provided to £17,025 million.
The charge to the provision in 2016 was largely driven by a higher total volume of complaints expected as a result of the
Financial Conduct Authority’s (FCA) proposed industry deadline being extended to the end of June 2019 in its
consultation paper published on 2 August 2016 (CP16/20: Rules and guidance on payment protection insurance
complaints: feedback on CP15/39 and further consultation). The paper also consulted on some changes to the proposed
rules and guidance that should apply when firms handle PPI complaints in light of the Supreme Court’s decision in
Plevin v Paragon Personal Finance Limited [2014] UKSC 61 (Plevin). In December 2016, the FCA stated that a further
announcement in relation to the consultation would follow in 2017.
As at 31 December 2016, a provision of £2,258 million remained unutilised relating to reactive complaints and associated
administration costs. Total cash payments were £2,200 million during the year to 31 December 2016. Spend continues to
reduce following the completion of the re-review of previously handled cases (remediation).
The provision is consistent with total expected reactive complaint volumes of 4.9 million (including complaints falling
under the Plevin rules and guidance) in light of the FCA proposals reflected in the third quarter provision increase which
was equivalent to approximately 7,700 net complaints per week on average through to the proposed industry deadline of
June 2019. Weekly complaint levels in the second half of 2016 have been approximately 8,300 versus approximately
8,600 in the first half, and are expected to vary significantly through to the proposed industry deadline.
Sensitivities
The Group estimates that it has sold approximately 16 million PPI policies since 2000. These include policies that were
not mis-sold and those that have been successfully claimed upon. Since the commencement of the PPI redress
programme in 2011 the Group estimates that it has contacted, settled or provided for approximately 50 per cent of the
policies sold since 2000.
The total amount provided for PPI represents the Group’s best estimate of the likely future cost. However a number of
risks and uncertainties remain in particular with respect to future volumes. The cost could differ from the Group’s
estimates and the assumptions underpinning them, and could result in a further provision being required. There is
significant uncertainty around the impact of the proposed regulatory changes, FCA media campaign and Claims
Management Companies and customer activity.
Key metrics and sensitivities are highlighted in the table below:
Sensitivities (exclude claims where no PPI policy was held)
Actuals to date
Anticipated future
Sensitivity
Customer initiated complaints since origination (m)1 3.9 1.0 0.1 = £210m
Average uphold rate per policy2 74% 87% 1% = £30m
Average redress per upheld policy2 £1,700 £1,470 £100 = £125m
Administrative expenses (£m) 3,190 460 1 case = £450 1 Sensitivity includes complaint handling costs. 2 Actuals to date are based on the last six months to 31 December 2016. Anticipated future and sensitivities are impacted by a
proportion of complaints falling under the Plevin rules and guidance.

LLOYDS BANKING GROUP PLC 2016 RESULTS
Page 42 of 48
Other provisions for legal actions and regulatory matters
Packaged bank accounts
In the year ended 31 December 2016 the Group has provided an additional £280 million in respect of complaints relating to alleged mis-selling of packaged bank accounts raising the total amount provided to £505 million. As at 31 December 2016, £215 million of the provision remained unutilised. The total amount provided represents the Group’s best estimate of the likely future cost, however a number of risks and uncertainties remain in particular with respect to future volumes.
Arrears handling related activities
Following a review of the Group’s secured and unsecured arrears handling activities, the Group has put in place a number of actions to further improve its handling of customers in these areas. As a result, the Group has provided an additional £261 million in the year ended 31 December 2016 (bringing the total provision to £397 million), for the costs of identifying and rectifying certain arrears management fees and activities. As at 31 December 2016, the unutilised provision was £383 million.
Customer claims in relation to insurance branch business in Germany
The Group continues to receive claims in Germany from customers relating to policies issued by Clerical Medical Investment Group Limited (subsequently renamed Scottish Widows Limited). The German industry-wide issue regarding notification of contractual ‘cooling off’ periods has continued to lead to an increasing number of claims in 2016. Accordingly a provision increase of £94 million was recognised in the year ended 31 December 2016 giving a total provision of £639 million; the remaining unutilised provision as at 31 December 2016 is £168 million. The validity of the claims facing the Group depends upon the facts and circumstances in respect of each claim. As a result the ultimate financial effect, which could be significantly different from the current provision, will be known only once all relevant claims have been resolved.
Other legal actions and regulatory matters
In the course of its business, the Group is engaged in discussions with the PRA, FCA and other UK and overseas regulators and other governmental authorities on a range of matters. The Group also receives complaints and claims from customers in connection with its past conduct and, where significant, provisions are held against the costs expected to be incurred as a result of the conclusions reached. In the year ended 31 December 2016, the Group charged an additional £450 million in respect of matters across all divisions. At 31 December 2016, the Group held unutilised provisions totalling £573 million for these other legal actions and regulatory matters.

LLOYDS BANKING GROUP PLC 2016 RESULTS
Page 43 of 48
5. Contingent liabilities and commitments
Interchange fees
With respect to multi-lateral interchange fees (MIFs), the Group is not directly involved in the ongoing investigations and
litigation (as described below) which involve card schemes such as Visa and MasterCard. However, the Group is a
member of Visa and MasterCard and other card schemes.
The European Commission continues to pursue certain competition investigations into MasterCard and Visa probing,
amongst other things, MIFs paid in respect of cards issued outside the EEA;
Litigation continues in the English Courts against both Visa and MasterCard. This litigation has been brought by
several retailers who are seeking damages for allegedly ‘overpaid’ MIFs. From publicly available information, it is
understood these damages claims are running to different timescales with respect to the litigation process. It is also
possible that new claims may be issued.
Any ultimate impact on the Group of the above investigations and the litigation against Visa and MasterCard remains
uncertain at this time.
Visa Inc completed its acquisition of Visa Europe on 21 June 2016. The Group’s share of the sale proceeds comprised
cash consideration of approximately £330 million (of which approximately £300 million was received on completion of the
sale and £30 million is deferred for three years) and preferred stock, which the Group measures at fair value. The
preferred stock is convertible into Class A Common Stock of Visa Inc or its equivalent upon the occurrence of certain
events. As part of this transaction, the Group and certain other UK banks also entered into a Loss Sharing Agreement
(LSA) with Visa Inc, which clarifies the allocation of liabilities between the parties should the litigation referred to above
result in Visa Inc being liable for damages payable by Visa Europe. The maximum amount of liability to which the Group
may be subject under the LSA is capped at the cash consideration which was received by the Group at completion. Visa
Inc may also have recourse to a general indemnity, currently in place under Visa Europe’s Operating Regulations, for
damages claims concerning inter or intra-regional MIF setting activities.
LIBOR and other trading rates
In July 2014, the Group announced that it had reached settlements totalling £217 million (at 30 June 2014 exchange
rates) to resolve with UK and US federal authorities legacy issues regarding the manipulation several years ago of Group
companies’ submissions to the British Bankers’ Association (BBA) London Interbank Offered Rate (LIBOR) and Sterling
Repo Rate. The Group continues to cooperate with various other government and regulatory authorities, including the
Serious Fraud Office, the Swiss Competition Commission, and a number of US State Attorneys General, in conjunction
with their investigations into submissions made by panel members to the bodies that set LIBOR and various other
interbank offered rates.
Certain Group companies, together with other panel banks, have also been named as defendants in private lawsuits,
including purported class action suits, in the US in connection with their roles as panel banks contributing to the setting of
US Dollar, Japanese Yen and Sterling LIBOR and the Australian BBSW Reference Rate. The lawsuits, which contain
broadly similar allegations, allege violations of the Sherman Antitrust Act, the Racketeer Influenced and Corrupt
Organizations Act and the Commodity Exchange Act, as well as various state statutes and common law doctrines.
Certain of the plaintiffs’ claims, including those asserted under US anti-trust laws, were dismissed by the US Federal
Court for Southern District of New York (the District Court). In November 2015 OTC and exchange-based plaintiffs’
claims against the Group were dismissed for lack of personal jurisdiction. On 20 December 2016, the Federal Court for
Southern District of New York dismissed all antitrust class action claims against LBG and its affiliates in the Multi District
Litigation arising from the alleged manipulation of USD LIBOR. Further appeals in relation to the anti-trust claims remain
possible.
Certain Group companies are also named as defendants in UK based claims raising LIBOR manipulation allegations in
connection with interest rate hedging products.
It is currently not possible to predict the scope and ultimate outcome on the Group of the various outstanding regulatory
investigations not encompassed by the settlements, any private lawsuits or any related challenges to the interpretation or
validity of any of the Group’s contractual arrangements, including their timing and scale.

LLOYDS BANKING GROUP PLC 2016 RESULTS
Page 44 of 48
UK shareholder litigation
In August 2014, the Group and a number of former directors were named as defendants in a claim filed in the English
High Court by a number of claimants who held shares in Lloyds TSB Group plc (LTSB) prior to the acquisition of HBOS
plc, alleging breaches of duties in relation to information provided to shareholders in connection with the acquisition and
the recapitalisation of LTSB. It is currently not possible to determine the ultimate impact on the Group (if any), but the
Group intends to defend the claim vigorously.
Financial Services Compensation Scheme
The Financial Services Compensation Scheme (FSCS) is the UK’s independent statutory compensation fund of last
resort for customers of authorised financial services firms and pays compensation if a firm is unable or likely to be unable
to pay claims against it. The FSCS is funded by levies on the authorised financial services industry. Each deposit-taking
institution contributes towards the FSCS levies in proportion to their share of total protected deposits on 31 December of
the year preceding the scheme year, which runs from 1 April to 31 March.
Following the default of a number of deposit takers in 2008, the FSCS borrowed funds from HM Treasury to meet the
compensation costs for customers of those firms. At 31 March 2016, the end of the latest FSCS scheme year for which it
has published accounts, the principal balance outstanding on these loans was £15,655 million (31 March 2015:
£15,797 million). Although it is anticipated that the substantial majority of this loan will be repaid from funds the FSCS
receives from asset sales, surplus cash flow or other recoveries in relation to the assets of the firms that defaulted, any
shortfall will be funded by deposit-taking participants of the FSCS. The amount of future levies payable by the Group
depends on a number of factors including the amounts recovered by the FSCS from asset sales, the Group’s
participation in the deposit-taking market at 31 December, the level of protected deposits and the population of
deposit-taking participants.
Tax authorities
The Group provides for potential tax liabilities that may arise on the basis of the amounts expected to be paid to tax
authorities including open matters where Her Majesty's Revenue and Customs (HMRC) adopt a different interpretation
and application of tax law. The Group has an open matter in relation to a claim for group relief of losses incurred in its
former Irish banking subsidiary, which ceased trading on 31 December 2010. In 2013 HMRC informed the Group that
their interpretation of the UK rules, permitting the offset of such losses, denies the claim; if HMRC’s position is found to
be correct management estimate that this would result in an increase in current tax liabilities of approximately
£600 million and a reduction in the Group’s deferred tax asset of approximately £400 million. The Group does not agree
with HMRC's position and, having taken appropriate advice, does not consider that this is a case where additional tax will
ultimately fall due. There are a number of other open matters on which the Group is in discussion with HMRC (including
the tax treatment of certain costs arising from the divestment of TSB Banking Group plc); none of these is expected to
have a material impact on the financial position of the Group.
Residential mortgage repossessions
In August 2014, the Northern Ireland High Court handed down judgment in favour of the borrowers in relation to three
residential mortgage test cases concerning certain aspects of the Group’s practice with respect to the recalculation of
contractual monthly instalments of customers in arrears. The FCA is actively engaged with the industry in relation to
these considerations. The Group will respond as appropriate to this and any investigations, proceedings, or regulatory
action that may in due course be instigated as a result of these issues. The FCA has issued a consultation on new
guidance on the treatment of customers with mortgage payment shortfalls. The guidance covers remediation for
mortgage customers who may have been affected by the way firms calculate these customers’ monthly mortgage
instalments. The output from this consultation is expected in the first quarter of 2017.

LLOYDS BANKING GROUP PLC 2016 RESULTS
Page 45 of 48
Update to the Financial Conduct Authority’s announcement in November 2015 on a deadline for PPI complaints
and Plevin v Paragon Personal Finance Limited
On 2 August 2016, the Financial Conduct Authority (FCA) published a further consultation paper (CP16/20: Rules and
guidance on payment protection insurance complaints: feedback on CP15/39 and further consultation), following on from
the original consultation published in November 2015.
The FCA continues to propose the introduction of a two year deadline by which consumers would need to make their PPI
complaints and indicates the deadline period will start in June 2017 and end in June 2019, later than originally indicated
by the FCA. The FCA has also consulted further on changes to the proposed rules and guidance that should apply when
firms handle PPI complaints in light of the Supreme Court’s decision in Plevin v Paragon Personal Finance Limited
[2014] UKSC 61. The Group awaits the FCA’s final decision. A further announcement by the FCA is expected in 2017.
Mortgage arrears handling activities
On 26 May 2016, the Group was informed that an enforcement team at the FCA had commenced an investigation in
connection with the Group’s mortgage arrears handling activities. This investigation is ongoing and it is currently not
possible to make a reliable assessment of the liability, if any, that may result from the investigation.
HBOS Reading – customer review
The Group is commencing a review into a number of customer cases from the former HBOS Impaired Assets Office
based in Reading. This review follows the conclusion of a criminal trial in which a number of individuals, including two
former HBOS employees, were convicted of conspiracy to corrupt, fraudulent trading and associated money laundering
offences which occurred prior to the acquisition of HBOS by the Group in 2009. The review is at an early stage and it is
currently not possible to determine the ultimate financial impact on the Group.
Other legal actions and regulatory matters
In addition, during the ordinary course of business the Group is subject to other complaints and threatened or actual legal
proceedings (including class or group action claims) brought by or on behalf of current or former employees, customers,
investors or other third parties, as well as legal and regulatory reviews, challenges, investigations and enforcement
actions, both in the UK and overseas. All such material matters are periodically reassessed, with the assistance of
external professional advisers where appropriate, to determine the likelihood of the Group incurring a liability. In those
instances where it is concluded that it is more likely than not that a payment will be made, a provision is established to
management's best estimate of the amount required at the relevant balance sheet date. In some cases it will not be
possible to form a view, for example because the facts are unclear or because further time is needed properly to assess
the merits of the case, and no provisions are held in relation to such matters. However the Group does not currently
expect the final outcome of any such case to have a material adverse effect on its financial position, operations or cash
flows.

LLOYDS BANKING GROUP PLC 2016 RESULTS
Page 46 of 48
6. Dividends on ordinary shares
The directors have recommended a final dividend, which is subject to approval by the shareholders at the Annual
General Meeting, of 1.7 pence per share (2015: 1.5 pence per share) totalling £1,212 million (2015: £1,070 million). The
directors have also recommended a special dividend of 0.5 pence per share (2015: 0.5 pence) totalling £356 million
(2015: £357 million). These financial statements do not reflect these recommended dividends.
Shareholders who have already joined the dividend reinvestment plan will automatically receive shares instead of the
cash dividend. Key dates for the payment of the dividends are:
Shares quoted ex-dividend 6 April 2017
Record date 7 April 2017
Final date for joining or leaving the dividend reinvestment plan 25 April 2017
Dividends paid 16 May 2017
The final and special dividends in respect of 2015 of 1.5 pence and 0.5 pence per ordinary share were paid to
shareholders on 17 May 2016 and an interim dividend for 2016 of 0.85 pence per ordinary share was paid on
28 September 2016; these dividends totalled £2,034 million.
7. Other information
Financial information contained in this document does not constitute statutory accounts within the meaning of section
434 of the Companies Act 2006 (‘the Act’). The statutory accounts for the year ended 31 December 2016 will be
published on the Group’s website. The report of the auditor on those statutory accounts was unqualified, did not draw
attention to any matters by way of emphasis and did not contain a statement under section 498(2) or (3) of the Act. The
statutory accounts for the year ended 31 December 2015 have been filed with the Registrar of Companies.

LLOYDS BANKING GROUP PLC 2016 RESULTS
Page 47 of 48
Summary of alternative performance measures The Group calculates a number of metrics that are used throughout the banking and insurance industries on an underlying basis. A description of these measures and their calculation is set out below.
Asset quality ratio The underlying impairment charge for the period (on an annualised basis) in respect of loans and advances to customers after releases and write-backs expressed as a percentage of average gross loans and advances to customers for the period
Banking net interest margin
Banking net interest income on customer and product balances in the banking businesses as a percentage of average gross banking interest-earning assets for the period
Cost:income ratio Operating costs as a percentage of net income calculated on an underlying basis
Gross asset quality ratio The underlying impairment charge for the period (on an annualised basis) in respect of loans and advances to customers before releases and write-backs expressed as a percentage of average gross loans and advances to customers for the period
Impaired loans as a percentage of advances
Impaired loans and advances to customers adjusted to exclude Retail and Consumer Finance loans in recoveries expressed as a percentage of closing gross loans and advances to customers
Loan to deposit ratio The ratio of loans and advances to customers net of allowance for impairment losses and excluding reverse repurchase agreements divided by customer deposits excluding repurchase agreements
Operating jaws The difference between the period on period percentage change in net income and the period on period change in operating costs calculated on an underlying basis
Present value of new business premium
The total single premium sales received in the period (on an annualised basis) plus the discounted value of premiums expected to be received over the term of the new regular premium contracts
Required equity The amount of shareholders’ equity and non-controlling interests required to achieve a common equity tier 1 ratio of 12.0 per cent after allowing for regulatory adjustments and deductions
Return on assets Underlying profit before tax divided by average total assets for the period
Return on required equity
Statutory profit after tax adjusted to reflect the notional earnings on any excess or shortfall in equity less the post-tax profit attributable to other equity holders, divided by the average required equity for the period
Return on risk-weighted assets
Underlying profit before tax divided by average risk-weighted assets
Return on tangible equity
Statutory profit after tax adjusted to add back amortisation of intangible assets after tax, profit attributable to non-controlling interests and other equity holders divided by average tangible net assets
Tangible net assets per share
Net assets excluding intangible assets such as goodwill and acquisition-related intangibles divided by the weighted average number of ordinary shares in issue
Underlying profit Statutory profit adjusted for certain items as detailed in the Basis of Preparation
Underlying return on required equity
Underlying profit after tax at the standard UK corporation tax rate adjusted to reflect the banking tax surcharge and the notional earnings on any excess or shortfall in equity less the post-tax profit attributable to other equity holders divided by the average required equity for the period
Underlying return on tangible equity
Underlying profit after tax at the standard UK corporation tax rate adjusted to add back amortisation of intangible assets after tax, profit attributable to non-controlling interests and other equity holders, divided by average tangible net assets

LLOYDS BANKING GROUP PLC 2016 RESULTS
Page 48 of 48
CONTACTS
For further information please contact:
INVESTORS AND ANALYSTS
Douglas Radcliffe
Group Investor Relations Director
020 7356 1571
Andrew Downey
Director of Investor Relations
020 7356 2334
Edward Sands
Director of Investor Relations
020 7356 1585
CORPORATE AFFAIRS
Fiona Laffan
Group Corporate Communications Director
020 7356 2081
Matt Smith
Head of Corporate Media
020 7356 3522
Copies of this news release may be obtained from:
Investor Relations, Lloyds Banking Group plc, 25 Gresham Street, London EC2V 7HN
The full news release can also be found on the Group’s website – www.lloydsbankinggroup.com
Registered office: Lloyds Banking Group plc, The Mound, Edinburgh, EH1 1YZ
Registered in Scotland no. 95000
